Demography, Vol. 31, No.2, May 1994
The Demographic Transition in Southern Africa:Reviewing the Evidence fromBotswana and Zimbabwe*
Duncan ThomasRAND1700 Main Street, Santa Monica, CA 90407andDepartment of Economics, UCLA405 Hilgard Avenue, Los Angeles, CA 90024
Ityai MuvandiCentre for African Family StudiesBox 60054Nairobi, Kenya
Part, but not all, of the observed decline in the number of children ever born reportedin the 1984 CPS and the 1988 DHS in Botswana and Zimbabwe can be attributed todifferences in sample composition: women in the 1988 survey appear to be bettereducated than women of the same cohort in the 1984 survey. Blanc and Rutstein arguethat differences in education levels in the pairs of surveys are not significant.However, weighted Kolmogorov-Smimov statistics, a comparison of average years ofschooling, and the proportions of women who complete primary school or attendsecondary school all indicate that the differences are, in fact, significant. This is truein both Botswana and Zimbabwe. Blanc and Rutstein also claim that these differencesdo not account for any of the observed decline in fertility between the surveys ofwomen age 15 to 49. Their methodology follows cohorts of women rather thanage-groups and thus cannot possibly address this issue. Furthermore, to interpret theirresults, response error and respondent education must be uncorrelated: this is a keyassumption which is violated by the data. We stand by our conclusions and argue forcaution when aggregate statistics from the CPS and the DHS are used to makeprojections about the course of fertility and population growth in Botswana andZimbabwe.
According to aggregate statistics from the Contraceptive Prevalence Survey (CPS) andthe Demographic and Health Survey (DHS), the number of children ever born to women age15 to 49 in Zimbabwe declined from 3.4 to 2.95 between 1984 and 1988. An even largerdecline is reported in Botswana for the same four-year period. Examination of microdata
* Discussions with Jim Smith have been very helpful. We are also grateful for the comments of the editors andof Janet Currie, Elizabeth Frankenberg, Linda Martin, Bill Mason, Anne Pebley and Dan Relies. Gary Bjorkprovided expert editorial advice.
Copyright © 1994 Population Association of America
217
218 Demography, Vol. 31, No.2, May 1994
from these surveys reveals that in both Botswana and Zimbabwe, education levels of thesame cohort of women are significantly higher in the second survey. Differences in samplecomposition account for part, but not all, of the observed decline in the number of childrenever born. We argue, therefore, for caution when these aggregate statistics are used to makeprojections about the course of fertility and population growth in Botswana and Zimbabwe.
Blanc and Rutstein take issue with our conclusions on two grounds. First, they claim to"find compelling statistical evidence that the composition of the two samples with respect toeducation is the same." Second, they claim that our methodology for assessing the impactof differences in education levels on fertility is flawed.
We disagree with both claims. First, their statistical test for differences in educationlevels is not appropriate. They compute a Kolmogorov-Smirnov statistic but fail to take intoaccount the fact that sampling strategies in the CPS and the DRS are not the same. If thesample weights are incorporated in the calculation of the Kolmogorov-Smirnov teststatistics, then the distributions of education in the CPS and the DHS are significantlydifferent in both Botswana and Zimbabwe. It is, perhaps, more important to understandwhere the distributions differ. Women in the DHS not only have higher education levels onaverage but they are also more likely to have completed primary school or to have attendedsecondary school than exactly the same cohort of women in the CPS. All of thesedifferences are significant in both Botswana and Zimbabwe.
Second, Blanc and Rutstein's methodology for assessing the impact of thesedifferences on fertility decline does not address that question. They compare reportedfertility in the CPS with fertility as of 1984 in the DHS for exactly the same cohort ofwomen. If there are no differences in the samples in the two surveys, then these arereflections of precisely the same reality and the estimates should be identical. Key for ourpurposes is the fact that comparing cohort-specific fertility can say nothing about fertilitydecline among women age 15 to 49 between the two surveys, which is the substantive issueaddressed in our paper.
Instead, Blanc and Rutstein's methodology can, in principle, address the issue ofrespondent error in demographic recall data. They compare estimates of fertility as of 1984,based on the 1988 DHS, with those of the CPS. The DHS estimates are constructed usingretrospective birth histories and, thus, are likely to be contaminated by respondent error.Comparing the CPS with the DHS estimates may provide information about these errors.However, as an empirical matter, reporting errors are related to the respondent's education,and so it is not even possible to disentangle these errors from the effects of differences ineducation levels in the samples. Thus, it is unclear what interpretation should be given toBlanc and Rutstein's estimates of the impact of differences in sample composition in theCPS and the DHS. In contrast, we believe that our own methodology, which comparesage-specific fertility of women, is appropriate. We thus view the conclusions in our paper ascorrect.
DIFFERENCES IN MEASUREMENT OF EDUCATION
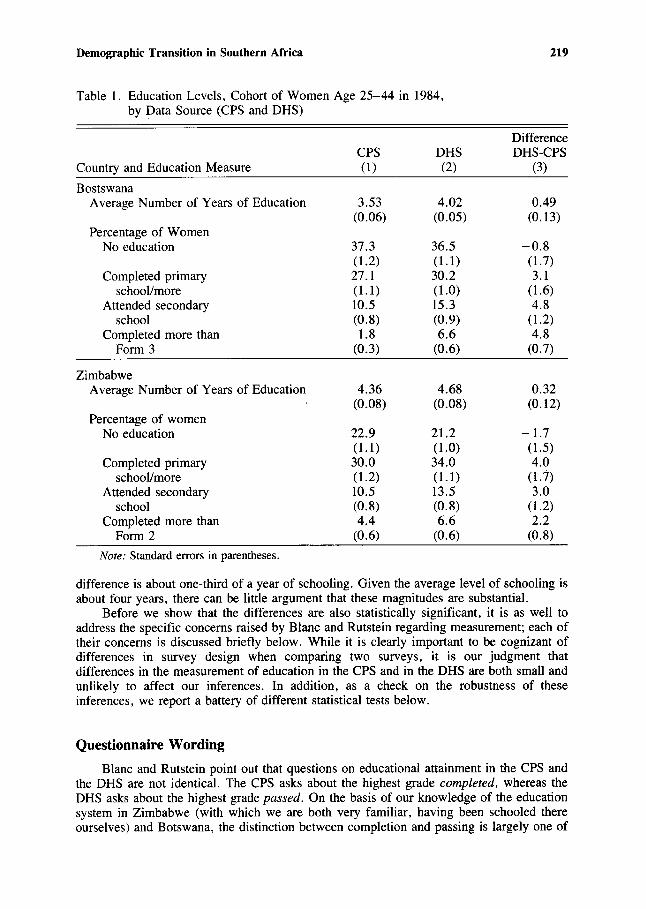
Let us first put the magnitudes of differences in education in perspective. Becauseeducation levels have increased over time in both Botswana and Zimbabwe, it is notappropriate to compare the education of women of the same age group. Instead, to isolatethe differences in education between the samples, it is important to compare the samecohorts of women.' Table 1 reports education levels of women age 25 to 44 in 1984 (andthus 29 to 48 in 1988). In the DHS, these women report about half a year more schoolingin Botswana than exactly the same cohort of women in the CPS. In Zimbabwe, the
Demographic Transition in Southern Africa
Table 1. Education Levels, Cohort of Women Age 25-44 in 1984,by Data Source (CPS and DHS)
CPS DHSCountry and Education Measure (1) (2)
BostswanaAverage Number of Years of Education 3.53 4.02
(0.06) (0.05)Percentage of Women
No education 37.3 36.5(1.2) (1.1)
Completed primary 27.1 30.2school/more (1.1) (1.0)
Attended secondary 10.5 15.3school (0.8) (0.9)
Completed more than 1.8 6.6Form 3 (0.3) (0.6)
ZimbabweAverage Number of Years of Education 4.36 4.68
(0.08) (0.08)Percentage of women
No education 22.9 21.2(1.1) (1.0)
Completed primary 30.0 34.0school/more (1.2) (1.1)
Attended secondary 10.5 13.5school (0.8) (0.8)
Completed more than 4.4 6.6Form 2 (0.6) (0.6)
Note: Standard errors in parentheses.
219
DifferenceDHS-CPS
(3)
0.49(0.13)
-0.8(1.7)3.1
(1.6)4.8
(1.2)4.8
(0.7)
0.32(0.12)
-1.7(1.5)4.0
(1.7)3.0
(1.2)2.2
(0.8)
difference is about one-third of a year of schooling. Given the average level of schooling isabout four years, there can be little argument that these magnitudes are substantial.
Before we show that the differences are also statistically significant, it is as well toaddress the specific concerns raised by Blanc and Rutstein regarding measurement; each oftheir concerns is discussed briefly below. While it is clearly important to be cognizant ofdifferences in survey design when comparing two surveys, it is our judgment thatdifferences in the measurement of education in the CPS and in the DHS are both small andunlikely to affect our inferences. In addition, as a check on the robustness of theseinferences, we report a battery of different statistical tests below.
Questionnaire Wording
Blanc and Rutstein point out that questions on educational attainment in the CPS andthe DHS are not identical. The CPS asks about the highest grade completed, whereas theDHS asks about the highest grade passed. On the basis of our knowledge of the educationsystem in Zimbabwe (with which we are both very familiar, having been schooled thereourselves) and Botswana, the distinction between completion and passing is largely one of
220 Demography, Vol. 31, No.2, May 1994
semantics." In Zimbabwe, the question in the DHS asks about formal school, whereas theCPS does not; since there is virtually no informal schooling there, this distinction isirrelevant. Thus, differences in the wording of these questions are likely to be of littleimport.
Changes in the Education System
Our examination of women's educational attainment in the CPS and the DHS compareswomen of exactly the same cohort in the two surveys. In the middle panel of Table 4, forexample, the education of women age 25 to 34 in 1984 (Column 1) is compared with that ofwomen age 29-38 in 1988 (in Column 2). These women faced exactly the same educationalsystem when they were in school. Thus we fail to understand why Blanc and Rutstein claimthat changes in the education system in Botswana in 1965 affect our inferences.
Real Increases in Education
Although the National Literacy Programme in Botswana may be associated withincreases in literacy rates among women with little or no education, it is not clear why, asBlanc and Rutstein argue, those women who had participated in the program would reportthat they had completed more years of schooling. Even if they did, this cannot account forthe magnitude of the differences between the education levels in the CPS and the DHS.3More importantly, as noted above and as discussed in detail in our footnote 17, the keydifferences in the education distribution between the CPS and the DHS are found amongwomen with secondary schooling. This fact cannot possibly be explained by the impact ofliteracy programs.
Data Processing Rules
The education variables that we use are drawn directly from the survey questions andare reported in exactly the same format in the CPS and the DHS: each respondent reports thehighest grade she attained at the final level of schooling." An assumption does have to bemade about the years of schooling completed iIi previous levels, but because we have madeexactly the same assumptions in our processing of both surveys, this fact is unlikely toexplain discrepancies in education levels between the two. 5
TESTING FOR DIFFERENCES IN EDUCATION LEVELS
In view of the discussion above, there is no compelling reason to discard theinformation contained in years of education reported in the survey and exploit onlyinformation on whether a woman completed preschool, primary school, or secondaryschool. However, our inferences about differences in education levels do not rely on thisdistinction.
Using a Kolmogorov-Smirnov test, Blanc and Rutstein use only information oneducation levels and compare the distributions in the CPS and the DHS. They acknowledgethat the distributions are different in Botswana for women age 35 to 44 but find that thedifference is not significant in Zimbabwe.
The sampling strategies in the Zimbabwe CPS and DHS are quite different. The DHS
Demographic Transition in Southern Africa 221
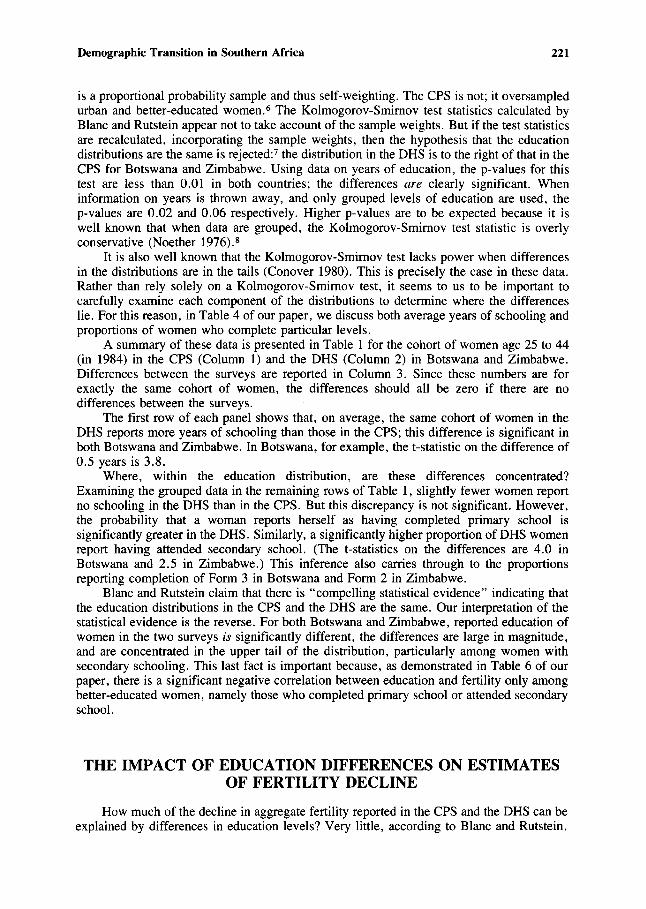
is a proportional probability sample and thus self-weighting. The CPS is not; it oversampledurban and better-educated women." The Kolmogorov-Smimov test statistics calculated byBlanc and Rutstein appear not to take account of the sample weights. But if the test statisticsare recalculated, incorporating the sample weights, then the hypothesis that the educationdistributions are the same is rejected:" the distribution in the DHS is to the right of that in theCPS for Botswana and Zimbabwe. Using data on years of education, the p-values for thistest are less than 0.01 in both countries; the differences are clearly significant. Wheninformation on years is thrown away, and only grouped levels of education are used, thep-values are 0.02 and 0.06 respectively. Higher p-values are to be expected because it iswell known that when data are grouped, the Kolmogorov-Smimov test statistic is overlyconservative (Noether 1976).8
It is also well known that the Kolmogorov-Smimov test lacks power when differencesin the distributions are in the tails (Conover 1980). This is precisely the case in these data.Rather than rely solely on a Kolmogorov-Smimov test, it seems to us to be important tocarefully examine each component of the distributions to determine where the differenceslie. For this reason, in Table 4 of our paper, we discuss both average years of schooling andproportions of women who complete particular levels.
A summary of these data is presented in Table 1 for the cohort of women age 25 to 44(in 1984) in the CPS (Column 1) and the DHS (Column 2) in Botswana and Zimbabwe.Differences between the surveys are reported in Column 3. Since these numbers are forexactly the same cohort of women, the differences should all be zero if there are nodifferences between the surveys.
The first row of each panel shows that, on average, the same cohort of women in theDHS reports more years of schooling than those in the CPS; this difference is significant inboth Botswana and Zimbabwe. In Botswana, for example, the t-statistic on the difference of0.5 years is 3.8.
Where, within the education distribution, are these differences concentrated?Examining the grouped data in the remaining rows of Table 1, slightly fewer women reportno schooling in the DHS than in the CPS. But this discrepancy is not significant. However,the probability that a woman reports herself as having completed primary school issignificantly greater in the DHS. Similarly, a significantly higher proportion of DHS womenreport having attended secondary school. (The t-statistics on the differences are 4.0 inBotswana and 2.5 in Zimbabwe.) This inference also carries through to the proportionsreporting completion of Form 3 in Botswana and Form 2 in Zimbabwe.
Blanc and Rutstein claim that there is "compelling statistical evidence" indicating thatthe education distributions in the CPS and the DHS are the same. Our interpretation of thestatistical evidence is the reverse. For both Botswana and Zimbabwe, reported education ofwomen in the two surveys is significantly different, the differences are large in magnitude,and are concentrated in the upper tail of the distribution, particularly among women withsecondary schooling. This last fact is important because, as demonstrated in Table 6 of ourpaper, there is a significant negative correlation between education and fertility only amongbetter-educated women, namely those who completed primary school or attended secondaryschool.
THE IMPACT OF EDUCATION DIFFERENCES ON ESTIMATESOF FERTILITY DECLINE
How much of the decline in aggregate fertility reported in the CPS and the DHS can beexplained by differences in education levels? Very little, according to Blanc and Rutstein.
222 Demography, Vol. 31, No.2, May 1994
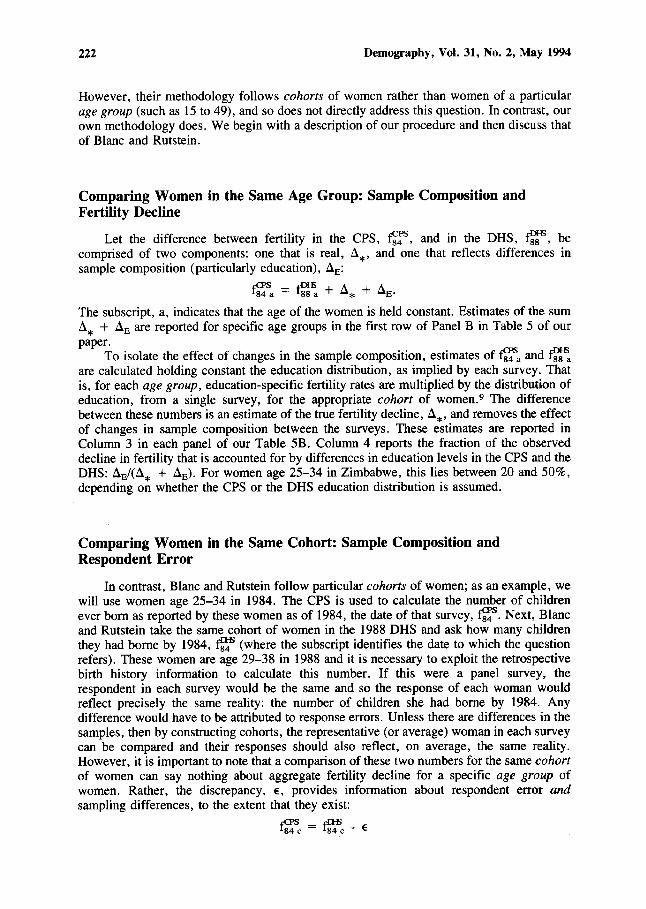
However, their methodology follows cohorts of women rather than women of a particularage group (such as 15 to 49), and so does not directly address this question. In contrast, ourown methodology does. We begin with a description of our procedure and then discuss thatof Blanc and Rutstein.
Comparing Women in the Same Age Group: Sample Composition andFertility Decline
Let the difference between fertility in the CPS, ~:S, and in the DHS, ~, becomprised of two components: one that is real, .l*, and one that reflects differences insample composition (particularly education), .l E :
~a =~ + .l* + .lE •
The subscript, a, indicates that the age of the women is held constant. Estimates of the sum.l* + .lE are reported for specific age groups in the first row of Panel B in Table 5 of ourpaper.
To isolate the effect of changes in the sample composition, estimates of ~a and~are calculated holding constant the education distribution, as implied by each survey. Thatis, for each age group, education-specific fertility rates are multiplied by the distribution ofeducation, from a single survey, for the appropriate cohort of women.? The differencebetween these numbers is an estimate of the true fertility decline, .l*, and removes the effectof changes in sample composition between the surveys. These estimates are reported inColumn 3 in each panel of our Table 5B. Column 4 reports the fraction of the observeddecline in fertility that is accounted for by differences in education levels in the CPS and theDHS: .lE/(.l* + .lE) . For women age 25-34 in Zimbabwe, this lies between 20 and 50%,depending on whether the CPS or the DHS education distribution is assumed.
Comparing Women in the Same Cohort: Sample Composition andRespondent Error
In contrast, Blanc and Rutstein follow particular cohorts of women; as an example, wewill use women age 25-34 in 1984. The CPS is used to calculate the number of childrenever born as reported by these women as of 1984, the date of that survey, ~. Next, Blancand Rutstein take the same cohort of women in the 1988 DHS and ask how many childrenthey had borne by 1984, t?f (where the subscript identifies the date to which the questionrefers). These women are age 29-38 in 1988 and it is necessary to exploit the retrospectivebirth history information to calculate this number. If this were a panel survey, therespondent in each survey would be the same and so the response of each woman wouldreflect precisely the same reality: the number of children she had borne by 1984. Anydifference would have to be attributed to response errors. Unless there are differences in thesamples, then by constructing cohorts, the representative (or average) woman in each surveycan be compared and their responses should also reflect, on average, the same reality.However, it is important to note that a comparison of these two numbers for the same cohortof women can say nothing about aggregate fertility decline for a specific age group ofwomen. Rather, the discrepancy, e, provides information about respondent error andsampling differences, to the extent that they exist:
~c = t?fc + e
Demographic Transition in Southern Africa 223
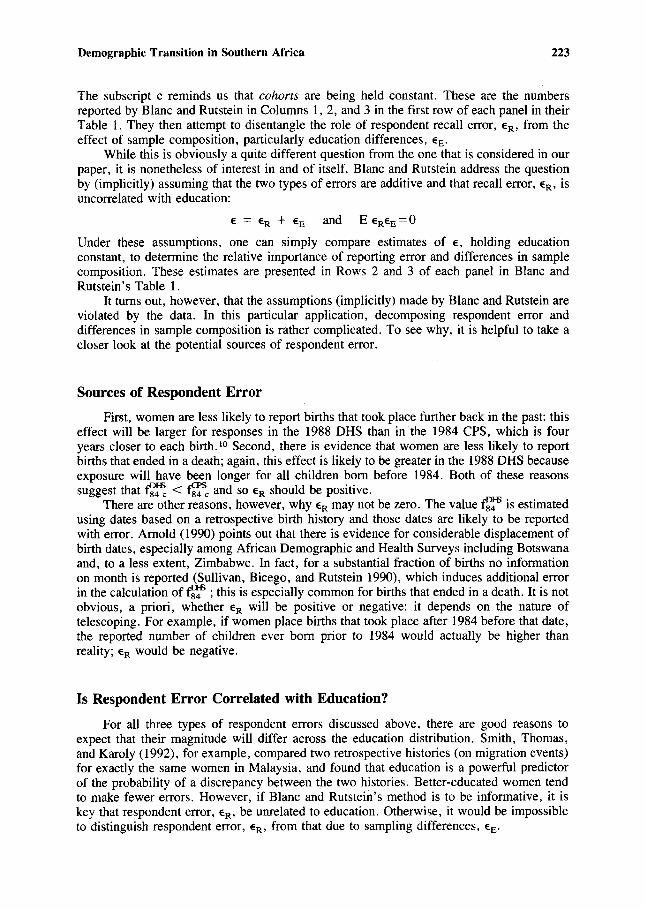
The subscript c reminds us that cohorts are being held constant. These are the numbersreported by Blanc and Rutstein in Columns 1, 2, and 3 in the first row of each panel in theirTable 1. They then attempt to disentangle the role of respondent recall error, ER, from theeffect of sample composition, particularly education differences, EE.
While this is obviously a quite different question from the one that is considered in ourpaper, it is nonetheless of interest in and of itself. Blanc and Rutstein address the questionby (implicitly) assuming that the two types of errors are additive and that recall error, ER, isuncorrelated with education:
E = ER + EE and E EREE=O
Under these assumptions, one can simply compare estimates of E, holding educationconstant, to determine the relative importance of reporting error and differences in samplecomposition. These estimates are presented in Rows 2 and 3 of each panel in Blanc andRutstein's Table 1.
It turns out, however, that the assumptions (implicitly) made by Blanc and Rutstein areviolated by the data. In this particular application, decomposing respondent error anddifferences in sample composition is rather complicated. To see why, it is helpful to take acloser look at the potential sources of respondent error.
Sources of Respondent Error
First, women are less likely to report births that took place further back in the past: thiseffect will be larger for responses in the 1988 DHS than in the 1984 CPS, which is fouryears closer to each birth. 10 Second, there is evidence that women are less likely to reportbirths that ended in a death; again, this effect is likely to be greater in the 1988 DHS becauseexposure will have been longer for all children born before 1984. Both of these reasonssuggest that~ < fsrc and so ER should be positive.
There are other reasons, however, why ER may not be zero. The value~ is estimatedusing dates based on a retrospective birth history and those dates are likely to be reportedwith error. Arnold (1990) points out that there is evidence for considerable displacement ofbirth dates, especially among African Demographic and Health Surveys including Botswanaand, to a less extent, Zimbabwe. In fact, for a substantial fraction of births no informationon month is reported (Sullivan, Bicego, and Rutstein 1990), which induces additional errorin the calculation of~ ; this is especially common for births that ended in a death. It is notobvious, a priori, whether ER will be positive or negative: it depends on the nature oftelescoping. For example, if women place births that took place after 1984 before that date,the reported number of children ever born prior to 1984 would actually be higher thanreality; ER would be negative.
Is Respondent Error Correlated with Education?
For all three types of respondent errors discussed above, there are good reasons toexpect that their magnitude will differ across the education distribution. Smith, Thomas,and Karoly (1992), for example, compared two retrospective histories (on migration events)for exactly the same women in Malaysia, and found that education is a powerful predictorof the probability of a discrepancy between the two histories. Better-educated women tendto make fewer errors. However, if Blanc and Rutstein's method is to be informative, it iskey that respondent error, ER, be unrelated to education. Otherwise, it would be impossibleto distinguish respondent error, ER, from that due to sampling differences, EE.
224 Demography, Vol. 31, No.2, May 1994
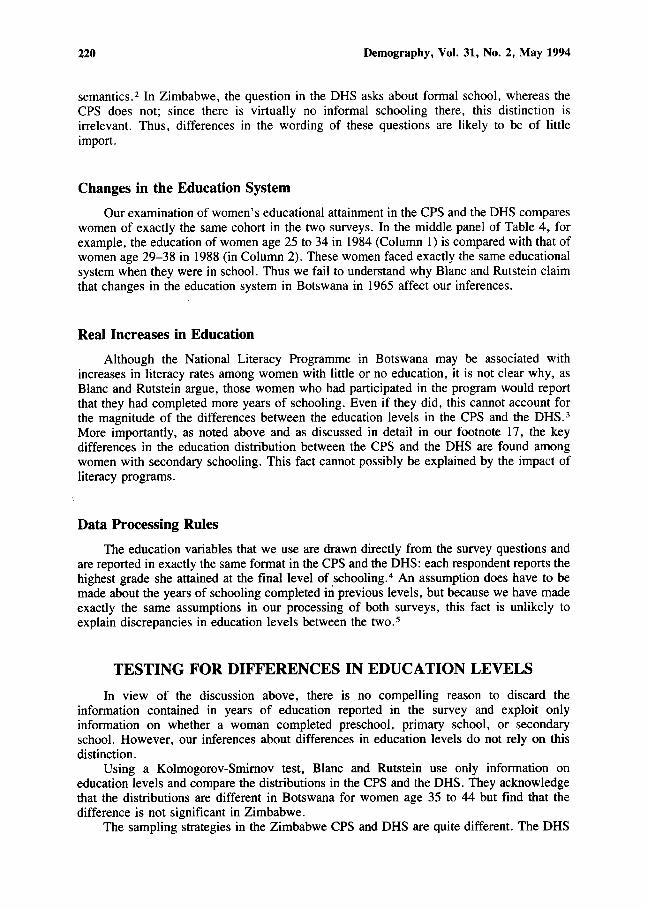
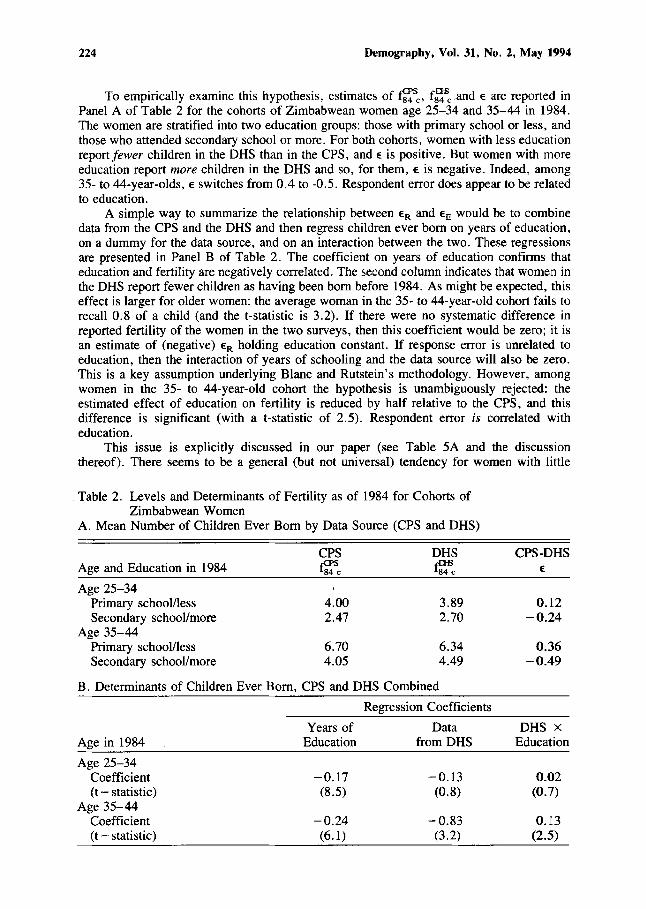
To empirically examine this hypothesis, estimates of ~c, f~c .and E are reported inPanel A of Table 2 for the cohorts of Zimbabwean women age 25-34 and 35-44 in 1984.The women are stratified into two education groups: those with primary school or less, andthose who attended secondary school or more. For both cohorts, women with less educationreportfewer children in the DHS than in the CPS, and E is positive. But women with moreeducation report more children in the DHS and so, for them, E is negative. Indeed, among35- to 44-year-olds, E switches from 0.4 to -0.5. Respondent error does appear to be relatedto education.
A simple way to summarize the relationship between ER and EE would be to combinedata from the CPS and the DHS and then regress children ever born on years of education,on a dummy for the data source, and on an interaction between the two. These regressionsare presented in Panel B of Table 2. The coefficient on years of education confirms thateducation and fertility are negatively correlated. The second column indicates that women inthe DHS report fewer children as having been born before 1984. As might be expected, thiseffect is larger for older women: the average woman in the 35- to 44-year-old cohort fails torecall 0.8 of a child (and the t-statistic is 3.2). If there were no systematic difference inreported fertility of the women in the two surveys, then this coefficient would be zero; it isan estimate of (negative) ER holding education constant. If response error is unrelated toeducation, then the interaction of years of schooling and the data source will also be zero.This is a key assumption underlying Blanc and Rutstein's methodology. However, amongwomen in the 35- to 44-year-old cohort the hypothesis is unambiguously rejected: theestimated effect of education on fertility is reduced by half relative to the CPS, and thisdifference is significant (with a t-statistic of 2.5). Respondent error is correlated witheducation.
This issue is explicitly discussed in our paper (see Table 5A and the discussionthereof). There seems to be a general (but not universal) tendency for women with little
.. Table 2. Levels and Determinants of Fertility as of 1984 for Cohorts ofZimbabwean Women
A. Mean Number of Children Ever Born by Data Source (CPS and DHS)
CPS DHS CPS-DHSAge and Education in 1984 ~c ~c E
Age 25-34Primary school/less 4.00 3.89 0.12Secondary school/more 2.47 2.70 -0.24
Age 35-44Primary school/less 6.70 6.34 0.36Secondary school/more 4.05 4.49 -0.49
B. Determinants of Children Ever Born, CPS and DHS Combined
Regression Coefficients
Age in 1984
Age 25-34Coefficient(t - statistic)
Age 35-44Coefficient(t - statistic)
Years ofEducation
-0.17(8.5)
-0.24(6.1)
Datafrom DHS
-0.13(0.8)
-0.83(3.2)
DHS X
Education
0.02(0.7)
0.13(2.5)
Demographic Transition in Southern Africa 225
education to report fewer children in the DHS and the better educated to report morechildren, relative to the CPS. Precisely why, we cannot say, although it probably hassomething to do with either the relationship between education and telescoping, or with thefact that the fertility questions in the CPS and the DHS are not the same. 11 What we can say,however, is that it is impossible to disentangle respondent error from the impact of samplecomposition differences using the methodology adopted by Blanc and Rutstein. It is,therefore, not clear what interpretation should be given to the numbers they present in theirTable 1.
Reasons for Preferring Cumulative Fertility over Current Fertility
Finally, Blanc and Rutstein argue that a more reliable approach would be to use fertilityover the previous year and calculate a total fertility rate (TFR) rather than examinecumulative fertility for age groups as we have done. At first blush, this seems like anappealing alternative although it is not obvious to us that it is more reliable. Because Blancand Rutstein adopt the same procedure as described above in their assessment of the impactof education differences, it is once again not clear how to interpret the results in their Table2. Putting that methodological issue aside, however, there are two reasons why we chosenot to use current fertility and the TFR in our analysis.
First, the total fertility rate is conventionally calculated for all women age 15 to 49.However, women age 15 to 19 in 1988 would have been 10 to 14 in 1984. Since the CPSonly contains information on women age 15 to 49, it contains no information about what theeducation of these women was in 1984: it is not even possible to calculate a conventionalTFR (holding the distribution of education constant as implied by the CPS). Furthermore,most of these women, and many of those age 20 to 24 in 1988, would not have completedschool by 1984 so their education levels will have risen between the surveys. In order toassess the effect of differences in sample compositions, an education retrospective is neededto calculate the education of the sample women four years previously. 12 It is for preciselythese reasons that we focus only on women age 25 to 44 in our analysis.
In principle, one could apply our methodology to compare age-specific current fertilityrates for women age 25 to 44, calculated using the CPS and the DHS, and determine howmuch of that decline is accounted for by differences in education levels in the two surveys.But this approach is unlikely to be very informative because it is only among young women(15 to 24) that there are large differences in current fertility across the educationdistribution. For example, in the Zimbabwe CPS, women in this age group with somesecondary schooling are about 16% less likely to have borne a child in the previous yearrelative to those without any schooling. For women age 25 to 44, however, there is nosignificant relationship between education and current fertility. Yet there is a substantialeffect of education on cumulative fertility for 25- to 44-year-old women; on average, thosewith secondary schooling have had 2.7 children fewer than those with no schooling. Thisfinding reflects the fact that most of the differences in fertility across the educationdistribution are accounted for by age at first birth and by fertility in the teens and earlytwenties. Thus we prefer our own strategy, which captures these differences by using acumulative measure of fertility-the number of children ever born.
CONCLUSION
Let us be clear about where there is agreement between Blanc and Rutstein andourselves. There is no argument that there is evidence for fertility decline in both Botswana
226 Demography, Vol. 31, No.2, May 1994
and Zimbabwe; it is the magnitude of the decline that is in dispute. Also, as we said in ourpaper, it is only with the examination, at the micro-level, of high quality survey data like theCPS and the DHS that researchers and policy makers can hope to understand the dynamicsand determinants of fertility change in sub-Saharan Africa.
We have two main conclusions. First, there is unambiguous evidence in both Botswanaand Zimbabwe that levels of reported education of women in the DHS are higher than thosefor the same cohort of women in the CPS. These differences are significant whether weexamine average years of education, the probability of completing primary school, attendingsecondary school or completing the first phase of secondary school. There are alsosignificant differences in the entire education distributions as indicated by KolmogorovSmimov statistics that take account of sample weights.
Second, our methodology for assessing the impact of these differences on fertility isappropriate. By comparing the fertility of the same age group of women, while holdingeducation constant, we can estimate the true extent of fertility decline. Therefore, we standby the conclusion as stated in our paper. That is, part, but not all, of the decline in theaggregate number of children ever born reported in the 1984 CPS and the 1988 DHS can beattributed to differences in sample composition.
Projections of population based on these aggregate statistics are likely to underestimatepopulation growth. It would be most unfortunate if, as census results from Botswana andZimbabwe become available, population policy (and family planning programs) were to bediscredited because of an error in the interpretation of these data by the research and policycommunities.
NOTES
1 In contrast, the discussion below of changes in the fertility of women age 15 to 49, say,compares specific age groups.
2 The bulk of the populationin both countries does not complete primary school; for them, thereare no formal examinations that need to be passed in order to progress to the next grade. Thedistinctionbetween passing and completing is relevant only in the case of public examinations, suchas '0' Level and 'A' Level, which are taken toward the end of secondary school.
3 Recall that, on average, half a year more of schooling is reported by women surveyed in theDHS compared with those in the CPS. In the CPS, half the Batswana women age 25 to 44 wereliterate in 1984; thus, to account for the differences 'in education, every single one of the other halfwould have had to participate in the literacy program between 1984 and 1988 and would have had toreport themselves as having completedan extra year of schooling. This implies that by 1988, amongwomen age 25 to 44, illiteracy would have been wiped out in Botswana.
4 Blanc and Rutstein appear to have assumed, incorrectly, that we used a derived variable on therecoded DHS data sets.
5 These concerns are likely to be importantonly for womenwho'complete '0' Level or 'A' Leveland continue to some tertiary educational institution. They account for only a tiny fraction of thesample. For example, in both the Zimbabwe CPS and DHS, only about 1.5% of all women reportmore than Form 4 schooling (when '0' Level examinations are often written). Obviously, dataprocessingdifferences of one year or even two in these women's education levels will not have anysubstantial impact on the average for the whole sample. Furthermore, inferences based on levels ofschooling, rather than years, will be unaffected by these assumptions.
6 For example, urban households are about 1.5 times more likely to be in the CPS than ruralhouseholds. Since, on average, urban women have nearly six years of education and rural womenhave less than four, failure to take account of the sampling weights will result in the CPS sampleappearing to be better educated than the underlying population.
7 Critical values of the Kolmogorov-Smirnov statistic are also computed taking account of thesample weights; the actual sample size is replaced by the effective sample size which, since the
Demographic Transition in Southern Africa 227
weights are nonnalizedto be on average unity, is simply the sum of the squared weights. We aregrateful to Dan Relles for making this point.
8 Within the urban sector, an unweighted Kolmogorov-Smirnov test also indicates that thedistributions of education in the Zimbabwe DHS and CPS are significantly different. This is because,among urban women, the range of the sampling weights is much smaller than in the rural sector andso for urban women the CPS is closer to self-weighting. The p-values for the Kolmogorov-Smirnovtest statistics are 0.003 (using years of education) and 0.01 (using grouped data).
9 For example, assuming the education distribution in the 1984 CPS, then for women age 25 to34 in the 1988 DHS, we multiply their own fertility rates by the education distribution of that cohortof women (age 21 to 30 in 1984) as reported in the CPS. This estimate of fertility is compared with thefertility estimate reported by 25- to 34-year-old women in the CPS. (See footnote 19 in our paper fora specific example.) Because the education distributions are cohort specific, this estimate of fertilitydecline incorporates the impact of growth in education of women over time. Many of the women age15 to 19 in 1984 (and thus 20 to 24 in 1988) would not have completed their education by 1984 andso that age group is excluded from the simulations. This is a straightforward application ofstandardizations that are commonly used in demography; see, for example, Shryock and Siegel(1980).
10 Recall that only births before 1984 are included in these calculations.11 Recall that the DHS contains a full birth history, whereas the CPS asks only summary
questions about children ever born. See our paper for a fuller discussion.12 Notice also that information is needed on the education of women age 50-54 in 1988 to
compute TFRs holding the distribution of education constant. This is not available in the DHS.
REFERENCESArnold, F. 1990. "Assessment of the Quality of Birth History Data in the Demographic and Health
Surveys." pp. 83-110 in An Assessment of DHS-l Data Quality, Methodological Reports 1.Columbia: Institute for Resource Development.
Conover, W. J. 1980. Practical Nonparametric Statistics. New York: Wiley.Noether, G. E. 1976. Elements ofNonparametric Statistics. New York: Wiley.Shryock, H. S. and J. S. Siegel. 1980. The Methods and Materials of Demography. San Diego:
Academic Press.Smith, J. P., D. Thomas and L. Karoly. 1992. "Migration in Retrospect: Differences between Men
and Women." Unpublished manuscript, RAND, Santa Monica.Sullivan, J. M., G. T. Bicego and S. O. Rutstein. 1990. "Assessment of the Quality of Data Used for
the Direct Estimation of Infant and Child Mortality in the Demographic and Health Surveys." pp.115-40 in An Assessment ofDHS-l Data Quality, Methodological Reports 1. Columbia: Institutefor Resource Development.
Recommended