PERSONNEL PSYCHOUMY 199245
THE IMPACT OF FLEXIBLE BENEFITS ON EMPLOYEE SATISFACTION: A FIELD STUDY
ALISON E. BARBER Eli Broad Graduate School of Management
Michigan State University
RANDALL B. DUNHAM, ROGER A. FORMISANO Graduate School of Business and Industrial Relations Research Institute
University of Wisconsin-Madison
This study examines the attitudes of 110 employees of a financial ser- vice organization before and after the introduction of a flexible bene- fit plan. A large, statistically significant increase in benefit satisfaction was observed following implementation, as was a smaller significant in- crease in overall satisfaction. Employee understanding of the benefit package also increased significantly. No significant relationships were found between demographic characteristics and responses to the flexi- ble plan. Potential confounds due to the complexity of the intervention are discussed. Future research is called for to examine the processes through which flexible benefits impact worker reactions and to examine the impact of flexible benefits on behavioral responses such as attrac- tion and retention.
Employee benefits accounted for 19% of payroll in the United States in 1950 (Bloom & 'Rahan, 1986). By 1986, they accounted for 39% of payroll (Bureau of National Affairs, 1988). Part of this increase is attributable to the rising costs of specific benefits (e.g., medical care coverage). However, the scope of benefit coverage has also expanded. Whereas most early benefit plans provided little more than basic health and retirement coverage, today's plans often offer profit-sharing and stock ownership benefits, legal, educational, and child-care assistance, dental and vision insurance, and life insurance for employees and their dependents. Because the United States provides little in the way of nationalized benefit plans (Alpert, 1989), pressure on U.S. employers to provide and manage this broad spectrum of benefits is particularly intense.
The authors wish to thank LaNette Zimmerman, Nancy Johnson, Mary Zastrow, and Candace Walker Brent for their assistance on this project; and Herb Heneman, Randi Huntsman, and three anonymous reviewers for helpful comments.
An earlier version of this paper was presented at the 1990 meeting of the Academy of Management, San Francisco, CA.
Correspondence and requests for reprints should be addressed to Alison E. Barber, Eli Broad Graduate School of Management, East Lansing, MI 48824-1121.
COPYRIGHT 8 1992 PERSONNEL PSYCHOLOGY, INC.
55
56 PERSONNEL PSYCHOLOGY
The wide variety of potential benefits raises an important issue for plan design: which of the many available benefits should an organiza- tion include in its plan? Baditionally, this decision has been made uni- laterally by professional benefits managers in consultation with top-level management. An increasingly popular option today is the “cafeteria” or “flexible” benefit plan, in which employees may choose among a vari- ety of benefits, or choose among varying levels of benefits. %idly, employers establish limits for total plan costs and, within certain limits, allow employees to determine how the total benefit dollars are spent. The amount of choice permitted by these plans can vary considerably.
Flexible benefit plans were first explored in the late 1970s. The growth in adoption of these programs since 1980, primarily in the United States, has been great. A Hewitt Associates report indicates that, while only eight major employers had federally qualified flexible benefit plans in 1980, over 800 offered them in 1988 (“Section 125 Flexible Benefit Programs,” 1988). This trend is likely to continue, particularly given that flexible programs are most prevalent in the service sector (“Demograph- ics,” 1989), the fastest growing employment sector in the U.S. economy (Haugen, 1989).
Flexible programs were initially explored in response to changing de- mographics. During the decade of the 19&, family and workforce pat- terns changed dramatically. Increased divorce rates, lowered childbirth rates, and increased female employment led to a more heterogeneous workforce. It was argued that traditional benefit plans geared to the needs of the formerly preponderant nuclear family (i.e., an employed male head of household, nonworking spouse, and children) failed to ac- commodate the interests of the new workforce (“Demographics,” 1989).
By the 198Os, exploding costs of health insurance and other employee benefits, combined with significant general inflation, brought a broader interest in flexible benefit plans as a cost containment tool. Cost sav- ings can be realized by (a) limiting the total cost of benefits by allowing employees to choose personally valued benefits within a cost constraint and, (b) improving efficiency of benefit use through increased aware- ness of benefit costs. A recent survey (“Changing Work Force,” 1988) indicated that cost containment is particularly effective for medical ben- efits, with medical cost increases for flexible plans averaging about 70% of the cost increases of traditional (nonflexible) plans. To some extent, however, the cost containment effect of flexible benefits could be offset by increased administrative costs (associated with processing individual benefit choices) and by adverse selection (where only heavy users of a particular benefit opt for that benefit).
ALISON E. BARBER ET AL. 57
Flexible benefit plans may also result in positive employee relations outcomes. Advocates of flexible plans claim that they can increase satis- faction with benefits per se, enhance job satisfaction in general, produce higher levels of motivation and productivity, and increase attraction and retention of employees (e.g., Beam & McFadden, 1988; Employee Ben- efits Research Institute, 1982; Rosenbloom & Hallman, 1986). These claims, however, are based on anecdotal evidence, since no available re- ports of empirical studies have addressed either the attitudinal or the behavioral impact of flexible benefit plans.
An important first step in evaluating flexible benefit plans would be to document the impact of flexible benefit plans on employee benefit satisfaction. Job satisfaction is frequently viewed as the sum of satis- faction with a number of independent job elements, such as pay, promo- tions, and working conditions (Locke, 1976). More recently, researchers have argued that pay satisfaction can be subdivided into independent el- ements such as satisfaction with benefits, pay level, pay administration, and pay structure (Heneman & Schwab, 1985.) Empirical research has consistently supported the existence of the benefit satisfaction dimen- sion (Scarpello, Huber, & Vandenberg, 1988). Furthermore, attitudes toward benefits have been found to be significant determinants of pay satisfaction (Berger, 1984; Dreher, 1981) and pay satisfaction has been shown to be related to behavioral outcomes such as absenteeism and turnover (Motowidlo, 1983; Weiner, 1980).
If flexible benefits (or other benefit innovations) influence employee behaviors, they likely do so through their impact on benefit satisfaction. Thus enhanced benefit satisfaction may be a prerequisite for other out- comes. (For a general review of the effects of pay satisfaction on em- ployee outcomes, see Heneman, 1985.)
Several reasons for the assumed linkages between flexible benefits and benefit satisfaction have been proposed. First, higher satisfaction might result if flexible benefits produce a better match between the ben- efits individual employees want and the benefits they receive (Rosen- bloom & Hallman, 1986). This need-satisfaction argument is consis- tent with Locke’s (1969,1976) discrepancy definition of job satisfaction. Locke posits that job satisfaction is “a function of the perceived relation- ship between what one wants from one’s job and what one perceives it as offering or entailing” (Locke, 1969, p. 316). If the benefits desired by the growing number of nontraditional employees (e.g., single employees, dual career couples) are not provided by conventional benefit plans, flex- ible benefit plans may provide a mechanism to reduce this discrepancy and hence increase their benefit satisfaction.
Flexible benefits may also enhance benefit satisfaction by making em- ployees more aware of the nature and value of their benefits (Beam
58 PERSONNEL PSYCHOLOGY
& McFadden, 1988). Employees are often unfamiliar with the value of their benefit packages, either in absolute (dollar) terms (Wilson, Northcraft, & Neale, 1985) or relative to the benefits received by oth- ers (Dreher, Ash, & Bretz, 1988). Research also indicates that employ- ees frequently undervalue their benefits (Wilson et al., 1985). It is fre- quently argued that participating in the process of designing and/or se- lecting benefits under an individualized (flexible) plan will lead to better understanding and appreciation of benefit value on the part of employ- ees (e.g., Miceli & Lane, in press; Rosenbloom & Hallman, 1986). If the information acquired leads employees to view their benefits in a more positive light, benefit satisfaction should increase.
Despite the fact that there are several sound reasons why implement- ing a flexible benefit plan could increase employee benefit satisfaction (and subsequently behavioral outcomes), there has yet to be an empiri- cal evaluation of this effect. The primary purpose of the present study is to empirically evaluate, in a field setting, the impact of the implementa- tion of a flexible benefit plan on employee benefit satisfaction. Thus:
HLpothesis 1: Implementation of a flexible benefit plan will lead to an increase in satisfaction with benefits.
The anecdotal literature also suggests that flexible benefit plans will lead to increases in general job satisfaction. This suggestion is based on a view of overall job satisfaction as the sum of evaluations of individual job elements (Locke, 1969). Because benefit satisfaction is an element of overall satisfaction, an increase in the former should yield an increase in the latter. However, given the variety of elements that have been shown to be components of overall job satisfaction (e.g., Smith, Kendall, & Hulin, 1969; Weiss, Dawis, England, & Lofquist, 1967), the contribution of a single element to overall job satisfaction is likely to be small. Thus, we hypothesized that:
H’ypothesis 2: Implementation of a flexible benefit plan will lead to an in- crease in job satisfaction. However, this increase will be smaller in magni- tude than the increase in benefit satisfaction.
Several additional research questions were formulated to provide a preliminary examination of the mechanisms by which flexibility influ- ences benefit satisfaction. First, we investigated whether flexible bene- fits might reduce discrepancies between the benefits employees want and the benefits they receive. Many advocates of flexible benefits argue that benefit preferences are determined by demographic characteristics, and that the benefit preferences of nontraditional workers are not well met by traditional plans. Therefore, we assessed the extent to which subjects
ALISON E. BARBER ET AL. 59
in the present study differed from the "traditional" (i.e., mamed male head of household) demographic profile, and whether divergence from the traditional profile was related to benefit satisfaction either before or after implementation of the flexible benefit plan. We expected a nega- tive relationship between benefit satisfaction and nontraditional status under the original (i.e., nonflexible) benefit plan, as a result of the antic- ipated discrepancy between the needs of nontraditional employees and the benefits offered by a traditional benefit plan. This negative correla- tion should be reduced by flexible plans because individuals can choose benefits to minimize any discrepancies.
The arguments of flexible benefits advocates notwithstanding, prior research has provided only mixed support for the relationship between demographics and benefit preferences (Milkovich & Newman, 1990). Many other factors can influence individual benefit preferences (e.g., risk aversion, individual demand for leisure; Miceli & Lane, in press). Therefore, a more general test of the discrepancy argument was needed. Presumably, employees experiencing severe discrepancies between ben- efits desired and benefits received under the traditional plan will make substantial changes to their benefit plan when given the opportunity to do so, regardless of how their preferences are determined. Once these changes are made, however, discrepancies should diminish. Therefore, we anticipated a negative relationship between the extent of changes made under the flexible plan and benefit satisfaction prior to implemen- tation of the flexible plan. Again, this negative correlation should be di- minished under the flexible plan, as individuals design plans to minimize discrepancies.
Method
Sample
Primary data for this study were collected between 1985 and 1987 from a professional management organization serving associated finan- cial institutions. Approximately 475 professional, technical, and admin- istrative workers were employed by the organization at the beginning of the study. All employees were included in the flexible benefit plan. A pretest survey was voluntarily completed by 314 employees (response rate of 66%), and a posttest survey was completed by 270 (response rate of 57%). This shrinkage was in part due to employee failure to attend meetings where the surveys were distributed, and in part to employees choosing not to complete the survey. These samples are referred to as the full pretest and full posttest samples.
60 PERSONNEL PSYCHOLOGY
Employees were asked to include their names on each survey, to al- low matching of pretest and posttest questionnaires. This self-identifica- tion was strictly voluntary. A total of 110 employees responded to and identified themselves on both surveys. The substantive hypotheses of this study are tested using this subset of subjects (referred to as .the matched sample.)
Subjects in the matched sample were predominately (75%) under the age of 40. lbo thirds were female, two thirds were married, half had chil- dren living at home, and over half had spouses who worked outside of the home. Half were members of a clerical union. Approximately 20% were professional employees, 25% held supervisory or managerial posi- tions, and the rest worked at technical or administrative jobs. Average tenure with the company was relatively low: 40% of the subjects had less than three years of organizational service; only 25% had more than 8 years of service.
Because of substantial shrinkage from the full pretest and posttest samples to the matched sample, numerous tests were conducted to iden- tify differences between those who self-identified on both surveys (and therefore could be matched) and those who did not. Chi-square and t-tests comparing the demographic characteristics of the matched sam- ple to those of the full pretest and full posttest samples identified no signiiicant differences. In addition, no differences in tenure or in gen- der were observed between survey respondents and the organizational population. No other demographic variables were available for the pop- ulation.
A comparison of satisfaction levels of those who self-identified on both surveys (i.e., the matched sample) and those who did not (i.e., the full pretest and full posttest samples) indicated no statistically significant differences in mean levels of benefit satisfaction or in distribution of benefit satisfaction scores at either the pretest or the posttest. Average overall satisfaction was slightly higher for those who self-identified at the time of the pretest (3.70 vs. 3.58, p <.05), but was not significantly different on the posttest. No significant differences were observed in understanding of the benefit plan at either pretest or posttest. Finally, no significant differences in benefits selected under the flexible plan were found.
An independent sample of 165 subjects from another organization was also used to assess convergence of our benefits satisfaction measure with the benefits satisfaction subscale of the Pay Satisfaction Question- naire (Heneman & Schwab, 1985), an instrument that became the sub- ject of considerable research following the initial design of our study. Information on this sample, and on the results of this analysis, are pro- vided in the appendix.
ALISON E. BARBER ET AL. 61
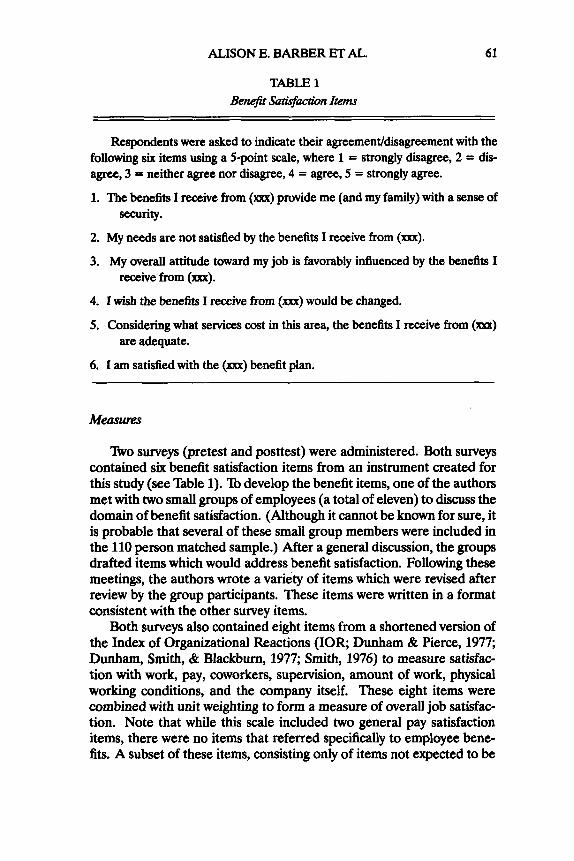
TABLE 1 Benefit Satu$action Items
Respondents were asked to indicate their agreementldisagreement with the following six items using a 5-point scale, where 1 = strongly disagree, 2 = dis- agree, 3 = neither agree nor disagree, 4 = agree, 5 = strongly agree.
1. The benefits I receive from (xxx) provide me (and my family) with a sense of
2. My needs are not satisfied by the benefits I receive from (xxx).
3. My overall attitude toward my job is favorably inffuenced by the benefits I
security.
receive from (xxx).
4. I wish the benefits I receive from (xxx) would be changed.
5. Considering what seMces cost in this area, the benefits I receive from (xxx)
6. I am satisfied with the (a) benefit plan.
are adequate.
Measums
Tho surveys (pretest and posttest) were administered. Both surveys contained six benefit satisfaction items from an instrument created for this study (see 'hble 1). 21 develop the benefit items, one of the authors met with two small groups of employees (a total of eleven) to discuss the domain of benefit satisfaction. (Although it cannot be known for sure, it is probable that several of these small group members were included in the 110 person matched sample.) After a general discussion, the groups drafted items which would address benefit satisfaction. Following these meetings, the authors wrote a variety of items which were revised after review by the group participants. These items were written in a format consistent with the other survey items.
Both surveys also contained eight items from a shortened version of the Index of Organizational Reactions (IOR, Dunham & Pierce, 1977; Dunham, Smith, & Blackburn, 1977; Smith, 1976) to measure satisfac- tion with work, pay, coworkers, supervision, amount of work, physical working conditions, and the company itself. These eight items were combined with unit weighting to form a measure of overall job satisfac- tion. Note that while this scale included two general pay satisfaction items, there were no items that referred specifically to employee bene- fits. A subset of these items, consisting only of items not expected to be
62 PERSONNEL PSYCHOLOGY
influenced by implementation of the flexible benefits plan (satisfaction with kind of work, amount of work, coworkers, supervision, and physical working conditions), was used to create a scale representing noncom- pensation satisfaction.
In addition, two 5-point Likert items were used to measure employ- ees’ understanding of the benefit plan (“I understand the benefit plan quite well,” and “I would like more information about the benefit plan”). The pretest survey also included a number of items used to aid in the de- sign of the new benefit plan.
A scale was formed to indicate the extent to which individual sub- jects differed from the traditional employee demographic profile. Infor- mation on demographics was obtained from the pretest survey. Mea- sures of gender, marital status, whether one’s spouse worked, whether one had children, and two levels of job tenure were dummy-coded, with the traditional categories (long-tenure, married males with children and nonworking spouses) coded as zero. These variables were then summed to create a demographic profile index with values ranging from 0-6, with higher index numbers representing a greater divergence from the tradi- tional profile.
Finally, an index of the extent to which subjects actually changed their benefit plans (relative to the existing plan) after flexible benefits were implemented was created using data from the company’s payroll records. Variables indicating whether subjects made changes in six major benefit categories (health insurance, life insurance, retirement, vacation, long- term disability, prepaid spending account) were each coded “0” if no change was made and “1” if a change was made. In addition, a variable indicating whether employees chose to receive cash in lieu of a portion of their benefit coverage was coded “0” if no cash was received and “1” if cash was received. These variables were then summed to generate an index of extent of change, with higher index numbers representing greater change.
Procedm
&test. Participants were assembled in groups of 2&50 in an on-site conference room during working hours. They were shown a videotape in which one of the authors and the organization’s vice president of human resources explained the purpose of the study. The pretest survey was then administered by and returned to the researchers.
After the pretest, participants were given a packet of materials that described and asked for reactions to all existing benefits and a num- ber of alternative benefits. These reactions consisted of valuation (on a scale from 0-10) of each element of the current benefit plan and each
ALISON E. BARBER ET AL. 63
of a variety of alternatives under consideration for inclusion in the new plan. In addition, employees were asked to choose benefits under a sim- ulated flexible benefit plan which was very similar to the plan later imple- mented. Some design changes were made based on the value attached to each benefit element and the frequency of choice alternatives.
Plan impkmentation. The flexible benefit plan implemented as part of this research was designed, in large part, based on input solicited during the pretest phase. The plan, implemented 14 months after the study began, included a core comprised of basic health, life, and long- term disability benefits. A number of new benefit options (e.g., more or less life insurance, more or less vacation time, and more or less long- term disability coverage) were made available. Several health insurance options were offered, as were opportunities to receive cash in lieu of some noncash benefits. The option of retaining the exact same coverage as had been provided by the “old” benefit plan was also offered. The flexible plan was designed so that the dollar value of benefits provided would be equal to the dollar value of benefits offered under the old plan.
Introduction of the flexible plan was accompanied by several infor- mational items describing the nature and administration of the new plan. In addition, up to 2 hours of group training were provided to help em- ployees use the plan. Virtually all employees participated in these group sessions, which were conducted by the organization’s human resources group. At the sessions, written materials describing the plan were dis- tributed and discussed, as was the process to be used for selecting bene- fits.
Posttest. Four months after the introduction of the flexible benefit plan, a second survey was administered on-site by a member of the re- search team. Responses were returned directly to the researchers. Par- ticipants were assured confidentiality, but they were asked to identify themselves by name on each survey to allow matching of pretest and posttest responses. This self-identification was entirely voluntary.
Data collected from organizational records at the time of the posttest indicated that over 90% of study participants opted for the flexible plan. Most of these took advantage of the substantial flexibility the new plan offered. For example, over 85% replaced the core health care option and over 80% enhanced their disability coverage.
Summary of design. It is important to note that a number of events occurred as part of this complex organizational intervention. All have been noted above. However, to summarize, the intervention included (a) discussionswith 11 employees to develop survey items, (b) the pretest survey, (c) training and communication regarding the flexible plan, (d) implementation of the flexible plan, and (e) the posttest survey.
64 PERSONNEL PSYCHOLOGY
Principal component factor analysis with varimax rotation and coeffi- cient alpha reliability analyses were used to assess reliability and validity for the benefit satisfaction measure. Pretest and posttest data from the matched sample were used for this analysis. (See appendix for conver- gence of this measure with the benefits subscale of the Pay Satisfaction Questionnaire.) Coefficient alpha internal consistency estimates were also obtained for the other scales.
A nonequivalent dependent variables design (Cook & Campbell, 1979) was used to test the hypotheses of this study. One-tailed, paired- sample t tests were used to test for increases from pre- to post-interven- tion means for benefit satisfaction and overall job satisfaction. We also tested for differences in facets of satisfaction that were not expected to change following implementation of the flexible plan: satisfaction with physical working conditions, coworkers, supervision, kind of work, and amount of work. These items were combined into a 5-item scale rep- resenting noncompensation satisfaction. There were two purposes for combining these items. The first was to allow assessment of measure- ment reliability, an indicator of whether true changes would have been registered had they occurred (Cook & Campbell, 1979). The second was to minimize the number of hypothesis tests performed, thereby reducing the probability of finding significant results by chance. However, results for individual facets of satisfaction are also reported.
A one-tailed t test was used to test for increased understanding of the benefit plan. Correlations between demographic profiles and pre- and posttest benefit satisfaction were used to assess whether (a) there was a negative relationship between nontraditional demographic char- acteristics and benefit satisfaction at the pretest stage, and (b) whether this relationship was diminished following implementation of the flexi- ble plan. In addition, correlations between the index of actual benefit changes and pre- and posttest benefit satisfaction were examined in or- der to assess more directly whether discrepancies between benefits de- sired and benefits received under the original plan might be associated with lower benefit satisfaction at the pretest stage, and whether this re- lationship was reduced under the flexible plan. This analysis is based on the assumption that those who felt the largest discrepancies under the original plan would make more substantial changes in their benefits than would those who experienced smaller discrepancies.
ALISON E. BARBER ET AL. 65
Results
Principal component factor analyses of the six-item benefit satisfac- tion measure suggested a two-factor solution for the pretest (using the criterion that eigenvalues for retained factors should exceed 1.0). This solution explained 63.9% of the variance. After varimax rotation, the first factor was defined by items 1, 2, 4, 5, and 6, with the second fac- tor defined solely by Item 3. Results for the posttest suggested a sin- gle factor defined by all six items and explaining 42.8% of the variance. However, the loading for Item 3 was low. Examination of the content of Item 3 (“My overall attitude toward my job is favorably influenced by the benefits I receive”) suggests that this item may measure both bene- fit satisfaction and the amount of spillover that occurs between benefit satisfaction and overall satisfaction. Therefore, we omitted Item 3 from the benefit satisfaction scale. Factor analysis of the remaining five items yielded single factors explaining 53.5% of the variance for the pretest, and 49.3% for the posttest. Coefficient alpha for the five-item scale was .78 for the pretest and .73 for the posttest.’
Internal consistency estimates for the overall job satisfaction scale were .67 for the pretest and .72 for the posttest. Internal consistency estimates for the noncompensation satisfaction scale were .64 for the pretest and .63 for the posttest. For the understanding of benefits scale, both pretest and posttest estimates were .67.
Substantive Issues
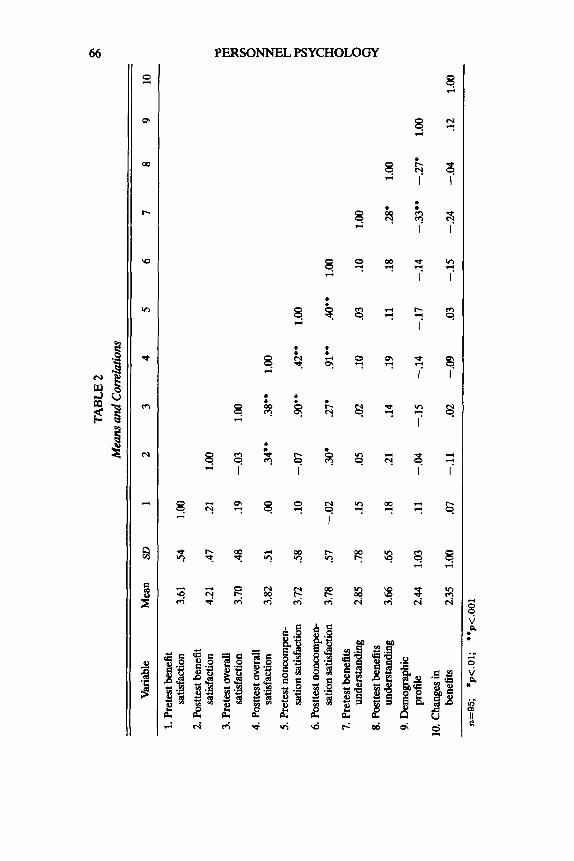
’Itible 2 provides means and correlations for scales used in the study. Satisfaction and understanding of benefits were 5-point scales. The de- mographic profile index had a potential range from 0 (perfectly fits tra- ditional profile) to 6. The changes in benefits index had a potential range from 0 (no changes made) to 6.
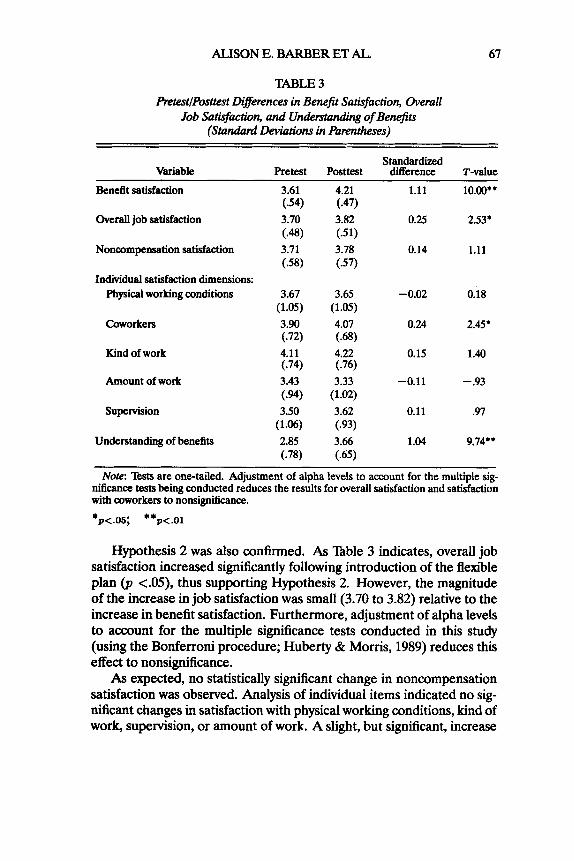
’Itible 3 presents results of paired t tests for changes in satisfaction following implementation of the new benefit plan. Hypothesis 1 of this study was confirmed by the statistically significant (p <.001) increase in benefit satisfaction following introduction of the flexible plan. The mean level of benefit satisfaction rose from 3.61 to 4.21, an increase of more than one standard deviation.
‘Factor analysis using the full posttest sample (n = 270) and the sample used to test convergence between our scale and the PSQ (n = 149; see appendix) also suggested a fwe- item scale, with Item 3 excluded. However, factor analysis using the full pretest sample (n = 314) suggested a two-factor structure, with Items 1 and 3 loaded on the second factor.
TABL
E 2
Mea
ns a
nd C
orre
latio
ns
Var
iabl
e M
ean
SD
1 2
3 4
5 6
7 8
9 10
1. Pr
etes
t ben
efit
satis
fact
ion
2. Po
sttes
t ben
efit
satis
fact
ion
3. P
rete
st ov
eral
l sa
tisfa
ctio
n 4. P
ostte
st ov
eral
l sa
tisfa
ctio
n 5. P
rete
st no
ncom
pen-
sa
tion
satis
fact
ion
6. P
ostte
st no
ncom
pen-
sa
tion
satis
fact
ion
7. Pr
etes
t ben
efits
un
ders
tand
ing
8. Po
stte
st be
nefit
s un
ders
tand
ing
9. D
emog
raph
ic
prof
ile
bene
fits
10. c
hang
es in
3.61
4.21
3.70
3.82
3.72
3.78
2.85
3.66
2.44
2.35
.54
.47
.48
.51
.58
.57
.78
.65
1.03
1.00
1.00
.21
.19
.00
.10
- .02
.15
.18
.ll
.07
1.00
-.03 .34*
*
- .07
.30*
.05
21
- .04
-.11
1.00
.38**
1.00
.go**
.42**
1.00
27.
.91**
.a** 1.00
.02
.lo
.03
.10
1.00
.14
.19
.ll
.18
.28*
1.00
-.15
-.14
-.17
-.14
-.33*
* -.27*
1.00
.02
-.09
.03
-.15
-24
-.04
.12
1.00
ALISON E. BARBER ET AL. 67
TABLE 3 &test/Posttest Difeences in Benefit Satisfaction, Overall
Job Satisfaction, and Understanding of Benefits (Standard Lkvhtions in Parentheses)
Standardized Variable Pretest Posttest difference T-value
Benefit satisfaction
Overall job satisfaction
Noncompensation satisfaction
Individual satisfaction dimensions: Physical working conditions
Coworkers
Kind of work
Amount of work
Supervision
Understanding of benefits
3.61
3.70
3.71
(54)
(.W
(58 )
3.67 (1.05) 3.90
4.11
3.43
3.50
2.85
672)
(-74)
(-94)
(1.06)
(-78)
4.21
3.82
3.78
C47)
(-51)
(-57)
3.65 (1.05) 4.07
4.22
3.33
3.62
3.66
(.68)
C76)
(1.02)
(.93)
(.65)
1.11
0.25
0.14
-0.02
0.24
0.15
-0.11
0.11
1.04
10.00**
2.53.
1.11
0 . k
2.45'
1.40
-.93
.97
9.74**
Note: Rsts are one-tailed. Adjustment of alpha levels to account for the multiple sig- nificance tests being conducted reduces the results for overall satisfaction and satisfaction with coworkers to nonsignificance.
*p<.05; **p<.Ol
Hypothesis 2 was also confirmed. As nble 3 indicates, overall job satisfaction increased significantly following introduction of the flexible plan (p <.05), thus supporting Hypothesis 2. However, the magnitude of the increase in job satisfaction was small (3.70 to 3.82) relative to the increase in benefit satisfaction. Furthermore, adjustment of alpha levels to account for the multiple significance tests conducted in this study (using the Bonferroni procedure; Huberty & Morris, 1989) reduces this effect to nonsignificance.
As expected, no statistically significant change in noncompensation satisfaction was observed. Analysis of individual items indicated no sig- nificant changes in satisfaction with physical working conditions, kind of work, supervision, or amount of work. A slight, but significant, increase
68 PERSONNEL PSYCHOLOGY
in satisfaction with coworkers was observed (from 3.90 to 4.07). How- ever, after adjustment of alpha levels, this change became nonsignifi- cant. Power to detect a moderate change in these items exceeded .95 (estimated using procedures outlined in Cohen, 1970.)
'Igble 3 also shows that there were significant increases in the degree to which employees understood their benefit plan (2.85 to 3.66). While it was anticipated that pretest benefit satisfaction would be negatively related to nontraditional profiles (i.e., high profile scores) and to changes in benefits, neither of these correlations were statistically significant (see Bble 2)?
Discussion
The results of this study support the hypothesis that the implemen- tation of a flexible benefit plan would be followed by increases in em- ployee satisfaction with benefits. The increase observed in this sample was both statistically significant and of considerable magnitude. In ad- dition, overall job satisfaction increased somewhat. Thus, the present research provides much needed empirical confirmation of anecdotal re- ports of increased satisfaction following the implementation of a flexible
This study also provides evidence on the role of needs discrepancies and communication in increasing benefit satisfaction. Although it has often been argued that changes in workplace demographics lead to a mismatch between benefits desired and benefits received, the nonsignif- icant correlations between nontraditional demographic profiles and sat- isfaction with the original (pretest) benefit plan fail to support this point of view. Other studies attempting to use demographics as predictors of benefit preferences have also failed to provide convincing support for the demographics argument (Milkovich & Newman, 1990).
of course, the determination of benefit preferences may not be a simple function of demographics. For example, preferences may be determined by other individual difference factors such as risk aversion or demand for leisure (Miceli & Lane, in press). However, the lack of a significant relationship between the extent to which our subjects changed their benefits and their benefit satisfaction at either the pretest or the posttest level makes any discrepancy argument hard to support.
plan.
2Furthermore, no significant correlations were observed between pretest or posttest benefit satisfaction and individual demographic variables or changes in individual benefit items.
ALISON E. BARBER ET AL. 69
On the other hand, our results are consistent with the argument that increased understanding of benefits following implementation of a flex- ible benefit plan generates increased satisfaction. Self-assessed under- standing of the benefit plan increased considerably after implementa- tion of the new plan. This should not be surprising, given the extensive communication and training that was part of that implementation. This communication could have led employees to a more favorable view of their benefits package. However, communication is a vital and integral part of the implementation of flexible benefit plans, as employers wish to avoid misinformed choices on the part of employees. Furthermore, the fact that employees must make decisions based on this information may make them more likely to attend to it than if it were presented with no action required. Therefore, we believe communication and training should be viewed as an inherent (and, as this study suggests, important) part of the process by which flexible benefits increase satisfaction.
The results of this study should be interpreted with caution for at least four reasons: the lack of a control group, the high initial benefit satisfaction level, the single posttest assessment, and the response rate.
As often happens in field research, we were unable to obtain a control group for this study. Control groups are extremely valuable as means of assessing whether observed effects are due to the treatment of interest or to other events (history factors) that might have occurred between the pretest and the posttest (Cook & Campbell, 1979). Presumably, if his- tory factors other than the benefit plan caused the observed increase in benefit satisfaction, dimensions of satisfaction unrelated to compensa- tion would have been affected as well. Thus, it is important to note that no changes were observed in the noncompensation satisfaction scale or in satisfaction with working conditions, kind or amount of work, or su- pervision. There was a small but significant increase in satisfaction with coworkers. Reasons for this increase are unknown.
Extensive interviews conducted with members of the organization’s management failed to identify factors other than the implementation of flexible benefits (e.g., union contract negotiations, changes in wage or salary levels, st& reorganizations) that might have affected benefit satisfaction. lbmover during this period was neither particularly high nor low, and overall employment levels were constant. Nonetheless, a study incorporating a control group would represent an improvement over the design used for this study.
A second reason to exercise caution in interpreting the results of this study concerns the issue of generalizability. The original benefit plan of the organization studied was generous compared to plans found else- where in the community, and initial satisfaction levels were fairly high (3.6 on a 5-point scale). Furthermore, the generosity of the plan was
70 PERSONNEL PSYCHOLOGY
maintained when the flexible plan was implemented (i.e., the employer did not reduce its benefits expenditures). Generalization to organiza- tions with less generous plans may be risky. Organizations offering infe- rior plans may have room for greater increases in satisfaction than were possible here. On the other hand, if an employer has not traditionally been generous with benefits, the introduction of a flexible plan might be viewed with suspicion by employees (e.g., as an attempt to disguise re- ductions in benefits). This could result in decreased benefit satisfaction. Thus, to explore the boundary conditions of our findings, there is a need to investigate the impact of flexible benefits in a variety of organizational contexts.
Third, this study included only a single assessment of postimplemen- tation satisfaction. This measure was taken only a few months after the plan was implemented. Thus, we do not know whether the observed in- crease in satisfaction persisted over time. Assessment of the long-term effects a flexible plan might have on benefit satisfaction is warranted.
Finally, it should be noted that a substantial number of employees chose not to self-identify on both pretest and posttest measures, and therefore were not part of the final sample used in this study. While our analyses failed to uncover systematic differences between those who were and those who were not included in the final sample, it would nonetheless have been desirable to have had less shrinkage in the sample.
Caveats notwithstanding, the present study suggests that substantial increases in benefit satisfaction may be observed following implemen- tation of a flexible benefits plan, particularly where communication is high. This lends some credence to the host of anecdotal reports on flex- ible benefits, and suggests that further research on the consequences of flexible benefits is merited.
However, in attempting to generalize from these results, it is impor- tant to note that the organizational intervention evaluated in this re- search was complex in nature, consisting of a package of related inter- ventions. The first component consisted of discussions with 11 employ- ees during which the nature of employee benefit plans was discussed, the concept of flexible plans was explored, and potential survey items were considered. The second component consisted of the pretest, at which time the nature of both fixed and flexible benefit plans were dis- cussed and the first survey was administered. The third aspect of the intervention included the distribution of materials about the new plan and training sessions during which the nature and administration of the upcoming flexible benefit plan were explored. The introduction and use of the flexible plan completed the intervention package. Although the complexity of this change is not unusual for organizational interventions, the design of the present study is not capable of separating the impact
ALISON E. BARBER ET AL. 71
of the intervention’s various components. Separation of some of these factors might best be accomplished in a simulation setting as opposed to the field setting where our research was conducted. It would be difficult in the field, for example, to introduce a flexible plan without providing information describing the plan and training in its use.
Suggestions for Future Reseatch
At least two additional lines of research would complement the re- search reported in this paper. First, further research on the processes by which flexible benefits influence benefit satisfaction is in order. llvo possible processes were described earlier: reduction in discrepancies be- tween benefits desired and benefits received, and increased (favorable) information about benefits. This study suggests that increased under- standing of benefits was a key factor in enhancing benefit satisfaction, and that discrepancies between benefits received and benefits desired were relatively unimportant. Further research on both of these issues is in order. First, regarding understanding of benefits, this study used a self-report measure of perceived understanding, rather than an objective test aimed at measuring actual knowledge of the plan. Further studies might attempt to differentiate between feelings of understanding versus a c m f understanding as contributors to benefits satisfaction, perhaps by including both measures in a single design. In addition, it would be de- sirable to control for the quantity and content of information received about the benefit plan. As noted earlier, it is assumed that the additional information received under flexible plans increases the employees’ eval- uation of the plan. If the information received is not positive (e.g., if the plan does not provide coverage the employees assumed they had), satisfaction would be expected to decrease, not increase.
While we found no evidence to support the argument that flexible benefits enhance benefit satisfaction by reducing discrepancies between benefits desired and benefits received, this issue must be tested in other organizational contexts. The original benefit plan provided by this orga- nization was generous. Therefore, it may be that few employees experi- enced any sizable discrepancies, and that changes to benefit plans rep- resented little more than “fine tuning” of an already satisfactory plan. Discrepancies may well play a role in organizations with less generous plans.
While we have focused on two of the most commonly discussed mechanisms by which flexible benefits may influence satisfaction, other mechanisms should also be explored. In particular, it has been argued that employees may react positively to the increased involvement that flexible benefit plans allow. The degree of involvement permitted by
72 PERSONNEL PSYCHOLOGY
flexible plans can vary, from merely choosing one’s own benefits (a form of delegation) to actual participation in plan design. Miceli and Lane (in press) argue that involvement in flexible benefit plans may enhance benefit satisfaction in two ways. First, self-efficacy may be enhanced; employees who feel they have more control over their work environ- ment tend to be more satisfied. Second, employees who participate in the structuring of a benefit plan may have greater commitment to its fi- nal design. It is important to note that the implementation reported in this paper involved both choice of benefits and extensive participation in plan design, and that plans providing for less involvement may yield smaller increases in satisfaction.
Comparison of benefit satisfaction across firms whose flexible ben- efit plans permit different amounts or different forms of employee in- volvement would add to our understanding of the role of participation and/or delegation. Alternatively, within-firm comparisons may be possi- ble where the extent of involvement varies across employees (for exam- ple, where some subset of organization members are selected to repre- sent all employees in plan design.)
It is particularly likely that the involvement provided by flexible plans will affect satisfaction with benefit plan administration. The measure of benefit satisfaction used in this paper focuses primarily on the content of the benefit package, rather than on the way benefits are administered. It has been argued, however, that benefit satisfaction is itself multidimen- sional (Miceli & Lane, in press). Future research on flexible benefits should attempt to assess both dimensions of benefit satisfaction, and to identify processes affecting each.
A second line of research encouraged by the findings of this study in- volves the behavioral consequences of flexible benefit plans. Anecdotal evidence suggests that flexible plans lead to improvements in attraction and retention, but this has yet to be empirically investigated. It may be that benefits (and employee reactions to benefits) are such a small part of the total work experience that they lack the power to influence em- ployee behaviors. On the other hand, they may have considerable influ- ence at the margin. For example, if employees are choosing among jobs that differ on a number of characteristics, benefits may play a small role in attraction and retention. However, if the labor market for applicants and employees consists of a number of apparently similar jobs, offering a flexible benefit plan may significantly improve an organization’s ability to attract and retain. The importance of job attribute variability has been documented (e.g., Rynes, Schwab, & Heneman, 1983) and represents an important boundary condition for studies of the impact of flexible ben- efits on employee behaviors.
ALISON E. BARBER ET AL. 73
Surprisingly little empirical research has been conducted on flexible benefit programs, or, for that matter, on the topic of employee benefits in general. This is unfortunate in that benefits constitute a large (and increasing) portion of the total compensation package, particularly for firms operating in the United States. Although much remains to be learned, the present study provides a first step in demonstrating that benefit innovations can influence employee reactions.
REFERENCES
Alpert RN. (1989). Mandating health care benefits in an environment of escalating costs. h e e d @ of the 4Ist Annual Meeting of the I&triul Relations Research Associo- tion, 102-109. Madison, WI: Industrial Relations Research Association.
Ash RA, Dreher GE (1990, August). Revision of the Henemen and Schwab Pay Satisfac- tion Questionnaire. Presented at 1990 annual meeting of the Academy of Manage- ment, San Francisco.
Beam B, McFadden J. (1988). Employee benefits (2nd ed.). Homewood, I L Richard D. Irwin.
Berger CI. (1984). llre Meets of pay level, pay values and employee benefits on pay satisfac- tion. Unpublished manuscript, Krannert School, h d u e University.
Bloom DE, W a n JT (1986). F W k benejits and employee choice. New York Pergamon Press.
Bureau of National Affairs. (1988). BNA policy andpmciice series: Compensation. Wash- ington, D C Author.
Changing work force, acquisitions, mergers fuel growth of Sec. 125 cafeteria plans. (1988, April). Employee Benefit Plan Review, 10,1617.
&hen J. (1970). Approximate power and sample sue determinations for common one- sample and two-sample hypothesis tests. Educational and PsyhorOgical Measwe- ment, 30,811431.
Cook T, Campbell DT (1979). Quasi-ephentation: Desip and anabsis issues forfiehf settings. Boston: Houghton M a i n .
Demographics: Driving force behind flexible plans. (1989, April). Employee Benefit Plan Review, 10,14-16.
Dreher GE (1981). Predicting the salary satisfaction of exempt employees. PERSONNEL PSYCHOLOGY, 34,579-589.
Dreher GF, Ash RA, Bretz RD. (1988). Benefit coverage and employee cost: Critical factors in explaining compensation satisfaction. PERSONNEL PSYCHOLOGY, 41,237- 254.
Dunham RB, Pierce JL. (1986). Attitudes toward work schedules: Construct definition, instrument development, and validation. Academy of Management Journal, 29,170- 182.
Dunham RB, Smith FJ, Blackburn RS. (1977). Validation of the index of organizational reactions with the JDI, the MSQ, and the faces scales. Academy of Management Journal, 20,42&432.
Employee Benefits Research Institute. (1982). America in transition: Implications for employee benefits. Washington, DC Author.
Haugen SE. (1989, August). Employment gains slow in the first half of 1989. MontMy Labor Review, 112,3-9.
74 PERSONNEL PSYCHOLOGY
Heneman HG 111. (1985). Pay satisfaction. In Rowland K, Ferris G (Eds.), Research in personnel and human resource management: VoL 3 (pp. 115-139). Greenwich, CT: JAI Press.
Heneman HG 111, Schwab DP. (1985). Pay satisfaction: Its multidimensional nature and measurement. I n t e ~ t i o ~ l J~umal of Psychology, 20,129-141.
Huberty CJ, Moms JD. (1989). Multivariate analysis versus multiple univariate analyses. PsVchological Bulktin, 105,302-308.
Locke EA. (1%9). What is job satisfaction? Organizational Behavior and Human Ptvjbr- mance, 4,309-336.
Locke FA. (1976). The nature and causes of job satisfaction. In Dunnette MD (Ed.), Handbook of indusmial and organizational psychology (pp. 1297-1349). Chicago: Rand McNally.
Miceli MP, Lane MC. (in press). Antecedents of pay satisfaction: A review and extension. In Rowland K, Ferris G (Eds.), Research in personnel and human resource manage- ment (Vol. 9). Greenwich, CT: JAI Press.
Milkovich G, Newman J. (1990). Compensation (3rd ed.). Homewood, I L Richard D. Irwin.
Motowidlow SJ. (1983). Predicting sales turnover from pay satisfaction and expectation. Joumal of Applied Psychology, 68,484-489.
Rosenbloom JS, Hallman GV (1986). Employee benefitplanning (2nd 4.). Englewood Cliffs, NJ: Prentice-Hall.
Ryes SL, Schwab DP, Heneman HG 111. (1983). The role of pay and market pay variability in job application decisions. Organiurtionol Behuvwrand Human perfwnance, 31, 353-364.
Scarpello V, Huber V, Vandenberg RJ. (1988). Compensation satisfaction: its measure- ment and dimensionality. Joumal ofApplied Psychology, 73,163-171.
Section 125 flexible benefit programs gain both employers’ and employees’ support. (1988, April). Empbyee Benefit Plan Review, 10,24-28,120.
Smith FJ. (1976). The index of organization reactions (IOR). JSAS Catalog of Selected Documents in Psychology, 6, Ms. no. 1265.
Smith PC, Kendall LM, H u h CL. (1969). The Measurement of sarirfaction in work and retirement. Chicago: Rand McNally.
Weiner N. (1980). Determinants and behavioral consequences of pay satisfaction: A comparison of two models. PERSONNEL PSYCHOLQGY, 33,741-757.
Weiss DJ, Dawis RV, England W, Lofquist LH. (1967). Manual for the Minnesota Satis- faction Questionnaire. Minnesota Studies in Vocational Rehabilitation: XXII, Min- neapolis, University of Minnesota Industrial Relations Center Work Adjustment Project.
Wilson M, Northcraft GB, Neale MA. (1985). The perceived value of fringe benefits. PERSONNEL PSYCHOLOGY, 38,309-320.
ALISON E. BARBER ET AL. 75
Appendix
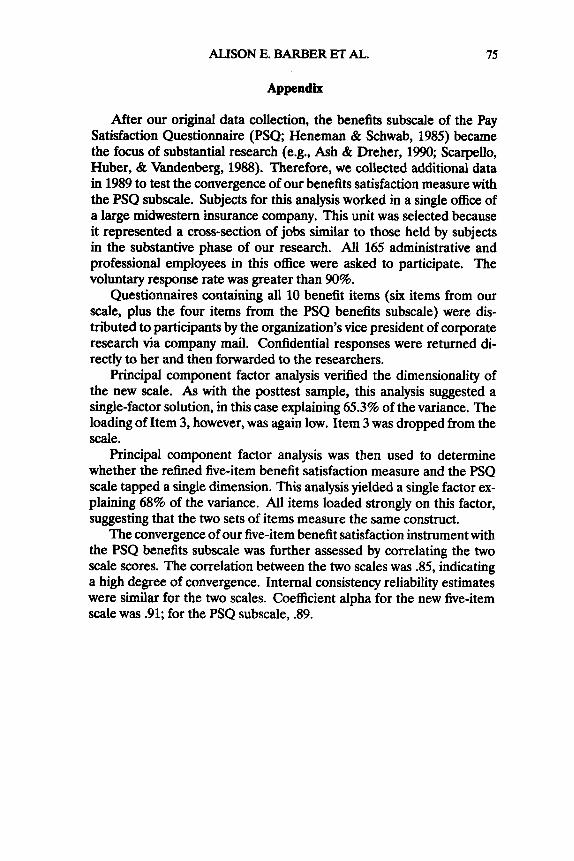
After our original data collection, the benefits subscale of the Pay Satisfaction Questionnaire (PSQ; Heneman & Schwab, 1985) became the focus of substantial research (e.g., Ash & Dreher, 1990; Scarpello, Huber, & Vandenberg, 1988). Therefore, we collected additional data in 1989 to test the convergence of our benefits satisfaction measure with the PSQ subscale. Subjects for this analysis worked in a single office of a large midwestern insurance company. This unit was selected because it represented a cross-section of jobs similar to those held by subjects in the substantive phase of our research. All 165 administrative and professional employees in this office were asked to participate. The voluntary response rate was greater than 90%.
Questionnaires containing all 10 benefit items (six items from our scale, plus the four items from the PSQ benefits subscale) were dis- tributed to participants by the organization’s vice president of corporate research via company mail. Confidential responses were returned di- rectly to her and then forwarded to the researchers.
Principal component factor analysis verified the dimensionality of the new scale. As with the posttest sample, this analysis suggested a single-factor solution, in this case explaining 65.3% of the variance. The loading of Item 3, however, was again low. Item 3 was dropped from the scale.
Principal component factor analysis was then used to determine whether the refined five-item benefit satisfaction measure and the PSQ scale tapped a single dimension. This analysis yielded a single factor ex- plaining 68% of the variance. AU items loaded strongly on this factor, suggesting that the two sets of items measure the same construct.
The convergence of our five-item benefit satisfaction instrument with the PSQ benefits subscale was further assessed by correlating the two scale scores. The correlation between the two scales was .85, indicating a high degree of convergence. Internal consistency reliability estimates were similar for the two scales. Coefficient alpha for the new five-item scale was .91; for the PSQ subscale, .89.
Recommended