
Because I have a lot to cover there won’t be time for questions at the end. And I’m guessing some of the question won’t have simple answers. So you can go to my blog jamesdixon.wordpress.com where each of the sections is a separate post that you can comment on or ask questions about.
First let’s look at the data explosion that everyone is talking about at the moment.
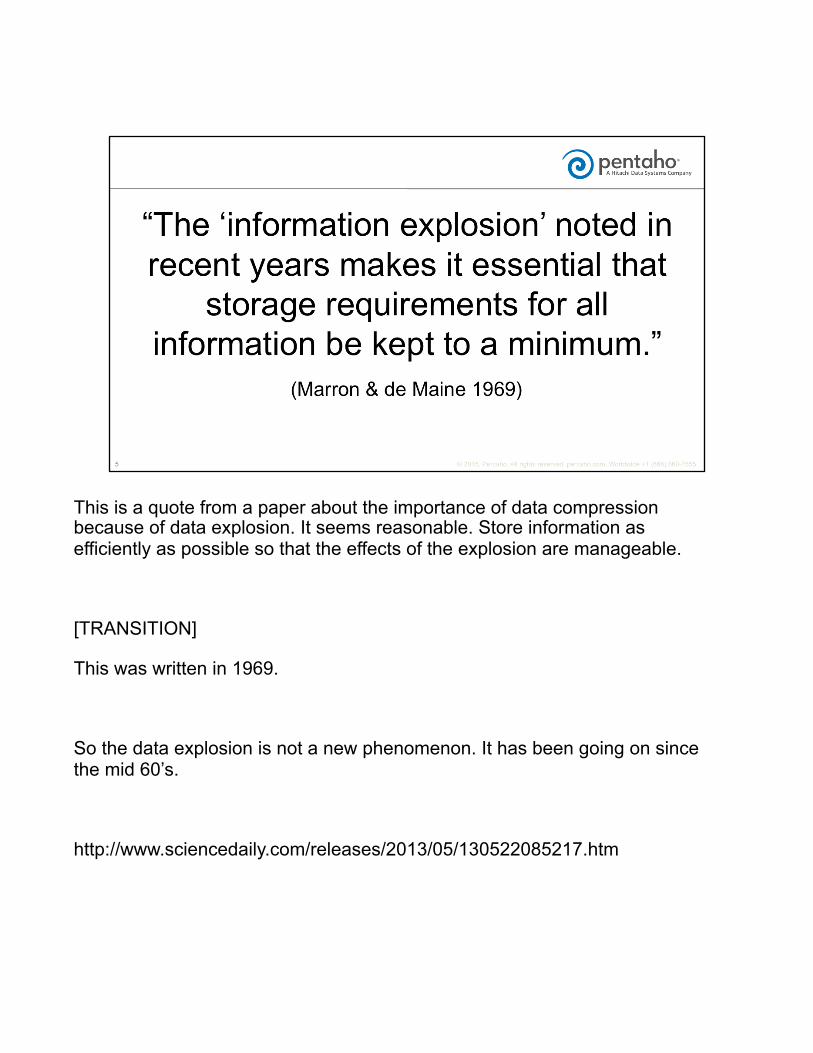
This is a quote from a paper about the importance of data compression because of data explosion. It seems reasonable. Store information as efficiently as possible so that the effects of the explosion are manageable.
[TRANSITION]
This was written in 1969.
So the data explosion is not a new phenomenon. It has been going on since the mid 60’s.
http://www.sciencedaily.com/releases/2013/05/130522085217.htm
This is another quote, much more recent, that you might see online. This says that the amount of data being created and stored is multiplying by a factor of 10 every two years. I have not found any numerical data to back this up so I will drill into this in a few minutes.
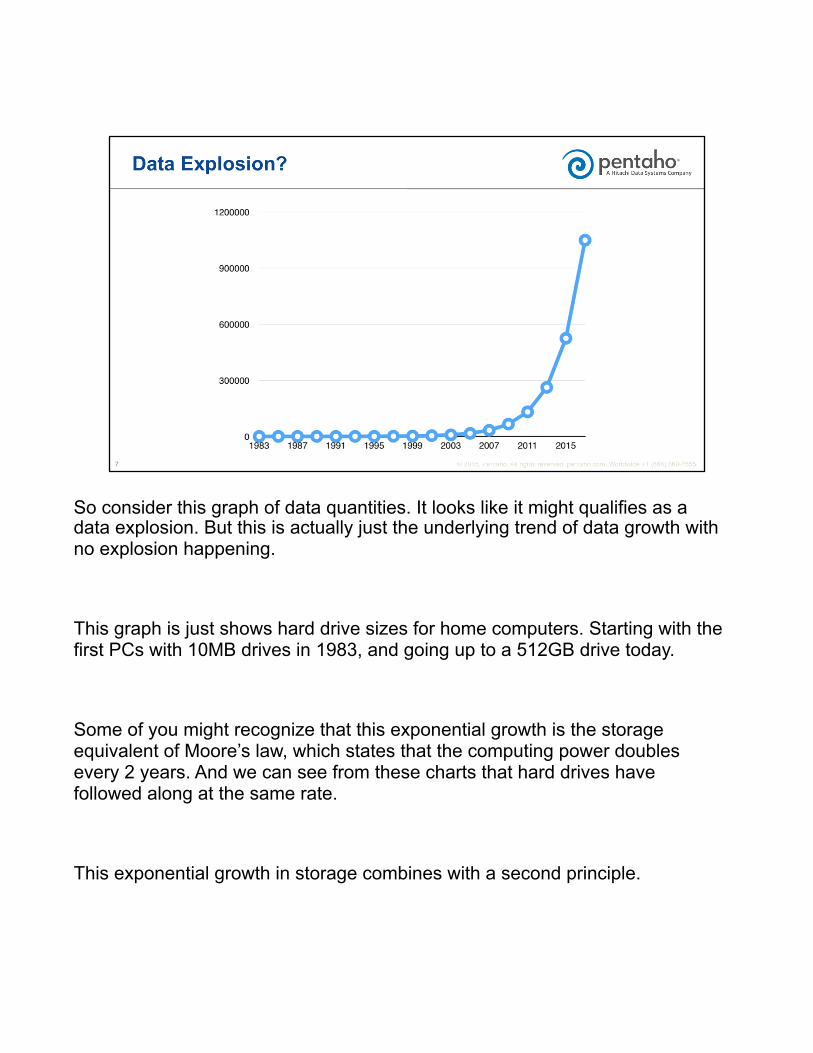
So consider this graph of data quantities. It looks like it might qualifies as a data explosion. But this is actually just the underlying trend of data growth with no explosion happening.
This graph is just shows hard drive sizes for home computers. Starting with the first PCs with 10MB drives in 1983, and going up to a 512GB drive today.
Some of you might recognize that this exponential growth is the storage equivalent of Moore’s law, which states that the computing power doubles every 2 years. And we can see from these charts that hard drives have followed along at the same rate.
This exponential growth in storage combines with a second principle.
http://www.sciencedaily.com/releases/2013/05/130522085217.htm
This statement is not just an ironic observation.
This effect is due to the fact that the amount of data stored is also affected by Moore’s law. With twice the computing power, you can process images that are twice as big. You can run applications with twice the logic. You can watch movies with twice the resolution. You can play games that are twice as detailed. All of these things require twice the space to store them.
Today an HD movie can be 3 or 4 gigabytes. In 2001 that was your entire hard drive.
With processing power doubling at the same rate that storage is increasing what does this say about any gap between the data explosion and the CPU power required to process it?
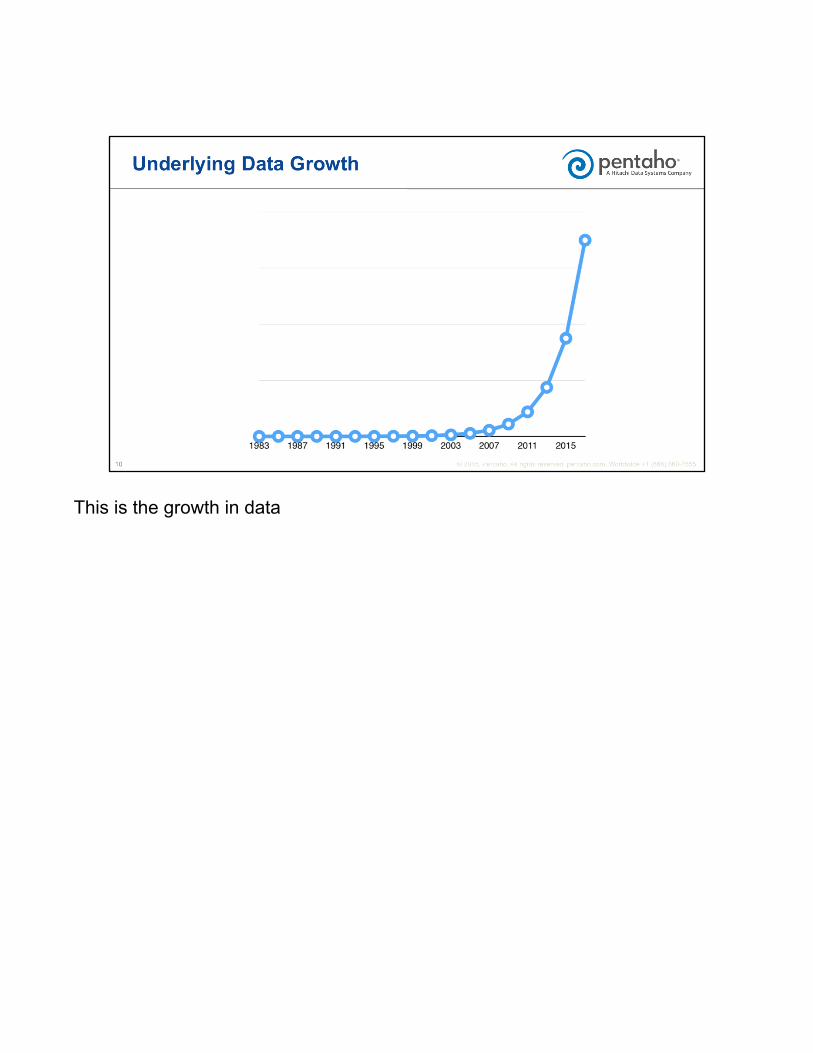
This is the growth in data
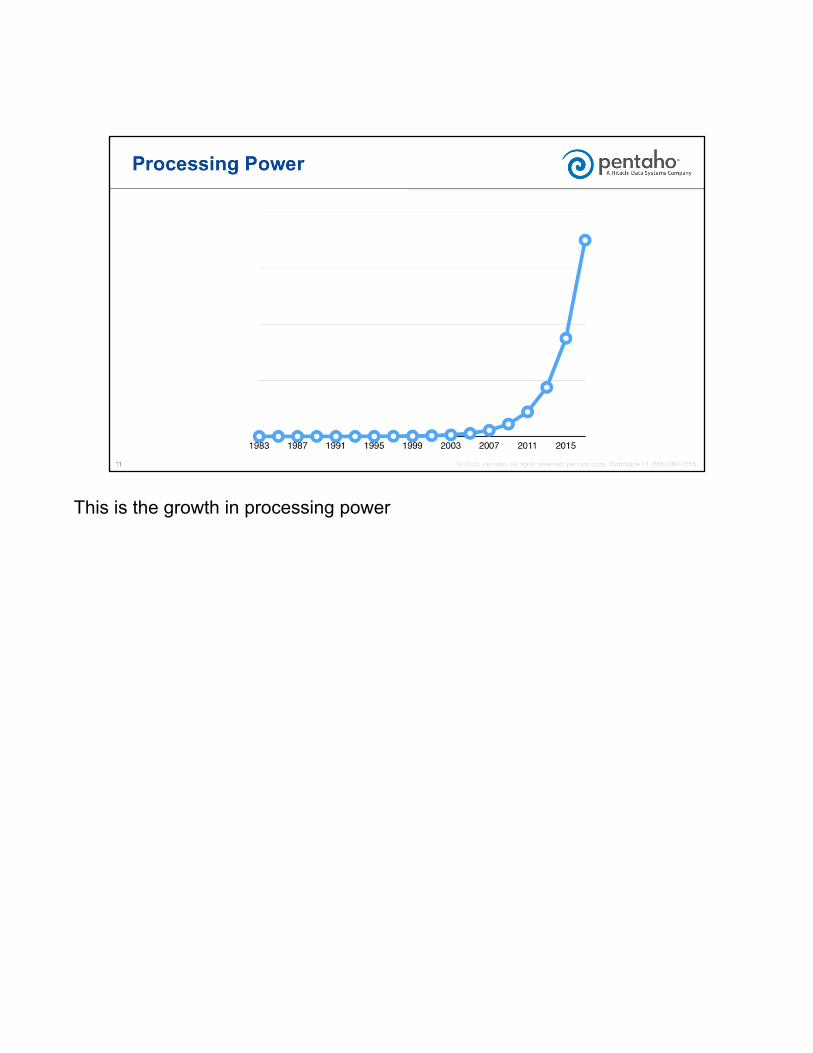
This is the growth in processing power
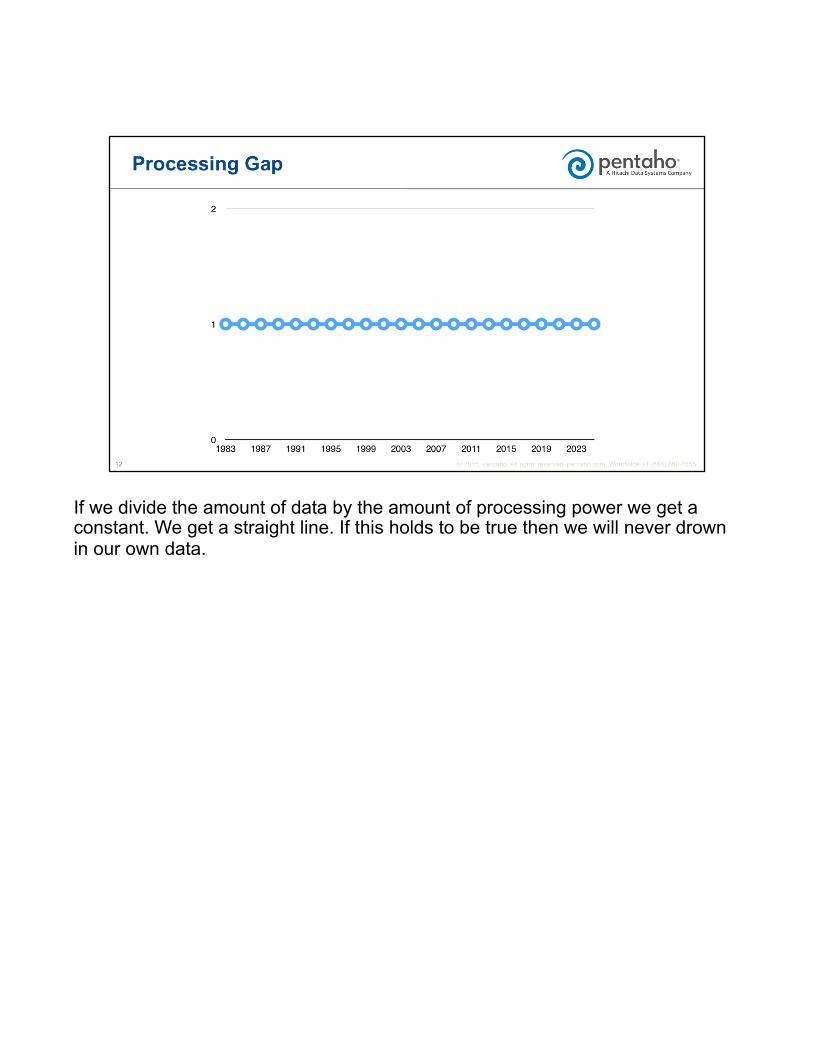
If we divide the amount of data by the amount of processing power we get a constant. We get a straight line. If this holds to be true then we will never drown in our own data.
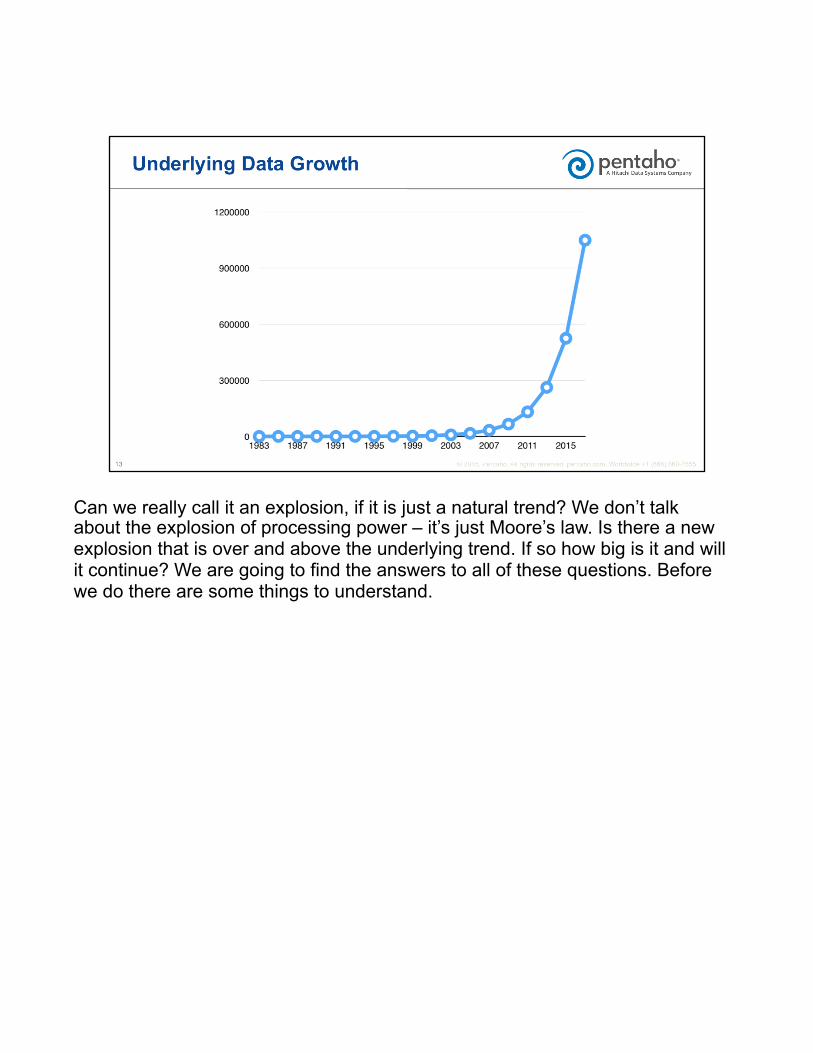
Can we really call it an explosion, if it is just a natural trend? We don’t talk about the explosion of processing power – it’s just Moore’s law. Is there a new explosion that is over and above the underlying trend. If so how big is it and will it continue? We are going to find the answers to all of these questions. Before we do there are some things to understand.
Firstly there is a point, for any one kind of data, where the explosion stops or slows down. It is the point at which the data reaches its natural maximum granularity, and beyond which there is little practical value to increasing the granularity. I’m going to demonstrate this natural maximum using some well known data types.
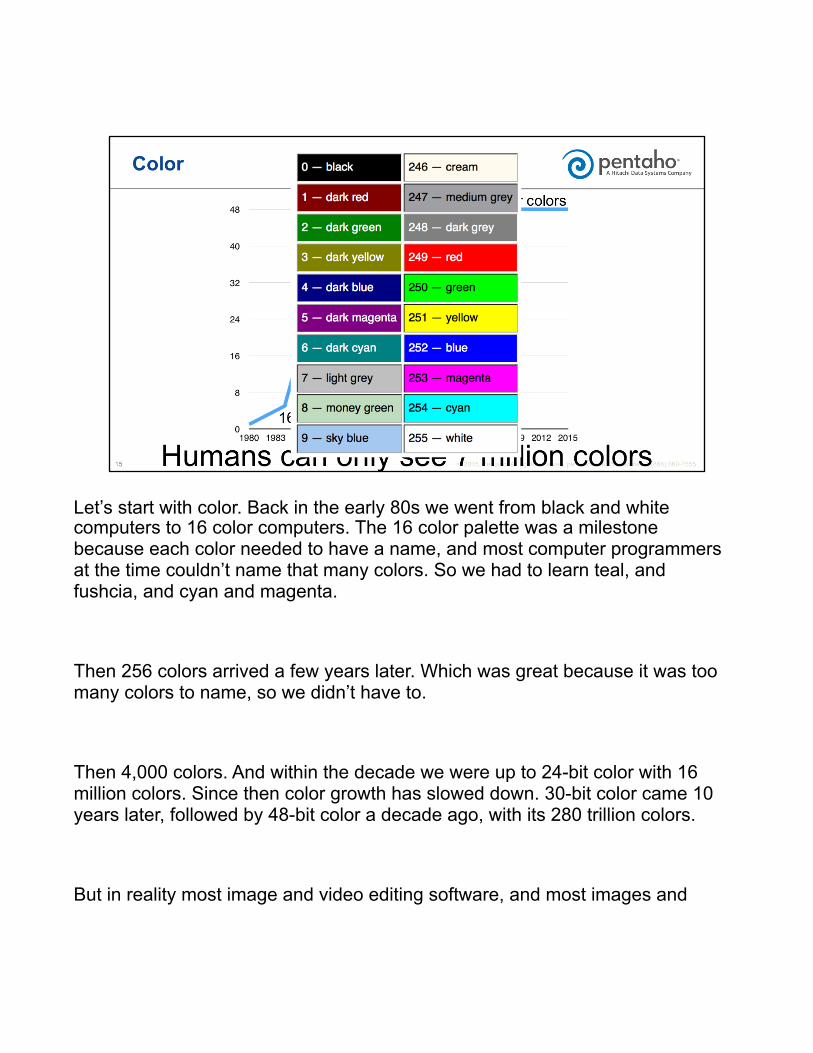
Let’s start with color. Back in the early 80s we went from black and white computers to 16 color computers. The 16 color palette was a milestone because each color needed to have a name, and most computer programmers at the time couldn’t name that many colors. So we had to learn teal, and fushcia, and cyan and magenta.
Then 256 colors arrived a few years later. Which was great because it was too many colors to name, so we didn’t have to.
Then 4,000 colors. And within the decade we were up to 24-bit color with 16 million colors. Since then color growth has slowed down. 30-bit color came 10 years later, followed by 48-bit color a decade ago, with its 280 trillion colors.
But in reality most image and video editing software, and most images and
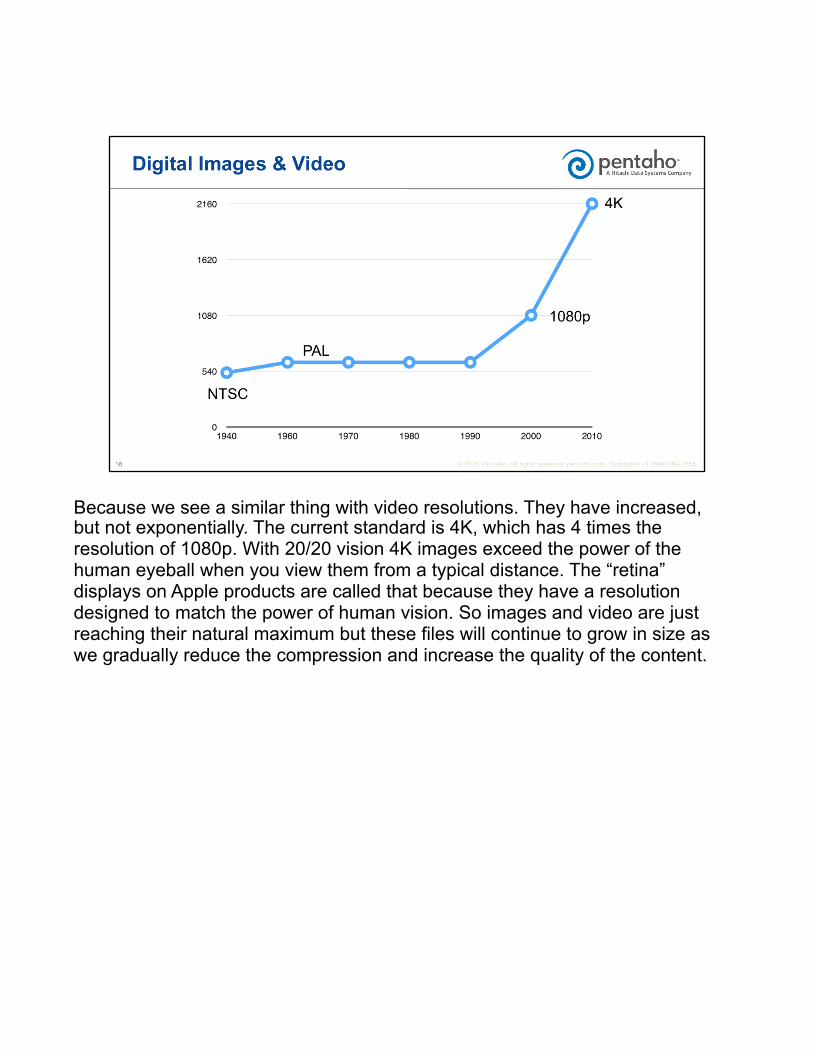
Because we see a similar thing with video resolutions. They have increased, but not exponentially. The current standard is 4K, which has 4 times the resolution of 1080p. With 20/20 vision 4K images exceed the power of the human eyeball when you view them from a typical distance. The “retina” displays on Apple products are called that because they have a resolution designed to match the power of human vision. So images and video are just reaching their natural maximum but these files will continue to grow in size as we gradually reduce the compression and increase the quality of the content.

In terms of ability, the human hearing system lies in between 16-bit sound and 24-bit sound. So again we have hit the natural limit of this data type.
If you still don’t believe in the natural granularity have I one further example.
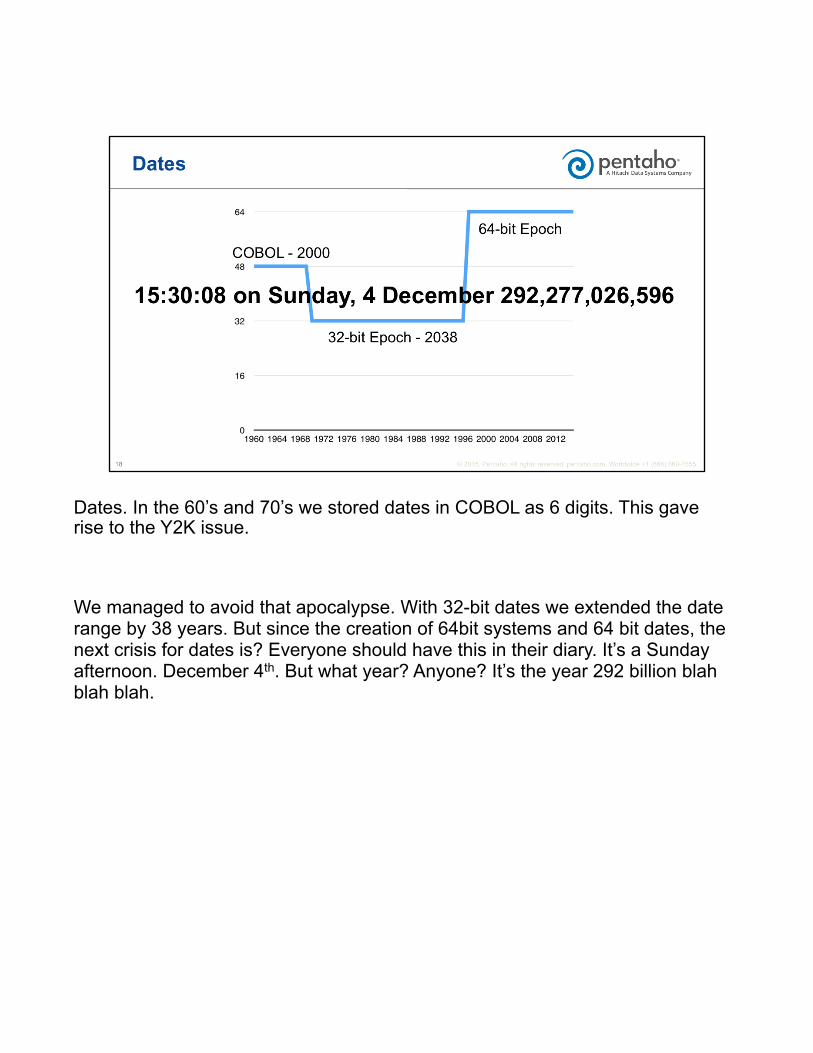
Dates. In the 60’s and 70’s we stored dates in COBOL as 6 digits. This gave rise to the Y2K issue.
We managed to avoid that apocalypse. With 32-bit dates we extended the date range by 38 years. But since the creation of 64bit systems and 64 bit dates, the next crisis for dates is? Everyone should have this in their diary. It’s a Sunday afternoon. December 4th. But what year? Anyone? It’s the year 292 billion blah blah blah.
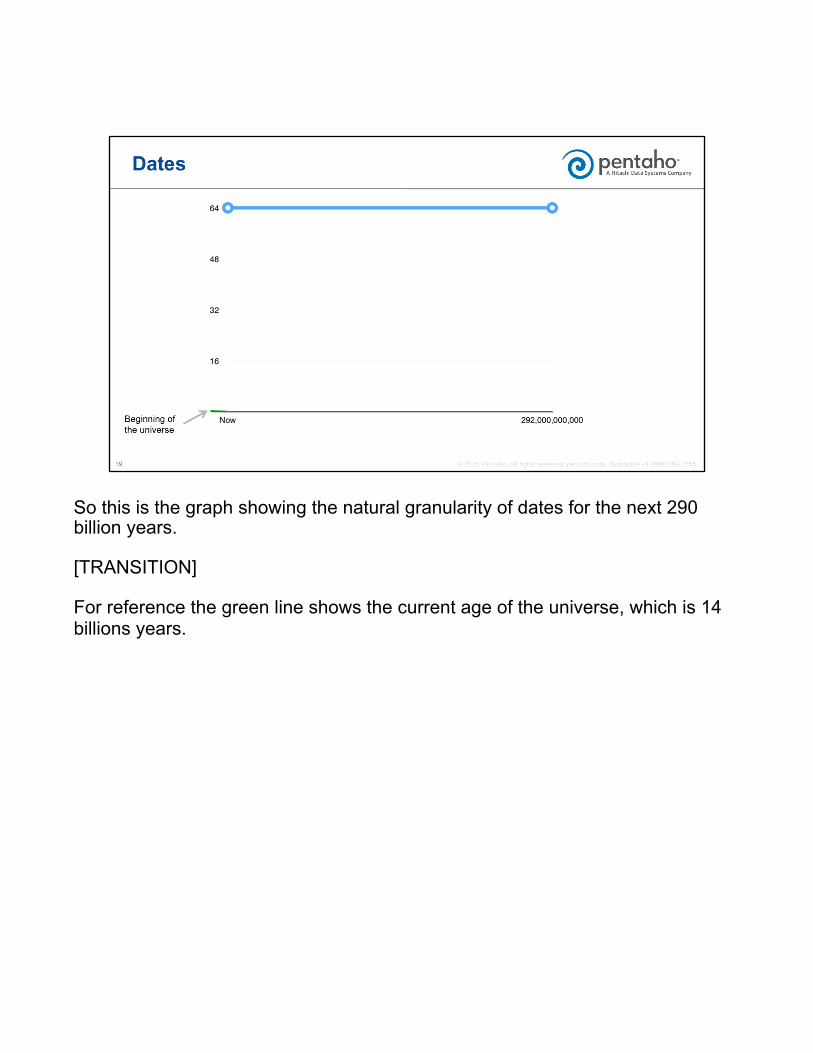
So this is the graph showing the natural granularity of dates for the next 290 billion years.
[TRANSITION]
For reference the green line shows the current age of the universe, which is 14 billions years.
So now that we understand that different data types have a natural maximum granularity, how does it relate to big data and the data explosion?
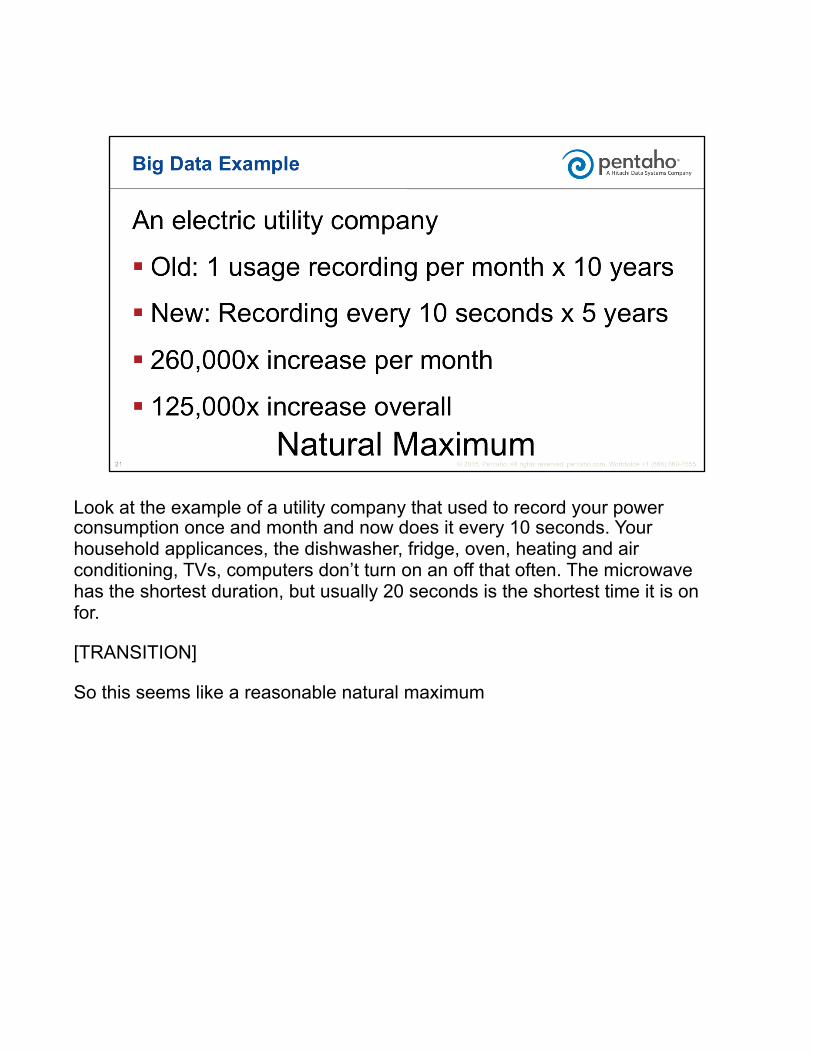
Look at the example of a utility company that used to record your power consumption once and month and now does it every 10 seconds. Your household applicances, the dishwasher, fridge, oven, heating and air conditioning, TVs, computers don’t turn on an off that often. The microwave has the shortest duration, but usually 20 seconds is the shortest time it is on for.
[TRANSITION]
So this seems like a reasonable natural maximum
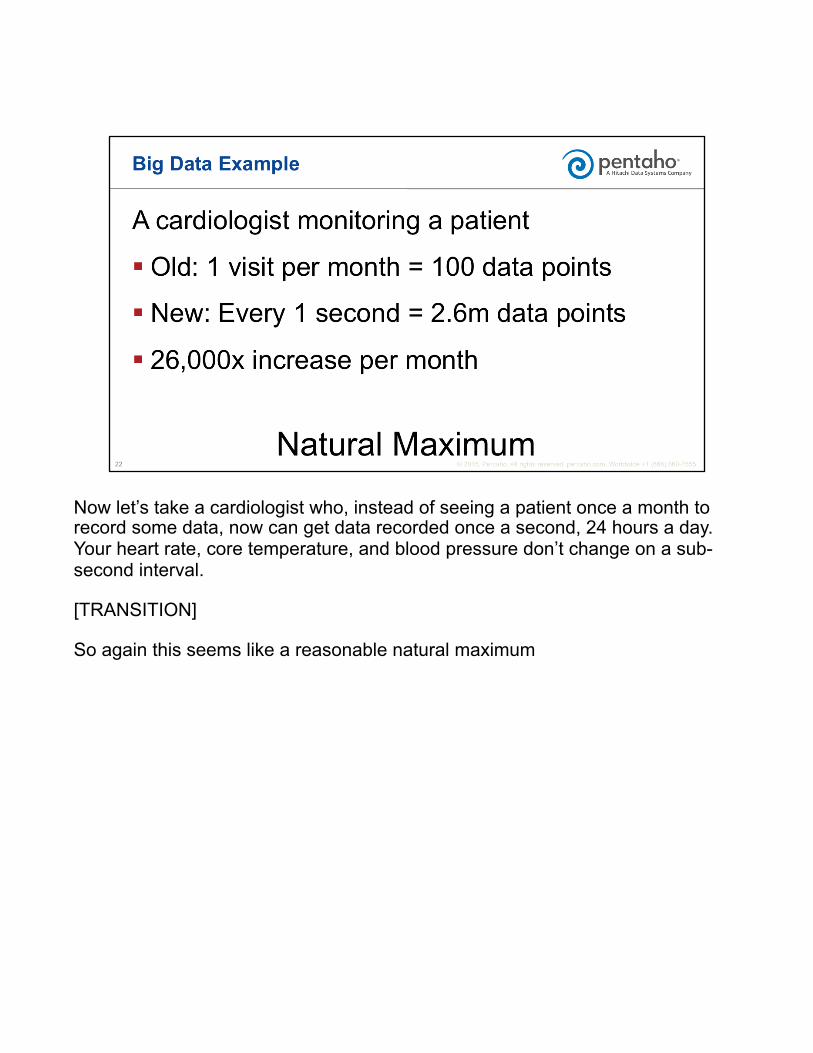
Now let’s take a cardiologist who, instead of seeing a patient once a month to record some data, now can get data recorded once a second, 24 hours a day. Your heart rate, core temperature, and blood pressure don’t change on a sub-second interval.
[TRANSITION]
So again this seems like a reasonable natural maximum
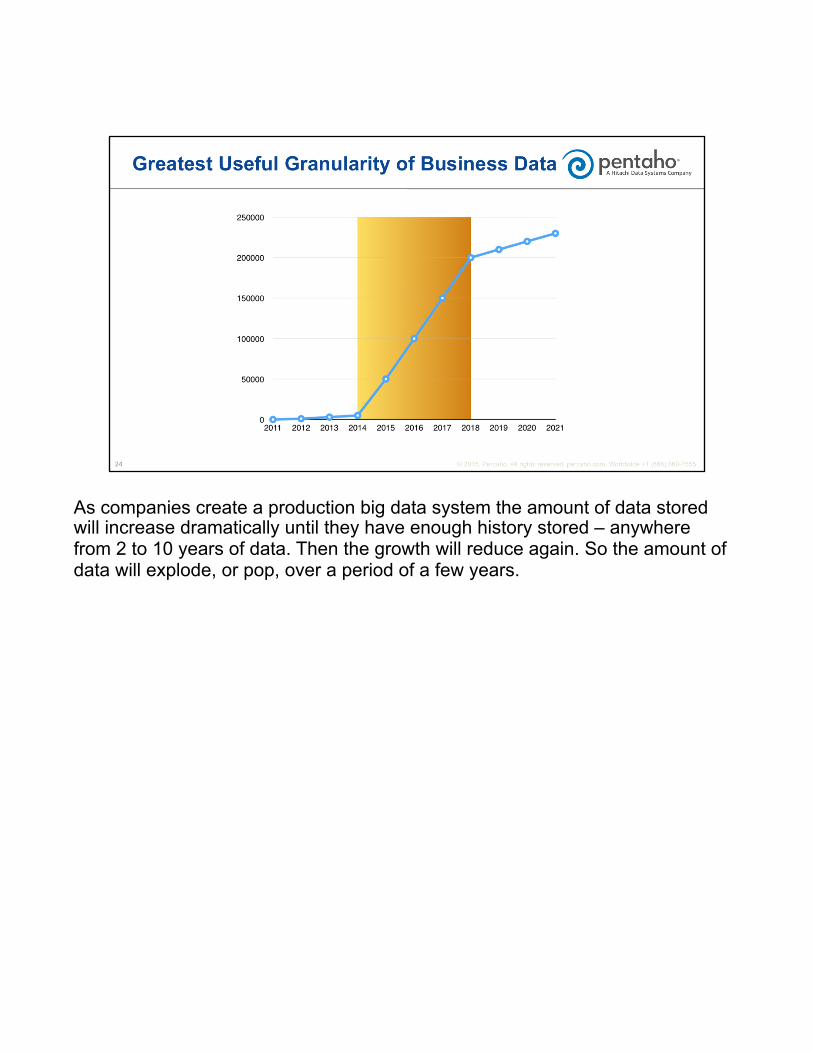
As companies create a production big data system the amount of data stored will increase dramatically until they have enough history stored – anywhere from 2 to 10 years of data. Then the growth will reduce again. So the amount of data will explode, or pop, over a period of a few years.
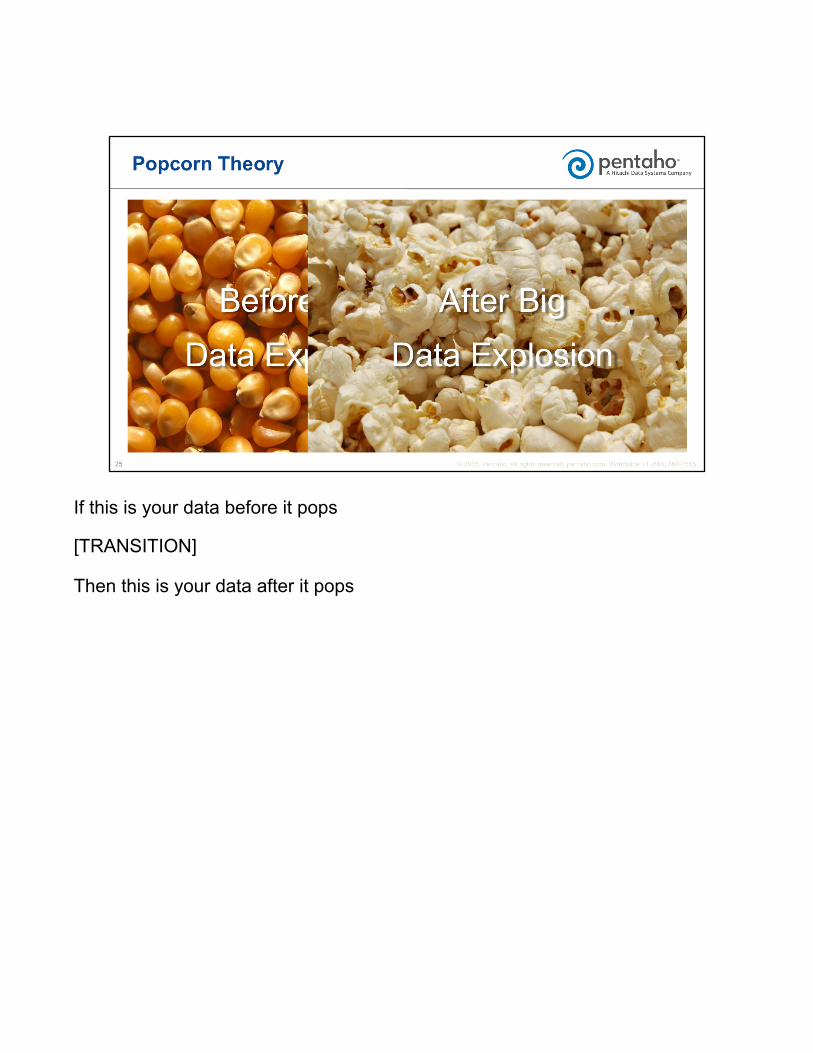
If this is your data before it pops
[TRANSITION]
Then this is your data after it pops


There are millions of companies in the world. If you only talk to the top 1000 companies in the USA you only get a very small view of the whole picture.
This brings us back to this claim, which aligns with the hype. How can we really asses the growth in data?

My thought is that if the data explosion is really going at a rate of 10x every two years, then HP, Dell, Cisco, and IBM must be doing really well, as these manufacturers account for 97% of the blade server market in North America. And Seagate, and Sandisk, and Fujitsu, and Hitachi must be doing well really well too, as they make the storage. And Intel and AMD must be doing really well because they make the processors.
Let’s look at HP who has 43% of worldwide market in blade servers.
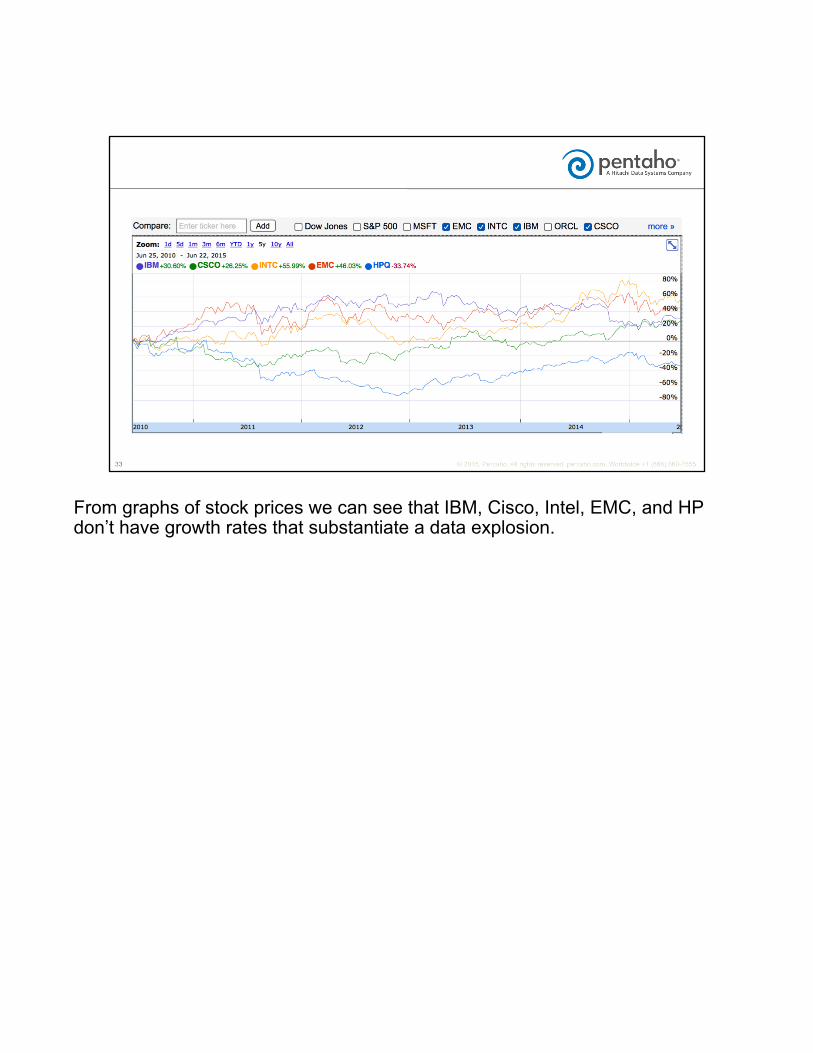
From graphs of stock prices we can see that IBM, Cisco, Intel, EMC, and HP don’t have growth rates that substantiate a data explosion.
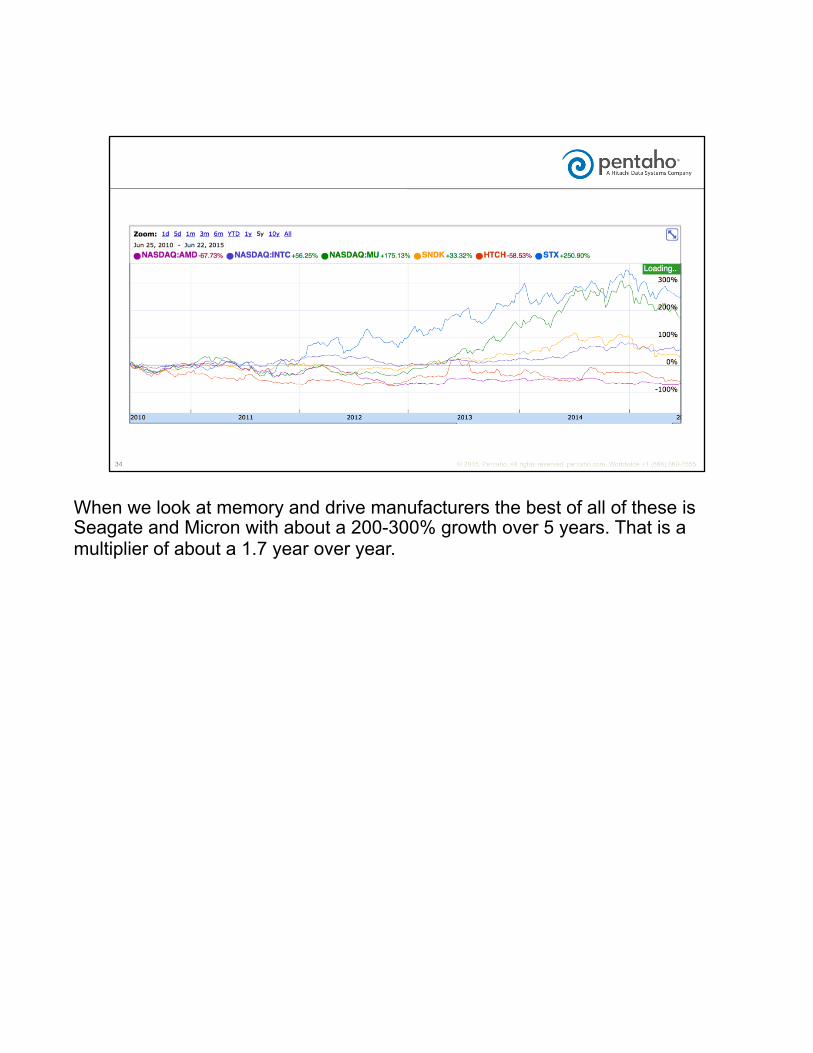
When we look at memory and drive manufacturers the best of all of these is Seagate and Micron with about a 200-300% growth over 5 years. That is a multiplier of about a 1.7 year over year.
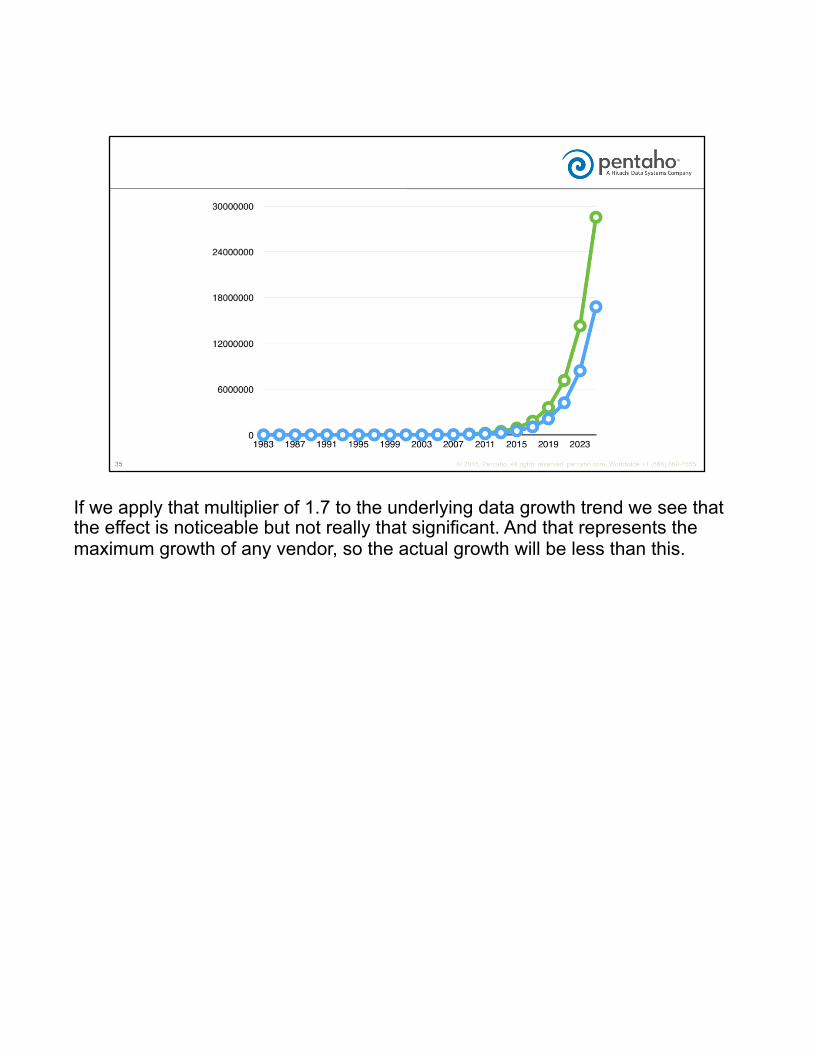
If we apply that multiplier of 1.7 to the underlying data growth trend we see that the effect is noticeable but not really that significant. And that represents the maximum growth of any vendor, so the actual growth will be less than this.

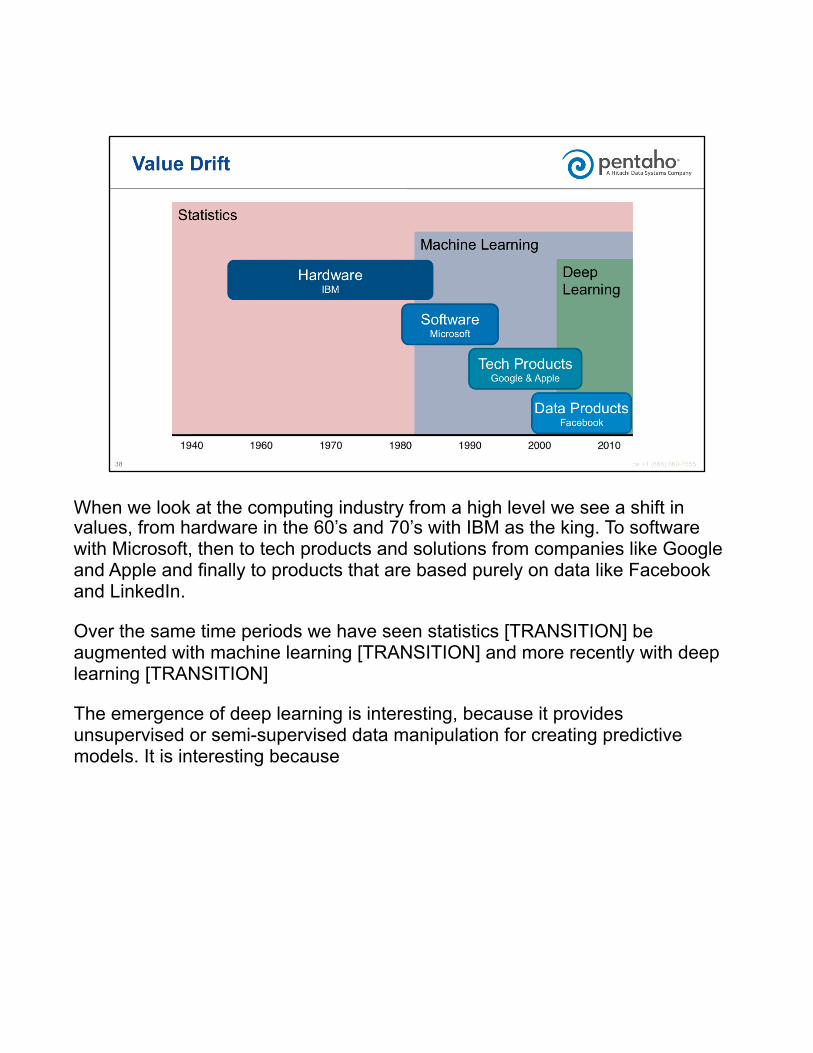
When we look at the computing industry from a high level we see a shift in values, from hardware in the 60’s and 70’s with IBM as the king. To software with Microsoft, then to tech products and solutions from companies like Google and Apple and finally to products that are based purely on data like Facebook and LinkedIn.
Over the same time periods we have seen statistics [TRANSITION] be augmented with machine learning [TRANSITION] and more recently with deep learning [TRANSITION]
The emergence of deep learning is interesting, because it provides unsupervised or semi-supervised data manipulation for creating predictive models. It is interesting because

It’s like the difference between mining for gold when you can just hammer lumps of it out of the ground, and panning for tiny gold flakes in a huge pile of sand and stones
The number of data scientists is not increasing at the same rate as the amount of data and the number of data analysis projects is. We are not doubling the number of data scientists every two years. This is why Deep Learning is a big topic at the moment because it automates part of the data science process. The problem is that the tools and techniques are very complicated.

For an example of complexity here is a classical problem know as the German Tank Problem
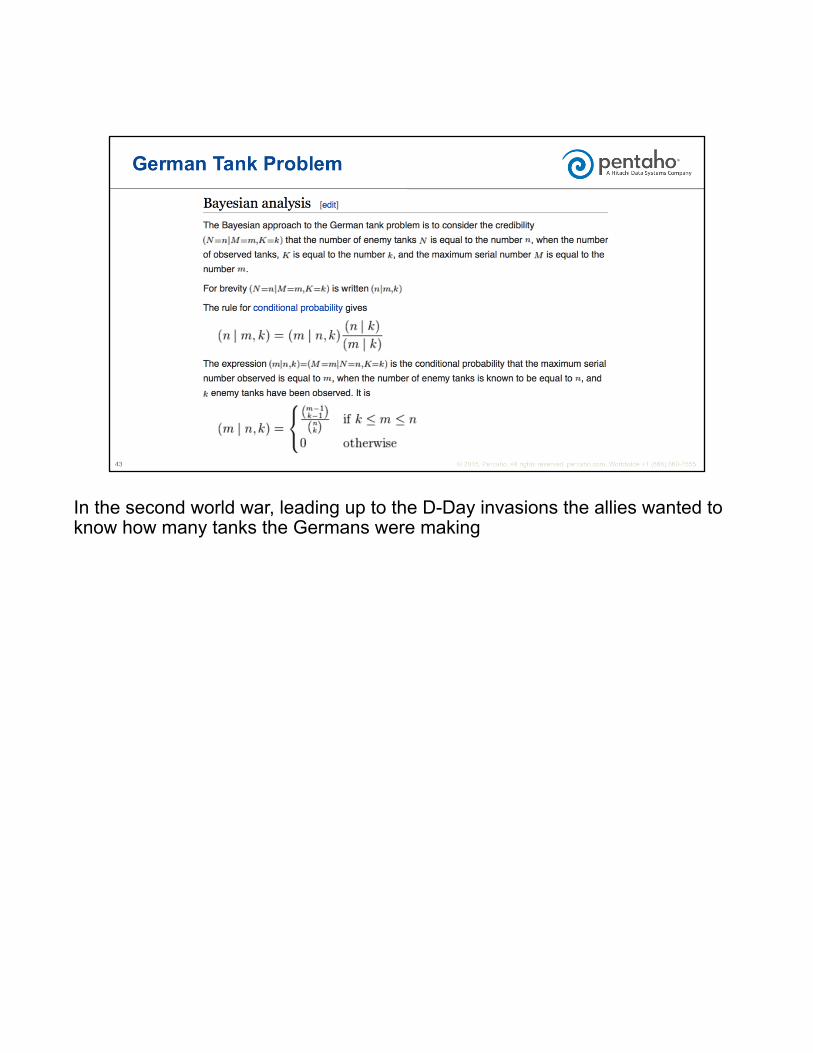
In the second world war, leading up to the D-Day invasions the allies wanted to know how many tanks the Germans were making
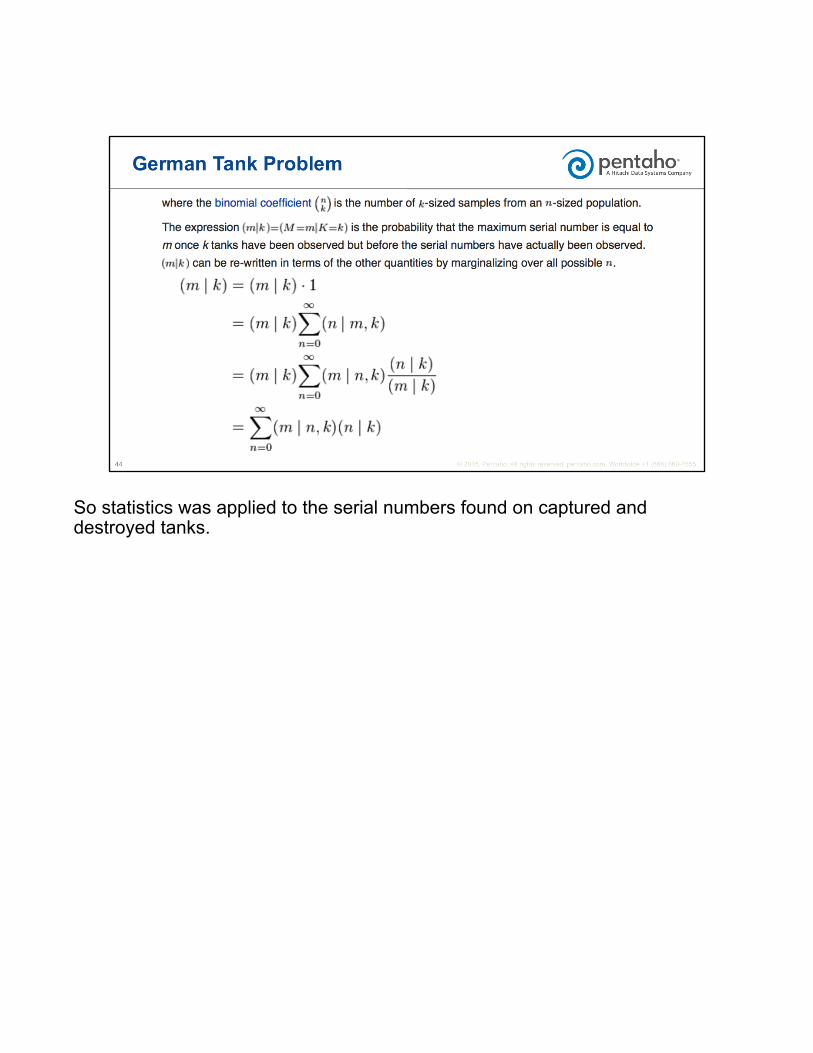
So statistics was applied to the serial numbers found on captured and destroyed tanks.

As you can see the formulas are not simple.
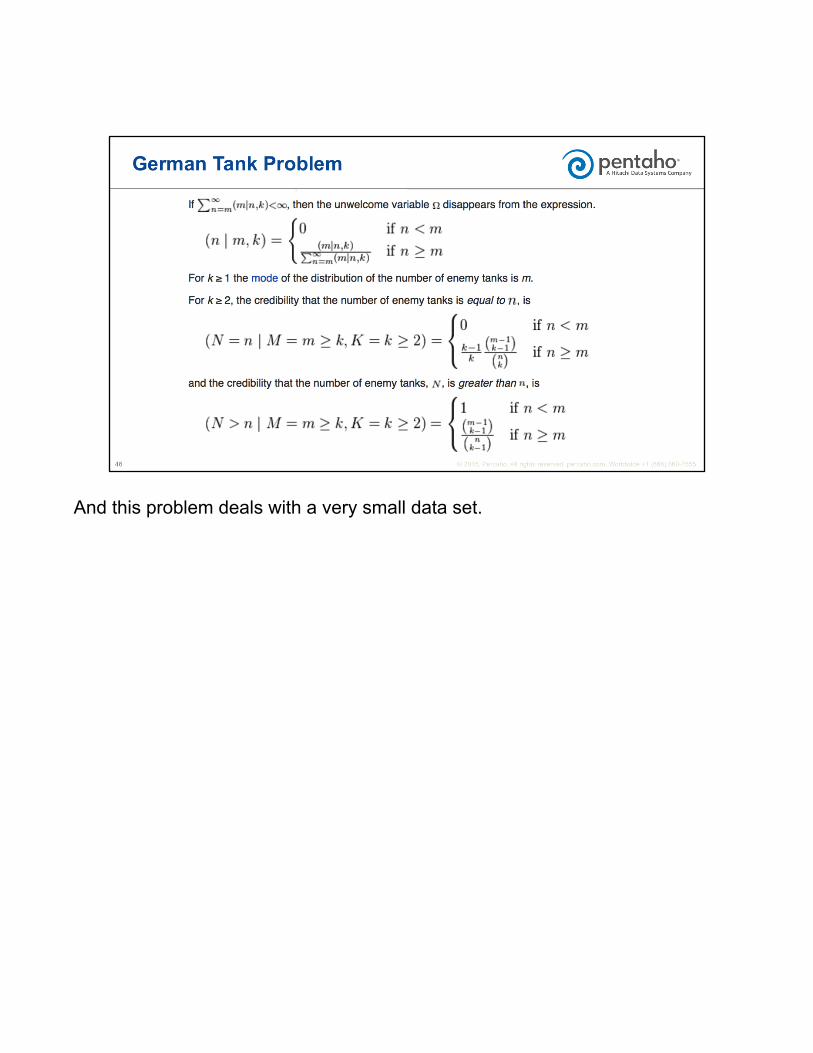
And this problem deals with a very small data set.
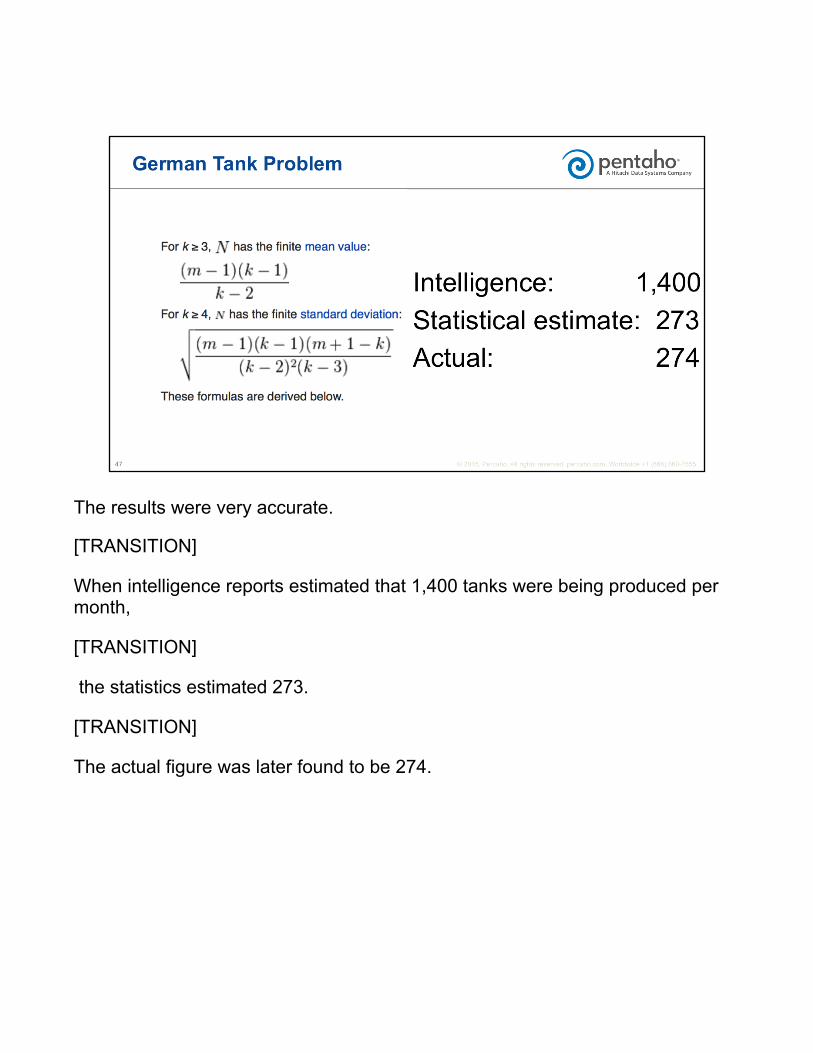
The results were very accurate.
[TRANSITION]
When intelligence reports estimated that 1,400 tanks were being produced per month,
[TRANSITION]
the statistics estimated 273.
[TRANSITION]
The actual figure was later found to be 274.

This next example is one of the greatest early works in the field of operation research. This is interesting for several reasons. Firstly because, with the creation of Storm and Spark Streaming and other real-time technologies we are seeing a dramatic increase in the number of real-time systems that include advanced analytics, machine learning, and model scoring. But this field is not new. The other reason this is interesting is that it shows that correctly interpreting the analysis is not always obvious and is more important than crunching the data.

In an effort to make bombers more effective each plane returning from a mission was examined for bullet holes and a map showing the density of bullet holes over the planes was generated.
Tally ho chaps, said the bomber command commanders, slap some lovely armor on these beauties where-ever you see the bullet holes
[TRANSITION]
Hold on a minute, said one bloke. I do not believe you want to do that.
Well, who are you said the bomber command commanders?
My name is Abram Wald. I am hungarian statistician who sounds a lot like Michael Caine for some reason.
Wald’s reasoning was that they should put the armor where there are no bullet holes, because that’s where the planes that don’t make it back must be getting hit. Which happened to be places like the cockpit and the engines.
I deliberately chose two examples from 70 years ago to show that the problems of analysis and interpretation are not new, and they are not easy. In 70 years we have managed to make tools more capable but not much easier. But this has to change.
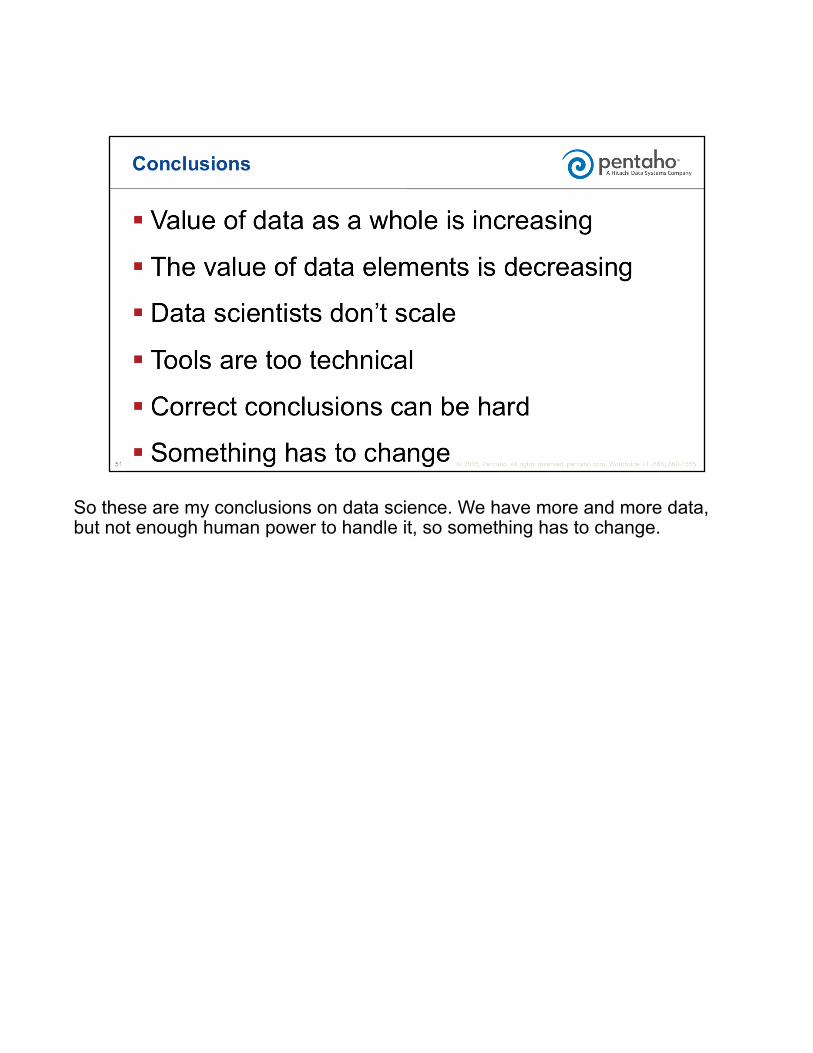
So these are my conclusions on data science. We have more and more data, but not enough human power to handle it, so something has to change.

Let’s move onto technology
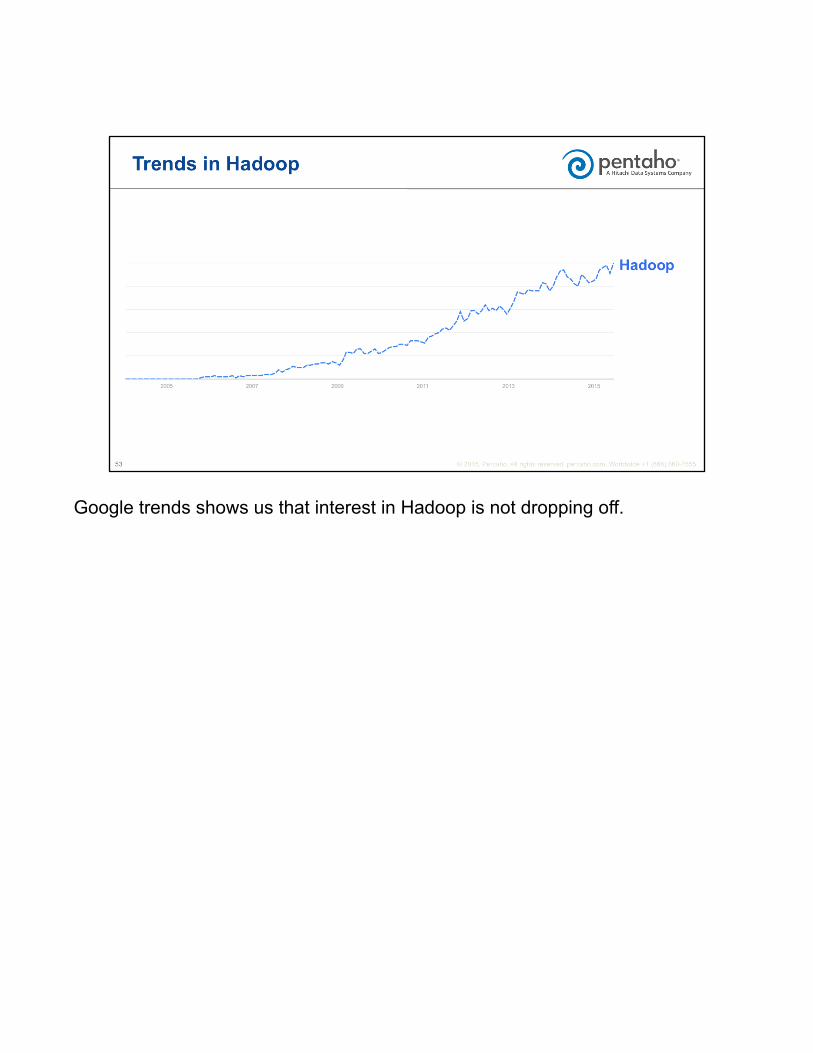
Google trends shows us that interest in Hadoop is not dropping off.
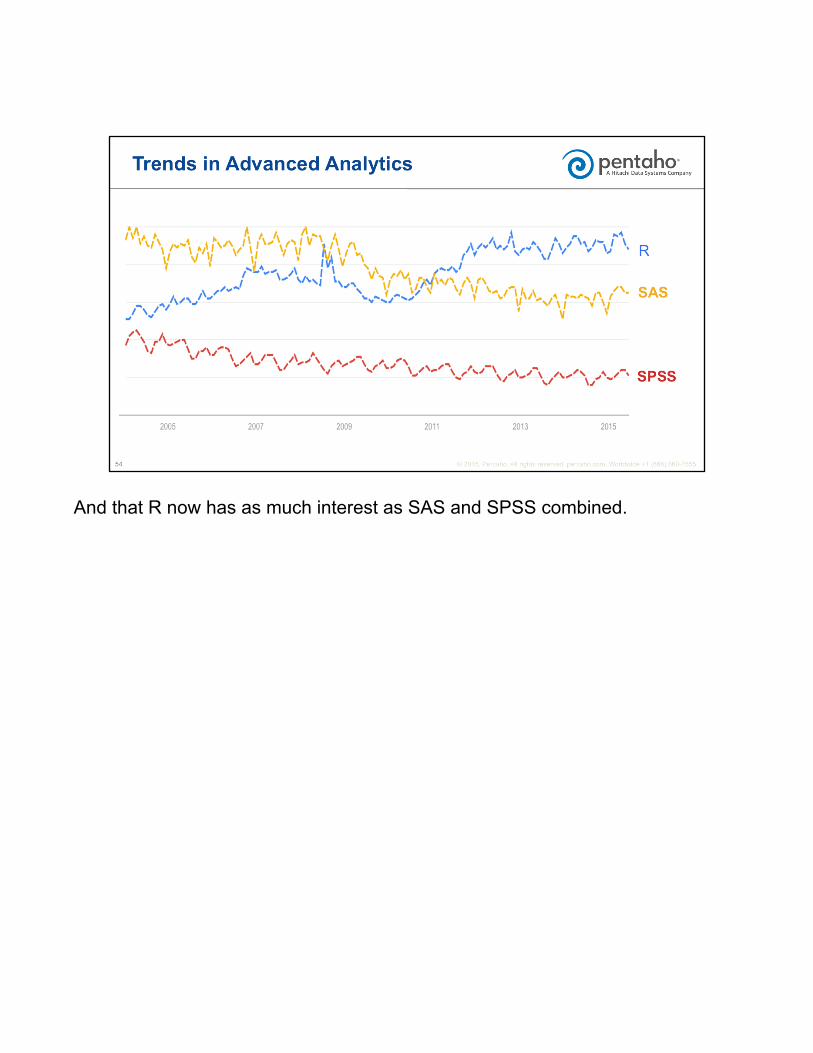
And that R now has as much interest as SAS and SPSS combined.
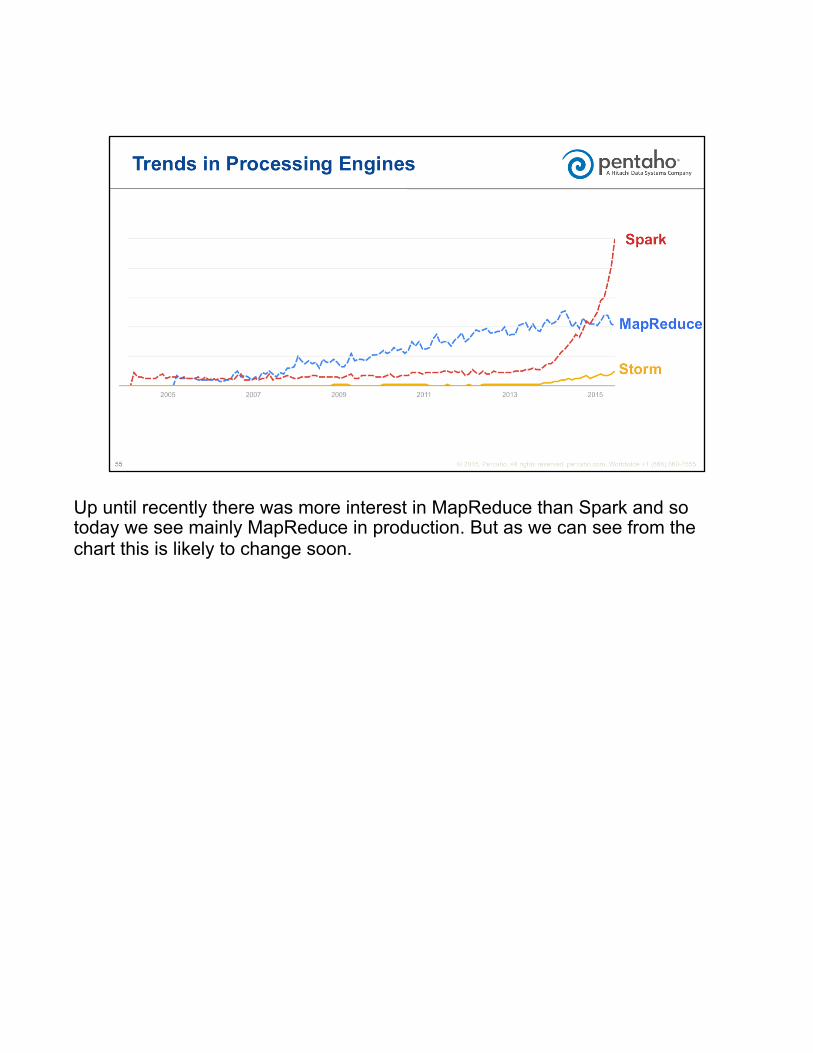
Up until recently there was more interest in MapReduce than Spark and so today we see mainly MapReduce in production. But as we can see from the chart this is likely to change soon.
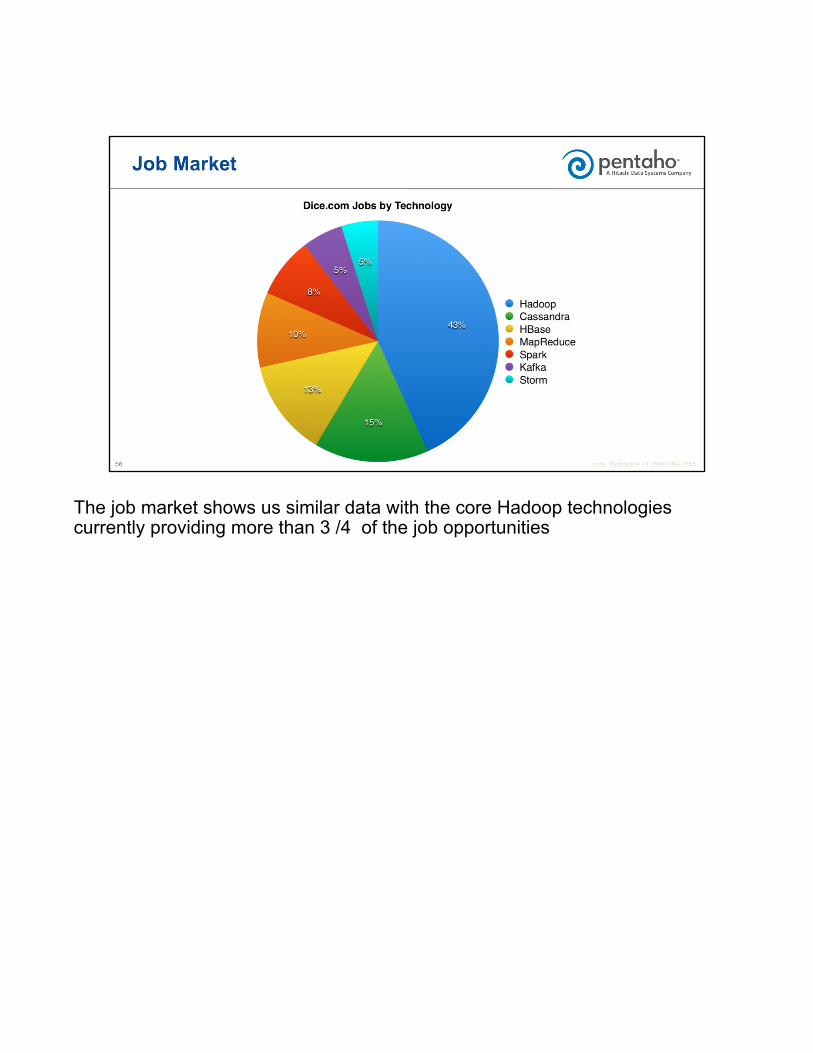
The job market shows us similar data with the core Hadoop technologies currently providing more than 3 /4 of the job opportunities
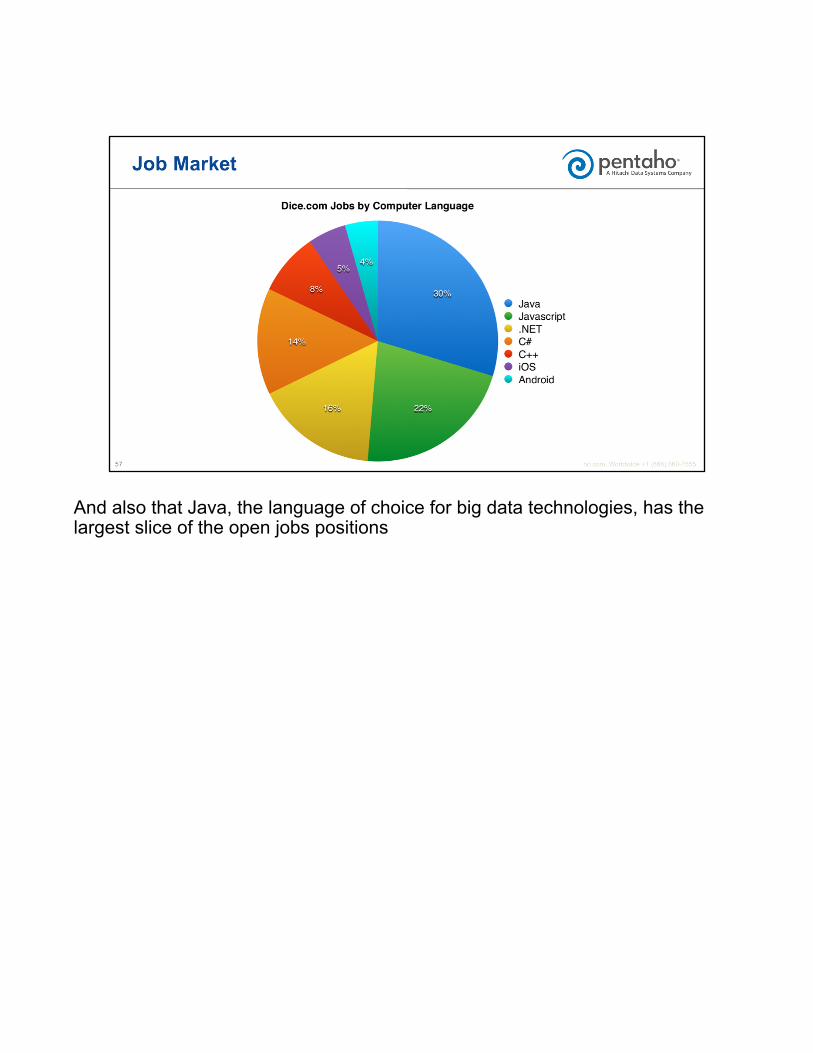
And also that Java, the language of choice for big data technologies, has the largest slice of the open jobs positions
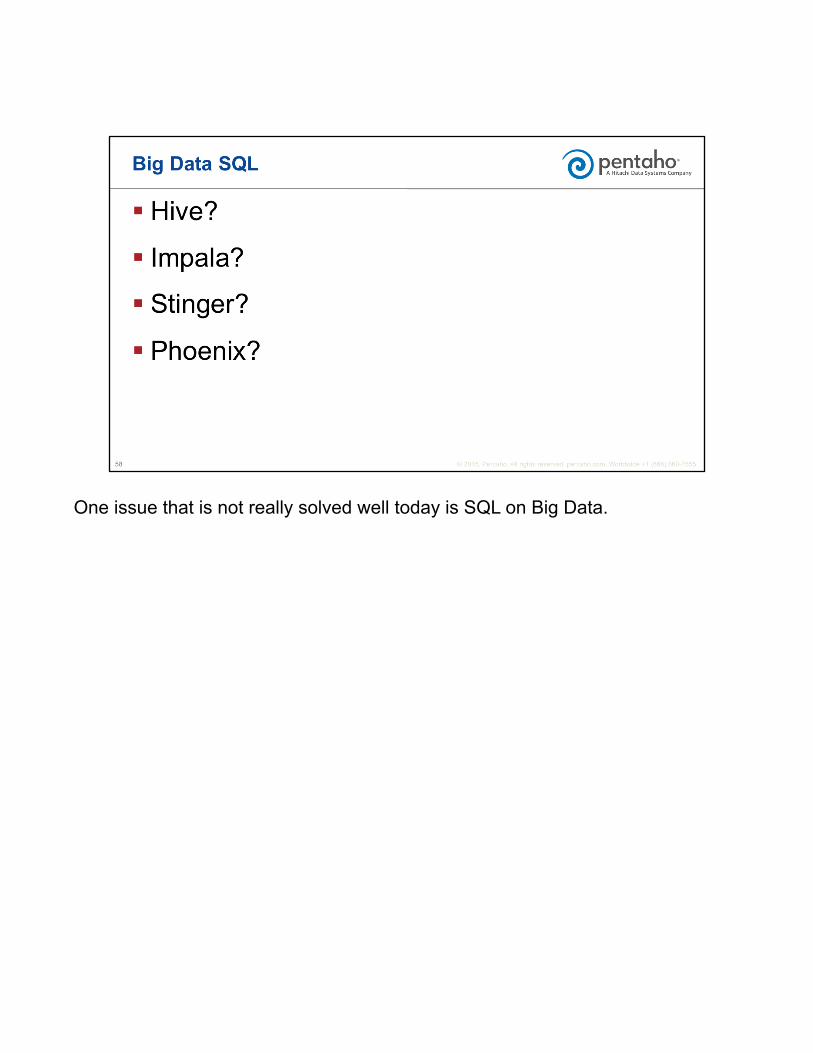
One issue that is not really solved well today is SQL on Big Data.
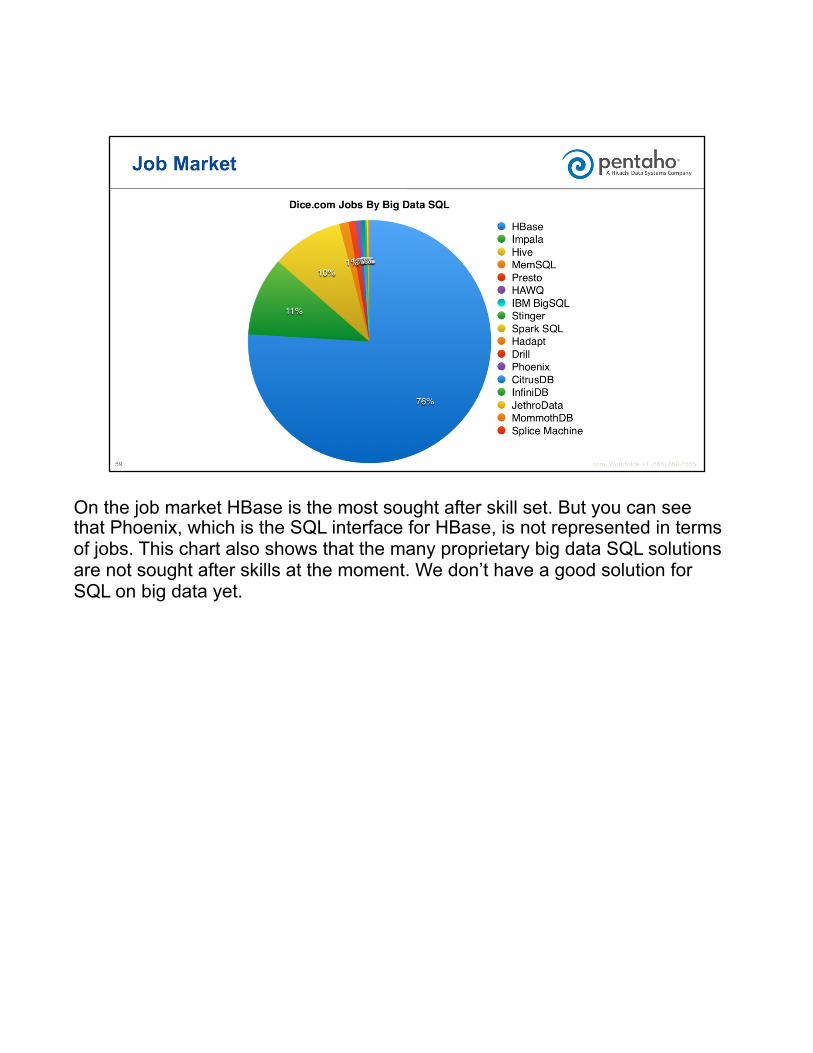
On the job market HBase is the most sought after skill set. But you can see that Phoenix, which is the SQL interface for HBase, is not represented in terms of jobs. This chart also shows that the many proprietary big data SQL solutions are not sought after skills at the moment. We don’t have a good solution for SQL on big data yet.
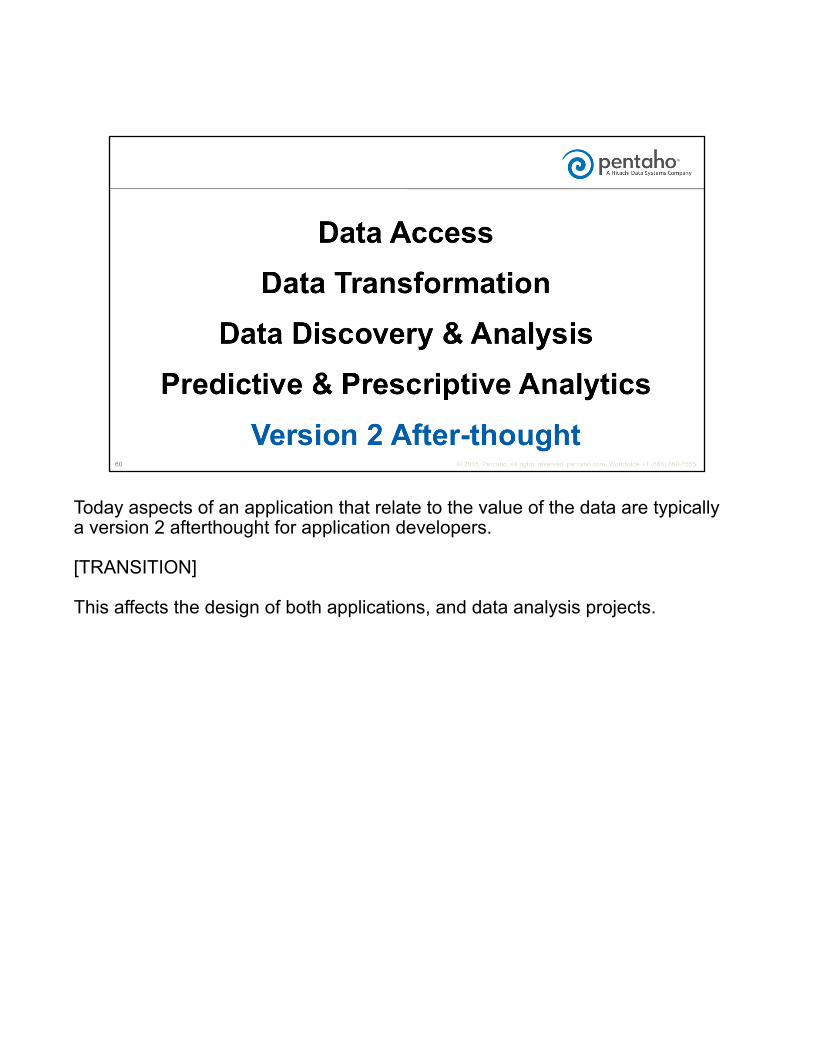
Today aspects of an application that relate to the value of the data are typically a version 2 afterthought for application developers.
[TRANSITION]
This affects the design of both applications, and data analysis projects.
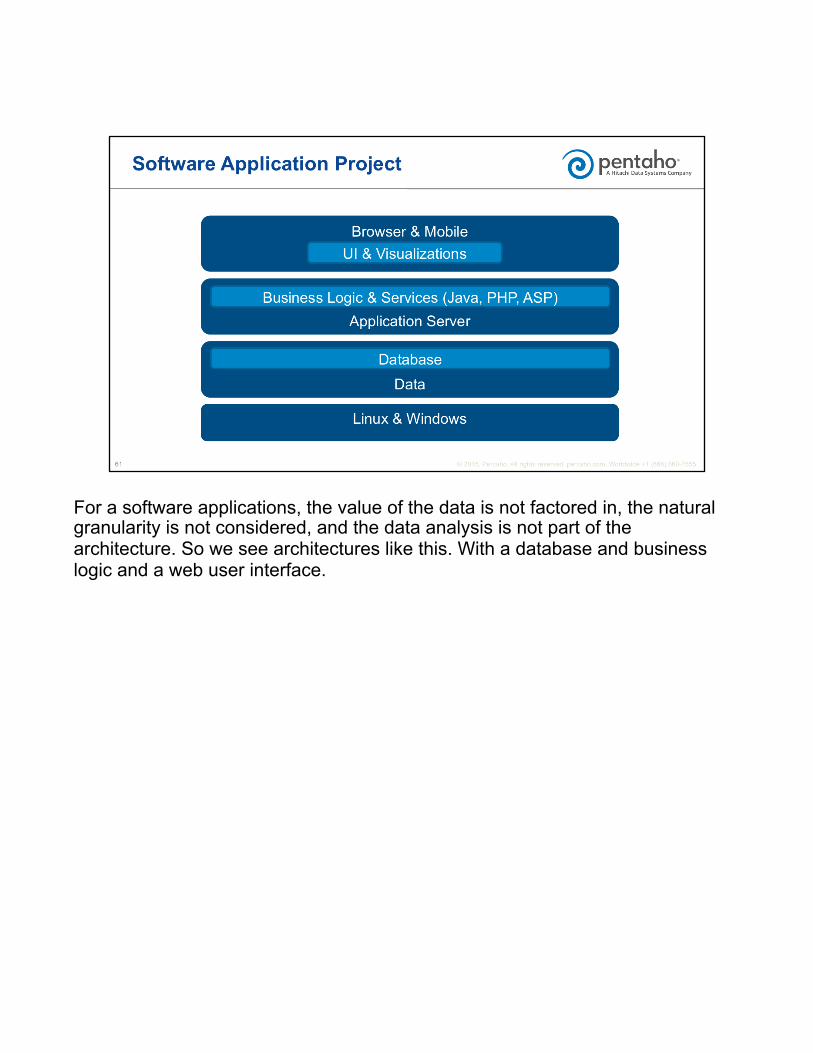
For a software applications, the value of the data is not factored in, the natural granularity is not considered, and the data analysis is not part of the architecture. So we see architectures like this. With a database and business logic and a web user interface.
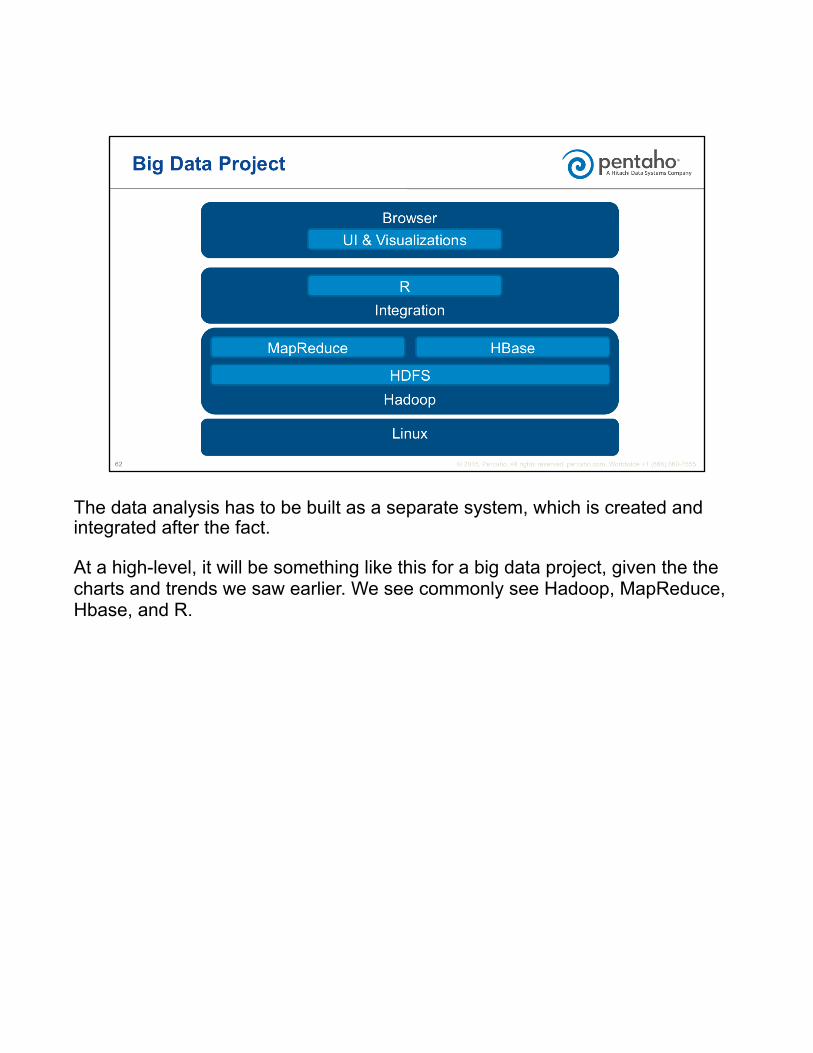
The data analysis has to be built as a separate system, which is created and integrated after the fact.
At a high-level, it will be something like this for a big data project, given the the charts and trends we saw earlier. We see commonly see Hadoop, MapReduce, Hbase, and R.
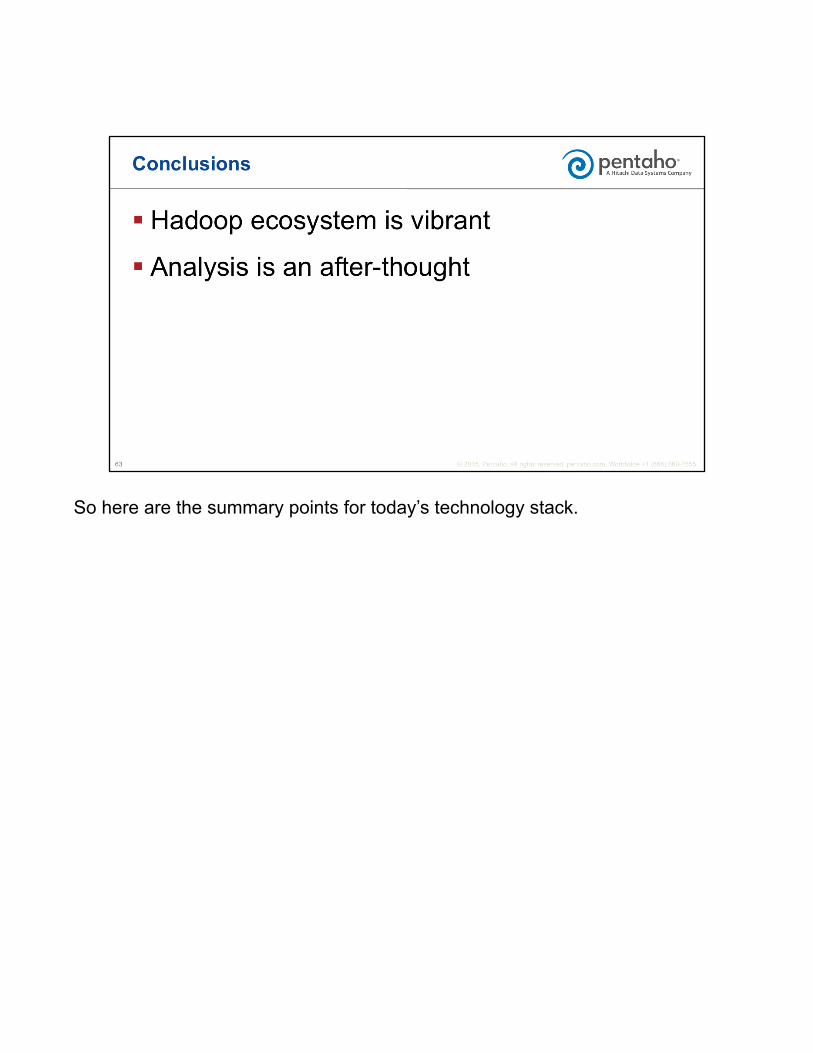
So here are the summary points for today’s technology stack.

Now let’s look into the future a little
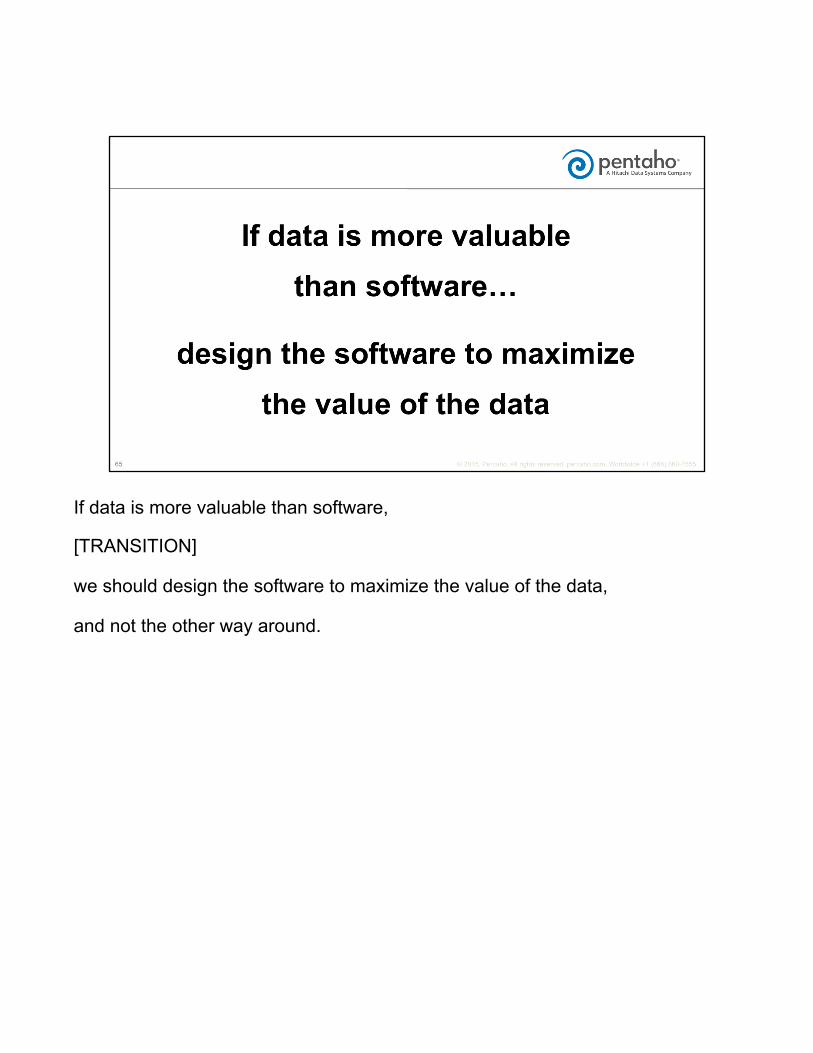
If data is more valuable than software,
[TRANSITION]
we should design the software to maximize the value of the data,
and not the other way around.

We should design applications with the purpose of storing and getting value from the natural maximum granularity
We should provide access to the granular data for the purpose of analysis and operational support
If data is where the value is, then the use and treatment of the data should be factored into an application from the start.
[TRANSITION]
It should be a priority of version 1.
[TRANSITION]
Valuing the data more than the software is a new requirement.
[TRANSITION]
Which demands new applications
[TRANSITION]
Which need new architectures
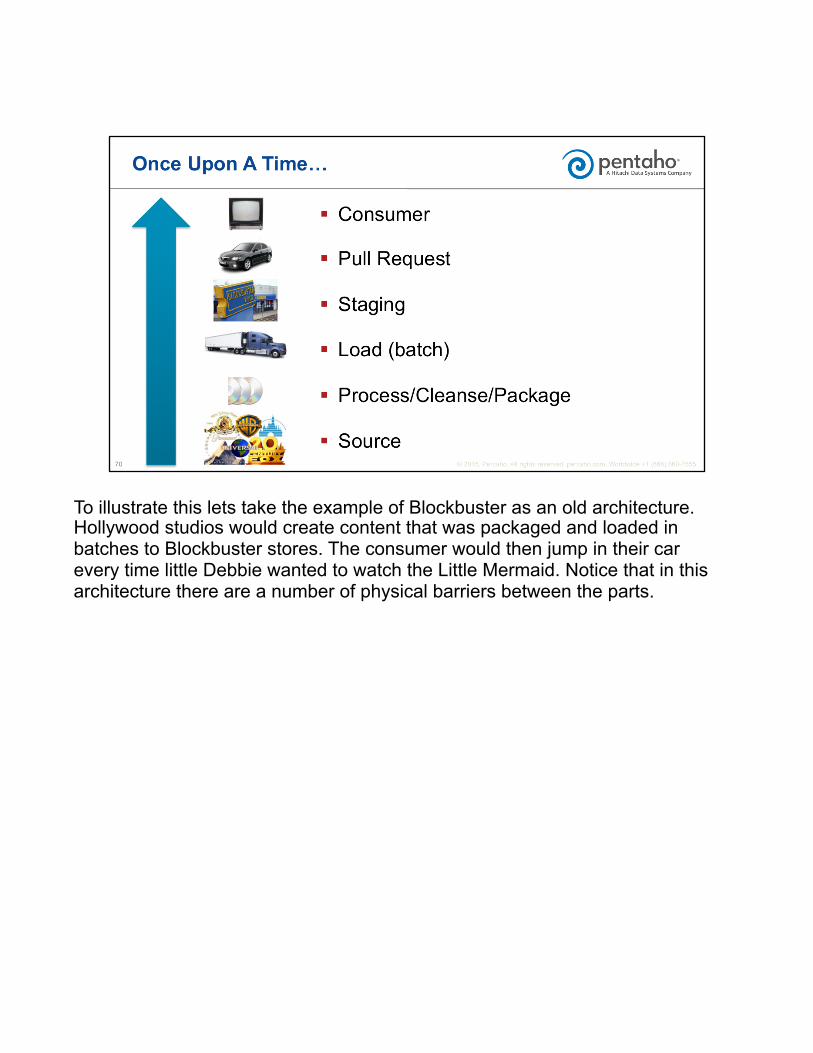
To illustrate this lets take the example of Blockbuster as an old architecture. Hollywood studios would create content that was packaged and loaded in batches to Blockbuster stores. The consumer would then jump in their car every time little Debbie wanted to watch the Little Mermaid. Notice that in this architecture there are a number of physical barriers between the parts.
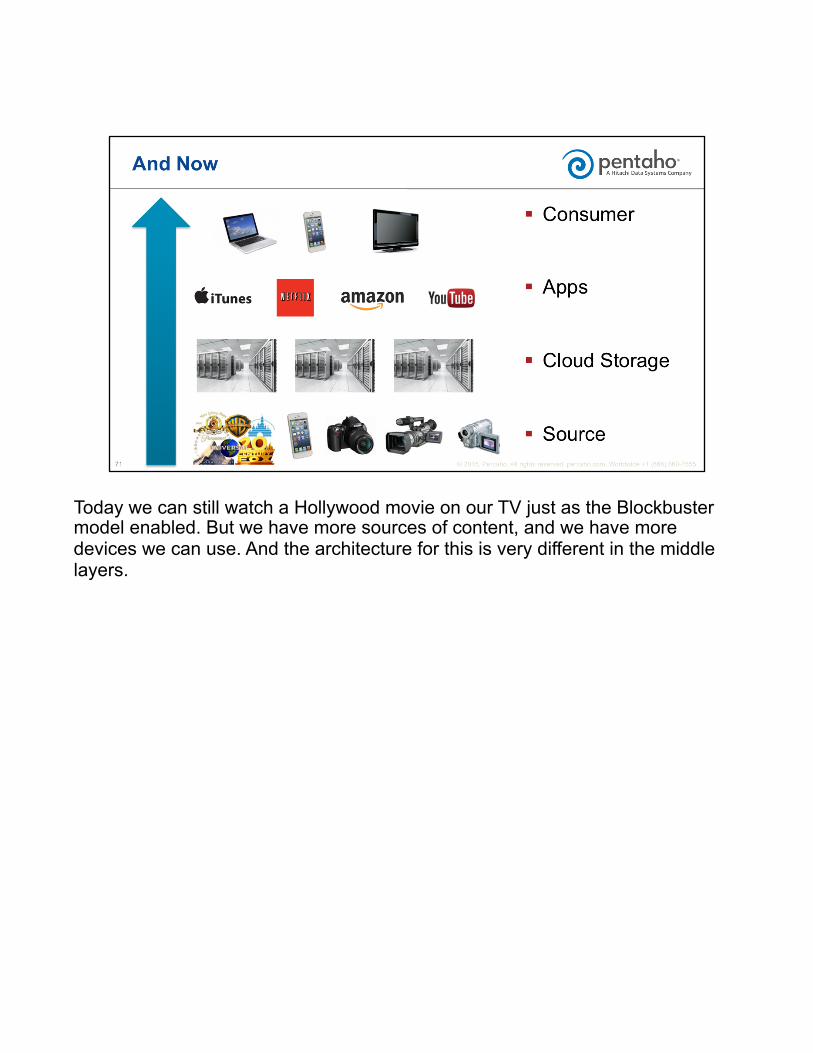
Today we can still watch a Hollywood movie on our TV just as the Blockbuster model enabled. But we have more sources of content, and we have more devices we can use. And the architecture for this is very different in the middle layers.
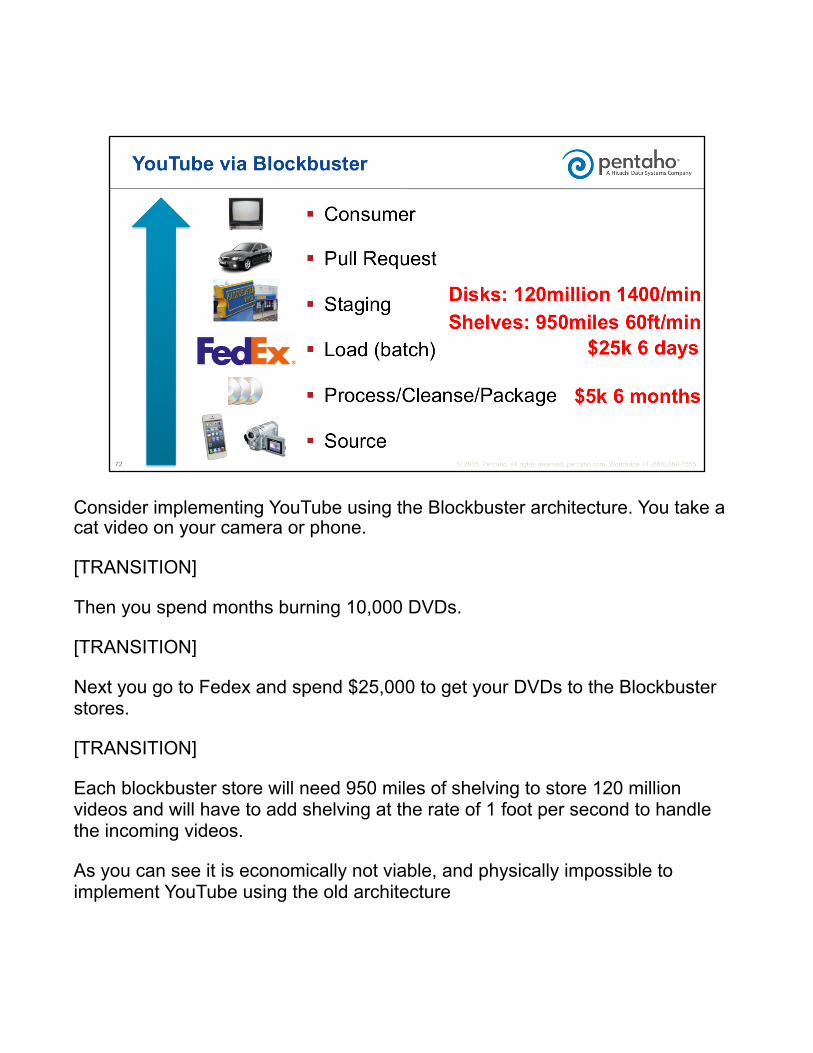
Consider implementing YouTube using the Blockbuster architecture. You take a cat video on your camera or phone.
[TRANSITION]
Then you spend months burning 10,000 DVDs.
[TRANSITION]
Next you go to Fedex and spend $25,000 to get your DVDs to the Blockbuster stores.
[TRANSITION]
Each blockbuster store will need 950 miles of shelving to store 120 million videos and will have to add shelving at the rate of 1 foot per second to handle the incoming videos.
As you can see it is economically not viable, and physically impossible to implement YouTube using the old architecture

Consider an Internet of Things architecture where you have millions of devices that have their own state and communicate with each other and with the central system in real time. These systems need to perform complex event processing, and analysis of state, and use predictive and prescriptive analytics to avoid failures. You cannot bolt all of this analysis to the outside of the system as an after-thought, it has to be designed-in and it has to be embedded.
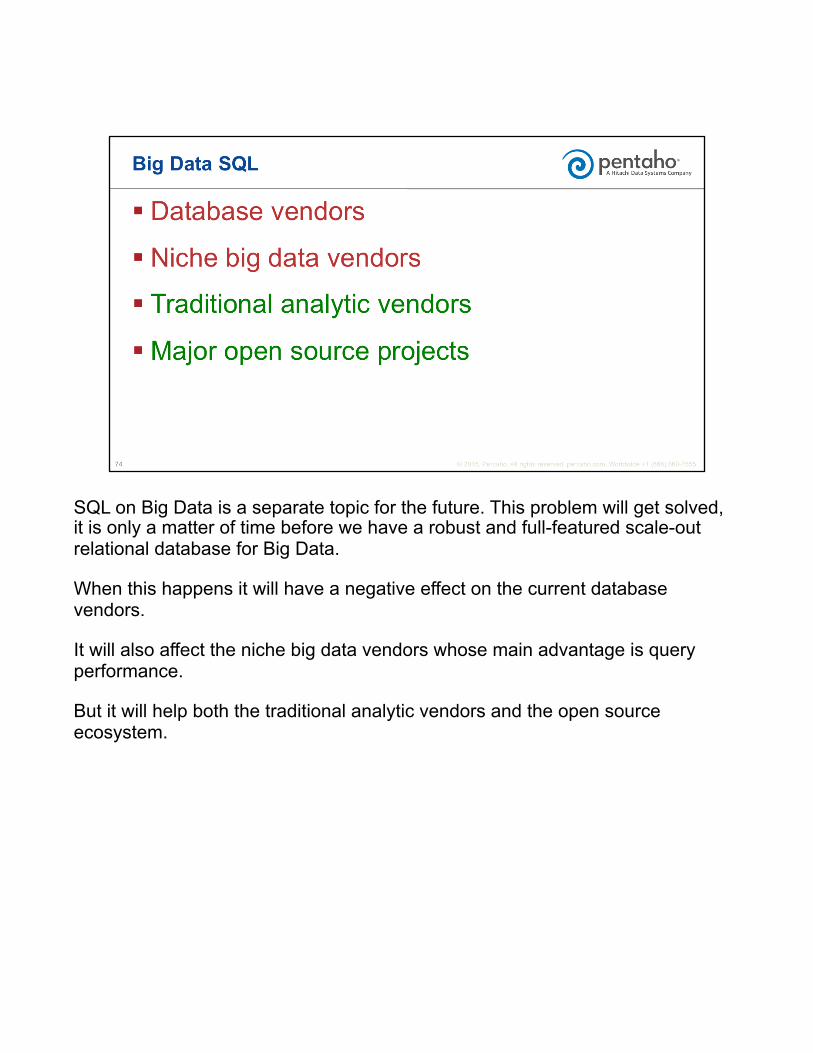
SQL on Big Data is a separate topic for the future. This problem will get solved, it is only a matter of time before we have a robust and full-featured scale-out relational database for Big Data.
When this happens it will have a negative effect on the current database vendors.
It will also affect the niche big data vendors whose main advantage is query performance.
But it will help both the traditional analytic vendors and the open source ecosystem.

Overall I think scalable technology is more interesting and more powerful that “big” technology that cannot scale down. Scalable technology allows you to start small and to grow without having to re-write, re-design or re-tool when you don’t have to.
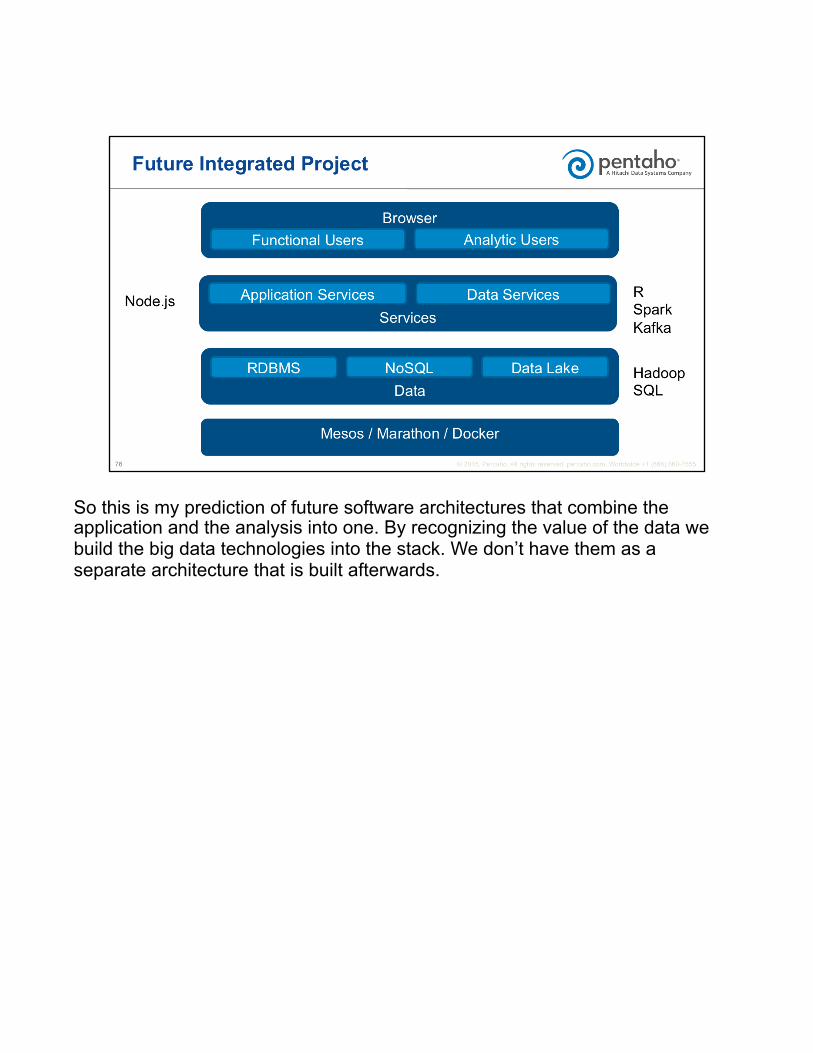
So this is my prediction of future software architectures that combine the application and the analysis into one. By recognizing the value of the data we build the big data technologies into the stack. We don’t have them as a separate architecture that is built afterwards.
So here are the summary points for tomorrow’s technology stack.

Let’s look at the big data use cases and consider why they will change in the future
In the database world if you took 50 database administrators and described a data problem to them they would probably come up with a small number of architectures and schemas between them. Probably only 3 or 4 when you discount the minor differences. This happens because, as a community, we understand how to solve problems using this kind of technology. We been doing it for a while, there are lots of examples and teachings and papers, and we have come to a consensus.
In the big data world we have not got to that point yet. Today if you took 50 big data engineers and described a problem you would get a large number of potential solutions back. Maybe as many as 50. We don’t collectively have enough experience of trying similar things with different architectures and technologies. But the emergence of these use cases helps a lot, because now we can categorize different solutions together, even though the actual problem might be different. Once we can do that we can compare the solutions and get a better understanding of what works well and what the best practices should be.
There is a set of problems that can be solved by SQL on Big Data as we talked about earlier
There is a second set of problems that can be solved using a data lake approach. These include agile analytics, and rewinding an application or device state and replying events.
A third set of solutions exist around processing streams of data in real-time
Obviously if we really value data, we should value big data as well.
And if we value big data, then it should be built into the system from the start. So the off-to-the-side big data projects should not exist, with the exception of a data warehouse solution.
Some of the big data use cases that are emerging today only exist because we are not building big data into the applications. Once we do that we will see some of the big data use cases change.
So to conclude this section, while big data use cases are important, the architecture stack needs to change, and with big data built in, we will see some of the big data use cases changing in the future.

Big data would not exist without open source. The reason these big data projects were created was because of a lack of existing products that were scalable and cost-effective.
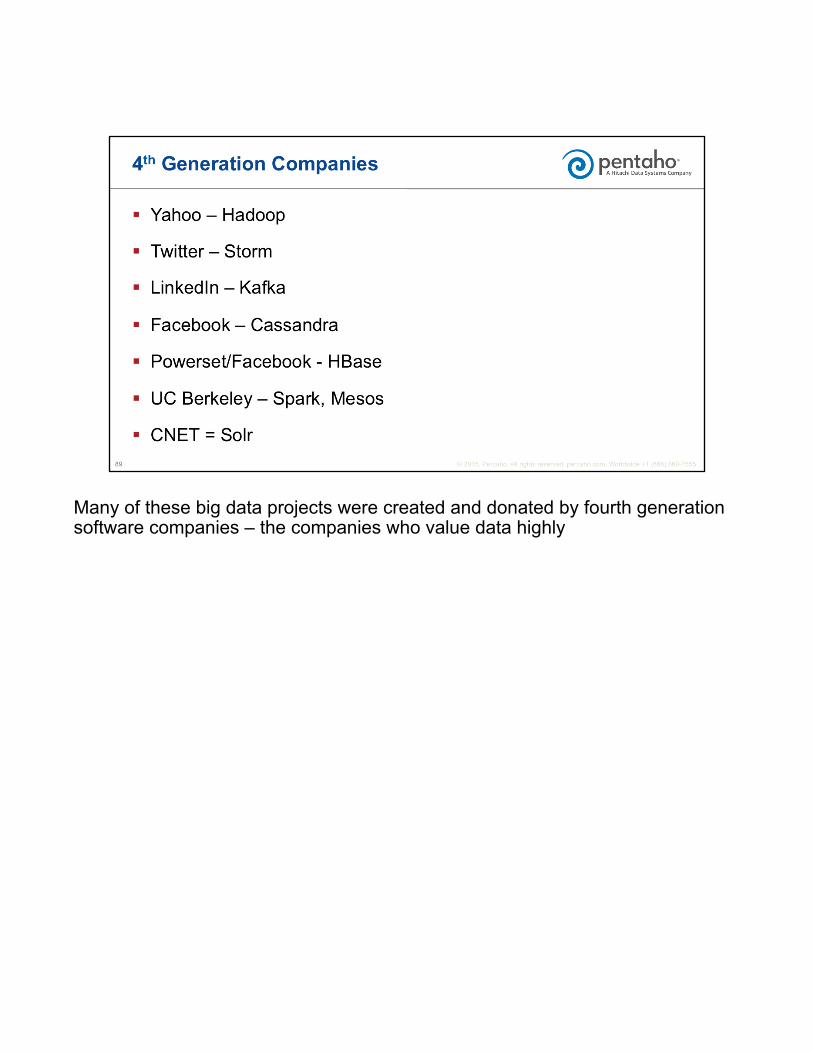
Many of these big data projects were created and donated by fourth generation software companies – the companies who value data highly
Large enterprises understand the advantage of big data solutions and are adopting them

Usage of Big Data by large enterprises fuels the news and excites the market analysts and commentators, because this is who they talk to the most. The fact that open source is not the main story is good because it makes acceptance of open source an assumption, and not a point of discussion or contention.

The widespread interest in big data technologies fuels adoption and contributions
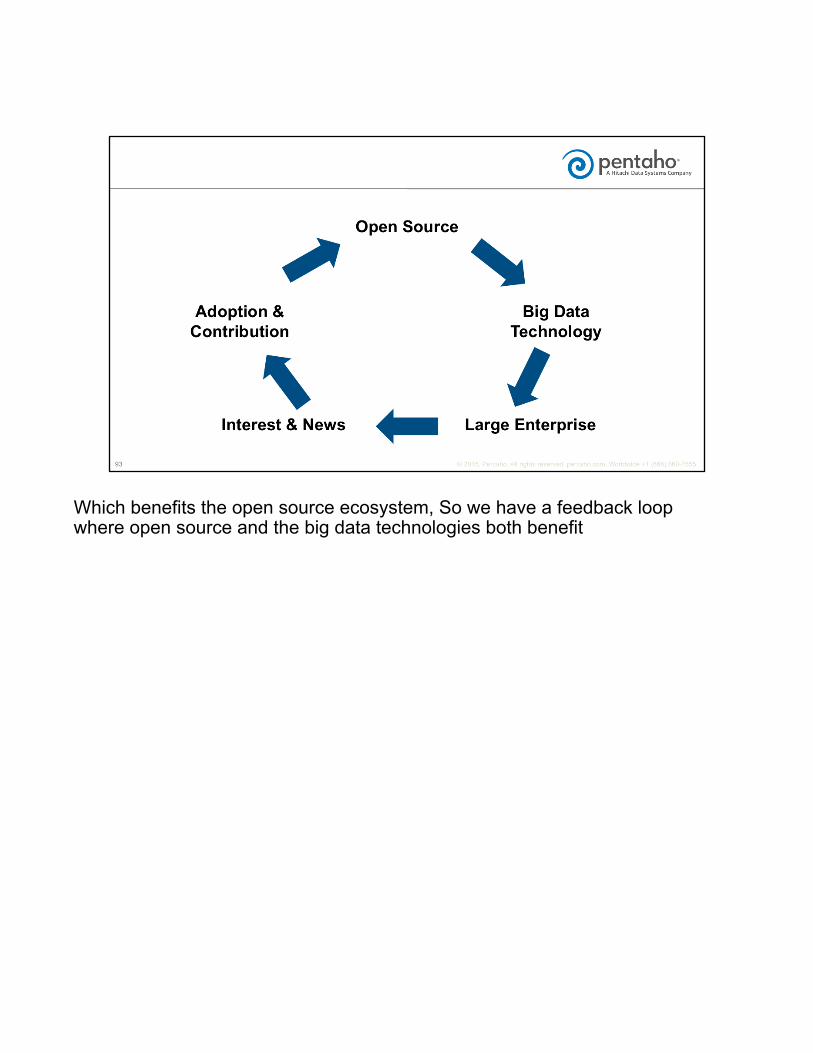
Which benefits the open source ecosystem, So we have a feedback loop where open source and the big data technologies both benefit
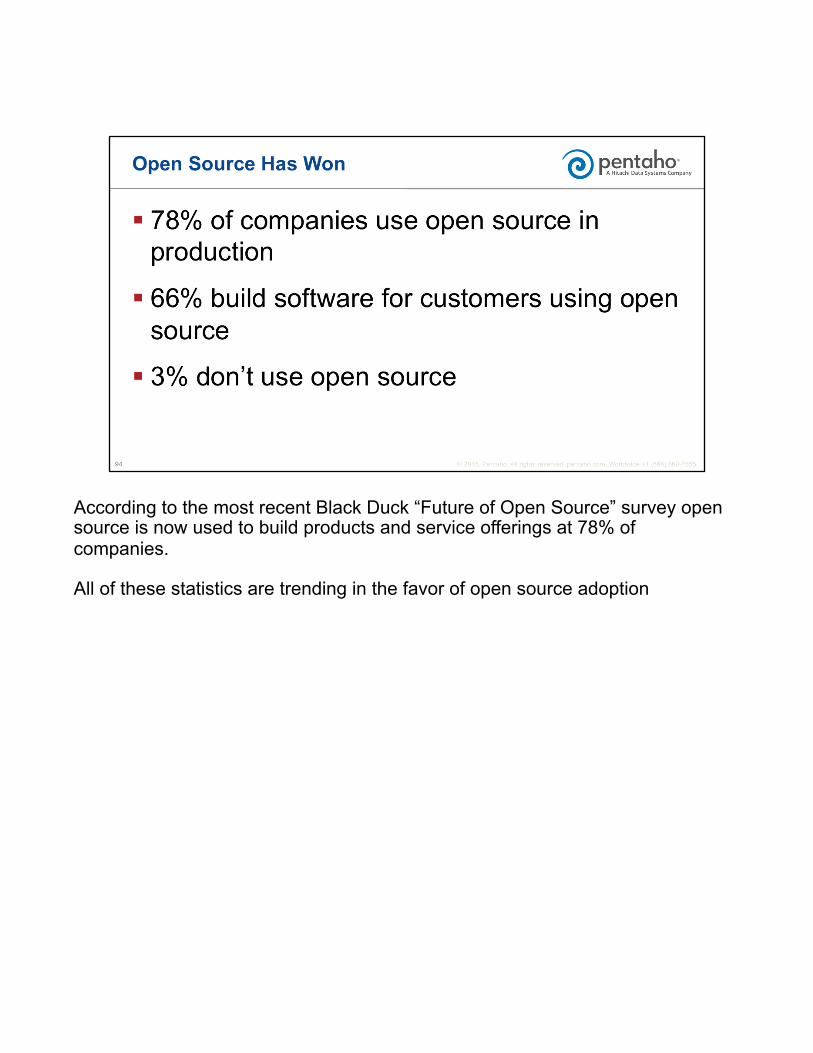
According to the most recent Black Duck “Future of Open Source” survey open source is now used to build products and service offerings at 78% of companies.
All of these statistics are trending in the favor of open source adoption
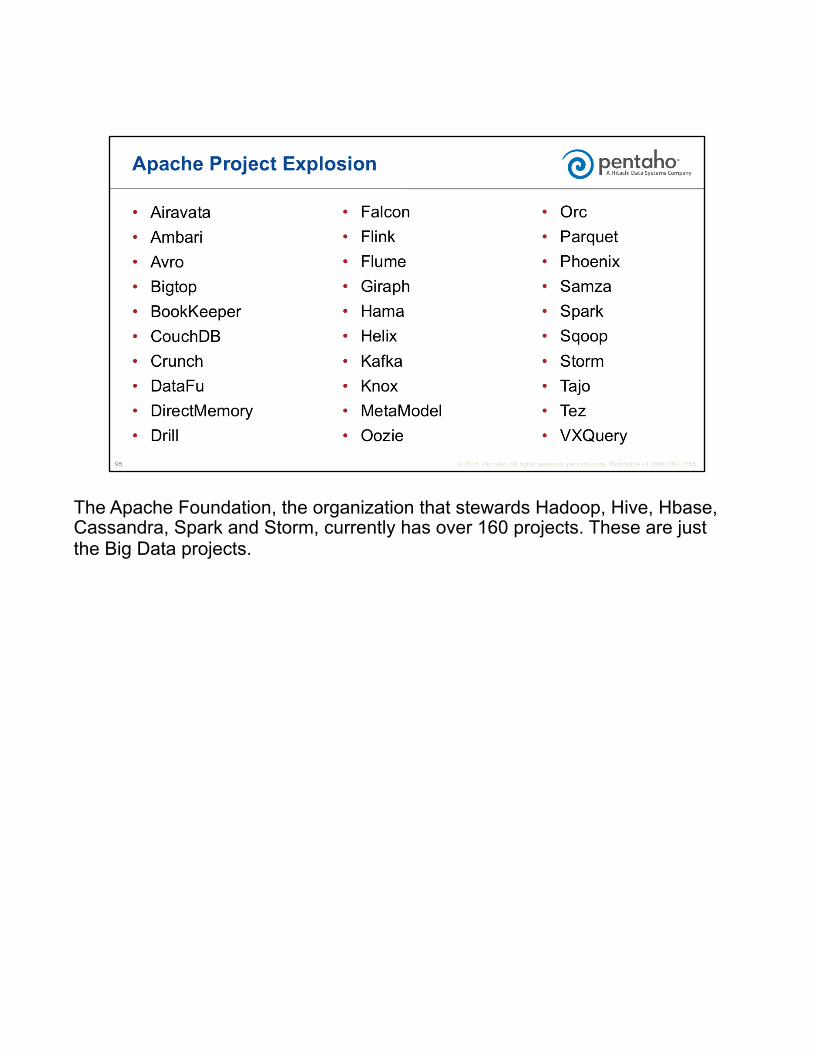
The Apache Foundation, the organization that stewards Hadoop, Hive, Hbase, Cassandra, Spark and Storm, currently has over 160 projects. These are just the Big Data projects.
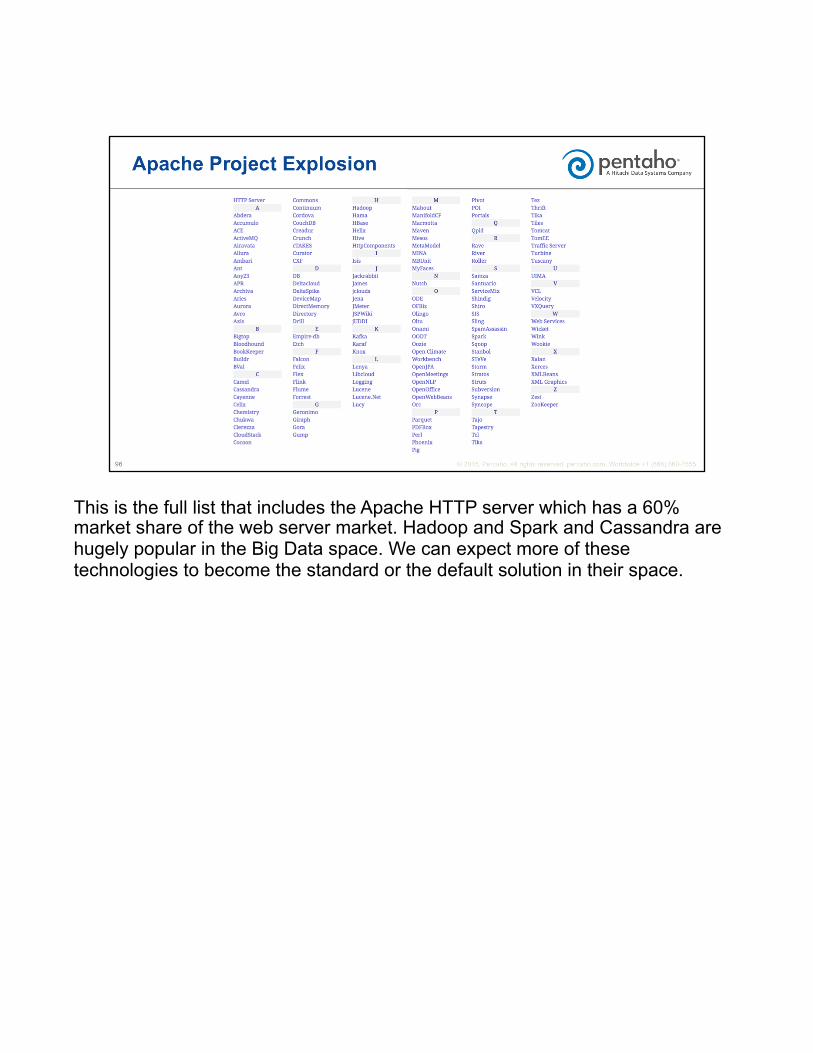
This is the full list that includes the Apache HTTP server which has a 60% market share of the web server market. Hadoop and Spark and Cassandra are hugely popular in the Big Data space. We can expect more of these technologies to become the standard or the default solution in their space.
Spark – in-memory general purpose large-scale processing engine
Kafka – cluster-based central data backbone
Samza – stream processing system
Mesos – cluster abstraction


I hope you enjoyed this talk. Whether or agree or disagree with these ideas or if you have questions you can comment on my blog at any time. Thank you all for joining.
Recommended