The Relationship between CEO
Compensation And Various
Performance Indicators in South
Africa
By :
Tadiwanashe Phillip Ndofirepi
A research report submitted to the Faculty of Commerce, Law and Management, University of the
Witwatersrand, in partial fulfilment of the requirements for the degree of Master of Management in Finance
and Investment.
Supervisor: Dr Thabang Mokoaleli-Mokoteli
March 2015

i
DECLARATION
I declare that this research report is my own unaided work, except where otherwise indicated
and acknowledged. It has not either in whole or part, been submitted at any other University or
institution for degree purposes or examination.
Tadiwanashe Phillip Ndofirepi
Signed at ……………..…………………On the …….. Day of March 2015

ii
DEDICATION
I dedicate this research to CHRIST JESUS who is GOD.
iii
ABSTRACT
This study examines the relationship between the remuneration of CEOs and the performance
of firms in South Africa. The purpose of the research is to empirically observe developments
post the King III corporate governance report that suggested that remuneration be closely
associated with compensation. The research areas include the risk and reward relationship in
three different compensations forms; salary, bonus (cash) and total remuneration (salary plus
bonus). It excludes stock options awarded and the level of compensation. The performance
measure used were both market and accounting related.
The results are drawn out of a sample of 119 JSE listed firms which sum up to 714 firm-years
observed. As in previous studies the multiple regression model was used on estimating panel
data, allowing the control of unobserved company related effects.
The results suggest that of all the performance measures ROA is the only one positively related
to CEO remuneration, i.e. fixed salary and total remuneration although it is not related to the
bonus portion. ROE is negatively related to all fixed salary, and shows that a large increase in
ROE leads to a large decrease in CEO basic/fixed pay. Only the preceding accounting
components of performance were related to CEO remuneration, stock price (RET) the market
measure for performance does not explain any changes in the studied compensation forms.
This result is not unexpected given that option awards were not included in the study. The
largest coefficients and positive levels of significance were found on the relationship between
international diversification and CEO compensation although it was not the main thrust of the
study. Therefore this confirms that performance is not the most important determinant in the
changes in CEO remuneration in South Africa.
iv
ACKNOWLEDGEMENTS
I am grateful to my LORD GOD for putting me on a purposeful path and giving me the
foundational understanding for studying MMFI. My appreciation also goes to my supervisor
Dr. Thabang Mokoteli for being available to give advice and guidance, which came with
amazing patience. To my parents Doctors Amasa and Elizabeth what an amazing inspiration
you have been through my life, thank you for the financial and moral support. Lindah Tafadzwa
my girlfriend thank you for being there regardless of the distance, GOD bless you. To Nyasha
Mhike and Tafadzwa Glory you inspire me to work harder. I want to acknowledge my mentor
as well T.T. Mudekunye, such an inspiration.
Lastly to my friends, colleagues, co-workers in CHRIST, and MMFI fellows a big thank you.
v
TABLE OF CONTENTS
DECLARATION.................................................................................................................................... i
DEDICATION....................................................................................................................................... ii
ABSTRACT .......................................................................................................................................... iii
ACKNOWLEDGEMENTS ................................................................................................................ iv
LIST OF TABLES .............................................................................................................................. vii
CHAPTER 1 INTRODUCTION ..................................................................................................... 1
1.1 Introduction ........................................................................................................................... 1
1.2 Context of the Study ............................................................................................................. 1
1.3 Research Problem ................................................................................................................. 3
1.4 Research Objectives .............................................................................................................. 4
1.5 Research Questions ............................................................................................................... 4
1.6 Research Gap ........................................................................................................................ 4
1.7 Organization of the Study .................................................................................................... 5
Chapter Summary ............................................................................................................................ 5
CHAPTER 2 LITERATURE REVIEW ......................................................................................... 6
2.1 Introduction ........................................................................................................................... 6
2.2 The History of the Agency Problem and Executive pay .................................................... 6
2.3 Compensation and Corporate governance ......................................................................... 7
2.4 Corporate Financial Scandals and Executive Compensation ........................................... 8
2.5 Factors influencing CEO compensation ............................................................................. 9
2.5.1 Board structure .............................................................................................................. 9
2.5.2 CEO Tenure ................................................................................................................... 9
2.5.3 Shareholding structure ................................................................................................ 10
2.5.4 Size of the Firm ............................................................................................................ 10
2.5.5 Industry Effects, Diversification and International Operations ................................ 10
2.5.6 Other Factors ............................................................................................................... 10
2.6 Firm earnings, stock performance and CEO compensation structure .......................... 10
Chapter Summary .......................................................................................................................... 12
CHAPTER 3 RESEARCH METHODOLOGY .......................................................................... 13
3.1 Introduction ......................................................................................................................... 13
3.2 Data, Sample and Data Sources ......................................................................................... 13
3.3 Research Design .................................................................................................................. 14
3.3.1 Empirical Hypothesis ................................................................................................... 16
vi
Chapter Summary .......................................................................................................................... 17
CHAPTER 4 PRESENTATION OF RESULTS ......................................................................... 18
4.1 Introduction ......................................................................................................................... 18
4.2 Descriptive Statistics ........................................................................................................... 18
4.3 Results .................................................................................................................................. 21
4.3.1 Regression Diagnostics ................................................................................................ 21
4.3.2 The relationship between CEO compensation and corporate performance .............. 22
Chapter Summary .......................................................................................................................... 26
CHAPTER 5 CONCLUSION AND RECOMMENDATIONS .................................................. 27
5.1 Introduction ......................................................................................................................... 27
5.2 Discussion............................................................................................................................. 27
5.3 Conclusion ........................................................................................................................... 28
5.4 Recommendations for Future Research............................................................................ 28
Chapter Summary .......................................................................................................................... 29
APPENDIX 1 ....................................................................................................................................... 30
REFERENCES .................................................................................................................................... 31
vii
LIST OF TABLES
Table 1 Summary of Variables Page 15
Table 2 Descriptive Statistics Page 18
Table 3 Descriptive Statistics (2) Page 19
Table 4 Descriptive Statistics (3) Page 20
Table 5 Pearson Correlation Coefficient Matrix Page 21
Table 6 Regression Results Page 22
1
CHAPTER 1 INTRODUCTION
1.1 Introduction
This chapter lays out the context of the study, objectives of the study, research problem,
research questions, the research gap, as well as the outline of the study. The chapter is arranged
as follows; Section 1.1 Introduces the study, Section 1.2 discusses the context of the study,
Section 1.3 states the research problem, Section 1.4 outlines the objectives of the research,
Section 1.5 states the research questions, Section 1.6 lays out the identified research gap and
Section 1.7 outlines briefly the organisation of the study.
1.2 Context of the Study
In a labour mature and conscious business environment, great amounts of attention tend to be
focused on the remuneration of CEO’s and executives of listed and unlisted companies alike.
Particular interest has grown on the structuring of compensation packages since King III report
recommended the publication of executive remuneration. The patterns that have since emerged
show that CEO compensation has risen yearly on the basis of matching market rates. The aim
of this study is to evaluate whether the changes in corporate governance monitoring
frameworks have resolved agency conflicts through varied adjustments in Pay-for-
Performance model of remuneration to CEOs in South Africa.
A presentation to the World Economic Forum ranked South Africa number one in corporate
board efficacy and second in the protection of minority shareholders’ interests in the world
(Schwab & Sala-i-Martín, 2012). The above issues speak strongly to the agency problem and
if the rankings are taken out of context then the agency problem is not existent or is
insignificantly minimal in South Africa. Much has been discussed academically and publicly
about the determinants and size of CEO compensation.
Early studies widely agree that incentives tend to alleviate agency problems between managers
and shareholders through corporate governance mechanisms (Agrawal & Knoeber, 1996;
Baker et al., 1988; Fama, 1980). Literature post the 2008-2009 financial crisis suggests that to
fully mitigate agency conflicts CEO compensation must be attached to the long-term results
for shareholders as well other providers of capital and stakeholders (Bebchuk & Fried, 2010;
Bebchuk & Spamann, 2009). In industry wide wage strikes and talks in South Africa,
politicians and workers have highlighted CEO salaries and incentives as one of their
justifications for demanding higher pay. The strikes lead to stops in production and increased
2
costs which eat into shareholder’s economic value (Seccombe, 2014). In turn shareholders have
not swallowed their dissatisfaction; they are at loggerheads with executives over pay policy.
An example being ABSA’s Maria Ramos who was awarded a R28-million package despite a
close to 20% fall in share price (Barron, 2014). In this report, it is observed as well that
shareholders have limited power to intervene, 18.4% of the shareholders voted against ABSA’s
remuneration policy yet the vote itself did not translate into a review of compensation program.
In a separate case the recent collapse of African Bank has raised a stink as anecdotal evidence
shows that the CEO and other executives of the bank had from year to year been rewarded huge
packs despite the board being largely dominated by independent directors. There is evidence
that shareholders have overtime failed to constrain compensation arrangements by any means
be it voting, litigation or equity-holder resolutions (Barris, 1992; Bebchuk & Fried, 2006).
Performance based remuneration through incentives has grown over the years compared to
executive’s basic salary but this has not been an antidote to agency conflict (PWC, 2013). In
this annual corporate governance bulletin PWC criticise the Pay-for-Performance model and
state that it has “failed” in South Africa. They suggest a new model of executive remuneration
developed by PWC in the UK. The problem with the model they suggest is that it originated in
developed market context and may not be appropriate in an emerging market as the
characteristics and needs of the South African economy are different. Overall, it seems like
South African companies need a new look at the CEO compensation model that will suit the
needs of both the executives and the shareholders. Remuneration committees composed
primarily of independent directors are tasked with designing, implementing and appraisal of
compensation of compensation packages for CEOs. The independence of these directors is put
to question as well because another agency problem will then emanate from remuneration of
these independent directors and the structure of the remuneration committee itself (Bebchuk &
Fried, 2003; Daily et al., 1998).
Against a pre-crisis warning by Bebchuk and Fried (2006) post world financial crisis studies
agreed that both bonus and equity based compensation had led CEOs to concentrate on short-
term firm performance. Bebchuk et al. (2010) in an investigation on the Lehman Brothers case
revealed that there was rampant cashing out of equity options by executives before the slump
of stocks, incentives prepaid to directors in previous years could not be recouped in the earnings
of 2008-2009. Pre-crisis cash out benefits were larger than stock options losses made by CEOs
during the post-crisis through stock slumps (Bhagat & Bolton, 2014). Based on this American
3
context, it is not inconceivable that that in South Africa too, CEOs compensation structures
have short-term outlook.
Sharp and Aling (2013) in a study of CEO remuneration in South Africa challenge trade unions
and politicians as not being considerate of the very basis for CEO compensation, corporate
profitability and argue that CEO compensation should reflect corporate financial performance.
In attempting to further establish the cause for higher executive pays they concluded that a
combination of new technologies and employment equity had led to an artificial shortage of
qualifying CEOs. They however, overlooked corporate governance mechanisms which are said
to derive and maintain effective and fair executive compensation.
The study of agency conflict has been of greater interest to consultancy firms as they review
corporate governance issues in South Africa, with little work being done academically to assess
the affairs which has resulted to rising voices of descent and dissatisfaction in this area. With
the above theoretical and event foundations, the study hopes to bring home a South African
context of the relationship between CEO compensation and firm accounting and stock price
performance and corporate governance issues that come into this nexus.
1.3 Research Problem
Many cases have been identified in which CEO pay has risen considerably whilst the
companies were performing poorly and stock prices were dropping. PIC which controls 11%
of stocks on the JSE has highlighted that it has blocked remuneration resolutions of 23 listed
firms in 2014 alone as most remuneration policies had been set against attainable performance
targets. Executives earning millions in South Africa claim that they do not have enough
financial resources to quell labour unrest which continues to erode shareholder value in
downtime (Barron, 2014; Seccombe, 2014). Faulkender et al. (2010) state that many observers
believe that top level executive compensation is not sufficiently linked to long-term corporate
performance. Crotty and Bonorchis (2006) found that since the announcement by the JSE in
2002 that in terms of King II report, executive pay should be disclosed publicly, a sharp upward
movement in CEO’s salaries has been seen which cannot be aligned to performance of the firm.
They speculate that this rise may be adjustments by firms’ remuneration committees to match
what other CEO’s earn in the market. This leads researchers to question the structure, devices
and mechanisms of optimal contracting based compensation from both the shareholder and
executives’ view which is meant to address agency conflict. Thus, it is not very clear whether
4
CEOs are over or under compensated in particular relation to performance in terms of both
market and accounting performance.
This study aims to evaluate the relationship between CEO pay and firm performance in South
Africa and whether the executives are compensated in line with the risk they take in making
discretionary decisions by testing whether accounting and stock price performance relates to
their pay. This pay-for-performance relationship is important to private investors, financial
economists, governments, churches, private institutions, trade unions, pension funds, asset
managers etc.
1.4 Research Objectives
The objectives of this research are stated as follows
To assess the relationship between CEO compensation and company accounting
and stock price performance for companies listed on the JSE.
To evaluate and analyse the relationship between the form/structure of CEO
compensation and firm performance.
1.5 Research Questions
Is there a relationship between CEO compensation and company accounting and
stock price performance exist in companies listed on the JSE?
Does the form/structure of CEO compensation affect firm performance?
1.6 Research Gap
Existing literature encompasses mixed findings in the relationship between CEO remuneration
and company performance. Boschen and Smith (1995) were of the opinion that impact of firm
performance on CEO compensation, while persistent, is not permanent. In their later study
Boschen et al. (2003) revealed that CEO's long-run financial gain from good stock price
performance is positive and significant while no long-run relationship was found between
accounting performance and compensation. In South Africa, the literature indicates that there
is no consensus in terms of whether there is a relationship between CEO pay and firm
performance? (Scholtz & Smit, 2012).
Ozkan (2011) found that there was no significant relationship between firm performances -
both accounting and stock price, and also concluded that corporate governance initiatives were
5
not totally effective. It is on the backdrop of such literature that this study seeks to add on to
the existing literature on the agency conflicts and the corporate governance mechanisms and
devices that are created to minimise these by checking whether these mechanisms are a curse
or piety in the pay-for-performance model of CEO compensation in South Africa.
This study will be significant in that it will attempt to clarify the position of the pay-for-
performance model in CEO compensation post implementation of King II & III Reports and
the Companies act of 2008. This study will assess composition of CEO remuneration in SA
and its effects on firm performance. This study seeks to make a contribution in outlining the
possible areas of note in the remuneration packaging and agency conflict resolution that have
been overlooked in the King reports. The trend of the pay-for-performance model will be
assessed as well. The study carefully brings in the dynamics of accounting performance
because it filters out common noise in stock price performance. In accounting performance
there is indeed noise in terms of manipulation though it is noted that it is not as the noise in
stock price performance (Boschen et al., 2003).
1.7 Organization of the Study
Chapter 2 reviews the literature and highlights gaps on CEO compensation and firm
performance extant literature. Chapter 3 outlines the research methodology including data, data
sources and research design. Chapter 4 presents and analyses the results of the study. Chapter
5 l discusses the results and concludes as well as makes recommendations and suggestions for
further study.
Chapter Summary
Remuneration of executives and CEOs is topical in South Africa and should be debated
constructively. The chapter outlined the context of the study and presented the objectives and
questions. The research problem, gap and outline I also laid out. The next chapter presents the
review of the literature.
6
CHAPTER 2 LITERATURE REVIEW
2.1 Introduction
The study of executive compensation and performance is underpinned by the agency theory,
which is finance theory developed to explain the divergences of interest between shareholders
and corporate managers (McColgan, 2001). The theory is the original work of Jensen and
Meckling (1976) who proposed the theory of the firm based on conflicts of interest between
different contracting parties. The literature has been developed overtime to explain both the
nature of these conflicts and means by which they may be resolved.
The aim of this chapter is present the systematic literature relating to the agency theory and
other literature related to CEO performance and firm performance. The chapter is organised as
follows; Section 2.2 reflects on the agency theory, Section 2.3 discusses CEO compensation
and corporate governance. Section 2.4 presents corporate financial scandals and CEO
compensation. Section 2.5 presents factors that influence CEO compensation.
2.2 The History of the Agency Problem and Executive pay
In the early history of the institutionalised company, the manager’s job was merely to
administer the movement of services, information and good. This effectively changed with the
establishment of the first joint stock exchange in 1856 introducing a discretionary manager
who watched over the stockholder’s interest (Scholtz & Smit, 2012). In a study of the theory
of the firm Berle and Means (1932) found that public issue of shares resulted effectively in no
single shareholder controlling the firm and directors had to exercise complete discretion. It is
this managerial power and discretion when abused by the agents to their own benefit at the
expense of the shareholder that modern financial economists call the “agency problem”.
The construction of compensation contracts for CEOs and executives alike should represent a
financial incentive for management to grow the company in value to align the interest of
shareholders and management. The formal work on agency theory and its emergence is rooted
in the work of Jensen and Meckling (1976) who in their development of the theory of the firm
(where the manager personifies the firm) are of the opinion that greater levels of financial
incentives ought to eventually lead to higher company performance there by reducing the
conflict of interest that the agent has because it puts her in the position of a residual risk bearer.
7
Executives as top agents are expected to use their specialised skills and knowledge on firm
resources to create the highest possible value for the principal who delegates the responsibility
of managing the firm (Finkelstein & Hambrick, 1988; Gómez-Mejía & Balkin, 1992). In a
study of firms over an effective 688 firm years since 1948, Boschen and Smith (1995)
concluded that to mitigate information asymmetry of an agent’s actions/talents, current pay has
to be linked to multiple periods. At the time this study was conducted compensation response
to performance happened in years to come (because of the introduction of long term reward
contracts) hence there is a significantly high likelihood that dynamic effects could be omitted,
resulting in misleading analysis of pay-performance sensitivity.
As a result of dispersed ownership, publicly listed firms do not have the ability to contract with
executives at arm’s length, do not have a significant say in the way they are remunerated and
would be interested in reducing the relative attention gathered by their pay and the way in
which it might result shifting attention from their performance1 (Bebchuk & Fried, 2003). In
an attempt to resolve the agency problem studies have suggested “the optimal contracting
approach” which they seen later as part of the agency problem itself.
2.3 Compensation and Corporate governance
Several policy documents have been developed on the conduct of companies with regards to
CEO compensation. The notion of remuneration for performance is developed and discussed
in popular corporate governance tools including South Africa’s King reports of 1994, 2002 and
2009; the Cadbury Report of 1992 and Greenbury Report of 1995.
The Cadbury Report of 1992 sets the tone in the introduction of independent directors to bring
on autonomous judgement paying particular attention on performance, resources and standard
of service. Cadbury also recommends the full reporting of all executives’ emoluments
including separate reports on highest paid executive, salary based pay and performance related
compensation. The Greenbury (1995) report is specifically designed to recommend and give
guiding policies on terms of service for executives with particular attention paid to
compensation policies. Greenbury recommends best practice in determination and disclosure
of executives’ remuneration in order to avoid conflict of interest by setting up remuneration
committees which constitute of non-interest Non-Executive directors. The current guiding
1“The firm is disciplined by competition from other firms, which forces the evolution of devices for efficiently monitoring the performance of the entire team and of its individual members. Individual participants in the firm, and in particular its managers, face both the discipline and opportunities”(Fama, 1980)
8
document in the South African corporate governance is the King III (2009) report which
recommends that the board should determine the remuneration of the executive directors in
line with the remuneration policy and also requires the disclosure of such compensation in
terms of the Companies Act. The report adds that companies should remunerate directors and
executives fairly and responsibly, i.e. aligning remuneration policies to company strategy and
individual performance.
In an investigation of panel data in the UK, Ozkan (2011) found that the Greenbury report was
not totally effective and not adequately implemented in UK firms, but noted that the disclosures
ushered by the Hampel (1998) report made it possible to analyse total compensation rather than
the cash only component of compensation. The question that then arises is: Have our corporate
governance institutions done enough to ensure CEO and executives’ fair and responsible
remuneration especially in emerging markets like SA?
The Institute of Directors (IOD) in South Africa have adopted King Codes and have
implemented the codes through the JSE listed firms as these tend to have more agency conflict
issues due to their public ownership nature. The detailed information about JSE listing
requirements and Companies acts are contained in appendix 1.
2.4 Corporate Financial Scandals and Executive Compensation
In the recent past, the world experienced corporate scandals that triggered the collapse of large
and well-known corporations such as Enron, WorldCom and Parmalat resulting in massive
destruction shareholder wealth as well as damage to other stakeholders (Faulkender et al,
2010). Some schools of thought blame the rise in financial scandals to ineffective remuneration
policies employed by boards in corporations. For example, Bebchuk and Fried (2006) state that
the absence of effective arm’s length dealing under today’s corporate governance system has
been the primary source of problematic compensation arrangements.
Crocker and Slemrod (2007) remark that many corporate boards dedicate far more time and
energy to compensation compared to the time that is spent assuring the veracity of the
company’s financials. They further suggest that company boards should not treat these two
concerns as unrelated issues, rather an optimal compensation scheme should be designed with
an eye on deterring misleading reporting by the firm’s officers. In fact, Faulkender et al (2010)
state that many observers believe that top- level executive compensation is not sufficiently
linked to long-term corporate performance. There are several cases in which executive pay are
9
companies rose dramatically even though the companies were doing poorly and stock prices
were plummeting.
2.5 Factors influencing CEO compensation
There are various factors that the literature link to CEO compensation including board
structure, CEO tenure, shareholding structure, size of the firm, and the industry in which
the firm is operating. The literature related to each of these factors is reviewed below.
2.5.1 Board structure
The corporate governance reports focused interest on the company board’s remuneration
policy, monitoring role and underlined the input that non-executive directors can make to this
development (Cadbury, 1992; Greenbury, 1995; Hampel, 1998; King, 2002). Larger boards
and less independent non-executive directors were generally associated with higher CEO
remuneration packages (Coakley & Iliopoulou, 2006; Core et al., 1999).
On the other hand, Ozkan (2007) suggests that existence of non-executive directors does not
result in monitoring as advocated for and indicated by previous reports and studies. In his more
recent study, Ozkan (2011) finds that, non-executive directors’ share ownership has a negative
and significant impact on CEO compensation level suggesting that ownership can provide
incentives for non-executive directors to be more active in monitoring CEO compensation
packages. In South Africa a study by Crotty and Bonorchis (2006) found that, since JSE
announcement in 2002 that executive pay be disclosed publicly, a sharp upward movement in
CEO’s salaries has been seen which is not be aligned to performance of the firm but rather to
adjustments by firms’ remuneration committees to match what other CEO’s earn in the market.
The monitoring functions of the board are set up so that the principals’ and agents’ interests
are aligned and are not self-serving to the managers hence the monitoring practices should
correlate with firm performance.
2.5.2 CEO Tenure
Time horizon problems in determining CEO compensations may lead to ambiguity (Ozkan,
2011). Thus, on one hand CEOs with longer tenure might have more power to propose their
compensation packages while on the other might also have larger share ownership from the
previous share awards and options. A study in the UK revealed that CEOs had a low level
tenure due poor performance in share price and dividend income than for accounting profits
(Hillier et al., 2005).
10
2.5.3 Shareholding structure
There is anecdotal evidence that institutional investors have become more active in their
monitoring role. Hartzell and Starks (2003) and Sapp (2008) find that institutional investors,
through large shareholdings can exert greater pressure and play an active role in crafting and
influencing executive compensation. A study by Ozkan (2007) found that institutional
ownership has a significant and negative impact on the level of CEO compensation in the UK.
2.5.4 Size of the Firm
A positive correlation is observed between remuneration of an executive and the size of the
organisation (Finkelstein & Hambrick, 1997; Rosen, 1990). Wang et al. (2013) affirm this by
stating that, “CEOs in larger firms receive more total compensation than CEOs in smaller
firms”. In asserting this, Rosen (1990) assumes that talent is distributed proportionately to
hierarchy so that more capable persons are higher placed there by resulting in higher CEO pay
as the span of control grows larger.
2.5.5 Industry Effects, Diversification and International Operations
Multinational corporations tend to diversify into international operational units and are more
profitable than local units, it follows that it is difficult to monitor executive compensation in
different markets because diversification affects the complexity of the operating environment
(Carpenter et al., 2001). In mitigating this monitoring challenge, firms can use long-term
incentive plans in place of fixed pay (Jensen & Murphy, 1990).
Duru and Reeb (2002) note that industrial and international diversification tends to fuel the
agency problem as it gives executives remuneration power and a larger span of control
increasing business risk, operational complexity propagating monitoring difficulties which can
cause reduction in profit and subsequent loss in value . In contrast Wang et al. (2013) found
that a greater level of industrial diversification led to lower relative compensation due to the
dispersion of optional risk.
2.5.6 Other Factors
Sharp and Aling (2013) fingered immigration controls for high skilled foreigners and new
technologies in South Africa as having led to an artificial shortage of company executives
which has fuelled CEO remuneration.
2.6 Firm earnings, stock performance and CEO compensation structure
The constitution of CEO pay is a solution to the agency problem that is expected to result in
better firm performance (Jensen & Murphy, 1990). What kind of performance one would ask?
11
Early research indicat+es that size mattered rather than profitability as CEO compensation was
found to be more closely related to sales which is an indicator of firms that put much
importance in size (Roberts, 1959). In following empirical research (Deckop (1988); Lewellen
and Huntsman (1970)) concur that profit for compensation had become more prominent with
firms.
Executive remuneration may take any of these four forms or a combination; basic salary, long-
term incentive plans (LTIP’s), executive stock option schemes and accounting-based
performance bonuses these are all linked to firm earnings and stock price performance
(McColgan, 2001). While Baker et al. (1988) argued that the level of pay is industry
determined, but the way in which managers worked was a result of the composition of the
remuneration contract hence structure matters in management’s efficient resource allocation.
In concurrence McColgan (2001) states that management are supposed to get enough
motivation from comprehensive contracts of incentive in order to efficiently maximise value
for shareholders.
In an interesting examination Banker et al. (2013) found that although current salary (cash
component) was related to all measures of past performance, the bonus component was
negatively associated with past performance measures. This they attributed to the fact that past
performance shows an executive’s future ability reducing the severity of the adverse selection
problem. This results in higher salary (cash component) because unobservable ability is
predictive in the future. Jayaraman and Milbourn (2012) found that there is an incremental
factor in CEO’s pay-for-performance sensitivity with respect to stock prices as stock liquidity
increased. Further they observe that as stock liquidity increases, the equity based compensation
increases as well while cash based compensation declines in aggregate compensation. Their
findings are in concurrence with Bushman and Smith (2001) and Fang et al. (2009) who
observe an increased focus on equity type compensation.
Accounting performance and stock price performance have different effects on CEO
compensation. Boschen et al. (2003) found that unexpectedly good accounting performance is
initially related to higher CEO compensation, this initial increase is offset by lower pay in the
future. However, they found that CEO receives a substantial reward over the long run for an
unexpected increase in stock price performance. In a more recent paper, Wang et al. (2013)
also noted the incremental usefulness of accounting based performance measures over market
based ones in CEO remuneration contracting.

12
Chapter Summary
This chapter assesses previous literature on the relationship between CEO compensation and
accounting and stock price performance. Most of the research although comprehensive tends
to relate to developed nations scenarios with inferences for frontier and emerging markets being
difficult to be made using most of these studies. The academic research done locally has been
mostly theoretical and aggregative. The literature largely supports the notion of correcting the
agency problem through the pay for performance relationship. Chapter 3presents the
methodology used to assess this relationship in South Africa is presented.
13
CHAPTER 3 RESEARCH METHODOLOGY
3.1 Introduction
This chapter presents information about the sample and data sources used. It also outlines the
research design in evaluating pay-performance sensitivities. The experimental models used for
testing the relationship are discussed under research design. The chapter is organised as
follows: Section 3.2 presents data and data sources. Section 3.3 discusses experimental model
design using different measures including dividend and risk adjusted models. Chapter summary
concludes the chapter.
3.2 Data, Sample and Data Sources
Information on CEO compensation is obtained from Bloomberg ESG under the compensation
C-Suite Tab of the listed firms together with earnings and market value information.2 It is
notable, however, that insufficient disclosure continues to pest the JSE even though that
regulations clearly stipulate that CEO remuneration information should be publicly disclosed.
Suggestions by Grinstein et al. (2011) are that this signals ill corporate governance and is
frequent where there firms are trying to hide the reporting of perks.
The sample selection is restricted to all firms listed on the JSE, and the research period is six
years between 2008 and 2013 inclusive. The length of the research period was influenced by
the amount of compensation data available.3 The compensation measure includes salary (fixed
component of total compensation) and bonus based compensation (. Performance measures to
be used are ROE, ROA, and stock returns. As in Ittner et al. (2003) equity based compensation
as past performance incentive is used by forward looking shareholders who would want to
continue using shareholder return (RET) in the determination of CEO compensation as ROE
and ROA tend to look backward.
For firms to be included in the final sample the following conditions have to be met. First share
price information on a firm has to be available for a firm covering the six year period from
2008-2013. Firms that faced changes in CEO’s are excluded only on the year that he CEO left,
this is because normally a leaving executive receives a golden handshake which is not
2 Note that due to information asymmetry compensation data in South Africa can only be divided into salary and bonus components without specifying well whether this would be in form of share options, cash or any other form of compensation. This invariably affects the quality of the research. 3 The study is only relying on published compensation data which are post the King II regulation of 2002, the data shows that a significant number of firms started implementing the King recommendations in 2005 and beyond.
14
separately reported at that same instance an incoming executive receives a signing bonus as
well. Assessing a multi-period agent’s salary allows for assessment of full dynamics of the
executive compensation. Firms listed during the year, firms reporting in foreign currency
(where the rand is the local currency), firms where executives are paid by another company
and firms with missing data will be deleted from the sample as in Matolcsy & Wright (2011).
Resultantly 119 firms totalling 714 firm-years were observed in the study.
3.3 Research Design
The total sample is divided into two components of executive compensation for the regression;
companies that provide cash and equity based remuneration, and companies that pay cash only
to the CEO.4 It is however notable that reporting of equity based remuneration on the JSE of
stock related compensation remains opaque despite effort in legislation and regulation to
address the availability of such information to the investing public.
Control variables are used to control for CEO duality, gender, tenure and age. Literature
supports the control of these variables and particularly so with horizon related predictors (age
and tenure) because the older the CEO the higher likelihood that they will structure their own
salary. An incumbent executive is more treasured than a new one as the firm tends to
understand the agent’s abilities better. Resultantly horizon variables (tenure and age)’s relation
with firm performance is expected to be ambiguous (Banker et al., 2013; Murphy & Zabojnik,
2007; Ryan & Wiggins, 2001).
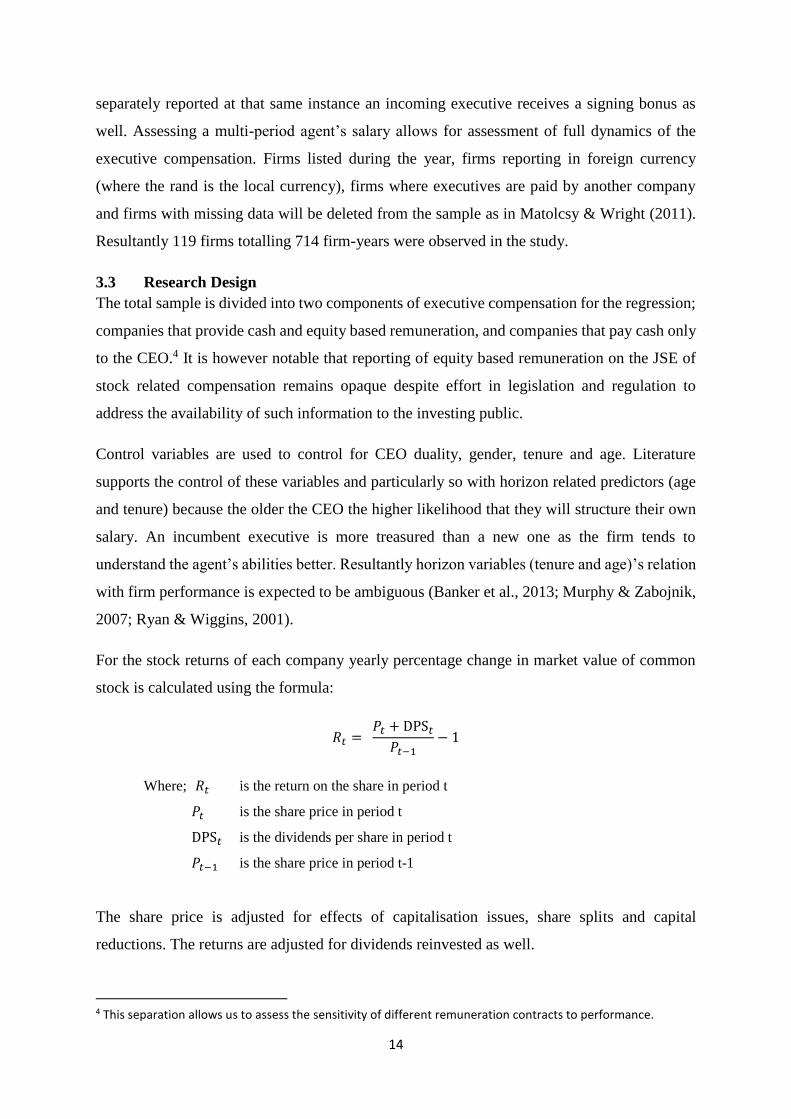
For the stock returns of each company yearly percentage change in market value of common
stock is calculated using the formula:
𝑅𝑡 = 𝑃𝑡 + DPS𝑡
𝑃𝑡−1− 1
Where; 𝑅𝑡 is the return on the share in period t
𝑃𝑡 is the share price in period t
DPS𝑡 is the dividends per share in period t
𝑃𝑡−1 is the share price in period t-1
The share price is adjusted for effects of capitalisation issues, share splits and capital
reductions. The returns are adjusted for dividends reinvested as well.
4 This separation allows us to assess the sensitivity of different remuneration contracts to performance.
15
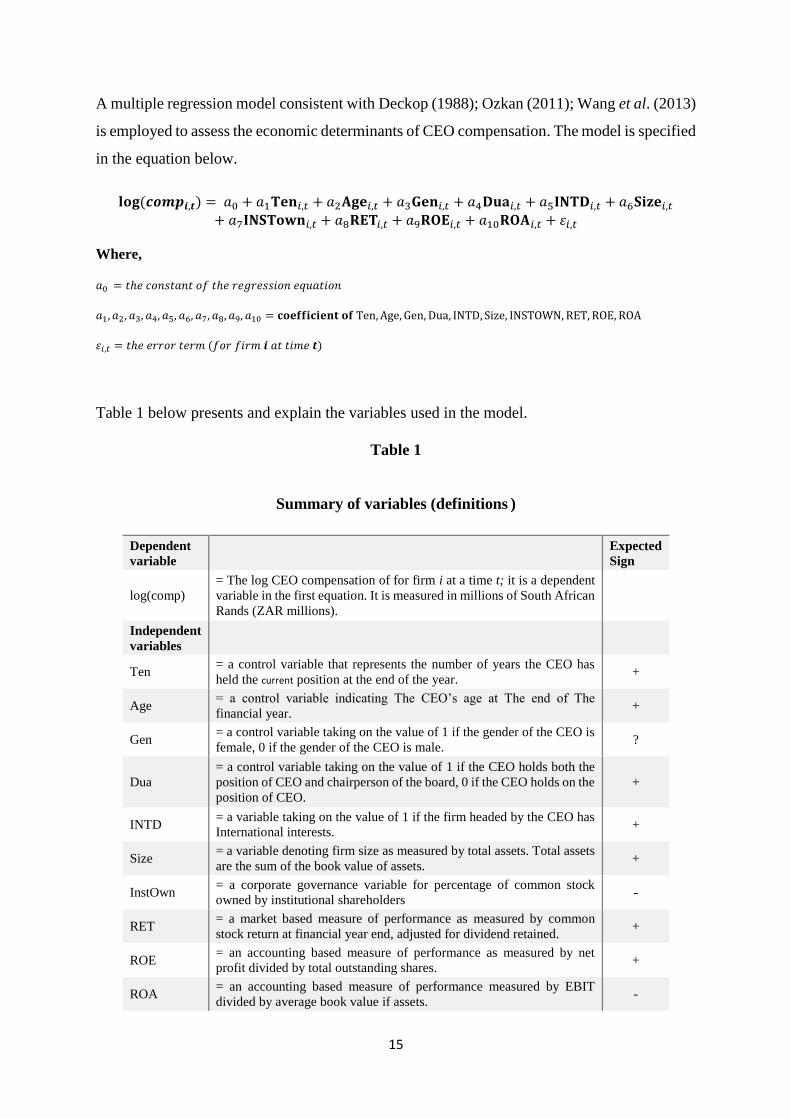
A multiple regression model consistent with Deckop (1988); Ozkan (2011); Wang et al. (2013)
is employed to assess the economic determinants of CEO compensation. The model is specified
in the equation below.
𝐥𝐨𝐠(𝒄𝒐𝒎𝒑𝒊,𝒕) = 𝑎0 + 𝑎1𝐓𝐞𝐧𝑖,𝑡 + 𝑎2𝐀𝐠𝐞𝑖,𝑡 + 𝑎3𝐆𝐞𝐧𝑖,𝑡 + 𝑎4𝐃𝐮𝐚𝑖,𝑡 + 𝑎5𝐈𝐍𝐓𝐃𝑖,𝑡 + 𝑎6𝐒𝐢𝐳𝐞𝑖,𝑡
+ 𝑎7𝐈𝐍𝐒𝐓𝐨𝐰𝐧𝑖,𝑡 + 𝑎8𝐑𝐄𝐓𝑖,𝑡 + 𝑎9𝐑𝐎𝐄𝑖,𝑡 + 𝑎10𝐑𝐎𝐀𝑖,𝑡 + 𝜀𝑖,𝑡
Where,
𝑎0 = 𝑡ℎ𝑒 𝑐𝑜𝑛𝑠𝑡𝑎𝑛𝑡 𝑜𝑓 𝑡ℎ𝑒 𝑟𝑒𝑔𝑟𝑒𝑠𝑠𝑖𝑜𝑛 𝑒𝑞𝑢𝑎𝑡𝑖𝑜𝑛
𝑎1, 𝑎2, 𝑎3, 𝑎4, 𝑎5, 𝑎6, 𝑎7, 𝑎8, 𝑎9, 𝑎10 = 𝐜𝐨𝐞𝐟𝐟𝐢𝐜𝐢𝐞𝐧𝐭 𝐨𝐟 Ten, Age, Gen, Dua, INTD, Size, INSTOWN, RET, ROE, ROA
𝜀𝑖,𝑡 = 𝑡ℎ𝑒 𝑒𝑟𝑟𝑜𝑟 𝑡𝑒𝑟𝑚 (𝑓𝑜𝑟 𝑓𝑖𝑟𝑚 𝒊 𝑎𝑡 𝑡𝑖𝑚𝑒 𝒕)
Table 1 below presents and explain the variables used in the model.
Table 1
Summary of variables (definitions )
Dependent
variable
Expected
Sign
log(comp)
= The log CEO compensation of for firm i at a time t; it is a dependent
variable in the first equation. It is measured in millions of South African
Rands (ZAR millions).
Independent
variables
Ten = a control variable that represents the number of years the CEO has
held the current position at the end of the year. +
Age = a control variable indicating The CEO’s age at The end of The
financial year. +
Gen = a control variable taking on the value of 1 if the gender of the CEO is
female, 0 if the gender of the CEO is male. ?
Dua
= a control variable taking on the value of 1 if the CEO holds both the
position of CEO and chairperson of the board, 0 if the CEO holds on the
position of CEO.
+
INTD = a variable taking on the value of 1 if the firm headed by the CEO has
International interests. +
Size = a variable denoting firm size as measured by total assets. Total assets
are the sum of the book value of assets. +
InstOwn = a corporate governance variable for percentage of common stock
owned by institutional shareholders -
RET = a market based measure of performance as measured by common
stock return at financial year end, adjusted for dividend retained. +
ROE = an accounting based measure of performance as measured by net
profit divided by total outstanding shares. +
ROA = an accounting based measure of performance measured by EBIT
divided by average book value if assets. -
16
3.3.1 Empirical Hypothesis
The thrust of this research is to advance the hypothesis that CEO compensation is existent to
align the interests of the executive with those of the investors and is accomplished by
associating the CEO’s compensation to the company’s stock price and accounting
performance. The study is developed on the notion that the presence of an agency problem does
not imply that firms, regulators and government cannot develop the framework to control the
effect of the agency problem.5
The hypotheses for this study are constructed on the propositions that firstly the total
concomitant compensation paid to a CEO is positively associated with ROE, ROA and
shareholder return. Secondly contemporaneous cash salary component of compensation is
positively associated with the three performance measures ROE, ROA and shareholder return.
Lastly the proposition that contemporaneous cash bonus to CEOs is positively related to ROE,
ROA and shareholder return. Hence is all the above discussed propositions a positive sign is
predicted in the hypotheses.
The above predictions, literature discussed and existing theories give a basis to elect nine
different hypothesis that relate to CEO pay-performance relationship.
The predictions would be:
Hypothesis 1:
𝐻0 ROE is positively related to total CEO compensation in South Africa.
Hypothesis 2:
𝐻0 ROA is positively related to total CEO compensation in South Africa.
Hypothesis 3:
𝐻0 Stock price performance is positively related to total CEO compensation in South Africa.
Hypothesis 4:
𝐻0 ROE is positively related to basic CEO salary in South Africa.
Hypothesis 5:
𝐻0 ROA is positively related to basic CEO salary in South Africa.
Hypothesis 6:
𝐻0 Stock price performance is positively related to basic CEO salary in South Africa.
Hypothesis 7:
5 The labour market, regulators and the firm’s internal mechanisms are set to help control the agency problem (Fama, 1980).
17
𝐻0 ROE is positively related to CEO cash bonuses in South Africa.
Hypothesis 8:
𝐻0 ROA is positively related to CEO cash bonuses in South Africa.
Hypothesis 9:
𝐻0 Stock price performance is positively related to CEO cash bonuses in South Africa.
Chapter Summary
In this chapter, sources of the data and sampling method are explained. The statistical
techniques applied to the data are described. An outline of the methodology applied on the data
is given. The research design involving the comparison of CEO remuneration with accounting
and stock price performance using the set regression models.
18
CHAPTER 4 PRESENTATION OF RESULTS
4.1 Introduction
This chapter reports the results of the multiple regression model and presents the descriptive
statistics of the data. The chapter arrangement is as follows. Section 4.2 summarises the
descriptive statistics of the data. 4.3 presents the results of the regression models used to
explore the relationship between CEO compensation and company performance, the chapter
summary concludes the chapter.
4.2 Descriptive Statistics
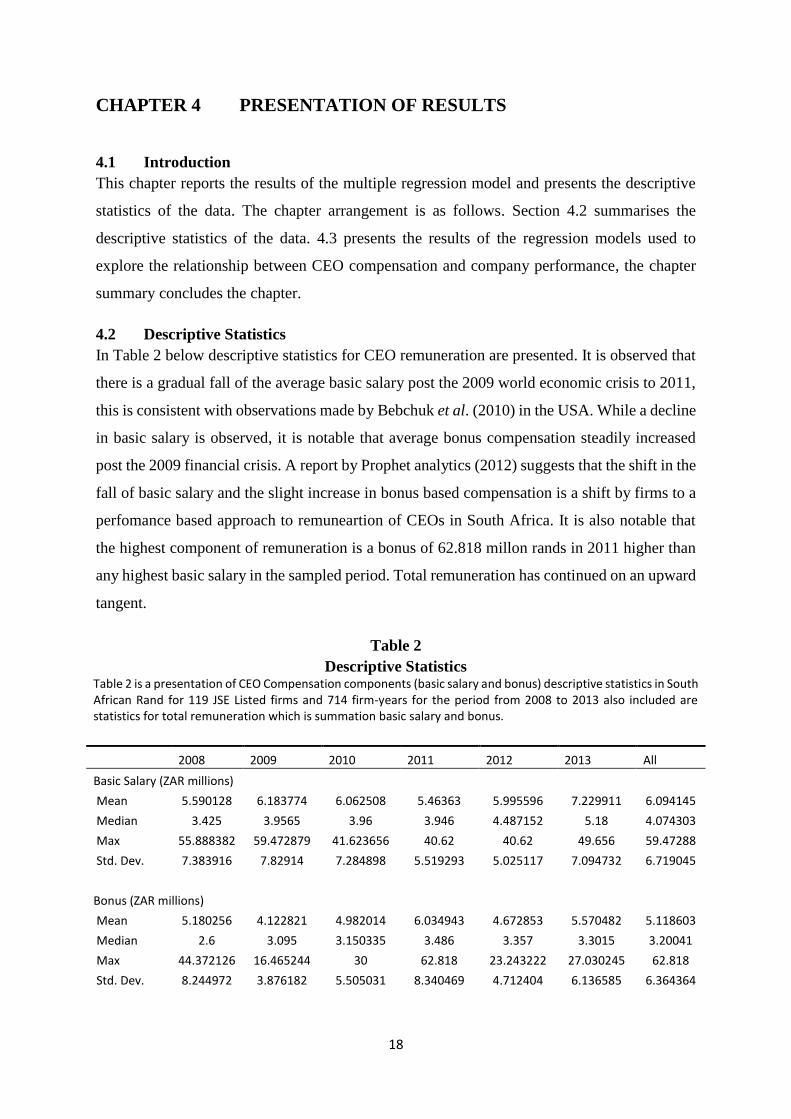
In Table 2 below descriptive statistics for CEO remuneration are presented. It is observed that
there is a gradual fall of the average basic salary post the 2009 world economic crisis to 2011,
this is consistent with observations made by Bebchuk et al. (2010) in the USA. While a decline
in basic salary is observed, it is notable that average bonus compensation steadily increased
post the 2009 financial crisis. A report by Prophet analytics (2012) suggests that the shift in the
fall of basic salary and the slight increase in bonus based compensation is a shift by firms to a
perfomance based approach to remuneartion of CEOs in South Africa. It is also notable that
the highest component of remuneration is a bonus of 62.818 millon rands in 2011 higher than
any highest basic salary in the sampled period. Total remuneration has continued on an upward
tangent.
Table 2
Descriptive Statistics Table 2 is a presentation of CEO Compensation components (basic salary and bonus) descriptive statistics in South African Rand for 119 JSE Listed firms and 714 firm-years for the period from 2008 to 2013 also included are statistics for total remuneration which is summation basic salary and bonus.
2008 2009 2010 2011 2012 2013 All
Basic Salary (ZAR millions)
Mean 5.590128 6.183774 6.062508 5.46363 5.995596 7.229911 6.094145
Median 3.425 3.9565 3.96 3.946 4.487152 5.18 4.074303
Max 55.888382 59.472879 41.623656 40.62 40.62 49.656 59.47288
Std. Dev. 7.383916 7.82914 7.284898 5.519293 5.025117 7.094732 6.719045
Bonus (ZAR millions)
Mean 5.180256 4.122821 4.982014 6.034943 4.672853 5.570482 5.118603
Median 2.6 3.095 3.150335 3.486 3.357 3.3015 3.20041
Max 44.372126 16.465244 30 62.818 23.243222 27.030245 62.818
Std. Dev. 8.244972 3.876182 5.505031 8.340469 4.712404 6.136585 6.364364
19
Total Remuneration (ZAR millions)
Mean 7.988764 7.760235 8.398399 9.679773 9.250346 10.933923 9.001907
Median 4.871311 5.83 5.955 6.795 7.85717 7.374733 6.2435
Max 63.216 59.472879 66.921 73.208 40.62 53.250597 73.208
Std. Dev. 11.555564 8.976965 10.084867 10.844386 7.803618 10.851035 10.12396
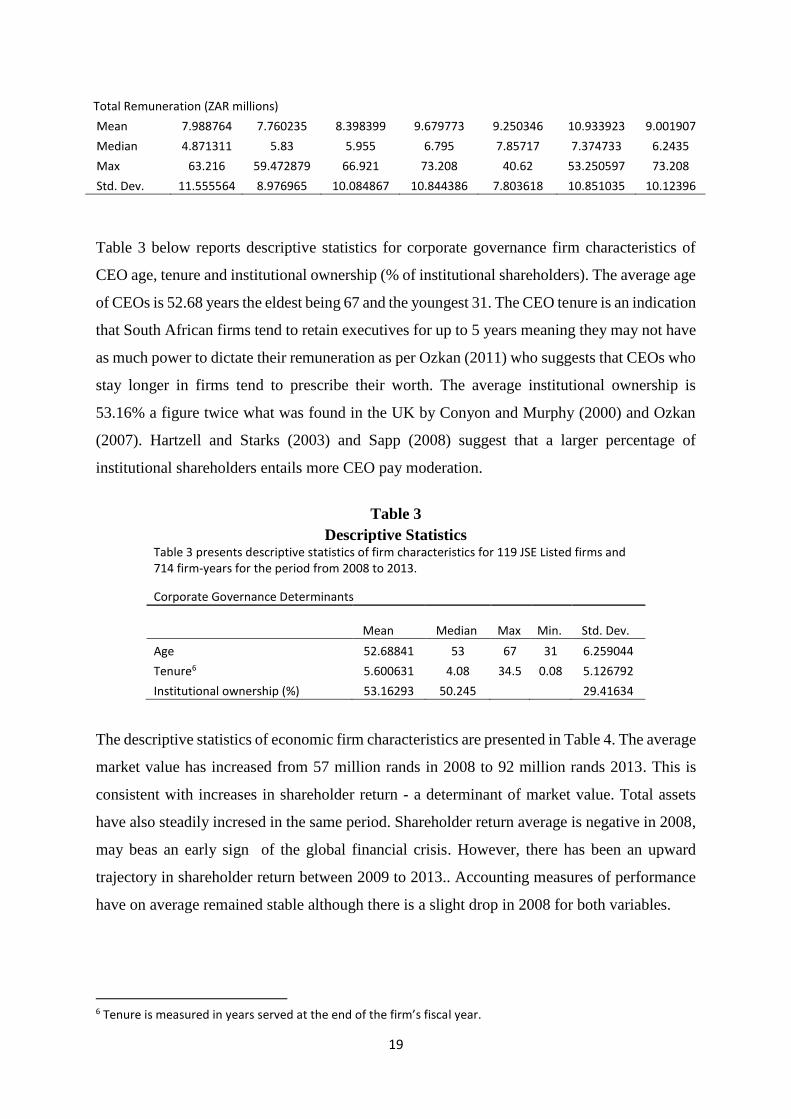
Table 3 below reports descriptive statistics for corporate governance firm characteristics of
CEO age, tenure and institutional ownership (% of institutional shareholders). The average age
of CEOs is 52.68 years the eldest being 67 and the youngest 31. The CEO tenure is an indication
that South African firms tend to retain executives for up to 5 years meaning they may not have
as much power to dictate their remuneration as per Ozkan (2011) who suggests that CEOs who
stay longer in firms tend to prescribe their worth. The average institutional ownership is
53.16% a figure twice what was found in the UK by Conyon and Murphy (2000) and Ozkan
(2007). Hartzell and Starks (2003) and Sapp (2008) suggest that a larger percentage of
institutional shareholders entails more CEO pay moderation.
Table 3
Descriptive Statistics Table 3 presents descriptive statistics of firm characteristics for 119 JSE Listed firms and 714 firm-years for the period from 2008 to 2013.
Corporate Governance Determinants
Mean Median Max
Min. Std. Dev.
Age 52.68841 53 67 31 6.259044
Tenure6 5.600631 4.08 34.5 0.08 5.126792
Institutional ownership (%) 53.16293 50.245 29.41634
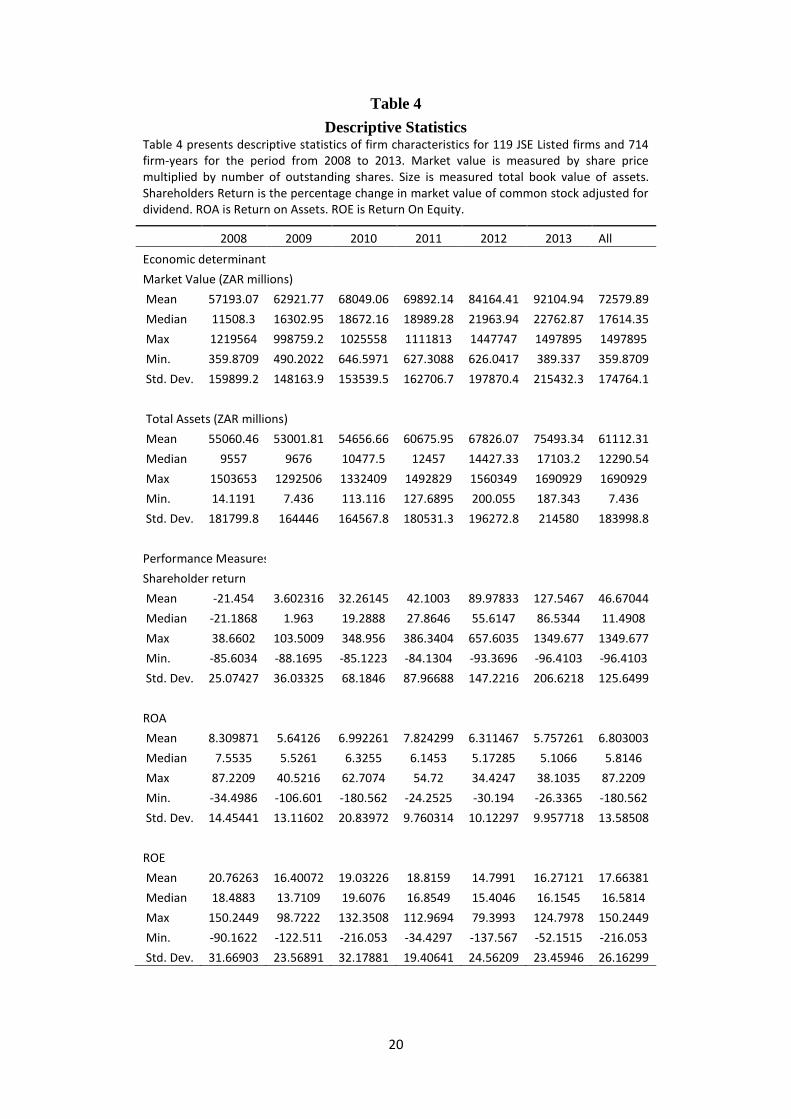
The descriptive statistics of economic firm characteristics are presented in Table 4. The average
market value has increased from 57 million rands in 2008 to 92 million rands 2013. This is
consistent with increases in shareholder return - a determinant of market value. Total assets
have also steadily incresed in the same period. Shareholder return average is negative in 2008,
may beas an early sign of the global financial crisis. However, there has been an upward
trajectory in shareholder return between 2009 to 2013.. Accounting measures of performance
have on average remained stable although there is a slight drop in 2008 for both variables.
6 Tenure is measured in years served at the end of the firm’s fiscal year.
20
Table 4
Descriptive Statistics Table 4 presents descriptive statistics of firm characteristics for 119 JSE Listed firms and 714 firm-years for the period from 2008 to 2013. Market value is measured by share price multiplied by number of outstanding shares. Size is measured total book value of assets. Shareholders Return is the percentage change in market value of common stock adjusted for dividend. ROA is Return on Assets. ROE is Return On Equity.
2008 2009 2010 2011 2012 2013 All
Economic determinants
Market Value (ZAR millions)
Mean 57193.07 62921.77 68049.06 69892.14 84164.41 92104.94 72579.89
Median 11508.3 16302.95 18672.16 18989.28 21963.94 22762.87 17614.35
Max 1219564 998759.2 1025558 1111813 1447747 1497895 1497895
Min. 359.8709 490.2022 646.5971 627.3088 626.0417 389.337 359.8709
Std. Dev. 159899.2 148163.9 153539.5 162706.7 197870.4 215432.3 174764.1
Total Assets (ZAR millions)
Mean 55060.46 53001.81 54656.66 60675.95 67826.07 75493.34 61112.31
Median 9557 9676 10477.5 12457 14427.33 17103.2 12290.54
Max 1503653 1292506 1332409 1492829 1560349 1690929 1690929
Min. 14.1191 7.436 113.116 127.6895 200.055 187.343 7.436
Std. Dev. 181799.8 164446 164567.8 180531.3 196272.8 214580 183998.8
Performance Measures
Shareholder return
Mean -21.454 3.602316 32.26145 42.1003 89.97833 127.5467 46.67044
Median -21.1868 1.963 19.2888 27.8646 55.6147 86.5344 11.4908
Max 38.6602 103.5009 348.956 386.3404 657.6035 1349.677 1349.677
Min. -85.6034 -88.1695 -85.1223 -84.1304 -93.3696 -96.4103 -96.4103
Std. Dev. 25.07427 36.03325 68.1846 87.96688 147.2216 206.6218 125.6499
ROA
Mean 8.309871 5.64126 6.992261 7.824299 6.311467 5.757261 6.803003
Median 7.5535 5.5261 6.3255 6.1453 5.17285 5.1066 5.8146
Max 87.2209 40.5216 62.7074 54.72 34.4247 38.1035 87.2209
Min. -34.4986 -106.601 -180.562 -24.2525 -30.194 -26.3365 -180.562
Std. Dev. 14.45441 13.11602 20.83972 9.760314 10.12297 9.957718 13.58508
ROE
Mean 20.76263 16.40072 19.03226 18.8159 14.7991 16.27121 17.66381
Median 18.4883 13.7109 19.6076 16.8549 15.4046 16.1545 16.5814
Max 150.2449 98.7222 132.3508 112.9694 79.3993 124.7978 150.2449
Min. -90.1622 -122.511 -216.053 -34.4297 -137.567 -52.1515 -216.053
Std. Dev. 31.66903 23.56891 32.17881 19.40641 24.56209 23.45946 26.16299
21
Increase in the performance measure shareholder return suggests that increase in total
remuneration is justified while accounting performance measures ROE and ROA have largely
remained flat over years.
4.3 Results
4.3.1 Regression Diagnostics
Multicollinearity makes it difficult to distinguish the proportional influences amongst
independent variables as it tends to cause large dispersions (variances and covariances) for the
regression estimators. Gujarati (2012) & Brooks (2014) suggest that to identify and overcome
this problem Pearson correlation has to be computed.
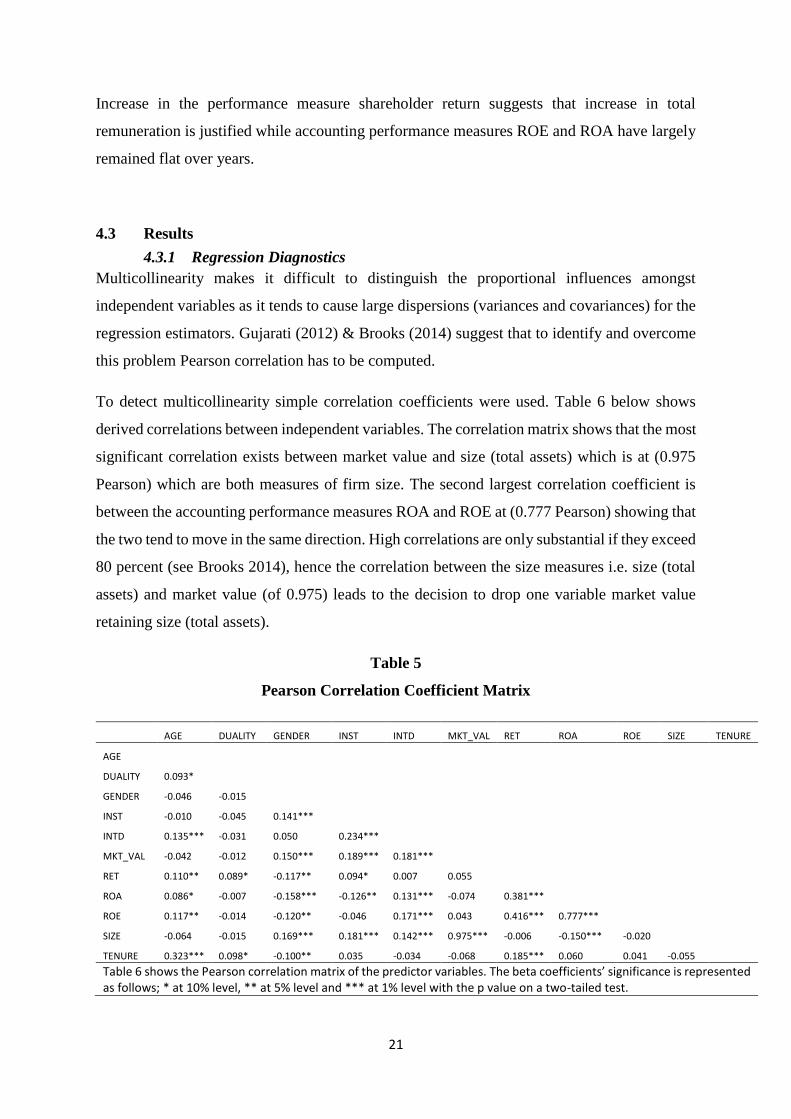
To detect multicollinearity simple correlation coefficients were used. Table 6 below shows
derived correlations between independent variables. The correlation matrix shows that the most
significant correlation exists between market value and size (total assets) which is at (0.975
Pearson) which are both measures of firm size. The second largest correlation coefficient is
between the accounting performance measures ROA and ROE at (0.777 Pearson) showing that
the two tend to move in the same direction. High correlations are only substantial if they exceed
80 percent (see Brooks 2014), hence the correlation between the size measures i.e. size (total
assets) and market value (of 0.975) leads to the decision to drop one variable market value
retaining size (total assets).
Table 5
Pearson Correlation Coefficient Matrix
AGE DUALITY GENDER INST INTD MKT_VAL RET ROA ROE SIZE TENURE
AGE
DUALITY 0.093*
GENDER -0.046 -0.015
INST -0.010 -0.045 0.141***
INTD 0.135*** -0.031 0.050 0.234***
MKT_VAL -0.042 -0.012 0.150*** 0.189*** 0.181***
RET 0.110** 0.089* -0.117** 0.094* 0.007 0.055
ROA 0.086* -0.007 -0.158*** -0.126** 0.131*** -0.074 0.381***
ROE 0.117** -0.014 -0.120** -0.046 0.171*** 0.043 0.416*** 0.777***
SIZE -0.064 -0.015 0.169*** 0.181*** 0.142*** 0.975*** -0.006 -0.150*** -0.020
TENURE 0.323*** 0.098* -0.100** 0.035 -0.034 -0.068 0.185*** 0.060 0.041 -0.055
Table 6 shows the Pearson correlation matrix of the predictor variables. The beta coefficients’ significance is represented as follows; * at 10% level, ** at 5% level and *** at 1% level with the p value on a two-tailed test.
22
The use of panel data is in itself a solution for the heteroskedasticity problem. To confirm that
no heteroskedasticity exists we ran the regressions with the entire data set in logs and compared
this to the results of the regression without logarithms which showed that they were very close
to one another. The researcher also performed the Wald test to test if the coefficients of
variables are equal to zero. The null hypothesis was rejected that the coefficients are equal to
zero basing on the probability value of the F-Statistic (p = 0.026 < p = 0.05), therefore it can
be concluded that the coefficients of variables are significantly different from zero.
4.3.2 The relationship between CEO compensation and corporate performance
The multiple regression model was used to test the hypotheses following a prior study by Wang
et al. (2013) to account for the effects of the control variables in the regression. Gujarati (2012)
states that independent variables in a hierarchical model can be nested into control variables
and other independent variables and entered at different intervals into the regression model so
that effects beyond and after the controls can be observed. In testing this model the Ordinary
Least Squares (OLS) is the method employed.
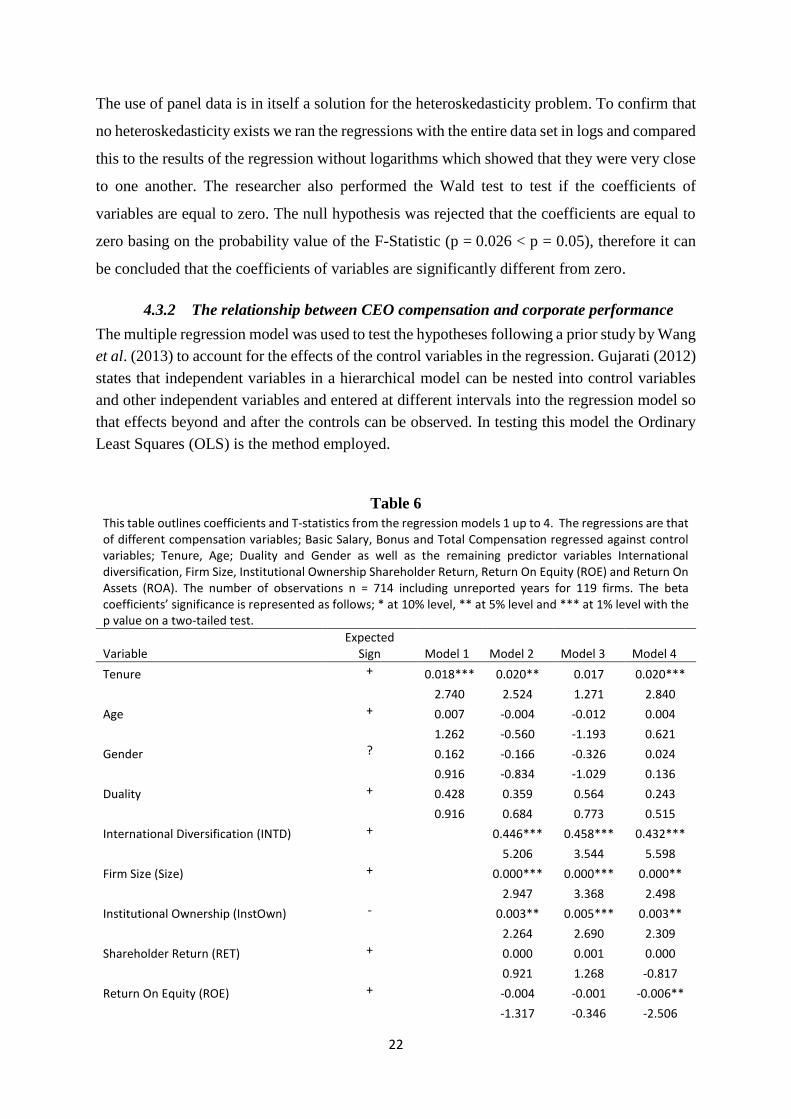
Table 6
This table outlines coefficients and T-statistics from the regression models 1 up to 4. The regressions are that of different compensation variables; Basic Salary, Bonus and Total Compensation regressed against control variables; Tenure, Age; Duality and Gender as well as the remaining predictor variables International diversification, Firm Size, Institutional Ownership Shareholder Return, Return On Equity (ROE) and Return On Assets (ROA). The number of observations n = 714 including unreported years for 119 firms. The beta coefficients’ significance is represented as follows; * at 10% level, ** at 5% level and *** at 1% level with the p value on a two-tailed test.
Variable Expected
Sign Model 1 Model 2 Model 3 Model 4
Tenure + 0.018*** 0.020** 0.017 0.020***
2.740 2.524 1.271 2.840
Age + 0.007 -0.004 -0.012 0.004
1.262 -0.560 -1.193 0.621
Gender ? 0.162 -0.166 -0.326 0.024
0.916 -0.834 -1.029 0.136
Duality + 0.428 0.359 0.564 0.243
0.916 0.684 0.773 0.515
International Diversification (INTD) + 0.446*** 0.458*** 0.432***
5.206 3.544 5.598
Firm Size (Size) + 0.000*** 0.000*** 0.000**
2.947 3.368 2.498
Institutional Ownership (InstOwn) - 0.003** 0.005*** 0.003**
2.264 2.690 2.309
Shareholder Return (RET) + 0.000 0.001 0.000
0.921 1.268 -0.817
Return On Equity (ROE) + -0.004 -0.001 -0.006**
-1.317 -0.346 -2.506
23
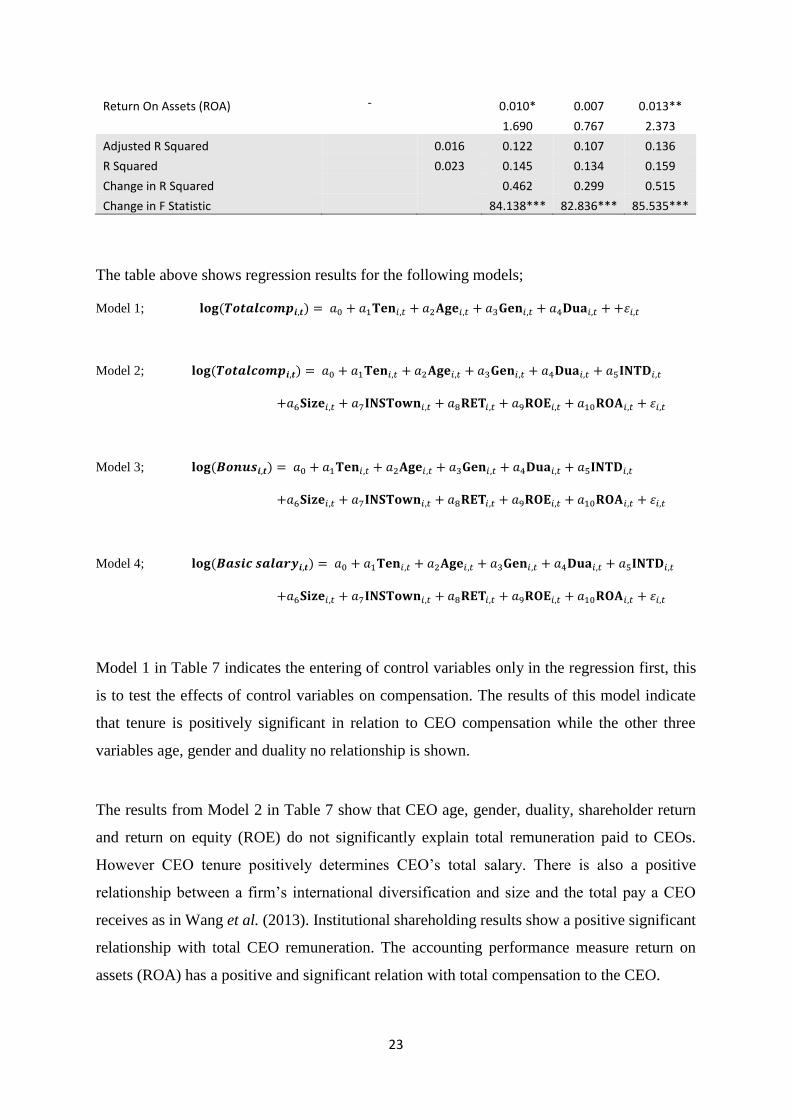
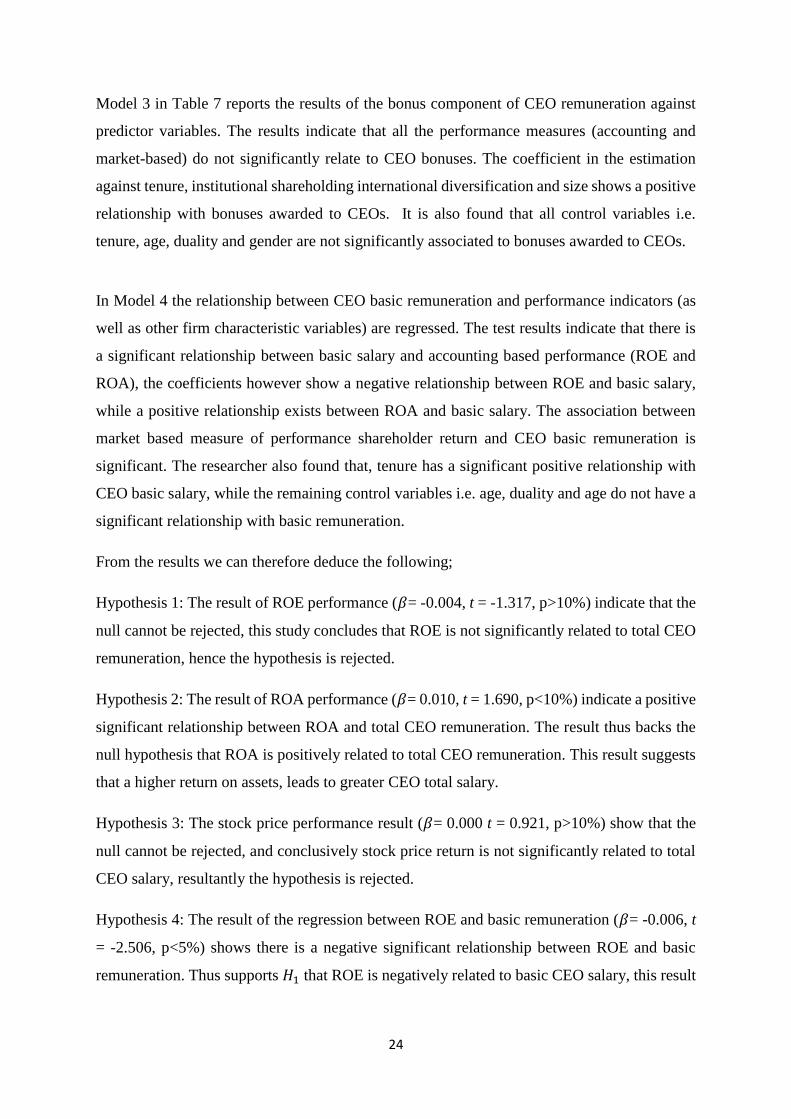
Return On Assets (ROA) - 0.010* 0.007 0.013**
1.690 0.767 2.373
Adjusted R Squared 0.016 0.122 0.107 0.136
R Squared 0.023 0.145 0.134 0.159
Change in R Squared 0.462 0.299 0.515
Change in F Statistic 84.138*** 82.836*** 85.535***
The table above shows regression results for the following models;
Model 1; 𝐥𝐨𝐠(𝑻𝒐𝒕𝒂𝒍𝒄𝒐𝒎𝒑𝒊,𝒕) = 𝑎0 + 𝑎1𝐓𝐞𝐧𝑖,𝑡 + 𝑎2𝐀𝐠𝐞𝑖,𝑡 + 𝑎3𝐆𝐞𝐧𝑖,𝑡 + 𝑎4𝐃𝐮𝐚𝑖,𝑡 + +𝜀𝑖,𝑡
Model 2; 𝐥𝐨𝐠(𝑻𝒐𝒕𝒂𝒍𝒄𝒐𝒎𝒑𝒊,𝒕) = 𝑎0 + 𝑎1𝐓𝐞𝐧𝑖,𝑡 + 𝑎2𝐀𝐠𝐞𝑖,𝑡 + 𝑎3𝐆𝐞𝐧𝑖,𝑡 + 𝑎4𝐃𝐮𝐚𝑖,𝑡 + 𝑎5𝐈𝐍𝐓𝐃𝑖,𝑡
+𝑎6𝐒𝐢𝐳𝐞𝑖,𝑡 + 𝑎7𝐈𝐍𝐒𝐓𝐨𝐰𝐧𝑖,𝑡 + 𝑎8𝐑𝐄𝐓𝑖,𝑡 + 𝑎9𝐑𝐎𝐄𝑖,𝑡 + 𝑎10𝐑𝐎𝐀𝑖,𝑡 + 𝜀𝑖,𝑡
Model 3; 𝐥𝐨𝐠(𝑩𝒐𝒏𝒖𝒔𝒊,𝒕) = 𝑎0 + 𝑎1𝐓𝐞𝐧𝑖,𝑡 + 𝑎2𝐀𝐠𝐞𝑖,𝑡 + 𝑎3𝐆𝐞𝐧𝑖,𝑡 + 𝑎4𝐃𝐮𝐚𝑖,𝑡 + 𝑎5𝐈𝐍𝐓𝐃𝑖,𝑡
+𝑎6𝐒𝐢𝐳𝐞𝑖,𝑡 + 𝑎7𝐈𝐍𝐒𝐓𝐨𝐰𝐧𝑖,𝑡 + 𝑎8𝐑𝐄𝐓𝑖,𝑡 + 𝑎9𝐑𝐎𝐄𝑖,𝑡 + 𝑎10𝐑𝐎𝐀𝑖,𝑡 + 𝜀𝑖,𝑡
Model 4; 𝐥𝐨𝐠(𝑩𝒂𝒔𝒊𝒄 𝒔𝒂𝒍𝒂𝒓𝒚𝒊,𝒕) = 𝑎0 + 𝑎1𝐓𝐞𝐧𝑖,𝑡 + 𝑎2𝐀𝐠𝐞𝑖,𝑡 + 𝑎3𝐆𝐞𝐧𝑖,𝑡 + 𝑎4𝐃𝐮𝐚𝑖,𝑡 + 𝑎5𝐈𝐍𝐓𝐃𝑖,𝑡
+𝑎6𝐒𝐢𝐳𝐞𝑖,𝑡 + 𝑎7𝐈𝐍𝐒𝐓𝐨𝐰𝐧𝑖,𝑡 + 𝑎8𝐑𝐄𝐓𝑖,𝑡 + 𝑎9𝐑𝐎𝐄𝑖,𝑡 + 𝑎10𝐑𝐎𝐀𝑖,𝑡 + 𝜀𝑖,𝑡
Model 1 in Table 7 indicates the entering of control variables only in the regression first, this
is to test the effects of control variables on compensation. The results of this model indicate
that tenure is positively significant in relation to CEO compensation while the other three
variables age, gender and duality no relationship is shown.
The results from Model 2 in Table 7 show that CEO age, gender, duality, shareholder return
and return on equity (ROE) do not significantly explain total remuneration paid to CEOs.
However CEO tenure positively determines CEO’s total salary. There is also a positive
relationship between a firm’s international diversification and size and the total pay a CEO
receives as in Wang et al. (2013). Institutional shareholding results show a positive significant
relationship with total CEO remuneration. The accounting performance measure return on
assets (ROA) has a positive and significant relation with total compensation to the CEO.
24
Model 3 in Table 7 reports the results of the bonus component of CEO remuneration against
predictor variables. The results indicate that all the performance measures (accounting and
market-based) do not significantly relate to CEO bonuses. The coefficient in the estimation
against tenure, institutional shareholding international diversification and size shows a positive
relationship with bonuses awarded to CEOs. It is also found that all control variables i.e.
tenure, age, duality and gender are not significantly associated to bonuses awarded to CEOs.
In Model 4 the relationship between CEO basic remuneration and performance indicators (as
well as other firm characteristic variables) are regressed. The test results indicate that there is
a significant relationship between basic salary and accounting based performance (ROE and
ROA), the coefficients however show a negative relationship between ROE and basic salary,
while a positive relationship exists between ROA and basic salary. The association between
market based measure of performance shareholder return and CEO basic remuneration is
significant. The researcher also found that, tenure has a significant positive relationship with
CEO basic salary, while the remaining control variables i.e. age, duality and age do not have a
significant relationship with basic remuneration.
From the results we can therefore deduce the following;
Hypothesis 1: The result of ROE performance (𝛽= -0.004, t = -1.317, p>10%) indicate that the
null cannot be rejected, this study concludes that ROE is not significantly related to total CEO
remuneration, hence the hypothesis is rejected.
Hypothesis 2: The result of ROA performance (𝛽= 0.010, t = 1.690, p<10%) indicate a positive
significant relationship between ROA and total CEO remuneration. The result thus backs the
null hypothesis that ROA is positively related to total CEO remuneration. This result suggests
that a higher return on assets, leads to greater CEO total salary.
Hypothesis 3: The stock price performance result (𝛽= 0.000 t = 0.921, p>10%) show that the
null cannot be rejected, and conclusively stock price return is not significantly related to total
CEO salary, resultantly the hypothesis is rejected.
Hypothesis 4: The result of the regression between ROE and basic remuneration (𝛽= -0.006, t
= -2.506, p<5%) shows there is a negative significant relationship between ROE and basic
remuneration. Thus supports 𝐻1 that ROE is negatively related to basic CEO salary, this result
25
exhibits that the higher the return on equity, the less the basic salary earned by CEOs in South
Africa.
Hypothesis 5: The result of ROA from model 4 (β= 0.013 t = 2.373, p<5%) is reflective of a
positive and significant relationship between ROA and basic remuneration. This outcome is
leads to acceptance of the null hypothesis that ROA is positively related to basic CEO
remuneration and means any increase in ROA leads to a higher CEO basic remuneration.
Hypothesis 6: The result from stock price performance (RET) (𝛽= 0.000, t = -0.817, p>10%)
show that the null cannot be rejected, and conclusively stock price return is not significantly
related to basic CEO salary, resultantly the hypothesis is rejected.
Hypothesis 7: The ROE result (𝛽= -0.001, t = -0.346, p>10%) in model 3 indicates that the
relationship between ROE and CEO cash bonus is statistically insignificant therefore the null
hypothesis is rejected.
Hypothesis 8: The ROA result (𝛽= 0.007, t = 0.767, p>10%) in model 3 indicates that the
relationship between ROA and CEO cash bonus is statistically insignificant therefore the null
hypothesis is rejected.
Hypothesis 9: The stock price performance (RET) result (𝛽= 0.001, t = 1.268, p>10%) in model
3 indicates that the relationship between stock price performance and CEO cash bonus is
statistically insignificant therefore the null hypothesis is rejected.
The results above leads one to making an inference that shareholder returns (the market
measure for performance) do not relate to the modelling CEO compensation i.e. cash bonuses,
basic remuneration and total salary. ROE does not have a significant impact on total
compensation and cash bonuses although a negative ROE seems to lead to higher basic CEO
remuneration in South Africa this is consistent with the findings of Ozkan (2007) although
contradicting a South African study by Scholtz & Smit (2012). ROA does not affect the
bonuses earned but higher ROA leads to increased basic salary and total earnings for CEOs.
Notably increased international diversification, firm size and institutional shareholding
strongly contribute to an increase in all forms of remuneration studied.
26
Chapter Summary
This chapter reports the results of the regression analysis of CEO compensation variables (total
remuneration, basic salary and cash bonuses) against performance variables (ROE, ROA and
shareholder return) as well as other firm characteristic variables. Moreover descriptive statistics
analysis on raw data was performed to assess trends of CEO pay and company performance.
Further, correlations of predictor variables where presented and an analysis of them made
before running the regression. Chapter five presents discussion, conclusions and
recommendations for further study from the presented outcomes.
27
CHAPTER 5 CONCLUSION AND RECOMMENDATIONS
5.1 Introduction
The preceding chapters introduced the research problem, reviewed the theoretical
underpinnings in relating CEO compensation to performance and findings of previous research,
they also derived and described the framework for examination of the problem and presented
the results of the study. The objective of this chapter is to close the study by presenting the
major findings of the research.
In Section 5.2 is a discussion of the major findings and their relation to literature, Section 5.3
concludes the the paper, 5.4 the recommendations for further research are provided ending the
paper with the chapter summary.
5.2 Discussion
Similar to Wang et. al (2013) the results in chapter four reflect that only accounting based
measures (ROA and ROE) are significantly associated with the fixed salary component of CEO
compensation although in this study the correlations go in different directions (ROA significant
and positive and ROE is negative and significant). The bonus component of CEO compensation
in South Africa shows no relation with performance. Consistent with Rosen (1992), and Sloan
(1993) we find that only ROA is has a significant in relation (positive) to the combined
compensation variable (Total compensation), however Boschen, et al (2003) say this does not
hold after observing long-run response. Shareholder return (RET) a market based measure of
firm performance was not significantly related to any compensation variable.
Although they were not amongst the objectives of the study, firm characteristic variables which
include international diversification and firm size are found to be positively correlated with
international diversification a large very strong the largest in the sample of variables this is
consistent with Denis, et al. (2002) and Fatemi (1984). Contary to Ozkan, (2011), we find that
there is a significant positive relationship between all forms of compensation and the
percentage of institutional shareholders. This unlike in Scholtz and Smit (2012) indicates a
weak monitoring role by stockholders post King III recommendations which state that that
remuneration policies must be tabled to and approved by shareholders. Surve (2008) suggests
that that institutional shareholders perceive the compensation paid to South African CEOs to
be a fair reflection of their value to their companies and therefore do not regulate it as expected.
28
This leads to the question: does the agency theory hold in South Africa? Ownership and control
were seperated to ensure directors work in best interest of shareholders and as a result it is
expected that positive correlation be found between corporate performace and CEO
compensation. The problem is, no relationship exists on CEO bonuses agaist any performance
measure and market return has no significant relationship to talk about while relatively low
correlation exists between ROA and basic salary as well as total salary.
The weak to non existent relationship between coporate performance and compensation the
study can be attributed to international diversification which leads most firms to being forced
to match international remuneration levels. As Duru & Reeb (2002) also allude, international
expansion and globalisation gives executives’ remuneration negotiation power, and this
coupled with a larger span of control, increasing business risk and operational complexity in
global markets all contribute to the trends observed in this study.
5.3 Conclusion
This study set out to examine the relationship between CEO compensation components (Total
Compensation, Salary and Bonus) and corporate performance (both accounting and stock
price). Our expectation was that, we find all compensation variables to be positively related to
both accounting and stock price performance. The results suggest that in South Africa only the
current return on assets (ROA) matters to the current fixed salary component and resultantly
the total remuneration, while the bonus component is not determined by company performance.
We observe as well that stock price performance (RET) is not a determinant of fixed salary and
cash bonuses nor the total compensation thereof. Unfortunately the researcher could not secure
data for options awards which could have reflected well with stock price performance.
Although not the main aim of this paper, the relationship between CEO remuneration and
international diversification reflected to be the most positively significant and had the highest
coefficient, showing that indeed performance is not the most influential variable in CEO pay
determinants in South Africa
The results indicate that there is still a need in South Africa to harmonise the relationship
between performance and pay of CEO’s through adaptation of the King III resolutions in
relation to executive pay.
5.4 Recommendations for Future Research
A number of avenues are available for further research on executive remuneration. Among
them the researcher recommends the following:
29
CEO pay-performance elasticity/sensitivity analysis.
International diversification, emerging markets, globalisation: An inquiry into CEO
compensation structures.
The relationship between mergers and acquisitions and executive compensation in
South Africa.
Industrial effects on executive compensation contracts.
Financial reporting systems and executive compensation.
The relationship between executive option awards and corporate performance in South
Africa.
The possible research topics are limitless although such studies may lead to unbundling of
various complexities in the South African Economy.
Chapter Summary
The research process is summarised in this chapter, the findings are discussed and conclusions
are drawn. An assessment of research objectives and research challenges is also compiled and
areas of possible future research are outlined as well.
30
APPENDIX 1
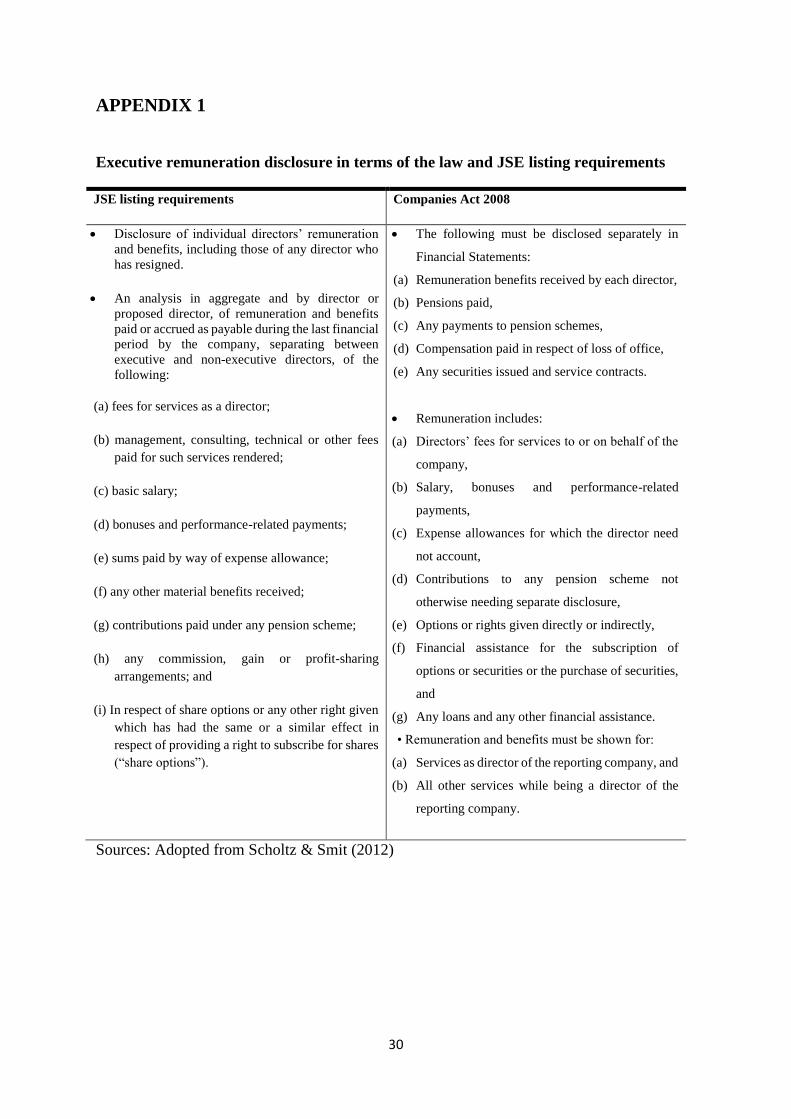
Executive remuneration disclosure in terms of the law and JSE listing requirements
JSE listing requirements Companies Act 2008
Disclosure of individual directors’ remuneration
and benefits, including those of any director who
has resigned.
An analysis in aggregate and by director or
proposed director, of remuneration and benefits
paid or accrued as payable during the last financial
period by the company, separating between
executive and non-executive directors, of the
following:
(a) fees for services as a director;
(b) management, consulting, technical or other fees
paid for such services rendered;
(c) basic salary;
(d) bonuses and performance-related payments;
(e) sums paid by way of expense allowance;
(f) any other material benefits received;
(g) contributions paid under any pension scheme;
(h) any commission, gain or profit-sharing
arrangements; and
(i) In respect of share options or any other right given
which has had the same or a similar effect in
respect of providing a right to subscribe for shares
(“share options”).
The following must be disclosed separately in
Financial Statements:
(a) Remuneration benefits received by each director,
(b) Pensions paid,
(c) Any payments to pension schemes,
(d) Compensation paid in respect of loss of office,
(e) Any securities issued and service contracts.
Remuneration includes:
(a) Directors’ fees for services to or on behalf of the
company,
(b) Salary, bonuses and performance-related
payments,
(c) Expense allowances for which the director need
not account,
(d) Contributions to any pension scheme not
otherwise needing separate disclosure,
(e) Options or rights given directly or indirectly,
(f) Financial assistance for the subscription of
options or securities or the purchase of securities,
and
(g) Any loans and any other financial assistance.
• Remuneration and benefits must be shown for:
(a) Services as director of the reporting company, and
(b) All other services while being a director of the
reporting company.
Sources: Adopted from Scholtz & Smit (2012)
31
REFERENCES
Agrawal, A., & Knoeber, C. R. (1996). Firm performance and mechanisms to control agency
problems between managers and shareholders. Journal of financial and quantitative
analysis, 31(03), 377-397.
Agrawal, R.K., & Samwick A. A. (1999) The other side of the trade off: The impact of risk
on executive compensation. Journal of Political Economy 107: 65-105.
Baker, G. P., Jensen, M. C., & Murphy, K. J. (1988). Compensation and incentives: Practice
vs. theory. The journal of Finance, 43(3), 593-616.
Banker, R. D., Darrough, M. N., Huang, R., & Plehn-Dujowich, J. M. (2013). The Relation
between CEO Compensation and Past Performance, The Accounting Review, pp. 1-30.
Retrieved from http://www.jstor.org/stable/41721933
Barris, L. J. (1992). Overcompensation Problem: A Collective Approach to Controlling
Executive Pay, The. Ind. LJ, 68, 59.
Barron, C. (2014, 18 May 2014). Amplats boss says sorry, Business Times.
Bebchuk, L. A., Cohen, A., & Spamann, H. (2010). Wages of Failure: Executive
Compensation at Bear Stearns and Lehman 2000-2008, The. Yale J. on Reg., 27, 257.
Bebchuk, L. A., & Fried, J. M. (2003). Executive Compensation as an Agency Problem. The
Journal of Economic Perspectives, 17(3), 71-92.
Bebchuk, L. A., & Fried, J. M. (2006). Pay without performance: The unfulfilled promise of
executive compensation: Harvard University Press.
Bebchuk, L. A., & Fried, J. M. (2010). Paying for long-term performance. University of
Pennsylvania Law Review, 1915-1959.
Bebchuk, L. A., & Spamann, H. (2009). Regulating bankers' pay. geo. Lj, 98, 247.
Berle, A. A., & Means, G. (1932). The modern corporation. Temporary National Economic
Committee, Distribution of Ownership in the, 200.
Bhagat, S., & Bolton, B. (2014). Financial crisis and bank executive incentive compensation.
Journal of Corporate Finance, 25, 313-341.
Boschen, J. F., Duru, A., Gordon, L. A., & Smith, K. J. (2003). Accounting and Stock Price
Performance in Dynamic CEO Compensation Arrangements. The Accounting Review,
78(1), 143-168.
Boschen, J. F., & Smith, K. J. (1995). You Can Pay Me Now and You Can Pay Me Later:
The Dynamic Response of Executive Compensation to Firm Performance. The
Journal of Business, 68(4), 577-608.
Brooks, C. (2014). Introductory econometrics for finance: Cambridge university press.
32
Bushman, R. M., & Smith, A. J. (2001). Financial accounting information and corporate
governance. Journal of accounting and Economics, 32(1), 237-333.
Cadbury, A. (1992). Report of the committee on the financial aspects of corporate
governance (Vol. 1): Gee.
Carpenter, M. A., Sanders, W. G., & Gregersen, H. B. (2001). Bundling human capital with
organizational context: The impact of international assignment experience on
multinational firm performance and CEO pay. Academy of Management Journal,
44(3), 493-511.
Coakley, J., & Iliopoulou, S. (2006). Bidder CEO and Other Executive Compensation in UK
M&As. European Financial Management, 12(4), 609-631.
Core, J. E., Holthausen, R. W., & Larcker, D. F. (1999). Corporate governance, chief
executive officer compensation, and firm performance. Journal of Financial
Economics, 51(3), 371-406.
Crocker, K. J., & Slemrod, J. (2007). The economics of earnings manipulation and
managerial compensation. The RAND Journal of Economics, 38(3), 698-713.
Crotty, A., & Bonorchis, R. (2006). Executive pay in South Africa: Who gets what and why:
Juta and Company Ltd.
Daily, C. M., Johnson, J. L., Ellstrand, A. E., & Dalton, D. R. (1998). Compensation
committee composition as a determinant of CEO compensation. Academy of
Management Journal, 41(2), 209-220.
Deckop, J. R. (1988). Determinants of Chief Executive Officer Compensation. Industrial and
Labor Relations Review, 41(2), 215-226.
Denis, D. J., Denis, D. K., & Yost, K. (2002). Global diversification, industrial
diversification, and firm value. The journal of Finance, 57(5), 1951-1979.
Duru, A., & Reeb, D. M. (2002). International diversification and analysts' forecast accuracy
and bias. The Accounting Review, 77(2), 415-433.
Fama, E. F. (1980). Agency Problems and the Theory of the Firm. Journal of Political
Economy, 88(2), 288-307.
Fang, V. W., Noe, T. H., & Tice, S. (2009). Stock market liquidity and firm value. Journal of
Financial Economics, 94(1), 150-169.
Fatemi, A. M. (1984). Shareholder benefits from corporate international diversification. The
journal of Finance, 39(5), 1325-1344.
33
Faulkender, M., Kadyrzhanova, D., Prabhala, N., & Senbet, L. (2010). Executive
compensation: An overview of research on corporate practices and proposed reforms.
Journal of Applied Corporate Finance, 22(1), 107-118.
Finkelstein, S., & Hambrick, D. C. (1988). Chief executive compensation: A synthesis and
reconciliation. Strategic Management Journal, 9(6), 543-558.
Finkelstein, S., & Hambrick, D. C. (1997). Review: Strategic Leadership: Top Executives
and Their Effects on Organizations. Australian Journal of Management.
Gómez-Mejía, L. R., & Balkin, D. B. (1992). Compensation, organizational strategy, and
firm performance: South-Western Pub.
Gujarati, D. N. (2012). Basic econometrics: Tata McGraw-Hill Education.
Greenbury, R. (1995). Greenbury Report. Directors’ Remuneration: Report of a Study Group
Chaired by Sir Richard Greenbury, 17.
Grinstein, Y., Weinbaum, D., & Yehuda, N. (2011). The economic consequences of perk
disclosure. Unpublished working paper. Cornell University and Syracuse University.
Hampel, R. (1998). Committee on Corporate Governance: Final Report. 1998. London: Gee.
Hartzell, J. C., & Starks, L. T. (2003). Institutional Investors and Executive Compensation.
Journal of Finance, 58(6), 2351-2374.
Hillier, D., Linn, S. C., & McColgan, P. (2005). Equity issuance, CEO turnover and corporate
governance. European Financial Management, 11(4), 515-538.
Ittner, C. D., Larcker, D. F., & Meyer, M. W. (2003). Subjectivity and the weighting of
performance measures: Evidence from a balanced scorecard. The Accounting Review,
78(3), 725-758.
Jayaraman, S., & Milbourn, T. T. (2012). The Role of Stock Liquidity in Executive
Compensation. The Accounting Review, 87(2), 537-563.
Jensen, M. C., & Meckling, W. H. (1976). Theory of the firm: managerial behavior, agency
costs and ownership structure. Journal of Financial Economics, 3(4), 305-360.
Jensen, M. C., & Murphy, K. J. (1990). CEO incentives—It’s not how much you pay, but
how. Harvard business review, 68(3), 138-153.
King. (2002). King Report on Corporate Governance for South Africa, 2002: Institute of
Directors in Southern Africa.
Lewellen, W. G., & Huntsman, B. (1970). Managerial pay and corporate performance. The
American Economic Review, 710-720.
Matolcsy, Z., & Wright, A. (2011). CEO compensation structure and firm performance.
Accounting & Finance, 51(3), 745-763.
34
McColgan, P. (2001). Agency theory and corporate governance: a review of the literature
from a UK perspective. Department of Accounting and Finance Working Paper, 6,
0203.
Murphy, K. J., & Zabojnik, J. (2007). Managerial capital and the market for CEOs. Available
at SSRN 984376.
Ozkan, N. (2007). Do corporate governance mechanisms influence CEO compensation? An
empirical investigation of UK companies. Journal of Multinational Financial
Management, 17(5), 349-364.
Ozkan, N. (2011). CEO Compensation and Firm Performance: an Empirical Investigation of
UK Panel Data. European Financial Management, 17(2), 260-285
PWC. (2013). Executive Directors’ Remuneration Practices and Trends Report. In G. Seegers
(Ed.), Practicices and Trends Report (Fifth Edition ed.). Johannesburg:
PriceWaterhouseCoopers South Africa.
Roberts, D. R. (1959). Executive compensation: Free Press.
Rosen, S. (1990). Contracts and the Market for Executives: National Bureau of Economic
Research.
Rosen, S. (1992). Contracts and the Market for Executives. In Contract Economics, edited by
L. Werin, and H. Wijkander, 181-211.
Ryan, H. E., & Wiggins, R. A. (2001). The influence of firm-and manager-specific
characteristics on the structure of executive compensation. Journal of Corporate
Finance, 7(2), 101-123.
Sapp, S. G. (2008). The Impact of Corporate Governance on Executive Compensation.
European Financial Management, 14(4), 710-746.
Scholtz, H. E., & Smit, A. (2012). Executive remuneration and company performance for
South African companies listed on the Alternative Exchange (AltX). 16(1), 22-38.
Schwab, K., & Sala-i-Martín, X. (2012). Insight Report: The Global Competitiveness Report
2012–2013. Paper presented at the Geneva: World Economic Forum.
Seccombe, A. (2014, 14 May 2014). Amplats CEO justifies his pay, Business Day.
Sharp, L., & Aling, P. (2013). South African CEO Remuneration Report 2013 Labour Market
Navigator (pp. 15). Johannesburg: Prophet Analytics.
Sloan, R. (1993). Sloan, R. G. (1993). Accounting earnings and top executive compensation.
Journal of accounting and Economics, 16(1), 55-100.
35
Surve, Y. (2008). The Effect of Institutional Shareholders on the level and mix of South
African Chief Executive Officers’ compensation. Masters Dessertation. University of
Witwatersrand.
Wang, H. C., Venezia, C. C., & Lou, Y.-I. (2013). Determinants of chief executive officer
compensation. The International Journal of Business and Finance Research, 7(4), 29-
42.
Recommended