This article was downloaded by: [Dalhousie University]On: 03 October 2014, At: 06:04Publisher: Taylor & FrancisInforma Ltd Registered in England and Wales Registered Number: 1072954 Registeredoffice: Mortimer House, 37-41 Mortimer Street, London W1T 3JH, UK
Enterprise Information SystemsPublication details, including instructions for authors andsubscription information:http://www.tandfonline.com/loi/teis20
The relationship of strategic businessalignment and enterprise informationmanagement in achieving betterbusiness performanceHonggeng Zhou a , David A. Collier b & Darryl D. Wilson ca Department of Decision Sciences , Whittemore School ofBusiness and Economics, University of New Hampshire , 15 CollegeRoad, Durham, New Hampshire, USAb Lutgert College of Business, Florida Gulf Coast University , FortMyers, Floridac Department of ITDS , College of Business and PublicAdministration, Old Dominion University , Norfolk, VirginiaPublished online: 03 Jul 2008.
To cite this article: Honggeng Zhou , David A. Collier & Darryl D. Wilson (2008) The relationship ofstrategic business alignment and enterprise information management in achieving better businessperformance, Enterprise Information Systems, 2:2, 201-220, DOI: 10.1080/17517570802095226
To link to this article: http://dx.doi.org/10.1080/17517570802095226
PLEASE SCROLL DOWN FOR ARTICLE
Taylor & Francis makes every effort to ensure the accuracy of all the information (the“Content”) contained in the publications on our platform. However, Taylor & Francis,our agents, and our licensors make no representations or warranties whatsoever as tothe accuracy, completeness, or suitability for any purpose of the Content. Any opinionsand views expressed in this publication are the opinions and views of the authors,and are not the views of or endorsed by Taylor & Francis. The accuracy of the Contentshould not be relied upon and should be independently verified with primary sourcesof information. Taylor and Francis shall not be liable for any losses, actions, claims,proceedings, demands, costs, expenses, damages, and other liabilities whatsoever orhowsoever caused arising directly or indirectly in connection with, in relation to or arisingout of the use of the Content.
This article may be used for research, teaching, and private study purposes. Anysubstantial or systematic reproduction, redistribution, reselling, loan, sub-licensing,systematic supply, or distribution in any form to anyone is expressly forbidden. Terms &

Conditions of access and use can be found at http://www.tandfonline.com/page/terms-and-conditions
Dow
nloa
ded
by [
Dal
hous
ie U
nive
rsity
] at
06:
04 0
3 O
ctob
er 2
014
Enterprise Information SystemsVol. 2, No. 2, May 2008, 219–237
The relationship of strategic business alignment and enterprise
information management in achieving better business performance
Honggeng Zhoua*, David A. Collierb and Darryl D. Wilsonc
aDepartment of Decision Sciences, Whittemore School of Business and Economics, University ofNew Hampshire, 15 College Road, Durham, New Hampshire, USA; bLutgert College of
Business, Florida Gulf Coast University, Fort Myers, Florida; cDepartment of ITDS, College ofBusiness and Public Administration, Old Dominion University, Norfolk, Virginia
(Received 1 October 2007; final version received 10 February 2008)
Four constructs are developed and five research hypotheses are tested in astructural equation model focused on the role of strategic business alignment andinformation management in achieving business performance. The data to developthe constructs and test the model are based on a survey of 226 manufacturingfirms in the US automobile components industry. The research is interdisciplinaryin nature with a focus on building theory in an under-researched area of study bytesting a causal model. The structural equation model analysis supports thegeneral theory that ‘the degree of business strategy alignment affects enterpriseinformation management and time-related operating performance, and throughthese two intermediate constructs, improves business performance’. Enterpriseinformation management is the key mediating variable in the causal model. Otherinsights based on statistical evidence are presented such as strategic businessalignment, which do not directly improve time-related operating performance butmust act indirectly through enterprise information management (the mediationconstruct) to improve performance.
Keywords: strategic business alignment; strategic enterprise management; strate-gic information management; enterprise information management; time-basedperformance; structural equation models; interdisciplinary
1. Introduction
Aligning the organisation’s business and information strategy is an important determinantfor market and financial success (Woolfe 1993, Chan et al. 1997). A time-based orientationalso plays a major role in determining a firm’s business performance (Blackburn 1991,Fairhurst 1992, Bruce 1998). In addition, one of the key characteristics of the MalcolmBaldrige National Quality Award (MBNQA) Criteria (NIST 2002, p. 7) is alignment asnoted by the following MBNQA statement: ‘The Criteria support a systems perspectivemaintaining organisation-wide goal alignment. Alignment in the Criteria is built aroundconnecting (cause-effect linkages) and reinforcing measures derived from your organisa-tion’s processes and strategy. These measures tie directly to stakeholder value and to
*Corresponding author. Email: [email protected]
ISSN 1751–7575 print/ISSN 1751–7583 online
� 2008 Taylor & Francis
DOI: 10.1080/17517570802095226
http://www.informaworld.com
Dow
nloa
ded
by [
Dal
hous
ie U
nive
rsity
] at
06:
04 0
3 O
ctob
er 2
014
overall performance. Such alignment ensures consistency of purpose while also supportingagility, innovation, and decentralised decision-making.’
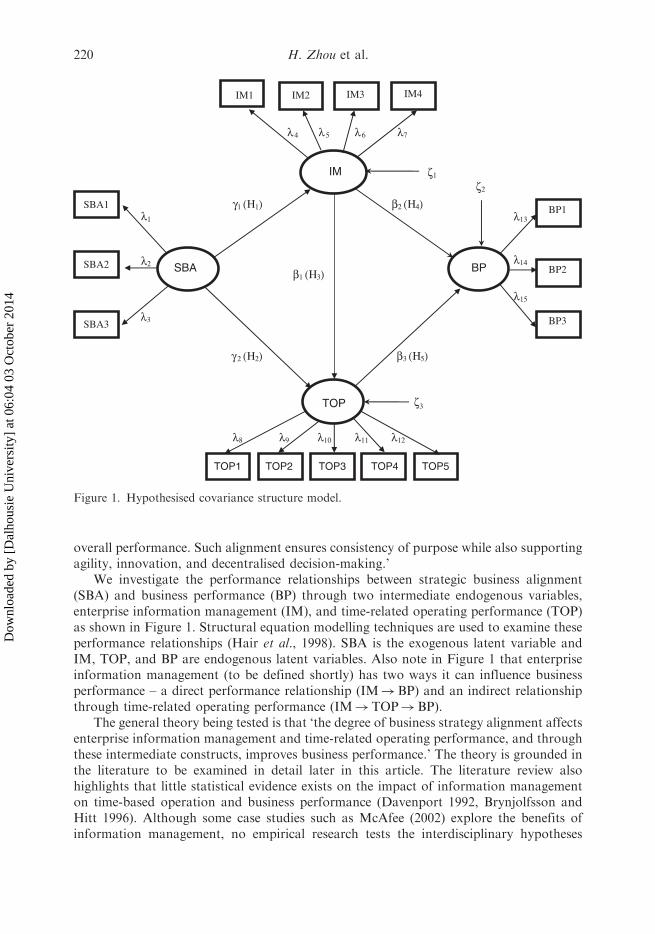
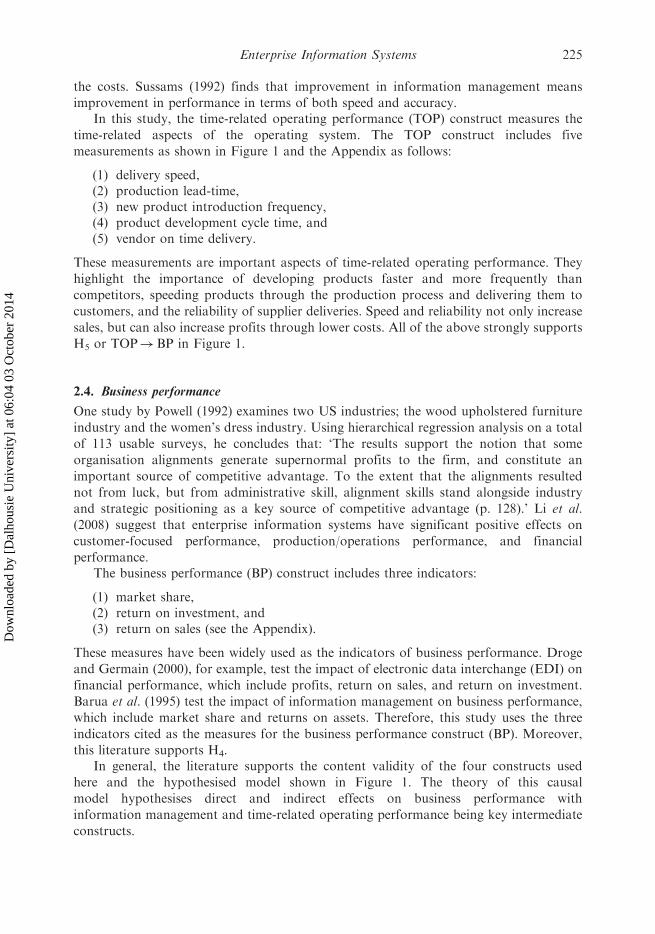
We investigate the performance relationships between strategic business alignment(SBA) and business performance (BP) through two intermediate endogenous variables,enterprise information management (IM), and time-related operating performance (TOP)as shown in Figure 1. Structural equation modelling techniques are used to examine theseperformance relationships (Hair et al., 1998). SBA is the exogenous latent variable andIM, TOP, and BP are endogenous latent variables. Also note in Figure 1 that enterpriseinformation management (to be defined shortly) has two ways it can influence businessperformance – a direct performance relationship (IM!BP) and an indirect relationshipthrough time-related operating performance (IM!TOP!BP).
The general theory being tested is that ‘the degree of business strategy alignment affectsenterprise information management and time-related operating performance, and throughthese intermediate constructs, improves business performance.’ The theory is grounded inthe literature to be examined in detail later in this article. The literature review alsohighlights that little statistical evidence exists on the impact of information managementon time-based operation and business performance (Davenport 1992, Brynjolfsson andHitt 1996). Although some case studies such as McAfee (2002) explore the benefits ofinformation management, no empirical research tests the interdisciplinary hypotheses
IM
TOP1
λ5 λ6 λ7
λ8 λ9 λ10 λ11 λ12
λ13
λ14
γ 1 (Η1)
γ 2 (Η2)
λ1
λ2
λ3
λ4
ζ 1
ζ 2
IM3 IM2 IM4
TOP2 TOP3 TOP4 TOP5
BP
λ15
β 2 (Η4)
β 1 (Η3)
β 3 (Η5)
ζ 3
SBA
TOP
IM1
BP1
BP2
BP3
SBA1
SBA2
SBA3
Figure 1. Hypothesised covariance structure model.
220 H. Zhou et al.
Dow
nloa
ded
by [
Dal
hous
ie U
nive
rsity
] at
06:
04 0
3 O
ctob
er 2
014
tested here. This study contributes to theory building, theory testing, and tointerdisciplinary research by subjecting the hypothesised causal model shown inFigure 1 to the rigorous statistical methods of structural equation modelling (Bollen1989, Bollen and Long 1993, Hair et al. 1998).
Also note in Figure 1 that a direct performance linkage between SBA and BP is nothypothesised because SBA alone accomplishes very little. That is, business strategyand alignment do not directly achieve business results but require execution of thestrategy through information management and time-related operating performance.As John Trani, head of General Electric’s medical systems business (Schneier et al.1991) states, ‘At best the plan and strategy is 20 percent of the game. Execution is80 percent of it.’
This article is organised in the following way. Section 2 presents a review of theliterature that establishes the content validity for the four constructs and provides supportfor the theory, research hypotheses, and the structural model. Section 3 describes thesample data and research methodology. Section 4 discusses the results of a structuralequation model analysis of the hypothesised model in Figure 1. The paper concludes witha summary and directions for future research.
2. Literature review and hypotheses
This research uses structural equation modelling to test the relationships among four keyconstructs (SBA, IM, TOP, and BP). Each construct has three to five indicators as shownin Figure 1 and the Appendix. The five research hypotheses shown in Figure 1 are stated asfollows:
H1: Strategic business alignment (SBA) has a positive statistically significant relationshipwith enterprise information management (IM). [�140]
H2: Strategic business alignment (SBA) has a positive statistically significant relationshipwith time-related operating performance (TOP). [�240]
H3: Enterprise information management (IM) has a positive statistically significantrelationship with time-related operating performance (TOP). [�140]
H4: Enterprise information management (IM) has a positive statistically significantrelationship with business performance (BP). [�240]
H5: Time-related operating performance (TOP) has a positive statistically significantrelationship with business performance (BP). [�340]
The literature review helps establish the content validity of each of the four constructs andprovides support for the five research hypotheses tested.
2.1. Strategic business alignment
The importance of alignment is firmly established in the literature. In addition, there ismuch evidence to support SBA being a key exogenous construct. For example, in an articletitled ‘The Age of Alignment,’ Berger et al. (1991) conclude that the Chief ExecutiveOfficer’s (CEO’s) job should be restructured and re-labelled as the ‘Chief AlignmentOfficer’. Gale and Wood (1994) argue that the primary reason total quality management(TQM) initiatives fail is due to lack of alignment. They cite 14 reasons why TQMinitiatives fail and then ask: ‘What do these reasons have in common?’ The answer is,
Enterprise Information Systems 221
Dow
nloa
ded
by [
Dal
hous
ie U
nive
rsity
] at
06:
04 0
3 O
ctob
er 2
014
‘People and processes in organisations that fail simply are not aligned to pursue the goal ofserving customers in a unified way.’
Several studies support the hypothesis that only when business strategies are alignedare information capabilities fully utilised (i.e. SBA! IM in Figure 1) (Li et al. 2008). Forexample, strategic information alignment, as described by Woolfe (1993), is the state inwhich the goals and activities of the business are in harmony with the information systemsthat support them. Henderson and Venkatraman (1993) propose a strategic alignmentmodel, which suggests that the choices made in business strategies will impact theinformation systems strategy. Chan et al. (1997) find that alignment between businessstrategic orientation and information system strategic orientation positively affects theinformation system effectiveness. Gupta et al. (1997) identify the need for establishing alink between a firm’s information management strategy and business strategy. They find adirect linkage between business strategy and information management.
The literature also documents that strategic business alignment contributes to beingfast and directly affecting time-related operating performance (i.e. SBA!TOP inFigure 1). Bruce (1998), for example, suggests that today’s hyper-competitive marketsbring pressure for firms to shorten the product life cycles and quickly increase time-basedoperational efficiencies. Droge and Germain (2000) study the influence of informationtechnology on electronic data interchange and time-based operation performance. Li et al.(2008) suggest that when enterprise information systems are integrated properly withmanufacturing infrastructure, they can support a firm’s market competitiveness, improveproduction performance, and achieve better financial results. Other studies examine theimpact of time-based practices on firm performance, such as Blackburn (1991), Fairhurst(1992), Bruce (1998), Koufterous et al. (1998), and Rondeau et al. (2000). Hence, there issubstantial support in the literature for H1 and H2.
The strategic business alignment (SBA) construct has three indicators:
(1) work unit performance measures linked to strategies,(2) short term strategic plans alignment, and(3) long-term strategic plans alignment (see the Appendix).
Linking work unit performance measures to the strategies of the organisation is animportant step to link business unit strategy to information management and time-relatedoperating performance results. Cross and Lynch (1992), for example, propose a paradigmcalled the performance pyramid, which contains the objectives and measures that link afirm’s daily operations to its strategic vision. The top level of the pyramid is theorganisation’s strategic vision. The second level is the business unit and includes keybusiness unit level performance measures such as market and financial performance(Li et al. 2008). The bottom level is the day-to-day operational measures, many of whichfocus on time-related performance. The study finds that the decision to emphasisea particular aspect of performance (time, cost, quality, etc.) depends on business unitstrategies and their alignment.
In the SBA construct, the second and third questions are about the alignment ofbusiness unit strategies over the short- and long-term, respectively. Among the alignmentof all business unit strategies, the alignment between manufacturing strategy andmarketing strategy is critical. Crittenden (1992) provides insights into the short-termalignment issue when he cites what managers say about the value of integrating theproduction and marketing information systems. For example, one marketing managersaid, ‘When both sides, marketing and production, see the profit implications of our
222 H. Zhou et al.
Dow
nloa
ded
by [
Dal
hous
ie U
nive
rsity
] at
06:
04 0
3 O
ctob
er 2
014
varying decisions, we begin to work together on a daily basis in a much better fashion.’
Hill (1994) suggests the use of product profiling to measure strategic long-term
misalignment. Bozarth and Edwards (1997) report the impact of market requirements
and manufacturing characteristics on plant performance. They find that a lack of focus in
either market requirements or manufacturing characteristics at the plant level leads to
poorer plant performance, and the impact of the market focus requirement on
manufacturing performance is mediated by some of the manufacturing characteristics
such as process choice and work-force skills.
2.2. Information management
The information management (IM) construct has four measures:
(1) aligning performance measure information for products and services with strategic
objectives,(2) training employees on data analysis techniques,(3) focusing information on key business drivers, and(4) integrating data from across the business unit to support business planning (see the
Appendix).
Here, the concept of information management includes both strategic and tactical criteria.The four IM construct measures highlight the role of alignment, employees, identifying
key business drivers, and integration across business units in defining information
management. Chan and Huff (1993) survey senior managers and find that the issue of
alignment is most important in how to align the company’s information systems strategy
with its business strategy. In addition, Chan et al. (1997) develop a conceptual model,
examining the relationships between the following five constructs: business strategic
orientation, information system strategic alignment, information system strategic
orientation, information system effectiveness, and business performance. The centrepiece
of their research is the hypothesis that information system strategic alignment leads to
improved information system effectiveness and business performance. Partial least squares
regressions and factor analyses are used to analyse the data. Path coefficients and bivariate
regression model R-squares are reported. Four of the path coefficients are positive and
statistically significant as hypothesised but the path coefficient from information system
strategic orientation to information system effectiveness is negative. The results find
a direct performance relationship from information system strategic alignment
and information system effectiveness to business performance, and therefore, support
H3 and H4.The employees’ ability to use the information systems is another determinant of
information management capability. No matter how good the strategy or information is, if
employees cannot use it, the strategy and information have little value. Li and Benton
(2006) indicate that the role of staff members in implementing technology is an integral
part of business performance. Crank (1997) finds that in the credit union industry, it is the
marriage of information technology and training employees that empowers people to
make the most of good information. Khalil and Elkordy (1999) find empirical evidence
that training contributes to the information system effectiveness. Training (1996) reveals
that the average organisation now devotes 25% of its total employee training budget to
teaching the use of computers and computer systems. Half of all information
Enterprise Information Systems 223
Dow
nloa
ded
by [
Dal
hous
ie U
nive
rsity
] at
06:
04 0
3 O
ctob
er 2
014
technology training dollars goes to outside suppliers who design and/or deliver employee
training.Enterprise information systems that focus on the key business drivers, one measure of
the IM construct, have been found to be important for information management success.
The third measure for the IM construct highlights key business drivers. For example,
Rockart (1979) proposes the critical success method for building information systems. The
critical success method focuses only on the key business drivers (and performance metrics)
that are critical to the success of the business.Information integration can enhance information capabilities, as captured by the
fourth survey question on IM. Under traditional information systems, different
functions in an organisation usually have their own information systems.
The information in different functional systems is frequently not consistent. The
inconsistency causes major problems when collaboration and speed across functions are
needed. Recognising that existing information systems in organisations are usually not
integrated, theoretical approaches for integrating functional databases have been
developed (Batini et al. 1986). Enterprise information integration results in improved
communication across functions (Galbraith 1973, Li et al. 2008). Lacking sufficient
data integration could cause delays, slow communications and process performance,
and could distort management decision-making. Linking separate information systems
into a networked information system can help to speed up product delivery and
improve customer satisfaction (Sweat 1999, Chopra and Meindl 2001, Xu et al. 2005,
Li and Zhao 2006, Xu 2006, Xu et al. 2006, Hou et al. 2007, Hsu and Wallace 2007,Staley and Warfield 2007, Warfield 2007, Xu 2007, Xu et al. 2007) which support H3.
In summary, the literature supports the content of the IM construct and the
formulation of H3 and H4.
2.3. Time-related operating performance
In the 1990s, time became more and more important in business competition. Theeffect of time-related operating performance on business performance is well
established in the literature (i.e. TOP!BP in Figure 1). Time-based competition is
focused on reducing time in every facet of the value chain from customer needs
analysis and final product development to post-sale maintenance and repair
(Abegglen and Stalk 1985). Blackburn (1991) describes many situations in
manufacturing firms to reduce time-related operating performance and thereby
improve overall business performance. The literature strongly supports H5 or
TOP!BP in Figure 1.Enterprise information management (IM) is the ‘enabler’ that makes the value chain
and its processes able to achieve dramatic improvements in time-related operating
performance, and ultimately, in business performance (i.e. H3 or IM!TOP in Figure 1).
Quick response capability is based on reducing development, production, order process,
and vendor delivery cycle time, and requires the synchronisation of information flow
(Forrest 1994). Schmitz (1999) finds that the use of product information managementtechnology cuts product development time. Co et al. (1998) provide a list of benefits from
implementing information system, including reduced manufacturing lead-time and time-
to-market. Burhanuddin and Randhawa (1992) reveal that a varied set of information and
analysis tools could shorten product development time and time-to-market, and reduce
224 H. Zhou et al.
Dow
nloa
ded
by [
Dal
hous
ie U
nive
rsity
] at
06:
04 0
3 O
ctob
er 2
014
the costs. Sussams (1992) finds that improvement in information management means
improvement in performance in terms of both speed and accuracy.In this study, the time-related operating performance (TOP) construct measures the
time-related aspects of the operating system. The TOP construct includes five
measurements as shown in Figure 1 and the Appendix as follows:
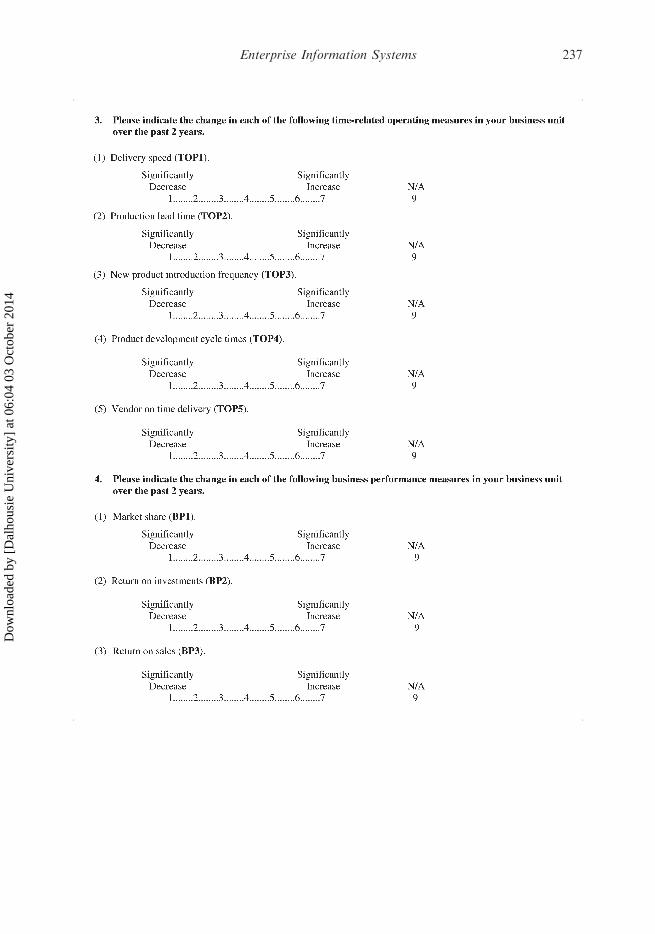
(1) delivery speed,(2) production lead-time,(3) new product introduction frequency,(4) product development cycle time, and(5) vendor on time delivery.
These measurements are important aspects of time-related operating performance. They
highlight the importance of developing products faster and more frequently than
competitors, speeding products through the production process and delivering them to
customers, and the reliability of supplier deliveries. Speed and reliability not only increase
sales, but can also increase profits through lower costs. All of the above strongly supports
H5 or TOP!BP in Figure 1.
2.4. Business performance
One study by Powell (1992) examines two US industries; the wood upholstered furniture
industry and the women’s dress industry. Using hierarchical regression analysis on a total
of 113 usable surveys, he concludes that: ‘The results support the notion that some
organisation alignments generate supernormal profits to the firm, and constitute an
important source of competitive advantage. To the extent that the alignments resulted
not from luck, but from administrative skill, alignment skills stand alongside industry
and strategic positioning as a key source of competitive advantage (p. 128).’ Li et al.
(2008) suggest that enterprise information systems have significant positive effects on
customer-focused performance, production/operations performance, and financial
performance.The business performance (BP) construct includes three indicators:
(1) market share,(2) return on investment, and(3) return on sales (see the Appendix).
These measures have been widely used as the indicators of business performance. Droge
and Germain (2000), for example, test the impact of electronic data interchange (EDI) on
financial performance, which include profits, return on sales, and return on investment.
Barua et al. (1995) test the impact of information management on business performance,
which include market share and returns on assets. Therefore, this study uses the three
indicators cited as the measures for the business performance construct (BP). Moreover,
this literature supports H4.In general, the literature supports the content validity of the four constructs used
here and the hypothesised model shown in Figure 1. The theory of this causal
model hypothesises direct and indirect effects on business performance with
information management and time-related operating performance being key intermediate
constructs.
Enterprise Information Systems 225
Dow
nloa
ded
by [
Dal
hous
ie U
nive
rsity
] at
06:
04 0
3 O
ctob
er 2
014
3. Research methodology
We begin this section by describing the sample population and final sample characteristics.Then we discuss the development of the four constructs – SBA, IM, TOP, and BP –including factor analysis results.
3.1. Data characteristics
The population for this study is manufacturing companies in the US automotivecomponents industry that were surveyed by mail. The target respondents for the surveywere plant managers. A list of 800 respondents was developed using the American Societyfor Quality (ASQ) Automotive Division membership directory. A total of 226 usablesurveys were received out of the 800 respondents. Of the remaining 574 potentialrespondents, 71 were no longer at the address indicated and nine were with companies thatprovided a service and had no manufacturing functions. The response rate for themain survey was 31.4% (226/(800-71-9)), which met the required response rate of 20%. Apilot survey was also mailed out to 128 Ohio manufacturing companies, 38 of which werecompleted and returned at a response rate of 29.7%. Improvements were made in the mainsurvey based on the results of the pilot study.
The average company size was 398 employees. The sample includes many industriessuch as non-metallic mineral, textile mill production, furniture and fixture, chemicals andallied products, rubber and plastic products, glass products, primary metal industries,fabricated metal products, electronic equipment, and instruments and related products.Eighteen percent of the respondents classified their manufacturing function as job shop,37% classified their processes as batch, 39% classified their processes as mass production,and 6% as continuous flow process. The automobile components industry is a diverseindustry as the previous characteristics document and their aggressive implement ofinformation management systems all along the value chain makes them a good samplingframe to test the causal model in Figure 1.
To check for inter-rater reliability, 51-second rater responses were obtained. Inter-raterreliability deals with the degree to which different respondents from the same companyagree on scale scores. Using scores from two raters, we tested the hypothesis that there wasno difference between the responses of the paired raters from each company. Conducting at test for the null hypothesis: �diff¼ 0 for each of the items, we found no significantdifference between any of the items used in this research. Based on the power table inCohen (1988), the minimum power of the t tests is larger than 0.90.
3.2. Construct development
Four constructs are developed from the 15 survey questions in order to examine theresearch hypotheses. Each construct is evaluated for content validity to ensure that theconstruct measures what it is intended to measure. In this study, the survey questions andconstructs are grounded in the literature. The content validity of the constructs used in thisstudy is persuasive. Three to five indicators as shown in Figure 1 and in the Appendixdefine each latent construct. Three to five indicators per construct are desirable forstructural equation modelling (Hair et al. 1998). Too few indicators may not represent theconstruct adequately, while too many indicators may result in difficulty in achievingadequate model fit (MacCallum et al. 1996). All survey questions use a 1–7 Likert scale,
226 H. Zhou et al.
Dow
nloa
ded
by [
Dal
hous
ie U
nive
rsity
] at
06:
04 0
3 O
ctob
er 2
014
all the scales are standardised, and the directions of the scales if reverse coded are adjusted
if necessary. In addition, the survey questions are randomised in order to reduce the
danger that the respondents are framed by previous questions. The scales were checked for
departures from normality, kurtosis, and skewness. All scales were found within
acceptable norms.Reliability measures the consistency among the scales used in the measurement of a
latent variable. Flynn et al. (1990) recommend using internal consistency as a measure of
reliability. A high degree of internal consistency implies a high degree of correlation
among the items in a construct. Cronbach’s alpha is a widely accepted measure for internal
consistency. A Cronbach’s alpha of 0.70 is suggested to be an acceptable minimum value
for an existing construct. A Cronbach’s alpha of 0.60 is suggested to be an acceptable
minimum value for a new construct that has not been empirically tested (Flynn et al. 1990).
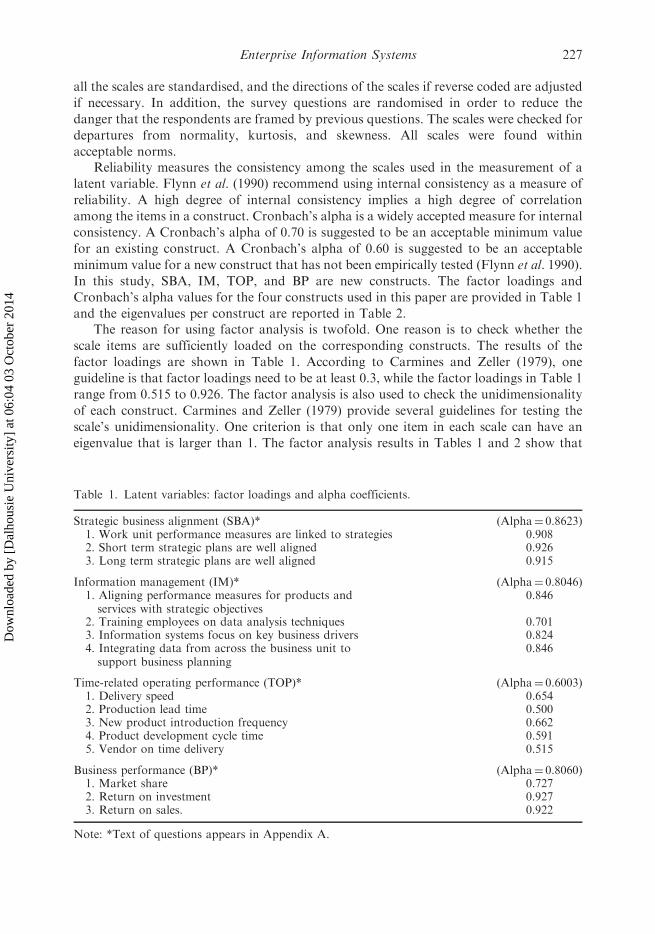
In this study, SBA, IM, TOP, and BP are new constructs. The factor loadings and
Cronbach’s alpha values for the four constructs used in this paper are provided in Table 1
and the eigenvalues per construct are reported in Table 2.The reason for using factor analysis is twofold. One reason is to check whether the
scale items are sufficiently loaded on the corresponding constructs. The results of the
factor loadings are shown in Table 1. According to Carmines and Zeller (1979), one
guideline is that factor loadings need to be at least 0.3, while the factor loadings in Table 1
range from 0.515 to 0.926. The factor analysis is also used to check the unidimensionality
of each construct. Carmines and Zeller (1979) provide several guidelines for testing the
scale’s unidimensionality. One criterion is that only one item in each scale can have an
eigenvalue that is larger than 1. The factor analysis results in Tables 1 and 2 show that
Table 1. Latent variables: factor loadings and alpha coefficients.
Strategic business alignment (SBA)* (Alpha¼ 0.8623)1. Work unit performance measures are linked to strategies 0.9082. Short term strategic plans are well aligned 0.9263. Long term strategic plans are well aligned 0.915
Information management (IM)* (Alpha¼ 0.8046)1. Aligning performance measures for products andservices with strategic objectives
0.846
2. Training employees on data analysis techniques 0.7013. Information systems focus on key business drivers 0.8244. Integrating data from across the business unit tosupport business planning
0.846
Time-related operating performance (TOP)* (Alpha¼ 0.6003)1. Delivery speed 0.6542. Production lead time 0.5003. New product introduction frequency 0.6624. Product development cycle time 0.5915. Vendor on time delivery 0.515
Business performance (BP)* (Alpha¼ 0.8060)1. Market share 0.7272. Return on investment 0.9273. Return on sales. 0.922
Note: *Text of questions appears in Appendix A.
Enterprise Information Systems 227
Dow
nloa
ded
by [
Dal
hous
ie U
nive
rsity
] at
06:
04 0
3 O
ctob
er 2
014
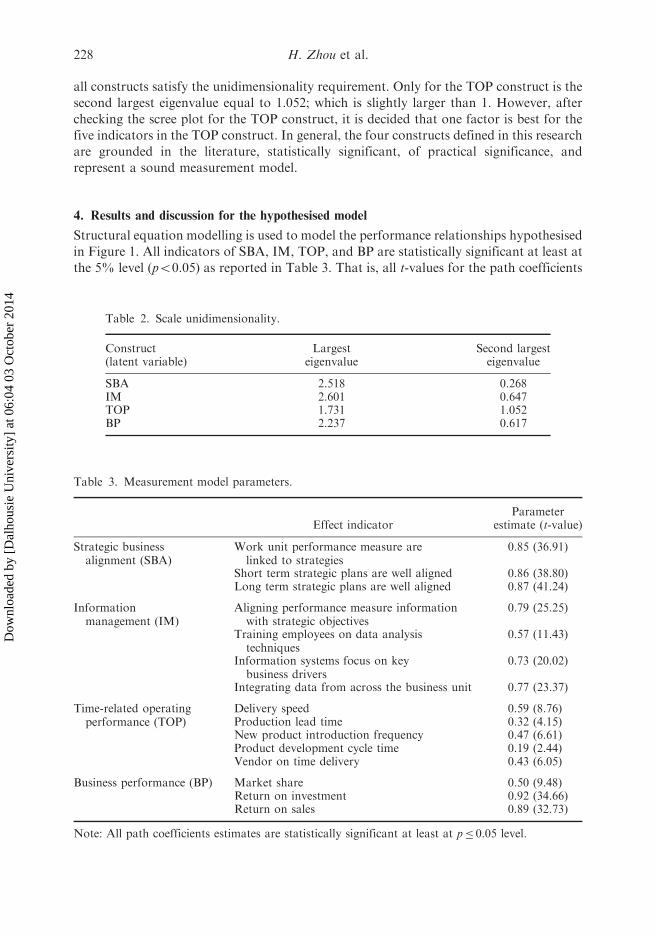
all constructs satisfy the unidimensionality requirement. Only for the TOP construct is the
second largest eigenvalue equal to 1.052; which is slightly larger than 1. However, after
checking the scree plot for the TOP construct, it is decided that one factor is best for the
five indicators in the TOP construct. In general, the four constructs defined in this research
are grounded in the literature, statistically significant, of practical significance, and
represent a sound measurement model.
4. Results and discussion for the hypothesised model
Structural equation modelling is used to model the performance relationships hypothesised
in Figure 1. All indicators of SBA, IM, TOP, and BP are statistically significant at least at
the 5% level (p50.05) as reported in Table 3. That is, all t-values for the path coefficients
Table 3. Measurement model parameters.
Effect indicatorParameter
estimate (t-value)
Strategic businessalignment (SBA)
Work unit performance measure arelinked to strategies
0.85 (36.91)
Short term strategic plans are well aligned 0.86 (38.80)Long term strategic plans are well aligned 0.87 (41.24)
Informationmanagement (IM)
Aligning performance measure informationwith strategic objectives
0.79 (25.25)
Training employees on data analysistechniques
0.57 (11.43)
Information systems focus on keybusiness drivers
0.73 (20.02)
Integrating data from across the business unit 0.77 (23.37)
Time-related operatingperformance (TOP)
Delivery speed 0.59 (8.76)Production lead time 0.32 (4.15)New product introduction frequency 0.47 (6.61)Product development cycle time 0.19 (2.44)Vendor on time delivery 0.43 (6.05)
Business performance (BP) Market share 0.50 (9.48)Return on investment 0.92 (34.66)Return on sales 0.89 (32.73)
Note: All path coefficients estimates are statistically significant at least at p� 0.05 level.
Table 2. Scale unidimensionality.
Construct(latent variable)
Largesteigenvalue
Second largesteigenvalue
SBA 2.518 0.268IM 2.601 0.647TOP 1.731 1.052BP 2.237 0.617
228 H. Zhou et al.
Dow
nloa
ded
by [
Dal
hous
ie U
nive
rsity
] at
06:
04 0
3 O
ctob
er 2
014
from the indicators to their corresponding latent constructs are statistically significant at
�� 0.05. Other evidence of a statistically significant measurement model is that the lower
bounds of the 90% confidence intervals for all the path coefficients from indicators to their
corresponding latent variables are larger than 0 (the 90% confidence intervals are not
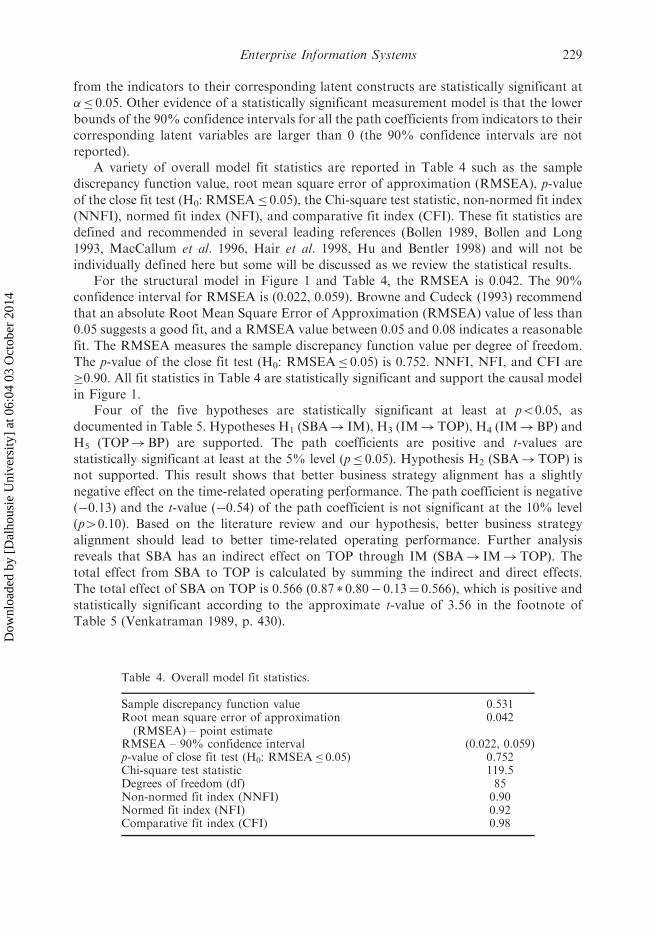
reported).A variety of overall model fit statistics are reported in Table 4 such as the sample
discrepancy function value, root mean square error of approximation (RMSEA), p-value
of the close fit test (H0: RMSEA� 0.05), the Chi-square test statistic, non-normed fit index
(NNFI), normed fit index (NFI), and comparative fit index (CFI). These fit statistics are
defined and recommended in several leading references (Bollen 1989, Bollen and Long
1993, MacCallum et al. 1996, Hair et al. 1998, Hu and Bentler 1998) and will not be
individually defined here but some will be discussed as we review the statistical results.For the structural model in Figure 1 and Table 4, the RMSEA is 0.042. The 90%
confidence interval for RMSEA is (0.022, 0.059). Browne and Cudeck (1993) recommend
that an absolute Root Mean Square Error of Approximation (RMSEA) value of less than
0.05 suggests a good fit, and a RMSEA value between 0.05 and 0.08 indicates a reasonable
fit. The RMSEA measures the sample discrepancy function value per degree of freedom.
The p-value of the close fit test (H0: RMSEA� 0.05) is 0.752. NNFI, NFI, and CFI are
�0.90. All fit statistics in Table 4 are statistically significant and support the causal model
in Figure 1.Four of the five hypotheses are statistically significant at least at p50.05, as
documented in Table 5. Hypotheses H1 (SBA! IM), H3 (IM!TOP), H4 (IM!BP) and
H5 (TOP!BP) are supported. The path coefficients are positive and t-values are
statistically significant at least at the 5% level (p� 0.05). Hypothesis H2 (SBA!TOP) is
not supported. This result shows that better business strategy alignment has a slightly
negative effect on the time-related operating performance. The path coefficient is negative
(�0.13) and the t-value (�0.54) of the path coefficient is not significant at the 10% level
(p40.10). Based on the literature review and our hypothesis, better business strategy
alignment should lead to better time-related operating performance. Further analysis
reveals that SBA has an indirect effect on TOP through IM (SBA! IM!TOP). The
total effect from SBA to TOP is calculated by summing the indirect and direct effects.
The total effect of SBA on TOP is 0.566 (0.87 * 0.80� 0.13¼ 0.566), which is positive and
statistically significant according to the approximate t-value of 3.56 in the footnote of
Table 5 (Venkatraman 1989, p. 430).
Table 4. Overall model fit statistics.
Sample discrepancy function value 0.531Root mean square error of approximation(RMSEA) – point estimate
0.042
RMSEA – 90% confidence interval (0.022, 0.059)p-value of close fit test (H0: RMSEA� 0.05) 0.752Chi-square test statistic 119.5Degrees of freedom (df) 85Non-normed fit index (NNFI) 0.90Normed fit index (NFI) 0.92Comparative fit index (CFI) 0.98
Enterprise Information Systems 229
Dow
nloa
ded
by [
Dal
hous
ie U
nive
rsity
] at
06:
04 0
3 O
ctob
er 2
014
The results from the statistical analysis are summarised and discussed as follows:
(1) This research develops two useful new constructs. The enterprise information
management (IM) construct has four measurements: (i) aligning performance
measure information for products and services with strategic objectives,
(ii) focusing information on key business drivers, (iii) training employees on data
analysis techniques, and (iv) integrating data from across the business unit to
support business planning. The time-related operating performance (TOP)
construct has five measurements: (i) delivery speed, (ii) production lead-time,
(iii) new product introduction frequency, (iv) product development cycle time, and
(v) vendor on time delivery. The two constructs prove to be valid and reliable
through this study. Future research in time-based competition and in information
management can use these two constructs and further validate the two constructs
in other industries or applications.(2) Improved strategic business alignment results in improved information manage-
ment. Authors such as Zemke and Schaaf (1989) based upon field research and
consulting experience find well-aligned strategies and performance measures the
key for business success. Their discussion and insights provide anecdotal evidence
and company case studies of the importance of strategic business alignment and
the role of communication and information systems to achieve superior market
and financial results. Our study contributes to theory development in this area by
providing statistical evidence (based on a large scale survey) to support their
anecdotal claims and H1 (SBA! IM, �140).(3) Improved information management fosters time-related operating performance
(H3: IM!TOP). To improve time-related operating performance (TOP) requires
that firms excel at information management which supports physical flows andother information dependent areas of the firm. For example, with timely
information, materials and parts can be delivered to the manufacturing area
directly rather than from supplier to warehouse to manufacturer. Many
practitioner articles and some academic studies have emphasised the importance
of information management in achieving time-based operational capability
Table 5. Estimated path coefficient statistics (see Figure 1).
Causal path Hypothesis
Path coefficientpoint
estimateStandarderror t-value
Statistically significant,valid and hypothesis
supported
SBA! IM H1 0.87 0.029 29.69* YesSBA!TOP H2 �0.13 0.243 �0.54 NoIM!TOP H3 0.80 0.242 3.31* YesIM!BP H4 0.31 0.122 2.49* YesTOP!BP H5 0.36 0.138 2.56* Yes
Notes: *Path coefficient estimates are statistically significant at least at p� 0.05 level. The total effectof SBA on TOP is 0.566 (0.87 * 0.80� 0.13¼ 0.566). The approximate t-value is
0:87 � 0:80ffiffiffiffiffiffiffiffiffiffiffiffiffiffiffiffiffiffiffiffiffiffiffiffiffiffiffiffiffiffiffiffiffiffiffiffiffiffiffiffiffiffiffiffiffiffiffiffiffiffiffiffiffiffiffiffiffiffiffiffiffiffi
0:872 � 0:0292 þ 0:802 � 0:2422p ¼ 3:56
(Venkatraman 1989, p. 430).
230 H. Zhou et al.
Dow
nloa
ded
by [
Dal
hous
ie U
nive
rsity
] at
06:
04 0
3 O
ctob
er 2
014
(Stalk and Hout 1990, Mason-Jones and Towill 1999). However, we are not awareof any study that shows a statistically significant and positive direct effect ofenterprise information management on time-related operating performance(IM!TOP, �140). These statistical results contribute to theory developmentby complementing past anecdotal evidence.
(4) Better enterprise information management improves business performance. Thisstudy shows that IM does have a positive and statistically significant direct effecton business performance and supports H4 (IM!BP, �240). Practitioners have tojustify their investment in information technology and know how to leverage it toget market and financial results. Estimating the cost of adopting and usinginformation technology is relatively easier and includes costs like labour, hardware,software and training. However, it is difficult to estimate the economic benefits ofusing information technologies, because many benefits are strategic such asimproved relationship with partners (Iacovou et al. 1994) and gaining competitiveadvantage (Bergeron 1994). Other benefits are intangible such as using informationsystem capabilities to speed up the firm’s decision-making process and facilitatecommunications within the firm, and across the firm’s value chain (Huber 1982).In addition, it is difficult to trace the cause and effect performance relationships.
(5) Improved time-related operating performance leads to better business perfor-mance. The anecdotal evidence has shown that improved time-related operatingperformance is usually associated with better business performance (Stalk andHout 1990, Blackburn 1992, Mason-Jones and Towill 1999). This studycomplements previous research by showing that TOP has a positive andstatistically significant direct effect on BP and the results support H5
(TOP!BP, �340). Time-related operating performance affects business perfor-mance in several ways. First, reduced cycle time can increase the asset turnoverrate, which directly increases the return on investment and the profit margin.Second, customers are demanding and getting shorter delivery time. When cycletimes throughout the firm are reduced, both profit margin and asset turnover ratesare likely to increase, which creates increased investment returns.
(6) Aligning business strategies does not directly improve time-related operatingperformance since H2 (SBA!TOP, �240) was not statistically significant.However, enterprise information management (IM) mediates the impact ofstrategic business alignment (SBA) on time-related operating performance(TOP). The total effect, SBA! IM!TOP, is statistically significant with acoefficient of 0.566 and a t-value of 3.56. The result also supports the conclusionthat the relative importance (i.e. path coefficients �i) of path IM!TOP (�1¼ 0.80)is greater than path IM!BP (�2¼ 0.31). The indirect effect of informationmanagement on business performance (IM!TOP!BP) is 0.288(0.80 * 0.36¼ 0.288). These statistical results confirm John Trani’s idea that theexecution of the strategy is much more important than the strategy itself in terms ofthe impact on performance (Schneier et al. 1991). Our results show that properinformation management is an important mediator (enabler) between strategyalignment and performance.
(7) In general, this study clearly identifies information management as one of theimportant factors needed to gain the economic benefits of business strategyalignment. The statistical results of this research confirm that improvedinformation management enables better time-based operating performance and
Enterprise Information Systems 231
Dow
nloa
ded
by [
Dal
hous
ie U
nive
rsity
] at
06:
04 0
3 O
ctob
er 2
014
business performance (see Figure 1). Previous studies such as Mason-Jones and
Towill (1999) propose an ‘information enriched’ supply (value) chain concept andmake a case for why information management is an enabler. Other studies such as
Srinivasan et al. (1994) have shown the enabling effect of information technologyon business performance. However, we are not aware of any large-scale survey
research that shows enterprise information management’s enabling effect on time-
based competition. To create superior business results, information managementmakes it happen.
5. Conclusions
As information management evolves, practitioners and researchers have increased needs to
evaluate the value of information in today’s competitive environment, and to learn how to
leverage enterprise information more effectively to improve market and financialperformance. The statistical results reported here provide insight into the direct and
indirect ways information management helps improve business performance and the roleof strategic alignment and time-based performance. The results of this research also
support the theory that a cross-functional approach to improvement, driven by strategic
business alignment, is required to achieve business success.This research uses structural equation modelling to study the complex performance
relationships between strategic business alignment (SBA), enterprise information manage-
ment (IM), time-related operating performance (TOP), and business performance (BP).The statistically significant causal model in Figure 1 supports the general theory that,
‘the degree of business strategy alignment affects enterprise information management andtime-related operating performance, and through these two intermediate constructs,
improves business performance’. More detailed conclusions have been previouslydiscussed.
Since the sample size of our study is 226 and the degree of freedom is 85, the power
of the model fit test is 0.956, which exceeds the suggested cut-off level of 0.80
(MacCallum et al. 1996). The large sample size and large power of the model fit testsupport the overall findings in this research. One future research opportunity is to test
whether the causal structure in Figure 1 is supported in other industries and othercountries.
References
Abegglen, J. and Stalk, G., 1985. Kaisha, the Japanese corporation. New York, NY: Basic Books.Barua, A., Kriebel, C., and Mukhopadhyay, T., 1995. Information technologies and business value:
an analytical and empirical investigation. Information Systems Research, 6 (1), 3–23.Batini, C., Lenzerini, M., and Navathe, S., 1986. A comparative analysis of methodologies for
database schema integration. ACM Computing Surveys, 18 (4), 323–364.
Berger, L., et al., 1991. The age of alignment. Directors and Boards, 16 (1), 13–16.Bergeron, M. 1994. Measuring the business value of information technology: the case of financial
electronic data interchange EDI) in Canada. Dissertation (PhD). Faculty of Commerce and
Business Administration, University of British Columbia, Vancouver, Canada.Blackburn, J., 1991. Time-based competition: The next battleground in American manufacturing.
Homewood, IL: Business One Irwin.
232 H. Zhou et al.
Dow
nloa
ded
by [
Dal
hous
ie U
nive
rsity
] at
06:
04 0
3 O
ctob
er 2
014
Blackburn, J., 1992. Time-based competition: white collar activities. Business Horizons, 35 (4),
96–101.Bollen, K.A., 1989. Structural equations with latent variables. New York, NY: Wiley.Bollen, K.A. and Long, J.S., 1993. Testing structural equation models. Newbury Park, CA:
Sage Publications.Bozarth, C. and Edwards, S., 1997. The impact of market requirements focus and manufacturing
characteristics focus on plant performance. Journal of Operations Management, 15 (3),
161–180.
Browne, M. and Cudeck, R., 1993. Alternative ways of assessing model fit. In: K.A. Bollen
and J.S. Long, eds. Testing structural equation models. Newbury Park, CA: Sage
Publications.Bruce, K., 1998. Can you align IT with business strategy?. Strategy & Leadership, 26 (5), 16–21.
Brynjolfsson, E. and Hitt, L., 1996. Paradox lost? Firm-level evidence on the returns to information
systems spending. Management Science, 42 (4), 541–558.Burhanuddin, S. and Randhawa, S., 1992. A framework for integrating manufacturing process
design and analysis. Computers and Industrial Engineering, 23 (1–4), 27–30.
Carmines, E. and Zeller, R., 1979. Reliability and validity assessment. Beverly Hills, CA: Sage
Publications.Chan, Y. and Huff, S., 1993. Strategic information systems alignment. Business Quarterly, 58 (1),
51–55.Chan, Y., et al., 1997. Business strategic orientation, information system strategic orientation, and
strategic alignment. Information Systems Research, 8 (2), 125–150.Chopra, S. and Meindl, P., 2001. Supply chain management: Strategy, planning, and operation. Upper
Saddle River, NJ: Prentice Hall.Co, H., Patuwo, E., and Hu, M., 1998. The human factor in advanced manufacturing technology
adoption: an empirical analysis. International Journal of Operations and Production
Management, 18 (1), 87–106.
Cohen, J., 1988. Statistical power analysis for the behavioral sciences. Hillsdale, NJ: L. Erlbaum
Associates.Crank, L., 1997. MCIFs: marrying training and technology. Credit Union Executive, 37 (4), 20–22.Crittenden, V., 1992. Closing the marketing/manufacturing gap. Sloan Management Review, 33 (3),
41–52.Cross, K. and Lynch, R., 1992. For good measure. CMA, 66 (3), 20–23.Davenport, T.H., 1992. Process innovation: Reengineering work through information technology.
Boston, MA: Harvard Business School Press.Droge, C. and Germain, R., 2000. The relationship of electronic data interchange with inventory and
financial performance. Journal of Business Logistics, 21 (2), 209–230.Fairhurst, A., 1992. Time in your hands. Work Study, 41 (1), 6–10.
Forrest, D., 1994. Quick response brings retailers up to speed. Computing Canada, 20 (11), 23.Flynn, B., et al., 1990. Empirical research method in operation management. Journal of Operations
Management, 9 (2), 250–284.
Galbraith, J., 1973. Designing complex organizations. Reading, MA: Addison-Wesley.Gale, B.T. and Wood, R.C., 1994. Managing customer value: Creating quality and service that
customers can see. New York, NY: Free Press.Gupta, Y., Karimi, J., and Somers, T., 1997. Alignment of a firm’s competitive strategy and
information technology management sophistication: the missing link. IEEE Transactions on
Engineering Management, 44 (4), 399–413.Hair Jr, J., Anderson, R., Tatham, R., and Black, W., 1998.Multivariate data analysis. Upper Saddle
River, NJ: Prentice Hall.
Henderson, J.C. and Venkatraman, N., 1993. Strategic alignment: leveraging information
technology for transforming organizations. IBM Systems Journal, 32 (1), 4–16.Hill, T., 1994. Manufacturing strategy: Text and cases. Blue Ridge, IL: Irwin.
Enterprise Information Systems 233
Dow
nloa
ded
by [
Dal
hous
ie U
nive
rsity
] at
06:
04 0
3 O
ctob
er 2
014
Hou, H., Xu, S., and Wang, H., 2007. A study on X party material flow: the theory and applications.
Enterprise Information Systems, 1 (3), 287–299.
Hsu, C. and Wallace, W.A., 2007. An industrial network flow information integration model for
supply chain management and intelligent transportation. Enterprise Information Systems, 1
(3), 327–351.Hu, L. and Bentler, P., 1998. Fit indices in covariance structure modeling: sensitivity to
underparameterized model misspecification. Psychological Methods, 3 (4), 424–453.Huber, G., 1982. Organizational information systems: determinants of their performance and
behaviour. Management Science, 28 (2), 138–155.Iacovou, C.L., Benbasat, I., and Dexter, A.S. 1994. Electronic data interchange and small
organizations: Adoption and impact of the technology. Working paper. Faculty of Commerce
and Business Administration, University of British Columbia, Vancouver, Canada.Khalil, O. and Elkordy, M., 1999. The relationship between user satisfaction and systems usage:
empirical evidence from Egypt. Journal of End User Computing, 11 (2), 21–28.
Koufteros, X., Vonderembse, M., and Doll, W., 1998. Developing measures of time-based
manufacturing. Journal of Operations Management, 16 (1), 21–41.
Li, L. and Benton, W.C., 2006. Hospital technology and nurse staffing management decisions.
Journal of Operations Management, 24 (5), 676–691.Li, L., et al., 2008. Assessing the effects of manufacturing infrastructure preparation prior to
enterprise information systems implementation. International Journal of Production Research,
466, 1645–1665.Li, L. and Zhao, X., 2006. Enhancing competitive edge through knowledge management in
implementing ERP systems. Systems Research and Behavioral Science, 23 (2), 129–140.MacCallum, R.C., Browne, M.W., and Sugawara, H.M., 1996. Power analysis and determination of
sample size for covariance structure modelling. Psychological Methods, 1 (2), 130–149.Mason-Jones, R. and Towill, D., 1999. Total cycle time compression and the agile supply chain.
International Journal of Production Economics, 62 (1/2), 61–73.
McAfee, A., 2002. The impact of enterprise information technology adoption on operational
performance: an empirical investigation. Production and Operations Management, 11 (1),
33–53.NIST (National Institute of Standards and Technology), 2002. Malcolm Baldrige National Quality
Award 2002 Criteria for Performance Excellence, Gaithersburg, MD.Powell, T.C., 1992. Organizational alignment as competitive advantage. Strategic Management
Journal, 13 (2), 119–134.Rockart, F., 1979. Chief executives define their own data needs. Harvard Business Review, 57 (2),
81–93.Rondeau, P., Vonderembse, M., and Ragu-Nathan, T., 2000. Exploring work system practices for
time–bad manufacturers: their impact on competitive capabilities. Journal of Operations
Management, 18 (5), 509–527.
Schmitz, B., 1999. Steelcase reduces new part generation with PDM. Computer-Aided
Engineering, 18 (10), 8.
Schneier, C.E., Shaw, D.G., and Beatty, R.W., 1991. Performance measurement and management:
a tool for strategy execution. Human Resource Management, 30 (3), 279–301.Srinivasan, K., Kekre, S., and Mukhopadhyay, T., 1994. Impact of electronic data interchange
technology on JIT Shipments. Management Science, 40 (10), 1291–1304.Stalk, G. and Hout, T., 1990. Competing against time: How time-based competition is reshaping global
markets. New York, NY: The Free Press.Staley, S. and Warfield, J.N., 2007. Enterprise integration of product development data: systems
science in action. Enterprise Information Systems, 1 (3), 269–285.
Sussams, J., 1992. IT and the total logistics concept. Management Services, 36 (9), 18–21.Sweat, J., 1999. The integrated enterprise. Information Week, 731, 63–66.Training, 1996. 1996 industry report: Technology and training, 33 (10), 73–79.
234 H. Zhou et al.
Dow
nloa
ded
by [
Dal
hous
ie U
nive
rsity
] at
06:
04 0
3 O
ctob
er 2
014
Venkatraman, N., 1989. The concept of fit in strategy research: toward verbal and statistical
correspondence. Academy of Management Review, 14 (1), 423–444.
Warfield, J.N., 2007. Systems science serves enterprise integration: a tutorial. Enterprise Information
Systems, 1 (2), 235–254.
Woolfe, R., 1993. The path to strategic alignment. Information Strategy, 9 (2), 13–23.Xu, L., et al., 2005. A polychromatic sets approach to the conceptual design of machine tools.
International Journal of Production Research, 43 (12), 2397–2422.Xu, L., et al., 2007. A decision support system for product design in concurrent engineering. Decision
Support Systems, 42 (4), 2029–2042.Xu, L., et al., 2006. Integrating knowledge management and ERP in enterprise information systems.
Systems Research and Behavioral Science, 23 (2), 147–156.Xu, S., 2006. A new discipline in the era of knowledge economy: material flow science and
technology. Systems Research and Behavioral Science, 23 (2), 251–257.Xu, L., 2007. Editorial. Enterprise Information Systems, 1 (1), 1–2.Zemke, R. and Schaaf, D., 1989. The service edge: 101 companies that profit from customer care.
New York, NY: New American Library.
Enterprise Information Systems 235
Dow
nloa
ded
by [
Dal
hous
ie U
nive
rsity
] at
06:
04 0
3 O
ctob
er 2
014
Appendix: Abbreviated survey questionnaire
236 H. Zhou et al.
Dow
nloa
ded
by [
Dal
hous
ie U
nive
rsity
] at
06:
04 0
3 O
ctob
er 2
014
Enterprise Information Systems 237
Dow
nloa
ded
by [
Dal
hous
ie U
nive
rsity
] at
06:
04 0
3 O
ctob
er 2
014
Recommended