The value of marine ecological data collected by volunteers
Judy Foster-Smith*, Stewart M. Evans
The Dove Marine Laboratory (The School of Marine Science and Technology, Newcastle University), Cullercoats, Tyne and Wear NE30 4PZ, UK
Received 28 August 2002; received in revised form 18 November 2002; accepted 18 November 2002
Abstract
Volunteers are potentially a huge scientific resource but there is scepticism among some scientists about the reliability of datacollected by inexperienced people. An assessment was therefore made of the ability of a group of 13 volunteers, recruited by theEarthwatch Institute, to collect valid data in a project that aimed to map the distribution and abundance of common littoral
organisms on shores of the Isle of Cumbrae, Scotland. The volunteers ranged considerably in age, educational background,knowledge and experience. They were capable of performing straight-forward tasks, such as learning to identify species, recordingtheir occurrence on specific parts of the shore and making length measurements of samples of some gastropods. They made some
recording errors during the fieldwork but similar errors were also made by experienced scientists and it is recommended thereforethat all ecological studies should include quality control of data whether or not they involve volunteers. The assessment of abun-dance was problematic. Volunteers’ assessments for some species were inconsistent and there is evidence that individuals interpreted
the scale in different ways. It is suggested that these problems stemmed from: (1) a lack of field experience in the volunteers; (2)inadequate guidelines on the use of the abundance scale; and (3) insufficient training before field surveys commenced. However,projects themselves may benefit in unexpected ways from the input of volunteers. They contributed taxonomic and computing skillsto the current project. Members of the group also offered new insights by developing hypotheses relating to populations of gas-
tropods during their fieldwork. These were tested and could have formed the basis of longer-term research programmes. There werealso educational benefits for the volunteers who were involved in the project. These included increased knowledge of marine issuesand clearer understanding of the ways in which scientific studies are undertaken.
# 2003 Elsevier Science Ltd. All rights reserved.
Keywords: Volunteer data; Validation; Quality control; Littoral species mapping; Conservation
1. Introduction
National and international programmes for the con-servation of biological diversity inevitably place enor-mous burdens on national science budgets (WorldConservation Strategy, 1980). Individual plans areambitious but, while governments, especially those inthe developed world, have allocated some additionalfinancial resources to relevant research (e.g. Biodi-versity: The UK Action Plan, 1994), there is widespreadbelief that conservation research is seriously under-fun-ded (e.g. Lewis, 1999). There is almost certainly con-sensus that science has neither the manpower nor thefinancial resources to meet the demands that are beingplaced upon it (e.g. Hodgson, 1999).
However, much of the research that is needed to fulfilbiodiversity action plans is labour intensive but techni-cally straight-forward. Volunteers could make impor-tant contributions to it, representing a potentially hugeworkforce. Indeed, they have already made significantcontributions to scientific knowledge through their par-ticipation in a range of studies, particularly ones thathave been guided by experienced scientists. Examplesinclude surveys of the abundance and distribution ofwaders and wildfowl in British coastal waters (Prater,1981); beached bird surveys (Stowe, 1982); the distribu-tion of Australian birds (Blakers et al., 1984); changes inbenthic and pelagic communities in Jakarta Bay due toorganic pollution from the city of Jakarta (Harger,1988); coral reef surveys in Singapore (Chou, 1994) andBelize (Mumby et al., 1995); coastal zone managementin Australia (Jacoby et al., 1997; Wescott, 1998); NorthSea pollution studies (Evans et al., 2000) and monitor-ing juvenile lobsters (Ellis and Cowan, 2002). The
0006-3207/03/$ - see front matter # 2003 Elsevier Science Ltd. All rights reserved.
doi:10.1016/S0006-3207(02)00373-7
Biological Conservation 113 (2003) 199–213
www.elsevier.com/locate/biocon
* Corresponding author. Te.l: +44-191-252-4850; fax: +44-191-
252-1054.
E-mail address: [email protected] (J. Foster-Smith).
potential of this workforce is especially well-illustratedin the coral programme ‘Reef Check’ (Hodgson, 1999).Recreational divers surveyed over 300 reefs in 31 coun-tries in a global survey that was certainly beyond theresources of conventional scientific projects.Nevertheless, some members of the scientific commu-
nity are sceptical about the reliability of data generatedby volunteers (Darwell and Dulvy, 1996; Saunders,2002). There is a need therefore to investigate the kindsof tasks that can be performed successfully by inexper-ienced people. The present study addresses this questionin a project in which volunteers collected data to mapthe distribution and abundance of common littoralorganisms on the Isle of Cumbrae, Scotland. In order todo this, they carried out two tasks: (1) the identificationof a range of littoral species; and (2) assessments of theirdistribution and abundance on the shore. However,opportunities were also taken to assess the abilities ofvolunteers to find organisms on the shore and to learnto identify a range of study species. In addition, thevolunteers were encouraged to formulate hypothesesthat might explain any differences that they observed inthe distributions or abundances of species on the shore.As it turned out, several hypotheses were postulated.Two of them, one relating to the sizes of dogwhelksNucella lapillus on parts of the shore that had beenrecently re-colonised following tributyltin (TBT) pollu-tion, and the other to differences in population structurein the top shells Gibbula cinerea and Gibbula umbilicalis,were tested by making length measurements of samplesof these species.
2. Methods
The field study took place between 9 and 16 July,2001. It was based at the University Marine BiologicalStation, Millport, Scotland.
2.1. The study site
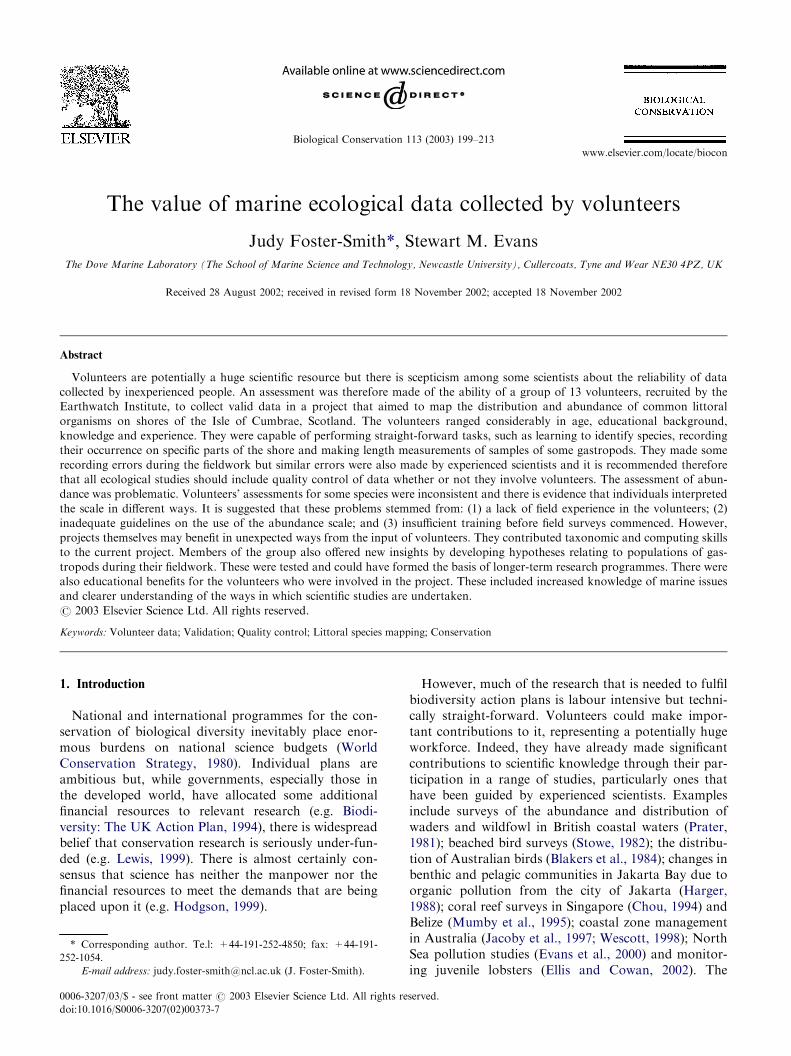
The Isle of Cumbrae is located in the Clyde Sea,adjacent to the town of Largs on the west coast ofScotland. The circumference of the island is approxi-mately 18 km, and the town of Millport, which hasabout 2000 inhabitants, is located at the southern end ofthe island. For purposes of the study, the coastal areawas divided into 16 one km recording squares based onthe Ordnance Survey map of the area (Fig. 1). Four tinyareas of shore, between the squares 1 and 16, 6 and 7, 12and 13, and 14 and 15, were excluded from the survey.The Cumbrae shore consists of rocky outcrops that areinterspersed with areas of soft sediment. There were noareas of rock in Square 8, which consisted of part of thesediment shore of Kames Bay. Each of the remainingsquares contained areas of both kinds of substrate,
although sediment patches in some of them were verysmall. The recording squares were grouped into fourquartiles (each of four squares), covering the northeast(recording squares 1–4), southeast (5–8), southwest (9–12) and western (13–16) parts of the island (see later).The work programme was based primarily on field-
work but there were some lectures, covering topics suchas biodiversity, the use of indicator species to assessenvironmental changes caused by natural and anthro-pogenic impacts and (from the skipper of one of theMarine Station’s research vessels) an account of the for-mer British basking shark fishery. The volunteers weregiven a talk on scientific literature and photocopies ofeight papers relating to the ecology of the study species.
2.2. The volunteers
There were 13 volunteers, five males and eightfemales, recruited by the Earthwatch Institute (see Gil-mour and Saunders, 1995). They contributed financiallyto the project to cover their travel, accommodation andsubsistence costs. Volunteers ranged in age from 17 to61, and came from a number of different backgrounds,including an sixth-form high school student, a recentgraduate, a housewife, a civil engineer, a retired biologyteacher, a personal assistant in a small firm and anemployee of a major oil company. Knowledge of marinebiology also varied in the group. One participant had a
Fig. 1. Map of Cumbrae showing places that are named in the text
and recording squares, which are 1 km square.
200 J. Foster-Smith, S.M. Evans / Biological Conservation 113 (2003) 199–213
degree in marine biology and two had degrees in biolo-gical sciences. The remainder ranged from self-claimed‘total ignorance of the subject’ to a general interest inwildlife, including the marine environment. Never-theless, members of the group functioned as a coherentunit during the project, both at work and socially. Theywere highly committed to the project and were preparedto carry out tasks allocated to them as required. Thiswas in spite of poor weather conditions, which consistedmostly of rain and high winds during the study period.
2.3. Preliminary tasks
(i) Questionnaire. The participants were asked to
respond independently to a questionnaire(Table 1) at the start of the project, beforeundertaking any fieldwork, and at the end of it,when the fieldwork had been completed.(ii) Species recognition. The participants’ knowledge
of littoral species was tested at the start of theproject before any fieldwork was undertaken andat the end of the project. This was done byshowing them 40 projected slides of species andasking them to write down either the common orlatin name of each of them. A single mark wasgiven for a fully correct answer (e.g. either‘beadlet anemone’ or Actinia equina) and halfmark for a partially correct response (e.g. ‘ane-mone’ or Actinia). The selection of species, ofwhich slides were shown, consisted of: (i) thosethat were the focus of the mapping project(referred to as ‘control’ and ‘target’ speciesbelow); and (ii) those that were likely to beencountered on the shore but were not part of themapping project (non-target species).(iii) Field exercise. The first day of the field pro-
gramme was devoted primarily to trainingvolunteers both to identify common littoralorganisms and to familiarise themselves withabundance assessments (in preparation for themapping exercise; see later). They were alsoasked to find as many different organisms as theycould during a 1-h search of the shore at low tideat White Bay. Specimens were taken back to thelaboratory for identification as necessary.
2.4. Mapping the distribution and abundance of species
Distribution and abundance data were collected on 20species. Four of them, the control species, were assessedby both volunteers and scientists, as part of the qualitycontrol procedure (see later). They were selected pri-marily because they are easy to identify in the field.They were: the lugworm Arenicola marina, whose pre-sence on the shore can be recognised by the character-istic faecal casts without digging into the sediment, thecommon mussel Mytilus edulis, the dogwhelk Nucellalapillus and the yellow lichen Xanthoria parietina. Eachis present in large numbers on the shore around mostparts of the island. The remaining 16 species, the targetspecies, were assessed by volunteers only. They were:the beadlet anemone Actinia equina, the knotted wrackAscophyllum nodosum, the common starfish Asteriasrubens, the common whelk Buccinum undatum, theedible crab Cancer pagurus, the green shore crab Carci-nus maenas, the gut weed Enteromorpha intestinalis, theserrated wrack Fucus serratus, the edible periwinkleLittorina littorea, the brittlestar Ophiothrix fragilis, thegrey top shell Gibbula cineraria, the flat top shell Gib-bula umbilicalis, the hermit crab Pagurus bernhardus, thebutterfish, Pholis gunnellus, the purple sea urchinPsammechinus miliaris and the tortoiseshell limpet Tec-
Table 1
The questionnaire which the participants were asked to complete both at the start and at the end of the project
1. Please assess the extent to which you feel a responsibly for protecting the marine environment:
Very strongly; strongly; to a limited extent; hardly at all; not at all
2. When you next go to a coastal area, how do you rate the possibility that you will visit the seashore to investigate the plants and animals living
there?
Certainly; probably; unlikely; certainly not; don’t know
3. Do you think that you are likely to join another ecological research survey in the future?
Certainly; probably; unlikely; certainly not; don’t know
4. In your opinion which of the following best fits the statement that ‘inexperienced volunteers can make significant contributions to ecological
studies, such as surveys of the seashore’? You:
Strongly agree with it; agree with it; disagree with it; strongly disagree with it; don’t know
5. In your opinion, which of the following best fits the statement that ‘opportunities should exist for everyone to become be involved in ecological
field work’? You:
Strongly agree with it; agree with it; disagree with it; strongly disagree with it; don’t know
6. How well do you understand the term ‘biodiversity’?
Completely; almost completely; partly; vaguely; not at all
7. List five scientific journals in which research on marine ecology might be published.
J. Foster-Smith, S.M. Evans / Biological Conservation 113 (2003) 199–213 201
tura tessulata. Each of the target species was found onat least some parts of the shore during a preliminarysurvey by two of the scientists (SME and JF-S) in June,2001.For safety reasons, volunteers carried out shore sur-
veys in small groups. There were five pairs and onegroup of three people. Each volunteer kept independentrecords of the abundance of the four control species andtwo or three additional target species. The latter werechosen from a selection of target species recommendedby the volunteers themselves. The instructions given tothem were to search as much of the area of eachrecording square as possible within approximately anhour, continually assessing and re-assessing the abun-dances of their allocated species. A ‘common sense’,broad brush approach to the abundance scale (Super-abundant; Abundant; Common; Frequent; Occasional;Rare; Not Recorded) was used, based on the level ofsearching effort and the relative likelihood of finding aspecies at a particular site. Volunteers were asked tomake their assessments of the abundances of species,without colluding with other members of the group.Each group made assessments in two 1 km recordingsquares per day, over the period of low water, com-pleting half of the Island (eight squares) in the periodof 4 days that was allocated to the surveys. Group 1volunteers (working in three pairs) were allocated thenortheast (squares 1–4) and southwest (9–12) quar-tiles, and Group 2 volunteers (two pairs and a three-some), the southeast (5–8) and western (13–16)quartiles of the Island (earlier). The surveys of differ-ent groups complemented one another and, betweenthem, provided data for each of the control and targetspecies for all of the recording squares round theisland.Independent assessments of each of the control spe-
cies were made by four experienced scientists (ProfessorS.M. Evans, Dr. J. Foster-Smith, Dr. R. Welch and Mr.C. Moss). They assessed the abundance of these speciesin each of the 16 recording squares (i.e. the wholeisland), and their data were subsequently sub-dividedinto that collected from the north-east/south-westquartiles and that from the south-east/western quartilesso that separate comparisons could be made with datacollected by the two groups of volunteers. There wereconsequently 10 or 11 assessments per recording squareof the control species (four scientists and either six orseven volunteers). However, there was only one assess-ment per square for each of the target species.In order to ease comparison between data sets,
abundance assessments were given numerical values(i.e. Superabundant=7; Abundant=6; Common=5;Frequent=4; Occasional=3; Rare=2; and NotRecorded=1). However, since the scale is a nom-inal one, statistical analyses have been restricted tononparametric tests (i.e. Mann–Whitney U test; Wil-
coxon matched-pairs signed-ranks test; Kendal coeffi-cients of concordance; and Kolmogorov–Smirnov twosample test).Four procedures were used in quality control as
means of identifying recording errors made in assessingabundance. They were restricted to the control species.First, the assessments returned for each species wereexamined for obvious errors (e.g. widely differentassessments of abundance in the same square). Second,data returned by each group of volunteers and scientistswere examined for agreement (concordance) betweenthe assessments recorded by different individuals in thegroups, and between the groups of volunteers and sci-entists. Third, cases in which errors were suspected,were discussed by the group as a whole as a way ofconfirming difficulties experienced in the field and pro-viding explanations for any erroneous records. Finally,recording squares, in which errors were believed to haveoccurred, were re-visited by two of the scientists (JF-Sand SME). They re-assessed any points at issue (e.g.disagreement about the presence or absence of a speciesin a recording square). Erroneous assessments wereexcluded from further analyses.Recorded data were compiled on to Excel spread-
sheets and displayed using MapInfoTM GeographicInformation System (GIS) software. Volunteers weregiven brief training to enable them to enter their owndata on to the spreadsheets. Some of the volunteerswere highly computer literate and were of considerablehelp in instructing other members of the group. How-ever, in practice most data were entered on to the com-puter by two of the scientists (CM and RW). They didso from hard copies of the data provided by the volun-teers and scientists.
2.5. Linear measurements to test hypotheses relating tothe population structure of gastropods
Volunteers developed several hypotheses relating totheir fieldwork. Two of them were tested by makinglength measurements of samples of dogwhelksN. lapillus, and the top shells G. cineraria andG. umbilicalis. These were collected by two of the sci-entists (SME and JF-S). Those of N. lapillus were fromthe shore adjacent to the town of Millport. Separatesamples were taken from distances of 0, 500 and 1000m from the harbour. The samples of Gibbula spp. werefrom White Bay.Measurements were made to the nearest mm, using
Vernier callipers. Those of N. lapillus were made fromthe tip of the spire to the end of the siphonal groove,and those of Gibbula spp. were made across the max-imum diameter of the base of the shell. Independentmeasures of the same samples were made by one of thescientists (SME).
202 J. Foster-Smith, S.M. Evans / Biological Conservation 113 (2003) 199–213
3. Results
3.1. Preliminary tasks
(i) Questionnaire. It was evident from answers to the
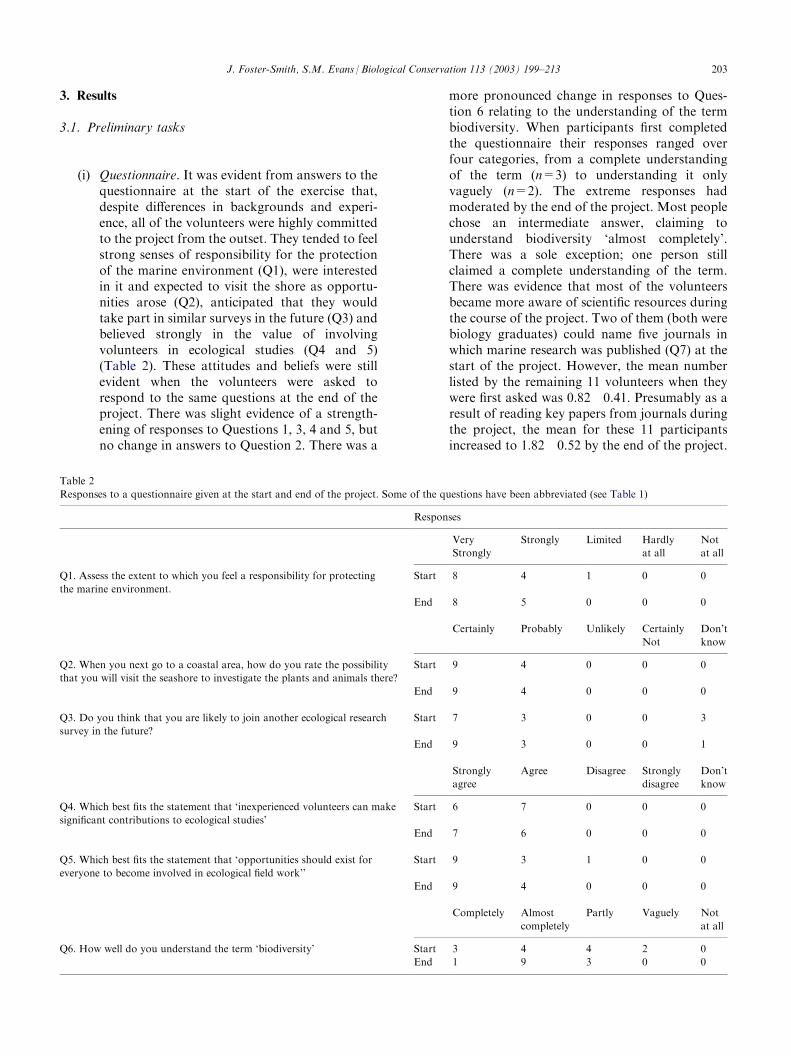
questionnaire at the start of the exercise that,despite differences in backgrounds and experi-ence, all of the volunteers were highly committedto the project from the outset. They tended to feelstrong senses of responsibility for the protectionof the marine environment (Q1), were interestedin it and expected to visit the shore as opportu-nities arose (Q2), anticipated that they wouldtake part in similar surveys in the future (Q3) andbelieved strongly in the value of involvingvolunteers in ecological studies (Q4 and 5)(Table 2). These attitudes and beliefs were stillevident when the volunteers were asked torespond to the same questions at the end of theproject. There was slight evidence of a strength-ening of responses to Questions 1, 3, 4 and 5, butno change in answers to Question 2. There was amore pronounced change in responses to Ques-tion 6 relating to the understanding of the termbiodiversity. When participants first completedthe questionnaire their responses ranged overfour categories, from a complete understandingof the term (n=3) to understanding it onlyvaguely (n=2). The extreme responses hadmoderated by the end of the project. Most peoplechose an intermediate answer, claiming tounderstand biodiversity ‘almost completely’.There was a sole exception; one person stillclaimed a complete understanding of the term.There was evidence that most of the volunteersbecame more aware of scientific resources duringthe course of the project. Two of them (both werebiology graduates) could name five journals inwhich marine research was published (Q7) at thestart of the project. However, the mean numberlisted by the remaining 11 volunteers when theywere first asked was 0.82�0.41. Presumably as aresult of reading key papers from journals duringthe project, the mean for these 11 participantsincreased to 1.82�0.52 by the end of the project.
Table 2
Responses to a questionnaire given at the start and end of the project. Some of the questions have been abbreviated (see Table 1)
Responses
Very
Strongly
Strongly
Limited Hardlyat all
Not
at all
Q1. Assess the extent to which you feel a responsibility for protecting
the marine environment.
Start
8 4 1 0 0End
8 5 0 0 0Certainly
Probably Unlikely CertainlyNot
Don’t
know
Q2. When you next go to a coastal area, how do you rate the possibility
that you will visit the seashore to investigate the plants and animals there?
Start
9 4 0 0 0End
9 4 0 0 0Q3. Do you think that you are likely to join another ecological research
survey in the future?
Start
7 3 0 0 3End
9 3 0 0 1Strongly
agree
Agree
Disagree Stronglydisagree
Don’t
know
Q4. Which best fits the statement that ‘inexperienced volunteers can make
significant contributions to ecological studies’
Start
6 7 0 0 0End
7 6 0 0 0Q5. Which best fits the statement that ‘opportunities should exist for
everyone to become involved in ecological field work’’
Start
9 3 1 0 0End
9 4 0 0 0Completely
Almostcompletely
Partly
Vaguely Notat all
Q6. How well do you understand the term ‘biodiversity’
Start 3 4 4 2 0End
1 9 3 0 0J. Foster-Smith, S.M. Evans / Biological Conservation 113 (2003) 199–213 203
This difference is significant (P<0.05; Mann–Whitney U test).
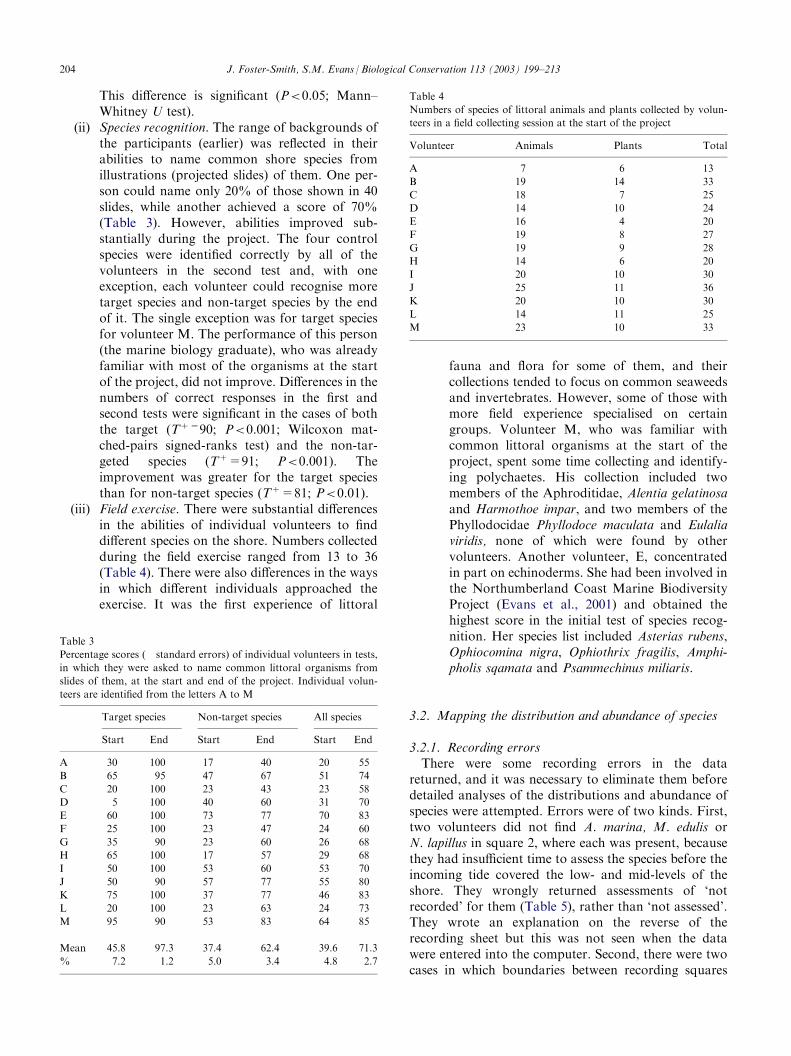
(ii) Species recognition. The range of backgrounds of
the participants (earlier) was reflected in theirabilities to name common shore species fromillustrations (projected slides) of them. One per-son could name only 20% of those shown in 40slides, while another achieved a score of 70%(Table 3). However, abilities improved sub-stantially during the project. The four controlspecies were identified correctly by all of thevolunteers in the second test and, with oneexception, each volunteer could recognise moretarget species and non-target species by the endof it. The single exception was for target speciesfor volunteer M. The performance of this person(the marine biology graduate), who was alreadyfamiliar with most of the organisms at the startof the project, did not improve. Differences in thenumbers of correct responses in the first andsecond tests were significant in the cases of boththe target (T+=90; P<0.001; Wilcoxon mat-ched-pairs signed-ranks test) and the non-tar-geted species (T+=91; P<0.001). Theimprovement was greater for the target speciesthan for non-target species (T+=81; P<0.01).(iii) Field exercise. There were substantial differences
in the abilities of individual volunteers to finddifferent species on the shore. Numbers collectedduring the field exercise ranged from 13 to 36(Table 4). There were also differences in the waysin which different individuals approached theexercise. It was the first experience of littoralfauna and flora for some of them, and theircollections tended to focus on common seaweedsand invertebrates. However, some of those withmore field experience specialised on certaingroups. Volunteer M, who was familiar withcommon littoral organisms at the start of theproject, spent some time collecting and identify-ing polychaetes. His collection included twomembers of the Aphroditidae, Alentia gelatinosaand Harmothoe impar, and two members of thePhyllodocidae Phyllodoce maculata and Eulaliaviridis, none of which were found by othervolunteers. Another volunteer, E, concentratedin part on echinoderms. She had been involved inthe Northumberland Coast Marine BiodiversityProject (Evans et al., 2001) and obtained thehighest score in the initial test of species recog-nition. Her species list included Asterias rubens,Ophiocomina nigra, Ophiothrix fragilis, Amphi-pholis sqamata and Psammechinus miliaris.
3.2. Mapping the distribution and abundance of species
3.2.1. Recording errorsThere were some recording errors in the data
returned, and it was necessary to eliminate them beforedetailed analyses of the distributions and abundance ofspecies were attempted. Errors were of two kinds. First,two volunteers did not find A. marina, M. edulis orN. lapillus in square 2, where each was present, becausethey had insufficient time to assess the species before theincoming tide covered the low- and mid-levels of theshore. They wrongly returned assessments of ‘notrecorded’ for them (Table 5), rather than ‘not assessed’.They wrote an explanation on the reverse of therecording sheet but this was not seen when the datawere entered into the computer. Second, there were twocases in which boundaries between recording squares
Table 3
Percentage scores (�standard errors) of individual volunteers in tests,
in which they were asked to name common littoral organisms from
slides of them, at the start and end of the project. Individual volun-
teers are identified from the letters A to M
Target species
Non-target species All speciesStart
End Start End Start EndA
30 100 17 40 20 55B
65 95 47 67 51 74C
20 100 23 43 23 58D
5 100 40 60 31 70E
60 100 73 77 70 83F
25 100 23 47 24 60G
35 90 23 60 26 68H
65 100 17 57 29 68I
50 100 53 60 53 70J
50 90 57 77 55 80K
75 100 37 77 46 83L
20 100 23 63 24 73M
95 90 53 83 64 85Mean
45.8 97.3 37.4 62.4 39.6 71.3%
�7.2 �1.2 �5.0 �3.4 �4.8 �2.7Table 4
Numbers of species of littoral animals and plants collected by volun-
teers in a field collecting session at the start of the project
Volunteer
Animals Plants TotalA
7 6 13B
19 14 33C
18 7 25D
14 10 24E
16 4 20F
19 8 27G
19 9 28H
14 6 20I
20 10 30J
25 11 36K
20 10 30L
14 11 25M
23 10 33204 J. Foster-Smith, S.M. Evans / Biological Conservation 113 (2003) 199–213
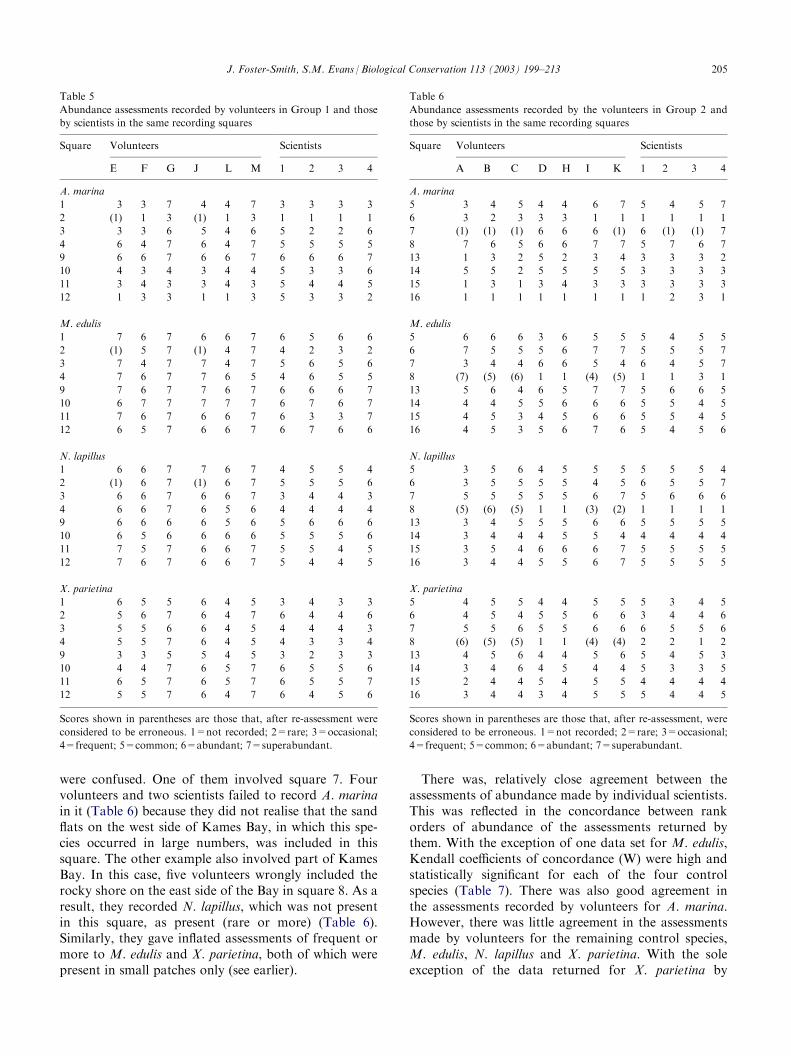
were confused. One of them involved square 7. Fourvolunteers and two scientists failed to record A. marinain it (Table 6) because they did not realise that the sandflats on the west side of Kames Bay, in which this spe-cies occurred in large numbers, was included in thissquare. The other example also involved part of KamesBay. In this case, five volunteers wrongly included therocky shore on the east side of the Bay in square 8. As aresult, they recorded N. lapillus, which was not presentin this square, as present (rare or more) (Table 6).Similarly, they gave inflated assessments of frequent ormore to M. edulis and X. parietina, both of which werepresent in small patches only (see earlier).
There was, relatively close agreement between theassessments of abundance made by individual scientists.This was reflected in the concordance between rankorders of abundance of the assessments returned bythem. With the exception of one data set for M. edulis,Kendall coefficients of concordance (W) were high andstatistically significant for each of the four controlspecies (Table 7). There was also good agreement inthe assessments recorded by volunteers for A. marina.However, there was little agreement in the assessmentsmade by volunteers for the remaining control species,M. edulis, N. lapillus and X. parietina. With the soleexception of the data returned for X. parietina by
Table 5
Abundance assessments recorded by volunteers in Group 1 and those
by scientists in the same recording squares
Square
Volunteers ScientistsE
F G J L M 1 2 3 4A. marina
1
3 3 7 4 4 7 3 3 3 32
(1) 1 3 (1) 1 3 1 1 1 13
3 3 6 5 4 6 5 2 2 64
6 4 7 6 4 7 5 5 5 59
6 6 7 6 6 7 6 6 6 710
4 3 4 3 4 4 5 3 3 611
3 4 3 3 4 3 5 4 4 512
1 3 3 1 1 3 5 3 3 2M. edulis
1
7 6 7 6 6 7 6 5 6 62
(1) 5 7 (1) 4 7 4 2 3 23
7 4 7 7 4 7 5 6 5 64
7 6 7 7 6 5 4 6 5 59
7 6 7 7 6 7 6 6 6 710
6 7 7 7 7 7 6 7 6 711
7 6 7 6 6 7 6 3 3 712
6 5 7 6 6 7 6 7 6 6N. lapillus
1
6 6 7 7 6 7 4 5 5 42
(1) 6 7 (1) 6 7 5 5 5 63
6 6 7 6 6 7 3 4 4 34
6 6 7 6 5 6 4 4 4 49
6 6 6 6 5 6 5 6 6 610
6 5 6 6 6 6 5 5 5 611
7 5 7 6 6 7 5 5 4 512
7 6 7 6 6 7 5 4 4 5X. parietina
1
6 5 5 6 4 5 3 4 3 32
5 6 7 6 4 7 6 4 4 63
5 5 6 6 4 5 4 4 4 34
5 5 7 6 4 5 4 3 3 49
3 3 5 5 4 5 3 2 3 310
4 4 7 6 5 7 6 5 5 611
6 5 7 6 5 7 6 5 5 712
5 5 7 6 4 7 6 4 5 6Scores shown in parentheses are those that, after re-assessment were
considered to be erroneous. 1=not recorded; 2=rare; 3=occasional;
4=frequent; 5=common; 6=abundant; 7=superabundant.
Table 6
Abundance assessments recorded by the volunteers in Group 2 and
those by scientists in the same recording squares
Square
Volunteers ScientistsA
B C D H I K 1 2 3 4A. marina
5
3 4 5 4 4 6 7 5 4 5 76
3 2 3 3 3 1 1 1 1 1 17
(1) (1) (1) 6 6 6 (1) 6 (1) (1) 78
7 6 5 6 6 7 7 5 7 6 713
1 3 2 5 2 3 4 3 3 3 214
5 5 2 5 5 5 5 3 3 3 315
1 3 1 3 4 3 3 3 3 3 316
1 1 1 1 1 1 1 1 2 3 1M. edulis
5
6 6 6 3 6 5 5 5 4 5 56
7 5 5 5 6 7 7 5 5 5 77
3 4 4 6 6 5 4 6 4 5 78
(7) (5) (6) 1 1 (4) (5) 1 1 3 113
5 6 4 6 5 7 7 5 6 6 514
4 4 5 5 6 6 6 5 5 4 515
4 5 3 4 5 6 6 5 5 4 516
4 5 3 5 6 7 6 5 4 5 6N. lapillus
5
3 5 6 4 5 5 5 5 5 5 46
3 5 5 5 5 4 5 6 5 5 77
5 5 5 5 5 6 7 5 6 6 68
(5) (6) (5) 1 1 (3) (2) 1 1 1 113
3 4 5 5 5 6 6 5 5 5 514
3 4 4 4 5 5 4 4 4 4 415
3 5 4 6 6 6 7 5 5 5 516
3 4 4 5 5 6 7 5 5 5 5X. parietina
5
4 5 5 4 4 5 5 5 3 4 56
4 5 4 5 5 6 6 3 4 4 67
5 5 6 5 5 6 6 6 5 5 68
(6) (5) (5) 1 1 (4) (4) 2 2 1 213
4 5 6 4 4 5 6 5 4 5 314
3 4 6 4 5 4 4 5 3 3 515
2 4 4 5 4 5 5 4 4 4 416
3 4 4 3 4 5 5 5 4 4 5Scores shown in parentheses are those that, after re-assessment, were
considered to be erroneous. 1=not recorded; 2=rare; 3=occasional;
4=frequent; 5=common; 6=abundant; 7=superabundant.
J. Foster-Smith, S.M. Evans / Biological Conservation 113 (2003) 199–213 205
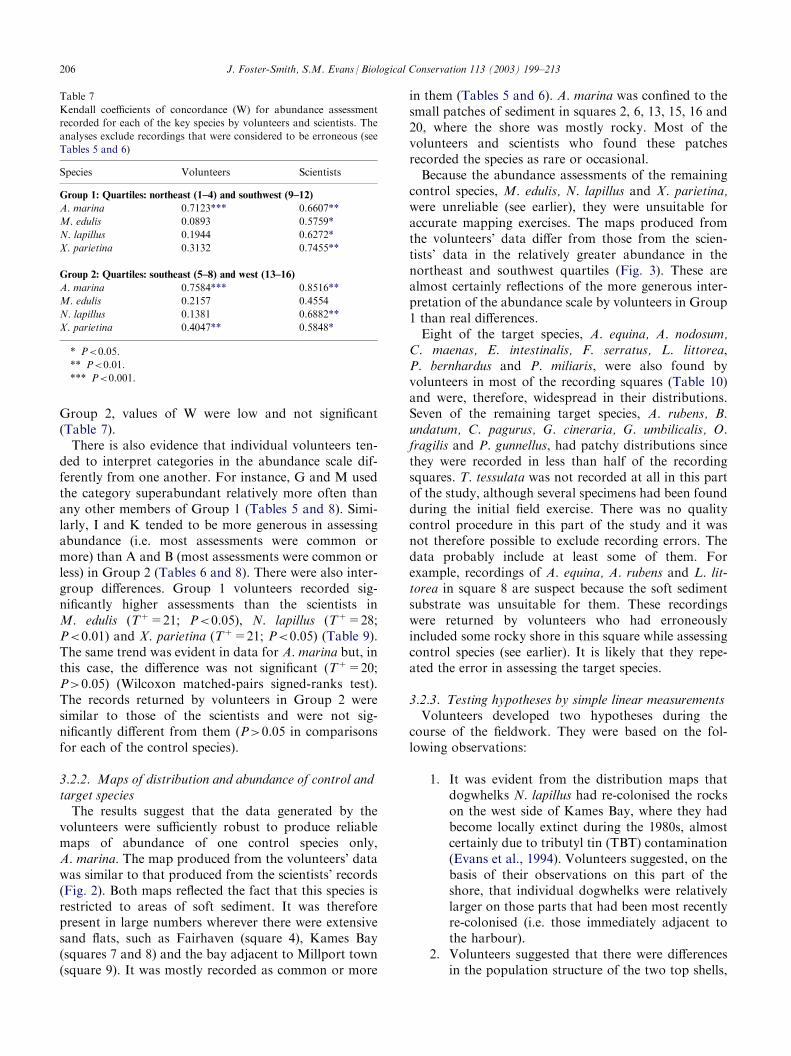
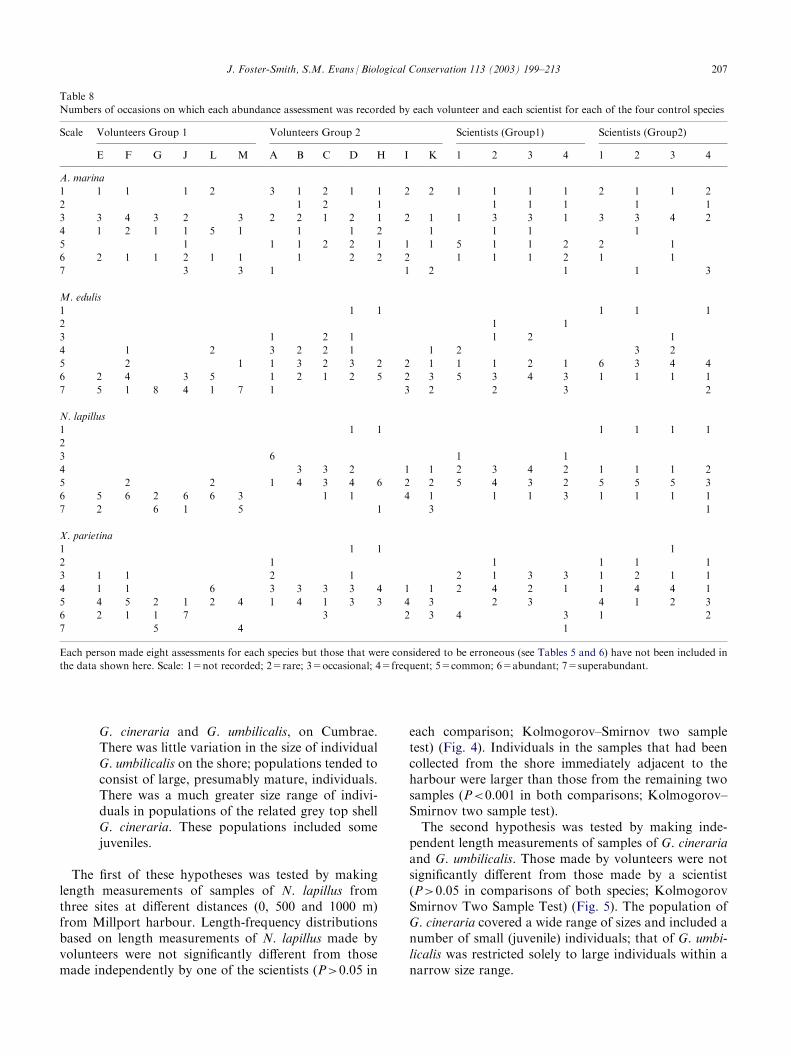
Group 2, values of W were low and not significant(Table 7).There is also evidence that individual volunteers ten-
ded to interpret categories in the abundance scale dif-ferently from one another. For instance, G and M usedthe category superabundant relatively more often thanany other members of Group 1 (Tables 5 and 8). Simi-larly, I and K tended to be more generous in assessingabundance (i.e. most assessments were common ormore) than A and B (most assessments were common orless) in Group 2 (Tables 6 and 8). There were also inter-group differences. Group 1 volunteers recorded sig-nificantly higher assessments than the scientists inM. edulis (T+=21; P<0.05), N. lapillus (T+=28;P<0.01) and X. parietina (T+=21; P<0.05) (Table 9).The same trend was evident in data for A. marina but, inthis case, the difference was not significant (T+=20;P>0.05) (Wilcoxon matched-pairs signed-ranks test).The records returned by volunteers in Group 2 weresimilar to those of the scientists and were not sig-nificantly different from them (P>0.05 in comparisonsfor each of the control species).
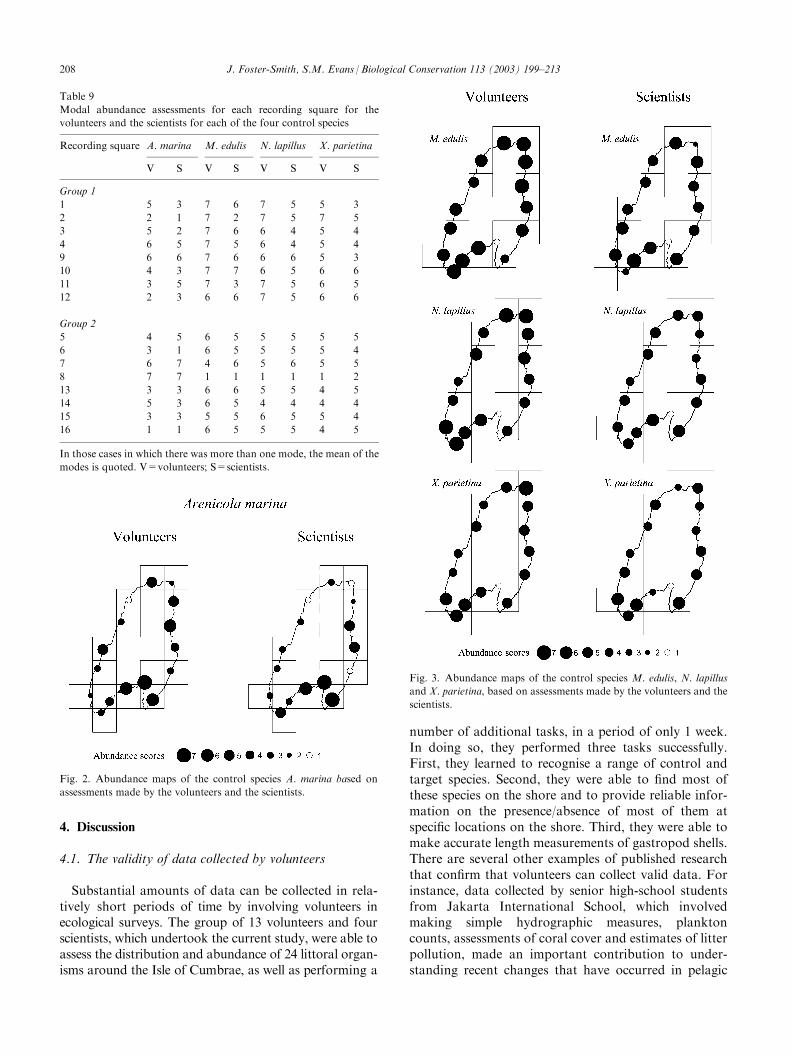
3.2.2. Maps of distribution and abundance of control andtarget speciesThe results suggest that the data generated by the
volunteers were sufficiently robust to produce reliablemaps of abundance of one control species only,A. marina. The map produced from the volunteers’ datawas similar to that produced from the scientists’ records(Fig. 2). Both maps reflected the fact that this species isrestricted to areas of soft sediment. It was thereforepresent in large numbers wherever there were extensivesand flats, such as Fairhaven (square 4), Kames Bay(squares 7 and 8) and the bay adjacent to Millport town(square 9). It was mostly recorded as common or more
in them (Tables 5 and 6). A. marina was confined to thesmall patches of sediment in squares 2, 6, 13, 15, 16 and20, where the shore was mostly rocky. Most of thevolunteers and scientists who found these patchesrecorded the species as rare or occasional.Because the abundance assessments of the remaining
control species, M. edulis, N. lapillus and X. parietina,were unreliable (see earlier), they were unsuitable foraccurate mapping exercises. The maps produced fromthe volunteers’ data differ from those from the scien-tists’ data in the relatively greater abundance in thenortheast and southwest quartiles (Fig. 3). These arealmost certainly reflections of the more generous inter-pretation of the abundance scale by volunteers in Group1 than real differences.Eight of the target species, A. equina, A. nodosum,
C. maenas, E. intestinalis, F. serratus, L. littorea,P. bernhardus and P. miliaris, were also found byvolunteers in most of the recording squares (Table 10)and were, therefore, widespread in their distributions.Seven of the remaining target species, A. rubens, B.undatum, C. pagurus, G. cineraria, G. umbilicalis, O.fragilis and P. gunnellus, had patchy distributions sincethey were recorded in less than half of the recordingsquares. T. tessulata was not recorded at all in this partof the study, although several specimens had been foundduring the initial field exercise. There was no qualitycontrol procedure in this part of the study and it wasnot therefore possible to exclude recording errors. Thedata probably include at least some of them. Forexample, recordings of A. equina, A. rubens and L. lit-torea in square 8 are suspect because the soft sedimentsubstrate was unsuitable for them. These recordingswere returned by volunteers who had erroneouslyincluded some rocky shore in this square while assessingcontrol species (see earlier). It is likely that they repe-ated the error in assessing the target species.
3.2.3. Testing hypotheses by simple linear measurementsVolunteers developed two hypotheses during the
course of the fieldwork. They were based on the fol-lowing observations:
1. It was evident from the distribution maps that
dogwhelks N. lapillus had re-colonised the rockson the west side of Kames Bay, where they hadbecome locally extinct during the 1980s, almostcertainly due to tributyl tin (TBT) contamination(Evans et al., 1994). Volunteers suggested, on thebasis of their observations on this part of theshore, that individual dogwhelks were relativelylarger on those parts that had been most recentlyre-colonised (i.e. those immediately adjacent tothe harbour).2. Volunteers suggested that there were differences
in the population structure of the two top shells,Table 7
Kendall coefficients of concordance (W) for abundance assessment
recorded for each of the key species by volunteers and scientists. The
analyses exclude recordings that were considered to be erroneous (see
Tables 5 and 6)
Species
Volunteers ScientistsGroup 1: Quartiles: northeast (1–4) and southwest (9–12)
A. marina
0.7123*** 0.6607**M. edulis
0.0893 0.5759*N. lapillus
0.1944 0.6272*X. parietina
0.3132 0.7455**Group 2: Quartiles: southeast (5–8) and west (13–16)
A. marina
0.7584*** 0.8516**M. edulis
0.2157 0.4554N. lapillus
0.1381 0.6882**X. parietina
0.4047** 0.5848** P<0.05.
** P<0.01.
*** P<0.001.
206 J. Foster-Smith, S.M. Evans / Biological Conservation 113 (2003) 199–213
G. cineraria and G. umbilicalis, on Cumbrae.There was little variation in the size of individualG. umbilicalis on the shore; populations tended toconsist of large, presumably mature, individuals.There was a much greater size range of indivi-duals in populations of the related grey top shellG. cineraria. These populations included somejuveniles.
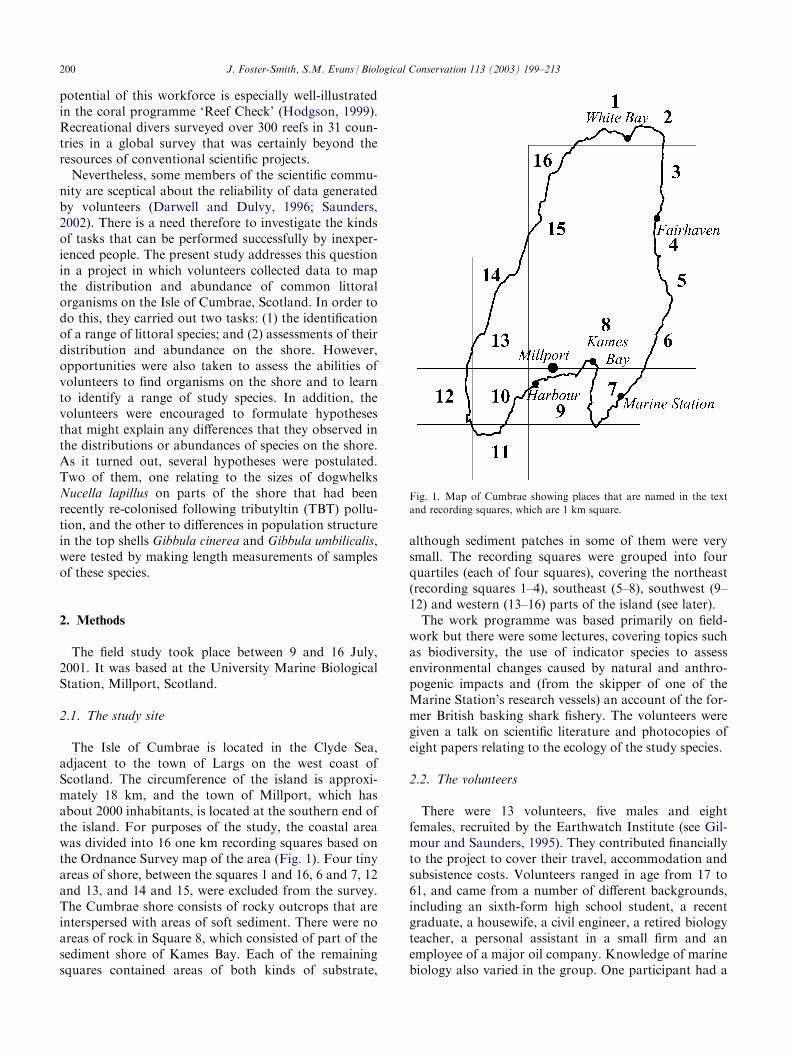
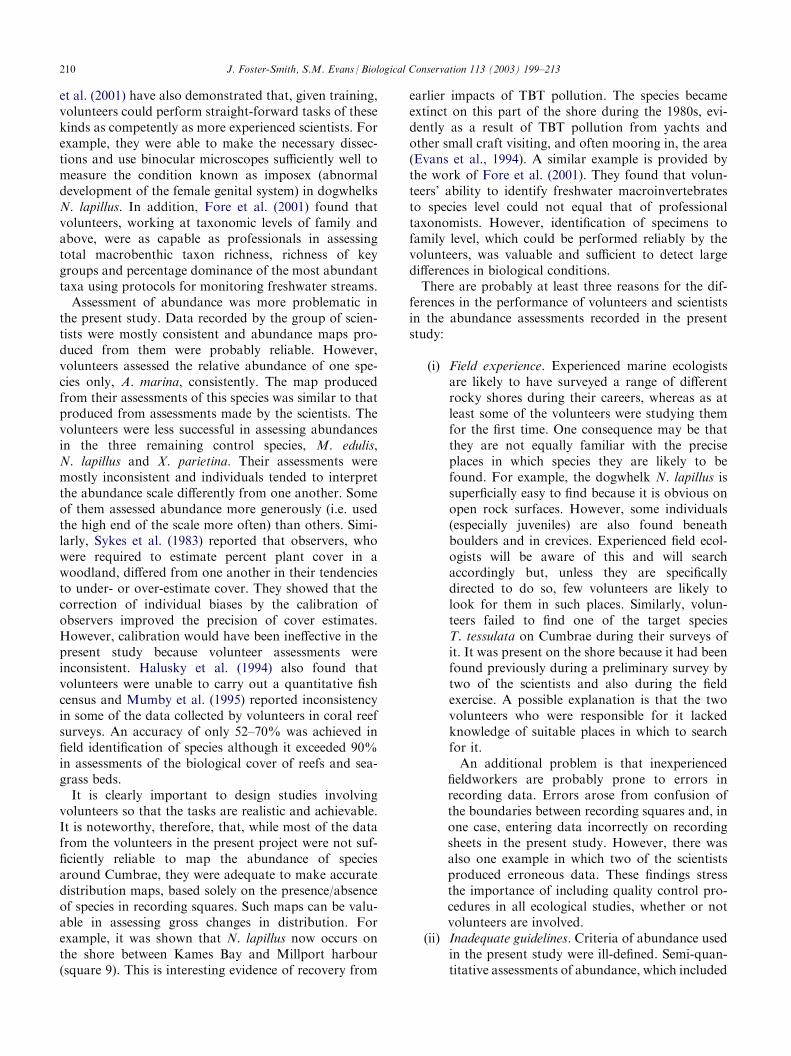
The first of these hypotheses was tested by makinglength measurements of samples of N. lapillus fromthree sites at different distances (0, 500 and 1000 m)from Millport harbour. Length-frequency distributionsbased on length measurements of N. lapillus made byvolunteers were not significantly different from thosemade independently by one of the scientists (P>0.05 in
each comparison; Kolmogorov–Smirnov two sampletest) (Fig. 4). Individuals in the samples that had beencollected from the shore immediately adjacent to theharbour were larger than those from the remaining twosamples (P<0.001 in both comparisons; Kolmogorov–Smirnov two sample test).The second hypothesis was tested by making inde-
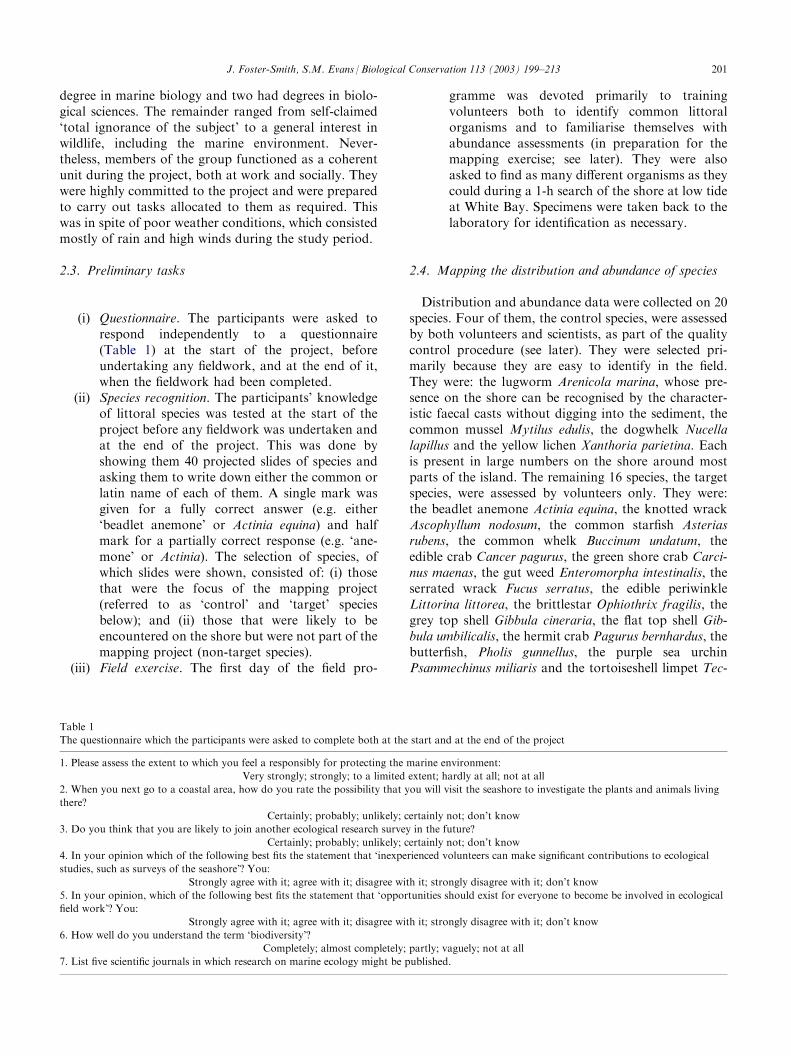
pendent length measurements of samples of G. cinerariaand G. umbilicalis. Those made by volunteers were notsignificantly different from those made by a scientist(P>0.05 in comparisons of both species; KolmogorovSmirnov Two Sample Test) (Fig. 5). The population ofG. cineraria covered a wide range of sizes and included anumber of small (juvenile) individuals; that of G. umbi-licalis was restricted solely to large individuals within anarrow size range.
Table 8
Numbers of occasions on which each abundance assessment was recorded by each volunteer and each scientist for each of the four control species
Scale
Volunteers Group 1 Volunteers Group 2 Scientists (Group1) Scientists (Group2)E
F G J L M A B C D H I K 1 2 3 4 1 2 3 4A. marina
1
1 1 1 2 3 1 2 1 1 2 2 1 1 1 1 2 1 1 22
1 2 1 1 1 1 1 13
3 4 3 2 3 2 2 1 2 1 2 1 1 3 3 1 3 3 4 24
1 2 1 1 5 1 1 1 2 1 1 1 15
1 1 1 2 2 1 1 1 5 1 1 2 2 16
2 1 1 2 1 1 1 2 2 2 1 1 1 2 1 17
3 3 1 1 2 1 1 3M. edulis
1
1 1 1 1 12
1 13
1 2 1 1 2 14
1 2 3 2 2 1 1 2 3 25
2 1 1 3 2 3 2 2 1 1 1 2 1 6 3 4 46
2 4 3 5 1 2 1 2 5 2 3 5 3 4 3 1 1 1 17
5 1 8 4 1 7 1 3 2 2 3 2N. lapillus
1
1 1 1 1 1 12
3
6 1 14
3 3 2 1 1 2 3 4 2 1 1 1 25
2 2 1 4 3 4 6 2 2 5 4 3 2 5 5 5 36
5 6 2 6 6 3 1 1 4 1 1 1 3 1 1 1 17
2 6 1 5 1 3 1X. parietina
1
1 1 12
1 1 1 1 13
1 1 2 1 2 1 3 3 1 2 1 14
1 1 6 3 3 3 3 4 1 1 2 4 2 1 1 4 4 15
4 5 2 1 2 4 1 4 1 3 3 4 3 2 3 4 1 2 36
2 1 1 7 3 2 3 4 3 1 27
5 4 1Each person made eight assessments for each species but those that were considered to be erroneous (see Tables 5 and 6) have not been included in
the data shown here. Scale: 1=not recorded; 2=rare; 3=occasional; 4=frequent; 5=common; 6=abundant; 7=superabundant.
J. Foster-Smith, S.M. Evans / Biological Conservation 113 (2003) 199–213 207
4. Discussion
4.1. The validity of data collected by volunteers
Substantial amounts of data can be collected in rela-tively short periods of time by involving volunteers inecological surveys. The group of 13 volunteers and fourscientists, which undertook the current study, were able toassess the distribution and abundance of 24 littoral organ-isms around the Isle of Cumbrae, as well as performing a
number of additional tasks, in a period of only 1 week.In doing so, they performed three tasks successfully.First, they learned to recognise a range of control andtarget species. Second, they were able to find most ofthese species on the shore and to provide reliable infor-mation on the presence/absence of most of them atspecific locations on the shore. Third, they were able tomake accurate length measurements of gastropod shells.There are several other examples of published researchthat confirm that volunteers can collect valid data. Forinstance, data collected by senior high-school studentsfrom Jakarta International School, which involvedmaking simple hydrographic measures, planktoncounts, assessments of coral cover and estimates of litterpollution, made an important contribution to under-standing recent changes that have occurred in pelagic
Table 9
Modal abundance assessments for each recording square for the
volunteers and the scientists for each of the four control species
Recording square
A. marina M. edulis N. lapillus X. parietinaV
S V S V S V SGroup 1
1
5 3 7 6 7 5 5 32
2 1 7 2 7 5 7 53
5 2 7 6 6 4 5 44
6 5 7 5 6 4 5 49
6 6 7 6 6 6 5 310
4 3 7 7 6 5 6 611
3 5 7 3 7 5 6 512
2 3 6 6 7 5 6 6Group 2
5
4 5 6 5 5 5 5 56
3 1 6 5 5 5 5 47
6 7 4 6 5 6 5 58
7 7 1 1 1 1 1 213
3 3 6 6 5 5 4 514
5 3 6 5 4 4 4 415
3 3 5 5 6 5 5 416
1 1 6 5 5 5 4 5In those cases in which there was more than one mode, the mean of the
modes is quoted. V=volunteers; S=scientists.
Fig. 2. Abundance maps of the control species A. marina based on
assessments made by the volunteers and the scientists.
Fig. 3. Abundance maps of the control species M. edulis, N. lapillus
and X. parietina, based on assessments made by the volunteers and the
scientists.
208 J. Foster-Smith, S.M. Evans / Biological Conservation 113 (2003) 199–213

and benthic communities in Jakarta Bay (Harger, 1988).Halusky et al. (1994) found that volunteer divers reli-ably performed seven tasks relating to artificial reefs, andfive others when the methods were modified appro-priately. Darwall and Dulvy (1996) demonstrated thatdivers could be trained in less than two weeks to collectreliable data on fish diversity, abundance and length fre-quency distributions. Evans et al. (2000) and Birchenough
Table 10
Abundance assessments for each of the target species
Species
Recording square1
2 3 4 5 6 7 8 9 10 11 12 13 14 15 16Actinia equina
5 5 6 4 6 7 7 5 4 6 6 6 7 6 6 6Ascophyllum nodosum
5 5 6 3 5 4 3 1 4 3 4 3 3 3 3 3Asterias rubens
4 1 1 3 4 1 3 2 1 1 5 5 1 3 3 1Buccinum undatum
1 1 1 1 2 3 2 1 1 1 4 4 3 3 3 2Cancer pagurus
5 3 3 1 1 2 3 1 4 1 5 4 1 2 1 2Carcinus maenas
7 7 7 6 5 5 5 1 7 6 5 6 5 4 5 5Enteromorpha intestinalis
6 6 5 5 1 3 5 3 7 6 6 5 5 5 6 4Fucus serratus
6 1 1 6 3 1 5 1 6 4 7 5 4 3 2 4Gibbula cinerarea
4 1 3 3 2 1 1 1 4 4 1 4 1 2 1 1Gibbula umbilicalis
3 1 3 3 1 1 2 1 1 3 2 3 2 2 2 2Littorina littorea
6 6 6 6 6 6 7 3 6 6 6 6 7 6 7 7Pagurus bernhardus
6 1 3 3 5 3 1 1 4 3 6 5 3 3 5 4Pholis gunnellus
6 3 4 1 1 3 3 1 1 1 3 1 2 1 1 2Psammechinus miliaris
1 1 2 3 5 3 4 1 6 5 7 4 3 3 5 3Ophiothrix fragilis
3 1 1 1 3 1 1 1 1 2 4 1 1 2 1 1Tectura tessulata
1 1 1 1 1 1 1 1 1 1 1 1 1 1 1 1Two volunteers were responsible for each species. Each made assessments in half of the squares. 1=not recorded; 2=rare; 3=occasional; 4=fre-
quent; 5=common; 6=abundant; 7=superabundant.
Fig. 4. Independent length measurements by volunteers (&) and a
scientist (&) of three samples of dogwhelks N. lapillus collected from
the shore (a) adjacent to the Millport Harbour (b) 500 m from the
Harbour and (c) 1000 m from the Harbour.
Fig. 5. Independent length measures made by the volunteers (&) and
a scientist (&) of samples of grey top shells G. cinerea and flat top
shells G. umbilicalis collected from White Bay, Isle of Cumbrae.
J. Foster-Smith, S.M. Evans / Biological Conservation 113 (2003) 199–213 209
et al. (2001) have also demonstrated that, given training,volunteers could perform straight-forward tasks of thesekinds as competently as more experienced scientists. Forexample, they were able to make the necessary dissec-tions and use binocular microscopes sufficiently well tomeasure the condition known as imposex (abnormaldevelopment of the female genital system) in dogwhelksN. lapillus. In addition, Fore et al. (2001) found thatvolunteers, working at taxonomic levels of family andabove, were as capable as professionals in assessingtotal macrobenthic taxon richness, richness of keygroups and percentage dominance of the most abundanttaxa using protocols for monitoring freshwater streams.Assessment of abundance was more problematic in
the present study. Data recorded by the group of scien-tists were mostly consistent and abundance maps pro-duced from them were probably reliable. However,volunteers assessed the relative abundance of one spe-cies only, A. marina, consistently. The map producedfrom their assessments of this species was similar to thatproduced from assessments made by the scientists. Thevolunteers were less successful in assessing abundancesin the three remaining control species, M. edulis,N. lapillus and X. parietina. Their assessments weremostly inconsistent and individuals tended to interpretthe abundance scale differently from one another. Someof them assessed abundance more generously (i.e. usedthe high end of the scale more often) than others. Simi-larly, Sykes et al. (1983) reported that observers, whowere required to estimate percent plant cover in awoodland, differed from one another in their tendenciesto under- or over-estimate cover. They showed that thecorrection of individual biases by the calibration ofobservers improved the precision of cover estimates.However, calibration would have been ineffective in thepresent study because volunteer assessments wereinconsistent. Halusky et al. (1994) also found thatvolunteers were unable to carry out a quantitative fishcensus and Mumby et al. (1995) reported inconsistencyin some of the data collected by volunteers in coral reefsurveys. An accuracy of only 52–70% was achieved infield identification of species although it exceeded 90%in assessments of the biological cover of reefs and sea-grass beds.It is clearly important to design studies involving
volunteers so that the tasks are realistic and achievable.It is noteworthy, therefore, that, while most of the datafrom the volunteers in the present project were not suf-ficiently reliable to map the abundance of speciesaround Cumbrae, they were adequate to make accuratedistribution maps, based solely on the presence/absenceof species in recording squares. Such maps can be valu-able in assessing gross changes in distribution. Forexample, it was shown that N. lapillus now occurs onthe shore between Kames Bay and Millport harbour(square 9). This is interesting evidence of recovery from
earlier impacts of TBT pollution. The species becameextinct on this part of the shore during the 1980s, evi-dently as a result of TBT pollution from yachts andother small craft visiting, and often mooring in, the area(Evans et al., 1994). A similar example is provided bythe work of Fore et al. (2001). They found that volun-teers’ ability to identify freshwater macroinvertebratesto species level could not equal that of professionaltaxonomists. However, identification of specimens tofamily level, which could be performed reliably by thevolunteers, was valuable and sufficient to detect largedifferences in biological conditions.There are probably at least three reasons for the dif-
ferences in the performance of volunteers and scientistsin the abundance assessments recorded in the presentstudy:
(i) Field experience. Experienced marine ecologists
are likely to have surveyed a range of differentrocky shores during their careers, whereas as atleast some of the volunteers were studying themfor the first time. One consequence may be thatthey are not equally familiar with the preciseplaces in which species they are likely to befound. For example, the dogwhelk N. lapillus issuperficially easy to find because it is obvious onopen rock surfaces. However, some individuals(especially juveniles) are also found beneathboulders and in crevices. Experienced field ecol-ogists will be aware of this and will searchaccordingly but, unless they are specificallydirected to do so, few volunteers are likely tolook for them in such places. Similarly, volun-teers failed to find one of the target speciesT. tessulata on Cumbrae during their surveys ofit. It was present on the shore because it had beenfound previously during a preliminary survey bytwo of the scientists and also during the fieldexercise. A possible explanation is that the twovolunteers who were responsible for it lackedknowledge of suitable places in which to searchfor it. An additional problem is that inexperiencedfieldworkers are probably prone to errors inrecording data. Errors arose from confusion ofthe boundaries between recording squares and, inone case, entering data incorrectly on recordingsheets in the present study. However, there wasalso one example in which two of the scientistsproduced erroneous data. These findings stressthe importance of including quality control pro-cedures in all ecological studies, whether or notvolunteers are involved.
(ii) Inadequate guidelines. Criteria of abundance used
in the present study were ill-defined. Semi-quan-titative assessments of abundance, which included210 J. Foster-Smith, S.M. Evans / Biological Conservation 113 (2003) 199–213
at least rough estimates of numbers per unitarea and for which precise guidelines weregiven, may have generated more consistent andreliable data.
(iii) The complexity of tasks. Volunteers evidently
found some tasks more difficult than others, eventhough they were superficially similar. Forinstance, they were able to assess the abundanceof A. marina casts on relatively homogenous sandflats reliably but were unsuccessful in assessingM. edulis and N. lapillus on heterogenous rockyshores. Problems of these kinds can probably beovercome by providing adequate training. Theamount of training needed is likely to vary sub-stantially depending on the complexity of thetasks involved, the numbers of them that thevolunteers are expected to perform and thebackgrounds and experience of the volunteers.Training was restricted to one day in the presentstudy and this was almost certainly inadequatefor each of them to acquire the skills to assess theabundance of four control and 2/3 target species.The aims of the study were, therefore, probablytoo ambitious to be achieved in a week.4.2. The importance of volunteer participation inconservation studies
It should be noted that the collection of scientific datais by no means the sole reason for engaging lay peoplein research. There are also major educational and socialbenefits from the involvement of volunteers in scientificprojects. Gilmour and Saunders (1995) identify a rangeof benefits to volunteers, including broadening theirhorizons through meeting different people and experi-encing different ecosystems, and providing opportu-nities for them to help solve environmental problems.Evans and Birchenough (2001) point out that it is ameans of both raising people’s feelings of responsibilitytowards the environment and increasing their knowl-edge of environmental issues. The ‘self-education’ ofthose collecting data and ‘the raising of a conservationforce for change’ are also recognised benefits (Saunders,2002). The opportunity to undertake fieldwork in thecurrent study undoubtedly opened the eyes of partici-pants to the diversity of inter-tidal life, and hopefullypresented them with a balanced understanding of pro-blems relating to pollution of the seas and exploitationof marine resources. There was also evidence of anincreased appreciation by participants of some complexissues. For example, some of the volunteers had mod-erated their views in relation to the term ‘biodiversity’by the end of the project, no longer feeling that they had‘complete understanding’ of the term. They alsoreceived at least a partial insight into the way in which
science ‘works’, and many of them were aware for thefirst time of the ways in which scientific research ispublished. However, dissemination of information fromsuch projects can go beyond the participants themselves.The media are keen to report the results of studiesinvolving volunteers. Evans et al. (2000) suggested that,because of media attention, the results of volunteer sur-veys may have wider impacts than other ‘purely scien-tific’ studies. The wider implications are enormousbecause there can be little doubt that the lay public’sfailure to comprehend scientific issues is a root cause ofthe under-funding of science (Anon, 2000).Volunteers may also bring attributes of scientific
studies so that they contribute significantly more than aworkforce that collects data. These may be of threekinds:
(i) Special skills. This applies, for example, to the
abilities of amateur ornithologists to identify birdspecies. Their skills have been used for the benefitof several major projects, such as distributionand abundance of waders and wildfowl in Britishcoastal waters (Prater, 1981), surveys of beachedbirds in the North Sea (Stowe, 1982) and sight-ings of birds and the subsequent publication ofthe Atlas of Australian Birds (Blakers et al.,1984). Similarly, two of the volunteers, who werealready familiar with common littoral organismswhen they joined the current project, con-centrated on collecting, and identifying poly-chaetes and echinoderms in the field exercise.These particular skills were not exploited in thesurveys but could have been used in moredetailed studies of these two groups of organ-isms. An example in which a specific benefit didaccrue from the involvement of volunteers isdescribed by Foster-Smith (2000). In a survey ofthe common species on the Northumberlandcoast volunteers provided many importantrecords of species other than those selected forthe project. For instance, one participant wasresponsible for the region’s first documentedrecord of the stalked jelly fish Craterolophusconvolvulus since 1856.(ii) Specialist knowledge. The specialist knowledge of
volunteers may be valuable in understanding thesignificance of the results of studies and especiallyin developing environmental management stra-tegies that are based on them. This is especiallytrue of groups such as fishers (Stevenson, 1996)or farmers (Wilson, 1997; Harrison et al., 1998)whose livelihoods bring them into close contactwith the environment.(iii) New insights. Hypotheses formulated by volun-
teers taking part in the present study could haveformed the basis of further study. For example,J. Foster-Smith, S.M. Evans / Biological Conservation 113 (2003) 199–213 211
research could provide an explanation for theobservation that individual N. lapillus were largerthan usual on part of the shore, where they hadbeen absent for a decade or so, but have now re-colonised. Evans (personal observations) believesthat this has occurred at other locations wherethe species has re-colonised shores, and that itmay be related to food availability and/or theabsence of predators in such places. Differencesin population structure of the top shellsG. cineraria and G. umbilicalis are also of interest.They may be related to differences in reproduc-tive performance and annual recruitment in thetwo species (see Kendall and Lewis, 1986).
Acknowledgements
We would like to thank the Earthwatch Institute andthe British Ecological Society for their support of theproject, and especially Dr. Pamela Mackney, NatSpring and Professor Rob Marrs for their interest in theresearch. Thanks are also due to Dr. Rupert Ormond,Director of the University Marine Biological Station,Millport, for permission to use the facilities at theLaboratory and the unfailing helpfulness of his staff,and to the two referees for helpful comments on theoriginal manuscript. Howard McCrindle gave us a moststimulating and idiosyncratic lecture on the formerbasking shark fishery, for which we are most grateful.We are also grateful to Dr. Bob Foster-Smith for pro-viding his expertise in the use of MapInfoTM GIS soft-ware. Not least we thank our fellow scientists, Dr.Rachel Welch and Christian Moss for their support inall weathers and the excellent group of volunteers,Diane Collins, Alison Holdsworth, Anna Holdsworth,Diana Holdsworth, Louise Johnson, Lorna Kendrick,Gabrielle Knapton, Simon Laman, Jenny Prince, RogerReynolds, Robin Shrubsole, Phil Wensley and JohnYoung. We thoroughly enjoyed their company andlearnt a great deal from them. We hope that they toofeel that they benefited from the course and Millport’sexhilarating summer weather!
References
Anon., 2000. The House of Lords Select Committee on Science and
Technology, 3rd Report: Science and Society. HMSO, London.
Biodiversity: The UK Action Plan, 1994. Biodiversity: The UK Action
Plan. HMSO, London.
Birchenough, A.C., Evans, S.M., Welch, R., 2001. A Tyne for change.
Science and Public Affairs August 2001, 18–19.
Blakers, M., Davies, S.J.J.F., Reilly, P.M., 1984. Australian Atlas of
Birds. Melbourne University Press, Carlton, Victoria.
Chou, L.M., 1994. Living coastal resources of southeast Asia: man-
agement through continuing education by institutions of higher
education. Aquatic Conservation: Freshwater and Marine Ecosys-
tems 4, 179–184.
Darwall, W.R.T., Dulvy, N.T., 1996. An evaluation of the suitability
of non-specialist volunteer researchers for coral reef fish surveys.
Mafia Island, Tanzania–a case study. Biological Conservation 78,
223–231.
Ellis, S.L., Cowan, D.F., 2002. Volunteer-based monitoring of juvenile
American lobster, Homarus americanus. Marine and Freshwater
Research 52, 1103–1112.
Evans, S.M., Birchenough, A.C., 2001. Community-based manage-
ment of the environment: lessons from the past and options for the
future. Aquatic Conservation: Marine and Freshwater Ecosystems
11, 137–147.
Evans, S.M., Hawkins, S.T., Porter, J., Samosir, A.M., 1994. Recov-
ery of dogwhelk populations on the Isle of Cumbrae, Scotland fol-
lowing legislation limiting the use of TBT-based anti-fouling paints.
Marine Pollution Bulletin 28, 15–17.
Evans, S.M., Birchenough, A.C., Fletcher, H., 2000. The value and
validity of community-based research: TBT contamination of the
North Sea. Marine Pollution Bulletin 40, 220–225.
Evans, S.M., Foster-Smith, J., Welch, R., 2001. Volunteers assess
marine biodiversity. Biologist 48, 168–172.
Fore, L.S., Paulsen, K., O’Laughlin, K., 2001. Assessing the perfor-
mance of volunteers in monitoring streams. Freshwater Biology 46,
109–123.
Foster-Smith, J., 2000. The Northumberland Coast Marine Biodi-
versity Project: building records of common species. Porcupine
Marine Natural History Society Newsletter No. 4, 3–13.
Gilmour, J., Saunders, D.A., 1995. Earthwatch: an international net-
work in support of research on nature conservation. In: Saunders,
D.A., Craig, J.L., Mattiske, E.M. (Eds.), Nature Conservation 4:
The Role of Networks. Beatty and Sons, Surrey, pp. 627–633.
Halusky, J.G., Seaman, W., Strawbridge, E.W., 1994. Effectiveness of
training volunteer divers in scientific documentation of artificial
aquatic habitats. Bulletin of Marine Science 55, 939–959.
Harger, J.R.E., 1988. Community displacement in stressed coral reef
systems and the implications for a comprehensive management
strategy for coastal and offshore productivity enrichment. Galaxea
7, 185–196.
Harrison, C.M., Burgess, J., Clark, J., 1998. Discounted knowledge:
farmers’ and residents’ understandings of nature conservation goals
and policies. Journal of Environmental management 54, 304–320.
Hodgson, G., 1999. A global assessment of human effects on coral
reefs. Marine Pollution Bulletin 38, 345–355.
Jacoby, C., Manning, C., Fritz, S., Rose, L., 1997. Three initiatives for
monitoring of Australian coasts by the community. Ocean and
Coastal Management 36, 205–226.
Kendall, M.A., Lewis, J.R., 1986. Temporal and spatial patterns in the
recruitment of Gibbula umbilicalis. Hydrobiologia 142, 15–22.
Lewis, J.R., 1999. Coastal zone conservation and management: a bio-
logical indicator of climatic influences. Aquatic Conservation: Mar-
ine and Freshwater Ecosystems 9, 401–405.
Mumby, P.A., Harborne, A.R., Raines, R.P., Ridley, J.M., 1995. A
critical appraisal of data derived from Coral Cay Conservation
volunteers. Bulletin of Marine Science 56, 737–751.
Prater, A.J., 1981. Estuary Birds of Britain and Ireland. T and A.D.
Poyser, Calton.
Saunders, D.A., 2002. Conservation research leads to a paradigm shift
in farming practice: a case study from the Western Australian
wheatbelt. In: Lunney, D., Dickman, C.R., Burgin, S. (Eds.), Com-
munity and Research-based Conservation: A Clash of Paradigms.
Royal Zoological Society of New South Wales, Mosman.
Stevenson, M.G., 1996. Indigenous knowledge in environmental
assessment. Arctic 49, 278–291.
Stowe, T.A., 1982. Beached Bird Surveys and Surveillance of Cliff-
breeding Birds. Royal Society for the Protection of Birds, Sandy,
Bedfordshire, England.
212 J. Foster-Smith, S.M. Evans / Biological Conservation 113 (2003) 199–213

Sykes, J.M., Horrill, A.D., Mountford, M.D., 1983. Use of visual
cover assessments as quantitative estimators of some British wood-
land taxa. Journal of Ecology 71, 437–450.
Wescott, G., 1998. Reforming coastal management to improve com-
munity participation and integration in Victoria, Australia. Coastal
Management 26, 3–15.
Wilson, G.A., 1997. Assessing the environmental impact of the Envir-
onmentally Sensitive Areas Scheme: a case for farmers’ environ-
mental knowledge? Landscape Research 22, 303–326.
World Conservation Strategy, 1980. World Conservation Strategy.
Living Resource Conservation for Sustainable Development.
IUCN, UNEP and WWF, Gland, Switzerland.
J. Foster-Smith, S.M. Evans / Biological Conservation 113 (2003) 199–213 213
Recommended