Coastal Engineering 87 (2014) 218–239
Contents lists available at ScienceDirect
Coastal Engineering
j ourna l homepage: www.e lsev ie r .com/ locate /coasta leng
THESEUS decision support system for coastal risk management
Barbara Zanuttigh a, Dario Simcic b, Stefano Bagli a, Fabio Bozzeda a, Luca Pietrantoni a, Fabio Zagonari a,Simon Hoggart c, Robert J. Nicholls d
a University of Bologna, Italyb GeoGraphics S.r.l., Ferrara, Italyc University of Plymouth, United Kingdomd University of Southampton, United Kingdom
0378-3839/$ – see front matter © 2013 Elsevier B.V. All rihttp://dx.doi.org/10.1016/j.coastaleng.2013.11.013
a b s t r a c t
a r t i c l e i n f oArticle history:Received 29 June 2013Received in revised form 14 November 2013Accepted 22 November 2013Available online 25 December 2013
Keywords:Decision support systemScenario analysisRisk assessmentRisk mitigationSocietyEconomyEcologyGIS
While planning coastal riskmanagement strategies, coastal managers need to assess risk across a range of spatialand temporal scales. GIS-based tools are one efficient way to support them in the decision making processthrough a scenarios analysis starting from social, economic and environmental information integrated into acommon platform. However, this integration process requires a significant effort from a team of scientists interms of a) identifying the appropriate scales and data resolution for analysing social, environmental and eco-nomic issues; b) selecting and linking an appropriate set of tools to build a coupled model; c) representing keyemerging (and hence challenging) research issues, such as risk perception and social resilience in the model;d) developing multi-criteria analysis to integrate social, environmental, economic impacts; and e) accountingfor the expectations of the stakeholders and therefore optimizing the opportunity for them to interact with thetool development and with the final tool itself.In this spirit, this paper presents an open-source Spatial Decision Support System developedwithin the THESEUSProject to help decisionmakers to scopeg optimal strategies tominimise coastal risks. The exploratory tool allowsthe users to perform an integrated coastal risk assessment, to analyse the effects of different combinations ofengineering, social, economic and ecologically based mitigation options, across short (2020s), medium (2050s)and long-term (2080s) scenarios, taking into account physical and non-physical drivers, such as climate change,subsidence, population and economic growth.
© 2013 Elsevier B.V. All rights reserved.
1. Introduction
Improving the adaptive capacity of individuals, groups or organiza-tions requires communicating present and possible trends in risk,building awareness of potential impacts and their implications, andunderstanding the available mitigation options.
And yet one of the biggest criticisms of much research is that it is notaccessible, including policymakers whose decisions help to shape ourfuture world. This is especially true for multi-dimensional problemswhere a system view is most effective at capturing the key issues andbehaviour. However, this necessitates multi-disciplinary working andusually requires engagement with the relevant stakeholders.
A good example issue is coastal flooding and erosion risk manage-ment where multiple and interacting factors embracing, human safety,the environment and society must be considered, requiring a systemperspective (Narayan et al., 2014; Thorne et al., 2007).
A spatial Decision Support System (DSS) is a computer-based soft-ware tool that can assist decision makers in their decision process.Such a DSS is an exploratory tool that allows to assess the conditionsof a system under a variety of scenarios and the consequences of
ghts reserved.
different adaptation andmitigationmeasures. A DSSwill generally inte-grate the relevant environmental models, database and assessmenttools – coupled within a Graphic User Interface (GUI), Spatial problemssuch as flood and erosion risk requires a Geographical InformationSystem (GIS) approach. GIS is a set of computer tools that can capture,manipulate, process and display spatial or geo-referenced data facilitat-ing spatial data integration, analysis and visualization (Burrough andMcDonnell, 1998). These functionalities make GIS-tools useful for effi-cient development and effective implementation of DSS within themanagement process. For this purpose GIS tools are used either asdata managers (i.e. as a spatial geo-database tool) or as an end in itself(i.e. media to communicate information to decision makers). The useof GIS for coastal zone management has expanded rapidly during thepast decade (Bartlett and Smith, 2004; Sheppard, 2012; Wright andBartlett, 2000; Wright et al., 2011).
Based on a review of a range of existingDSSswhich dealwith coastalareas (Table 1), the main objectives of these tools are the analysis ofvulnerability, impacts and risks, and the identification and evaluationof related management options, in order to support robust decisionsfor sustainablemanagement. Specifically, the objectives of the examined
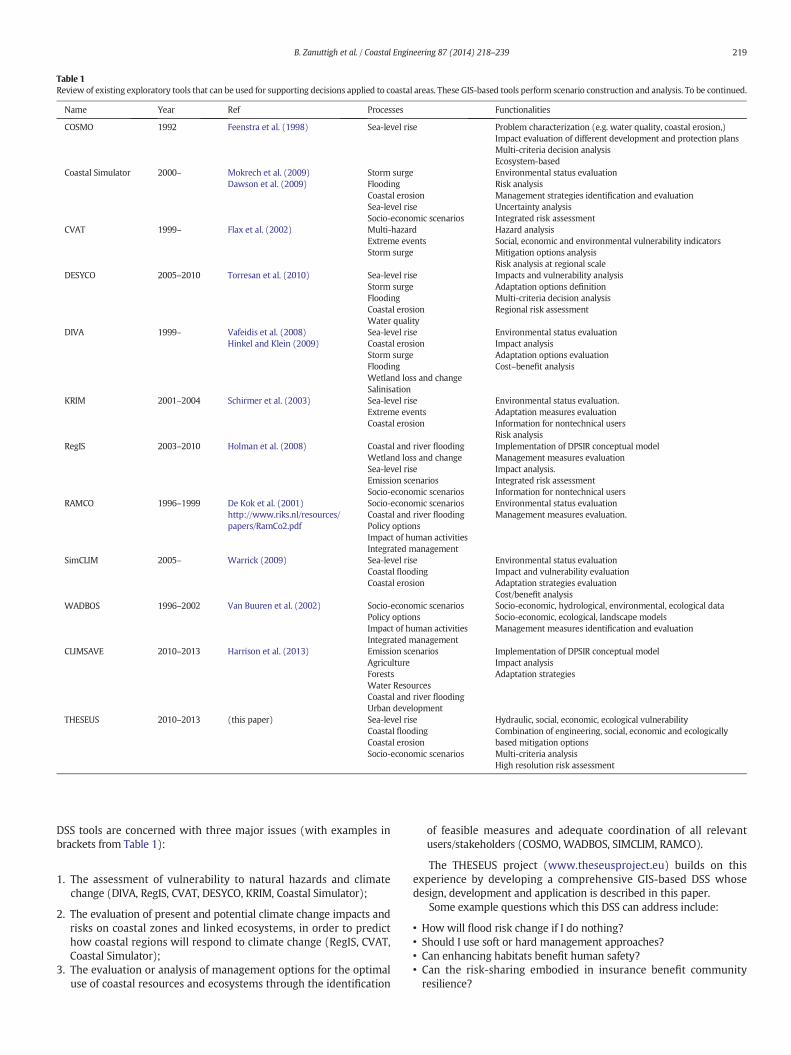
Table 1Review of existing exploratory tools that can be used for supporting decisions applied to coastal areas. These GIS-based tools perform scenario construction and analysis. To be continued.
Name Year Ref Processes Functionalities
COSMO 1992 Feenstra et al. (1998) Sea-level rise Problem characterization (e.g. water quality, coastal erosion,)Impact evaluation of different development and protection plansMulti-criteria decision analysisEcosystem-based
Coastal Simulator 2000– Mokrech et al. (2009)Dawson et al. (2009)
Storm surgeFloodingCoastal erosionSea-level riseSocio-economic scenarios
Environmental status evaluationRisk analysisManagement strategies identification and evaluationUncertainty analysisIntegrated risk assessment
CVAT 1999– Flax et al. (2002) Multi-hazardExtreme eventsStorm surge
Hazard analysisSocial, economic and environmental vulnerability indicatorsMitigation options analysisRisk analysis at regional scale
DESYCO 2005–2010 Torresan et al. (2010) Sea-level riseStorm surgeFloodingCoastal erosionWater quality
Impacts and vulnerability analysisAdaptation options definitionMulti-criteria decision analysisRegional risk assessment
DIVA 1999– Vafeidis et al. (2008)Hinkel and Klein (2009)
Sea-level riseCoastal erosionStorm surgeFloodingWetland loss and changeSalinisation
Environmental status evaluationImpact analysisAdaptation options evaluationCost–benefit analysis
KRIM 2001–2004 Schirmer et al. (2003) Sea-level riseExtreme eventsCoastal erosion
Environmental status evaluation.Adaptation measures evaluationInformation for nontechnical usersRisk analysis
RegIS 2003–2010 Holman et al. (2008) Coastal and river floodingWetland loss and changeSea-level riseEmission scenariosSocio-economic scenarios
Implementation of DPSIR conceptual modelManagement measures evaluationImpact analysis.Integrated risk assessmentInformation for nontechnical users
RAMCO 1996–1999 De Kok et al. (2001)http://www.riks.nl/resources/papers/RamCo2.pdf
Socio-economic scenariosCoastal and river floodingPolicy optionsImpact of human activitiesIntegrated management
Environmental status evaluationManagement measures evaluation.
SimCLIM 2005– Warrick (2009) Sea-level riseCoastal floodingCoastal erosion
Environmental status evaluationImpact and vulnerability evaluationAdaptation strategies evaluationCost/benefit analysis
WADBOS 1996–2002 Van Buuren et al. (2002) Socio-economic scenariosPolicy optionsImpact of human activitiesIntegrated management
Socio-economic, hydrological, environmental, ecological dataSocio-economic, ecological, landscape modelsManagement measures identification and evaluation
CLIMSAVE 2010–2013 Harrison et al. (2013) Emission scenariosAgricultureForestsWater ResourcesCoastal and river floodingUrban development
Implementation of DPSIR conceptual modelImpact analysisAdaptation strategies
THESEUS 2010–2013 (this paper) Sea-level riseCoastal floodingCoastal erosionSocio-economic scenarios
Hydraulic, social, economic, ecological vulnerabilityCombination of engineering, social, economic and ecologicallybased mitigation optionsMulti-criteria analysisHigh resolution risk assessment
219B. Zanuttigh et al. / Coastal Engineering 87 (2014) 218–239
DSS tools are concerned with three major issues (with examples inbrackets from Table 1):
1. The assessment of vulnerability to natural hazards and climatechange (DIVA, RegIS, CVAT, DESYCO, KRIM, Coastal Simulator);
2. The evaluation of present and potential climate change impacts andrisks on coastal zones and linked ecosystems, in order to predicthow coastal regions will respond to climate change (RegIS, CVAT,Coastal Simulator);
3. The evaluation or analysis of management options for the optimaluse of coastal resources and ecosystems through the identification
of feasible measures and adequate coordination of all relevantusers/stakeholders (COSMO, WADBOS, SIMCLIM, RAMCO).
The THESEUS project (www.theseusproject.eu) builds on thisexperience by developing a comprehensive GIS-based DSS whosedesign, development and application is described in this paper.
Some example questions which this DSS can address include:
• How will flood risk change if I do nothing?• Should I use soft or hard management approaches?• Can enhancing habitats benefit human safety?• Can the risk-sharing embodied in insurance benefit communityresilience?
220 B. Zanuttigh et al. / Coastal Engineering 87 (2014) 218–239
The THESEUS DSS is intended as a vehicle for communication,training, forecasting and experimentation. It fills a gap among theexisting tools, based on the following pillars.
• It provides seamless integration across disciplines: physics, engineer-ing, ecology, social sciences and economy.
• It considers intermediate spatial scales (10–100 km) and short-,medium- and long-term time spans (1–10–100 years).
• It allows diverse portfolios of mitigation options such as engineeringdefences (i.e. barriers, wave farms), ecologically-based solutions(i.e. biogenic reefs, sea-grasses) and socio-economic mitigations(i.e. insurance, change of land use);
• It supports decision-making based on a balance between determinis-tic models and expert, discussion-based assumptions.
• It uses an open source approach – based on a specific request fromthe European Commission – to maximise the availability and uptakeof the tool.
This paper first describes in Section 2 the conceptual model frame-work around which THESEUS DSS was built, and the main modellingchallenges when describing physical, ecological, and human (social/economic) processes and assessing the system status. Section 3 summa-rises the goal of the DSS and the intended application at the Science andPolicy interface (SPI), including the stakeholder-informed designmeasures adopted for promoting its exploitation. Section 4 details thetechnical structure of the DSS, including scenarios and mitigationoptions, and the most significant results using Cesenatico, Italy, asan example. Lastly, Section 5 critically discusses the limitation ofTHESEUS DSS and the wider lessons of this exercise.
2. The modelling framework
2.1. Conceptual framework
The conceptual model for coastal risk assessment proposed inTHESEUS is based on the Source–Pathway–Receptor–Consequence(SPRC) model that is widely used in the fields of waste and pollutionmanagement (FLOODsite, 2009; Narayan et al., 2012, 2014; Thorneet al., 2007). The SPRC model is a simple 1D–2D conceptual modelfor representing flood systems and processes that lead to particularflooding consequences. Effectively, the SPRC represents how theSources (in this case, waves, tide, storm surge, mean sea level, riverdischarge, run-off) through the Pathways (including, coastal defenceunits) affect the Receptors (buildings, infrastructure, habitats, etc.)generating economic, social and environmental Consequences. Scenari-os of change will modify the consequences of flooding and, given ad-verse trends such as sea-level rise and increasing coastal development,will increase them.Mitigation options fromawidemenuof engineering,ecological and social options can offset this increase in Consequences,and keep risk at a socially-acceptable level.
Following DINAS-COAST (2004), SafeCoast (2008), and FLOODsite(2009) approach, THESEUS also adopts a scenario framework thatconsiders the present situation (2010), and three future scenarios:short (2020s), medium (2050s) and long-term (2080s). In THESEUS,the coastal risk assessment is performed at a high spatial resolutionusing a Digital Elevation Model (DEM) to support detailed coastalmanagement analysis of receptors, consequences and their mitigation.
Sources have been distinguished as primary and secondary. The pri-mary sources are the weather-related phenomena which generatewater that could cause flooding. The secondary sources are the physicalmanifestations of the abovewhichmay cause flooding, e.g. wave, surge,and changes in river volume and flow. For environmental purposes,Sources are essentially classified into three groups according to dura-tion: short-term processes (storm surge, wind waves, tides, run-offdue to downpours); seasonal – river high/low waters; and long-termprocesses (sea-level rise, subsidence).
Source statistics are defined in the study sites by compiling existingresearch archives (PRUDENCE3 or HIPOCAS4 from the IPCC AR4) andnew data through a number of hindcast and downscaling activities,see Weisse et al. (2014). This approach delivers a comprehensive pic-ture of present and potential future climate changes in the study sitesand provides an assessment of the uncertainties associated with thesechanges. Climate parameters include: extreme sea levels and waveheights; long-term variation of extreme sea level occurrence; annualfrequency distribution of extreme sea levels for different return periods;extreme sea levels; statistics of storm surges; sea level pressure fields ofmajor flooding events; and present and extreme river discharges ifappropriate (see Monbaliu et al., 2014).
Pathways are the route and processes which are active during aflood event and there must be at least one pathway between the sourceand receptor otherwise no consequences can occur. Pathways are arelative concept and they include the components of the flood systemand management through or over which flood waters flow, such ashabitats relevant for coastal protection, hard and soft coastal defences,and infrastructure. It is worth remembering that an individual pathwaymay lead to multiple receptors and individual receptors may havemultiple pathways (Narayan et al., 2014). The DSS model needs to beable to describe multiple sets of flood routings.
Understanding the interaction between socio-economic and bio-physical system components is complex and the subject of ongoing re-search, because terms, methods, and scales of analysis differ betweennatural and social science and are often not comparable (Adger et al.,2004). These data have to be related to each other in a way thatmakes sense for analysing vulnerability in a specific region and societyon a scale that is useful for delivering outputs that can be transferredinto the decision making processes. To operationalise vulnerabilityand resilience and to create vulnerability profiles the identificationand quantification of a variety of indicators on different scales have tobe further developed (Brooks et al., 2005).
However, the SPRC includes the physical, ecological (habitat) andsocio-economic aspects of the flood system and hence provides an inte-grated framework which the DSS exploits. The physical, habitat andsocio-economic analysis and their influence on Pathways and Receptorsare considered separately and detailed in the following sub-Sections.
2.2. Modelling physical processes
In order to be fully integrated in the DSS a floodmodel must achievethe following requirements:
- Predict and represent spatial (raster maps) and temporal character-istics of the flood required by environmental and socio-economicalrisk assessment procedures, with a particular emphasis on maxi-mum or worst case values of flood characteristics (mainly waterdepth, velocity and flood duration);
- Produce runs for several risk assessment scenarios (for instance bychanging mitigation measures and climate scenarios) in a shorttime;
- Simulate flooding due to overtopping, overflow and failure ofdefence measures, including beach retreat;
- Be easily embedded inside the open-source DSS developed inside aGIS framework (desktop or web-based).
There are numerous hydrodynamic models that can be used tosimulate the propagation of flood water across floodplain areas. Thesemodels generally solve a form of the 2D shallow water equationsand range in complexity from raster-based approaches (Bates andAnderson, 1996; Bates and De Roo, 2000; Bates et al., 2005; Bradbrooket al., 2004; Dottori and Todini, 2011; Horritt and Bates, 2001) – thatare based on the Manning equation – to more complex finite volumeapproaches that solve the full 2D equations (Lane and Richards, 1998).
221B. Zanuttigh et al. / Coastal Engineering 87 (2014) 218–239
These models are computationally expensive to run, can suffer frominstability problems and are time consuming to set up. For these reasonstheir application and integration in THESEUS DSS was impractical.
Alternatively, simple GIS-based flood inundation or flood spreadingmodels (Brown, 2006; Poulter and Halpin, 2008) can be easily imple-mented in a DSS in order to map the extent of the flood. This approachdoes not use a physically based model but performs flood mappingthrough the spreading of water levels or volumes in a DEM using aGIS-raster based approach, through several techniques (Chen et al.,2009; Gouldby et al., 2008; Lhomme et al., 2008; Wang et al., 2010;Zerger et al., 2002).
The GIS-based flood inundation model selected and implementedfor the THESUS DSS is developed by considering a water overflowmethod, combined with erosion where appropriate. The methodfollows the marker controlled watershed segmentation algorithm de-scribed by Meyer and Beucher (1990) and Soille and Ansoult (1990).This algorithm floods each pixel that is located on a lower level withrespect to the fixed water level and that is spatially “connected” to theflooding sources. Through this algorithm it is possible to produce floodmaps for different storm surge levels and with multiple sources offlood. This algorithm has been modified within THESEUS to includefinite water volumes which are varying with time: this is a significantimprovement with respect to the existing bath-tub approach adoptedin many similar existing tools (a.o. DIVA, RegIS, RAMCO).
Firstly, the water overflow of a sea bank (either a seawall or a beachbank/dune) during a flood is evaluated through the following procedure(Martinelli et al., 2010).
Waves are transferred for a given tidal range from offshore to theshore, including wave reduction due to structures where applicable,using an analytical Matlab procedure. The reduction of wave heightinduced by structures or other kinds of mitigation measures is alsoconsidered (see Section 4 for details).
In order to define in a simple and quantitative way the floodingprocess, the proposed failure mechanism is given by
Zm þ Zr þ ηþ Ru2%ð Þ–ZbankN ¼ 0 ð1Þ
where Zm is the storm surge level, Zr is the sea-level rise induced byclimate change effects; η is wave set-up; Ru2% is wave run-up corre-sponding to the characteristic value of 2% exceeding probability; Zbankis the crest height of the sea bank (equal to the beach height plus thedune height/seawall, if applicable).
Eq. (1) is based on the following simplified assumptions:
- Non-erodible cross-shore beach profile during the storm;- Absence of defence breaching against wave and tidal loads.
Wave run-up is computed by means of Stockdon et al. (2006):
Ru2% ¼ 1:1 � 0:35 � tan β HsL0ð Þ1=2 þ 0:5 � H0L0 0:563 � tan β2 þ 0:004� �h i1=2� �
ð2Þ
where Eq. (2) is modified to include as Hs the local transmitted signifi-cantwave height and as L0 is the corresponding local peakwave length;β is the beach slope defined as the average slope over a region of twotimes the standard deviation of a continuous water-level record (β isabout 0.01). Eq. (2) already accounts for wave set-up η on naturalbeaches.
A random-phase Gaussian process is generated having 2% character-istic value consistent with the value of Ru2% estimated from Eq. (2).
The “off-shore” boundary is thusmoved to the “sea bank line”wherethe boundary condition considers a varying level in time W(t) given byEq. (2). The flood wave propagation is then simulated as a dam-break,where the wave celerity is indirectly represented by the contributionof Ru2% (i.e. potential wave energy at the shoreline).
The flood level W(t) is integrated on coastal segments in time toprovide water volumes as input data for the flood model.
Furthermoremost existing coastal flooding tools do not consider theeffect of coastal erosion.Within the THESEUSDSS, the erosion process isrepresented by means of a simple 1-line model based on Miller andDean (2004). The variation of the shoreline position and therefore ofthe beach width is reflected in the slope to be included in Eq. (2) forestimating wave run-up.
The erosion model is based on the assumption that the startingshoreline position assumed in the calculations corresponds to theequilibrium position.
The governing differential equation is
dy tð Þdt
¼ k � yeq tð Þ−y tð Þð Þ ð3Þ
which hypothesises that the shoreline approaches an equilibrium format an approximately exponential rate. In Eq. (3), y(t) is the shorelineposition at time t; yeq(t) is the equilibrium shoreline position deter-mined by the forcing at time t; k is the constant governing the rate atwhich the shoreline approaches equilibrium.
The differential equation is solved by utilizing a numerical finitedifference approach (Miller and Dean, 2004), resulting in:
ynþ1 ¼yn þ A yeqnþ1 þ yeqn
� �−yn
h i1þ A
where A ¼ kΔt2
ð4Þ
In Eq. (4) the equilibrium shoreline change, Δyeq, is based on theequilibrium beach profile theory and a Bruun-type conservation ofvolume argument (Miller and Dean, 2004):
Δyeq ¼ −w tð Þ � � 0:106 � Hs tð Þ þ SBhþ 2 � Hs tð Þ
� �;w � tð Þ ¼ db
ADean
� �1:5
being: Bh the berm height, S the storm surge, Hs i the significant waveheight at breaking depth db, and ADean Dean's parameter.
The equilibrium shoreline change expression is slightly modified byintroducing the tidal range, CM, as follows:
Δyeq ¼ −w tð Þ � � 0:106 � Hs tð Þ þ SBhþ 2 � Hs tð Þ þ CM
� �;where w � tð Þ ¼ dbþ CM
ADean
� �1:5
;
ð5Þ
A limitation is that the presence of long-shore interruptions of sedi-ment transport, such as jetties, marinas and groynes, is not considered.Therefore the methodology is suited for open coasts only.
However, in the DSS the end users can interact directly by providinga shape file of the eroded shoreline predictable on the basis of expertjudgement and/or historical trends.
2.3. Modelling coastal ecosystems
Coastal ecosystems are of great environmental significance: theecological communities found in these areas represent a transitionfrom both aquatic to terrestrial environments andmarine to freshwaterenvironments and are some of themost productive and valuable aquaticecosystems (Vasconcelos et al., 2007). Over the past decade changes incoastal ecosystems have predominantly been attributed to humansrather than natural processes (MEA, 2005). Such changes are causedby the necessity to meet the rapidly growing demand for food, waterand fuel by the increasing human population. Coastal ecosystems areunder considerable additional pressure, due to disproportionally largecoastal population growth and development. With changes in climate,coastal ecosystems face an additional threat: increasing seawater levelsand changes in the weather patterns which are also likely to increasethe vulnerability of coastal ecosystems to human-induced and natural
222 B. Zanuttigh et al. / Coastal Engineering 87 (2014) 218–239
stressors. In Europe, these are especially important as many ofthese habitats are designated under the Habitats Directives and yetthreatened by human-induced changes, such as climate change andsea-level rise. Hence, the vulnerability of coastal ecosystems has beenexplicitly modelled as part of THESEUS DSS.
The modelling considers the impacts of flooding on coastal ecosys-tems from both a short term and long term perspective, as explainedin the following.
Impacts of floods are evaluated in relation to community and habitatvulnerability and also resilience to flooding, erosion and damage associ-ated with storm events. Vulnerability is considered to arise from thesystem's inherent properties, which determine resistance and resil-ience. An ecosystem can be defined as resistant if it has a high abilityto withstand disturbance events. Resilience is the time the ecosystemneeds to recover to the state before the disturbance event took place:a rapid recovery time leads to a high resilience and vice versa. As such,the most vulnerable ecosystems are the ones in which both resistanceand resilience are low; thepersistence of such systems is highly unlikely,especially under unfavourable scenarios of climate change.
The ecological modelling carried out in THESEUS has developedan Environmental Vulnerability Index (EVI) for 10 coastal habitatsincluding: terrestrial grasslands, terrestrial broadleaf and pine wood-lands, sand dunes, salt marshes, biogenic reefs, rocky shore habitats,sub-tidal rocky habitats, sub-tidal soft sediments and seagrassmeadows.These habitats represent key coastal ecosystems across Europe that arealso found within the THESEUS study sites and are considered to be atrisk from flooding. While these habitats are addressed individually,they are linked in various ways (Vannote et al., 1980). For examplethere is a continuum from sub-tidal sandy habitats to sand dune habitats(Hanley et al., 2014) and dune systems, seagrass meadows and biogenicreefs are sensitive to sediment dynamics and erosion or rapid accretioncan have negative impacts on these ecosystems. For rocky shores, amajor vulnerability is the impact of sedimentation on communities,particularly over the short term. Over longer time scales coastal squeezecould also present amajor threat to biodiversity, where direct losses dueto sea-level rise are reinforced by anthropogenic coastal modificationssuch as the construction of coastal defence walls.
The types of habitat/features to be mapped in the DSS include:
1. Habitat extent: in the form of a habitat land use map (i.e. habitatshapefile), including both intertidal and terrestrial habitats, andappropriate shallow sub-tidal communities;
2. Protected sites: sites designated for their ecological importance. Thisshould include Special Areas of Conservation (SACs), Special Protec-tion Areas (SPAs), Ramsar sites, nature reserves and other siteswith local or national protection designations;
3. Key species: key species to be described/listed including rare speciesand species protected under the Habitats Directive (EuropeanCommission, 1992);
4. Commercially important features: locations where economically im-portant species are harvested/farmed should be outlined along withareas that are designated for fishing (including recreational fishing);
5. Other important features: habitat features such as key breeding sitesfor birds or distinct habitat/land use related to the study site.
The habitats (and key species) affected by flooding and erosion areconsidered as Receptors following the SPRC methodology (Narayanet al., 2014). Hence they may change in response to changes in theSources as follows:
i. Short-term processes (storm surge, wind driven waves, tides);ii. Long-termprocesses (sea-level rise, vertical landmovements – uplift/
subsidence).
These processes have different effects on habitats. Short-termprocesses are temporary process where after inundation floodwaterwill subsequently retreat (see Hoggart et al., 2014, for a discussion onthe impact of salt water flooding to terrestrial areas). This imposes the
need for identification of several possibilities for effects on and the re-covery of habitats and species in respect to inundation duration. In con-trast, for inundation due to Long-term processes (e.g. sea level rise) it isassumed that the water will not retreat. While losing terrestrial habitatareas as a consequence of sea-level rise, it is important to recognise thataquatic habitatsmay be gained or expand resulting in no overall changein total area, but a change in the relative extent of different habitattypes. If habitats have the ability to “retreat” (the affected terrestrialhabitats can move landward), these newly occupied territories may beconsidered as additional coastal habitat. Alternatively where there isno possibility for habitat retreat because of natural or anthropogenicbarriers (coastal squeeze), intertidal habitats such as salt marshes areexpected to decline.
Seasonal effects are not considered in the present DSS modelling.To assess the vulnerability of ecosystems to changes in stresses
and to disturbances an index is adopted within the THESEUS project.This provides a rapid and standardised method for characterisingvulnerability across coastal systems, and identifies issues that mayneed to be addressed in order to reduce vulnerability. By looking atcombinations of factors, ecosystem vulnerability can be assessed. Suchfactors are the inherent ecosystem characteristics, the natural driversthat act upon the ecosystems, human use of the ecosystem, and theeffects of climate change.
Vulnerability of habitats is dependent on:
i. Which part of a particular habitat area will be a subject to theunfavourable impact and which species will be affected;
ii. The degree of sensitivity of habitats/key species to unfavourableimpact/hazard.
The proposed Environment Vulnerability Index (EVI) is similarto that used in Gornitz et al. (1994) and many subsequent studies(e.g., Boruff et al., 2005; Thieler and Hammar-Klose, 1999) to assesscoastal vulnerability. Coastal vulnerability index is calculated as thesquare root of the product of the ranked variables divided by the totalnumber of variables. The EVI ranked variables respond to the secondarySources for particular habitats:
EVI ¼ A1xA2x…xAnð Þ0:5=n ð6Þ
where A1, A2,…, An are different receptor habitats/species, identified forthe discrete area in question and n is the number of different receptorhabitats/species. Each habitat is given a score of 0, 1, 2 or 3 followingTable 2. Thresholds beyond which the index increases to a highervalue are determined by the specific EVI for each habitat and theattributes of the site.
The assessment of EVI uses the following steps.
1. Define sources: Different primary/secondary Sources are examinedwith respect to their potential to cause habitat degradation.
2. Identify and map habitat types, including: Terrestrial grasslands,terrestrial broadleaf and pine woodlands, sand dunes, salt marshes,biogenic reefs rocky shore habitats, sub-tidal rocky habitats, sub-tidal soft sediments and seagrass meadows.
3. Identify consequences of the source on each habitat receptor. Forinstance, storm surge (Source) affecting sand dunes will causeerosion and inundation.
4. Calculate the area affected. The approach will vary according to theSource and habitat Receptor. Use of a GIS platform permits delinea-tion and calculation of the inundated habitat. Construction of thesemaps requires both habitat maps and a DEM.
5. Calculate the EVI. This is calculated for each habitat following Eq. (6).A categorical score of 0 to 3 is given for each habitat based on the def-initions in Table 2. Four categories are proposed for Short-term andseasonal processes (categories 0, 1 and 2); for Long-term processesit is assumed that habitats will be permanently affected (category3). To establish the thresholds (shown in Table 2), for each habitat
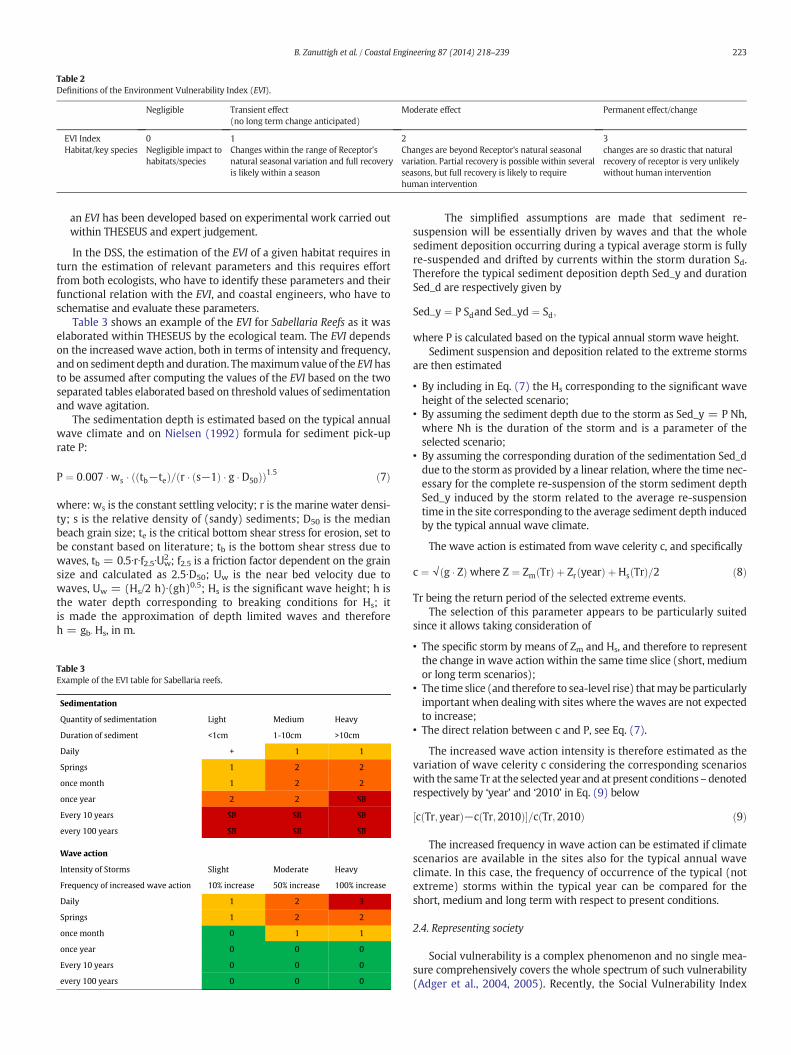
Table 2Definitions of the Environment Vulnerability Index (EVI).
Negligible Transient effect(no long term change anticipated)
Moderate effect Permanent effect/change
EVI Index 0 1 2 3Habitat/key species Negligible impact to
habitats/speciesChanges within the range of Receptor'snatural seasonal variation and full recoveryis likely within a season
Changes are beyond Receptor's natural seasonalvariation. Partial recovery is possible within severalseasons, but full recovery is likely to requirehuman intervention
changes are so drastic that naturalrecovery of receptor is very unlikelywithout human intervention
223B. Zanuttigh et al. / Coastal Engineering 87 (2014) 218–239
an EVI has been developed based on experimental work carried outwithin THESEUS and expert judgement.
In the DSS, the estimation of the EVI of a given habitat requires inturn the estimation of relevant parameters and this requires effortfrom both ecologists, who have to identify these parameters and theirfunctional relation with the EVI, and coastal engineers, who have toschematise and evaluate these parameters.
Table 3 shows an example of the EVI for Sabellaria Reefs as it waselaborated within THESEUS by the ecological team. The EVI dependson the increased wave action, both in terms of intensity and frequency,and on sediment depth and duration. Themaximumvalue of the EVI hasto be assumed after computing the values of the EVI based on the twoseparated tables elaborated based on threshold values of sedimentationand wave agitation.
The sedimentation depth is estimated based on the typical annualwave climate and on Nielsen (1992) formula for sediment pick-uprate P:
P ¼ 0:007 �ws � tb−teð Þ= r � s−1ð Þ � g � D50ð Þð Þ1:5 ð7Þ
where: ws is the constant settling velocity; r is the marine water densi-ty; s is the relative density of (sandy) sediments; D50 is the medianbeach grain size; te is the critical bottom shear stress for erosion, set tobe constant based on literature; tb is the bottom shear stress due towaves, tb = 0.5∙r∙f2.5∙Uw
2 ; f2.5 is a friction factor dependent on the grainsize and calculated as 2.5∙D50; Uw is the near bed velocity due towaves, Uw = (Hs/2 h)∙(gh)0.5; Hs is the significant wave height; h isthe water depth corresponding to breaking conditions for Hs; itis made the approximation of depth limited waves and thereforeh = gb∙ Hs, in m.
Table 3Example of the EVI table for Sabellaria reefs.
Sedimentation
Quantity of sedimentation
Duration of sediment
Daily
Springs
once month
once year
Every 10 years
every 100 years
Wave action
Intensity of Storms
Frequency of increased wave action
Daily
Springs
once month
once year
Every 10 years
every 100 years
Light
<1cm
+
1
1
2
SB
SB
Slight
10% increase
1
1
0
0
0
0
Medium
1-10cm
1
2
2
2
SB
SB
Moderate
50% increase
2
2
1
0
0
0
Heavy
>10cm
1
2
2
SB
SB
SB
Heavy
100% increase
3
2
1
0
0
0
The simplified assumptions are made that sediment re-suspension will be essentially driven by waves and that the wholesediment deposition occurring during a typical average storm is fullyre-suspended and drifted by currents within the storm duration Sd.Therefore the typical sediment deposition depth Sed_y and durationSed_d are respectively given by
SedXy ¼ P Sdand SedXyd ¼ Sd;
where P is calculated based on the typical annual storm wave height.Sediment suspension and deposition related to the extreme storms
are then estimated
• By including in Eq. (7) the Hs corresponding to the significant waveheight of the selected scenario;
• By assuming the sediment depth due to the storm as Sed_y = P Nh,where Nh is the duration of the storm and is a parameter of theselected scenario;
• By assuming the corresponding duration of the sedimentation Sed_ddue to the storm as provided by a linear relation, where the time nec-essary for the complete re-suspension of the storm sediment depthSed_y induced by the storm related to the average re-suspensiontime in the site corresponding to the average sediment depth inducedby the typical annual wave climate.
The wave action is estimated from wave celerity c, and specifically
c ¼ √ g � Zð Þwhere Z ¼ Zm Trð Þ þ Zr yearð Þ þHs Trð Þ=2 ð8Þ
Tr being the return period of the selected extreme events.The selection of this parameter appears to be particularly suited
since it allows taking consideration of
• The specific storm by means of Zm and Hs, and therefore to representthe change in wave action within the same time slice (short, mediumor long term scenarios);
• The time slice (and therefore to sea-level rise) thatmay be particularlyimportant when dealing with sites where the waves are not expectedto increase;
• The direct relation between c and P, see Eq. (7).
The increased wave action intensity is therefore estimated as thevariation of wave celerity c considering the corresponding scenarioswith the same Tr at the selected year and at present conditions–denotedrespectively by ‘year’ and ‘2010’ in Eq. (9) below
c Tr; yearð Þ−c Tr;2010ð Þ½ �=c Tr;2010ð Þ ð9Þ
The increased frequency in wave action can be estimated if climatescenarios are available in the sites also for the typical annual waveclimate. In this case, the frequency of occurrence of the typical (notextreme) storms within the typical year can be compared for theshort, medium and long term with respect to present conditions.
2.4. Representing society
Social vulnerability is a complex phenomenon and no single mea-sure comprehensively covers the whole spectrum of such vulnerability(Adger et al., 2004, 2005). Recently, the Social Vulnerability Index
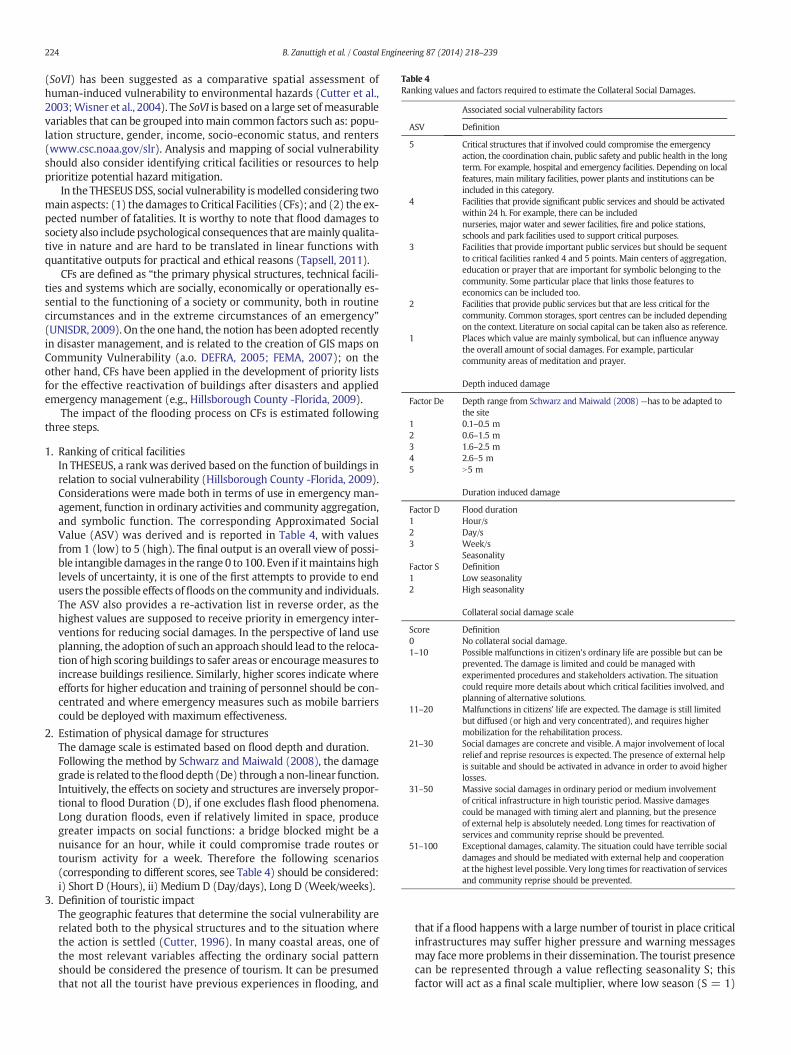
Table 4Ranking values and factors required to estimate the Collateral Social Damages.
Associated social vulnerability factors
ASV Definition
5 Critical structures that if involved could compromise the emergencyaction, the coordination chain, public safety and public health in the longterm. For example, hospital and emergency facilities. Depending on localfeatures, main military facilities, power plants and institutions can beincluded in this category.
4 Facilities that provide significant public services and should be activatedwithin 24 h. For example, there can be includednurseries, major water and sewer facilities, fire and police stations,schools and park facilities used to support critical purposes.
3 Facilities that provide important public services but should be sequentto critical facilities ranked 4 and 5 points. Main centers of aggregation,education or prayer that are important for symbolic belonging to thecommunity. Some particular place that links those features toeconomics can be included too.
2 Facilities that provide public services but that are less critical for thecommunity. Common storages, sport centres can be included dependingon the context. Literature on social capital can be taken also as reference.
1 Places which value are mainly symbolical, but can influence anywaythe overall amount of social damages. For example, particularcommunity areas of meditation and prayer.
Depth induced damage
Factor De Depth range from Schwarz and Maiwald (2008)—has to be adapted tothe site
1 0.1–0.5 m2 0.6–1.5 m3 1.6–2.5 m4 2.6–5 m5 N5 m
Duration induced damage
Factor D Flood duration1 Hour/s2 Day/s3 Week/s
SeasonalityFactor S Definition1 Low seasonality2 High seasonality
Collateral social damage scale
Score Definition0 No collateral social damage.1–10 Possible malfunctions in citizen's ordinary life are possible but can be
prevented. The damage is limited and could be managed withexperimented procedures and stakeholders activation. The situationcould require more details about which critical facilities involved, andplanning of alternative solutions.
11–20 Malfunctions in citizens' life are expected. The damage is still limitedbut diffused (or high and very concentrated), and requires highermobilization for the rehabilitation process.
21–30 Social damages are concrete and visible. A major involvement of localrelief and reprise resources is expected. The presence of external helpis suitable and should be activated in advance in order to avoid higherlosses.
31–50 Massive social damages in ordinary period or medium involvementof critical infrastructure in high touristic period. Massive damagescould be managed with timing alert and planning, but the presenceof external help is absolutely needed. Long times for reactivation ofservices and community reprise should be prevented.
51–100 Exceptional damages, calamity. The situation could have terrible socialdamages and should be mediated with external help and cooperationat the highest level possible. Very long times for reactivation of servicesand community reprise should be prevented.
224 B. Zanuttigh et al. / Coastal Engineering 87 (2014) 218–239
(SoVI) has been suggested as a comparative spatial assessment ofhuman-induced vulnerability to environmental hazards (Cutter et al.,2003;Wisner et al., 2004). The SoVI is based on a large set ofmeasurablevariables that can be grouped into main common factors such as: popu-lation structure, gender, income, socio-economic status, and renters(www.csc.noaa.gov/slr). Analysis and mapping of social vulnerabilityshould also consider identifying critical facilities or resources to helpprioritize potential hazard mitigation.
In the THESEUSDSS, social vulnerability ismodelled considering twomain aspects: (1) the damages to Critical Facilities (CFs); and (2) the ex-pected number of fatalities. It is worthy to note that flood damages tosociety also include psychological consequences that aremainly qualita-tive in nature and are hard to be translated in linear functions withquantitative outputs for practical and ethical reasons (Tapsell, 2011).
CFs are defined as “the primary physical structures, technical facili-ties and systems which are socially, economically or operationally es-sential to the functioning of a society or community, both in routinecircumstances and in the extreme circumstances of an emergency”(UNISDR, 2009). On the one hand, the notion has been adopted recentlyin disaster management, and is related to the creation of GIS maps onCommunity Vulnerability (a.o. DEFRA, 2005; FEMA, 2007); on theother hand, CFs have been applied in the development of priority listsfor the effective reactivation of buildings after disasters and appliedemergency management (e.g., Hillsborough County -Florida, 2009).
The impact of the flooding process on CFs is estimated followingthree steps.
1. Ranking of critical facilitiesIn THESEUS, a rankwas derived based on the function of buildings inrelation to social vulnerability (Hillsborough County -Florida, 2009).Considerations were made both in terms of use in emergency man-agement, function in ordinary activities and community aggregation,and symbolic function. The corresponding Approximated SocialValue (ASV) was derived and is reported in Table 4, with valuesfrom 1 (low) to 5 (high). The final output is an overall view of possi-ble intangible damages in the range 0 to 100. Even if itmaintains highlevels of uncertainty, it is one of the first attempts to provide to endusers the possible effects offloods on the community and individuals.The ASV also provides a re-activation list in reverse order, as thehighest values are supposed to receive priority in emergency inter-ventions for reducing social damages. In the perspective of land useplanning, the adoption of such an approach should lead to the reloca-tion of high scoring buildings to safer areas or encouragemeasures toincrease buildings resilience. Similarly, higher scores indicate whereefforts for higher education and training of personnel should be con-centrated and where emergency measures such as mobile barrierscould be deployed with maximum effectiveness.
2. Estimation of physical damage for structuresThe damage scale is estimated based on flood depth and duration.Following the method by Schwarz and Maiwald (2008), the damagegrade is related to theflooddepth (De) through a non-linear function.Intuitively, the effects on society and structures are inversely propor-tional to flood Duration (D), if one excludes flash flood phenomena.Long duration floods, even if relatively limited in space, producegreater impacts on social functions: a bridge blocked might be anuisance for an hour, while it could compromise trade routes ortourism activity for a week. Therefore the following scenarios(corresponding to different scores, see Table 4) should be considered:i) Short D (Hours), ii) Medium D (Day/days), Long D (Week/weeks).
3. Definition of touristic impactThe geographic features that determine the social vulnerability arerelated both to the physical structures and to the situation wherethe action is settled (Cutter, 1996). In many coastal areas, one ofthe most relevant variables affecting the ordinary social patternshould be considered the presence of tourism. It can be presumedthat not all the tourist have previous experiences in flooding, and
that if a flood happens with a large number of tourist in place criticalinfrastructures may suffer higher pressure and warning messagesmay facemore problems in their dissemination. The tourist presencecan be represented through a value reflecting seasonality S; thisfactor will act as a final scale multiplier, where low season (S = 1)
225B. Zanuttigh et al. / Coastal Engineering 87 (2014) 218–239
denotes ordinary conditions, and high season (S = 2) implies thatthe effects will be exacerbated.
The Collateral Social Damages (CSD) are finally estimated as:
CSD ¼ SIASVi � De � D � S ð10Þ
The value of CSD is related to a common scale to allow exportabilityto other case studies and comparison of the results. The scale is alsoreported in Table 4.
For tangible social damages, we derived a function of life losses andinjuries (NI) from Penning-Rowsell et al. (2005)
NI ¼ H � AVð Þ= Paþ IDð Þ ð11Þ
where H is the hazard rate, AV is the Area Vulnerability, Pa is the sensi-tive population (age b 14 years and N65 years) and ID is the number ofsick and disabled people.
The value of H is computed in each cell of the domain as
H ¼ NI � y � v � DF ð12Þ
where N is the number of people involved in the flood, y is the flooddepth, v is the flood velocity, DF is the debris factor equal to 1 for theMediterranean and 2 for the Ocean.
The Area Vulnerability AV is derived as:
AV ¼ Wþ Foþ Na ð13Þ
where W denotes theWarning, Fo is the speed of onset of flooding andNa is the Nature of the flooded Area, see Table 5.
The value of Na can be derived from statistical demographic dataor can be alternatively schematised based on Penning-Rowsell et al.(2005). If statistical data are available, their main use should beidentified and impact levels from 1 (low) to 3 (high) are attributed asshown in Table 5. Since social patterns determine the impact levels ofspecial attributes, three main scenarios were identified: day, night andtouristic periods. Higher impact was attributed to residential areaswhen people are generally at home sleeping (night), while zonesidentified for schools and education are vulnerable when children arein classes (day). Finally, tourist resorts are most susceptible duringholidays (touristic period).
The percentage of the Population Aged (Pa) can be derived from de-mographic data (ISTAT, 2009) or referred to national middle average.The final value of Pa should be conformed to a common value of 50as: Npa: ×50 = Pa:50, ×100 = nPa *(100/Pa).
The percentage of Infirm/Disabled/long-term sick (ID) can be setbased on perception or on the national average.
The values for the ID factors are synthesised in Table 5. In general,this function provides and overall count of people that could be subject
Table 5Ranking values and factors required to estimate Life losses and injuries.
W Not present Present but notimplemented
Present and wellworking
3 2 1So Slow flooding
(many hours)Gradual flooding(an hour or so)
Rapid flooding
1 2 3ID Low presence Medium presence High presence
10% 25% 50%Na Touristic season Day NightResidential area 2 1 3Tourist area 3 2 1Manufacturing 2 3 2Common or religious area 2 3 1Education area 1 3 1City centre 3 3 3Parking and green 1 1 1
to death or injuries. We decided not to distinguish between these twoaspects as too many external variables such as local lifestyle, wealth orpublic health services influence the final output of life losses, and theuncertainties are high.
2.5. Modelling the economy
In the literature, the Economic Vulnerability Index (EcVI)(Guillaumont, 2009) is derived from the composition of the followingseven indicators: 1) population size, 2) remoteness, 3) merchandiseexport concentration, 4) share of agriculture, forestry and fisheries ingross domestic product, 5) homelessness owing to natural disasters,6) instability of agricultural production, and 7) instability of exports ofgoods and services.
However, within a Multi-Criteria Analysis, where social andeconomic impacts must be distinguished and separately weighted,this index turned out to be inadequate, since it combines social andeconomic indicators. Instead, since detailed data on economic activitiesin Gross Domestic Product (GDP) terms were available, a consistentapproach based on incomes for each economic land use was adopted:e.g., hotels are evaluated in terms of annual GDP, houses are evaluatedin terms of annual rents, beaches are evaluated in terms of annualwillingness to pay to preserve them.
The overall Economic Consequences (EC) of flood in terms of flooddepth and flood duration are estimated by applying the followingformula:
EC ¼ vij · bj · Fdþ vij · aj√Fy ð14Þ
where vij are the values of land uses in euro/m2/year from census statis-tic data; Fd is flood duration and Fy is flood depth; aj are proportionalityconstants as functions of Fy that are normalised for each land use j at themaximum value of Fy in 2050 for a storm return period Tr = 100 years,assuming different reference percentage of damage depending on theuse (for instance, 50% damage for buildings/homes/hotels, 25% damagefor harbours); bj are proportionality constants as functions of Fd thatexpress the expected period to restore economic activities as a factorof duration, depend on the land use (for instance, a value of 30 is setfor hotels and of 20 for private services) and are normalised to annualincomes with the days/year. Note that flood velocity is assumed to beirrelevant.
The land use value loss is combined with beach loss due to erosion.The value function was derived from a choice experiment exercise car-ried out at the Santander site, ES, within THESEUS project distinguishingthe Willingness To Pay (WTP) for bio-diversity, health risk and recrea-tion. The instant value of the WTP (€/person/m2/years) is expressedbased on the following empirical relation
WTP ¼ 1=529;000ð Þ 30:358þ 0:408−0:002ð−5þ t−2010ð Þð Þð Þ� −60þ t−2010ð Þð Þ ð15Þ
where 529,000 is the Santander beach area and t is the year chosen bythe DSS users.
Eq. (15) supposes zero damage in case the beach width equals theinitial one, while damages are proportional to the eroded area dividedby the total (initial) beach area.
Alternatively, a consistent approach based onmarket values of infra-structures could have been used. Note that it is theoretically possible tomove from an income approach to an infrastructure approach under astandard set of assumptions about market competition.
2.6. Multi-criteria decision making
In the overall vulnerability analysis, multi-disciplinary approachesinvolve different experts, who come from different areas with distinctknowledge and experience, adopt different judgement and evaluation
226 B. Zanuttigh et al. / Coastal Engineering 87 (2014) 218–239
methods (e.g., qualitative and quantitative forms; certain and uncertainassessments), and tackle various and at least partially conflictingobjectives (Li et al., 2010).
Multi-Criteria Multi-Expert Decision Making (MCMEDM) is a meth-odology to dealwith the inherent complexity and uncertainty aswell asthe vague knowledge arising from the participation of many experts inthe decision making process (Yan et al., 2011).
Within THESEUS, issues related to vagueness or qualitative indexeswere not examined, since each expert group (i.e. ecologists, sociologistsand economists) reached an internal agreement on one ormore quanti-tative indexes to be applied: ecologists suggested an EVI index in [0,3],sociologists developed one indicator in [0,∞[for the affected populationand one indicator in [0,10] for CF, and economists relied on land usevalues in euro/m2 in [0,∞[.
Multi-Criteria Decision Making (MCDM) is a response to theinability of people to analyse multiple streams of unalike informationin a structured way: preferential information is modelled byweighting factors (i.e. inter-criteria comparisons) and value functions(i.e. intra-criteria preferences).
Thismethodologywas applied in THESEUS framework, byweightingthe three impacts (i.e. ecology, society, economy) according to stake-holders' preferences or other user specifiedweights and by normalisingall values estimated by experts.
3. End user involvement in the DSS
3.1. Fundamentals of THESEUS DSS
The primary objective is to provide an integrated GIS-based method-ology for planning sustainable coastal defence strategies,which addressestechnical, social, economic and environmental aspects. THESEUS-DSS hasbeen defined as a scoping tool to assess risk conditions and consequencesof mitigation options against flooding and erosion at a given coastal site.
The tool supports an assessment of the change in risk due to a range ofscenarios and selection of the most appropriate intervention measuresfrom an available portfolio of engineering, ecological and socialmeasures.
The primary end-users are intermediate-level coastal managerswho need to make sound evidence-based decisions regarding spatialplanning and coastal protection.
The main foundation of this DSS is that it has to be “Open andParametric”, not only in terms of source code and technology but alsoin terms of usability. This software is designed to be easily modifiedand distributed across many sites with many diverse characteristics:this requires adequate flexibility in terms of configuration parametersand input materials.
The DSS should also be “Interactive” so that users can explore acombination of scenarios, while being trained in interdisciplinary riskassessment, including the best (i.e. sustainable) solution or combinationof solutions for risk mitigation. Here sustainable means protecting thecoast while preserving its socio-economic development and the integri-ty of the ecosystem services.
Underlying the advice and discussion regarding the development ofTHESEUS DSS, the limitations on the tool should be noted:
• It provides coastal managers with an overview of the drivers, pres-sures, impacts and response options in different time slices, but it isnot expected to replace detailed design tools;
• It raises awareness of the implications of different policy decisions, butit does not prompt the selection of specific policies;
• It should be a tool for aiding decision making but it cannot provide astraightforward decision since a) it does not overcome the represen-tation of the social perception of risk and the resilience of society;b) it includes a strong uncertainty component in the prediction ofboth physical processes and consequences.
THESEUS DSS is developed on top of an integrated simulationmodelsuitable for performing ‘What if’ analyses based on scenarios. By means
of this kind of analysis the user tries to find out howmanagement strat-egies and scenario sensitive variables and parameters influence risk atthe selected coastal site. The policy analysis mainly focuses on theconsequences of changing coastal management options. The differentcomponents of this analysis can be seen and changed interactively bymeans of the user interface (see Section 3.2).
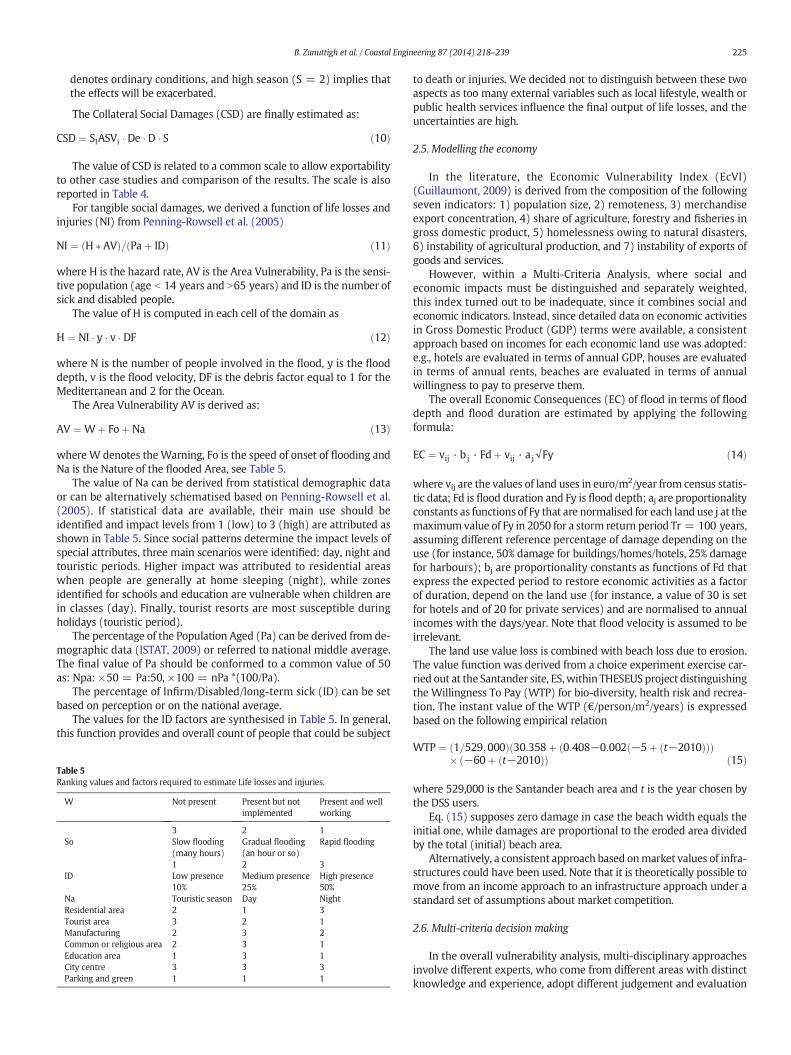
Fig. 1 gives an overview of the structure of the integrated model atthe most synthetic level. The integrated model is the actual calculationkernel of THESEUSDSS. It contains relations in the formofmathematicalequations, formal rules, or transfer functions representing the realworld processes.
3.2. The design of the tool
The inclusion and participation of relevant stakeholders (coastalmanagers) is essential to test the outcomes of themodelling, to identifythemost relevant parameters and related scenarios to be included in theanalysis and to evaluate adaptation options (Dessai and Hulme, 2004).To maximise the utility of THESEUS DSS, the stakeholders gave theirinput on:
• Definition of the site boundaries;• Identification of critical pathways of the existing management thatmay lead to failure and are worthy of further investigation;
• Usefulness of output indicators for each of the meta-models;• Appropriateness of the mitigation measures to be included in futurecoastal management strategies for a given site;
• Site-specific relevance of the social, economic and environmentalcomponents of risk;
• Functionality and user-friendliness of the interface.
Following Holman et al. (2008), the set-up of the tool consideredtwo key points.
1. Intuitive and interactive design of the Guider User Interface andpossibility as follows.• The physical layout of the tool should closely mirror the conceptu-al model, i.e.; the SPRC components.
• The user should be able to vary the input parameters throughsliders to analyse the potential changes induced by differentscenarios or mitigation strategies.
• ‘Realistic’ and plausible ranges of values for a given parametershould be used to give guidance on the uncertainty associatedwith a scenario.
• The users should be allowed to save and compare the graphicaloutputs from more than one model or scenario.
2. Balance of simplified modelling assumptions and speed to promotethe use of the tool for testing different combinations of mitigationoptions by:• Avoiding extensive or prolonged model set-up has been avoided;• Providing rapid outputs.
3.3. Type of outputs
THESEUS DSS operates at high resolution to provide geographic spe-cific outputs. While users should be encouraged to study the detailedmaps, this output is not suitable for direct application, nor should it beconfused with the policies that would accomplish those outcomes andjudged based on the avoided monetary damage only. Therefore whilethe intermediate maps of specific results (for instance: flood depth,land value loss, life losses, etc.) are shown with their own scale, theresults of (hydraulic, social, economic and ecological) vulnerability andthe overall risk assessment map are given as normalised-quantitativeindicators (see Section 4).
Based on these guiding concepts, on the experience gained fromother tool development (and specifically RAMCO and RegIS) and onthe feedback from stakeholders, the interface for each site consists of a
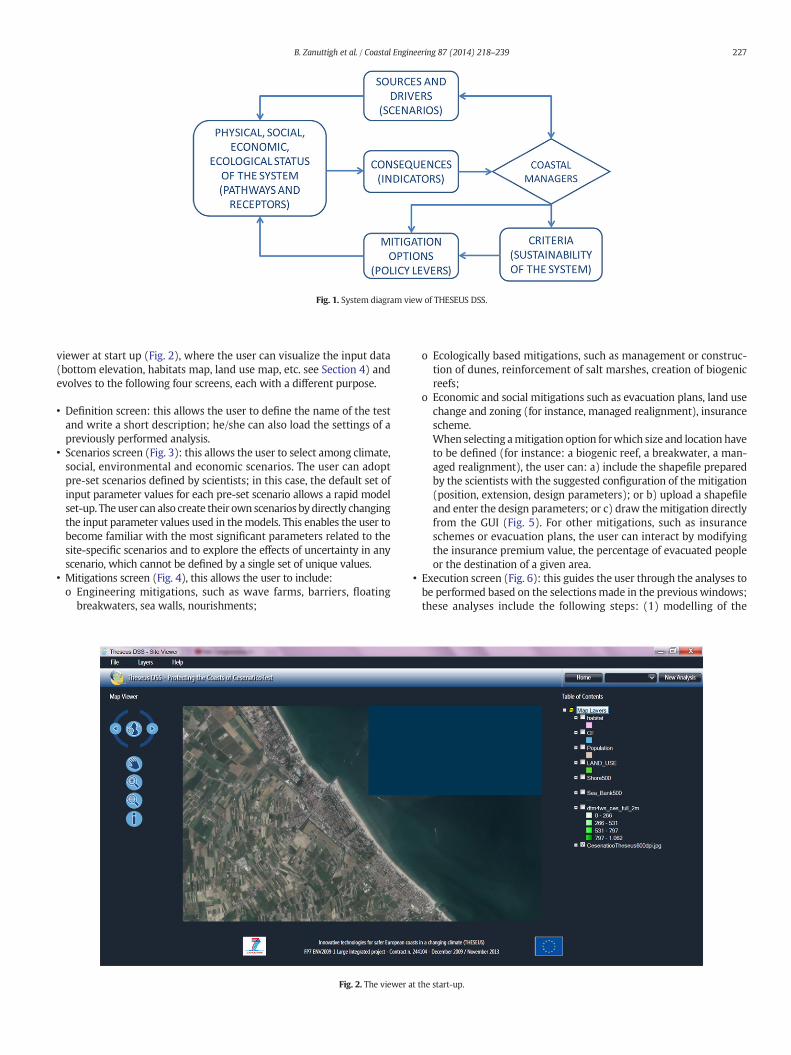
Fig. 1. System diagram view of THESEUS DSS.
227B. Zanuttigh et al. / Coastal Engineering 87 (2014) 218–239
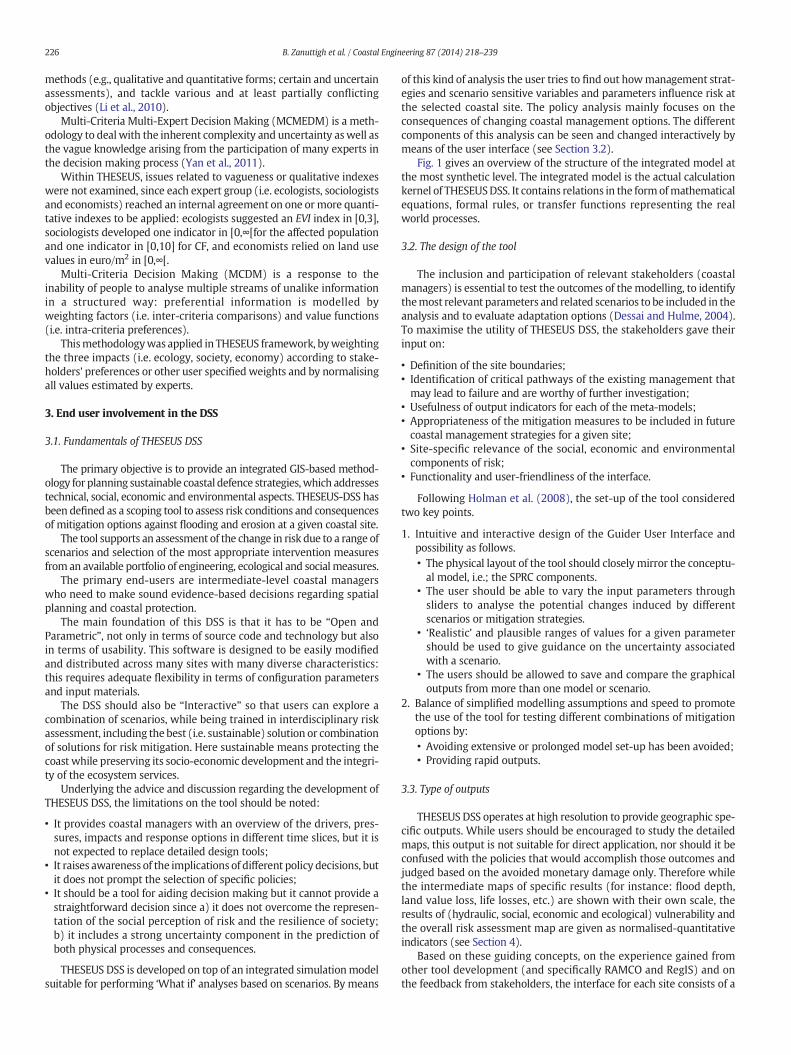
viewer at start up (Fig. 2), where the user can visualize the input data(bottom elevation, habitats map, land use map, etc. see Section 4) andevolves to the following four screens, each with a different purpose.
• Definition screen: this allows the user to define the name of the testand write a short description; he/she can also load the settings of apreviously performed analysis.
• Scenarios screen (Fig. 3): this allows the user to select among climate,social, environmental and economic scenarios. The user can adoptpre-set scenarios defined by scientists; in this case, the default set ofinput parameter values for each pre-set scenario allows a rapid modelset-up. The user can also create their own scenarios bydirectly changingthe input parameter values used in themodels. This enables the user tobecome familiar with the most significant parameters related to thesite-specific scenarios and to explore the effects of uncertainty in anyscenario, which cannot be defined by a single set of unique values.
• Mitigations screen (Fig. 4), this allows the user to include:o Engineering mitigations, such as wave farms, barriers, floating
breakwaters, sea walls, nourishments;
Fig. 2. The viewer a
o Ecologically based mitigations, such as management or construc-tion of dunes, reinforcement of salt marshes, creation of biogenicreefs;
o Economic and social mitigations such as evacuation plans, land usechange and zoning (for instance, managed realignment), insurancescheme.When selecting amitigation option forwhich size and location haveto be defined (for instance: a biogenic reef, a breakwater, a man-aged realignment), the user can: a) include the shapefile preparedby the scientists with the suggested configuration of the mitigation(position, extension, design parameters); or b) upload a shapefileand enter the design parameters; or c) draw themitigation directlyfrom the GUI (Fig. 5). For other mitigations, such as insuranceschemes or evacuation plans, the user can interact by modifyingthe insurance premium value, the percentage of evacuated peopleor the destination of a given area.
• Execution screen (Fig. 6): this guides the user through the analyses tobe performed based on the selectionsmade in the previous windows;these analyses include the following steps: (1) modelling of the
t the start-up.
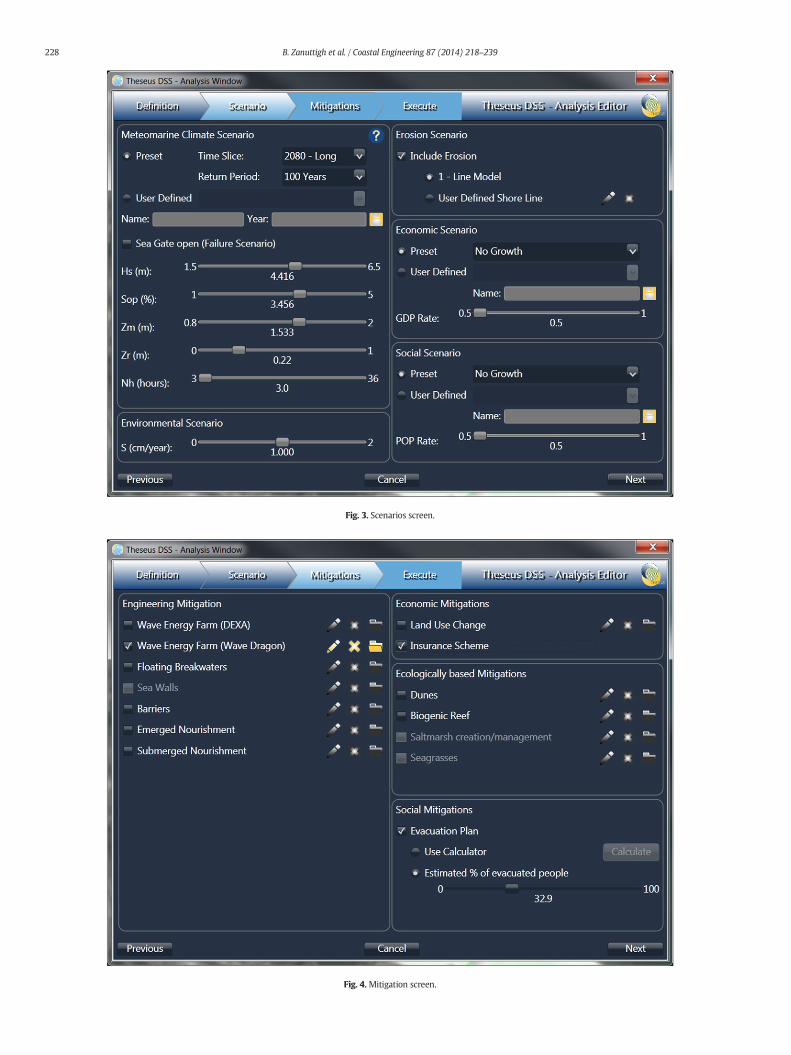
Fig. 3. Scenarios screen.
Fig. 4.Mitigation screen.
228 B. Zanuttigh et al. / Coastal Engineering 87 (2014) 218–239
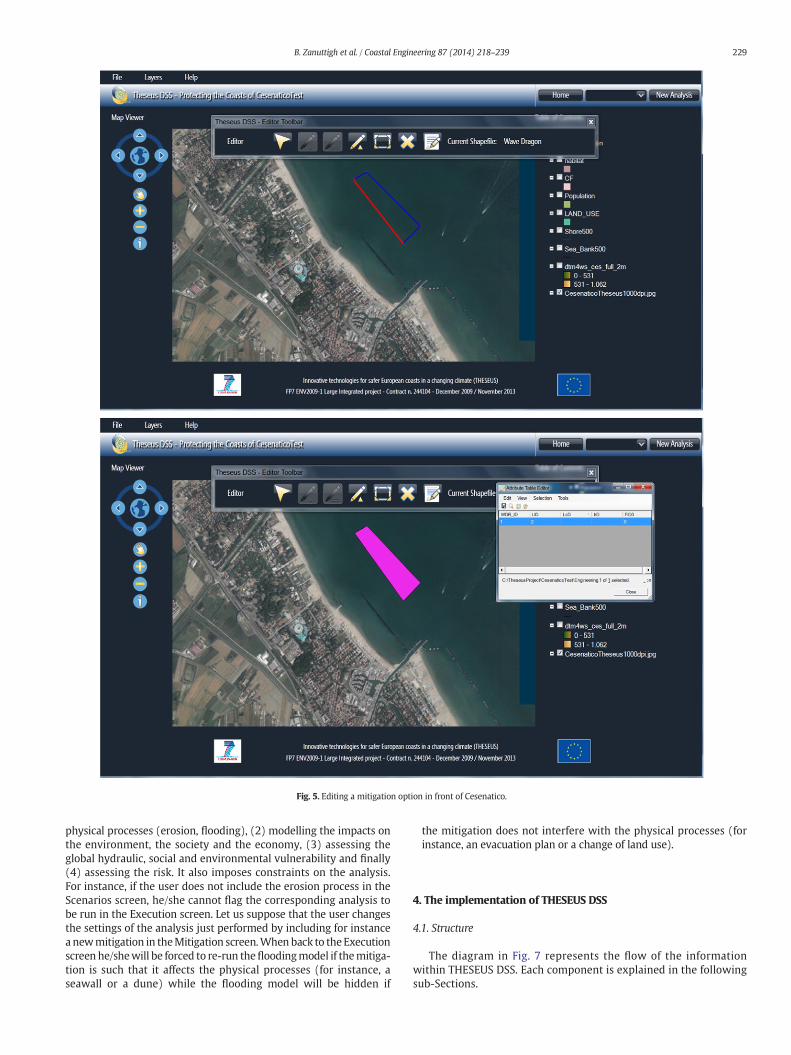
Fig. 5. Editing a mitigation option in front of Cesenatico.
229B. Zanuttigh et al. / Coastal Engineering 87 (2014) 218–239
physical processes (erosion, flooding), (2) modelling the impacts onthe environment, the society and the economy, (3) assessing theglobal hydraulic, social and environmental vulnerability and finally(4) assessing the risk. It also imposes constraints on the analysis.For instance, if the user does not include the erosion process in theScenarios screen, he/she cannot flag the corresponding analysis tobe run in the Execution screen. Let us suppose that the user changesthe settings of the analysis just performed by including for instancea newmitigation in theMitigation screen.When back to the Executionscreen he/shewill be forced to re-run thefloodingmodel if themitiga-tion is such that it affects the physical processes (for instance, aseawall or a dune) while the flooding model will be hidden if
the mitigation does not interfere with the physical processes (forinstance, an evacuation plan or a change of land use).
4. The implementation of THESEUS DSS
4.1. Structure
The diagram in Fig. 7 represents the flow of the informationwithin THESEUS DSS. Each component is explained in the followingsub-Sections.
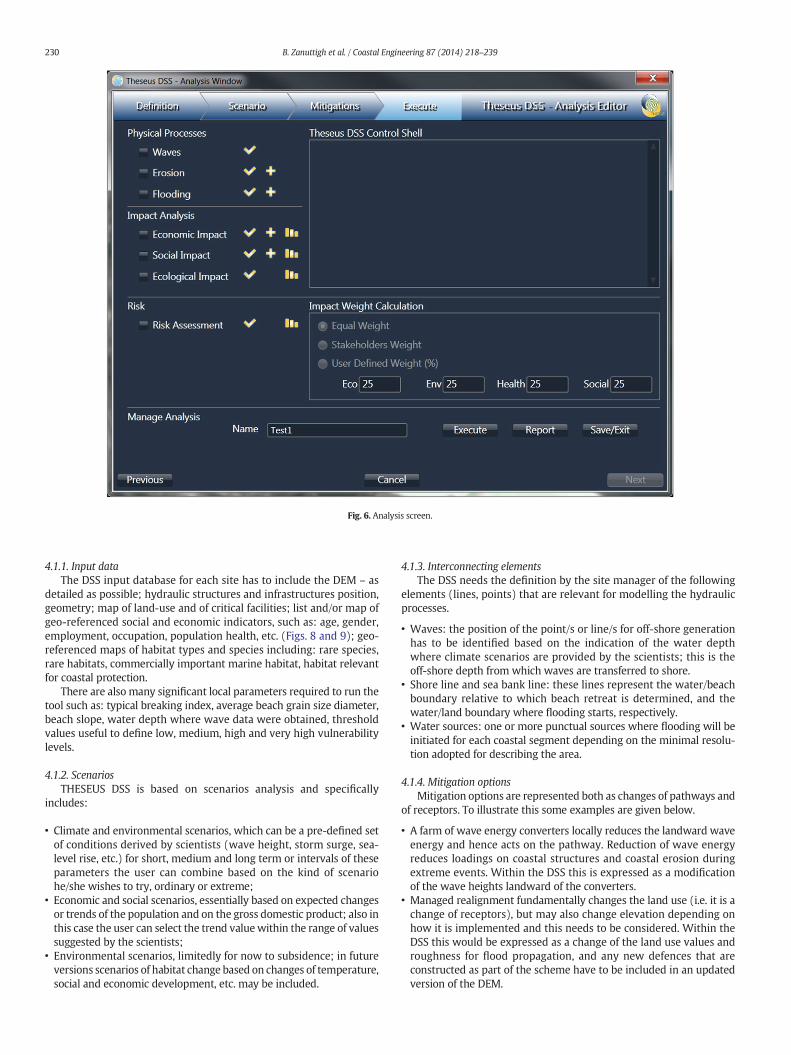
Fig. 6. Analysis screen.
230 B. Zanuttigh et al. / Coastal Engineering 87 (2014) 218–239
4.1.1. Input dataThe DSS input database for each site has to include the DEM – as
detailed as possible; hydraulic structures and infrastructures position,geometry; map of land-use and of critical facilities; list and/or map ofgeo-referenced social and economic indicators, such as: age, gender,employment, occupation, population health, etc. (Figs. 8 and 9); geo-referenced maps of habitat types and species including: rare species,rare habitats, commercially important marine habitat, habitat relevantfor coastal protection.
There are also many significant local parameters required to run thetool such as: typical breaking index, average beach grain size diameter,beach slope, water depth where wave data were obtained, thresholdvalues useful to define low, medium, high and very high vulnerabilitylevels.
4.1.2. ScenariosTHESEUS DSS is based on scenarios analysis and specifically
includes:
• Climate and environmental scenarios, which can be a pre-defined setof conditions derived by scientists (wave height, storm surge, sea-level rise, etc.) for short, medium and long term or intervals of theseparameters the user can combine based on the kind of scenariohe/she wishes to try, ordinary or extreme;
• Economic and social scenarios, essentially based on expected changesor trends of the population and on the gross domestic product; also inthis case the user can select the trend valuewithin the range of valuessuggested by the scientists;
• Environmental scenarios, limitedly for now to subsidence; in futureversions scenarios of habitat change based on changes of temperature,social and economic development, etc. may be included.
4.1.3. Interconnecting elementsThe DSS needs the definition by the site manager of the following
elements (lines, points) that are relevant for modelling the hydraulicprocesses.
• Waves: the position of the point/s or line/s for off-shore generationhas to be identified based on the indication of the water depthwhere climate scenarios are provided by the scientists; this is theoff-shore depth from which waves are transferred to shore.
• Shore line and sea bank line: these lines represent the water/beachboundary relative to which beach retreat is determined, and thewater/land boundary where flooding starts, respectively.
• Water sources: one or more punctual sources where flooding will beinitiated for each coastal segment depending on the minimal resolu-tion adopted for describing the area.
4.1.4. Mitigation optionsMitigation options are represented both as changes of pathways and
of receptors. To illustrate this some examples are given below.
• A farm of wave energy converters locally reduces the landward waveenergy and hence acts on the pathway. Reduction of wave energyreduces loadings on coastal structures and coastal erosion duringextreme events. Within the DSS this is expressed as a modificationof the wave heights landward of the converters.
• Managed realignment fundamentally changes the land use (i.e. it is achange of receptors), but may also change elevation depending onhow it is implemented and this needs to be considered. Within theDSS this would be expressed as a change of the land use values androughness for flood propagation, and any new defences that areconstructed as part of the scheme have to be included in an updatedversion of the DEM.
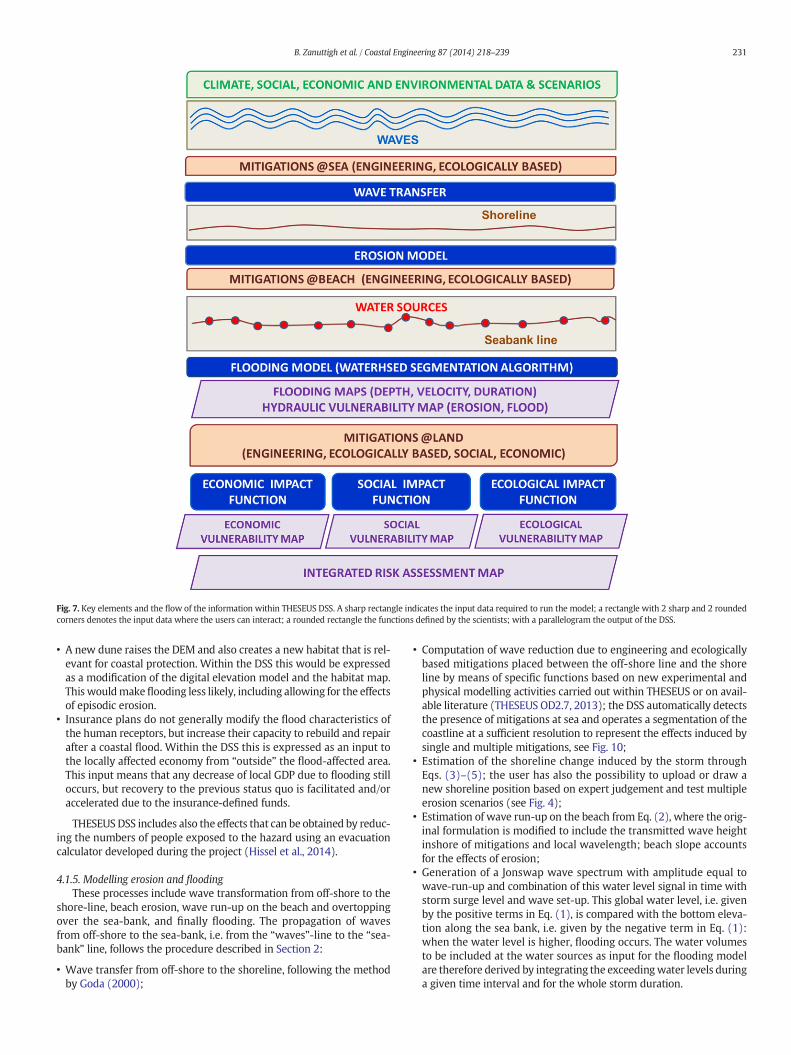
Fig. 7. Key elements and the flow of the information within THESEUS DSS. A sharp rectangle indicates the input data required to run the model; a rectangle with 2 sharp and 2 roundedcorners denotes the input data where the users can interact; a rounded rectangle the functions defined by the scientists; with a parallelogram the output of the DSS.
231B. Zanuttigh et al. / Coastal Engineering 87 (2014) 218–239
• A new dune raises the DEM and also creates a new habitat that is rel-evant for coastal protection. Within the DSS this would be expressedas a modification of the digital elevation model and the habitat map.This wouldmakeflooding less likely, including allowing for the effectsof episodic erosion.
• Insurance plans do not generally modify the flood characteristics ofthe human receptors, but increase their capacity to rebuild and repairafter a coastal flood. Within the DSS this is expressed as an input tothe locally affected economy from “outside” the flood-affected area.This input means that any decrease of local GDP due to flooding stilloccurs, but recovery to the previous status quo is facilitated and/oraccelerated due to the insurance-defined funds.
THESEUS DSS includes also the effects that can be obtained by reduc-ing the numbers of people exposed to the hazard using an evacuationcalculator developed during the project (Hissel et al., 2014).
4.1.5. Modelling erosion and floodingThese processes include wave transformation from off-shore to the
shore-line, beach erosion, wave run-up on the beach and overtoppingover the sea-bank, and finally flooding. The propagation of wavesfrom off-shore to the sea-bank, i.e. from the “waves”-line to the “sea-bank” line, follows the procedure described in Section 2:
• Wave transfer from off-shore to the shoreline, following the methodby Goda (2000);
• Computation of wave reduction due to engineering and ecologicallybased mitigations placed between the off-shore line and the shoreline by means of specific functions based on new experimental andphysical modelling activities carried out within THESEUS or on avail-able literature (THESEUS OD2.7, 2013); the DSS automatically detectsthe presence of mitigations at sea and operates a segmentation of thecoastline at a sufficient resolution to represent the effects induced bysingle and multiple mitigations, see Fig. 10;
• Estimation of the shoreline change induced by the storm throughEqs. (3)–(5); the user has also the possibility to upload or draw anew shoreline position based on expert judgement and test multipleerosion scenarios (see Fig. 4);
• Estimation of wave run-up on the beach from Eq. (2), where the orig-inal formulation is modified to include the transmitted wave heightinshore of mitigations and local wavelength; beach slope accountsfor the effects of erosion;
• Generation of a Jonswap wave spectrum with amplitude equal towave-run-up and combination of this water level signal in time withstorm surge level and wave set-up. This global water level, i.e. givenby the positive terms in Eq. (1), is compared with the bottom eleva-tion along the sea bank, i.e. given by the negative term in Eq. (1):when the water level is higher, flooding occurs. The water volumesto be included at the water sources as input for the flooding modelare therefore derived by integrating the exceedingwater levels duringa given time interval and for the whole storm duration.
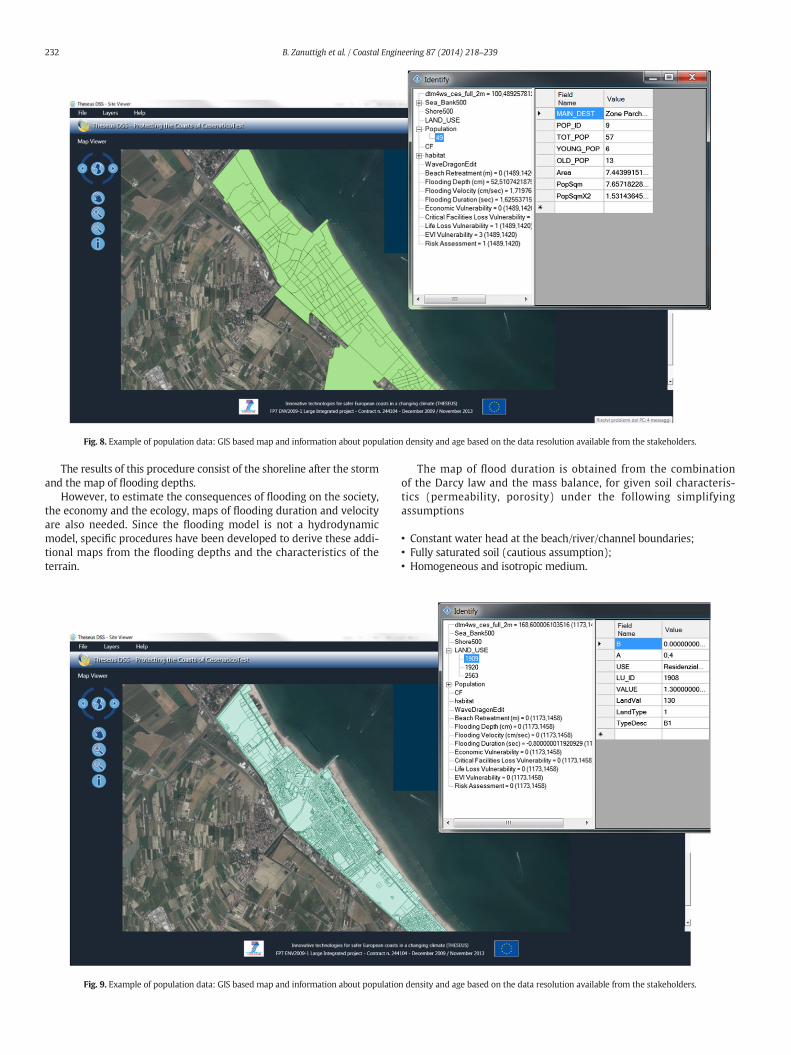
Fig. 8. Example of population data: GIS based map and information about population density and age based on the data resolution available from the stakeholders.
232 B. Zanuttigh et al. / Coastal Engineering 87 (2014) 218–239
The results of this procedure consist of the shoreline after the stormand the map of flooding depths.
However, to estimate the consequences of flooding on the society,the economy and the ecology, maps of flooding duration and velocityare also needed. Since the flooding model is not a hydrodynamicmodel, specific procedures have been developed to derive these addi-tional maps from the flooding depths and the characteristics of theterrain.
Fig. 9. Example of population data: GIS based map and information about populatio
The map of flood duration is obtained from the combinationof the Darcy law and the mass balance, for given soil characteris-tics (permeability, porosity) under the following simplifyingassumptions
• Constant water head at the beach/river/channel boundaries;• Fully saturated soil (cautious assumption);• Homogeneous and isotropic medium.
n density and age based on the data resolution available from the stakeholders.
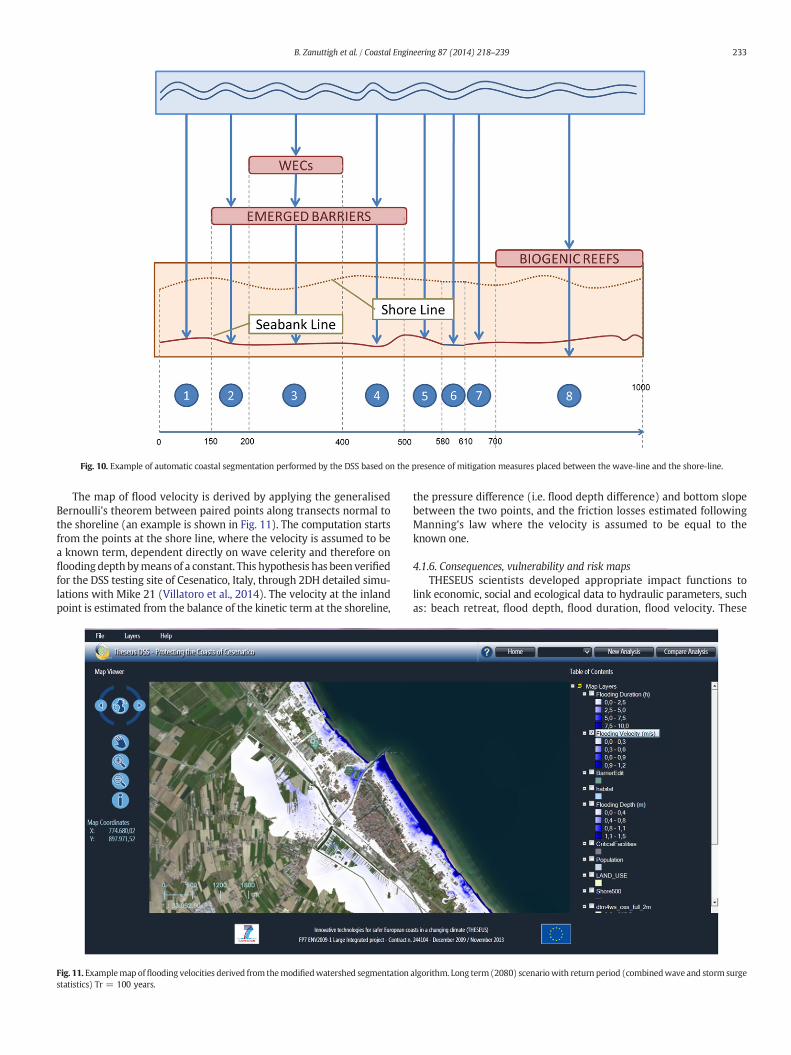
Fig. 10. Example of automatic coastal segmentation performed by the DSS based on the presence of mitigation measures placed between the wave-line and the shore-line.
233B. Zanuttigh et al. / Coastal Engineering 87 (2014) 218–239
The map of flood velocity is derived by applying the generalisedBernoulli's theorem between paired points along transects normal tothe shoreline (an example is shown in Fig. 11). The computation startsfrom the points at the shore line, where the velocity is assumed to bea known term, dependent directly on wave celerity and therefore onfloodingdepth bymeans of a constant. This hypothesis has been verifiedfor the DSS testing site of Cesenatico, Italy, through 2DH detailed simu-lations with Mike 21 (Villatoro et al., 2014). The velocity at the inlandpoint is estimated from the balance of the kinetic term at the shoreline,
Fig. 11. Examplemap offlooding velocities derived from themodifiedwatershed segmentationstatistics) Tr = 100 years.
the pressure difference (i.e. flood depth difference) and bottom slopebetween the two points, and the friction losses estimated followingManning's law where the velocity is assumed to be equal to theknown one.
4.1.6. Consequences, vulnerability and risk mapsTHESEUS scientists developed appropriate impact functions to
link economic, social and ecological data to hydraulic parameters, suchas: beach retreat, flood depth, flood duration, flood velocity. These
algorithm. Long term (2080) scenariowith return period (combinedwave and storm surge
234 B. Zanuttigh et al. / Coastal Engineering 87 (2014) 218–239
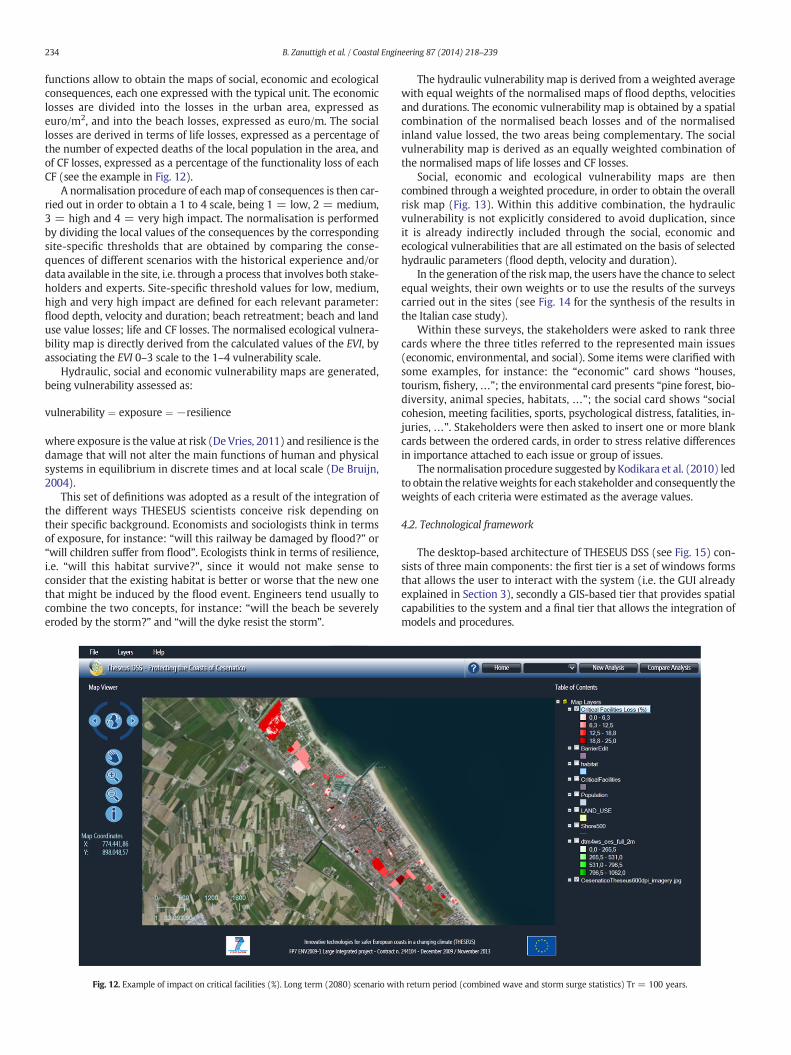
functions allow to obtain the maps of social, economic and ecologicalconsequences, each one expressed with the typical unit. The economiclosses are divided into the losses in the urban area, expressed aseuro/m2, and into the beach losses, expressed as euro/m. The sociallosses are derived in terms of life losses, expressed as a percentage ofthe number of expected deaths of the local population in the area, andof CF losses, expressed as a percentage of the functionality loss of eachCF (see the example in Fig. 12).
A normalisation procedure of eachmap of consequences is then car-ried out in order to obtain a 1 to 4 scale, being 1 = low, 2 = medium,3 = high and 4 = very high impact. The normalisation is performedby dividing the local values of the consequences by the correspondingsite-specific thresholds that are obtained by comparing the conse-quences of different scenarios with the historical experience and/ordata available in the site, i.e. through a process that involves both stake-holders and experts. Site-specific threshold values for low, medium,high and very high impact are defined for each relevant parameter:flood depth, velocity and duration; beach retreatment; beach and landuse value losses; life and CF losses. The normalised ecological vulnera-bility map is directly derived from the calculated values of the EVI, byassociating the EVI 0–3 scale to the 1–4 vulnerability scale.
Hydraulic, social and economic vulnerability maps are generated,being vulnerability assessed as:
vulnerability ¼ exposure ¼ −resilience
where exposure is the value at risk (De Vries, 2011) and resilience is thedamage that will not alter the main functions of human and physicalsystems in equilibrium in discrete times and at local scale (De Bruijn,2004).
This set of definitions was adopted as a result of the integration ofthe different ways THESEUS scientists conceive risk depending ontheir specific background. Economists and sociologists think in termsof exposure, for instance: “will this railway be damaged by flood?” or“will children suffer from flood”. Ecologists think in terms of resilience,i.e. “will this habitat survive?”, since it would not make sense toconsider that the existing habitat is better or worse that the new onethat might be induced by the flood event. Engineers tend usually tocombine the two concepts, for instance: “will the beach be severelyeroded by the storm?” and “will the dyke resist the storm”.
Fig. 12. Example of impact on critical facilities (%). Long term (2080) scenario wit
The hydraulic vulnerability map is derived from a weighted averagewith equal weights of the normalised maps of flood depths, velocitiesand durations. The economic vulnerability map is obtained by a spatialcombination of the normalised beach losses and of the normalisedinland value lossed, the two areas being complementary. The socialvulnerability map is derived as an equally weighted combination ofthe normalised maps of life losses and CF losses.
Social, economic and ecological vulnerability maps are thencombined through a weighted procedure, in order to obtain the overallrisk map (Fig. 13). Within this additive combination, the hydraulicvulnerability is not explicitly considered to avoid duplication, sinceit is already indirectly included through the social, economic andecological vulnerabilities that are all estimated on the basis of selectedhydraulic parameters (flood depth, velocity and duration).
In the generation of the riskmap, the users have the chance to selectequal weights, their own weights or to use the results of the surveyscarried out in the sites (see Fig. 14 for the synthesis of the results inthe Italian case study).
Within these surveys, the stakeholders were asked to rank threecards where the three titles referred to the represented main issues(economic, environmental, and social). Some items were clarified withsome examples, for instance: the “economic” card shows “houses,tourism, fishery,…”; the environmental card presents “pine forest, bio-diversity, animal species, habitats, …”; the social card shows “socialcohesion, meeting facilities, sports, psychological distress, fatalities, in-juries, …”. Stakeholders were then asked to insert one or more blankcards between the ordered cards, in order to stress relative differencesin importance attached to each issue or group of issues.
The normalisation procedure suggested by Kodikara et al. (2010) ledto obtain the relativeweights for each stakeholder and consequently theweights of each criteria were estimated as the average values.
4.2. Technological framework
The desktop-based architecture of THESEUS DSS (see Fig. 15) con-sists of three main components: the first tier is a set of windows formsthat allows the user to interact with the system (i.e. the GUI alreadyexplained in Section 3), secondly a GIS-based tier that provides spatialcapabilities to the system and a final tier that allows the integration ofmodels and procedures.
h return period (combined wave and storm surge statistics) Tr = 100 years.
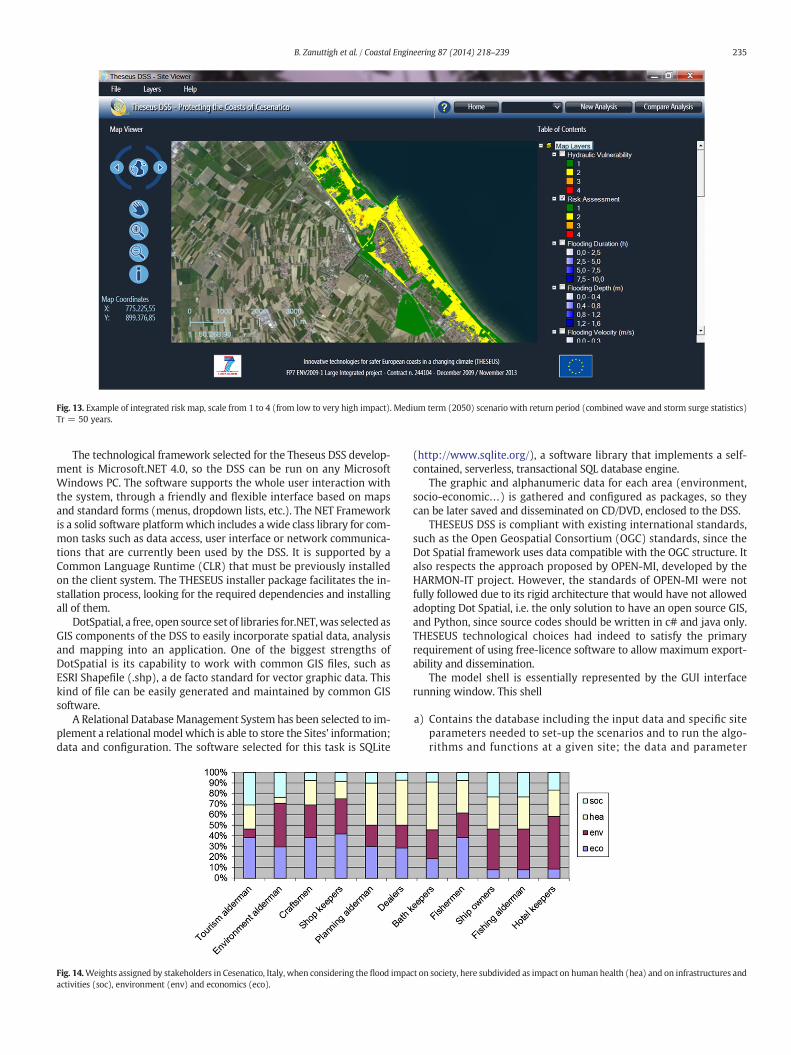
Fig. 13. Example of integrated risk map, scale from 1 to 4 (from low to very high impact). Medium term (2050) scenario with return period (combined wave and storm surge statistics)Tr = 50 years.
235B. Zanuttigh et al. / Coastal Engineering 87 (2014) 218–239
The technological framework selected for the Theseus DSS develop-ment is Microsoft.NET 4.0, so the DSS can be run on any MicrosoftWindows PC. The software supports the whole user interaction withthe system, through a friendly and flexible interface based on mapsand standard forms (menus, dropdown lists, etc.). The NET Frameworkis a solid software platformwhich includes a wide class library for com-mon tasks such as data access, user interface or network communica-tions that are currently been used by the DSS. It is supported by aCommon Language Runtime (CLR) that must be previously installedon the client system. The THESEUS installer package facilitates the in-stallation process, looking for the required dependencies and installingall of them.
DotSpatial, a free, open source set of libraries for.NET,was selected asGIS components of the DSS to easily incorporate spatial data, analysisand mapping into an application. One of the biggest strengths ofDotSpatial is its capability to work with common GIS files, such asESRI Shapefile (.shp), a de facto standard for vector graphic data. Thiskind of file can be easily generated and maintained by common GISsoftware.
A Relational Database Management System has been selected to im-plement a relational model which is able to store the Sites' information;data and configuration. The software selected for this task is SQLite
Fig. 14.Weights assigned by stakeholders in Cesenatico, Italy, when considering the flood impaactivities (soc), environment (env) and economics (eco).
(http://www.sqlite.org/), a software library that implements a self-contained, serverless, transactional SQL database engine.
The graphic and alphanumeric data for each area (environment,socio-economic…) is gathered and configured as packages, so theycan be later saved and disseminated on CD/DVD, enclosed to the DSS.
THESEUS DSS is compliant with existing international standards,such as the Open Geospatial Consortium (OGC) standards, since theDot Spatial framework uses data compatible with the OGC structure. Italso respects the approach proposed by OPEN-MI, developed by theHARMON-IT project. However, the standards of OPEN-MI were notfully followed due to its rigid architecture that would have not allowedadopting Dot Spatial, i.e. the only solution to have an open source GIS,and Python, since source codes should be written in c# and java only.THESEUS technological choices had indeed to satisfy the primaryrequirement of using free-licence software to allow maximum export-ability and dissemination.
The model shell is essentially represented by the GUI interfacerunning window. This shell
a) Contains the database including the input data and specific siteparameters needed to set-up the scenarios and to run the algo-rithms and functions at a given site; the data and parameter
ct on society, here subdivided as impact on human health (hea) and on infrastructures and
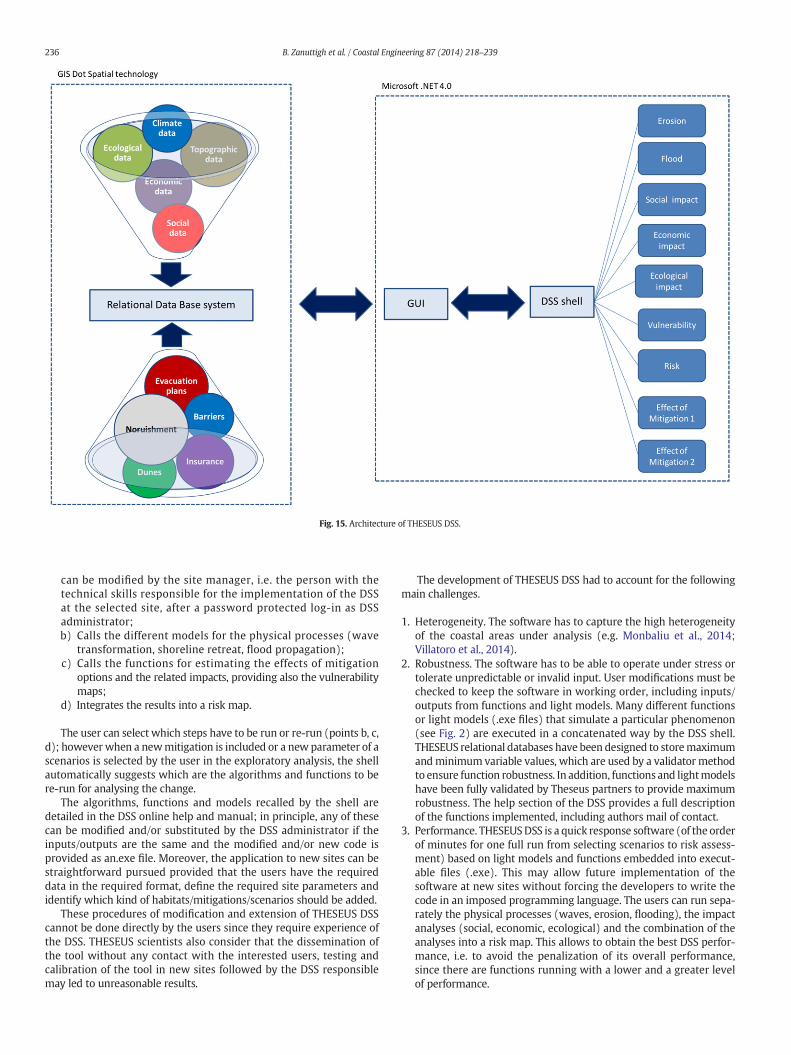
Fig. 15. Architecture of THESEUS DSS.
236 B. Zanuttigh et al. / Coastal Engineering 87 (2014) 218–239
can be modified by the site manager, i.e. the person with thetechnical skills responsible for the implementation of the DSSat the selected site, after a password protected log-in as DSSadministrator;b) Calls the different models for the physical processes (wave
transformation, shoreline retreat, flood propagation);c) Calls the functions for estimating the effects of mitigation
options and the related impacts, providing also the vulnerabilitymaps;
d) Integrates the results into a risk map.
The user can select which steps have to be run or re-run (points b, c,d); however when a newmitigation is included or a new parameter of ascenarios is selected by the user in the exploratory analysis, the shellautomatically suggests which are the algorithms and functions to bere-run for analysing the change.
The algorithms, functions and models recalled by the shell aredetailed in the DSS online help and manual; in principle, any of thesecan be modified and/or substituted by the DSS administrator if theinputs/outputs are the same and the modified and/or new code isprovided as an.exe file. Moreover, the application to new sites can bestraightforward pursued provided that the users have the requireddata in the required format, define the required site parameters andidentify which kind of habitats/mitigations/scenarios should be added.
These procedures of modification and extension of THESEUS DSScannot be done directly by the users since they require experience ofthe DSS. THESEUS scientists also consider that the dissemination ofthe tool without any contact with the interested users, testing andcalibration of the tool in new sites followed by the DSS responsiblemay led to unreasonable results.
The development of THESEUS DSS had to account for the followingmain challenges.
1. Heterogeneity. The software has to capture the high heterogeneityof the coastal areas under analysis (e.g. Monbaliu et al., 2014;Villatoro et al., 2014).
2. Robustness. The software has to be able to operate under stress ortolerate unpredictable or invalid input. User modifications must bechecked to keep the software in working order, including inputs/outputs from functions and light models. Many different functionsor light models (.exe files) that simulate a particular phenomenon(see Fig. 2) are executed in a concatenated way by the DSS shell.THESEUS relational databases have been designed to storemaximumandminimum variable values, which are used by a validator methodto ensure function robustness. In addition, functions and lightmodelshave been fully validated by Theseus partners to provide maximumrobustness. The help section of the DSS provides a full descriptionof the functions implemented, including authors mail of contact.
3. Performance. THESEUSDSS is a quick response software (of the orderof minutes for one full run from selecting scenarios to risk assess-ment) based on light models and functions embedded into execut-able files (.exe). This may allow future implementation of thesoftware at new sites without forcing the developers to write thecode in an imposed programming language. The users can run sepa-rately the physical processes (waves, erosion, flooding), the impactanalyses (social, economic, ecological) and the combination of theanalyses into a risk map. This allows to obtain the best DSS perfor-mance, i.e. to avoid the penalization of its overall performance,since there are functions running with a lower and a greater levelof performance.
237B. Zanuttigh et al. / Coastal Engineering 87 (2014) 218–239
4.3. Accessibility
THESEUS DSSwas applied to four of the eight case studies examinedwithin the project. These siteswere selected since they represent a rangeof characteristics and diverse environmental, social, economic andecological issues: Cesenatico, Northern Adriatic Sea, Italy; Teignmouthestuary, South Devon, United Kingdom; Gironde estuary, AtlanticOcean, France; Santander, Gulf of Biscay, Spain.
From the project website (www.theseusproject.eu) it will beaccessible and downloadable after registration the application of theDSS (as an executable code) in these four sites, including the manualand the online help.
5. Discussion of the DSS challenges and limitations
Besides the intrinsic problem of integrating different disciplineswith different views and languages, the DSS has to face the followingpractical and conceptual challenges.
• The conceptual approach and the simplified modelling assumptionsthat are at the basis of the DSS may be considered too simplistic bythe coastal managers and stakeholders to trust the reliability of theresults. However, there are at least three key points to answer thisproblem with the DSS. First, the relatively fast running time allowsthe user to examine many different scenarios. In this way, the usercan identify how and how far the DSS results compare with thehistorical data and/or the memory in the sites. Second, the inherentuncertainty of the results (that do exist for any type of model) canbe overcome if one runs the tool aiming at a sensitivity analysis ofthe results, i.e. at comparing results of different scenarios consideringthat all the results are affected by the same simplifying assumptions.Third, it should not be forgotten the clear statement that the DSS isessentially a tool to be used in a preliminary phase for assessing riskand identifying the optimal portfolio of mitigation strategies, but itis not meant as a tool that substitutes for the detailed design process.Hence, theDSS is designed to be part of a stratified analytical approachfor coastal risk management.
• In many cases, the topographic, social, economic and ecological highspatial resolution data that are required for running the DSS may benot available. Evenwhen available these datamay be ownedby differ-ent authorities (municipalities, regional governments, ministry) andscattered and hard to obtain, due to miscommunication among theowners and confidentiality issues. This same problem howevertypically affects all kind of risk assessment for any hazard at any area.
• The non-linear interdependence of the mitigation options is notconsidered. For instance, the construction of a hard flood defenceaffects insurance andmay also affect public preparedness to evacuate.However the tool separately represents the effects of these threemeasures on the flood processes, on the land value losses and on thelife losses and then these effects are linearly combined.
• Risk perception – and therefore social resilience and its effects interms of preparedness and social changes in terms of cohesion, liveli-hoods and opportunities – is not represented.
• A cost–benefit analysis is not included for several reasons. For somemitigation measures (wave energy converters, insurance schemes,biogenic reefs) it is very difficult to assess the costs, especially sincea market is not already available. Moreover, as pointed out above,the combination of mitigation measures is actually non-linear andtherefore also synergies of the costs and benefits may be achieved,but cannot be easily represented even by more complicated models.The benefits may tackle very different scales, for instance: therelevance of the indirect benefit generated by the reinforcement of ahabitat can be judged at national/European scale, the benefit due tothe power production of a wave farm requires a regional scale, thebenefit induced by an evacuation plan is assessed at the municipalityscale.
• Since the users get the results for each computed scenario, they mayachieve misleading decision if based on a single DSS run only. It istherefore important to warn the user that the best methodologicalcompromise is running multiple storm scenarios (at least threestorms, let's say 10, 50 and 100 years) for each selected time slice(2020s, 2050s or 2080s if one refers to the pre-set ones) and bypost-processing the results of these scenarios to get the sources-consequences function. Specifically, the social, economic, hydraulicand ecological vulnerability maps obtained for each storm should bemultiplied by the probability of occurrence of the correspondingstorm and then added to get the average vulnerability maps. A alter-native solution is to define few relevant parameters/indicators andcompare their values for different scenarios (i.e. combination of returnperiods for a given time slice), such as: percentage of flooded areawith flow depth greater than a Fixed Threshold Value (FTV), numberof CFs whose functionality is damaged for a percentage greater than aFTV, percentage of land or beach values loss greater than a FTV withrespect to the total value, and so on.
6. Conclusions
Within the THESEUS project, a new Decision Support System (DSS)was developed aiming at providing coastal managers with informationabout present and future flood risk assessment and at supporting asustainable long-term planning of mitigation strategies.
The tool is based on a series of linked simplified models to ensure arapid run-time and a quick response to the user. Hence, it is most usefulin the preliminary risk assessment phase, identifying the most threat-ened areas, and in the preliminary planning phase, verifying the mostpromising portfolio of mitigation solutions. Hence its role is to structurethe analysis, including selection and use of more sophisticated modelsfor subsequent more detailed analysis.
The DSS is open source and parametric so that it can be applied, inprinciple, to any coastal area independent of scale issues. However it re-quires appropriate site data, both to simulate inundationwith a sufficientdegree of accuracy (needing a high resolution DEM) and to represent so-cial and economic vulnerability and the range of mitigation options.
While the tool can represent hydraulic, social, economic and eco-logical vulnerability, it is currently limited in terms of the inclusionof the resilience concept. Hence issues such as (1) how far a sea-bank can resist during a storm?, (2) how much people can recoverafter the disaster?, and (3) how an increase of risk awareness may af-fect the rapidity of evacuation? are not currently addressed. This rep-resents an important improvement to be considered in furtherdevelopment.
The tool was designed to allow the user step by step interaction bysetting up scenarios, selectingmitigation options, and changingweightswithin the multi-criteria risk analysis. The possibility to run and com-pare many different conditions allows the users to explore flood riskand to develop an impact-oriented approach to coastal risk mitigationacross multiple criteria. This process of course depends on the technicalskills of the user and their local site-specific background.
The monitoring of the use of the DSS in practice and its supportingrole – if any – in decision making will allow refinement and furtherdevelopment of the approach.
Acknowledgements
The support of the European Commission through FP7.2009-1, con-tract 244104 —THESEUS (“Innovative technologies for safer Europeancoasts in a changing climate”), is gratefully acknowledged.
References
Adger, W.N., Brooks, N., Bentham, G., Agnew, M., 2004. New indicators of vulnerability andadaptive capacity. Technical Report, 7. Tyndall Centre for Climate Change Research.
238 B. Zanuttigh et al. / Coastal Engineering 87 (2014) 218–239
Adger, W., Hughes, T., Folke, C., Carpenter, S., Rockström, J., 2005. Social–ecologicalresilience to coastal disasters. Science 309, 1036–1039.
Bartlett, D., Smith, J.L. (Eds.), 2004. GIS for Coastal Zone Management. Routledge, London(300 pp.).
Bates, P.D., Anderson, M.G., 1996. A preliminary investigation into the impact of initialconditions on flood inundation predictions using a time/space distributed sensitivityanalysis. Catena 26 (1–2), 115–134.
Bates, P.D., De Roo, A.P.J., 2000. A simple raster based model for flood inundation simula-tion. J. Hydrol. 236, 54–77.
Bates, P.D., Dawson, R.J., Hall, J.W., Horritt, M.S., Nicholls, R.J., Wicks, J., Hassan, M.A.A.M.,2005. Simplified two-dimensional numerical modelling of coastal flooding andexample applications. Coast. Eng. 52, 793–810.
Boruff, B.J., Emrich, C., Cutter, S.L., 2005. Erosion hazard vulnerability of US coastalcounties. J. Coast. Res. 25, 932–942.
Bradbrook, K.F., Lane, S.N., Waller, S.G., Bates, P.D., 2004. Two dimensional diffusion wavemodelling of flood inundation using a simplified channel representation. Int. J. RiverBasin Manag. 3, 1–13.
Brooks, N., Adger, W.N., Mick Kelly, P., 2005. The determinants of vulnerability and adap-tive capacity at the national level and the implications for adaptation. Glob. Environ.Chang. 15, 151–163.
Brown, I., 2006. Modelling future landscape change on coastal floodplains using a rule-based GIS. Environ. Model. Softw. 21, 1479–1490.
Burrough, P.A., McDonnell, R.A., 1998. Principles of Geographical Information Systems.Oxford University Press.
Chen, J., Hill, A.A., Urbano, L.D., 2009. A GIS-based model for urban flood inundation.J. Hydrol. 373 (1–2), 184–192.
Cutter, S.L., 1996. Vulnerability to environmental hazards. Prog. Hum. Geogr. 20 (4),529–539.
Cutter, S.L., Boruff, B.J., Shirley, W.L., 2003. Social vulnerability to environmental hazards.Soc. Sci. Q. 84 (2), 242–261.
Dawson, R.J., Dickson, M., Nicholls, R.J., Hall, J., Walkden, M.J.A., Stansby, P.K., Mokrech, M.,Richards, J., Zhou, J., Milligan, J., Jordan, A., Pearson, S., Rees, J., Bates, P.D., Koukoulas,S., Watkinson, A., 2009. Integrated analysis of risks of coastal flooding and cliff erosionunder scenarios of long term change. Clim. Chang. 95 (1–2), 249–288.http://dx.doi.org/10.1007/s10584-008-9532-8.
De Bruijn, K.M., 2004. Resilience and flood risk management. Water Policy 6, 53–65.De Kok, J.L., Engelen, G., White, R., Wind, H.G., 2001. Modelling land-use change in a
decision-support system for coastal-zone management. Environ. Model. Assess. 6(2), 123–132.
De Vries, D.H., 2011. Temporal vulnerability in hazardscapes: Flood memory-networksand referentiality along the North Carolina Neuse River (USA). Glob. Environ.Chang. 21, 154–164.
DEFRA, Environment Agency, 2005. Flood warning for vulnerable groups: measuring andmapping vulnerability. R&D Technical Report W5C-018/4. DEFRA, London.
Dessai, S., Hulme, M., 2004. Does climate adaptation policy need probabilities? Clim. Pol.4, 107–128.
DINAS-COAST Project, 2004. http://www.pik-potsdam.de/DINAS-COAST.Dottori, F., Todini, E., 2011. Developments of a flood inundation model based on the cel-
lular automata approach: testing different methods to improve model performance.Phys. Chem. Earth 36, 266–280.
Feenstra, J.F., Programme, U.N.E., Milieuvraagst, V., 1998. Handbook on Methods forClimate Change Impact Assessment and Adaptation Strategies. United NationsEnvironment Programme.
FEMA, 2007. Risk Management Series—Design Guide for Improving Critical Facility Safetyfrom Flooding and High Winds. FEMA, Washington D.C.
Flax, L.K., Jackson, R.W., Stein, D.N., 2002. Community vulnerability assessment toolmethodology. Nat. Hazards Rev. 3, 163–176.
FLOODsite, 2009. Integrated flood risk analysis and management methodologies. CR-RomFLOODsite Consortium. (www.floodsite.net).
Goda, Y., 2000. Random Seas and Design of Maritime Structures. World Scientific.Gornitz, V.M., Daniels, R.C., White, T.W., Birdwell, K.R., 1994. The development of a coastal
risk assessment database: Vulnerability to sea-level rise in the U.S. southeast. Journalof Coastal Research, Special Issue No. 12, 327–338. Edited by: Coastal Education & Re-search Foundation.
Gouldby, B.P., Sayers, P., Mulet-Marti, J., Hassan, M., Benwell, D., 2008. A methodology forregional scale risk assessment. Proc. Inst. Civ. Eng. Water Manage. 161, 169–182.
Guillaumont, P., 2009. An Economic Vulnerability Index: Its Design and Use for InternationalDevelopment Policy, Oxford Development Studies, 1469–9966. 37 (3), 193–228.
Hanley, M.E., Hoggart, S.P.G., Simmonds, D.J., Bichot, A., Colangelo, M.A., Bozzeda, F.,Heurtefeux, H., Ondiviela, B., Ostrowski, R., Recio, M., Trude, R., Zawadzka-Kahlau,E., Thompson, R.C., 2014. Shifting sands? Coastal protection by sand banks, beachesand dunes. Coast. Eng. 87, 136–146.
Harrison, P.A., Holman, I.P., Cojocaru, G., Kok, K., Kontogianni, A., Metzger, M.,Gramberger, M., 2013. Combining qualitative and quantitative understanding for ex-ploring cross-sectoral climate change impacts, adaptation and vulnerability inEurope. Reg. Environ. Chang. 13, 761–780.
Hillsborough County -Florida, 2009. Hillsborough County Local Mitigation StrategyAppendix K-1 Critical facilities. Hillsborough County. http://www.hillsboroughcounty.org/DocumentCenter/Home/View/1126.
Hinkel, J., Klein, R.J.T., 2009. Integrating knowledge to assess coastal vulnerability tosea-level rise: the development of the DIVA tool. Global Environ. Chang. 19 (3),384–395.
Hissel, F., Morel, G., Pescaroli, G., Graaff, H., Felts, G., Pietrantoni, L., 2014. Early warningand mass evacuation in coastal cities. Coast. Eng. 87, 193–204.
Hoggart, S.P.G., Hanley, M.E., Franklin, E., Simmonds, D.J., White, A., Bilton, D.,Rundle, S., Penning-Rowsell, E., Thompson, Richard, 2014. The consequences of
doing nothing: the effects of seawater flooding on coastal zones. Coast. Eng.87, 169–182.
Holman, I.P., Rounsevell, M.D.A., Berry, P.M., Nicholls, R.J. (Eds.), 2008. Development andapplication of participatory integrated assessment software to support local/regionalimpacts and adaptation assessment. Climatic Change, 90. 1/2, pp. 1–187.
Horritt, M.S., Bates, P.D., 2001. Predicting floodplain inundation: raster-based modellingversus the finite element approach. Hydrol. Process. 15, 825–842.
ISTAT, 2009. http://www3.istat.it/dati/catalogo/20100526_00/Avvio2009.pdf (in Italian).Kodikara, P.N., et al., 2010. Stakeholder preference elicitation and modeling in multi-
criteria decision analysis —a case study on urban water supply. Eur. J. Oper. Res.206, 209–220.
Lhomme, J., Sayers, P., Gouldby, B., Samuels, P., Wills, M., Mulet-Marti, J., 2008. Recentdevelopment and application of a rapid flood spreading method, River Flow 2008.
Li, D.-F., Huang, Z.-G., Cheng, G.-H., et al., 2010. A systematic approach to heterogeneousmulti-attribute group decision making. Comput. Ind. Eng. 59, 561–572.
Martinelli, L., Zanuttigh, B., Corbau, C., 2010. Assessment of coastal flooding risk along theEmilia Romagna littoral, Italy. Coast. Eng. 57 (11–12), 1042–1058.
Meyer, F., Beucher, S., 1990. Morphological segmentation. J. Vis. Commun. ImageRepresent. 1 (1), 21–46.
Millennium Ecosystem Assessment (MEA), 2005. Ecosystems and Human Well-Being:Synthesis. Island Press, Washington, DC.
Miller, J.K., Dean, R.G., 2004. A simple new shoreline change model. Coast. Eng. 51,531–556.
Mokrech, Mustafa, Hanson, Susan, Nicholls, Robert J., Wolf, Judith, Walkden, Mike,Fontaine, Corentin, Nicholson-Cole, Sophie, Jude, Simon R., Leake, James, Stansby,Peter, Watkinson, Andrew R., Rounsevell, Mark D.A., Lowe, Jason A., Hall, Jim W.,2009. The Tyndall coastal simulator. J. Coast. Conserv. Plan. Manag. http://dx.doi.org/10.1007/s11852-009-0083-6.
Monbaliu, Jaak, Chen, Zhongyuan, Felts, Didier, Ge, Jianzhong, Hissel, Francois,Kappenberg, Jens, Narayan, Sid, Nicholls, Robert J., Ohle, Nino, Schuster, Dagmar,Sothmann, Janina, Willems, Patrick, 2014. Risk assessment of estuaries under climatechange: lessons from Western Europe. Coast. Eng. 87, 32–49.
Narayan, S., Hanson, S., Nicholls, R.J., Clarke, D., Willems, P., Ntegeka, V., Monbaliu, J., 2012.A holisticmodel for coastalflooding using systemdiagrams and the Source–Pathway–Receptor (SPR) concept. [in special issue Sea Hazards]. Nat. Hazards Earth Syst. Sci. 12(5), 1431–1439. http://dx.doi.org/10.5194/nhess-12-1431-2012.
Narayan, S., Nicholls, R.J., Clarke, D., Hanson, S., Reeve, D., Horrillo-Caraballo, J.M.,Trifonova, E., Filipova-Marinova, M., Kowalska, B., Parda, R., Hissel, F., Willems, P.,Ohle, N., Zanuttigh, B., Losada, I.J., Ge, J., Penning-Rowsell, E., Vanderlinden, J.P.,2014. The SPR systemsmodel as a conceptual foundation for rapid integrated risk ap-praisals: Lessons from Europe. Coast. Eng. 87, 15–31.
Nielsen, P., 1992. Coastal Bottom Boundary Layers and Sediment Transport. WorldScientific, Singapore (324 pp.).
Penning-Rowsell, E.C., Floyd, P., Ramsbottom, D., Surendran, S., 2005. Estimating injuryand loss of life in floods: a deterministic framework. Nat. Hazards 36, 43–64.
Poulter, B., Halpin, P.N., 2008. Raster modelling of coastal flooding from sea-level rise. Int.J. Geogr. Inf. Sci. 22 (2), 167–182.
SAFECOAST, 2008. Final Report. available at www.safecoast.org.Schirmer, M., Schuchardt, B., Hahn, B., Bakkenist, S., Kraft, D., 2003. KRIM: Climate change
risk construct and coastal defence. DEKLM German climate research programme.Proceedings, pp. 269–273.
Schwarz, J., Maiwald, H., 2008. Damage and loss prediction model based on the vulnera-bility of building types. 4th International Symposium on Flood Defence: ManagingFlood Risk, Reliability and Vulnerability. Toronto, Ontario, Canada, May 6–8, 2008.
Sheppard, S.R.J., 2012. Visualizing Climate Change: A Guide to Visual Communication ofClimate Change and Developing Local Solutions. Routledge, London (514 pp.).
Soille, P., Ansoult, M., 1990. Automated basin delineation from digital elevation modelsusing mathematical morphology. Signal Process. 20 (2), 171–182.
Stockdon, H.F., Holman, R.A., Howd, P.A., Sallenger, A.H., 2006. Empirical parameterizationof setup, swash, and runup. Coast. Eng. 53 (7), 573–588.
Tapsell, S., 2011. Socio-psychological dimensions of flood risk management. In: Pender,G., Faulkner, H. (Eds.), Contained in Flood Risk Science and Management. Wiley-Blackwell, Oxford, UK.
THESEUS OD2.7, 2013. Integrated report on design of innovative coastal structures andbest practices for coastal defence. Results from numerical, experimental and prototypetesting. www.theseusproject.eu/index.php?option=com_remository&Itemid=2&func=fileinfo&id=438.
Thieler, E.R., Hammar-Klose, E.S., 1999. National assessment of coastal vulnerability tofuture sea-level rise: preliminary results for the US Atlantic Coast. US GeologicalSurvey, Open File Report 99–593.
Thorne, C., Evans, E., Penning-Rowsell, E. (Eds.), 2007. Future Flooding and CoastalErosion Risks. Thomas Telford, London, UK (350 pp.).
Torresan, S., Zabeo, A., Rizzi, J., Critto, A., Pizzol, L., Giove, S., Marcomini, A., 2010.Risks assessment and decision support tools for the integrated evaluation of cli-mate change impacts on coastal zones. International Congress on EnvironmentalModelling and Software Modelling for Environmental Sake, Fifth Biennial Meet-ing, Ottawa, Canada.
UNISDR, 2009. UNISDR Terminology on Disaster Risk Reduction. United Nations, New York.Vafeidis, Athanasios T., Nicholls, Robert J., McFadden, Loraine, Tol, Richard S.J., Hinkel,
Jochen, Spencer, Tom, Grashoff, Poul S., Boot, Gerben, Klein, Richard J.T., 2008. Anew global coastal database for impact and vulnerability analysis to sea-level rise.J. Coast. Res. 24 (4), 917–924. http://dx.doi.org/10.2112/06-0725.1.
van Buuren, J.T., Engelen, G., van de Ven, K., 2002. The DSS WadBOS and EU policiesimplementation.
Vannote, R.L., Minshall, G.W., Cummins, K.W., Sedell, J.R., Cushing, C.E., 1980. The rivercontinuum concept. Can. J. Fish. Aquat. Sci. 37 (1), 130–137.

239B. Zanuttigh et al. / Coastal Engineering 87 (2014) 218–239
Vasconcelos, R.P., Reis-Santos, P., Fonseca, V., Maia, A., Ruano, M., França, S., Vinagre, C.,Costa, M.J., Cabral, H., 2007. Assessing anthropogenic pressures on estuarine fishnurseries along the Portuguese coast: a multi-metric index and conceptual approach.Sci. Total Environ. 374, 199–215.
Villatoro, M.M., Silva, R., Méndez, F.J., Zanuttigh, B., Shunqi, P., Trifonova, E., Losada, I.J.,Izaguirre, C., Simmonds, D., Reeve, D., Mendoza, E.G., Martinelli, L., Bagli, S.,Galiatsatou, P., Eftimova, P., 2014. An Approach to Assess Flooding and Erosion Riskfor Open Beaches in a Changing Climate. Coast. Eng. 87, 50–76.
Wang, C., Wan, T., Palmer, I., 2010. Urban flood risk analysis for determining optimal floodprotection levels based on digital terrain model and flood spreading model. Vis.Comput. 1–13.
Warrick, R.A., 2009. Using SimCLIM for modelling the impacts of climate extremes in achanging climate: a preliminary case study of household water harvesting inSoutheast Queensland. 18th World IMACS/MODSIM Congress, Cairns, Australia13–17, July 2009.
Weisse, Ralf, Bellafiore, Debora, Menéndez, Melisa, Méndez, Fernando, Nicholls, Robert J.,Umgiesser, Georg,Willems, Patrick, 2014. Changing extreme sea levels along Europe-an coasts. Coast. Eng. 87, 4–14.
Wisner, B., Blaikie, P., Cannon, T., Davis, I., 2004. At Risk: Natural Hazards, People'sVulnerability and Disasters. Routledge, London.
Wright, D., Bartlett, D., 2000. Marine and Coastal Geographical Information Systems.Taylor and Francis, London.
Wright, D.J., Dwyer, E., Cummins, V. (Eds.), 2011. Coastal Informatics: Web Atlas Designand Implementation. IGI-Global, Hershey, PA. http://dx.doi.org/10.4018/978-1-61520-815-9 (ISBN13: 9781615208159, 350 pp.).
Yan, H.-B., Huynh, V.-N., Nakamori, Y., 2011. A probabilistic model for linguistic multi-expertdecision making involving semantic overlapping. Expert Syst. Appl. 38, 8901–8912.
Zerger, A., Smith, D.I., Hunter, G.J., Jones, S.D., 2002. Riding the storm: a comparison ofuncertainty modelling techniques for storm surge risk management. Appl. Geogr.22 (3), 307–330.
Recommended