
This paper might be a pre-copy-editing or a post-print author-produced .pdf of an article accepted for publication. For the
definitive publisher-authenticated version, please refer directly to publishing house’s archive system.
Boundary-Layer Meteorology manuscript No.(will be inserted by the editor)
Flow and pollutant transport in urban street canyons of different aspect ratios
with ground heating
Xian-Xiang Li · Rex E. Britter · Leslie K. Norford · Tieh
Yong Koh · Dara Entekhabi
Received: September 8, 2010
Abstract A validated large-eddy simulation model was employed to study the effect of the aspect ratio and
ground heating on the flow and pollutant dispersion in urban street canyons. Three ground heating intensities
(neutral, weak and strong) were imposed in the street canyons of aspect ratio 1, 2, and 0.5. The detailed
patterns of flow, turbulence, temperature and pollutant transport were analysed and compared. Of all the cases
simulated, significant changes of flow and scalar patterns were caused by ground heating in the street canyon
of aspect ratio 2 and 0.5, while only the street canyon of aspect ratio 0.5 showed change in flow regime (from
wake interference flow to skimming flow). Ground heating generated strong mixing of heat and pollutant, but
the normalised temperature inside street canyons was spatially uniform and somewhat insensitive to the aspect
ratio and heating intensity. The quadrant analysis of pollutant flux showed that sweeps dominated in most of
the regions within the street canyon, while ejections dominated in the wake of the line source and above the
street canyon. The ground heating was shown to enhance ejections at the leeward roof-level corner.
X-X Li
CENSAM, Singapore-MIT Alliance for Research and Technology, S16-05-08, 3 Science Drive 2, Singapore 117543
E-mail: [email protected]
R.E. Britter
Department of Urban Studies and Planning, Massachusetts Institute of Technology, Cambridge, MA, USA
L.K. Norford
Department of Architecture, Massachusetts Institute of Technology, Cambridge, MA, USA
T-Y Koh
School of Physical and Mathematical Sciences, Nanyang Technological University, Singapore 637371
D. Entekhabi
Department of Civil and Environmental Engineering, Massachusetts Institute of Technology, Cambridge, MA, USA
2 Xian-Xiang Li et al.
Keywords Aspect ratio · Ground heating · Large-eddy simulation · Pollutant dispersion · Urban street
canyon · Unstable stratification
1 Introduction1
With rapid urbanization and city expansion, the sustainable development of the urban environment is now2
facing many challenges, such as urban heat island effect, deteriorating air quality and severe securities con-3
cerns (Fernando et al., 2001; Britter and Hanna, 2003; Belcher, 2005). As the typical element of the urban area,4
the street canyon exhibits a distinct climate where microscale meteorological processes dominate (Oke, 1988).5
These unique microscale meteorological processes affect not only the local air quality but also the comfort of6
city inhabitants (Bottema, 1993). Therefore, many research efforts have been devoted to the characteristics of7
airflow and pollutant dispersion in urban street canyons during the past few decades (Ahmad et al., 2005; Li8
et al., 2006; Vardoulakis et al., 2003).9
Located within the roughness sublayer (RSL), the flow in urban street canyon has a strong dependence on10
the local urban morphology. The flow field inside an urban street canyon is mainly determined by the aspect11
ratio (AR) defined as building-height-to-street-width ratio (h/b, where h is the building height and b the street12
width; see Fig. 1). The flow inside street canyons can be classified into different flow regimes according to the AR,13
i.e. isolated roughness flow (IRF), wake interference flow (WIF) and skimming flow (SF) regimes (Oke, 1988).14
It was shown that within the SF regime, different ARs resulted in different number of primary recirculations in15
urban street canyons (Li et al., 2008, 2009). Another factor, the thermal effect (due to solar radiation, release of16
stored heat, and anthropogenic heat), also has a profound impact on the flow field, and therefore, the pollutant17
dispersion in street canyons, as demonstrated by many previous studies (Nakamura and Oke, 1988; Ca et al.,18
1995; Sini et al., 1996; Uehara et al., 2000; Kim and Baik, 2001; Xie et al., 2006).19
With the development of computer hardware and algorithms, the computational fluid dynamics (CFD)20
technique has become a popular and powerful tool in urban street canyon research due to its efficiency and21
relatively low cost (Li et al., 2006). Of the many CFD models, Reynolds-averaged Navier-Stokes equations22
(RANS) models have provided many insights into the characteristics of the airflow and dispersion in urban23
street canyons during the past two decades. Recently, large-eddy simulation (LES) has become popular in24
street-canyon studies mainly owing to its power of handling transient and unsteady turbulent processes (e.g.,25
Liu and Barth, 2002; Cui et al., 2004; Liu et al., 2004, 2005; Cai et al., 2008; Letzel et al., 2008; Li et al., 2008).26
LES of urban street canyons of different AR with ground heating 3
The LES model developed by Li et al. (2010) was validated against wind-tunnel data and then was applied27
to study the flow and dispersion inside the urban street canyon of AR 1 with ground heating. With different28
ground heating intensities, the flow, turbulence and pollutant dispersion exhibited some characteristics that29
were not present under isothermal conditions. They demonstrated that LES could be an ideal tool to study the30
thermal effects in street canyons.31
In this paper, the LES model developed in Li et al. (2010) is employed to study the effect of AR and ground32
heating on the flow and pollutant dispersion in urban street canyons. The objective is to investigate how the33
change of urban geometry will affect the flow pattern and pollutant transport when ground heating is present.34
2 Numerical model and boundary conditions35
2.1 Numerical model36
The LES code (Li et al., 2010) developed for incompressible turbulent flow based on a one-equation subgrid-scale37
(SGS) model is employed in this study. The thermal buoyancy forces are, using the Boussinesq approximation,38
taken into account in both the dimensionless Navier-Stokes equations and the transport equation for SGS39
turbulent kinetic energy (TKE). The reference length scale H (the building height of the street canyon of40
AR 1), the reference velocity scale U (free-stream velocity) and the reference temperature θa (the ambient41
temperature) are used to make the governing equations dimensionless.42
The details of the numerical model can be found elsewhere (Li et al., 2008; Li, 2008; Li et al., 2010) and will43
not be repeated here.44
2.2 Computational domain and boundary conditions45
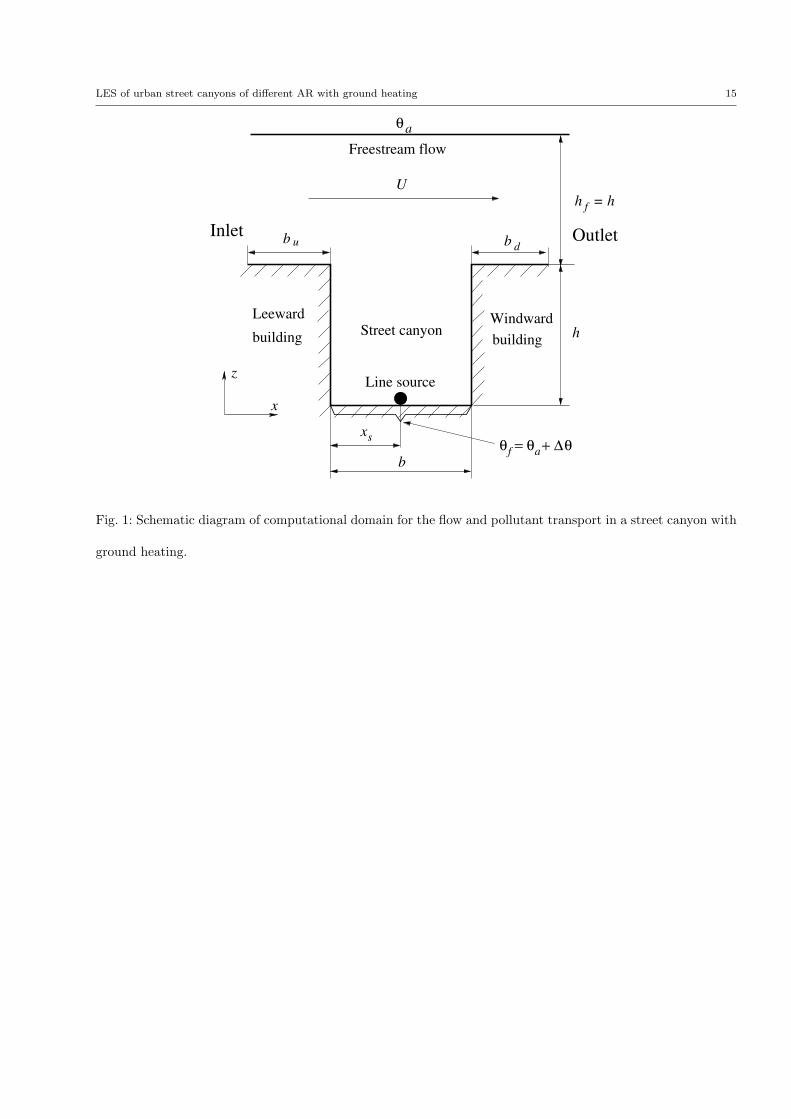
Figure 1 depicts the schematic computational domain used in the current study, which represents a typical46
street canyon in an idealised manner. The spanwise-homogeneous computational domain consists of a street47
canyon of height h at the bottom and a free shear layer of height h above the building. The width of the street48
is b and the length is L.49
The background atmospheric flow is simulated in the form of a pressure-driven free stream in the free shear50
layer only. The approaching wind flow is perpendicular to the street axis, which results in a free-stream wind51
speed U in the streamwise direction. The air flow boundary conditions are set to be periodic in the streamwise52
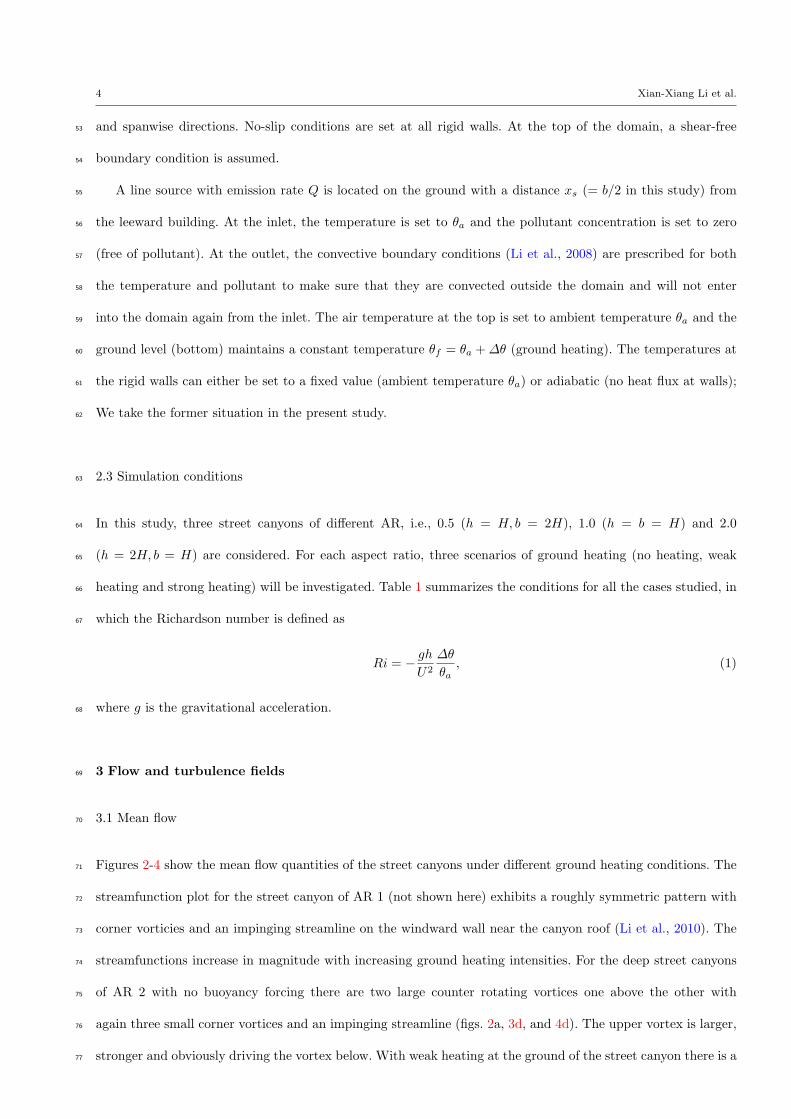
4 Xian-Xiang Li et al.
and spanwise directions. No-slip conditions are set at all rigid walls. At the top of the domain, a shear-free53
boundary condition is assumed.54
A line source with emission rate Q is located on the ground with a distance xs (= b/2 in this study) from55
the leeward building. At the inlet, the temperature is set to θa and the pollutant concentration is set to zero56
(free of pollutant). At the outlet, the convective boundary conditions (Li et al., 2008) are prescribed for both57
the temperature and pollutant to make sure that they are convected outside the domain and will not enter58
into the domain again from the inlet. The air temperature at the top is set to ambient temperature θa and the59
ground level (bottom) maintains a constant temperature θf = θa +∆θ (ground heating). The temperatures at60
the rigid walls can either be set to a fixed value (ambient temperature θa) or adiabatic (no heat flux at walls);61
We take the former situation in the present study.62
2.3 Simulation conditions63
In this study, three street canyons of different AR, i.e., 0.5 (h = H, b = 2H), 1.0 (h = b = H) and 2.064
(h = 2H, b = H) are considered. For each aspect ratio, three scenarios of ground heating (no heating, weak65
heating and strong heating) will be investigated. Table 1 summarizes the conditions for all the cases studied, in66
which the Richardson number is defined as67
Ri = − gh
U2
∆θ
θa, (1)
where g is the gravitational acceleration.68
3 Flow and turbulence fields69
3.1 Mean flow70
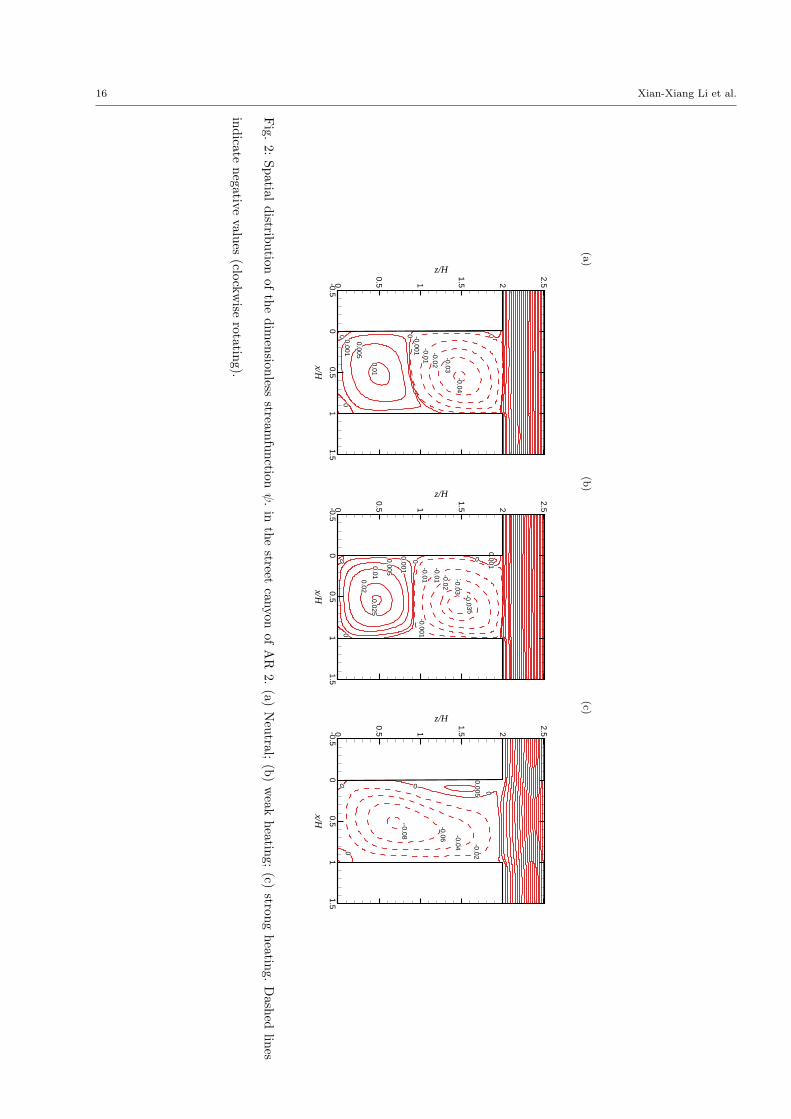
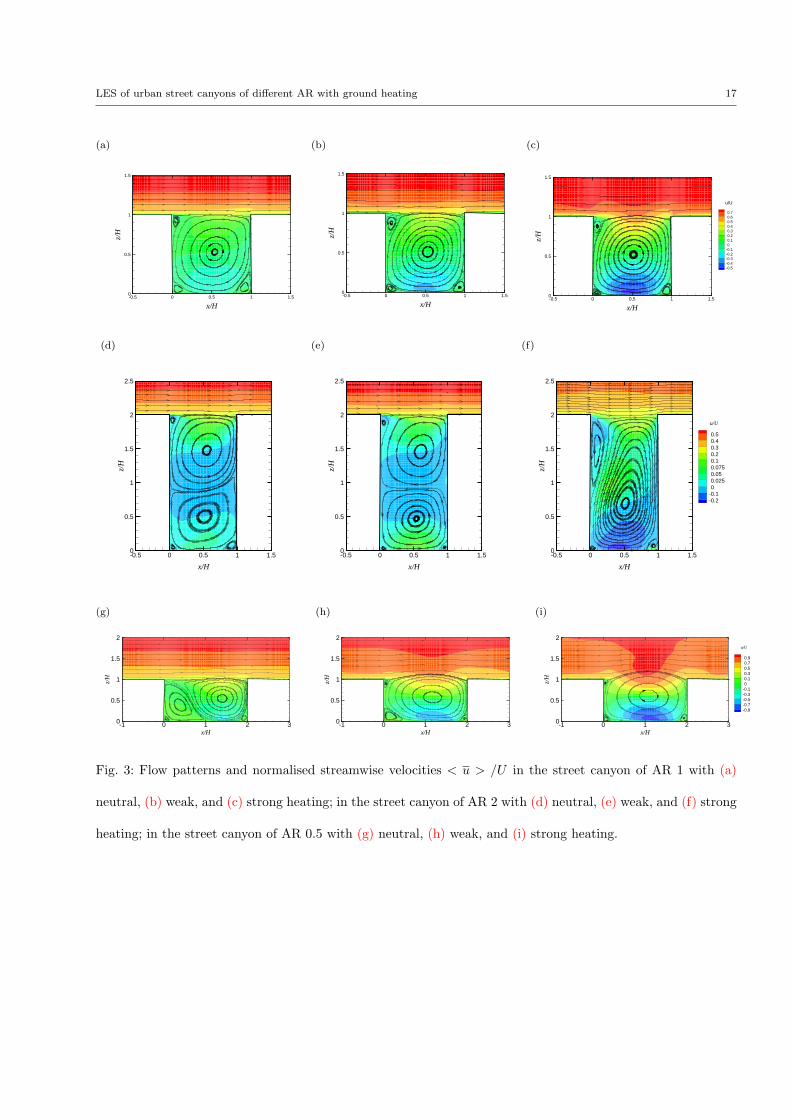
Figures 2-4 show the mean flow quantities of the street canyons under different ground heating conditions. The71
streamfunction plot for the street canyon of AR 1 (not shown here) exhibits a roughly symmetric pattern with72
corner vorticies and an impinging streamline on the windward wall near the canyon roof (Li et al., 2010). The73
streamfunctions increase in magnitude with increasing ground heating intensities. For the deep street canyons74
of AR 2 with no buoyancy forcing there are two large counter rotating vortices one above the other with75
again three small corner vortices and an impinging streamline (figs. 2a, 3d, and 4d). The upper vortex is larger,76
stronger and obviously driving the vortex below. With weak heating at the ground of the street canyon there is a77
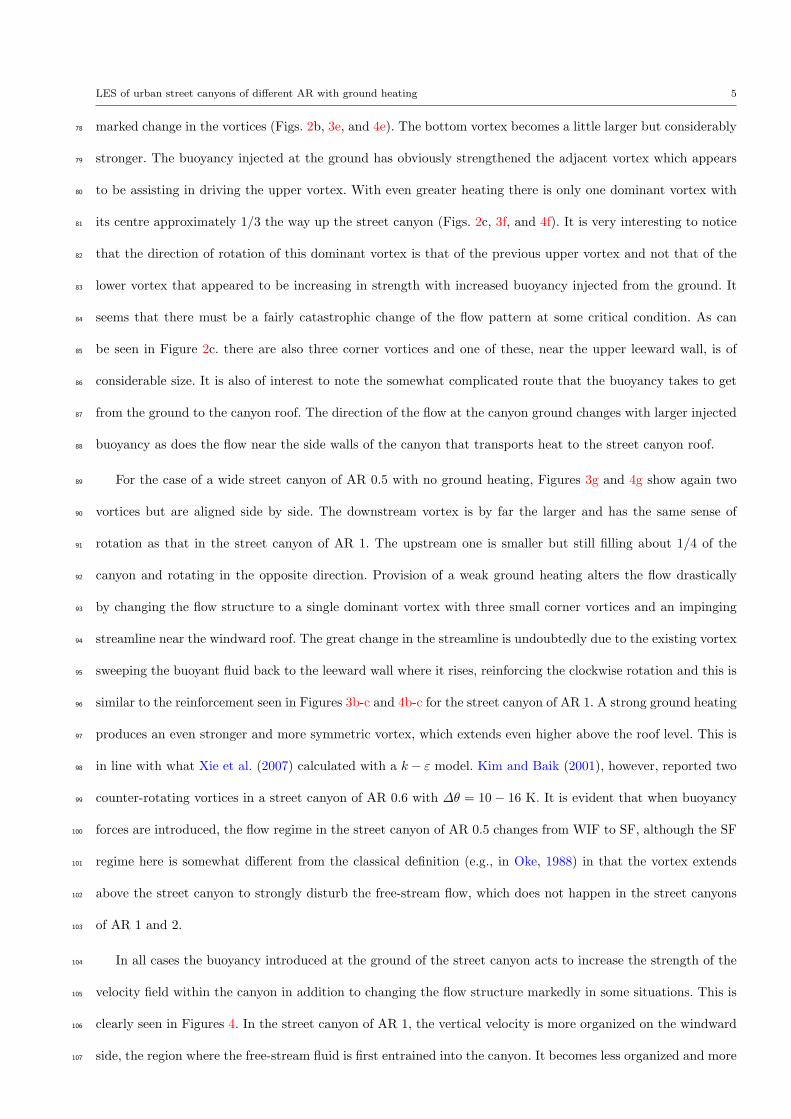
LES of urban street canyons of different AR with ground heating 5
marked change in the vortices (Figs. 2b, 3e, and 4e). The bottom vortex becomes a little larger but considerably78
stronger. The buoyancy injected at the ground has obviously strengthened the adjacent vortex which appears79
to be assisting in driving the upper vortex. With even greater heating there is only one dominant vortex with80
its centre approximately 1/3 the way up the street canyon (Figs. 2c, 3f, and 4f). It is very interesting to notice81
that the direction of rotation of this dominant vortex is that of the previous upper vortex and not that of the82
lower vortex that appeared to be increasing in strength with increased buoyancy injected from the ground. It83
seems that there must be a fairly catastrophic change of the flow pattern at some critical condition. As can84
be seen in Figure 2c. there are also three corner vortices and one of these, near the upper leeward wall, is of85
considerable size. It is also of interest to note the somewhat complicated route that the buoyancy takes to get86
from the ground to the canyon roof. The direction of the flow at the canyon ground changes with larger injected87
buoyancy as does the flow near the side walls of the canyon that transports heat to the street canyon roof.88
For the case of a wide street canyon of AR 0.5 with no ground heating, Figures 3g and 4g show again two89
vortices but are aligned side by side. The downstream vortex is by far the larger and has the same sense of90
rotation as that in the street canyon of AR 1. The upstream one is smaller but still filling about 1/4 of the91
canyon and rotating in the opposite direction. Provision of a weak ground heating alters the flow drastically92
by changing the flow structure to a single dominant vortex with three small corner vortices and an impinging93
streamline near the windward roof. The great change in the streamline is undoubtedly due to the existing vortex94
sweeping the buoyant fluid back to the leeward wall where it rises, reinforcing the clockwise rotation and this is95
similar to the reinforcement seen in Figures 3b-c and 4b-c for the street canyon of AR 1. A strong ground heating96
produces an even stronger and more symmetric vortex, which extends even higher above the roof level. This is97
in line with what Xie et al. (2007) calculated with a k − ε model. Kim and Baik (2001), however, reported two98
counter-rotating vortices in a street canyon of AR 0.6 with ∆θ = 10 − 16 K. It is evident that when buoyancy99
forces are introduced, the flow regime in the street canyon of AR 0.5 changes from WIF to SF, although the SF100
regime here is somewhat different from the classical definition (e.g., in Oke, 1988) in that the vortex extends101
above the street canyon to strongly disturb the free-stream flow, which does not happen in the street canyons102
of AR 1 and 2.103
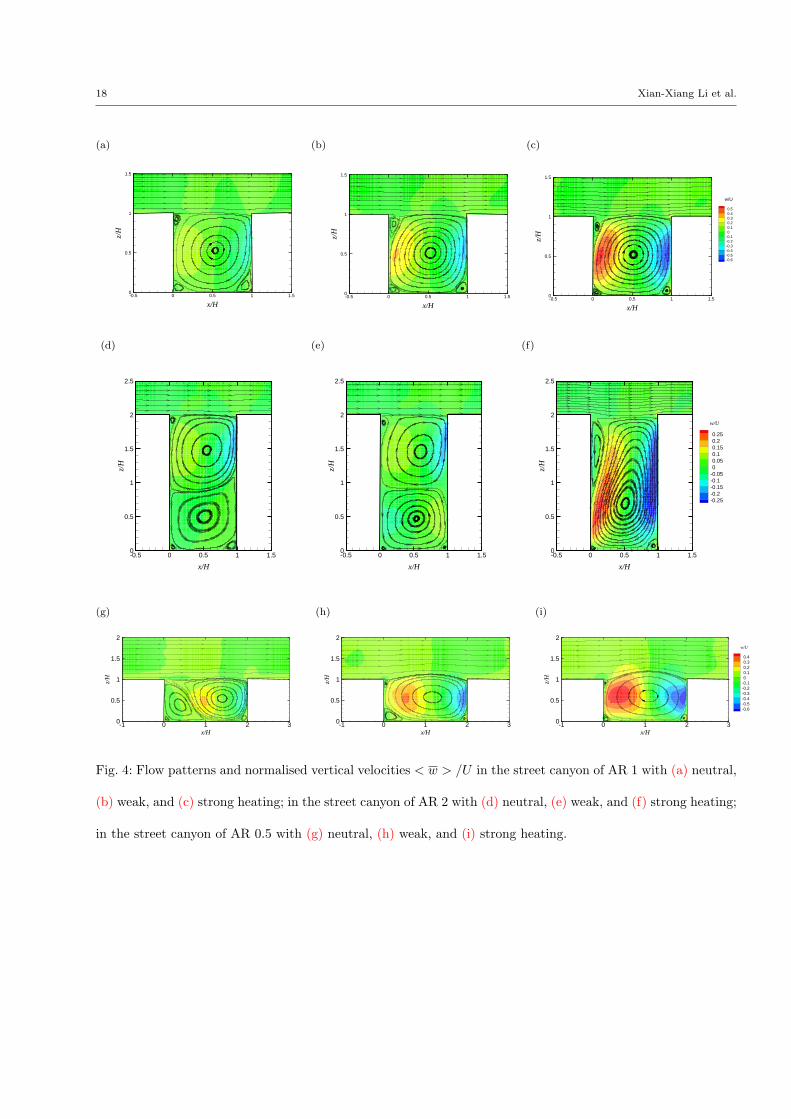
In all cases the buoyancy introduced at the ground of the street canyon acts to increase the strength of the104
velocity field within the canyon in addition to changing the flow structure markedly in some situations. This is105
clearly seen in Figures 4. In the street canyon of AR 1, the vertical velocity is more organized on the windward106
side, the region where the free-stream fluid is first entrained into the canyon. It becomes less organized and more107
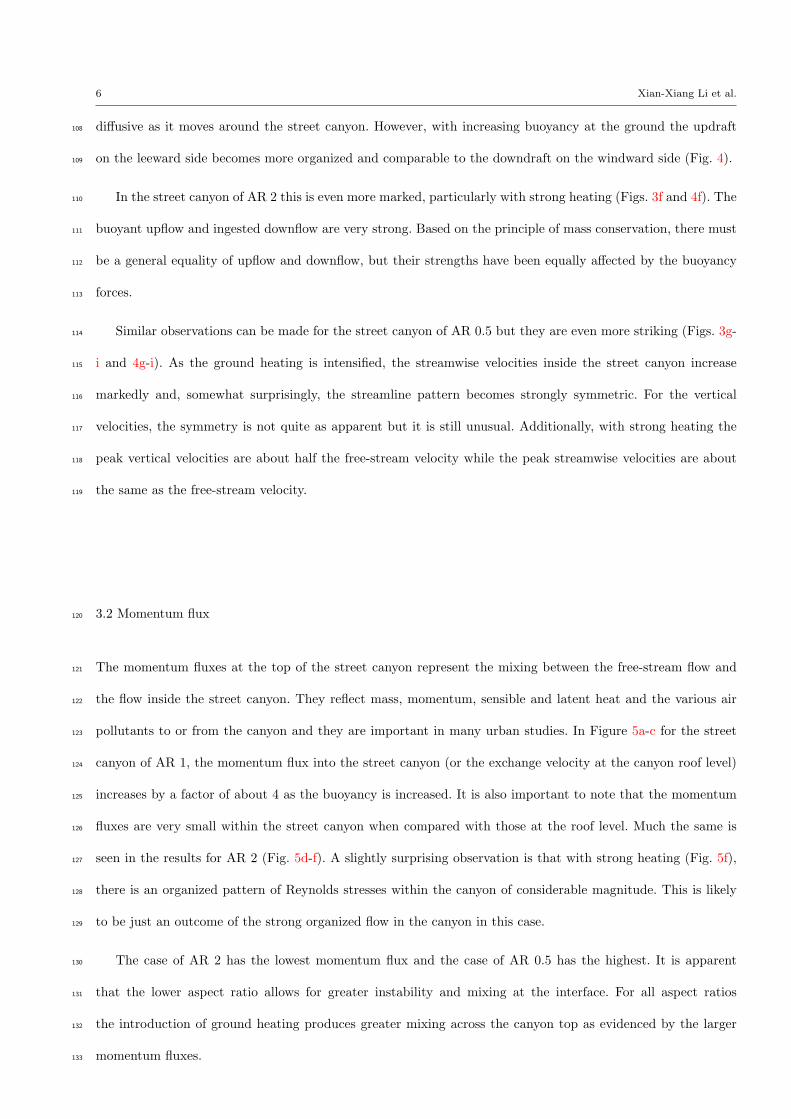
6 Xian-Xiang Li et al.
diffusive as it moves around the street canyon. However, with increasing buoyancy at the ground the updraft108
on the leeward side becomes more organized and comparable to the downdraft on the windward side (Fig. 4).109
In the street canyon of AR 2 this is even more marked, particularly with strong heating (Figs. 3f and 4f). The110
buoyant upflow and ingested downflow are very strong. Based on the principle of mass conservation, there must111
be a general equality of upflow and downflow, but their strengths have been equally affected by the buoyancy112
forces.113
Similar observations can be made for the street canyon of AR 0.5 but they are even more striking (Figs. 3g-114
i and 4g-i). As the ground heating is intensified, the streamwise velocities inside the street canyon increase115
markedly and, somewhat surprisingly, the streamline pattern becomes strongly symmetric. For the vertical116
velocities, the symmetry is not quite as apparent but it is still unusual. Additionally, with strong heating the117
peak vertical velocities are about half the free-stream velocity while the peak streamwise velocities are about118
the same as the free-stream velocity.119
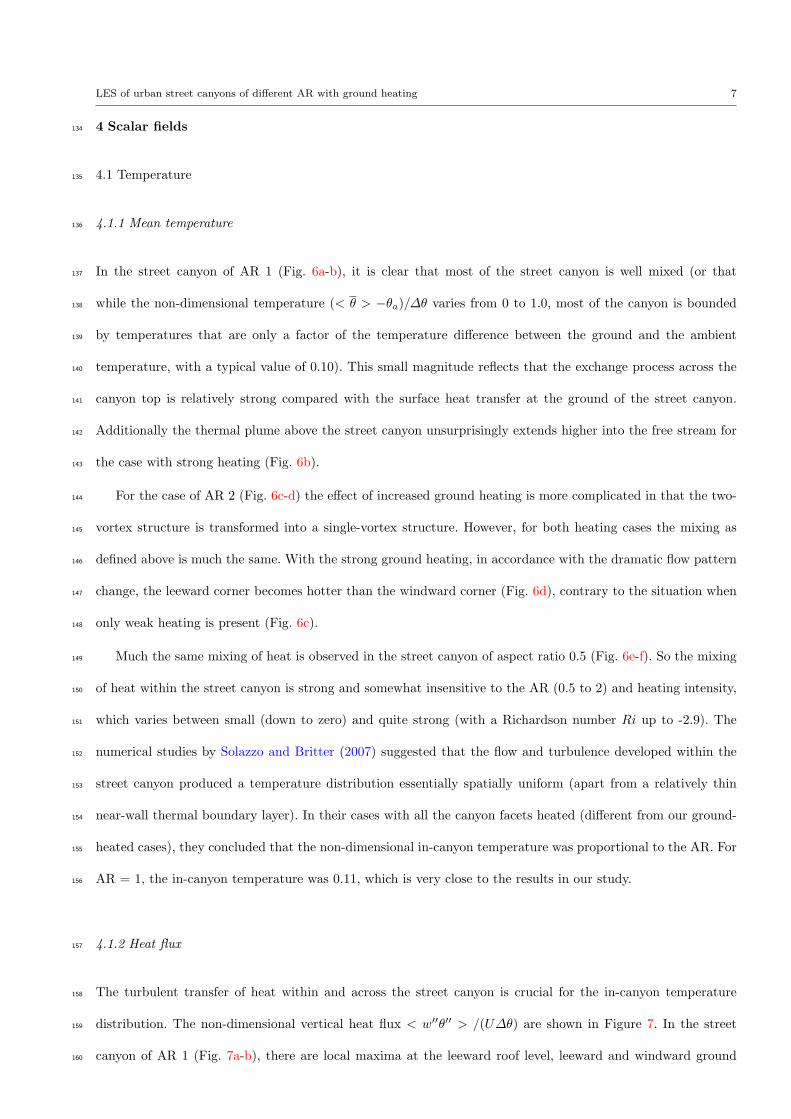
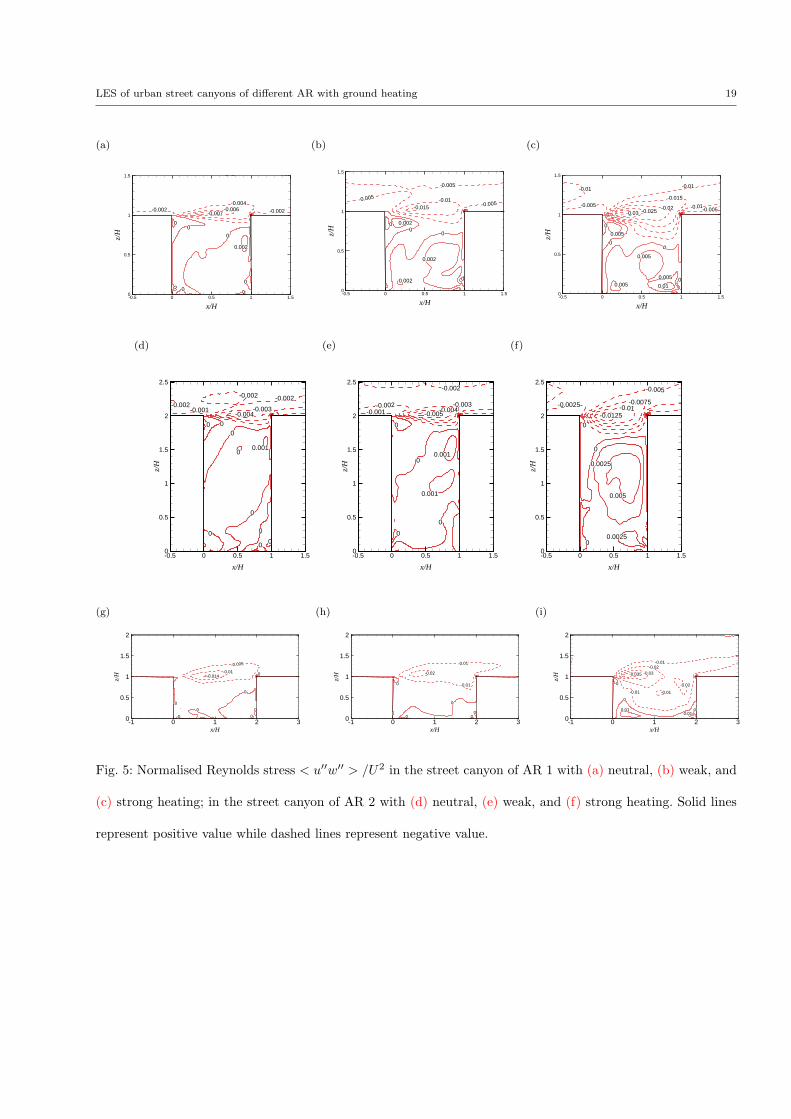
3.2 Momentum flux120
The momentum fluxes at the top of the street canyon represent the mixing between the free-stream flow and121
the flow inside the street canyon. They reflect mass, momentum, sensible and latent heat and the various air122
pollutants to or from the canyon and they are important in many urban studies. In Figure 5a-c for the street123
canyon of AR 1, the momentum flux into the street canyon (or the exchange velocity at the canyon roof level)124
increases by a factor of about 4 as the buoyancy is increased. It is also important to note that the momentum125
fluxes are very small within the street canyon when compared with those at the roof level. Much the same is126
seen in the results for AR 2 (Fig. 5d-f). A slightly surprising observation is that with strong heating (Fig. 5f),127
there is an organized pattern of Reynolds stresses within the canyon of considerable magnitude. This is likely128
to be just an outcome of the strong organized flow in the canyon in this case.129
The case of AR 2 has the lowest momentum flux and the case of AR 0.5 has the highest. It is apparent130
that the lower aspect ratio allows for greater instability and mixing at the interface. For all aspect ratios131
the introduction of ground heating produces greater mixing across the canyon top as evidenced by the larger132
momentum fluxes.133
LES of urban street canyons of different AR with ground heating 7
4 Scalar fields134
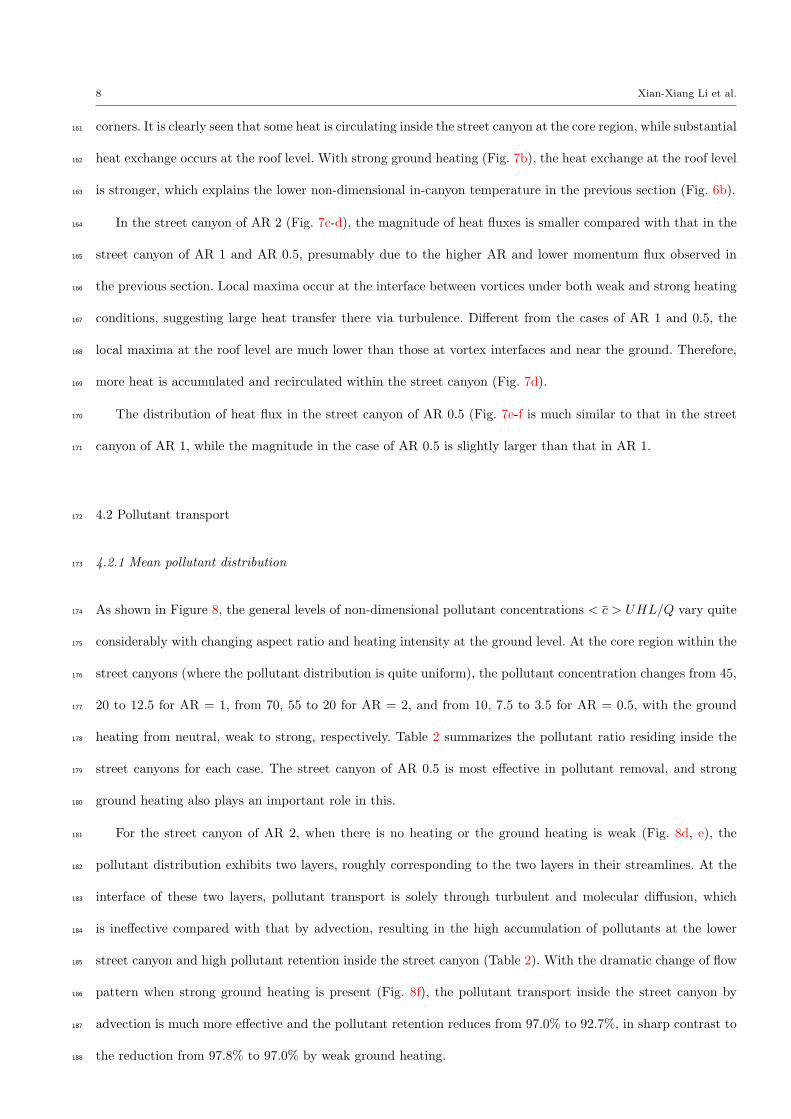
4.1 Temperature135
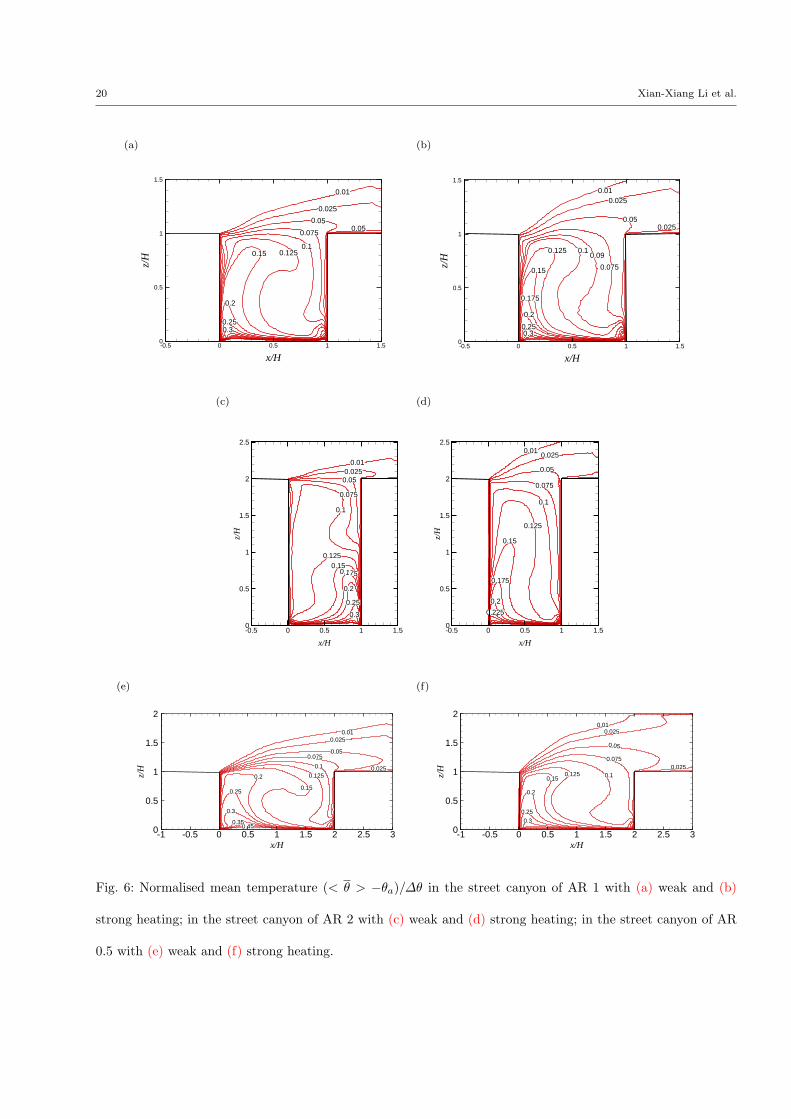
4.1.1 Mean temperature136
In the street canyon of AR 1 (Fig. 6a-b), it is clear that most of the street canyon is well mixed (or that137
while the non-dimensional temperature (< θ > −θa)/∆θ varies from 0 to 1.0, most of the canyon is bounded138
by temperatures that are only a factor of the temperature difference between the ground and the ambient139
temperature, with a typical value of 0.10). This small magnitude reflects that the exchange process across the140
canyon top is relatively strong compared with the surface heat transfer at the ground of the street canyon.141
Additionally the thermal plume above the street canyon unsurprisingly extends higher into the free stream for142
the case with strong heating (Fig. 6b).143
For the case of AR 2 (Fig. 6c-d) the effect of increased ground heating is more complicated in that the two-144
vortex structure is transformed into a single-vortex structure. However, for both heating cases the mixing as145
defined above is much the same. With the strong ground heating, in accordance with the dramatic flow pattern146
change, the leeward corner becomes hotter than the windward corner (Fig. 6d), contrary to the situation when147
only weak heating is present (Fig. 6c).148
Much the same mixing of heat is observed in the street canyon of aspect ratio 0.5 (Fig. 6e-f). So the mixing149
of heat within the street canyon is strong and somewhat insensitive to the AR (0.5 to 2) and heating intensity,150
which varies between small (down to zero) and quite strong (with a Richardson number Ri up to -2.9). The151
numerical studies by Solazzo and Britter (2007) suggested that the flow and turbulence developed within the152
street canyon produced a temperature distribution essentially spatially uniform (apart from a relatively thin153
near-wall thermal boundary layer). In their cases with all the canyon facets heated (different from our ground-154
heated cases), they concluded that the non-dimensional in-canyon temperature was proportional to the AR. For155
AR = 1, the in-canyon temperature was 0.11, which is very close to the results in our study.156
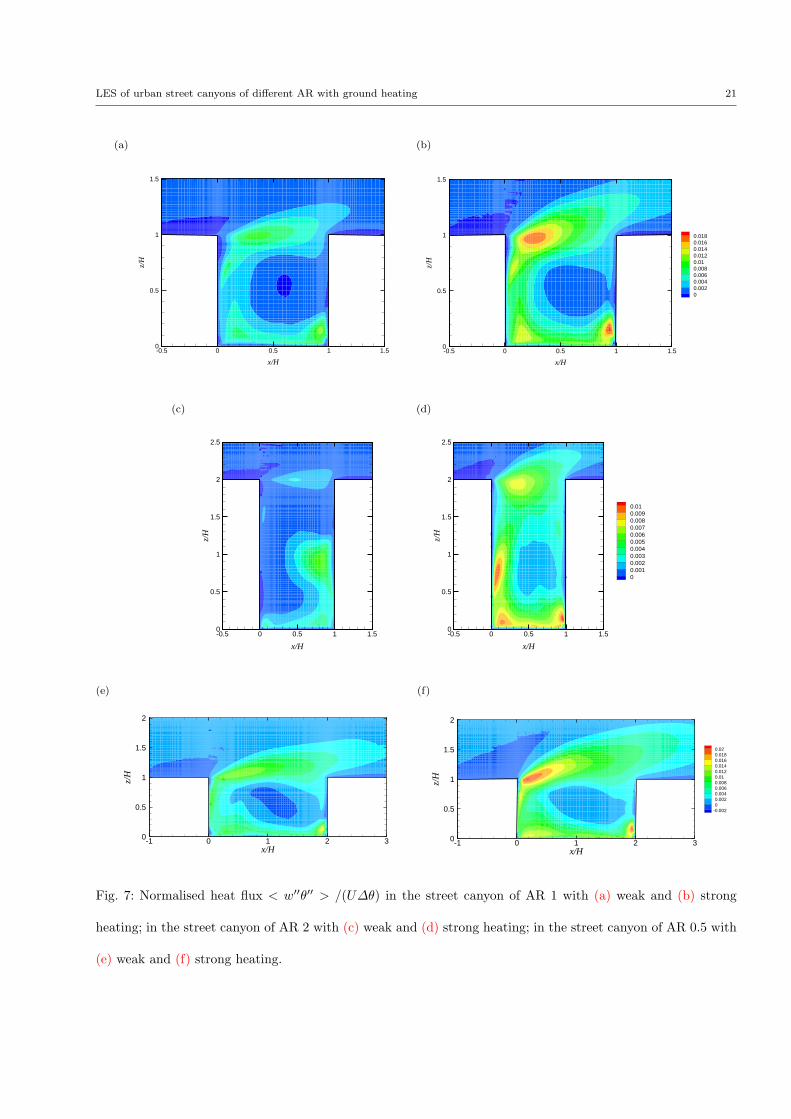
4.1.2 Heat flux157
The turbulent transfer of heat within and across the street canyon is crucial for the in-canyon temperature158
distribution. The non-dimensional vertical heat flux < w′′θ′′ > /(U∆θ) are shown in Figure 7. In the street159
canyon of AR 1 (Fig. 7a-b), there are local maxima at the leeward roof level, leeward and windward ground160
8 Xian-Xiang Li et al.
corners. It is clearly seen that some heat is circulating inside the street canyon at the core region, while substantial161
heat exchange occurs at the roof level. With strong ground heating (Fig. 7b), the heat exchange at the roof level162
is stronger, which explains the lower non-dimensional in-canyon temperature in the previous section (Fig. 6b).163
In the street canyon of AR 2 (Fig. 7c-d), the magnitude of heat fluxes is smaller compared with that in the164
street canyon of AR 1 and AR 0.5, presumably due to the higher AR and lower momentum flux observed in165
the previous section. Local maxima occur at the interface between vortices under both weak and strong heating166
conditions, suggesting large heat transfer there via turbulence. Different from the cases of AR 1 and 0.5, the167
local maxima at the roof level are much lower than those at vortex interfaces and near the ground. Therefore,168
more heat is accumulated and recirculated within the street canyon (Fig. 7d).169
The distribution of heat flux in the street canyon of AR 0.5 (Fig. 7e-f is much similar to that in the street170
canyon of AR 1, while the magnitude in the case of AR 0.5 is slightly larger than that in AR 1.171
4.2 Pollutant transport172
4.2.1 Mean pollutant distribution173
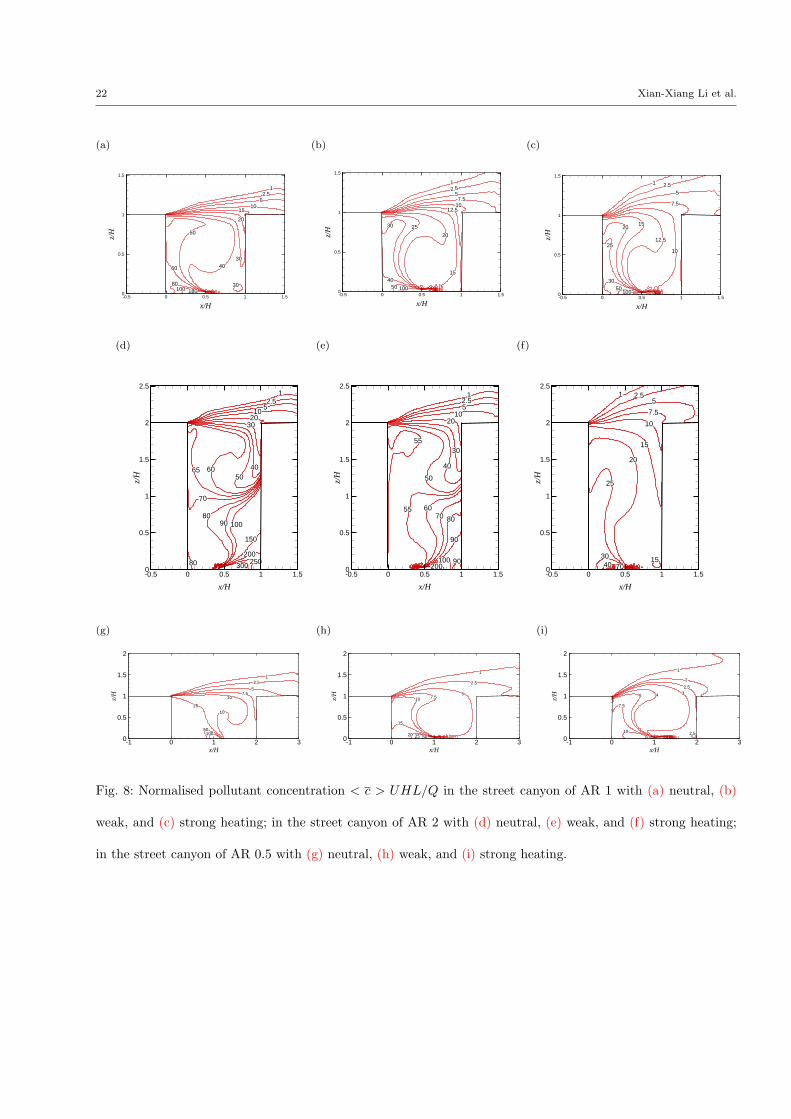
As shown in Figure 8, the general levels of non-dimensional pollutant concentrations < c > UHL/Q vary quite174
considerably with changing aspect ratio and heating intensity at the ground level. At the core region within the175
street canyons (where the pollutant distribution is quite uniform), the pollutant concentration changes from 45,176
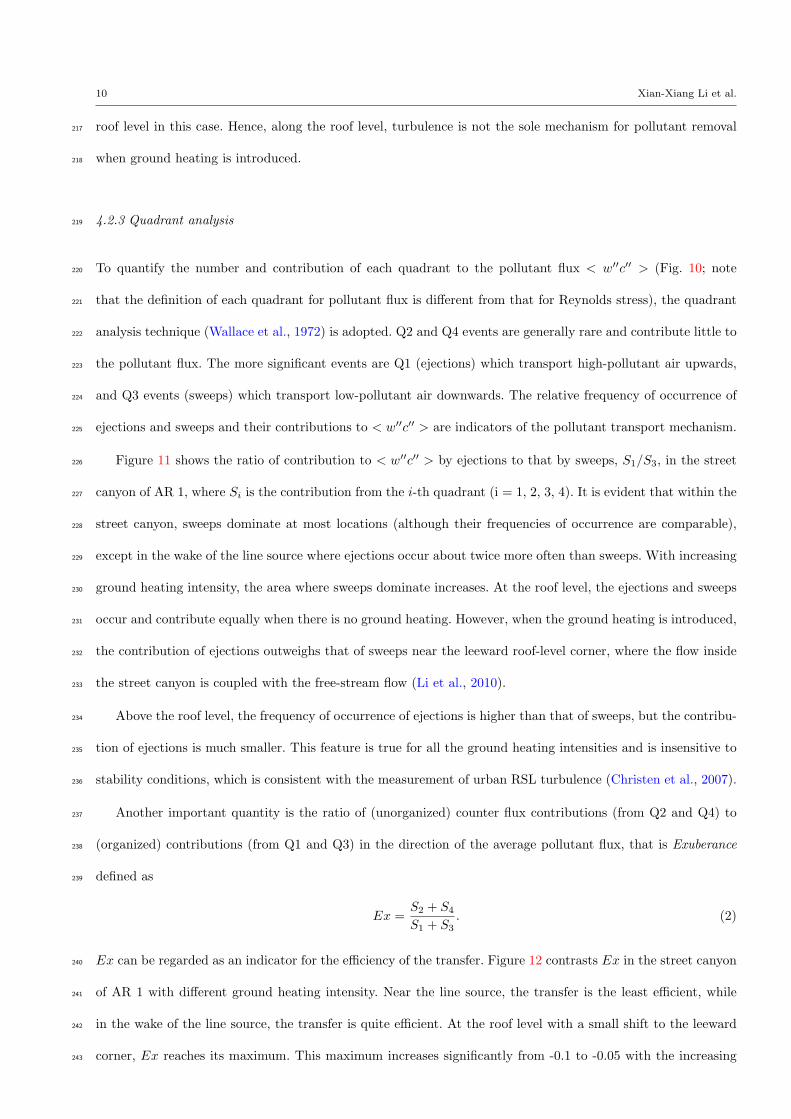
20 to 12.5 for AR = 1, from 70, 55 to 20 for AR = 2, and from 10, 7.5 to 3.5 for AR = 0.5, with the ground177
heating from neutral, weak to strong, respectively. Table 2 summarizes the pollutant ratio residing inside the178
street canyons for each case. The street canyon of AR 0.5 is most effective in pollutant removal, and strong179
ground heating also plays an important role in this.180
For the street canyon of AR 2, when there is no heating or the ground heating is weak (Fig. 8d, e), the181
pollutant distribution exhibits two layers, roughly corresponding to the two layers in their streamlines. At the182
interface of these two layers, pollutant transport is solely through turbulent and molecular diffusion, which183
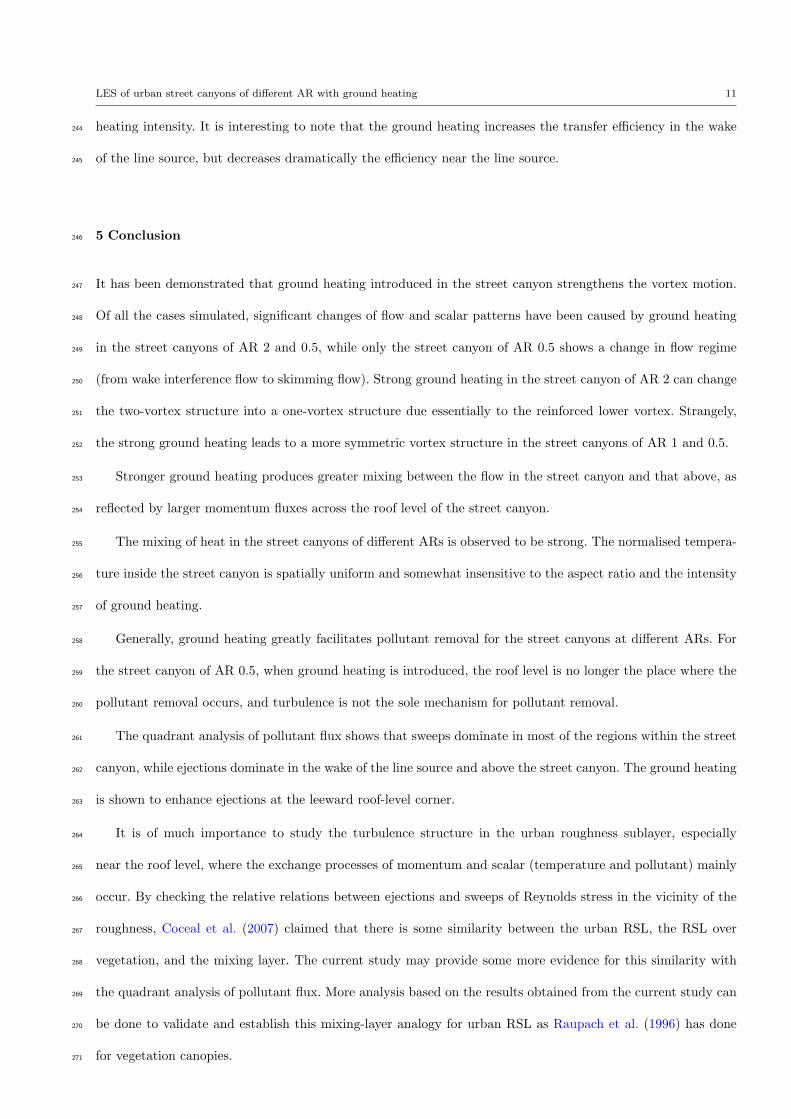
is ineffective compared with that by advection, resulting in the high accumulation of pollutants at the lower184
street canyon and high pollutant retention inside the street canyon (Table 2). With the dramatic change of flow185
pattern when strong ground heating is present (Fig. 8f), the pollutant transport inside the street canyon by186
advection is much more effective and the pollutant retention reduces from 97.0% to 92.7%, in sharp contrast to187
the reduction from 97.8% to 97.0% by weak ground heating.188
LES of urban street canyons of different AR with ground heating 9
It is worth noting the difference between the temperature and pollutant, although they are both treated189
as scalars (one active and one passive) and governed by equations of the same form. The main reasons for190
their different distribution patterns are twofold. On one hand, the source sizes are obviously different: the191
temperature has an area source occupying the whole street floor, while the pollutant source is a line source192
situated in the middle of the street floor. Smaller sources are known to produce more detail in the concentration193
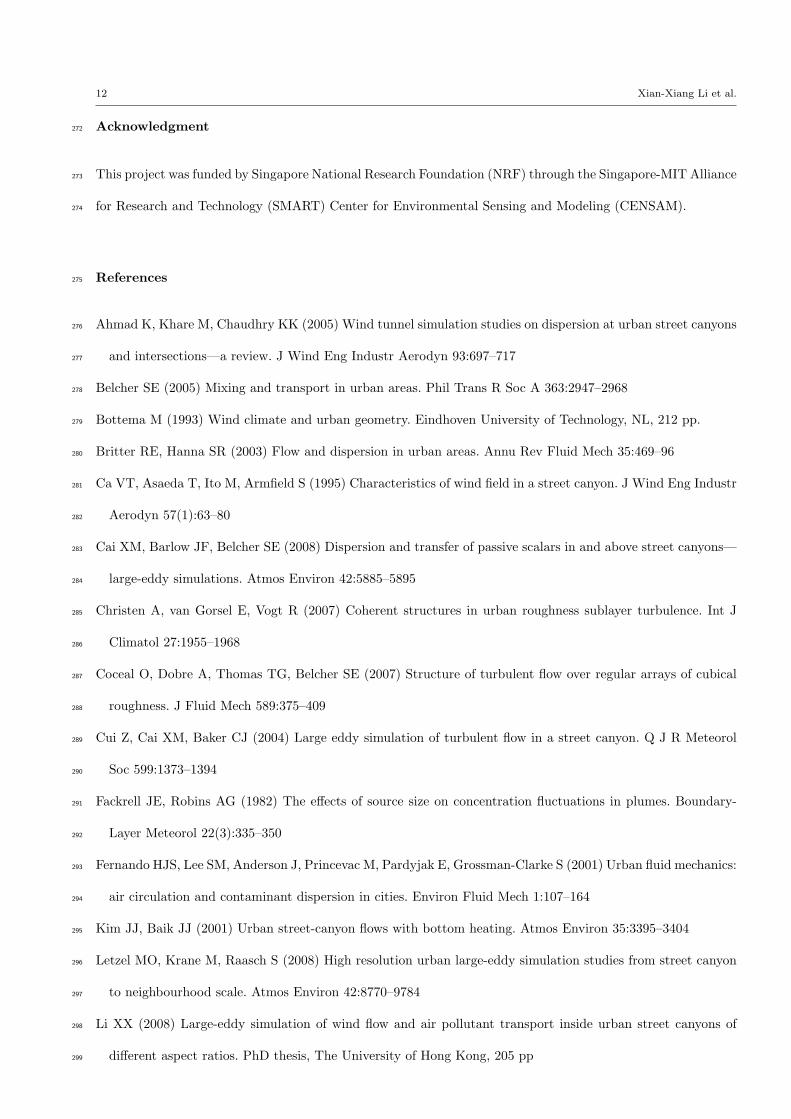
field (Fackrell and Robins, 1982). On the other hand, the boundary conditions for each scalar are different, as194
outlined in Section 2.2. Physically, there are heat transfer at solid walls, which are impermeable for pollutants.195
Mathematically, with the eddy-diffusivity assumption adopted in modeling the SGS heat (pollutant) fluxes, the196
governing equations are essentially elliptic. In addition, the temperature is fixed at most boundaries, therefore197
the temperature distribution must be basically fixed and independent of the heating intensity (Li et al., 2010).198
In contrast, the boundary conditions for the pollutant are mostly no-flux and hence the pollutant distribution199
is rather sensitive to the aspect ratio and heating intensity.200
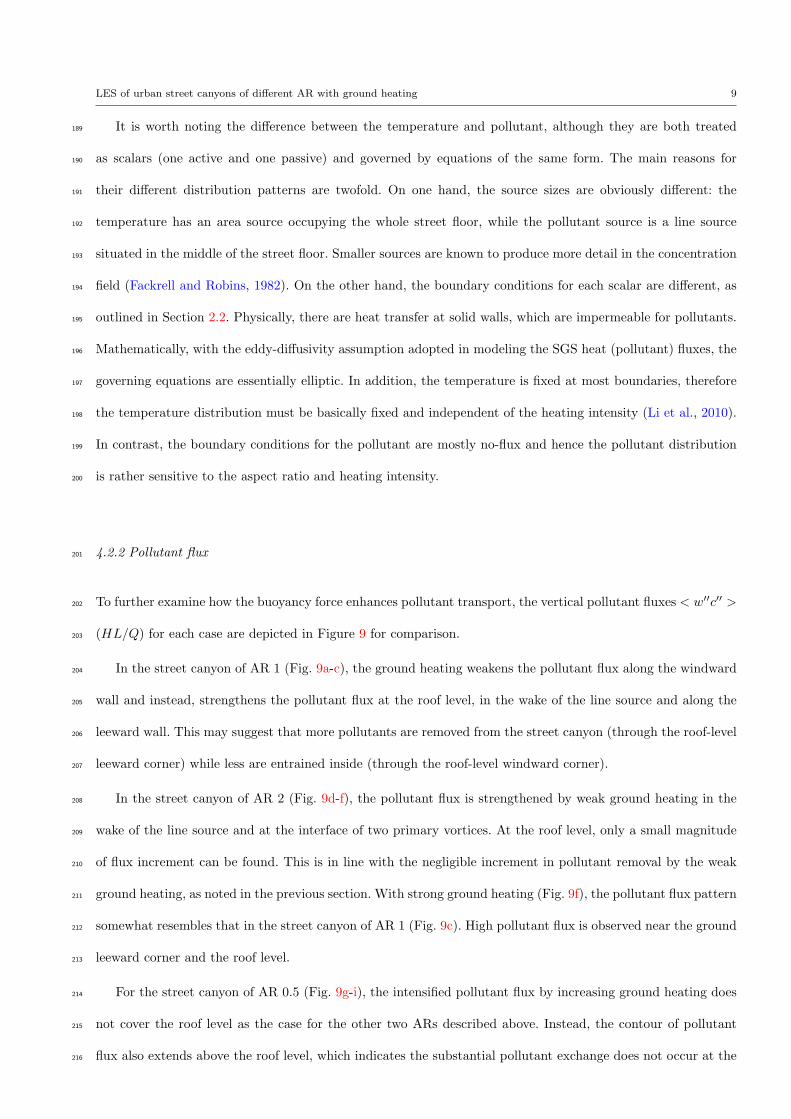
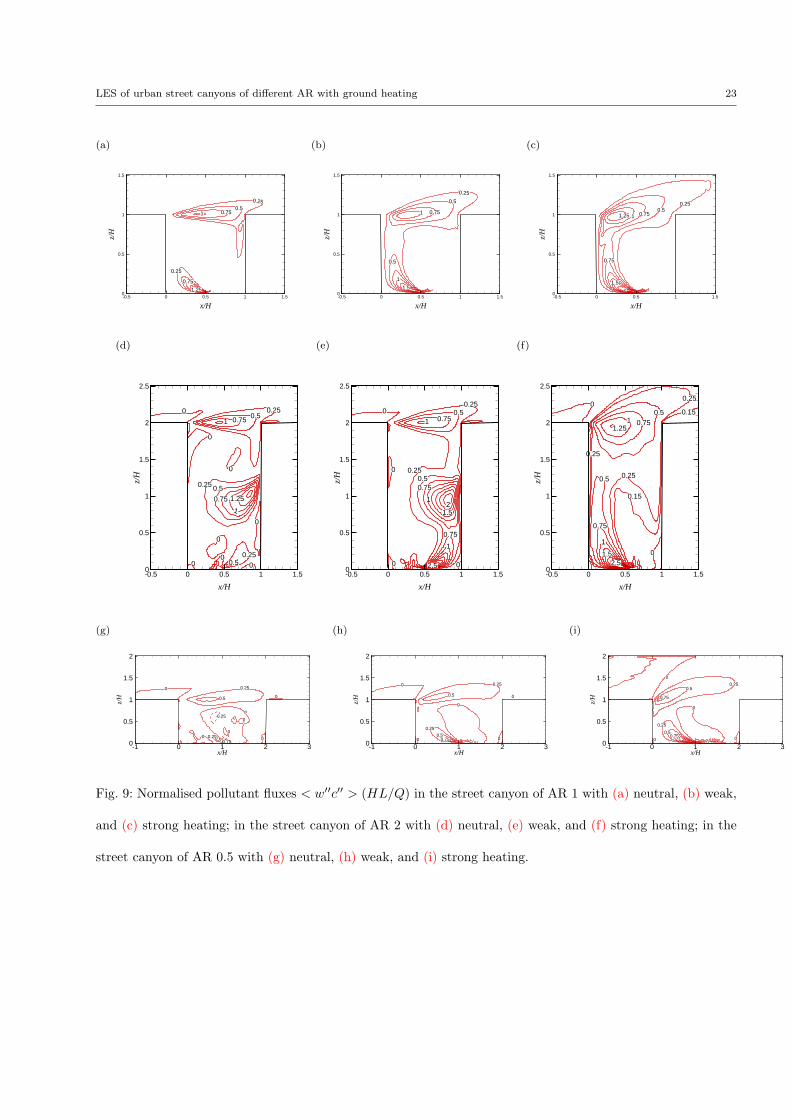
4.2.2 Pollutant flux201
To further examine how the buoyancy force enhances pollutant transport, the vertical pollutant fluxes < w′′c′′ >202
(HL/Q) for each case are depicted in Figure 9 for comparison.203
In the street canyon of AR 1 (Fig. 9a-c), the ground heating weakens the pollutant flux along the windward204
wall and instead, strengthens the pollutant flux at the roof level, in the wake of the line source and along the205
leeward wall. This may suggest that more pollutants are removed from the street canyon (through the roof-level206
leeward corner) while less are entrained inside (through the roof-level windward corner).207
In the street canyon of AR 2 (Fig. 9d-f), the pollutant flux is strengthened by weak ground heating in the208
wake of the line source and at the interface of two primary vortices. At the roof level, only a small magnitude209
of flux increment can be found. This is in line with the negligible increment in pollutant removal by the weak210
ground heating, as noted in the previous section. With strong ground heating (Fig. 9f), the pollutant flux pattern211
somewhat resembles that in the street canyon of AR 1 (Fig. 9c). High pollutant flux is observed near the ground212
leeward corner and the roof level.213
For the street canyon of AR 0.5 (Fig. 9g-i), the intensified pollutant flux by increasing ground heating does214
not cover the roof level as the case for the other two ARs described above. Instead, the contour of pollutant215
flux also extends above the roof level, which indicates the substantial pollutant exchange does not occur at the216
10 Xian-Xiang Li et al.
roof level in this case. Hence, along the roof level, turbulence is not the sole mechanism for pollutant removal217
when ground heating is introduced.218
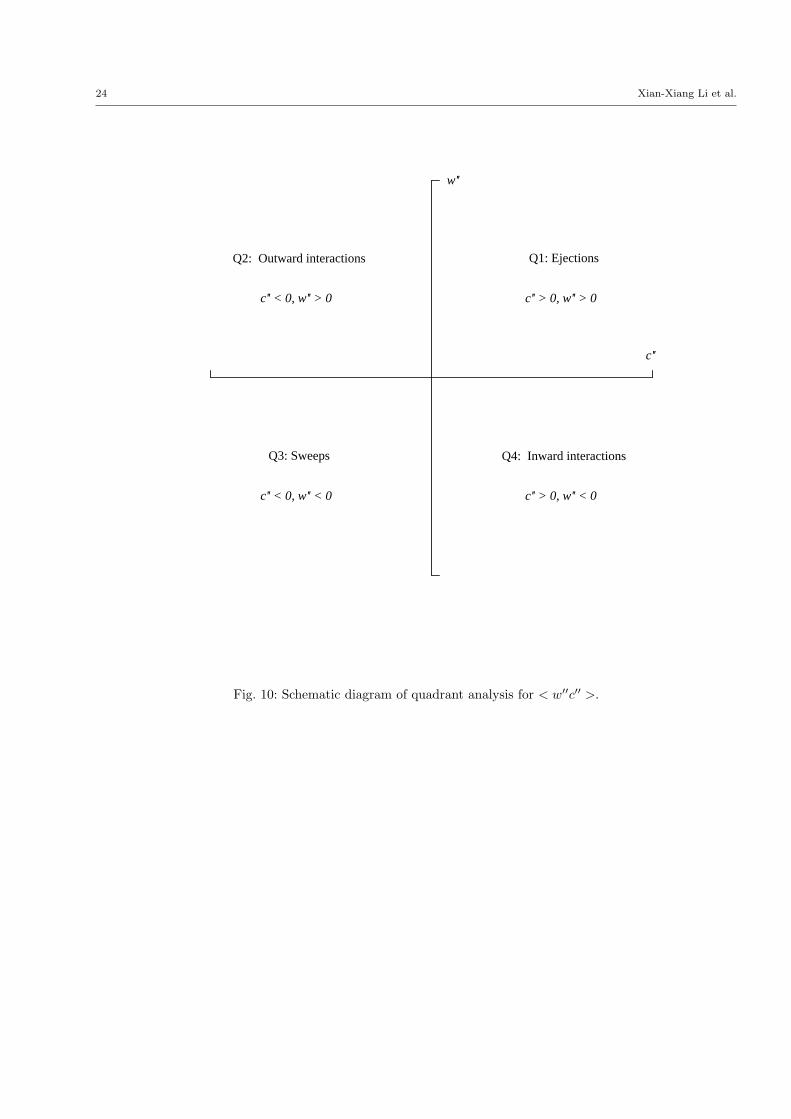
4.2.3 Quadrant analysis219
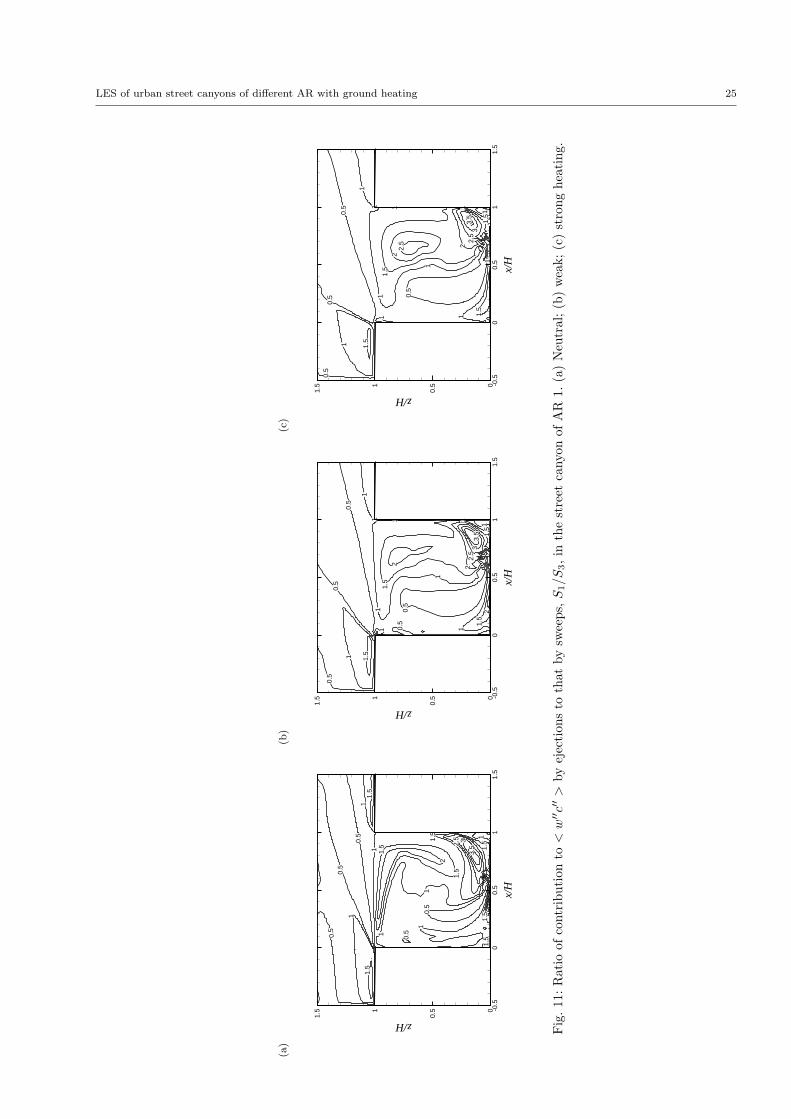
To quantify the number and contribution of each quadrant to the pollutant flux < w′′c′′ > (Fig. 10; note220
that the definition of each quadrant for pollutant flux is different from that for Reynolds stress), the quadrant221
analysis technique (Wallace et al., 1972) is adopted. Q2 and Q4 events are generally rare and contribute little to222
the pollutant flux. The more significant events are Q1 (ejections) which transport high-pollutant air upwards,223
and Q3 events (sweeps) which transport low-pollutant air downwards. The relative frequency of occurrence of224
ejections and sweeps and their contributions to < w′′c′′ > are indicators of the pollutant transport mechanism.225
Figure 11 shows the ratio of contribution to < w′′c′′ > by ejections to that by sweeps, S1/S3, in the street226
canyon of AR 1, where Si is the contribution from the i-th quadrant (i = 1, 2, 3, 4). It is evident that within the227
street canyon, sweeps dominate at most locations (although their frequencies of occurrence are comparable),228
except in the wake of the line source where ejections occur about twice more often than sweeps. With increasing229
ground heating intensity, the area where sweeps dominate increases. At the roof level, the ejections and sweeps230
occur and contribute equally when there is no ground heating. However, when the ground heating is introduced,231
the contribution of ejections outweighs that of sweeps near the leeward roof-level corner, where the flow inside232
the street canyon is coupled with the free-stream flow (Li et al., 2010).233
Above the roof level, the frequency of occurrence of ejections is higher than that of sweeps, but the contribu-234
tion of ejections is much smaller. This feature is true for all the ground heating intensities and is insensitive to235
stability conditions, which is consistent with the measurement of urban RSL turbulence (Christen et al., 2007).236
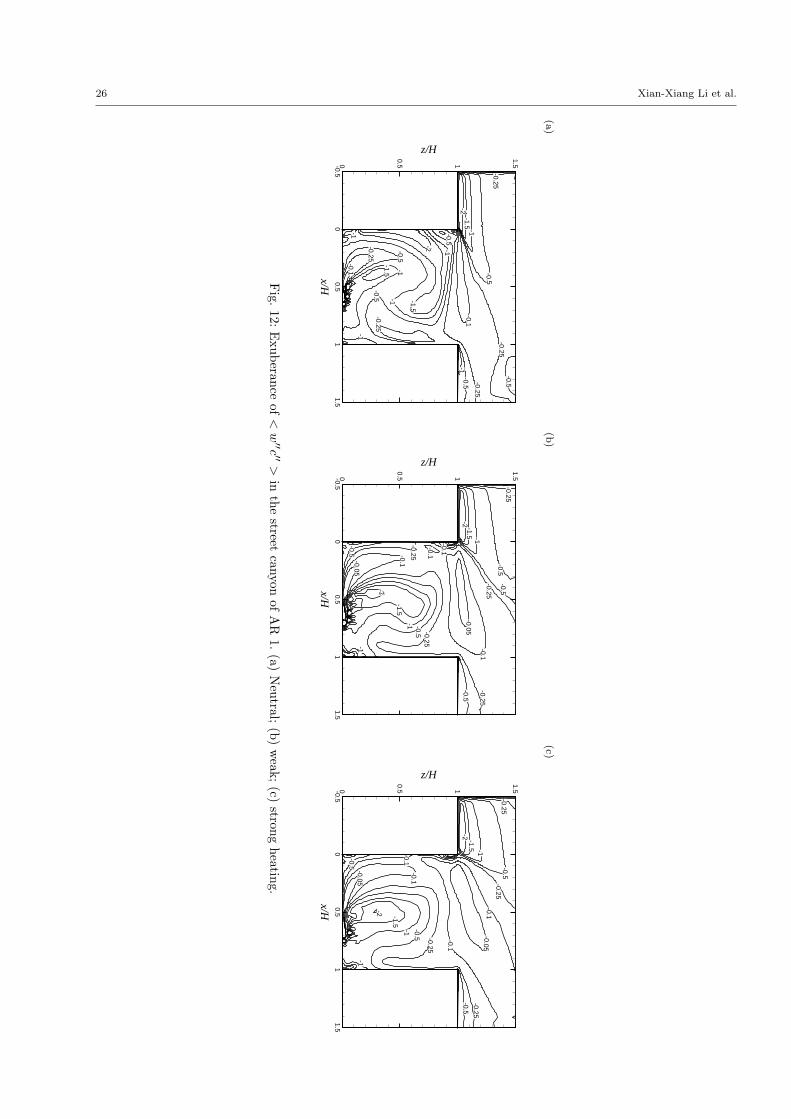
Another important quantity is the ratio of (unorganized) counter flux contributions (from Q2 and Q4) to237
(organized) contributions (from Q1 and Q3) in the direction of the average pollutant flux, that is Exuberance238
defined as239
Ex =S2 + S4
S1 + S3. (2)
Ex can be regarded as an indicator for the efficiency of the transfer. Figure 12 contrasts Ex in the street canyon240
of AR 1 with different ground heating intensity. Near the line source, the transfer is the least efficient, while241
in the wake of the line source, the transfer is quite efficient. At the roof level with a small shift to the leeward242
corner, Ex reaches its maximum. This maximum increases significantly from -0.1 to -0.05 with the increasing243
LES of urban street canyons of different AR with ground heating 11
heating intensity. It is interesting to note that the ground heating increases the transfer efficiency in the wake244
of the line source, but decreases dramatically the efficiency near the line source.245
5 Conclusion246
It has been demonstrated that ground heating introduced in the street canyon strengthens the vortex motion.247
Of all the cases simulated, significant changes of flow and scalar patterns have been caused by ground heating248
in the street canyons of AR 2 and 0.5, while only the street canyon of AR 0.5 shows a change in flow regime249
(from wake interference flow to skimming flow). Strong ground heating in the street canyon of AR 2 can change250
the two-vortex structure into a one-vortex structure due essentially to the reinforced lower vortex. Strangely,251
the strong ground heating leads to a more symmetric vortex structure in the street canyons of AR 1 and 0.5.252
Stronger ground heating produces greater mixing between the flow in the street canyon and that above, as253
reflected by larger momentum fluxes across the roof level of the street canyon.254
The mixing of heat in the street canyons of different ARs is observed to be strong. The normalised tempera-255
ture inside the street canyon is spatially uniform and somewhat insensitive to the aspect ratio and the intensity256
of ground heating.257
Generally, ground heating greatly facilitates pollutant removal for the street canyons at different ARs. For258
the street canyon of AR 0.5, when ground heating is introduced, the roof level is no longer the place where the259
pollutant removal occurs, and turbulence is not the sole mechanism for pollutant removal.260
The quadrant analysis of pollutant flux shows that sweeps dominate in most of the regions within the street261
canyon, while ejections dominate in the wake of the line source and above the street canyon. The ground heating262
is shown to enhance ejections at the leeward roof-level corner.263
It is of much importance to study the turbulence structure in the urban roughness sublayer, especially264
near the roof level, where the exchange processes of momentum and scalar (temperature and pollutant) mainly265
occur. By checking the relative relations between ejections and sweeps of Reynolds stress in the vicinity of the266
roughness, Coceal et al. (2007) claimed that there is some similarity between the urban RSL, the RSL over267
vegetation, and the mixing layer. The current study may provide some more evidence for this similarity with268
the quadrant analysis of pollutant flux. More analysis based on the results obtained from the current study can269
be done to validate and establish this mixing-layer analogy for urban RSL as Raupach et al. (1996) has done270
for vegetation canopies.271
12 Xian-Xiang Li et al.
Acknowledgment272
This project was funded by Singapore National Research Foundation (NRF) through the Singapore-MIT Alliance273
for Research and Technology (SMART) Center for Environmental Sensing and Modeling (CENSAM).274
References275
Ahmad K, Khare M, Chaudhry KK (2005) Wind tunnel simulation studies on dispersion at urban street canyons276
and intersections—a review. J Wind Eng Industr Aerodyn 93:697–717277
Belcher SE (2005) Mixing and transport in urban areas. Phil Trans R Soc A 363:2947–2968278
Bottema M (1993) Wind climate and urban geometry. Eindhoven University of Technology, NL, 212 pp.279
Britter RE, Hanna SR (2003) Flow and dispersion in urban areas. Annu Rev Fluid Mech 35:469–96280
Ca VT, Asaeda T, Ito M, Armfield S (1995) Characteristics of wind field in a street canyon. J Wind Eng Industr281
Aerodyn 57(1):63–80282
Cai XM, Barlow JF, Belcher SE (2008) Dispersion and transfer of passive scalars in and above street canyons—283
large-eddy simulations. Atmos Environ 42:5885–5895284
Christen A, van Gorsel E, Vogt R (2007) Coherent structures in urban roughness sublayer turbulence. Int J285
Climatol 27:1955–1968286
Coceal O, Dobre A, Thomas TG, Belcher SE (2007) Structure of turbulent flow over regular arrays of cubical287
roughness. J Fluid Mech 589:375–409288
Cui Z, Cai XM, Baker CJ (2004) Large eddy simulation of turbulent flow in a street canyon. Q J R Meteorol289
Soc 599:1373–1394290
Fackrell JE, Robins AG (1982) The effects of source size on concentration fluctuations in plumes. Boundary-291
Layer Meteorol 22(3):335–350292
Fernando HJS, Lee SM, Anderson J, Princevac M, Pardyjak E, Grossman-Clarke S (2001) Urban fluid mechanics:293
air circulation and contaminant dispersion in cities. Environ Fluid Mech 1:107–164294
Kim JJ, Baik JJ (2001) Urban street-canyon flows with bottom heating. Atmos Environ 35:3395–3404295
Letzel MO, Krane M, Raasch S (2008) High resolution urban large-eddy simulation studies from street canyon296
to neighbourhood scale. Atmos Environ 42:8770–9784297
Li XX (2008) Large-eddy simulation of wind flow and air pollutant transport inside urban street canyons of298
different aspect ratios. PhD thesis, The University of Hong Kong, 205 pp299
LES of urban street canyons of different AR with ground heating 13
Li XX, Liu CH, Leung DYC, Lam KM (2006) Recent progress in CFD modelling of wind field and pollutant300
transport in street canyons. Atmos Environ 40(29):5640–5658301
Li XX, Liu CH, Leung DYC (2008) Large-eddy simulation of flow and pollutant dispersion in urban street302
canyons with wall model. Boundary-Layer Meteorol 129(2):249–268303
Li XX, Liu CH, Leung DYC (2009) Numerical investigation of pollutant transport characteristics inside deep304
urban street canyons. Atmos Environ 43(15):2410–2418305
Li XX, Britter RE, Koh TY, Norford LK, Liu CH, Entekhabi D, Leung DYC (2010) Large-eddy simulation306
of flow and pollutant transport in urban street canyons with ground heating. Boundary-Layer Meteorol (in307
press) DOI: 10.1007/s10546-010-9534-8308
Liu CH, Barth MC (2002) Large-eddy simulation of flow and scalar transport in a modeled street canyon. J309
Appl Meteorol 41(6):660–673310
Liu CH, Barth MC, Leung DYC (2004) Large-eddy simulation of flow and pollutant transport in street canyons311
of different building-height-to-street-width ratios. J Appl Meteorol 43:1410–1424312
Liu CH, Leung DYC, Barth MC (2005) On the prediction of air and pollutant exchange rates in street canyons313
of different aspect ratios using large-eddy simulation. Atmos Environ 39:1567–1574314
Nakamura Y, Oke TR (1988) Wind, temperature, and stability conditions in an east-west-oriented urban canyon.315
Atmos Environ 22:2691–2700316
Oke T (1988) Street design and urban canopy layer climate. Energy Build 11:103–113317
Raupach MR, Finnigan JJ, Brunet Y (1996) Coherent eddies and turbulence in vegetation canopies: the mixing318
layer analogy. Boundary-Layer Meteorol 78:351–382319
Sini JF, Anquetin S, Mestayer PG (1996) Pollutant dispersion and thermal effects in urban street canyons.320
Atmos Environ 30:2659–2677321
Solazzo E, Britter RE (2007) Transfer processes in a simulated urban street canyon. Boundary-Layer Meteorol322
124(1):43–60323
Uehara K, Murakami S, Oikawa S, Wakamatsu S (2000) Wind tunnel experiments on how thermal stratification324
affects flow in and above urban street canyons. Atmos Environ 34:1553–1562325
Vardoulakis S, Fisher BEA, Pericleous K, Gonzalez-Flesca N (2003) Modelling air quality in street canyons: a326
review. Atmos Environ 37:155–182327
Wallace JM, Eckelman H, Brodkey RS (1972) The wall region in turbulent shear flow. J Fluid Mech 54:39–48328
14 Xian-Xiang Li et al.
Xie X, Liu CH, Leung DYC, Leung MKH (2006) Characteristics of air exchange in a street canyon with ground329
heating. Atmos Environ 40(33):6396–6409330
Xie X, Liu CH, Leung DYC (2007) Impact of building facades and ground heating on wind flow and pollutant331
transport in street canyons. Atmos Environ 41:9030–9049332
Table 1: Richardson numbers Ri and aspect ratios h/b for each case.
AR Richardson number Ri
h/b Weak heating Strong heating
0.5 −0.9 −2.9
1.0 −0.6 −2.4
2.0 −0.5 −2.0
Table 2: Ratio of pollutants inside the street canyon of different AR with different ground heating intensity.
HHHHHH
HHAR
HeatingNeutral Weak Strong
0.5 90.7% 80.5% 72.5%
1 93.6% 89.3% 83.6%
2 97.8% 97.0% 92.7%
LES of urban street canyons of different AR with ground heating 15
U
u db
building
Leeward Windward
buildingh
h = h f
Inlet
b
xs
Outlet
z
x
b
f
θa
Street canyon
Line source
Freestream flow
θ = θ + a ∆ θ
Fig. 1: Schematic diagram of computational domain for the flow and pollutant transport in a street canyon with
ground heating.
16 Xian-Xiang Li et al.
(a)
-0.03
-0.02
0 0
0.001
0.005
0.01
-0.04
-0.01-0.001
00
x/H
z/H
-0.50
0.51
1.50
0.5 1
1.5 2
2.5
(b)
-0.03
-0.02-0.01
0
0.001
0.001
0.005
0.01
0.02
0.025
-0.035
-0.010
-0.00100
x/H
z/H
-0.50
0.51
1.50
0.5 1
1.5 2
2.5
(c)
0.005 0
-0.02
-0.08
-0.06
0
-0.04
00
x/H
z/H
-0.50
0.51
1.50
0.5 1
1.5 2
2.5
Fig.
2:Spatial
distributionof
thedim
ensionlessstream
functionψ
.in
thestreet
canyonof
AR
2.(a)
Neutral;
(b)w
eakheating;
(c)strong
heating.D
ashedlines
indicatenegative
values(clockw
iserotating).
LES of urban street canyons of different AR with ground heating 17
(a)
x/H
z/H
-0.5 0 0.5 1 1.50
0.5
1
1.5
(b)
x/H
z/H
-0.5 0 0.5 1 1.50
0.5
1
1.5
(c)
x/H
z/H
-0.5 0 0.5 1 1.50
0.5
1
1.5
0.70.60.50.40.30.20.10
-0.1-0.2-0.3-0.4-0.5
u/U
(d)
x/H
z/H
-0.5 0 0.5 1 1.50
0.5
1
1.5
2
2.5
(e)
x/H
z/H
-0.5 0 0.5 1 1.50
0.5
1
1.5
2
2.5
(f)
x/H
z/H
-0.5 0 0.5 1 1.50
0.5
1
1.5
2
2.5
0.50.40.30.20.10.0750.050.0250
-0.1-0.2
u/U
(g)
x/H
z/H
-1 0 1 2 30
0.5
1
1.5
2
(h)
x/H
z/H
-1 0 1 2 30
0.5
1
1.5
2
(i)
x/H
z/H
-1 0 1 2 30
0.5
1
1.5
2
0.90.70.50.30.10
-0.1-0.3-0.5-0.7-0.9
u/U
Fig. 3: Flow patterns and normalised streamwise velocities < u > /U in the street canyon of AR 1 with (a)
neutral, (b) weak, and (c) strong heating; in the street canyon of AR 2 with (d) neutral, (e) weak, and (f) strong
heating; in the street canyon of AR 0.5 with (g) neutral, (h) weak, and (i) strong heating.
18 Xian-Xiang Li et al.
(a)
x/H
z/H
-0.5 0 0.5 1 1.50
0.5
1
1.5
(b)
x/H
z/H
-0.5 0 0.5 1 1.50
0.5
1
1.5
(c)
x/H
z/H
-0.5 0 0.5 1 1.50
0.5
1
1.5
0.50.40.30.20.10
-0.1-0.2-0.3-0.4-0.5-0.6
w/U
(d)
x/H
z/H
-0.5 0 0.5 1 1.50
0.5
1
1.5
2
2.5
(e)
x/H
z/H
-0.5 0 0.5 1 1.50
0.5
1
1.5
2
2.5
(f)
x/H
z/H
-0.5 0 0.5 1 1.50
0.5
1
1.5
2
2.5
0.250.20.150.10.050
-0.05-0.1-0.15-0.2-0.25
w/U
(g)
x/H
z/H
-1 0 1 2 30
0.5
1
1.5
2
(h)
x/H
z/H
-1 0 1 2 30
0.5
1
1.5
2
(i)
x/H
z/H
-1 0 1 2 30
0.5
1
1.5
2
0.40.30.20.10
-0.1-0.2-0.3-0.4-0.5-0.6
w/U
Fig. 4: Flow patterns and normalised vertical velocities < w > /U in the street canyon of AR 1 with (a) neutral,
(b) weak, and (c) strong heating; in the street canyon of AR 2 with (d) neutral, (e) weak, and (f) strong heating;
in the street canyon of AR 0.5 with (g) neutral, (h) weak, and (i) strong heating.
LES of urban street canyons of different AR with ground heating 19
(a)
-0.004-0.006-0.002 -0.002
00
0
0.002
0
0
0
0
-0.007
x/H
z/H
-0.5 0 0.5 1 1.50
0.5
1
1.5
(b)
-0.005
-0.01-0.015
-0.005-0.005
00
0
0
0.002
0.002
0.002
x/H
z/H
-0.5 0 0.5 1 1.50
0.5
1
1.5
(c)
-0.01
-0.015
-0.02-0.025-0.03
-0.01
-0.01-0.005
0.005
0
00
0.005
0.0050.005
0.010
-0.005
x/H
z/H
-0.5 0 0.5 1 1.50
0.5
1
1.5
(d)
-0.003
-0.002
-0.004
-0.002
0.001
0
0
0
0
-0.002
0
0
0 0
0
-0.001
x/H
z/H
-0.5 0 0.5 1 1.50
0.5
1
1.5
2
2.5
(e)
-0.004-0.003
-0.005-0.002
-0.002
0.0010
0.001
0
0
-0.001
0
x/H
z/H
-0.5 0 0.5 1 1.50
0.5
1
1.5
2
2.5
(f)
-0.0125-0.01
-0.0075-0.0025
-0.005
0
0.0025
0.005
0.00250
0
x/H
z/H
-0.5 0 0.5 1 1.50
0.5
1
1.5
2
2.5
(g)
0
-0.005
0
0
0
0
-0.014
0
0
-0.01
x/H
z/H
-1 0 1 2 30
0.5
1
1.5
2
(h)
-0.01
-0.02
-0.010
0
0
00
x/H
z/H
-1 0 1 2 30
0.5
1
1.5
2
(i)
-0.01-0.02
-0.03
-0.01 -0.01
-0.020
0
0.010.01
0
-0.035
x/H
z/H
-1 0 1 2 30
0.5
1
1.5
2
Fig. 5: Normalised Reynolds stress < u′′w′′ > /U2 in the street canyon of AR 1 with (a) neutral, (b) weak, and
(c) strong heating; in the street canyon of AR 2 with (d) neutral, (e) weak, and (f) strong heating. Solid lines
represent positive value while dashed lines represent negative value.
20 Xian-Xiang Li et al.
(a)
0.01
0.05
0.10.15
0.2
0.250.3
0.125
0.025
0.0750.05
x/H
z/H
-0.5 0 0.5 1 1.50
0.5
1
1.5
(b)
0.010.025
0.050.025
0.075
0.10.125
0.15
0.175
0.2
0.250.3
0.09
x/H
z/H
-0.5 0 0.5 1 1.50
0.5
1
1.5
(c)
0.025
0.15
0.01
0.05
0.075
0.125
0.1
0.175
0.2
0.25
0.3
x/H
z/H
-0.5 0 0.5 1 1.50
0.5
1
1.5
2
2.5
(d)
0.010.025
0.05
0.075
0.1
0.125
0.15
0.175
0.2
0.225
x/H
z/H
-0.5 0 0.5 1 1.50
0.5
1
1.5
2
2.5
(e)
0.01
0.075
0.15
0.45
0.2
0.3
0.35
0.025
0.25
0.025
0.05
0.1
0.125
x/H
z/H
-1 -0.5 0 0.5 1 1.5 2 2.5 30
0.5
1
1.5
2
(f)
0.010.025
0.05
0.075
0.10.1250.15
0.2
0.25
0.3
0.025
x/H
z/H
-1 -0.5 0 0.5 1 1.5 2 2.5 30
0.5
1
1.5
2
Fig. 6: Normalised mean temperature (< θ > −θa)/∆θ in the street canyon of AR 1 with (a) weak and (b)
strong heating; in the street canyon of AR 2 with (c) weak and (d) strong heating; in the street canyon of AR
0.5 with (e) weak and (f) strong heating.
LES of urban street canyons of different AR with ground heating 21
(a)
x/H
z/H
-0.5 0 0.5 1 1.50
0.5
1
1.5
(b)
x/H
z/H
-0.5 0 0.5 1 1.50
0.5
1
1.5
0.0180.0160.0140.0120.010.0080.0060.0040.0020
(c)
x/H
z/H
-0.5 0 0.5 1 1.50
0.5
1
1.5
2
2.5
(d)
x/H
z/H
-0.5 0 0.5 1 1.50
0.5
1
1.5
2
2.5
0.010.0090.0080.0070.0060.0050.0040.0030.0020.0010
(e)
x/H
z/H
-1 0 1 2 30
0.5
1
1.5
2
(f)
x/H
z/H
-1 0 1 2 30
0.5
1
1.5
2
0.020.0180.0160.0140.0120.010.0080.0060.0040.0020
-0.002
Fig. 7: Normalised heat flux < w′′θ′′ > /(U∆θ) in the street canyon of AR 1 with (a) weak and (b) strong
heating; in the street canyon of AR 2 with (c) weak and (d) strong heating; in the street canyon of AR 0.5 with
(e) weak and (f) strong heating.
22 Xian-Xiang Li et al.
(a)
12.5
5
15
20
40
50
60
10080
18030
30
10
x/H
z/H
-0.5 0 0.5 1 1.50
0.5
1
1.5
(b)
12.5
5
10
15
20
2530
4050
12.5
100
7.5
x/H
z/H
-0.5 0 0.5 1 1.50
0.5
1
1.5
(c)
10
1 2.5
5
15
12.5
20
25
3050
100
7.5
x/H
z/H
-0.5 0 0.5 1 1.50
0.5
1
1.5
(d)
2.5
20
5
1
60
10
4050
90 10080
200
150
300 250
30
70
80
65
x/H
z/H
-0.5 0 0.5 1 1.50
0.5
1
1.5
2
2.5
(e)
2.5
20
5
1
50
10
30
40
6070 80
100
90
20090
55
55
x/H
z/H
-0.5 0 0.5 1 1.50
0.5
1
1.5
2
2.5
(f)
5
10
2.5
40
7.5
1
15
70
30 15
20
25
x/H
z/H
-0.5 0 0.5 1 1.50
0.5
1
1.5
2
2.5
(g)
1
57.5
10
2.5
25
10050
10
x/H
z/H
-1 0 1 2 30
0.5
1
1.5
2
(h)
1
2.5
57.510
25 50
15
20
x/H
z/H
-1 0 1 2 30
0.5
1
1.5
2
(i)
1
2
2.5345
7.5
1050
2.5
x/H
z/H
-1 0 1 2 30
0.5
1
1.5
2
Fig. 8: Normalised pollutant concentration < c > UHL/Q in the street canyon of AR 1 with (a) neutral, (b)
weak, and (c) strong heating; in the street canyon of AR 2 with (d) neutral, (e) weak, and (f) strong heating;
in the street canyon of AR 0.5 with (g) neutral, (h) weak, and (i) strong heating.
LES of urban street canyons of different AR with ground heating 23
(a)
0.25
0.75
1.25
1 0.750.5
0.25
x/H
z/H
-0.5 0 0.5 1 1.50
0.5
1
1.5
(b)
0.5
1
1.5
1 0.75
0.5
0.25
x/H
z/H
-0.5 0 0.5 1 1.50
0.5
1
1.5
(c)
0.75
1.52
1 0.750.5
0.25
1.25
x/H
z/H
-0.5 0 0.5 1 1.50
0.5
1
1.5
(d)
0.250.50.751
0
0
0
0.25 0.5
0.75 1.25
0
0.250.5
1
0 0
0
0
x/H
z/H
-0.5 0 0.5 1 1.50
0.5
1
1.5
2
2.5
(e)
0.250.5
0.751
0
0 0.250.50.75
12
0.75
1
2.5
1.5
0 0
x/H
z/H
-0.5 0 0.5 1 1.50
0.5
1
1.5
2
2.5
(f)
0.25
0.50.751
0
0.25
0.5 0.25
1
1.52.5
0.75
0
1.25
0.15
0.15
x/H
z/H
-0.5 0 0.5 1 1.50
0.5
1
1.5
2
2.5
(g)
0 0.25
0.5 0
0
0 0
0
00 0.25
-0.25
-0.750.5
x/H
z/H
-1 0 1 2 30
0.5
1
1.5
2
(h)
0 0.25
0.5 0
0
0.25
00.5
0.75
0
0
x/H
z/H
-1 0 1 2 30
0.5
1
1.5
2
(i)
0
0.25
0.75
0
0.25
00.5
0.75
0
0
0.5
1
x/H
z/H
-1 0 1 2 30
0.5
1
1.5
2
Fig. 9: Normalised pollutant fluxes < w′′c′′ > (HL/Q) in the street canyon of AR 1 with (a) neutral, (b) weak,
and (c) strong heating; in the street canyon of AR 2 with (d) neutral, (e) weak, and (f) strong heating; in the
street canyon of AR 0.5 with (g) neutral, (h) weak, and (i) strong heating.
24 Xian-Xiang Li et al.
c''
w''
Q1: Ejections
c'' > 0, w'' > 0
Q2: Outward interactions
c'' < 0, w'' > 0
Q3: Sweeps
c'' < 0, w'' < 0
Q4: Inward interactions
c'' > 0, w'' < 0
Fig. 10: Schematic diagram of quadrant analysis for < w′′c′′ >.
LES of urban street canyons of different AR with ground heating 25
(a)
1 1.5
0.5
2
1.5
10.
51
33.
5
1.5 1
1.5
1.5
0.5
0.5
1
1.5
11.
5
0.51
2.5
1.5
x/H
z/H
-0.5
00.
51
1.5
0
0.51
1.5
(b)
1
2
0.5
1
1.5
0.5
1
1
1
11
1
2
2.5
1.5
2
3.5
3
0.5
0.5
0.5
1
1 1.5
1.5
x/H
z/H
-0.5
00.
51
1.5
0
0.51
1.5
(c)
1
2
0.5
2.5
1
1.5
0.5
1
1
11
1
1
2.5
1.5
1.51.5
2
3.5
3
0.5
0.5
0.5 1
1 1.5
1 x/H
z/H
-0.5
00.
51
1.5
0
0.51
1.5
Fig
.11
:R
atio
ofco
ntri
buti
onto<w
′′c′
′>
byej
ecti
ons
toth
atby
swee
ps,S
1/S
3,
inth
est
reet
cany
onof
AR
1.(a
)N
eutr
al;
(b)
wea
k;(c
)st
rong
heat
ing.
26 Xian-Xiang Li et al.
(a)
-1 -1.5
-1
-1-1.5
-0.5
-1
-1.5
-1
-0.5-0.25
-0.5
-0.25
-2
-0.25-0.5
-2-0.25
-1
-0.1
-0.5
-0.5
-0.25
-0.1
-1
x/H
z/H
-0.50
0.51
1.50
0.5 1
1.5
(b)
-1.5
-1 -0.5
-0.5
-1-1.5
-0.25
-2
-0.1
-0.5
-0.5
-0.25
-0.5
-0.1
-0.1
-2
-0.25
-0.25
-0.25
-0.05-1
-0.05
-0.1
x/Hz/H
-0.50
0.51
1.50
0.5 1
1.5
(c)
-1.5
-1 -0.5
-0.5
-1-1.5
-0.25
-2
-0.1
-0.5
-0.25
-0.25
-0.5
-0.05
-0.1
-2
-0.25
-0.1
-0.1
-0.05-1
x/H
z/H
-0.50
0.51
1.50
0.5 1
1.5
Fig.
12:E
xuberanceof<w
′′c ′′>
inthe
streetcanyon
ofA
R1.
(a)N
eutral;(b)
weak;
(c)strong
heating.
Recommended