Staff Working Paper ERSD-2010-14 Date: November 2010
World Trade Organization
Economic Research and Statistics Division
Timeliness and Contract Enforceability in Intermediate Goods Trade
Elisa Gamberoni (The World Bank)
Rainer Lanz (Organisation for Economic Co-operation and Development, OECD)
Roberta Piermartini (World Trade Organization, WTO)
Manuscript date: November, 2010
Disclaimer: This is a working paper, and hence it represents research in progress. This paper
represents the opinions of the authors, and is the product of professional research. It is not meant to
represent the position or opinions of the WTO or its Members, nor the official position of any staff
members. Any errors are the fault of the authors. Copies of working papers can be requested from
the divisional secretariat by writing to: Economic Research and Statistics Division, World Trade
Organization, Rue de Lausanne 154, CH 1211 Geneva 21, Switzerland. Please request papers by
number and title.
Timeliness and Contract Enforceability in Intermediate Goods Trade1
Elisa Gamberoni (The World Bank)
Rainer Lanz (Organisation for Economic Co-operation and Development, OECD)
Roberta Piermartini (World Trade Organization, WTO)
Abstract
This paper shows that the institutional environment and the ability to export on time aresources of
comparative advantage as important as factors of production. In particular, the ability to export on time is
crucial to explain comparative advantage in intermediate goods. These findings underscore the importance of
investing in infrastructure and fostering trade facilitation to boost a country's participation in production
networks. Furthermore, we contribute to the so-called "distance puzzle" by showing that the increasing
importance of distance over time is in part driven by trade in intermediate goods.
Keywords: aid for trade, trade facilitation, offshoring, export times, quality of infrastructure, quality
of institutions, comparative advantage.
JEL Classifications: F13, F14, L60.
1 This paper represents the opinions of the authors, and is the product of professional research. It does not necessarily
reflect the position or opinions of the WTO or its Members, or the OECD or OECD Member countries, or the World
Bank or those of the Executive Directors of The World Bank or the governments they represent, nor the official position
of any staff members. We would like to thank Joelle Latina for her assistance, Richard Newfarmer and the participants
at the European Trade Study Group (ETSG) conference for their comments. Any remaining errors are the responsibility
of the authors. Rainer Lanz, Trade Policy Linkages and Services Division, OECD Trade and Agriculture Directorate,
Tel: +33 145 24 81 73, Email: [email protected] , 2, rue André-Pascal, 75775 Paris Cedex 16, France. Roberta
Piermartini, Economic Research and Statistics Division, WTO, Tel. 0041 22 7395492, Email:
[email protected], 154 Rue de Lausanne, Geneva CH-1211, Switzerland.
2
I. Introduction
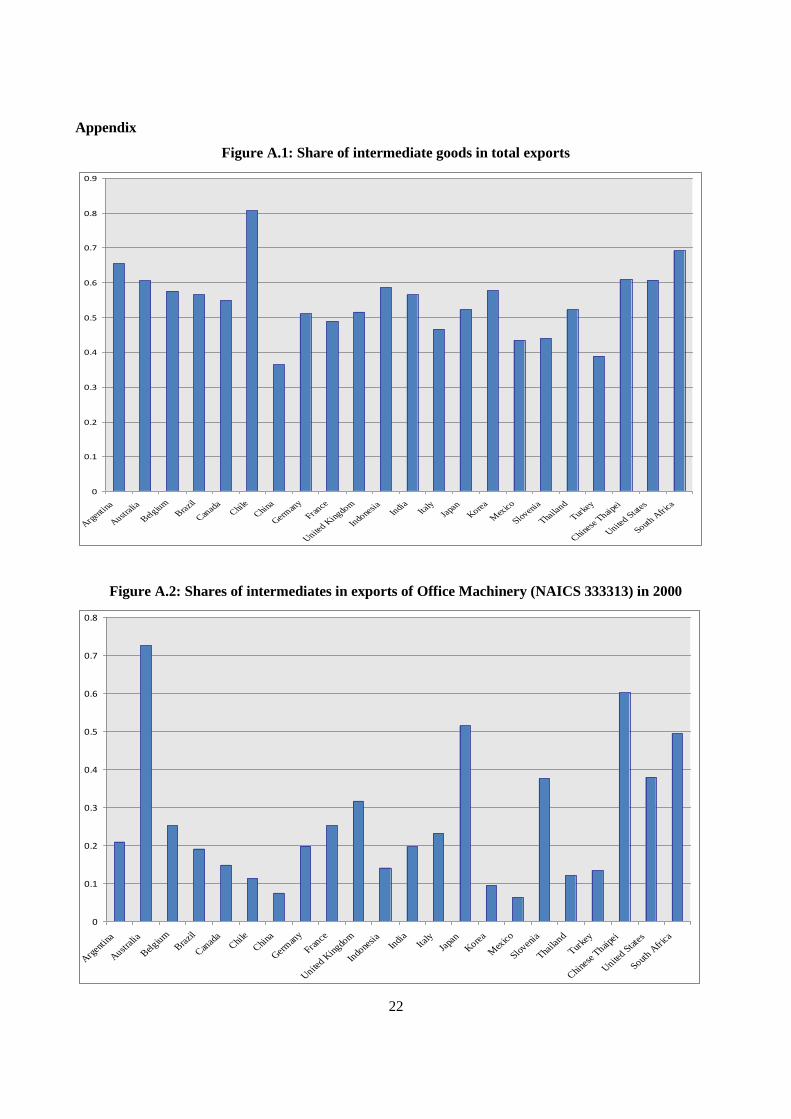
Trade in intermediate goods dominate trade flows, constituting about 60 percent of world exports. This
aggregate figure hides, however, significant differences across countries and products. For example, while
Chile’s exports of intermediate goods amount to 80 percent of its total exports, for China this figure is only
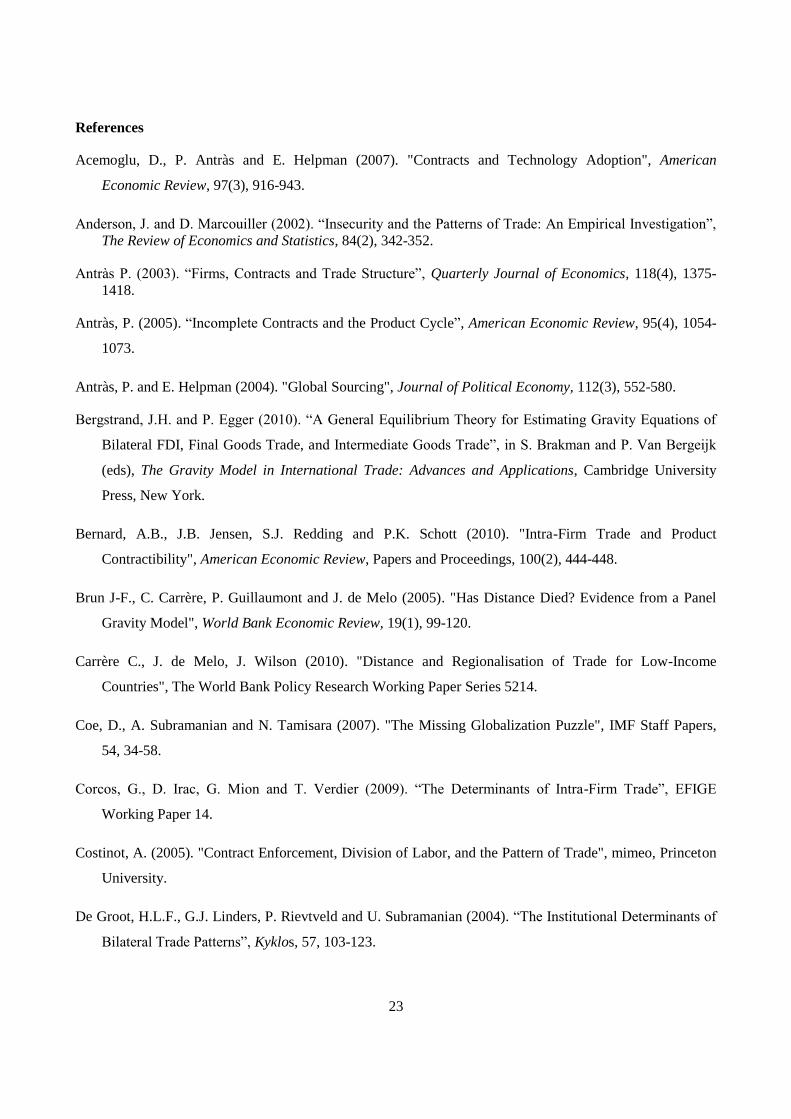
35 percent. Countries also vary significantly in their share of intermediate exports within a sector. For
example, in the office machinery sector, over 70 percent of Australian exports are intermediate products,
whereas 40 percent of US exports and only around 10 percent of Chilean and Chinese exports are
intermediate goods.2
These data suggest that understanding the determinants of trade in intermediate goods is crucial to
comprehend the patterns of trade. Despite the growing importance of international production networks in
the world economy and a growing body of theoretical literature on fragmetation of production, to our
knowledge, existing empirical literature has not studied what factors explain the different patterns of trade
between intermediate and final goods. This paper fills this gap.
Economic analysis has stressed two factors of comparative advantage to explain the specificities of trade in
intermediate goods: a country's ability to enforce contracts and its ability to export on time. The ability to
enforce a contract matters as a determinant of comparative advantage in trade of intermediate goods because,
by mitigating the so-called "hold-up" problem3, it affects the costs of producing a customised good.
Intuitively, if the production of an intermediate good requires specific investments to customize the input to
the production of the final good, the value of the input is lower outside the specific relationship supplier-
buyer than inside this relationship. Therefore, there is an incentive for the supplier to under-invest ex ante
and to produce a lower quality good. Since this incentive is lower for suppliers located in countries with
better contract enforcement, these countries will have an advantage in producing customised intermediate
goods (Levchenko, 2007; Antràs, 2005; Acemoglu et al., 2007; Costinot, 2005).4 The importance of
organizing and locating prodution in a way that ensures the timely delivery of parts and components also
matters. According to the literature, timeliness matters for trade in intermediate goods as it is essential to the
management of the production chain (Nordas, 2007). Delays in delivery increase the cost of holding stocks,
impede rapid responses to changes in customers oders and limit the ability to rapidly detect, fix and replace
2 Figures A.1 and A.2 in the Appendix illustrate this phenomenon for a selected number of countries.
3 See Williamson (1985), Grossman and Hart (1986) and Hart and Moore (1990) for seminal contributions.
4 Another branch of the literature has focussed on the importance of the ability to enforce contracts for the share of
intra-firm trade. See, for example, the theoretical models developed by Antras (2003), Antras and Helpman (2004), and
Grossman and Helpman (2005) and the empirical studies on the determinants of the share of intra-firm trade by Bernard
et al. (2010), Nunn and Trefler (2008), and Corcos et al. (2009).
3
defective components. Focusing on these costs, Harrigan and Venables (2004) show that the demand for
timeliness in delivery generates incentives for the clustering of plants around the assembler or retailer.
Guided by this literature, we test whether countries’ ability to enforce contracts and their ability to export on
time play a different role in trade of intermediate and in that of final goods. If production occurs as a
sequence of tasks and various inputs are all essential to the production of the final good, an input that is not
of the required quality (because of the underinvestment due to the hold-up problem) or is missing at the time
when it is required (because of export delays) may nullify the value of all other inputs/tasks. Therefore, no
discount can compensate the producer of the final good for the unreliable delivery (Kremer, 1993). In
contrast, when a good is imported for final consumption, it is plausible that the consumer may accept to buy
it for a reduced price even if it is of a lower quality than required or if it is delivered with a delay. For
example, while a car manufacturer will not be willing to use a cheap radio in a luxurious car, a consumer
that has ordered an expensive radio may compromise on the quality if he gets an adequate discount.
Our empirical strategy consists in estimating a factor content model of trade. In this model, the ability to
enforce contracts and to export on time is assumed to determine a country's pattern of trade according to its
comparative advantage rather than its trade volume. Hence, we test whether countries with better ability to
enforce contracts (export on time) export relatively more institutional-intensive (time-sensitive) goods. In
particular, using the UN Broad Economic Categories (BEC) classification to categorize goods according to
their main end use5, we test whether a country's ability to enforce a contract and its ability to export on time
are more important determinants of comparative advantage in intermediate goods than in final goods.
Our paper adds to the existing literature by testing whether the hold-up problem and time matter for the
patterns of trade in intermediate goods. Although the theoretical literature defines the hold-up problem with
respect to intermediate inputs, previous studies assessing the role of the quality of institutions as a
determinant of trade patterns have focused on trade in final goods (which are produced using intensively
intermediate goods) rather than on trade in intermediate goods themselves (Nunn, 2007; Levchenko, 2007).6
Similarly, while the importance of timely delivery has been stressed in particular in relation to production
5 Recently, other studies have used the BEC classification to study the patterns of trade in intermediate goods
(Bergstrand and Egger, 2010; Miroudot et al., 2009). Our approach, however, is conceptually different from these
studies, as they use the gravity model to study the volume of trade, while we focus on the factor content methodology to
determine the sectoral pattern of trade. 6 Institutional differences are found to be an important determinant of trade flows in a number of recent studies that use
the gravity model of trade. For example, Anderson and Marcouiller (2002) and de Groot et al. (2004) show that quality
of institutions significantly affects bilateral trade volumes and that better institutions are associated with higher volumes
of trade. These models however do not look at institutions as factors affecting comparative advantage.
4
networks, there is no study to our knowledge that estimats the importance of time for trade in intermediate
goods.7
Our results suggest that the ability to enforce contracts and timeliness are as important as traditional factors
of comparative advantage for trade in intermediate goods. The ability to deliver on time, in particular,
appears as the major factor in explaining the differences in trade patterns between trade in intermediate and
final goods. These results are robust to the use of alternative measures of a country's quality of institutions
and its ability to deliver on time as well as instrumental variable estimates.
Finally, we further test the importance of time for trade in intermediate goods using a gravity model over the
period 1980-2010. If time particularly matters for trade in intermediate goods, the distance coefficient of a
standard gravity regression should be higher for trade in intermediate goods than for total trade. The results
of our gravity model estimation support this prediction. We interpret this finding in the light of the so-called
“distance puzzle” (Brun et al. 2005; Coe et al. 2007; Melitz, 2007; Disdier and Head, 2008) - that is the
typical finding of gravity models that the elasticity of trade flows to distance has been rising over time. We
show that the distance coefficient for trade in intermediate goods is higher and increases faster than that for
total trade. This supports the view that the distance-puzzle can, to a certain extent, be explained by the
growing phenomenon of vertical specialisation and just-in-time production.
Our findings have important policy implications. They suggest that improving institutions, investing in
infrastructure, and fostering trade facilitation would significantly boost a country's participation –especially a
developing country’s participation- in production networks.
To develop these arguments, section II presents the empirical specification and discusses our methodological
approach. Section III describes the data and provides summary statistics. In section IV we present and
discuss our main results and robustness checks. Section V derives some implications in terms of the so-called
distance puzzle. Finally, section VI concludes.
II. Methodological Approach
We analyse the role that a country's ability to enforce contracts and its ability to export on time have in
determining trade patterns using a factor content methodology. A similar approach has been used by Romalis
(2004) to assess the importance of traditional factor endowments (capital and labour) as sources of
7 Time has been found an important determinant of trade in a number of recent papers, such as Hummels (2001),
Hausman et al. (2005), Evans and Harrigan (2005), Portugal-Perez and Wilson (2009), Djankov, Freund and Pham
(2010), and Freund and Rocha (2010). These papers, however, do not look at the role of time in trade in intermediate
goods.
5
comparative advantage, by Nunn (2007) and Levchenko (2007) to estimate the role of institutions, and by
Djankov, Freund and Pham (2010) and Li and Wilson (2009) to assess the role of time delays. In particular,
we adopt the following empirical specification:
ijjiijijijijij TtQqHhKkX 43210 (1)
where ijX is the logarithm of exports of country i to the world in the 6-digit NAICS industry j in the year
2000. Equation (1) is run for different types of goods, that is for the exports of intermediate goods,
consumption goods or total trade.
All explanatory variables take the form of interactions between industry intensities and country endowments
which are denoted in lower case and upper case letters, respectively. The interaction terms allow testing
whether countries export relatively more in industries that intensively use their abundant production factors.
The four variables of interest are the interaction term between a product's contract-intensity and a country's
ability to enforce a contract ( ijQq ), the interaction term between a product's time-sensitivity and a country's
ability to export on time ( ijTt ), as well as the traditional comparative advantage variables, i.e. the interaction
terms between a product capital-intensity and a country's capital endowment ( ij Kk ) and that between a
product skill labour intensity and a country's human capital endowment ( ij Hh ). The set of dummies i and
j control for country- and industry-specific fixed effects, respectively. We are most interested in the
coefficients β3 and β4, especially for trade in intermediate goods. A positive sign of these coefficients will
denote that countries with better contract enforcement environment capture a higher share of trade in
institutional-intensive intermediate goods and that countries with better ability to export on time will capture
a higher share of time-sensitive intermediate goods.
In particular, we test the hypothesis that a country's ability to enforce contracts (that we measure with various
indexes of the quality of institutions) and its ability to export on time (that we measure with various indexes
of the quality of transport infrastructure) may be more important factors in determining the comparative
advantage of trade in intermediate than in final goods. To test this hyphotesis, we pool all observations
across different types of exported good and estimate the following equation:
ijgjigijijgijijijijijg ITtTtIQqQqHhKkX 6543210 (2)
where ijgX are pooled exports with g denoting either exports of intermediate goods or exports of
consumption (final) goods. To test whether comparative advantage patterns are significantly different for
intermediate goods, we interact the interaction term for quality of institutions and that for export timeliness
6
variable with a dummy gI that equals 1 if ijgX are exports of intermediate goods and 0 otherwise. In
creating these interaction terms we center the variables at the sample mean in order to facilitate the
interpretation of results. We run equation (2) twice: in the first case, we pool the exports of intermediate and
consumption goods, and in the second case, we pool the exports of intermediate and all other goods
(consumption and capital goods). We are most interested in the coefficients β4 and β6. A positive estimate of
these parameters would provide evidence consistent with the general assumption of theoretical models of
trade that the hold up problem and timeliness are particularly important as a source of comparative advantage
in intermediate goods than in consumption goods.
We address potential endogeneity problems arising from omitted variables problems or from reverse
causality. A concern is, for example, that trade (specialisation) in institutional-intensive sectors could
stimulate institutional reforms or that trade in time-sensitive sectors could foster investments in transport
infrastructure. To address these issues, first, we adopt a factor content methodology that, as noted in
Djankov, Freund and Pham (2010), presents the advantage that it minimises identification problems.
Second, we use country and industry fixed effects in all regressions to minimise omitted variable bias. Third,
we also use instrumental variables (IV) estimations. In particular, we use the legal origin of a country’s legal
system as an instrument for quality of institutions, and, focusing on a subsample of landlocked countries, we
use the average quality of infrastructure of its neighbouring countries as an instrument for the quality of
infrastructure of each landlocked country. The results of instrumental variables regressions and other
robustness checks are presented in section IV.
III. Data Sources and Variable Definitions
Data on trade flows, factor endowments and factor intensity are from standard sources. The year under
consideration is 2000. Exports data at the SITC Rev. 3 5-digit level are from the OECD International Trade
Commodity Statistics (ITCS) database. We use the UN Broad Economic Categories (BEC) classification to
define intermediate goods. We then map these data to 6-digit NAICS 1997 industries using the
correspondence table from Feenstra et al. (2002). The BEC classification groups products into four
categories of goods according to their main end use, i.e. intermediate, consumption, capital goods and not
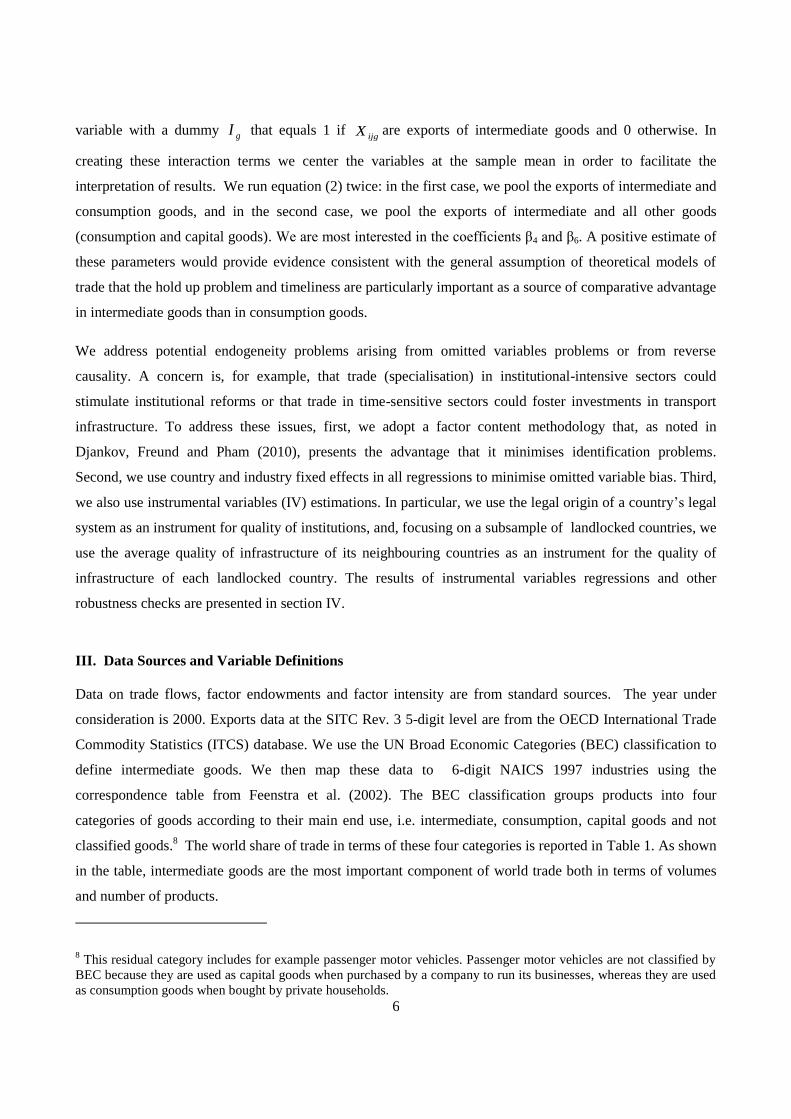
classified goods.8 The world share of trade in terms of these four categories is reported in Table 1. As shown
in the table, intermediate goods are the most important component of world trade both in terms of volumes
and number of products.
8 This residual category includes for example passenger motor vehicles. Passenger motor vehicles are not classified by
BEC because they are used as capital goods when purchased by a company to run its businesses, whereas they are used
as consumption goods when bought by private households.
7
Table 1: World trade by end use, 2000
Number of SITC
Rev.3 lines
Exports in
Mill. USD
Total exports
(%)
Total 3,053 5,900,952.0 100.0%
Intermediate 1,873 3,397,270.5 57.6%
Consumption 698 1,096,182.5 18.6%
Capital 468 1,082,342.4 18.3%
Not classified 14 325,156.7 5.5%
Source: Authors calculations based on ITCS database.
Capital intensity, jk , and skilled labour intensity, jh , of 6-digit NAICS industries in the year 2000 are taken
from the U.S. NBER-CES Manufacturing Industry Database. They are measured as the natural logarithm of
the total real capital stock per worker in industry j , and the share of non-production workers in total
employment of industry j , respectively. We measure institutional intensity jq of industry j as the share of
products in the industry that are neither reference priced nor sold on an organised exchange. To construct this
variable we use the Rauch (1999)’s classification, which groups goods into goods traded on an organised
exchange, reference priced goods and non-reference priced goods. The assumption is that the production of
non-reference priced goods requires a relatively high level of relation-specific investments so that these
goods are more subject to the hold-up problem than goods sold on an organised exchage or reference priced
goods. As suggested by Nunn (2007), the fact that a good is traded on an organised exchange indicates that
its market is thick, hence there is limited scope for the hold-up problem to emerge. Similarly, the fact that a
good is reference priced in a publication may be thought of as an indication that there is a reasonable number
of potential buyers and sellers of that good,limiting potential hold-up problems. Following Hummels (2001),
we define time-sensitive products according to their probability of being transported by air. We measure
timeliness jt of industry j as the share of US imports shipped by air. Data on US imports and shipping
mode at the HS10 digit level are collected by the U.S. Census Bureau and are taken from the homepage of
Peter Schott. We use the HS10 to NAICS 1997 correspondence table from Feenstra et al. (2002) to calculate
timeliness at the NAICS industry level. Since both institutional intensity jq and timeliness jt
are based on
product level data, we can use the BEC classification to calculate intensities for intermediate and other types
of goods that belong to the same NAICS industry.
Country endowments of capital iK and human capital iH are measured by the natural logarithm of capital
stock per worker and the logarithm of human capital per worker for the year 1988 taken from Hall and Jones
8
(1999).9 In our benchmark specification, a country’s quality of institutions iQ is measured by the "rule of
law index" from the World Bank Worldwide Governance Indicators (2009).In the robustness checks, we also
use the time and the cost to enforce contracts10
from the World Bank Doing Business Indicators as
alternative measures for the quality of institutions.A country’s ability to export timely is measured by the
quality of transport infrastructure iT as captured by the infrastructure component of the World Bank
Logistics Performance Index.11
Quality of infrastructure matters because it is an important determinant of the
length of time to export and of the certainty of delivery, beyond being an important determinant of the
financial dimension of trade costs. As additional measures for a country’s ability to deliver on time, we use
the time to export from World Bank Doing Business Indicators12
and an index of the quality of transport
infrastructure constructed as in Limão and Venables (2001). The latter is calculated as the average of the
deviations from the sample mean of four variables: (i) the percentage of paved road; (ii) the density of the
rail network, both taken from the World Development Indicators 2008; (iii) the number of airports with
paved runways over 3,047 meters – obtained from the CIA Factbook; and (iv) a port efficiency index
(ranging between 1 and 10) taken from the IMD World Competitiveness year book.
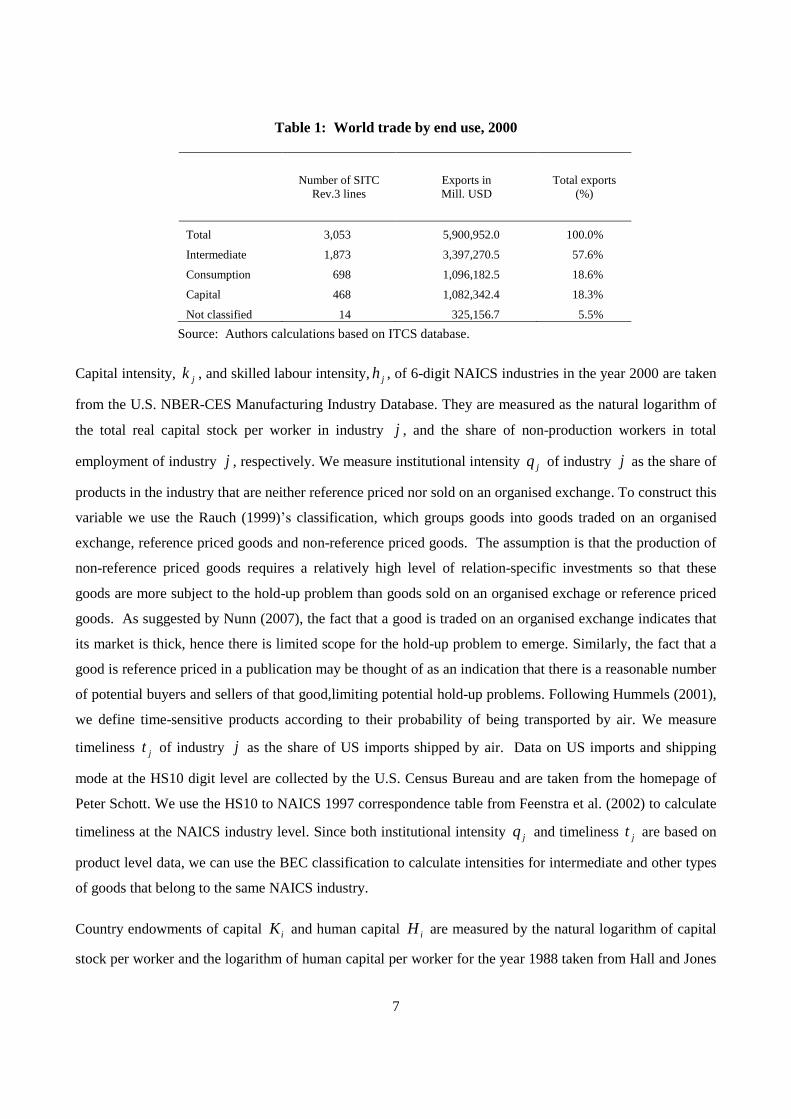
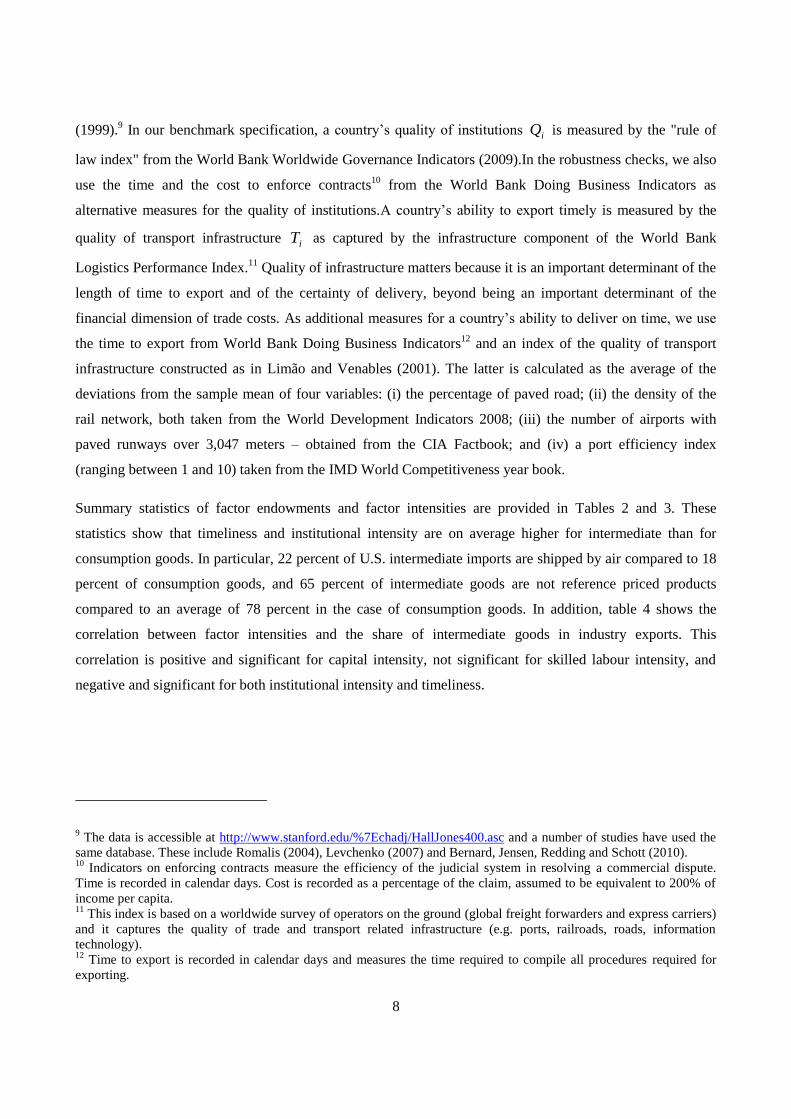
Summary statistics of factor endowments and factor intensities are provided in Tables 2 and 3. These
statistics show that timeliness and institutional intensity are on average higher for intermediate than for
consumption goods. In particular, 22 percent of U.S. intermediate imports are shipped by air compared to 18
percent of consumption goods, and 65 percent of intermediate goods are not reference priced products
compared to an average of 78 percent in the case of consumption goods. In addition, table 4 shows the
correlation between factor intensities and the share of intermediate goods in industry exports. This
correlation is positive and significant for capital intensity, not significant for skilled labour intensity, and
negative and significant for both institutional intensity and timeliness.
9 The data is accessible at http://www.stanford.edu/%7Echadj/HallJones400.asc and a number of studies have used the
same database. These include Romalis (2004), Levchenko (2007) and Bernard, Jensen, Redding and Schott (2010). 10
Indicators on enforcing contracts measure the efficiency of the judicial system in resolving a commercial dispute.
Time is recorded in calendar days. Cost is recorded as a percentage of the claim, assumed to be equivalent to 200% of
income per capita. 11
This index is based on a worldwide survey of operators on the ground (global freight forwarders and express carriers)
and it captures the quality of trade and transport related infrastructure (e.g. ports, railroads, roads, information
technology). 12
Time to export is recorded in calendar days and measures the time required to compile all procedures required for
exporting.
9
Table 2: Summary statistics of country endowments
Obs Mean Std. Dev. Min Max
Rule of Law 103 2.650 1.002 1.043 4.425
ln(K/L) 103 9.422 1.504 5.763 11.589
ln(H/L) 103 0.613 0.291 0.072 1.215
LPI Infrastructure 95 2.779 0.746 1.400 4.290
LPI Timeliness 95 3.340 0.651 2.000 4.530
Table 3: Summary statistics of industry intensities
Obs. Mean Std. Dev. Min Max
capital intensity 360 11.491 0.879 9.547 14.299
skilled labor intensity 360 0.286 0.114 0.087 0.682
institutional intensity intermediate 241 0.649 0.433 0 1
institutional intensity consumption 136 0.778 0.403 0 1
institutional intensity capital goods 89 0.966 0.169 0 1
timeliness intermediate goods 265 0.217 0.217 0 0.901
timeliness consumption goods 142 0.187 0.212 0 0.968
Table 4: Pairwise correlations between industry intensities and the
share of intermediates in industry exports
Intermediate export
share
capital int. 0.343*
skilled labor int. -0.080
institutional int. interm. -0.199*
timeliness interm. -0.311*
Note: * denotes significant at 5%
IV. Results
A. Comparative advantage in intermediate and final goods trade
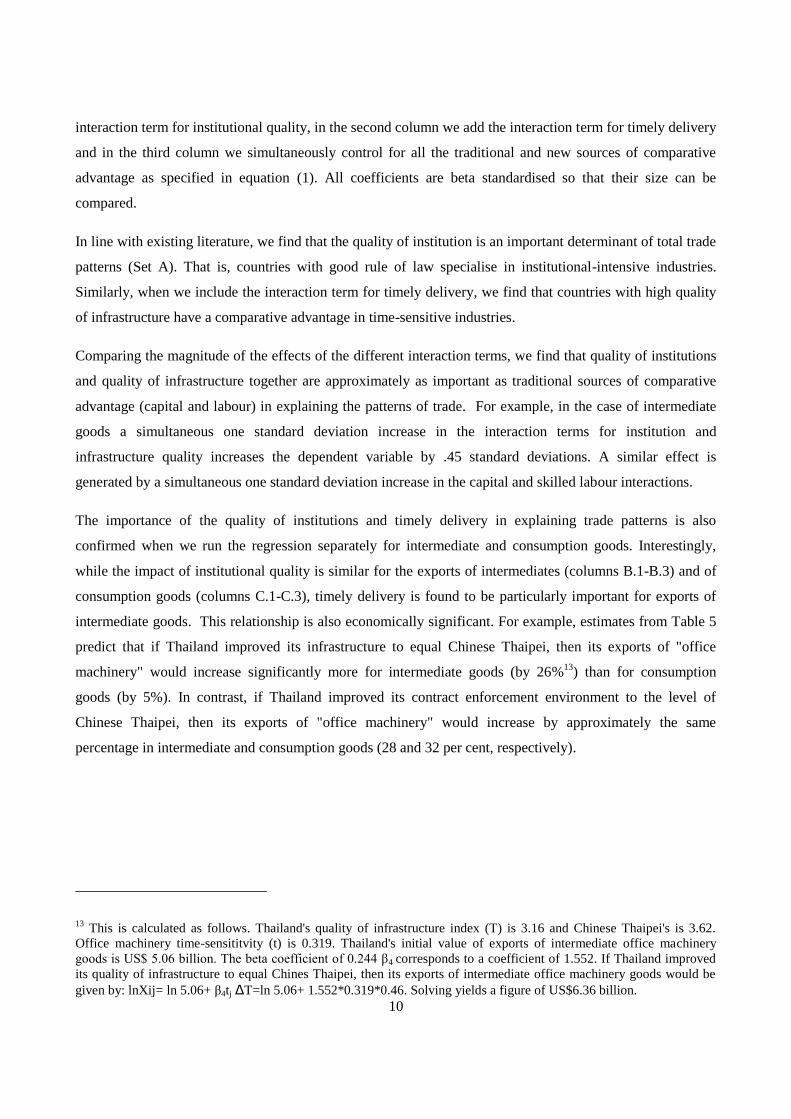
Table 5 reports the OLS estimations of equation (1) for three sets of regressions. Columns A.1-A.3 show the
results of the regression for total trade, columns B.1-B.3 report the results for trade in intermediate goods,
and columns C.1-C.3 provide the results for trade in consumption goods. All regressions control for the
traditional factors of comparative advantage: capital and skilled labour. For each dependent variable, we
provide in the first column the estimates for the traditional sources of comparative advantage adding only the
10
interaction term for institutional quality, in the second column we add the interaction term for timely delivery
and in the third column we simultaneously control for all the traditional and new sources of comparative
advantage as specified in equation (1). All coefficients are beta standardised so that their size can be
compared.
In line with existing literature, we find that the quality of institution is an important determinant of total trade
patterns (Set A). That is, countries with good rule of law specialise in institutional-intensive industries.
Similarly, when we include the interaction term for timely delivery, we find that countries with high quality
of infrastructure have a comparative advantage in time-sensitive industries.
Comparing the magnitude of the effects of the different interaction terms, we find that quality of institutions
and quality of infrastructure together are approximately as important as traditional sources of comparative
advantage (capital and labour) in explaining the patterns of trade. For example, in the case of intermediate
goods a simultaneous one standard deviation increase in the interaction terms for institution and
infrastructure quality increases the dependent variable by .45 standard deviations. A similar effect is
generated by a simultaneous one standard deviation increase in the capital and skilled labour interactions.
The importance of the quality of institutions and timely delivery in explaining trade patterns is also
confirmed when we run the regression separately for intermediate and consumption goods. Interestingly,
while the impact of institutional quality is similar for the exports of intermediates (columns B.1-B.3) and of
consumption goods (columns C.1-C.3), timely delivery is found to be particularly important for exports of
intermediate goods. This relationship is also economically significant. For example, estimates from Table 5
predict that if Thailand improved its infrastructure to equal Chinese Thaipei, then its exports of "office
machinery" would increase significantly more for intermediate goods (by 26%13
) than for consumption
goods (by 5%). In contrast, if Thailand improved its contract enforcement environment to the level of
Chinese Thaipei, then its exports of "office machinery" would increase by approximately the same
percentage in intermediate and consumption goods (28 and 32 per cent, respectively).
13 This is calculated as follows. Thailand's quality of infrastructure index (T) is 3.16 and Chinese Thaipei's is 3.62.
Office machinery time-sensititvity (t) is 0.319. Thailand's initial value of exports of intermediate office machinery
goods is US$ 5.06 billion. The beta coefficient of 0.244 β4 corresponds to a coefficient of 1.552. If Thailand improved
its quality of infrastructure to equal Chines Thaipei, then its exports of intermediate office machinery goods would be
given by: lnXij= ln 5.06+ β4tj ΔT=ln 5.06+ 1.552*0.319*0.46. Solving yields a figure of US$6.36 billion.
11
Table 5: The determinants of comparative advantage in intermediates and final goods trade
Total
trade
Total
trade
Total
trade
Inter-
mediate
Inter-
mediate
Inter-
mediate
Con-
sumption
Con-
sumption
Con-
sumption
A.1 A.2 A.3 B.1 B.2 B.3 C.1 C.2 C.3
qxQ (institutions) 0.187*** 0.163*** 0.247*** 0.207*** 0.226*** 0.236***
(14.318) (12.081) (15.820) (12.621) (9.878) (10.036)
txT (infrastructure) 0.225*** 0.184*** 0.303*** 0.244*** 0.077*** 0.047**
(16.186) (12.910) (16.947) (12.443) (3.274) (1.998)
kxK (capital) 0.247*** 0.102* 0.372*** 0.245*** -0.002 0.371*** 0.180* -0.106 0.223**
(4.136) (1.842) (5.984) (3.341) (-0.033) (4.887) (1.871) (-1.156) (2.161)
hxH (human capital) 0.096*** 0.057*** 0.048*** 0.144*** 0.089*** 0.077*** 0.016 0.041* 0.017
(9.036) (4.819) (4.052) (10.120) (5.904) (4.853) (0.770) (1.888) (0.753)
Country fixed effects Yes Yes Yes Yes Yes Yes Yes Yes Yes
Industry fixed effects Yes Yes Yes Yes Yes Yes Yes Yes Yes
R-squared 0.752 0.752 0.754 0.748 0.75 0.75 0.722 0.716 0.72
Number of observations 29,126 28,343 27,153 18,993 19,600 17,838 11,252 10,971 10,414
Number of countries 103 95 95 103 95 95 103 95 95
Number of industries 343 359 342 241 265 241 136 142 135
Notes: The dependent variable is the natural log of exports in industry k by country i to the World. Coefficients are beta standardized
and t-values for robust standard errors are reported in brackets. * Significant at 10%; ** at 5%; *** at 1%.
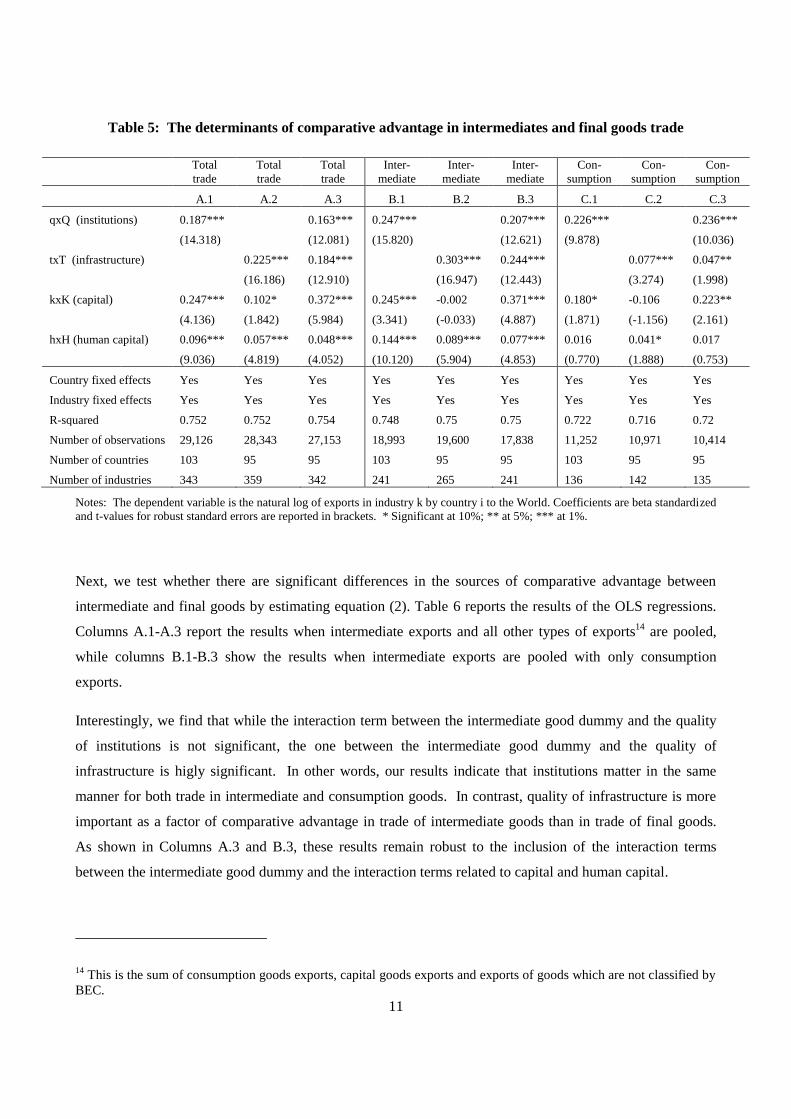
Next, we test whether there are significant differences in the sources of comparative advantage between
intermediate and final goods by estimating equation (2). Table 6 reports the results of the OLS regressions.
Columns A.1-A.3 report the results when intermediate exports and all other types of exports14
are pooled,
while columns B.1-B.3 show the results when intermediate exports are pooled with only consumption
exports.
Interestingly, we find that while the interaction term between the intermediate good dummy and the quality
of institutions is not significant, the one between the intermediate good dummy and the quality of
infrastructure is higly significant. In other words, our results indicate that institutions matter in the same
manner for both trade in intermediate and consumption goods. In contrast, quality of infrastructure is more
important as a factor of comparative advantage in trade of intermediate goods than in trade of final goods.
As shown in Columns A.3 and B.3, these results remain robust to the inclusion of the interaction terms
between the intermediate good dummy and the interaction terms related to capital and human capital.
14 This is the sum of consumption goods exports, capital goods exports and exports of goods which are not classified by
BEC.
12
These results are surprisingly at odds with the emphasis given by recent trade theory to the international
hold-up problem as a determiniant of offshoring at least as to the choice of where to offshore is concerned.
Rather, they support the view of Harrigan and Venables (2004), who suggest that timeliness is crucial for the
integration of countries into global production networks while it is less important for serving final
consumers.
Table 6: Testing for differences in the determinants of comparative advantage
Intermediate versus all other exports Intermediate versus consumption exports
A.1 A.2 A.3 B.1 B.2 B.3
qxQ (institutions) 0.060*** 0.063*** 0.055*** 0.064*** 0.069*** 0.065***
(15.465) (10.175) (8.683) (15.098) (9.710) (8.765)
qxQxI -0.005 0.005 -0.008 -0.003
(-0.902) (0.790) (-1.198) (-0.422)
txT (infrastructure) 0.043*** 0.034*** 0.030*** 0.045*** 0.017*** 0.017***
(12.480) (7.028) (5.987) (11.706) (2.791) (2.738)
txTxI 0.013*** 0.017*** 0.037*** 0.036***
(2.756) (3.402) (6.018) (5.518)
kxK (capital) 0.019*** 0.018*** -0.001 0.026*** 0.026*** 0.018**
(4.726) (4.652) (-0.114) (5.972) (5.953) (2.445)
kxKxI 0.026*** 0.011
(4.233) (1.604)
hxH (human capital) 0.017*** 0.017*** 0.022*** 0.018*** 0.016*** 0.009
(5.194) (5.255) (4.941) (4.724) (4.299) (1.383)
hxHxI -0.005 0.009
(-1.238) (1.369)
I (intermediate dummy) -0.076*** -0.077*** -0.076*** -0.01 -0.011* -0.011*
(-15.832) (-15.875) (-15.855) (-1.627) (-1.659) (-1.663)
Country fixed effects Yes Yes Yes Yes Yes Yes
Industry fixed effects Yes Yes Yes Yes Yes Yes
R-squared 0.709 0.709 0.709 0.691 0.691 0.691
Number of observations 33,743 33,743 33,743 28,252 28,252 28,252
Number of countries 95 95 95 95 95 95
Number of industries 342 342 342 309 309 309
Notes: The dependent variable is the natural log of intermediate or all other (consumption) exports in industry k by country i to the
World. Coefficients are beta standardized and t-values for robust standard errors are reported in brackets. * Significant at 10%; ** at
5%; *** at 1%.
13
B. Robustness Checks
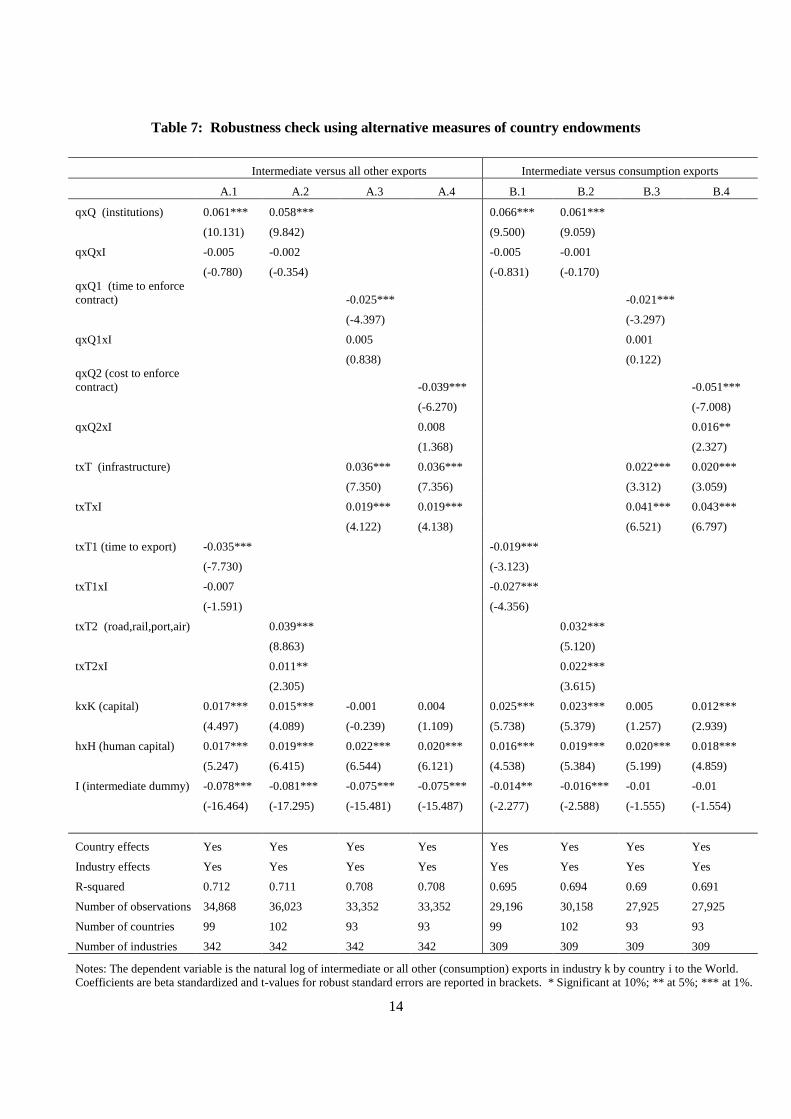
As a first test for the robustness of the results, we estimate equation (2) using alternative measures for the
quality of the institutional environment and the ability to deliver in time. Results are reported in Table 7. We
consistently find that the ability to deliver on time is a significant determinant of comparative advantage also
when it is measured by the days required to export (columns A.1 and B.1) or by the index of transport
infrastructure – calculated as an average of the quality of rail, road, air and port infrastructure (columns A.2
and B.2). We also find that the coefficients for the quality of institution is significant and of the expected
sign also when the quality of institutions is proxied by the time and the cost required to enforce a contract
(columns A.3-A.4 and B.3-A.4). Note that since we expect that lengthy times and high costs denote scarse
ability to enforce contracts, a negative coefficient on these variables denote that countries with better
enforceability conditions have a comparative advantage in institutional intensive goods.
The results also confirm that timeliness rather than institutional quality is the most important factor in
explaining the different patterns of comparative advantage in intermediate rather than in final goods. For all
the measures used to proxy a country's ability to deliver on time, the interaction term with the dummy for
intermediate goods is significant and of the same sign as the term denoting the comparative advantage in
time sensitive goods per se. In contrast, the interaction of the intermediate good dummy with the variable
that proxies a comparative advantage in institutional intensive goods is either not significant or takes the
opposite sign of the related comparative advantage terms.
14
Table 7: Robustness check using alternative measures of country endowments
Intermediate versus all other exports Intermediate versus consumption exports
A.1 A.2 A.3 A.4 B.1 B.2 B.3 B.4
qxQ (institutions) 0.061*** 0.058*** 0.066*** 0.061***
(10.131) (9.842) (9.500) (9.059)
qxQxI -0.005 -0.002 -0.005 -0.001
(-0.780) (-0.354) (-0.831) (-0.170)
qxQ1 (time to enforce
contract) -0.025*** -0.021***
(-4.397) (-3.297)
qxQ1xI 0.005 0.001
(0.838) (0.122)
qxQ2 (cost to enforce
contract) -0.039*** -0.051***
(-6.270) (-7.008)
qxQ2xI 0.008 0.016**
(1.368) (2.327)
txT (infrastructure) 0.036*** 0.036*** 0.022*** 0.020***
(7.350) (7.356) (3.312) (3.059)
txTxI 0.019*** 0.019*** 0.041*** 0.043***
(4.122) (4.138) (6.521) (6.797)
txT1 (time to export) -0.035*** -0.019***
(-7.730) (-3.123)
txT1xI -0.007 -0.027***
(-1.591) (-4.356)
txT2 (road,rail,port,air) 0.039*** 0.032***
(8.863) (5.120)
txT2xI 0.011** 0.022***
(2.305) (3.615)
kxK (capital) 0.017*** 0.015*** -0.001 0.004 0.025*** 0.023*** 0.005 0.012***
(4.497) (4.089) (-0.239) (1.109) (5.738) (5.379) (1.257) (2.939)
hxH (human capital) 0.017*** 0.019*** 0.022*** 0.020*** 0.016*** 0.019*** 0.020*** 0.018***
(5.247) (6.415) (6.544) (6.121) (4.538) (5.384) (5.199) (4.859)
I (intermediate dummy) -0.078*** -0.081*** -0.075*** -0.075*** -0.014** -0.016*** -0.01 -0.01
(-16.464) (-17.295) (-15.481) (-15.487) (-2.277) (-2.588) (-1.555) (-1.554)
Country effects Yes Yes Yes Yes Yes Yes Yes Yes
Industry effects Yes Yes Yes Yes Yes Yes Yes Yes
R-squared 0.712 0.711 0.708 0.708 0.695 0.694 0.69 0.691
Number of observations 34,868 36,023 33,352 33,352 29,196 30,158 27,925 27,925
Number of countries 99 102 93 93 99 102 93 93
Number of industries 342 342 342 342 309 309 309 309
Notes: The dependent variable is the natural log of intermediate or all other (consumption) exports in industry k by country i to the World.
Coefficients are beta standardized and t-values for robust standard errors are reported in brackets. * Significant at 10%; ** at 5%; *** at 1%.
15
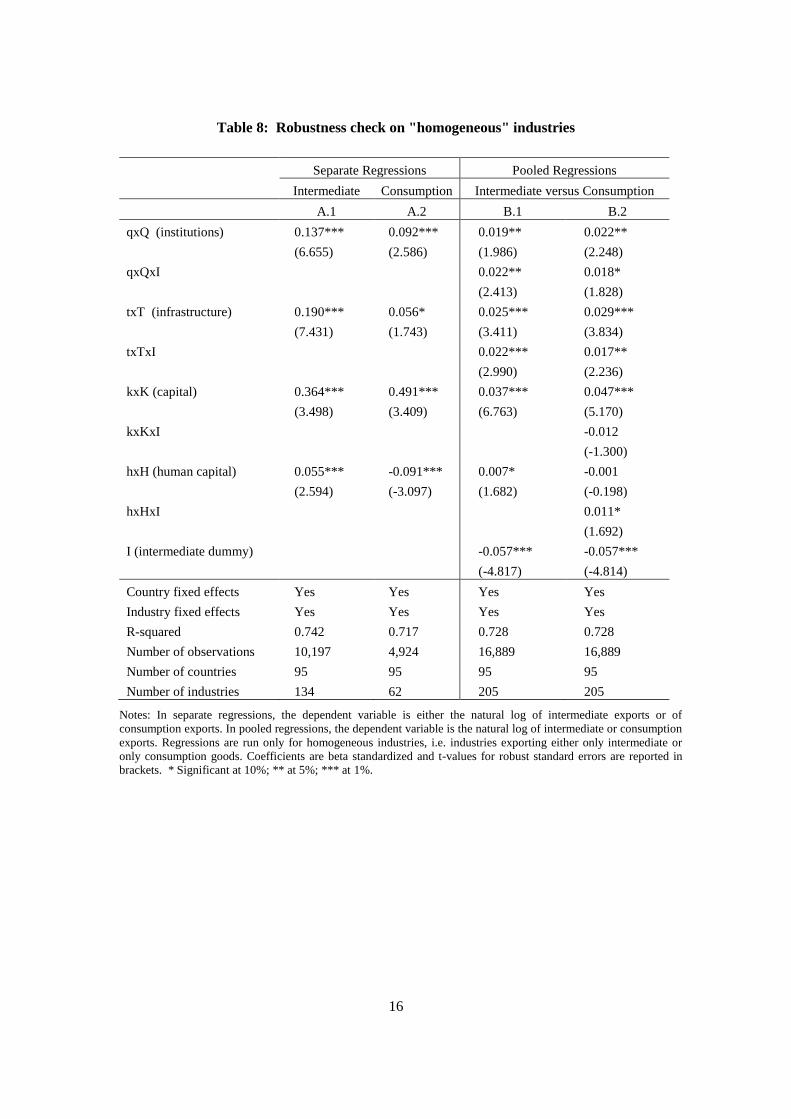
As a further robustness check, we run the regressions for the subsample of “homogeneous” industries, i.e.
industries which produce either only intermediate or only consumption goods. The rationale for this
additional test is the following: While industry intensities related to institutions and timeliness are broken
down by BEC categories because they are based on product information, this is not possible for capital and
skilled labour intensities. Hence, if an industry consists of intermediate and consumption goods, we have to
assume that all goods in this industry are produced using the same capital and skilled labour intensity. To
address this shortcoming, we rerun our main regressions for a set of homogenous industries consisting of
either only intermediate or only consumption goods. By focusing on the subsample of “intermediate goods-
only” and “consumption goods-only” industries, we can ensure that the measure of capital and labour
intensity we use are industry specific to the good they refer to. The results of these regressions (reported in
Table 8) support our previous findings: timeliness in exporting has a larger impact on the export pattern of
intermediate goods (columns B.1 and B.2). Furthermore, for this subsample we also find that quality of
institutions increases exports of institution-intensive sectors more for intermediate than for final goods.
16
Table 8: Robustness check on "homogeneous" industries
Separate Regressions Pooled Regressions
Intermediate Consumption Intermediate versus Consumption
A.1 A.2 B.1 B.2
qxQ (institutions) 0.137*** 0.092*** 0.019** 0.022**
(6.655) (2.586) (1.986) (2.248)
qxQxI 0.022** 0.018*
(2.413) (1.828)
txT (infrastructure) 0.190*** 0.056* 0.025*** 0.029***
(7.431) (1.743) (3.411) (3.834)
txTxI 0.022*** 0.017**
(2.990) (2.236)
kxK (capital) 0.364*** 0.491*** 0.037*** 0.047***
(3.498) (3.409) (6.763) (5.170)
kxKxI -0.012
(-1.300)
hxH (human capital) 0.055*** -0.091*** 0.007* -0.001
(2.594) (-3.097) (1.682) (-0.198)
hxHxI 0.011*
(1.692)
I (intermediate dummy) -0.057*** -0.057***
(-4.817) (-4.814)
Country fixed effects Yes Yes Yes Yes
Industry fixed effects Yes Yes Yes Yes
R-squared 0.742 0.717 0.728 0.728
Number of observations 10,197 4,924 16,889 16,889
Number of countries 95 95 95 95
Number of industries 134 62 205 205
Notes: In separate regressions, the dependent variable is either the natural log of intermediate exports or of
consumption exports. In pooled regressions, the dependent variable is the natural log of intermediate or consumption
exports. Regressions are run only for homogeneous industries, i.e. industries exporting either only intermediate or
only consumption goods. Coefficients are beta standardized and t-values for robust standard errors are reported in
brackets. * Significant at 10%; ** at 5%; *** at 1%.
17
Although, as discussed in section II, our methodological approach as well as the inclusion of country and
industry fixed effect limit the scope for endogeneity, one must be cautious in interpreting the OLS estimate
as causal. It is in fact possible that the relationship between infrastructure and institutions on one side and
trade on the other side is reversed. That is, countries that specialise in contract intensive (time sensitive)
industries may have greater incentive to develop a good contract enforcement environment (good
infrastructure). To address this endogeneity bias, we use instrumental variables regressions to estimate our
model (1).
In particular, to address the problem of a possible endogeneity of the quality of infrastructure, we follow
Djankov, Freund and Pham (2010) and run the regressions for a subsample of landlocked countries using the
average quality of infrastructure of neighbouring countries as instrumental variables. The idea is that while
exports of a landlocked county might affect its infrastructure, it will not affect the investment in
infrastructure of its neighbours. However, the infrastructure quality of its neighbours will affect the
landlocked country's ability to export timely since exports will have to transit through at least one of its
neighbours.
Table 9 provides the results of the IV regressions obtained using the average quality of transport
infrastructure of neighbouring countries as instrument for the transport infrastructure of landlocked countries.
Since we only focus on landlocked countries, the number of countries left in the regressions shrinks to 13.
Results confirm that if countries improve their infrastructure quality, they will indeed experience an increase
in exports in time-sensitive sectors. In particular, quality of infrastructure is more important in determining
comparative advanatage in intermediate goods than in final goods (where for this subsample they do not
appear even to be sigificant).
18
Table 9: Robustness to endogeneity of quality of infrastructure, 2SLS IV regressions
Total Trade Intermediate Consumption
First stage Second Stage First stage Second Stage First stage Second Stage
txT (infrastructure) 0.157*** 0.201*** 0.02
(4.652) (4.095) 0.292
qxQ (institutions) 0.054*** 0.173*** 0.069*** 0.169*** 0.040** 0.211***
(6.411) (5.774) (5.741) (3.901) (2.512) 3.545
kxK (capital) 0.041 -0.108 0.074 -0.039 -0.078 -0.606**
(0.993) (-0.747) (1.223) (-0.184) (-1.037) -2.16
hxH (human capital) 0.046*** 0 0.039*** 0.02 0.022 -0.005
(5.518) (0.014) (2.966) (0.419) (1.352) -0.093
txIV (average
neighbouring countries T) 1.197*** 1.183*** 1.226***
(103.02) (71.76) (55.16)
R-squared 0.983 0.772 0.985 0.77 0.986 0.762
Number of observations 3249 3249 1603 1603 882 882
Number of countries 13 13 13
Number of industries 342 246 137
Widstat 10612.605 5148.938 3042.99
Notes: The dependent variable is the natural log of exports in industry j by country i to the World. txT is instrumented using txIV
where the instrument is the average infrastructure of neighbouring countries. Reported are the beta standardized coefficients of the
second stage IV regression with t-values shown in brackets. * Significant at 10%; ** at 5%; *** at 1%.
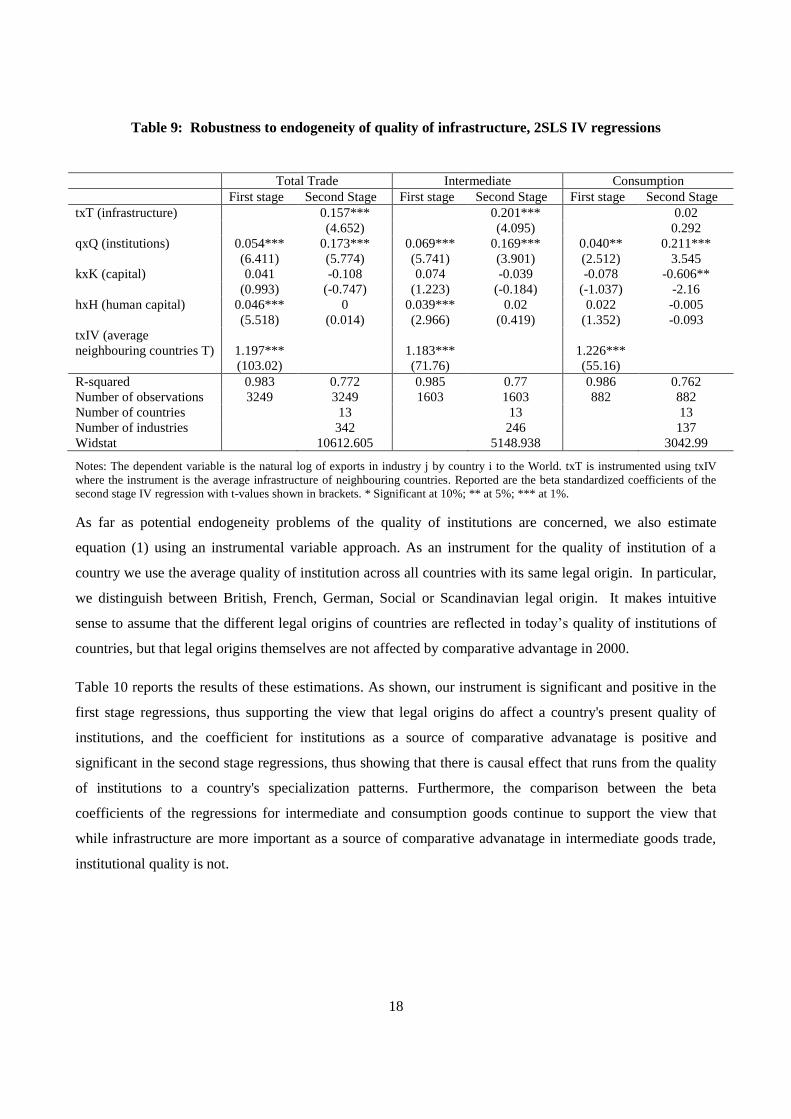
As far as potential endogeneity problems of the quality of institutions are concerned, we also estimate
equation (1) using an instrumental variable approach. As an instrument for the quality of institution of a
country we use the average quality of institution across all countries with its same legal origin. In particular,
we distinguish between British, French, German, Social or Scandinavian legal origin. It makes intuitive
sense to assume that the different legal origins of countries are reflected in today’s quality of institutions of
countries, but that legal origins themselves are not affected by comparative advantage in 2000.
Table 10 reports the results of these estimations. As shown, our instrument is significant and positive in the
first stage regressions, thus supporting the view that legal origins do affect a country's present quality of
institutions, and the coefficient for institutions as a source of comparative advanatage is positive and
significant in the second stage regressions, thus showing that there is causal effect that runs from the quality
of institutions to a country's specialization patterns. Furthermore, the comparison between the beta
coefficients of the regressions for intermediate and consumption goods continue to support the view that
while infrastructure are more important as a source of comparative advanatage in intermediate goods trade,
institutional quality is not.
19
Table 10: Robustness to endogeneity of quality of institutions, 2SLS IV regressions
Total Trade Intermediate Consumption
First stage Second Stage First stage Second Stage First stage Second Stage
qxQ (institutions) 0.247*** 0.204*** 0.358***
(9.993) (5.684) 6.976
txT (infrastructure) 0.143*** 0.167*** 0.227*** 0.205*** 0.085*** -0.002
(23.481) (11.514) (25.084) (8.943) (7.288) -0.063
kxK (capital) -1.347*** 0.514*** -1.382*** 0.437*** -1.255*** 0.515***
(-62.42) (8.12) (-44.20) (4.738) (-30.87) 4.097
hxH (human capital) 0.045*** 0.044*** 0.006 0.085*** 0.054*** -0.026
(8.796) (3.764) (0.744) (4.694) (5.52) -1.113
qxIV (quality of
institutions by legal origin) 0.662*** 0.638*** 0.660***
(90.41) (61.84) (46.33)
R-squared 0.951 0.753 0.95 0.745 0.951 0.716
Number of observations 27153 27153 13749 13749 7322 7322
Nunmber of countries 95 95 95
Number of industries 342 241 135
Widstat 8174.639 3823.676 2146.721 Notes: The dependent variable is the natural log of exports in industry k by country i to the World. qxQ is instrumented using qxIV
where the instrument (IV) is a variable that assumes the value of the average quality of institution across all countries with the same
legal origin. Reported are the beta standardized coefficients of the second stage IV regression with t-values shown in brackets. *
Significant at 10%; ** at 5%; *** at 1%.
V. The Distance Puzzle Revisited
Our finding that timeliness is particularly important as a determinant of trade in intermediate goods supports
Harrigan and Venables (2004)'s view that fragmentation of production is a force of agglomeration and
suggests that intermediate goods should be more sensitive to distance than final goods. To support our
findings, in this section we also assess whether these expectations hold true using an alternative
methodological approach: the standard gravity model of bilateral trade flows. In doing so, we also relate our
results to the recent literature on the so-called "distance puzzle", that is the typical finding of gravity models
that, contrary to expectations, the elasticity of trade flows to distance has been rising over time (Brun et al.,
2005; Coe et al., 2007; Melitz, 2007; Disdier and Head, 2008). A number of explanations have been
proposed as a solution to the puzzle. Melitz (2007), for example, investigates the role that the composition of
trade flows in terms of intra- and inter-industry trade may have played. Our finding that trade in intermediate
goods are more time sensitive than trade in final goods points to an additional effect of the composition of
trade on the distance coefficient. That is, can the growing importance of vertical specialization for trade help
to explain the distance puzzle?
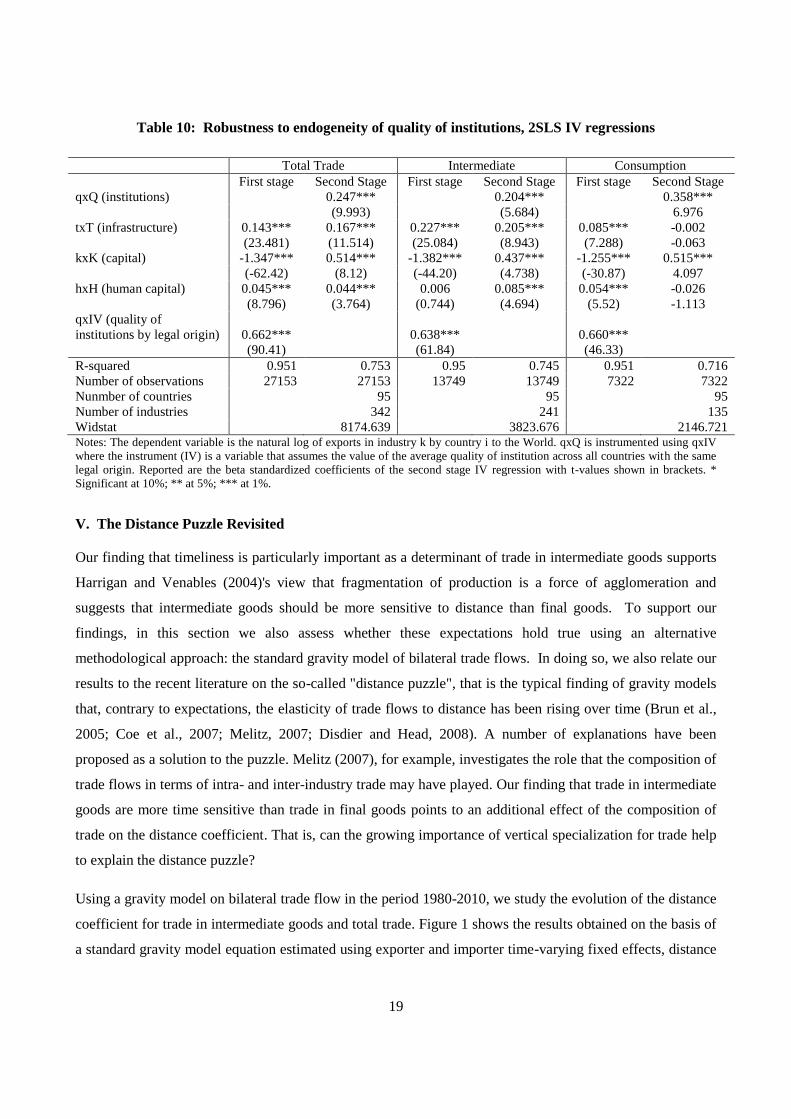
Using a gravity model on bilateral trade flow in the period 1980-2010, we study the evolution of the distance
coefficient for trade in intermediate goods and total trade. Figure 1 shows the results obtained on the basis of
a standard gravity model equation estimated using exporter and importer time-varying fixed effects, distance
20
and a range of bilateral variables including: common language, common border, colonial links, whether a
country is landlocked or an island as well as common currency dummy.
The figure shows that in line with our previous finding that timeliness is more important for trade in
intermediate than in final goods, the coefficient of distance for trade in intermediate goods is larger than that
for the total trade over the whole period. In particular, we find that the coefficient of distance in trade in
intermediate goods increases faster than that of total trade. This suggests that the composition of trade
between trade in intermediate and final goods may partially explain the increase in the distance coefficient.
Yet, rather than solving the puzzle, this result simply raises the question of why trade in intermediates is
increasingly more time sensitive.
This result supports the pessimistic interpretation of the recent finding by Carrère, de Melo and Wilson
(2010: 32) that if “trade costs can be viewed as a growing impediment in the supply-chain production. Then,
if low-income countries’ trade costs (in particular distance-dependant costs such as high mark-ups in
international shipping) remain high compared to other developing countries’ trade costs, the observed
regionalisation of trade could be interpreted as a marginalisation of these countries."
Figure 1: The distance coefficient in total and intermediate goods trade, gravity
estimations
1.3
1.4
1.5
1.6
Est
ima
ted
Coe
ffic
ient
s
1980 1990 2000 2010Years
Total Trade Trade in Intermediates
21
VI. Conclusions
Recent literature on production networks has emphasised the international hold-up problem and the
importance of a country’s ability to enforce a contract to explain the patterns of trade in general and of
offshoring in particular. The relevance of the ability to deliver on time as a factor of comparative advantage
has been studied empirically for total trade and highlighted for production networks mainly in the policy
debate. This paper complements existing studies that show that the quality of institutions and of transport
infrastructure provide a comparative advantage in exporting institution-intensive and time-sensitive goods,
respectively.
Moreover, we contribute to the literature by extending these results to trade in intermediate goods. We find
that the hold-up problem and timeliness are important determinants of the patterns of trade for both final and
intermediate goods. They together account for as much as traditional sources of comparative advantage, such
as capital and labour. Most importantly, we show that quality of transport infrastructure, i.e. the ability to
export on time, rather than quality of institutions is particularly important to explain the difference between
the pattern of trade in intermediate and that in final goods. For example, we estimate that if Thailand
improved its infrastructure to equal Chinese Thaipei, then its exports of "office machinery" intermediate
goods would increase by 26 percent while its exports of consumption products of the same sector would
increase by 5 percent.
We also contribute to the literature on the so-called "distance puzzle" by showing that part of the explanation
for an increasing distance coefficient over time in the gravity model of trade is the increase over time in the
time-sensitivity of trade in intermediate goods.
These results have important policy implications as they emphasise the importance of timeliness for the just-
in-time needs of production networks and help explain why many countries are left out of these production
networks. By providing a more detailed understanding of the role of institutions and transport infrastructure
for comparative advantage patterns of trade, our results may also provide guidance in the evaluation of
possible gains from "aid for trade" (an initiative launched at the Hong Kong Ministerial Conference in
December 2005 targeted among other issues to developing infrastructure in developing countries) and "trade
facilitations" (an area under negotiation in the ongoing Doha Round, that aims at the simplification of trade
procedures as a way to facilitate trade).
22
Appendix
Figure A.1: Share of intermediate goods in total exports
Figure A.2: Shares of intermediates in exports of Office Machinery (NAICS 333313) in 2000
0
0.1
0.2
0.3
0.4
0.5
0.6
0.7
0.8
Arg
entin
a
Aust
ralia
Bel
gium
Bra
zil
Can
ada
Chi
le
Chi
na
Ger
man
y
France
Unite
d K
ingdo
m
Indo
nesi
aIn
dia
Italy
Japa
n
Kore
a
Mex
ico
Sloven
ia
Thaila
nd
Turke
y
Chi
nese
Thai
pei
Unite
d Sta
tes
South
Afr
ica
0
0.1
0.2
0.3
0.4
0.5
0.6
0.7
0.8
0.9
Argen
tina
Australi
a
Belgiu
mBra
zil
Canad
aChi
le
China
Germ
any
France
United
Kingdo
m
Indo
nesia
Indi
aIta
ly
Japa
n
Korea
Mex
ico
Sloven
ia
Thaila
nd
Turke
y
Chine
se T
haipei
United
States
South
Africa
23
References
Acemoglu, D., P. Antràs and E. Helpman (2007). "Contracts and Technology Adoption", American
Economic Review, 97(3), 916-943.
Anderson, J. and D. Marcouiller (2002). “Insecurity and the Patterns of Trade: An Empirical Investigation”,
The Review of Economics and Statistics, 84(2), 342-352.
Antràs P. (2003). “Firms, Contracts and Trade Structure”, Quarterly Journal of Economics, 118(4), 1375-
1418.
Antràs, P. (2005). “Incomplete Contracts and the Product Cycle”, American Economic Review, 95(4), 1054-
1073.
Antràs, P. and E. Helpman (2004). "Global Sourcing", Journal of Political Economy, 112(3), 552-580.
Bergstrand, J.H. and P. Egger (2010). “A General Equilibrium Theory for Estimating Gravity Equations of
Bilateral FDI, Final Goods Trade, and Intermediate Goods Trade”, in S. Brakman and P. Van Bergeijk
(eds), The Gravity Model in International Trade: Advances and Applications, Cambridge University
Press, New York.
Bernard, A.B., J.B. Jensen, S.J. Redding and P.K. Schott (2010). "Intra-Firm Trade and Product
Contractibility", American Economic Review, Papers and Proceedings, 100(2), 444-448.
Brun J-F., C. Carrère, P. Guillaumont and J. de Melo (2005). "Has Distance Died? Evidence from a Panel
Gravity Model", World Bank Economic Review, 19(1), 99-120.
Carrère C., J. de Melo, J. Wilson (2010). "Distance and Regionalisation of Trade for Low-Income
Countries", The World Bank Policy Research Working Paper Series 5214.
Coe, D., A. Subramanian and N. Tamisara (2007). "The Missing Globalization Puzzle", IMF Staff Papers,
54, 34-58.
Corcos, G., D. Irac, G. Mion and T. Verdier (2009). “The Determinants of Intra-Firm Trade”, EFIGE
Working Paper 14.
Costinot, A. (2005). "Contract Enforcement, Division of Labor, and the Pattern of Trade", mimeo, Princeton
University.
De Groot, H.L.F., G.J. Linders, P. Rievtveld and U. Subramanian (2004). “The Institutional Determinants of
Bilateral Trade Patterns”, Kyklos, 57, 103-123.
24
Disdier A.C. and K. Head (2008). "The Puzzling Persistence of the Distance Effect on Bilateral Trade", The
Review of Economics and Statistics, 90 (1), 37-41.
Djankov, S., C. Freund and C.S. Pham (2010). “Trading on Time”, Review of Economics and Statistics,
92(1), 166-173.
Evans, C.L. and J. Harrigan (2005). "Distance, Time, and Specialization: Lean Retailing in General
Equilibrium", American Economic Review, 95(1), 292-313.
Feenstra, R.C., J. Romalis and P.K. Schott (2002). "U.S. Imports, Exports, and Tariff Data, 1989-2001",
NBER Working Paper 9387.
Freund, C. and N. Rocha (2010). “What Constraints Africa’s Exports?”, The World Bank Policy Research
Working Paper Series 5184.
Grossman, G.M. and E. Helpman (2005). "Outsourcing in a Global Economy", Review of Economic Studies,
72(1), 135-59.
Grossman, S.J. and O.D. Hart (1986). “The Costs and Benefits of Ownership: A Theory of Vertical and
Lateral Integration”, Journal of Political Economy, 94(4), 691-719.
Hall, R.E. and C.I. Jones (1999). "Why Do Some Countries Produce So Much More Output Per Worker
Than Others?", The Quarterly Journal of Economics, 114(1), 83-116.
Harrigan J. and A.J. Venables (2004) "Timeliness, Trade and Agglomeration", NBER Working Paper 10404.
Hart, O. and J. Moore (1990). "Property Rights and the Nature of the Firm", Journal of Political Economy,
98(6), 1119-58.
Hausman, W.H., L.L. Lee and U. Subramanian (2005). "Global Logistics Services, Supply Chain Metrics
and Bilateral Trade Patterns", The World Bank Policy Research Working Paper Series 3773.
Hummels, D. (2001). "Time as a Trade Barrier", GTAP Working Papers 1152, Purdue University.
Kremer, M. (1993). “The O-Ring Theory of Economic Development”, The Quarterly Journal of Economics,
118(3), 551-575.
Levchenko, A. (2007). "Institutional Quality and International Trade", Review of Economic Studies, 74(3),
791-819.
25
Li, Y. and J.S. Wilson (2009). “Time as a Determinant of Comparartive Advanatage”, The World Bank
Policy Research Working Paper Series 5128.
Limão, N. and A.J. Venables (2001). "Infrastructure, Geographical Disadvantage, Transport Costs and
Trade", World Bank Economic Review, 15(3), 451-479.
Melitz, J. (2007). "North, South and Distance in the Gravity Model", European Economic Review, 51, 971-
991.
Miroudot, S., R. Lanz and A. Ragoussis (2009). "Trade in Intermediate Goods and Services," OECD Trade
Policy Working Papers 93.
Nordas, H. K. (2007). “International Production Sharing: A Case for a Coherent Policy Framework”, WTO
Ddiscussion Ppaper N° 11, Geneva: World Trade Organization
Nunn, N. (2007). "Relationship-Specificity, Incomplete Contracts, and the Pattern of Trade," The Quarterly
Journal of Economics, 122(2), 569-600.
Nunn, N. and D. Trefler (2008). "The Boundaries of the Multinational Firm: An Empirical Analysis", in D.
Marin and T. Verdier (eds.), The Organization of Firms in a Global Economy, Harvard University Press.
Portugal-Perez, A. and J.S. Wilson (2009). "Why Trade Facilitation Matters to Africa", World Trade Review,
8(3), 379-416.
Rauch, J.E. (1999). "Networks versus Markets in International Trade", Journal of International Economics,
48(1), 7-35.
Romalis, J. (2004). “Factor Proportions and the Structure of Commodity Trade”, American Economic
Review, 94(1), 67-97.
Williamson, O.E. (1985). The Economic Institutions of Capitalism, New York, The Free Press.
Recommended