JEA Total Market Compensation Strategy 6/19/2019
For Compensation Committee Meeting ‐‐Tuesday, June 18, 2019 1
Total Market Compensation Strategy
Total Market Compensation StrategyCompensation CommitteeJune 2018 1
Work together to elevate the entire team
2
Core competencies accelerate results
JEA Total Market Compensation Strategy 6/19/2019
For Compensation Committee Meeting ‐‐Tuesday, June 18, 2019 2
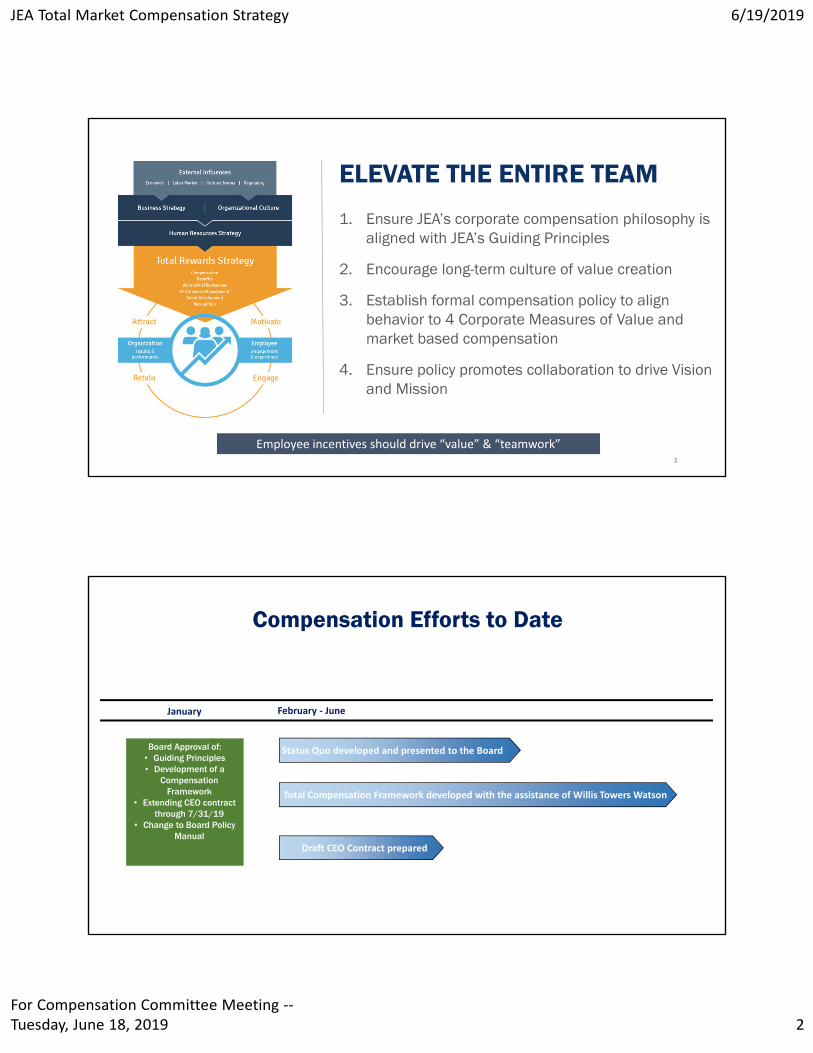
ELEVATE THE ENTIRE TEAM
1. Ensure JEA’s corporate compensation philosophy is aligned with JEA’s Guiding Principles
2. Encourage long-term culture of value creation
3. Establish formal compensation policy to align behavior to 4 Corporate Measures of Value and market based compensation
4. Ensure policy promotes collaboration to drive Vision and Mission
3
Employee incentives should drive “value” & “teamwork”
Compensation Efforts to Date
Draft CEO Contract prepared
February ‐ June
Total Compensation Framework developed with the assistance of Willis Towers Watson
Status Quo developed and presented to the Board
January
Board Approval of:• Guiding Principles• Development of a
Compensation Framework
• Extending CEO contract through 7/31/19
• Change to Board Policy Manual
JEA Total Market Compensation Strategy 6/19/2019
For Compensation Committee Meeting ‐‐Tuesday, June 18, 2019 3
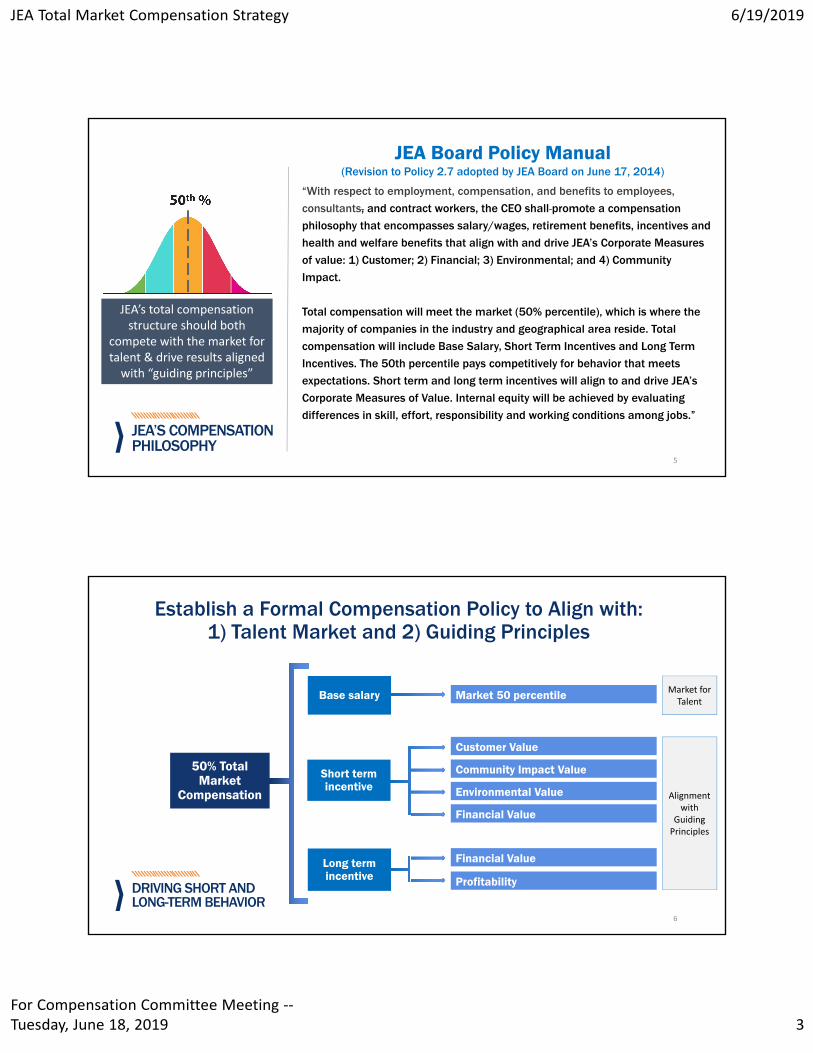
JEA’S COMPENSATION PHILOSOPHY
JEA Board Policy Manual(Revision to Policy 2.7 adopted by JEA Board on June 17, 2014)
5
“With respect to employment, compensation, and benefits to employees,
consultants, and contract workers, the CEO shall promote a compensation
philosophy that encompasses salary/wages, retirement benefits, incentives and
health and welfare benefits that align with and drive JEA’s Corporate Measures
of value: 1) Customer; 2) Financial; 3) Environmental; and 4) Community
Impact.
Total compensation will meet the market (50% percentile), which is where the
majority of companies in the industry and geographical area reside. Total
compensation will include Base Salary, Short Term Incentives and Long Term
Incentives. The 50th percentile pays competitively for behavior that meets
expectations. Short term and long term incentives will align to and drive JEA’s
Corporate Measures of Value. Internal equity will be achieved by evaluating
differences in skill, effort, responsibility and working conditions among jobs.”
JEA’s total compensation structure should both
compete with the market for talent & drive results aligned with “guiding principles”
Establish a Formal Compensation Policy to Align with:1) Talent Market and 2) Guiding Principles
Base salary
Short term incentive
Long term incentive
Market 50 percentile
Customer Value
Community Impact Value
Environmental Value
Financial Value
Profitability
50% Total Market
Compensation
Financial Value
DRIVING SHORT AND LONG-TERM BEHAVIOR
6
Market for Talent
Alignment with
GuidingPrinciples
JEA Total Market Compensation Strategy 6/19/2019
For Compensation Committee Meeting ‐‐Tuesday, June 18, 2019 4
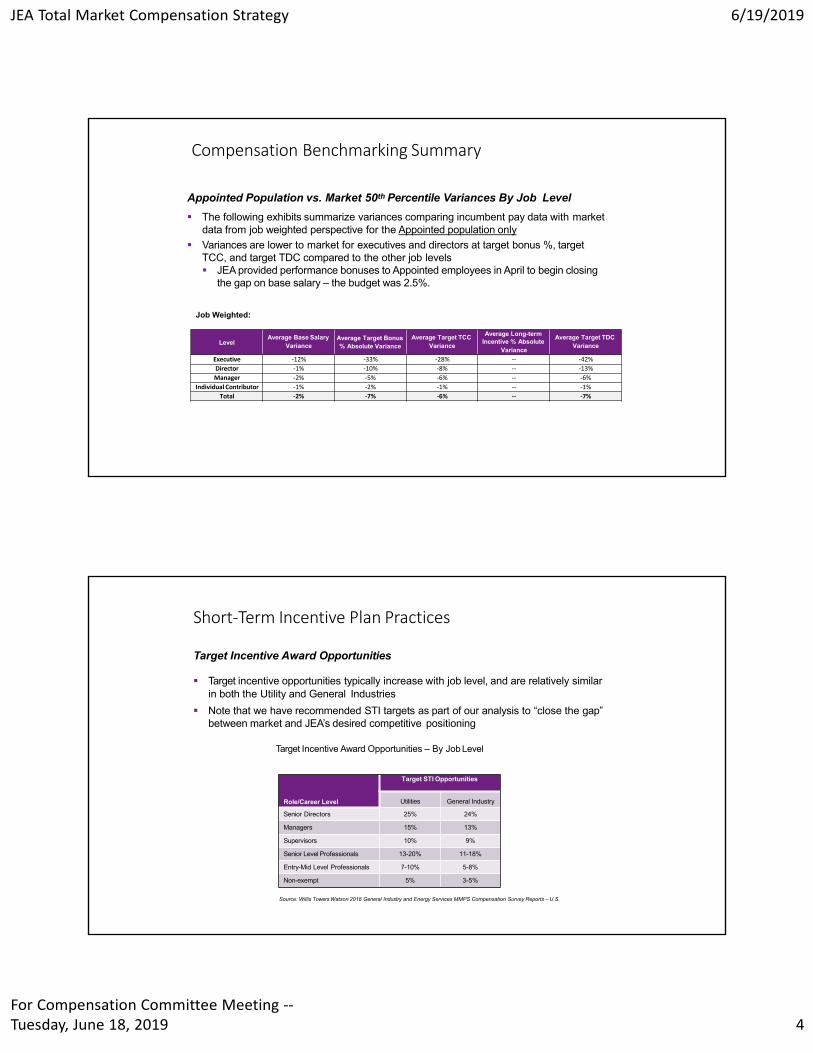
Compensation Benchmarking Summary
Appointed Population vs. Market 50th Percentile Variances By Job Level
The following exhibits summarize variances comparing incumbent pay data with marketdata from job weighted perspective for the Appointed population only
Variances are lower to market for executives and directors at target bonus %, targetTCC, and target TDC compared to the other job levels JEA provided performance bonuses to Appointed employees in April to begin closing
the gap on base salary – the budget was 2.5%.
Job Weighted:
LevelAverage Base Salary
VarianceAverage Target Bonus% Absolute Variance
Average Target TCC Variance
Average Long-termIncentive % Absolute
Variance
Average Target TDC Variance
Executive ‐12% ‐33% ‐28% ‐‐ ‐42%
Director ‐1% ‐10% ‐8% ‐‐ ‐13%
Manager ‐2% ‐5% ‐6% ‐‐ ‐6%
Individual Contributor ‐1% ‐2% ‐1% ‐‐ ‐1%
Total ‐2% ‐7% ‐6% ‐‐ ‐7%
Short‐Term Incentive Plan Practices
Role/Career Level
Target STI Opportunities
Utilities General Industry
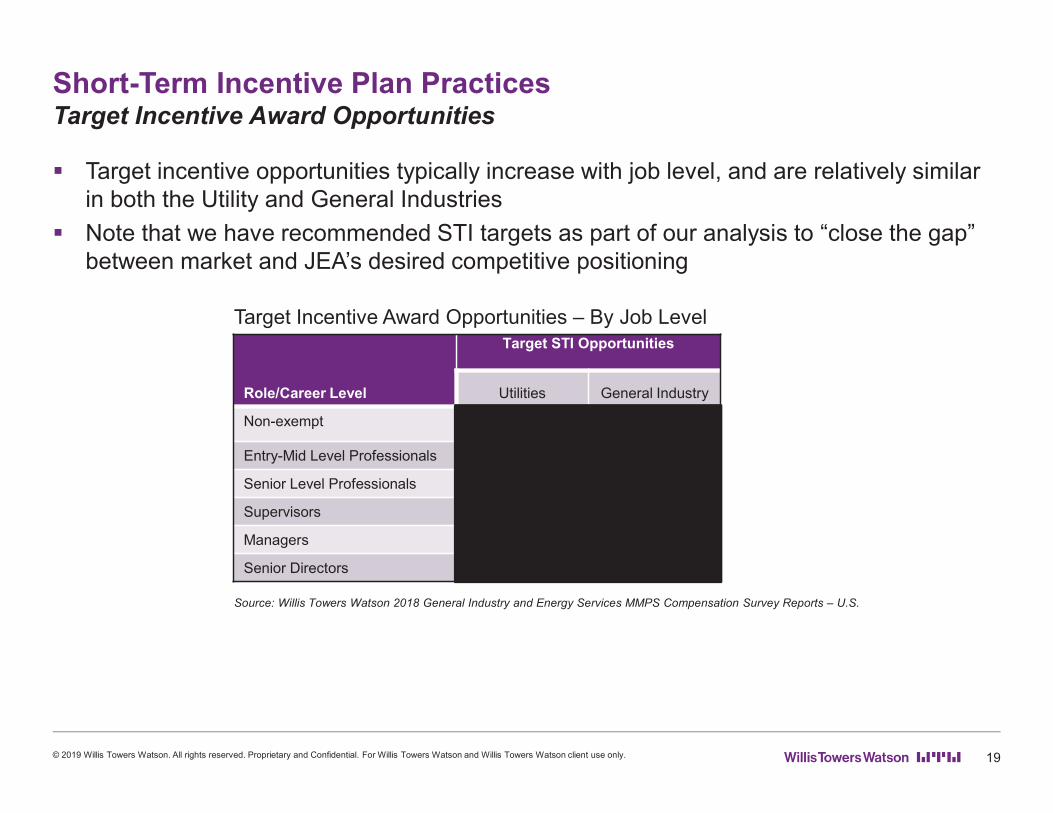
Senior Directors 25% 24%
Managers 15% 13%
Supervisors 10% 9%
Senior Level Professionals 13-20% 11-18%
Entry-Mid Level Professionals 7-10% 5-8%
Non-exempt 5% 3-5%
Source: Willis Towers Watson 2018 General Industry and Energy Services MMPS Compensation Survey Reports – U.S.
Target Incentive Award Opportunities
Target incentive opportunities typically increase with job level, and are relatively similar in both the Utility and General Industries
Note that we have recommended STI targets as part of our analysis to “close the gap” between market and JEA’s desired competitive positioning
Target Incentive Award Opportunities – By Job Level
JEA Total Market Compensation Strategy 6/19/2019
For Compensation Committee Meeting ‐‐Tuesday, June 18, 2019 5
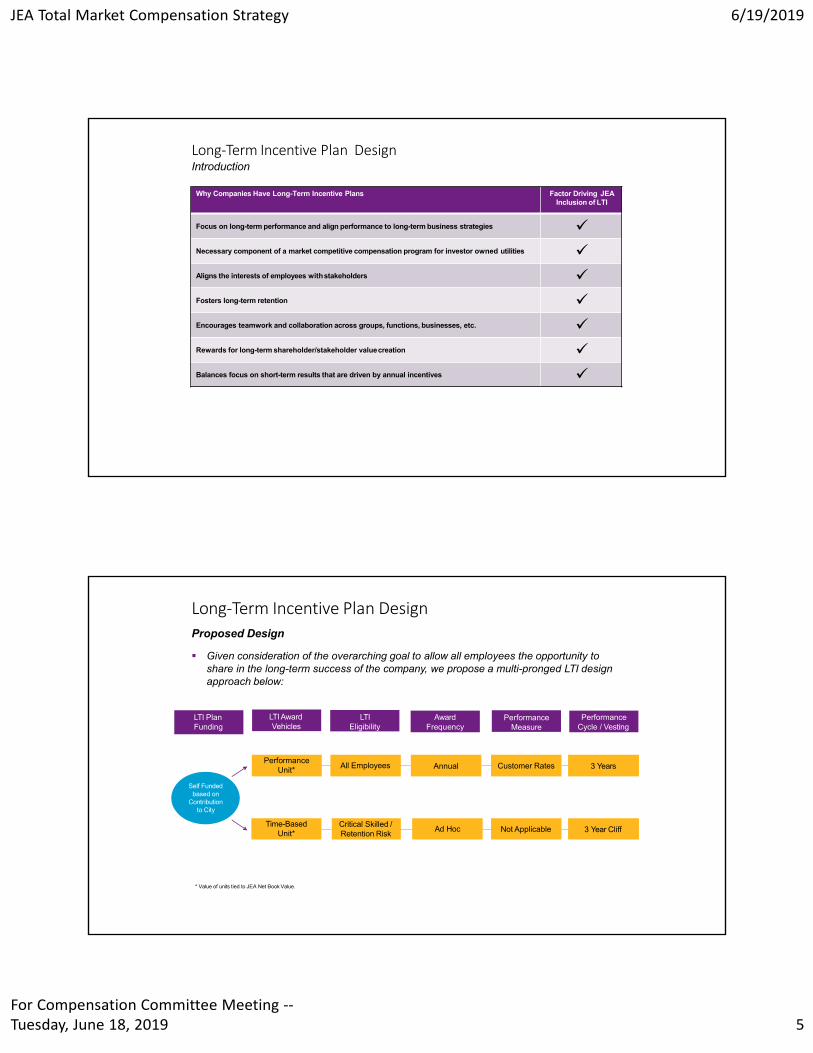
Long‐Term Incentive Plan DesignIntroduction
Why Companies Have Long-Term Incentive Plans Factor Driving JEAInclusion of LTI
Focus on long-term performance and align performance to long-term business strategies Necessary component of a market competitive compensation program for investor owned utilities Aligns the interests of employees withstakeholders Fosters long-term retention Encourages teamwork and collaboration across groups, functions, businesses, etc. Rewards for long-term shareholder/stakeholder valuecreation Balances focus on short-term results that are driven by annual incentives
Long‐Term Incentive Plan DesignProposed Design
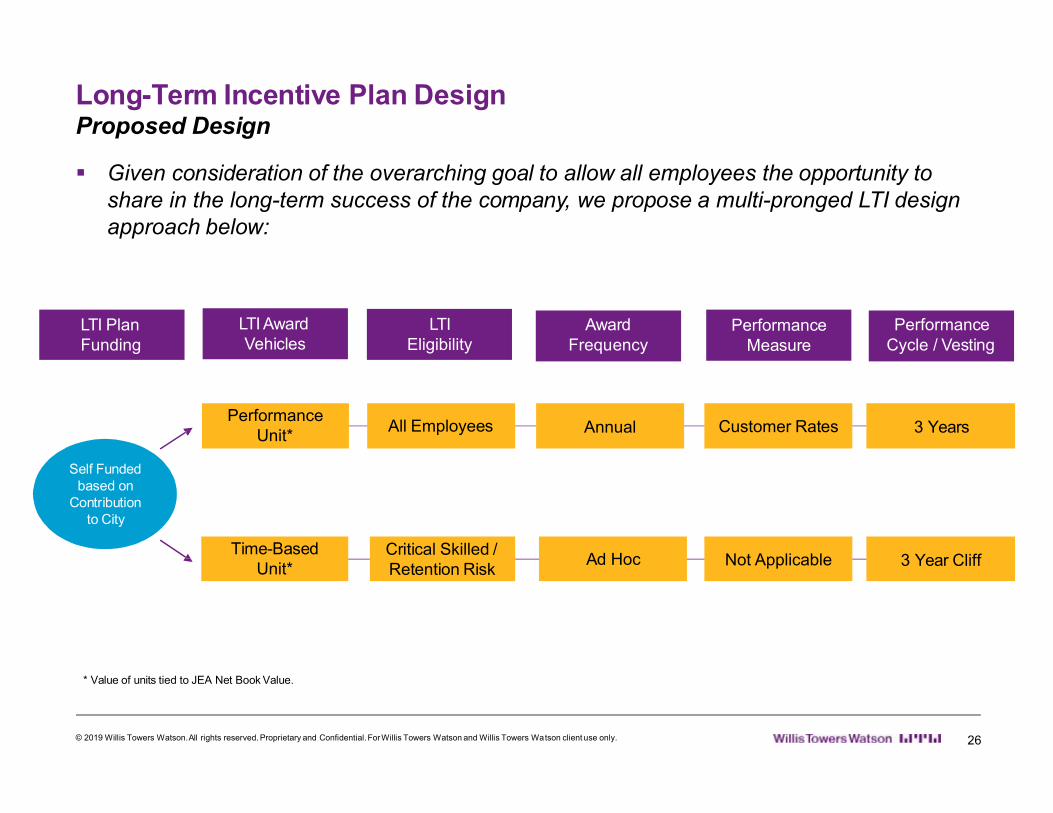
Given consideration of the overarching goal to allow all employees the opportunity to share in the long-term success of the company, we propose a multi-pronged LTI design approach below:
LTI AwardVehicles
LTI PlanFunding
Self Funded based on
Contribution to City
LTIEligibility
* Value of units tied to JEA Net Book Value.
PerformanceMeasure
Performance Cycle / Vesting
Award Frequency
Performance Unit*
All Employees Annual Customer Rates 3 Years
Time-BasedUnit*
Critical Skilled /Retention Risk
Ad Hoc Not Applicable 3 Year Cliff
JEA Total Market Compensation Strategy 6/19/2019
For Compensation Committee Meeting ‐‐Tuesday, June 18, 2019 6
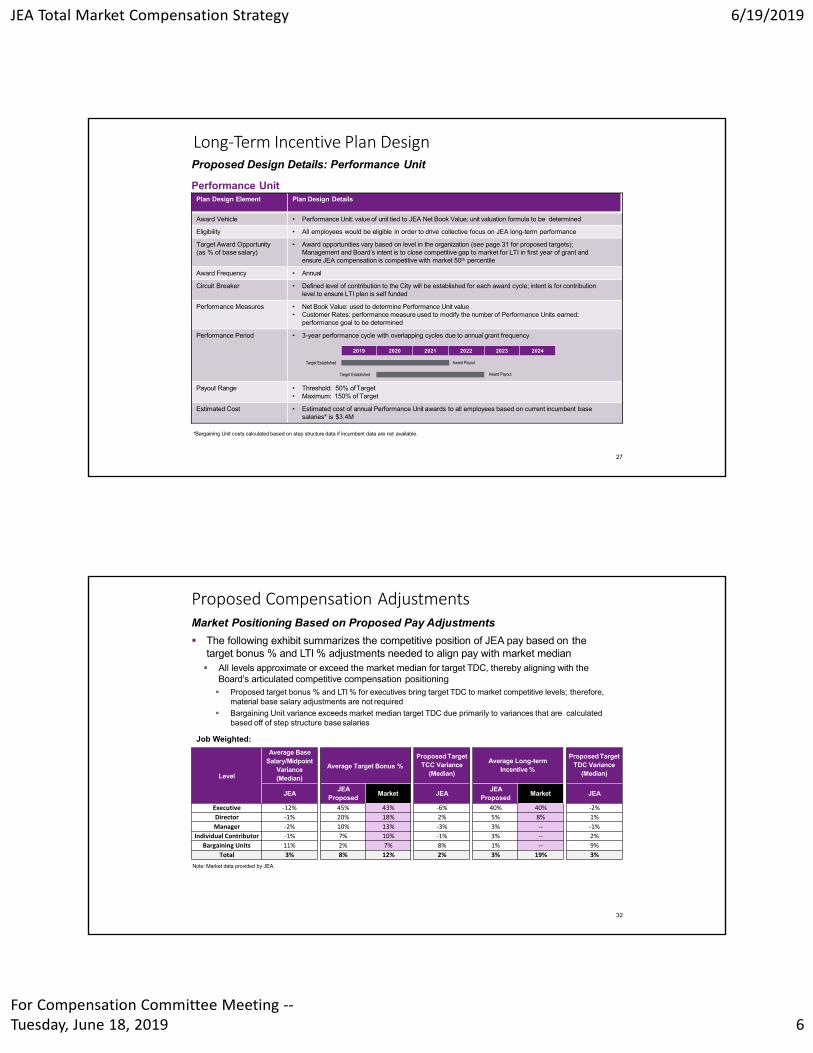
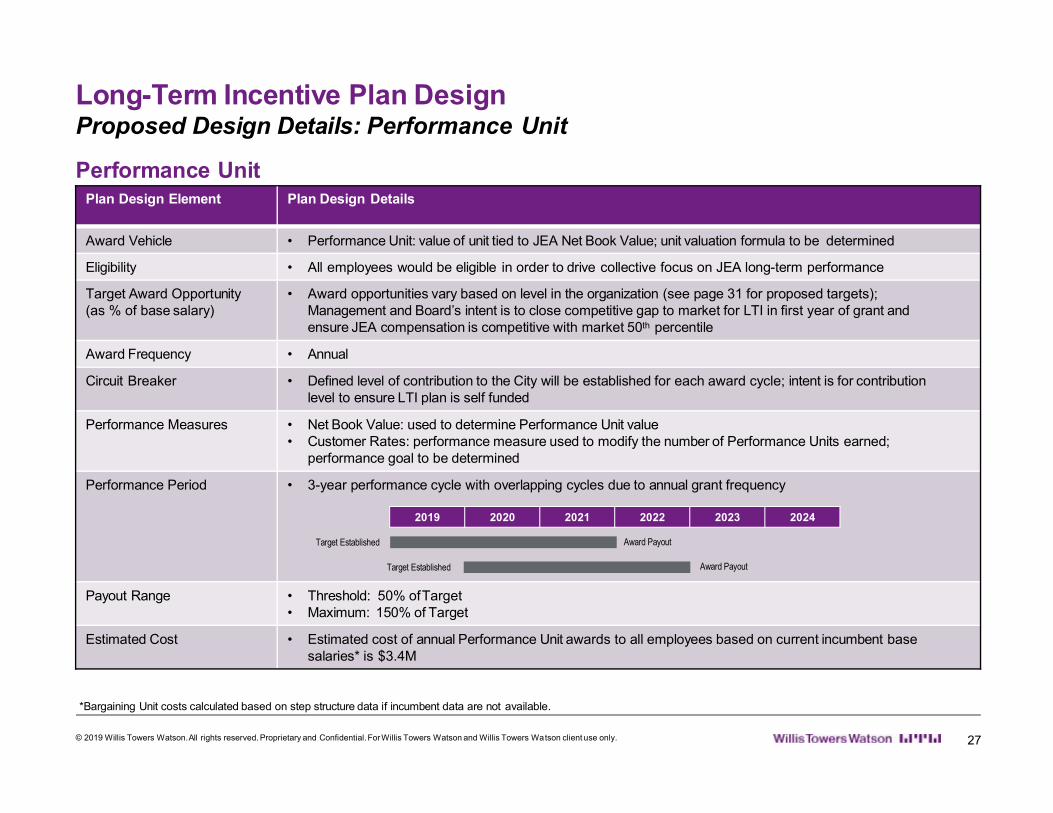
Long‐Term Incentive Plan DesignProposed Design Details: Performance Unit
Performance UnitPlan Design Element Plan Design Details
Award Vehicle • Performance Unit: value of unit tied to JEA Net Book Value; unit valuation formula to be determined
Eligibility • All employees would be eligible in order to drive collective focus on JEA long-term performance
Target Award Opportunity •(as % of base salary)
Award opportunities vary based on level in the organization (see page 31 for proposed targets); Management and Board’s intent is to close competitive gap to market for LTI in first year of grant and ensure JEA compensation is competitive with market 50th percentile
Award Frequency • Annual
Circuit Breaker • Defined level of contribution to the City will be established for each award cycle; intent is for contributionlevel to ensure LTI plan is self funded
Performance Measures • Net Book Value: used to determine Performance Unit value• Customer Rates: performance measure used to modify the number of Performance Units earned;
performance goal to be determined
Performance Period • 3-year performance cycle with overlapping cycles due to annual grant frequency
Payout Range • Threshold: 50% ofTarget• Maximum: 150% of Target
Estimated Cost • Estimated cost of annual Performance Unit awards to all employees based on current incumbent basesalaries* is $3.4M
2019 2020 2021 2022 2023 2024
Target Established
*Bargaining Unit costs calculated based on step structure data if incumbent data are not available.
27
Target Established
Award Payout
Award Payout
Proposed Compensation Adjustments
Note: Market data provided by JEA.
32
Market Positioning Based on Proposed Pay Adjustments
The following exhibit summarizes the competitive position of JEA pay based on thetarget bonus % and LTI % adjustments needed to align pay with market median All levels approximate or exceed the market median for target TDC, thereby aligning with the
Board’s articulated competitive compensation positioning Proposed target bonus % and LTI % for executives bring target TDC to market competitive levels; therefore,
material base salary adjustments are not required
Bargaining Unit variance exceeds market median target TDC due primarily to variances that are calculatedbased off of step structure base salaries
Job Weighted:
Level
Average Base Salary/Midpoint
Variance(Median)
JEA
Executive ‐12%
Director ‐1%
Manager ‐2%
Individual Contributor ‐1%
Bargaining Units 11%
Total 3%
Proposed Target TCC Variance
(Median)
JEA
‐6%
2%
‐3%
‐1%
8%
2%
Average Target Bonus %
JEAProposed
Market
45% 43%
20% 18%
10% 13%
7% 10%
2% 7%
8% 12%
Average Long-term Incentive %
JEAProposed
Market
40% 40%
5% 8%
3% ‐‐
3% ‐‐
1% ‐‐
3% 19%
Proposed Target TDC Variance
(Median)
JEA
‐2%
1%
‐1%
2%
9%
3%
JEA Total Market Compensation Strategy 6/19/2019
For Compensation Committee Meeting ‐‐Tuesday, June 18, 2019 7
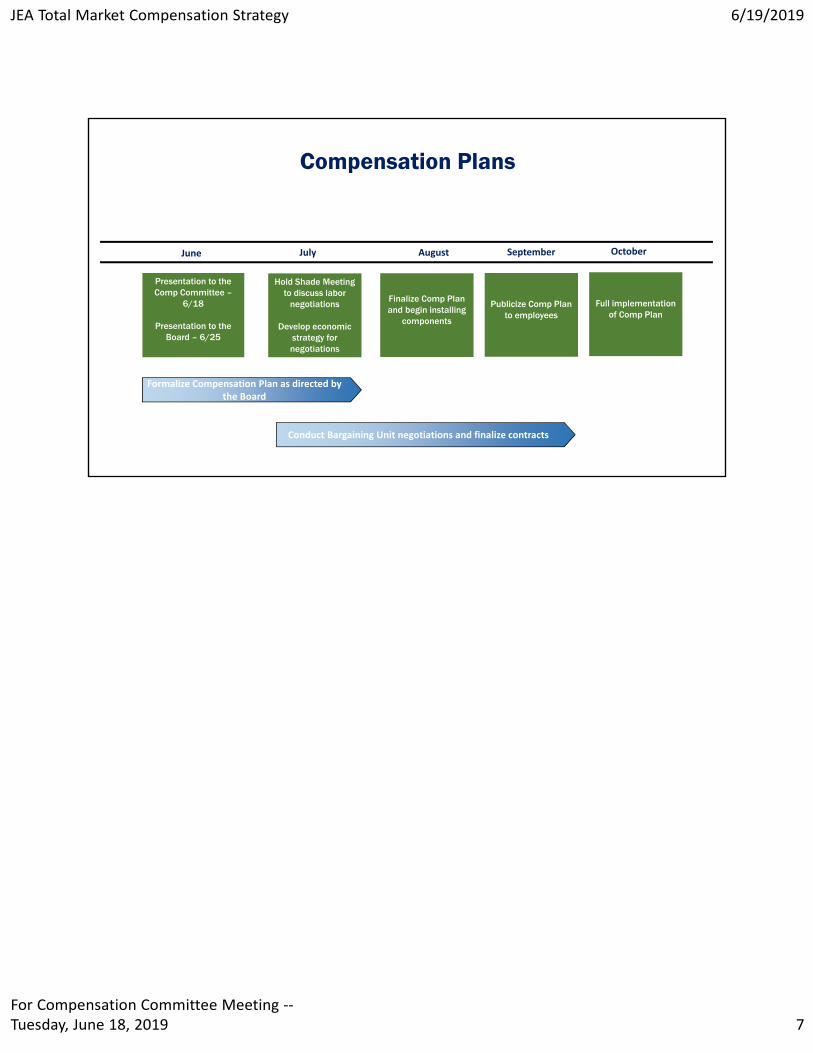
Compensation Plans
July
Formalize Compensation Plan as directed by the Board
June
Presentation to the Comp Committee –
6/18
Presentation to the Board – 6/25
Hold Shade Meeting to discuss labor
negotiations
Develop economic strategy for negotiations
Conduct Bargaining Unit negotiations and finalize contracts
August September
Finalize Comp Plan and begin installing
components
October
Publicize Comp Plan to employees
Full implementation of Comp Plan
Compensation Program Appendix for Compensation Committee Meeting
© 2019 Willis Towers Watson. All rights reserved.
Prepared for JEA
June 18, 2019
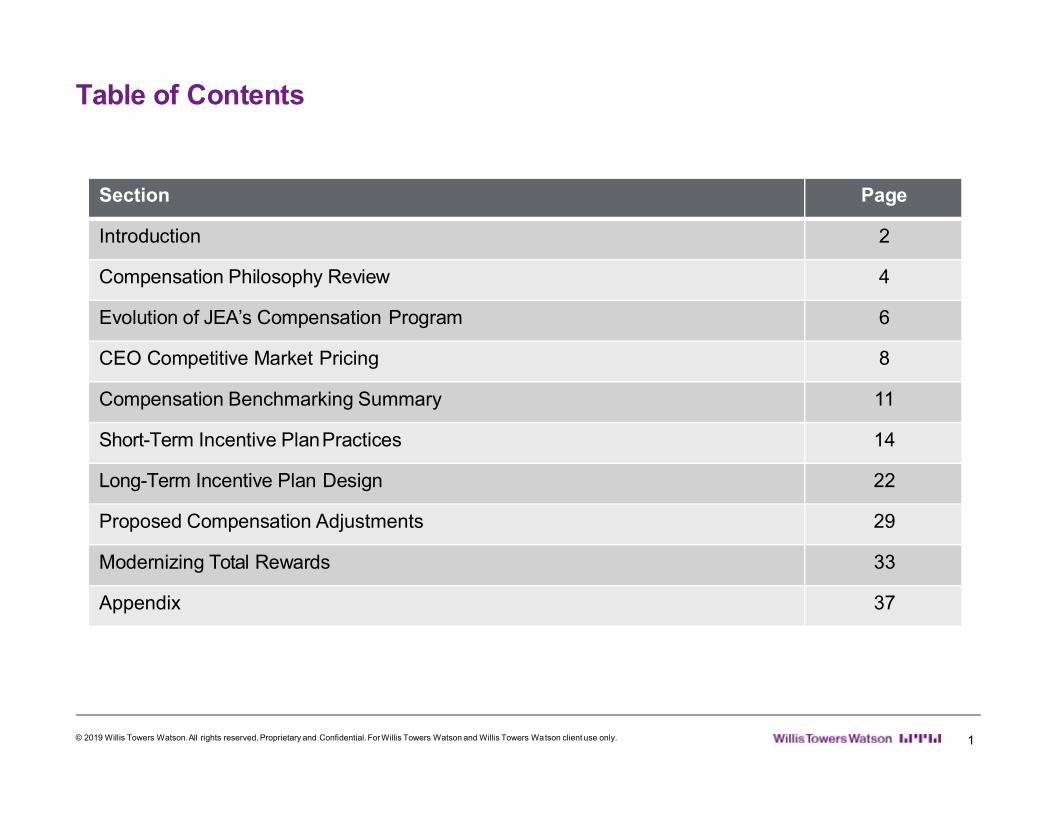
Table of Contents
© 2019 Willis Towers Watson.All rights reserved. Proprietary and Confidential.ForWillis Towers Watson and Willis Towers Watson client use only. 1
Section Page
Introduction 2
Compensation Philosophy Review 4
Evolution of JEA’s Compensation Program 6
CEO Competitive Market Pricing 8
Compensation Benchmarking Summary 11
Short-Term Incentive PlanPractices 14
Long-Term Incentive Plan Design 22
Proposed Compensation Adjustments 29
Modernizing Total Rewards 33
Appendix 37
IntroductionSummary
© 2019 Willis Towers Watson.All rights reserved. Proprietary and Confidential.ForWillis Towers Watson and Willis Towers Watson client use only. 3
ß JEA engaged Willis Towers Watson (“WTW”) to complete the following:ß Conduct a competitive market assessment for JEA’s entire employee population
ß Provide a summary of market practices related to short-term incentive plan design
ß Conduct a competitive market analysis of long-term incentive (“LTI”) plan design practices anddevelop a proposeddesign
ß This report includes the following:ß Confirmation of JEA’s current compensation philosophy
ß Review of the evolution of JEA’s compensation programs
ß Analysis of the compensation variances for JEA’s employee population
ß Analysis of the gaps to market for JEA’s Appointed population and Bargaining Units
ß Proposed LTI plan design
ß Total rewards market best practices
Compensation Philosophy Review
© 2019 Willis Towers Watson.All rights reserved. Proprietary and Confidential.ForWillis Towers Watson and Willis Towers Watson client use only. 5
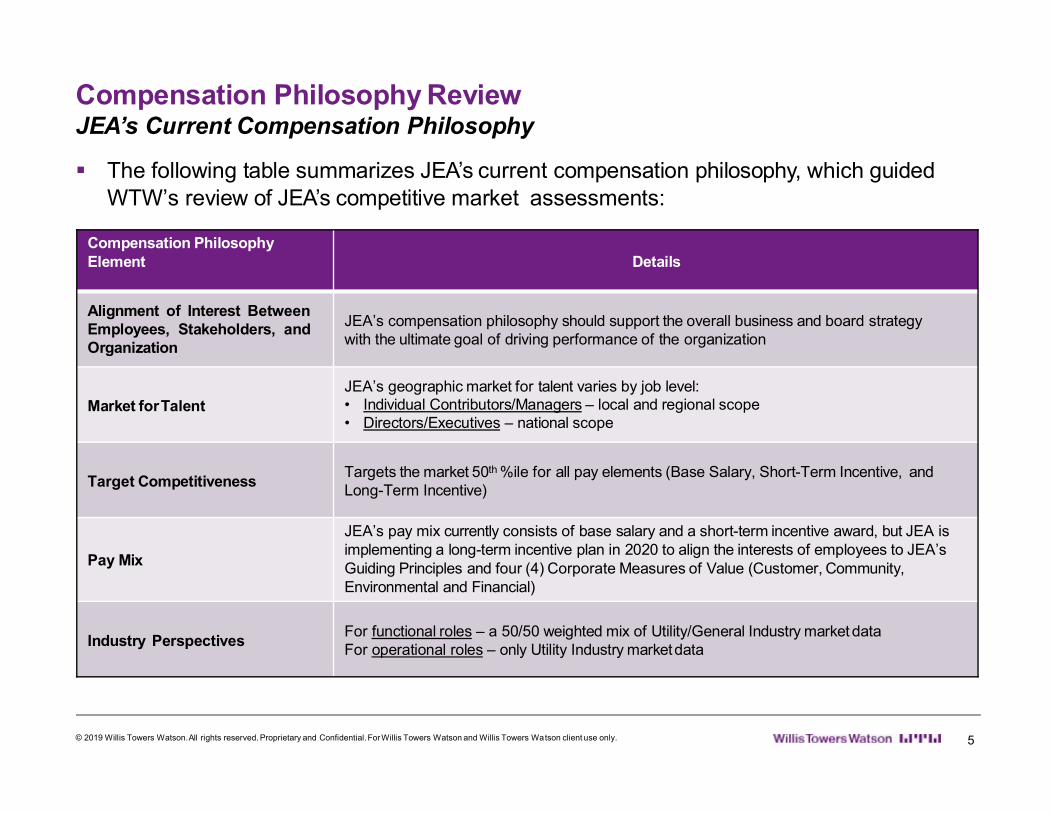
Compensation Philosophy Element Details
Alignment of Interest BetweenEmployees, Stakeholders, andOrganization
JEA’s compensation philosophy should support the overall business and board strategywith the ultimate goal of driving performance of the organization
Market forTalentJEA’s geographic market for talent varies by job level:• Individual Contributors/Managers – local and regional scope• Directors/Executives – national scope
Target CompetitivenessTargets the market 50th %ile for all pay elements (Base Salary, Short-Term Incentive, andLong-Term Incentive)
Pay Mix
JEA’s pay mix currently consists of base salary and a short-term incentive award, but JEA is implementing a long-term incentive plan in 2020 to align the interests of employees to JEA’s Guiding Principles and four (4) Corporate Measures of Value (Customer, Community, Environmental and Financial)
Industry PerspectivesFor functional roles – a 50/50 weighted mix of Utility/General Industry market dataFor operational roles – only Utility Industry marketdata
JEA’s Current Compensation Philosophy
ß The following table summarizes JEA’s current compensation philosophy, which guided WTW’s review of JEA’s competitive market assessments:
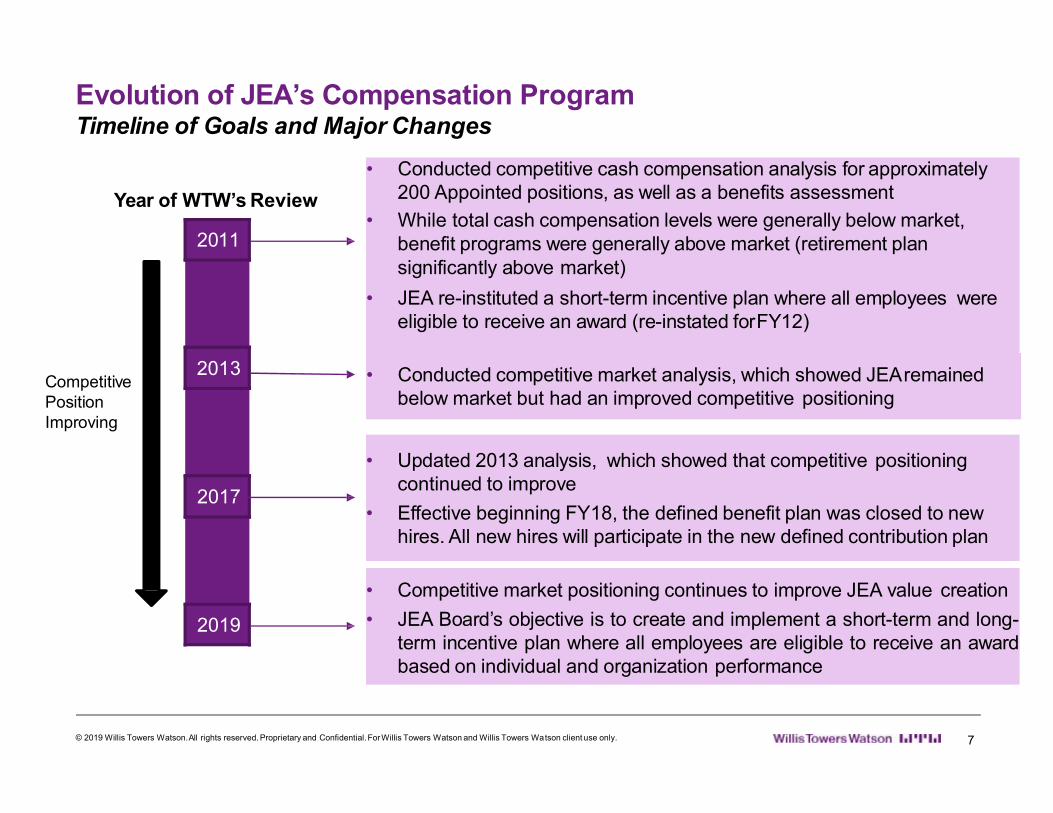
Evolution of JEA’s Compensation ProgramTimeline of Goals and Major Changes
• Conducted competitive cash compensation analysis for approximately200 Appointed positions, as well as a benefits assessment
• While total cash compensation levels were generally below market, benefit programs were generally above market (retirement plan significantly above market)
• JEA re-instituted a short-term incentive plan where all employees wereeligible to receive an award (re-instated forFY12)
2011
2013
2017
2019
Year of WTW’s Review
Competitive Position Improving
• Updated 2013 analysis, which showed that competitive positioningcontinued to improve
• Effective beginning FY18, the defined benefit plan was closed to newhires. All new hires will participate in the new defined contribution plan
• Competitive market positioning continues to improve JEA value creation
• JEA Board’s objective is to create and implement a short-term and long-term incentive plan where all employees are eligible to receive an awardbased on individual and organization performance
• Conducted competitive market analysis, which showed JEAremainedbelow market but had an improved competitive positioning
© 2019 Willis Towers Watson.All rights reserved. Proprietary and Confidential.ForWillis Towers Watson and Willis Towers Watson client use only. 7
Compensation Benchmarking Summary
© 2019 Willis Towers Watson.All rights reserved. Proprietary and Confidential.ForWillis Towers Watson and Willis Towers Watson client use only. 12
Methodology
ß The following page contains a summary of WTW’s review of JEA’s competitive marketdata for its Appointed population (including 13 executives)
ß WTW reviewed the most current incumbent and market data provided by JEAß Market data for the positions below the Director-level reflect a -5% geographic differential to
account for the cost of labor of Jacksonville, FL vs. the US national average
ß Analysis of competitive positioning focused on market data at the 50th percentile
Compensation Benchmarking Summary
© 2019 Willis Towers Watson.All rights reserved. Proprietary and Confidential.ForWillis Towers Watson and Willis Towers Watson client use only. 13
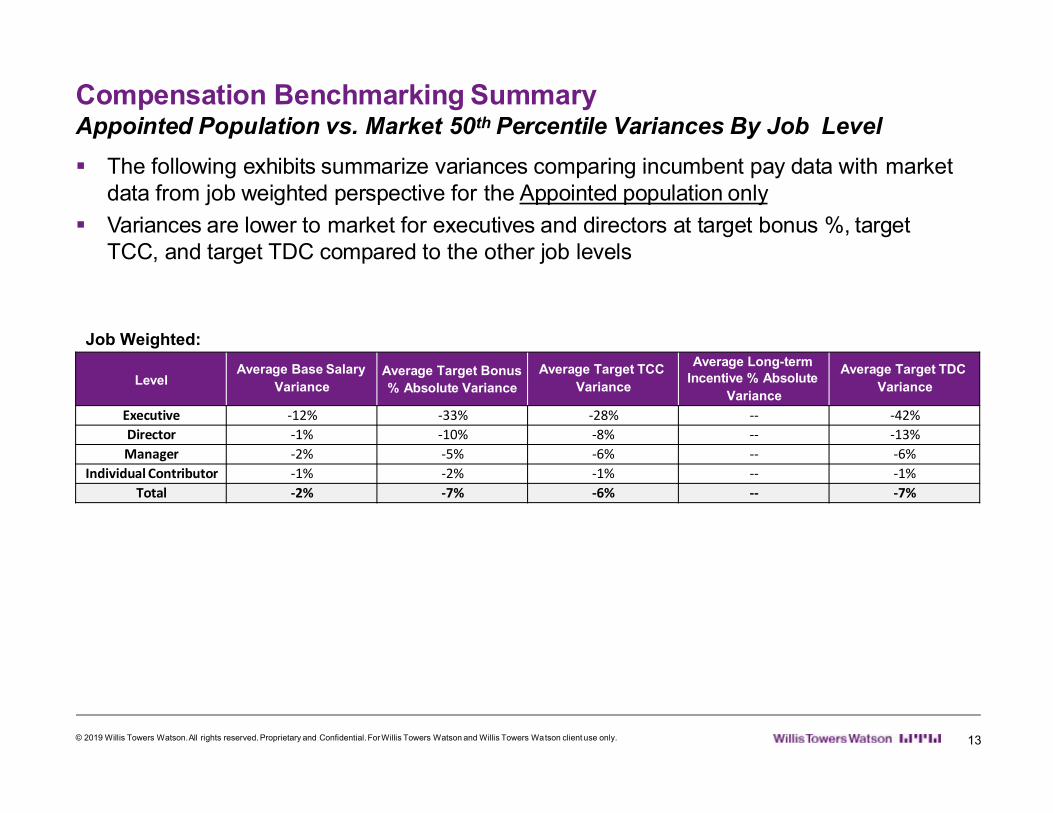
Appointed Population vs. Market 50th Percentile Variances By Job Level
ß The following exhibits summarize variances comparing incumbent pay data with marketdata from job weighted perspective for the Appointed population only
ß Variances are lower to market for executives and directors at target bonus %, targetTCC, and target TDC compared to the other job levels
Job Weighted:
LevelAverage Base Salary
VarianceAverage Target Bonus% Absolute Variance
Average Target TCC Variance
Average Long-termIncentive % Absolute
Variance
Average Target TDC Variance
Executive -12% -33% -28% -- -42%Director -1% -10% -8% -- -13%Manager -2% -5% -6% -- -6%
Individual Contributor -1% -2% -1% -- -1%Total -2% -7% -6% -- -7%
Short-Term Incentive Plan Practices
© 2019 Willis Towers Watson.All rights reserved. Proprietary and Confidential.ForWillis Towers Watson and Willis Towers Watson client use only. 15
Introduction
ß JEA re-instated a broad-based short-term incentive plan several years ago, both toaddress competitive pay levels, as well as to reinforce specific messages related toperformance expectations
ß The following pages summarize market practices related to short-term incentive plandesignß As appropriate, JEA may consider these practices as they continue to evolve their incentive plan
designß Key design features covered include eligibility, target award opportunities, payout ranges, bonus
pool funding, performance measures and performance range
ß The market practices information has been summarized from survey research, as wellas our consulting experiences
Short-Term Incentive Plan Practices
© 2019 Willis Towers Watson.All rights reserved. Proprietary and Confidential.ForWillis Towers Watson and Willis Towers Watson client use only. 16
Eligibility
ß Eligibility for short-term incentive plans is typically broad for both the Utility and GeneralIndustries, with prevalence actually higher in the Utility Industry (particularly at the lowerjob levels)
ß Over 60% of organizations in the industry extend eligibility to the lower exempt and non-exempt rolesß Lower roles may not have an expressed target opportunity, but they may be part of a“sharing
program” based on organizational performance
ß In some cases, overall funding and participation at lower levels may bediscretionary
Short-Term Incentive Plan Practices
© 2019 Willis Towers Watson.All rights reserved. Proprietary and Confidential.ForWillis Towers Watson and Willis Towers Watson client use only. 19
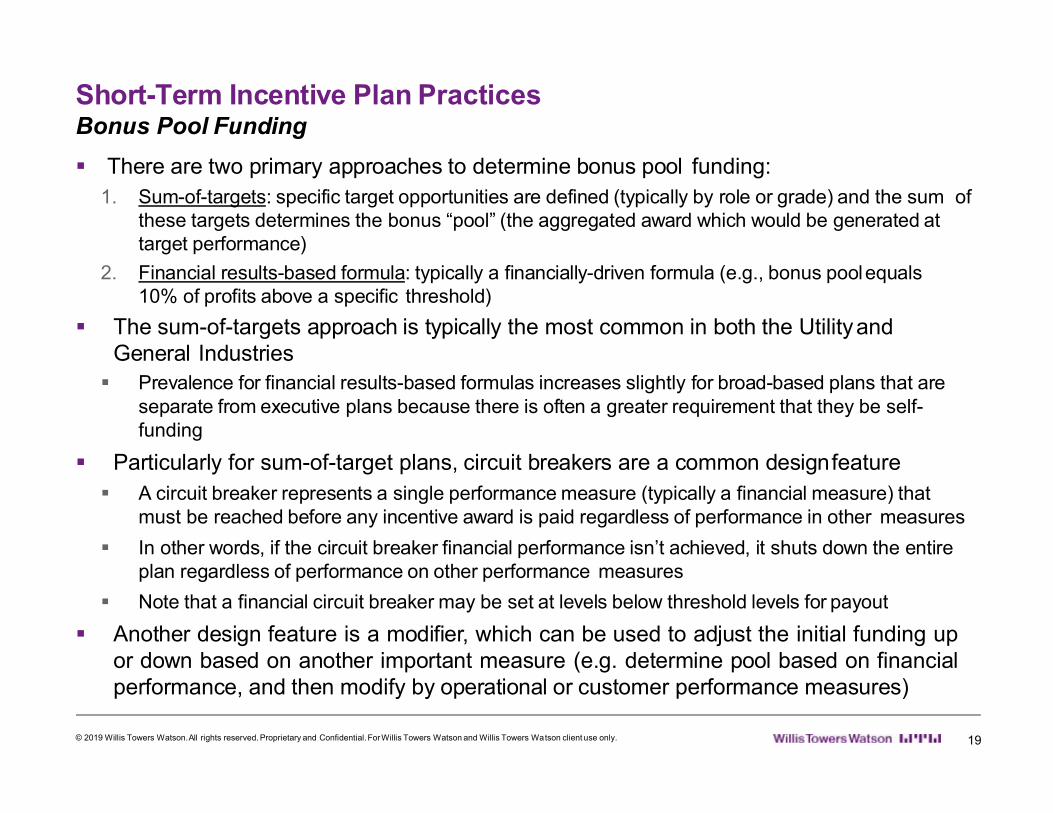
Bonus Pool Funding
ß There are two primary approaches to determine bonus pool funding:1. Sum-of-targets: specific target opportunities are defined (typically by role or grade) and the sum of
these targets determines the bonus “pool” (the aggregated award which would be generated at target performance)
2. Financial results-based formula: typically a financially-driven formula (e.g., bonus poolequals10% of profits above a specific threshold)
ß The sum-of-targets approach is typically the most common in both the UtilityandGeneral Industries
ß Prevalence for financial results-based formulas increases slightly for broad-based plans that are separate from executive plans because there is often a greater requirement that they be self-funding
ß Particularly for sum-of-target plans, circuit breakers are a common designfeatureß A circuit breaker represents a single performance measure (typically a financial measure) that
must be reached before any incentive award is paid regardless of performance in other measures
ß In other words, if the circuit breaker financial performance isn’t achieved, it shuts down the entire plan regardless of performance on other performance measures
ß Note that a financial circuit breaker may be set at levels below threshold levels for payout
ß Another design feature is a modifier, which can be used to adjust the initial funding upor down based on another important measure (e.g. determine pool based on financialperformance, and then modify by operational or customer performance measures)
Short-Term Incentive Plan Practices
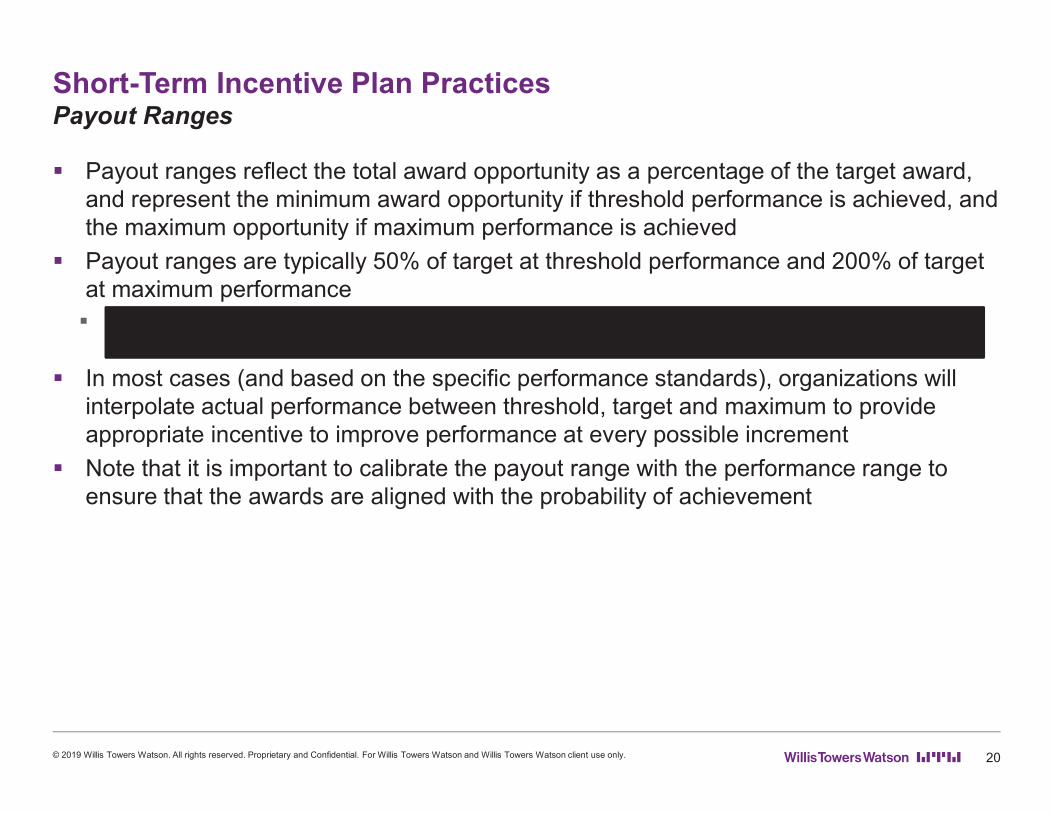
© 2019 Willis Towers Watson.All rights reserved. Proprietary and Confidential.ForWillis Towers Watson and Willis Towers Watson client use only. 20
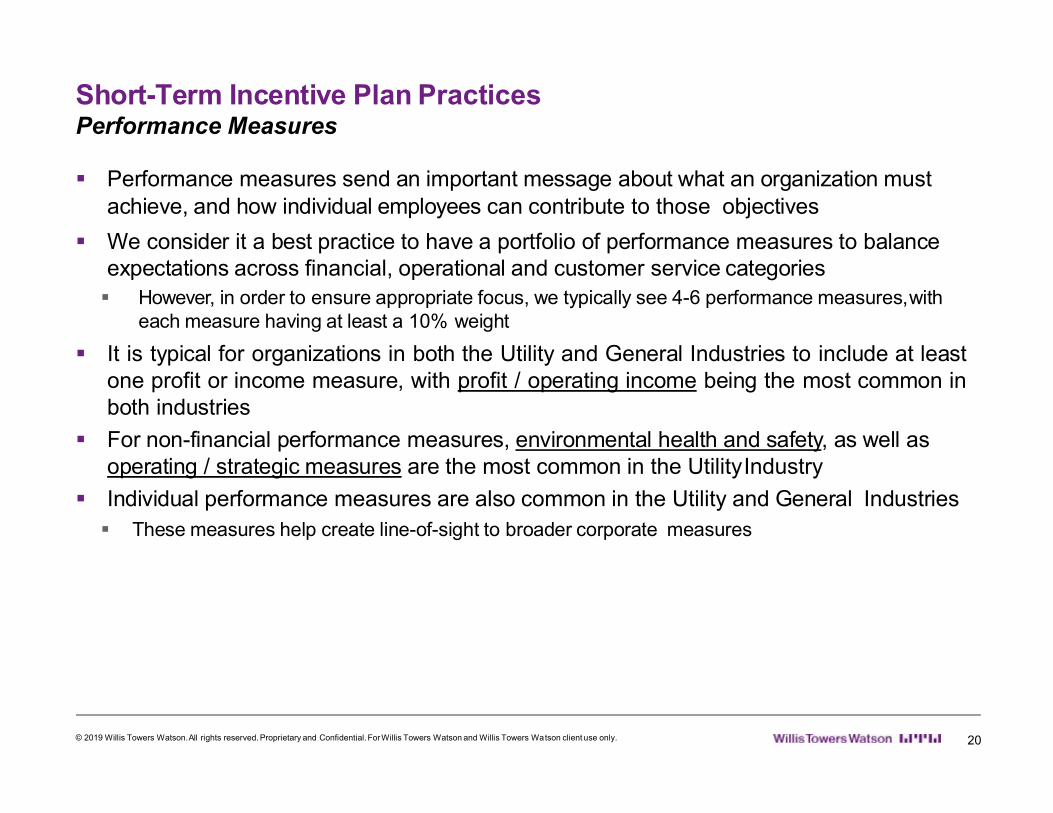
Performance Measures
ß Performance measures send an important message about what an organization must achieve, and how individual employees can contribute to those objectives
ß We consider it a best practice to have a portfolio of performance measures to balance expectations across financial, operational and customer service categoriesß However, in order to ensure appropriate focus, we typically see 4-6 performance measures,with
each measure having at least a 10% weight
ß It is typical for organizations in both the Utility and General Industries to include at leastone profit or income measure, with profit / operating income being the most common inboth industries
ß For non-financial performance measures, environmental health and safety, as well asoperating / strategic measures are the most common in the UtilityIndustry
ß Individual performance measures are also common in the Utility and General Industriesß These measures help create line-of-sight to broader corporate measures
Short-Term Incentive Plan Practices
© 2019 Willis Towers Watson.All rights reserved. Proprietary and Confidential.ForWillis Towers Watson and Willis Towers Watson client use only. 21
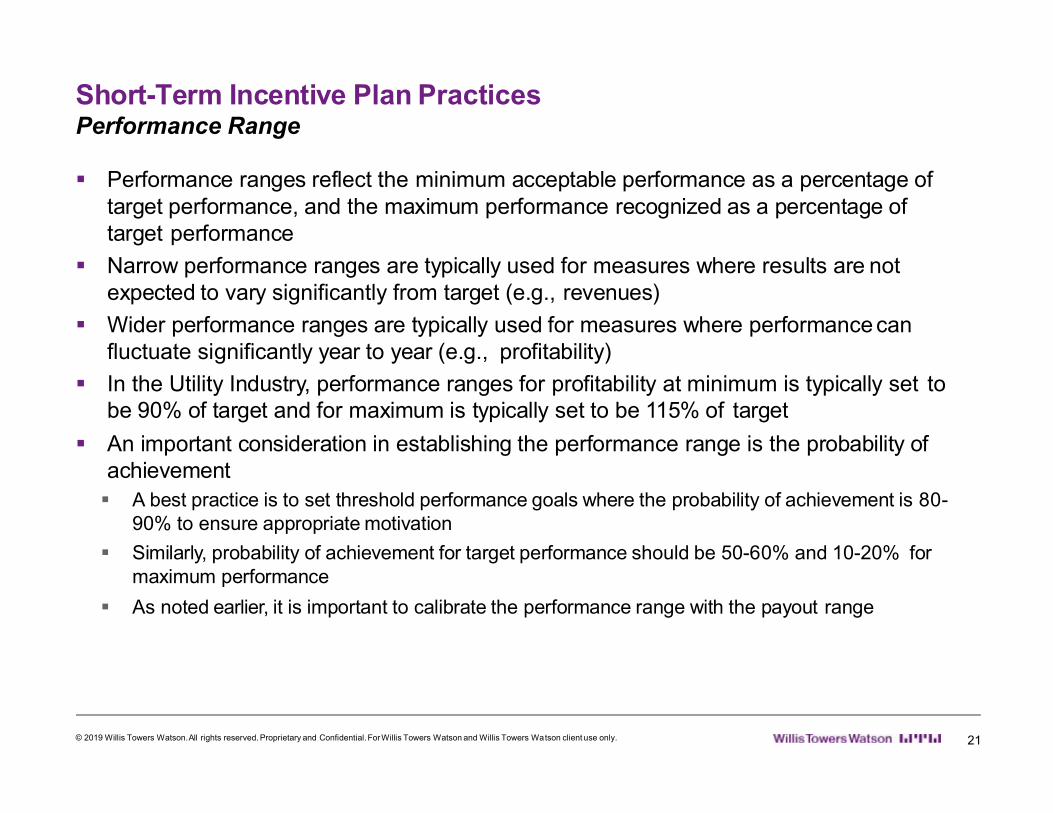
Performance Range
ß Performance ranges reflect the minimum acceptable performance as a percentage of target performance, and the maximum performance recognized as a percentage of target performance
ß Narrow performance ranges are typically used for measures where results are notexpected to vary significantly from target (e.g., revenues)
ß Wider performance ranges are typically used for measures where performance canfluctuate significantly year to year (e.g., profitability)
ß In the Utility Industry, performance ranges for profitability at minimum is typically set tobe 90% of target and for maximum is typically set to be 115% of target
ß An important consideration in establishing the performance range is the probability of achievementß A best practice is to set threshold performance goals where the probability of achievement is 80-
90% to ensure appropriate motivation
ß Similarly, probability of achievement for target performance should be 50-60% and 10-20% formaximum performance
ß As noted earlier, it is important to calibrate the performance range with the payout range
Long-Term Incentive Plan DesignIntroduction
© 2019 Willis Towers Watson.All rights reserved. Proprietary and Confidential.ForWillis Towers Watson and Willis Towers Watson client use only. 23
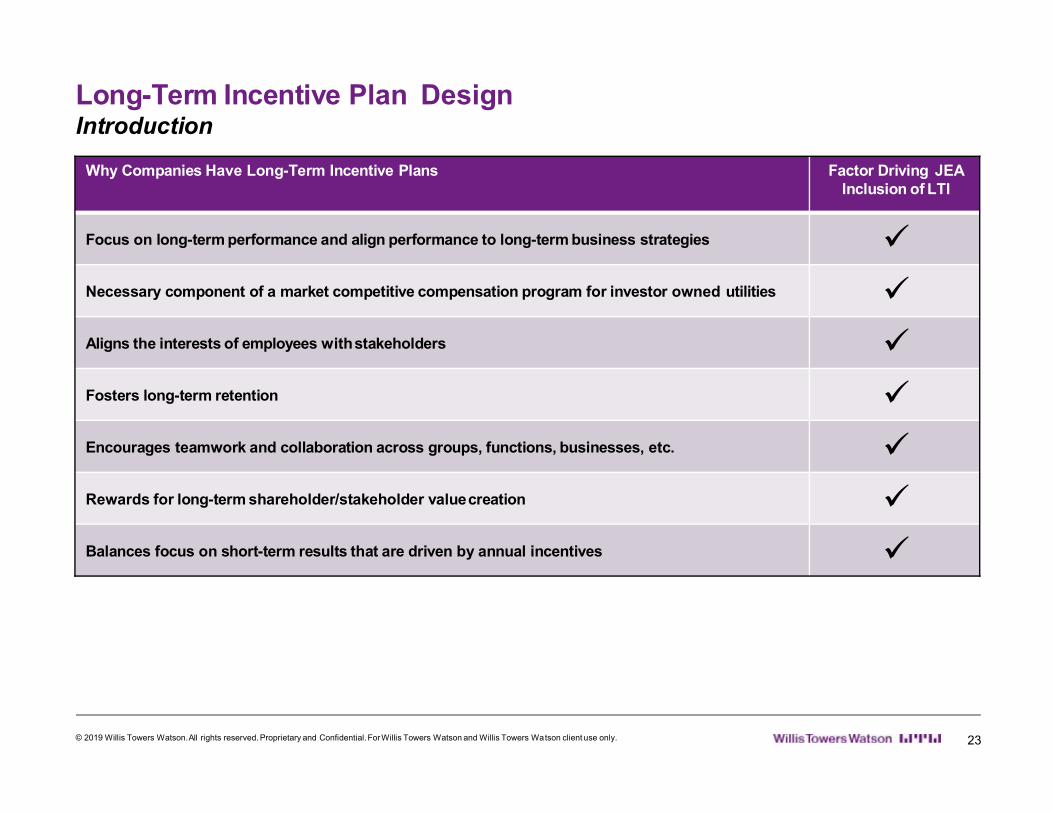
Why Companies Have Long-Term Incentive Plans Factor Driving JEAInclusion of LTI
Focus on long-term performance and align performance to long-term business strategies ¸Necessary component of a market competitive compensation program for investor owned utilities ¸Aligns the interests of employees withstakeholders ¸Fosters long-term retention ¸Encourages teamwork and collaboration across groups, functions, businesses, etc. ¸Rewards for long-term shareholder/stakeholder valuecreation ¸Balances focus on short-term results that are driven by annual incentives ¸
Long-Term Incentive Plan DesignProposed Design
ß Given consideration of the overarching goal to allow all employees the opportunity to share in the long-term success of the company, we propose a multi-pronged LTI design approach below:
LTI AwardVehicles
LTI PlanFunding
Self Funded based on
Contribution to City
LTIEligibility
* Value of units tied to JEA Net Book Value.
PerformanceMeasure
Performance Cycle / Vesting
Award Frequency
Performance Unit*
All Employees Annual Customer Rates 3 Years
Time-BasedUnit*
Critical Skilled /Retention Risk
Ad Hoc Not Applicable 3 Year Cliff
© 2019 Willis Towers Watson.All rights reserved. Proprietary and Confidential.ForWillis Towers Watson and Willis Towers Watson client use only. 26
Long-Term Incentive Plan DesignProposed Design Details: Performance Unit
Performance UnitPlan Design Element Plan Design Details
Award Vehicle • Performance Unit: value of unit tied to JEA Net Book Value; unit valuation formula to be determined
Eligibility • All employees would be eligible in order to drive collective focus on JEA long-term performance
Target Award Opportunity •(as % of base salary)
Award opportunities vary based on level in the organization (see page 31 for proposed targets); Management and Board’s intent is to close competitive gap to market for LTI in first year of grant and ensure JEA compensation is competitive with market 50th percentile
Award Frequency • Annual
Circuit Breaker • Defined level of contribution to the City will be established for each award cycle; intent is for contributionlevel to ensure LTI plan is self funded
Performance Measures • Net Book Value: used to determine Performance Unit value• Customer Rates: performance measure used to modify the number of Performance Units earned;
performance goal to be determined
Performance Period • 3-year performance cycle with overlapping cycles due to annual grant frequency
Payout Range • Threshold: 50% ofTarget• Maximum: 150% of Target
Estimated Cost • Estimated cost of annual Performance Unit awards to all employees based on current incumbent basesalaries* is $3.4M
2019 2020 2021 2022 2023 2024
Target Established
*Bargaining Unit costs calculated based on step structure data if incumbent data are not available.
© 2019 Willis Towers Watson.All rights reserved. Proprietary and Confidential.ForWillis Towers Watson and Willis Towers Watson client use only. 27
Target Established
Award Payout
Award Payout
Long-Term Incentive Plan Design
*Bargaining Unit costs calculated based on step structure data if incumbent data are not available.
© 2019 Willis Towers Watson.All rights reserved. Proprietary and Confidential.ForWillis Towers Watson and Willis Towers Watson client use only. 28
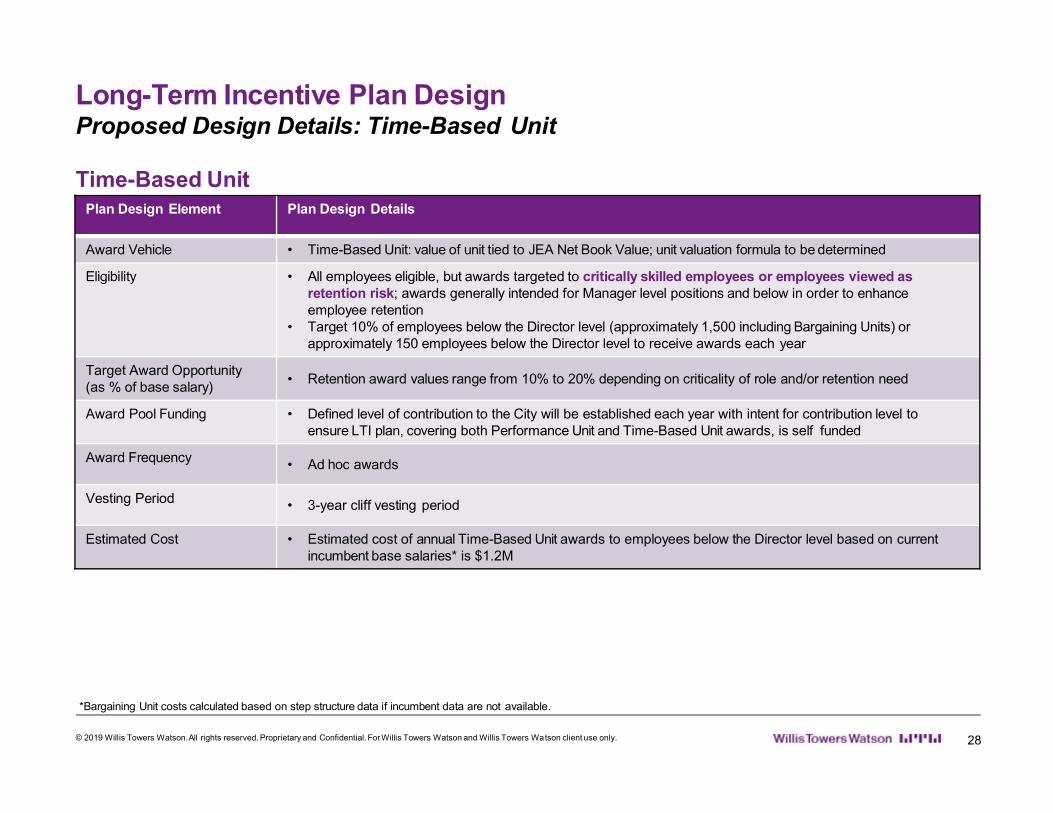
Proposed Design Details: Time-Based Unit
Time-Based UnitPlan Design Element Plan Design Details
Award Vehicle • Time-Based Unit: value of unit tied to JEA Net Book Value; unit valuation formula to be determined
Eligibility • All employees eligible, but awards targeted to critically skilled employees or employees viewed as retention risk; awards generally intended for Manager level positions and below in order to enhance employee retention
• Target 10% of employees below the Director level (approximately 1,500 including Bargaining Units) or approximately 150 employees below the Director level to receive awards each year
Target Award Opportunity(as % of base salary)
• Retention award values range from 10% to 20% depending on criticality of role and/or retention need
Award Pool Funding • Defined level of contribution to the City will be established each year with intent for contribution level toensure LTI plan, covering both Performance Unit and Time-Based Unit awards, is self funded
Award Frequency • Ad hoc awards
Vesting Period • 3-year cliff vesting period
Estimated Cost • Estimated cost of annual Time-Based Unit awards to employees below the Director level based on currentincumbent base salaries* is $1.2M
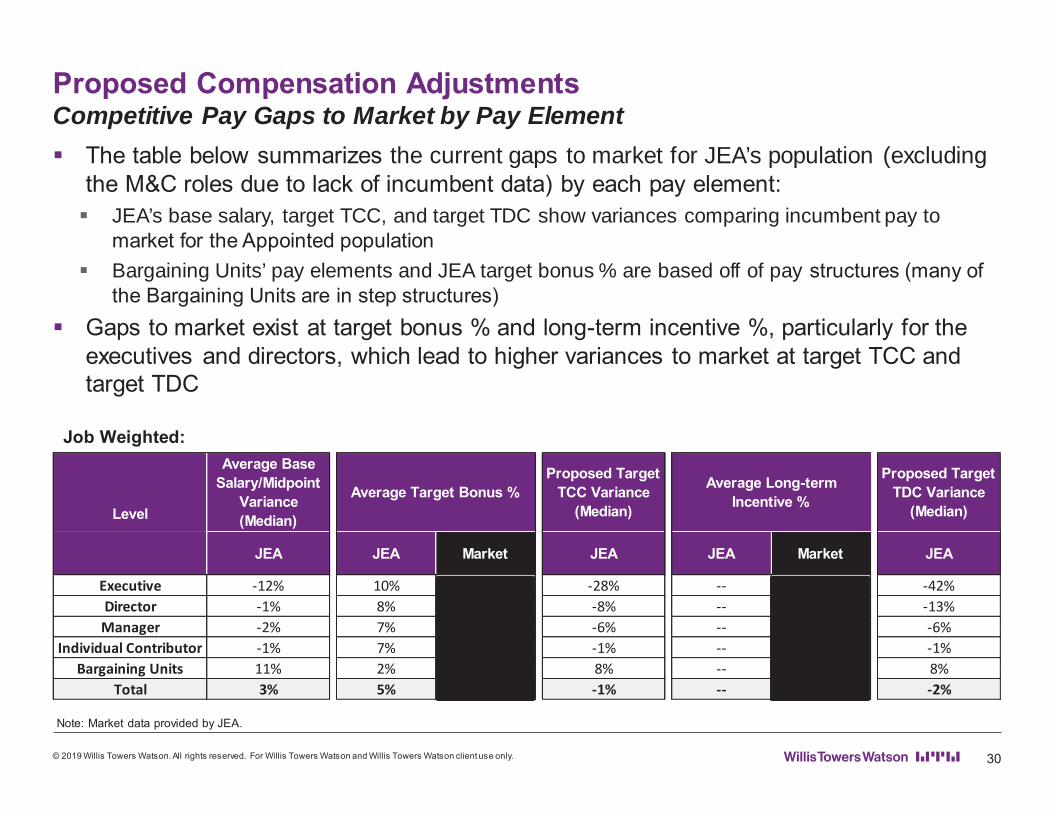
Proposed Compensation AdjustmentsCompetitive Pay Gaps to Market by Pay Element
The table below summarizes the current gaps to market for JEA’s population (excluding the M&C roles due to lack of incumbent data) by each pay element:
JEA’s base salary, target TCC, and target TDC show variances comparing incumbent pay to market for the Appointed population
Bargaining Units’ pay elements and JEA target bonus % are based off of pay structures (many of the Bargaining Units are in step structures)
Gaps to market exist at target bonus % and long-term incentive %, particularly for the executives and directors, which lead to higher variances to market at target TCC and target TDC
Job Weighted:
30
Note: Market data provided by JEA.
Average Base Salary/Midpoint
Variance (Median)
Proposed Target TCC Variance
(Median)
Proposed Target TDC Variance
(Median)
JEA JEA Market JEA JEA Market JEA
Executive -12% 10% 43% -28% -- 40% -42%Director -1% 8% 18% -8% -- 8% -13%Manager -2% 7% 13% -6% -- -- -6%
Individual Contributor -1% 7% 10% -1% -- -- -1%Bargaining Units 11% 2% 7% 8% -- -- 8%
Total 3% 5% 12% -1% -- 19% -2%
Level
Average Target Bonus %Average Long-term
Incentive %
© 2019 Willis Towers Watson. All rights reserved. For Willis Towers Watson and Willis Towers Watson client use only.
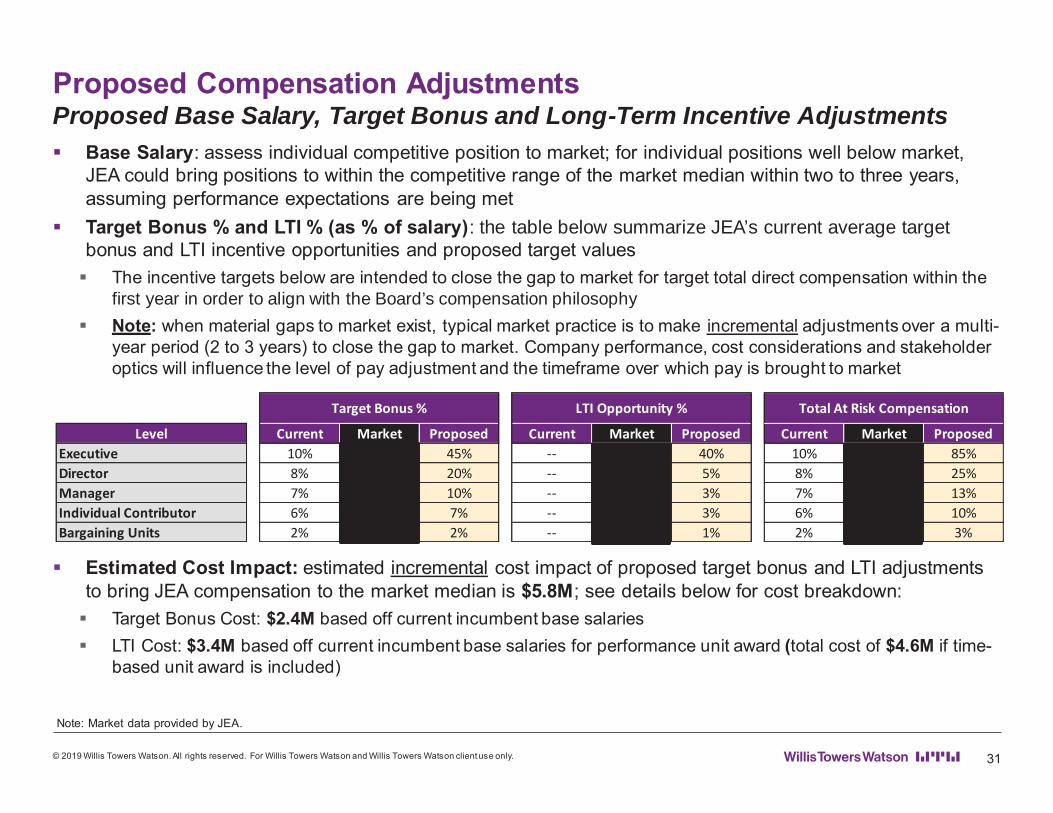
Proposed Compensation AdjustmentsProposed Base Salary, Target Bonus and Long-Term Incentive Adjustments
Base Salary: assess individual competitive position to market; for individual positions well below market, JEA could bring positions to within the competitive range of the market median within two to three years, assuming performance expectations are being met
Target Bonus % and LTI % (as % of salary): the table below summarize JEA’s current average target bonus and LTI incentive opportunities and proposed target values
The incentive targets below are intended to close the gap to market for target total direct compensation within the first year in order to align with the Board’s compensation philosophyNote: when material gaps to market exist, typical market practice is to make incremental adjustments over a multi-year period (2 to 3 years) to close the gap to market. Company performance, cost considerations and stakeholder optics will influence the level of pay adjustment and the timeframe over which pay is brought to market
Estimated Cost Impact: estimated incremental cost impact of proposed target bonus and LTI adjustments to bring JEA compensation to the market median is $5.8M; see details below for cost breakdown:
Target Bonus Cost: $2.4M based off current incumbent base salaries
LTI Cost: $3.4M based off current incumbent base salaries for performance unit award (total cost of $4.6M if time-based unit award is included)
31
Note: Market data provided by JEA.
Level Current Market Proposed Current Market Proposed Current Market ProposedExecutive 10% 43% 45% -- 40% 40% 10% 83% 85%Director 8% 18% 20% -- 8% 5% 8% 26% 25%Manager 7% 13% 10% -- -- 3% 7% 13% 13%Individual Contributor 6% 10% 7% -- -- 3% 6% 10% 10%Bargaining Units 2% 7% 2% -- -- 1% 2% 7% 3%
Total At Risk CompensationTarget Bonus % LTI Opportunity %
© 2019 Willis Towers Watson. All rights reserved. For Willis Towers Watson and Willis Towers Watson client use only.
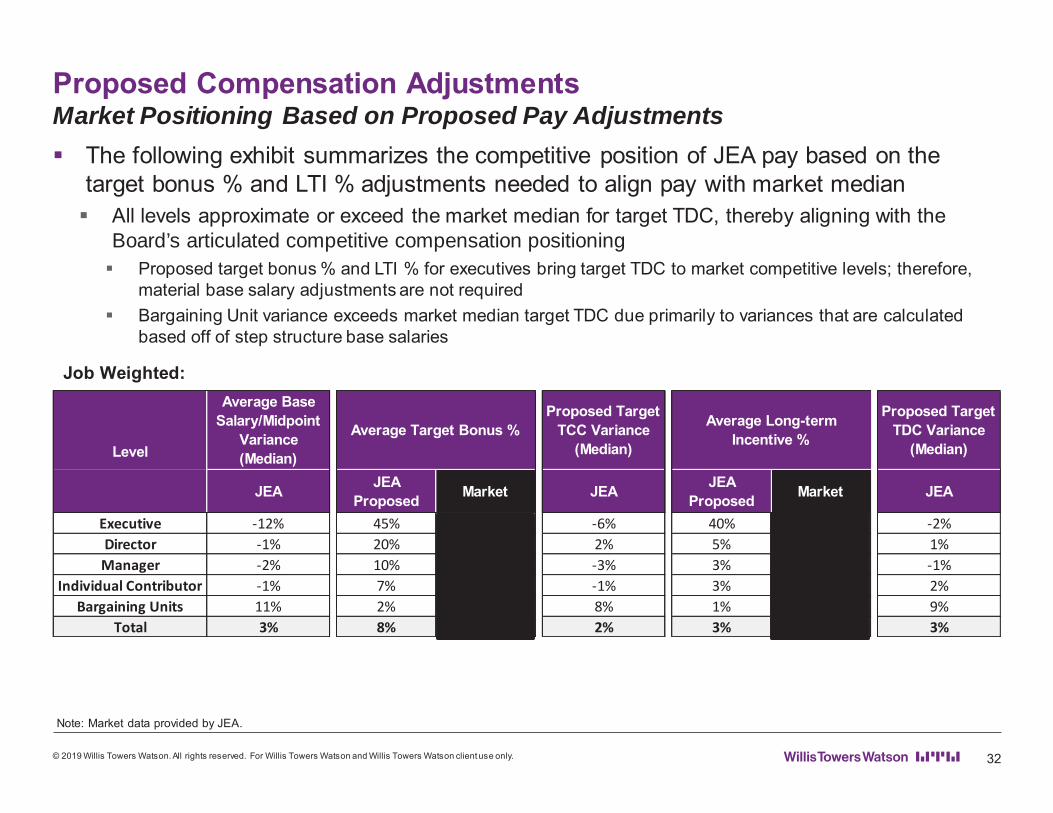
Proposed Compensation Adjustments Market Positioning Based on Proposed Pay Adjustments
The following exhibit summarizes the competitive position of JEA pay based on the target bonus % and LTI % adjustments needed to align pay with market median
All levels approximate or exceed the market median for target TDC, thereby aligning with the Board’s articulated competitive compensation positioning
Proposed target bonus % and LTI % for executives bring target TDC to market competitive levels; therefore, material base salary adjustments are not required
Bargaining Unit variance exceeds market median target TDC due primarily to variances that are calculated based off of step structure base salaries
Job Weighted:
32
Note: Market data provided by JEA.
Average Base Salary/Midpoint
Variance (Median)
Proposed Target TCC Variance
(Median)
Proposed Target TDC Variance
(Median)
JEAJEA
ProposedMarket JEA
JEA Proposed
Market JEA
Executive -12% 45% 43% -6% 40% 40% -2%Director -1% 20% 18% 2% 5% 8% 1%Manager -2% 10% 13% -3% 3% -- -1%
Individual Contributor -1% 7% 10% -1% 3% -- 2%Bargaining Units 11% 2% 7% 8% 1% -- 9%
Total 3% 8% 12% 2% 3% 19% 3%
Level
Average Target Bonus %Average Long-term
Incentive %
© 2019 Willis Towers Watson. All rights reserved. For Willis Towers Watson and Willis Towers Watson client use only.
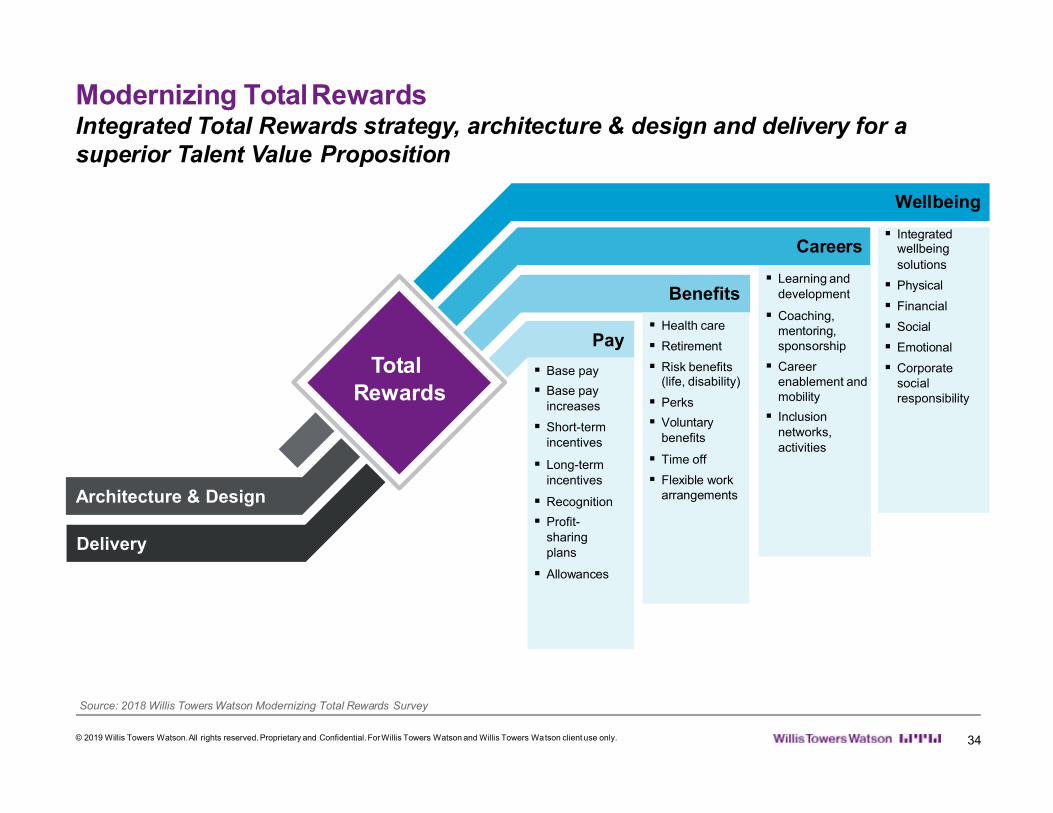
Modernizing TotalRewards
Total Rewards
Careers
Benefits
Pay
Delivery
Architecture & Design
Integrated Total Rewards strategy, architecture & design and delivery for asuperior Talent Value Proposition
Wellbeing
ß Base pay
ß Base pay increases
ß Short-term incentives
ß Long-term incentives
ß Recognition
ß Profit-sharing plans
ß Allowances
ß Health care
ß Retirement
ß Risk benefits
© 2019 Willis Towers Watson.All rights reserved. Proprietary and Confidential.ForWillis Towers Watson and Willis Towers Watson client use only. 34
(life, disability)
ß Perks
ß Voluntarybenefits
ß Time off
ß Flexible workarrangements
ß Learning and development
ß Coaching, mentoring, sponsorship
ß Career enablement and mobility
ß Inclusion networks, activities
ß Integratedwellbeingsolutions
ß Physical
ß Financial
ß Social
ß Emotional
ß Corporate social responsibility
Source: 2018 Willis Towers Watson Modernizing Total Rewards Survey
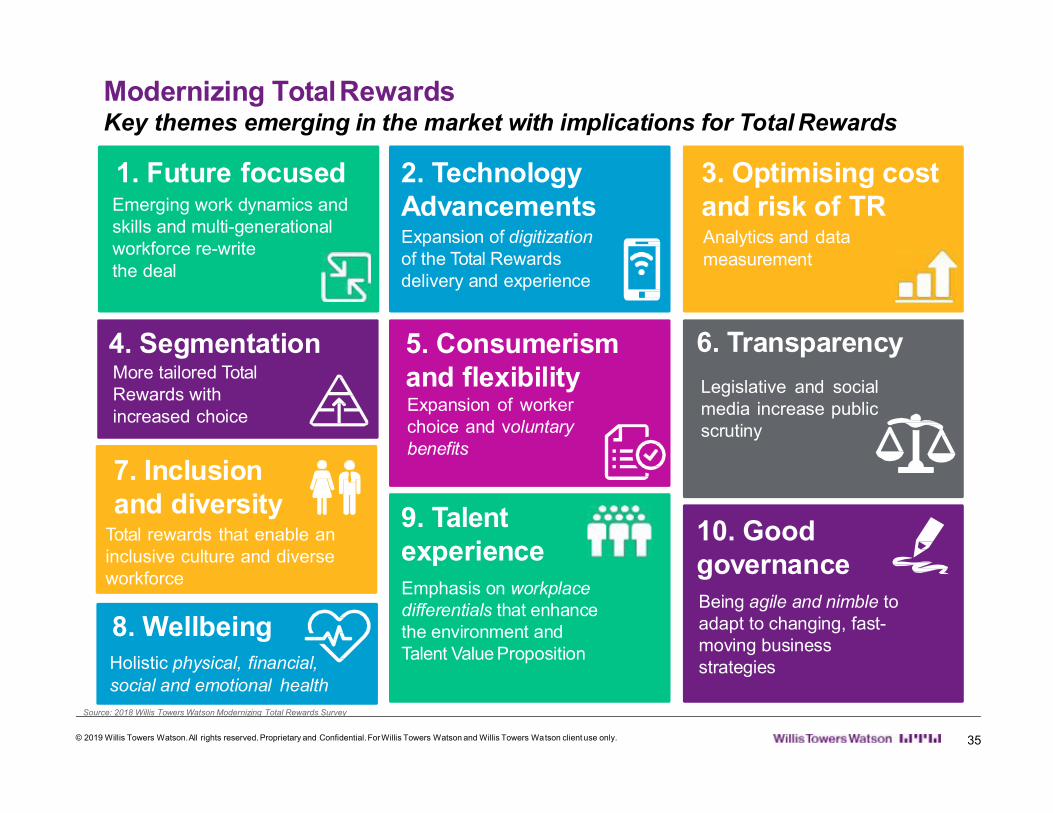
Modernizing TotalRewardsKey themes emerging in the market with implications for Total Rewards
7. Inclusion
1. Future focusedEmerging work dynamics and skills and multi-generational workforce re-writethe deal
2. Technology AdvancementsExpansion of digitization of the Total Rewards delivery and experience
3. Optimising cost and risk of TRAnalytics and datameasurement
4. SegmentationMore tailored Total Rewards with increased choice
8. WellbeingHolistic physical, financial,social and emotional health
5. Consumerismand flexibilityExpansion of workerchoice and voluntarybenefits
6. Transparency
Legislative and socialmedia increase publicscrutiny
and diversityTotal rewards that enable aninclusive culture and diverseworkforce
9. Talent experienceEmphasis on workplace differentials that enhance the environment and Talent Value Proposition
10. Good governanceBeing agile and nimble to adapt to changing, fast-moving business strategies
Source: 2018 Willis Towers Watson Modernizing Total Rewards Survey
© 2019 Willis Towers Watson.All rights reserved. Proprietary and Confidential.ForWillis Towers Watson and Willis Towers Watson client use only. 35
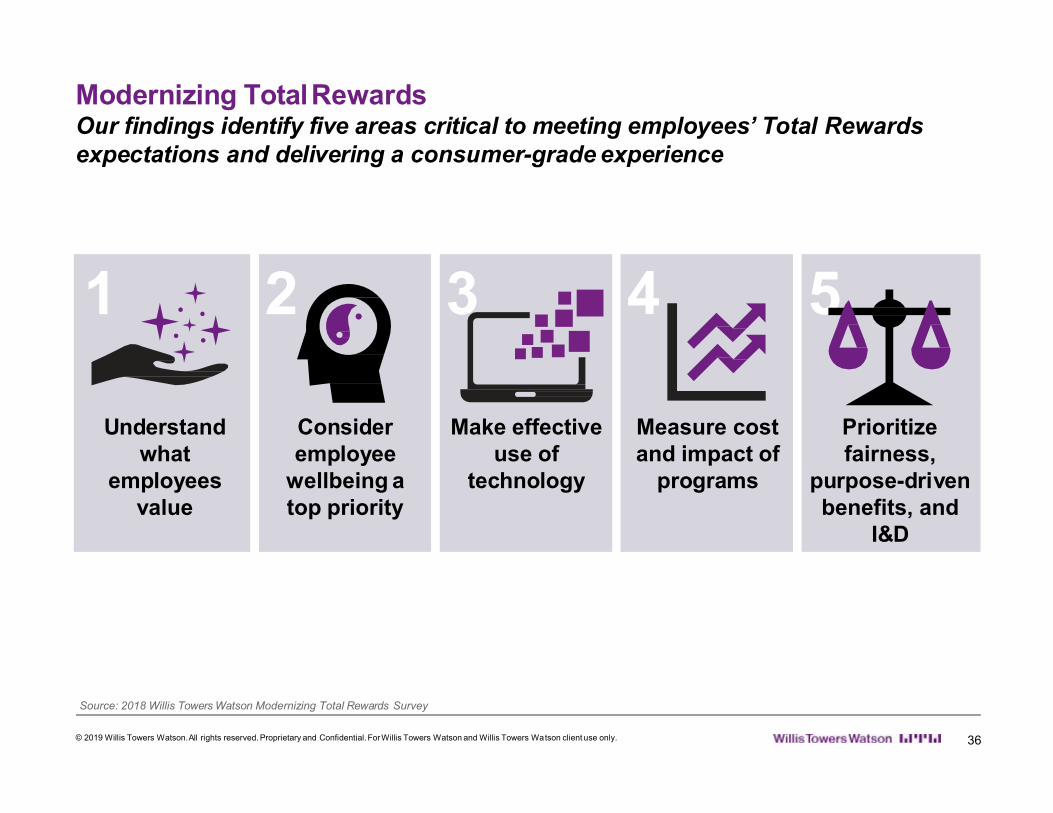
Modernizing TotalRewardsOur findings identify five areas critical to meeting employees’ Total Rewardsexpectations and delivering a consumer-grade experience
1 2 3 4 5
Understand what
employees value
Consider employee
wellbeing a top priority
Make effective use of
technology
Measure cost and impact of
programs
Prioritize fairness,
purpose-driven benefits, and
I&D
Source: 2018 Willis Towers Watson Modernizing Total Rewards Survey
© 2019 Willis Towers Watson.All rights reserved. Proprietary and Confidential.ForWillis Towers Watson and Willis Towers Watson client use only. 36
Recommended