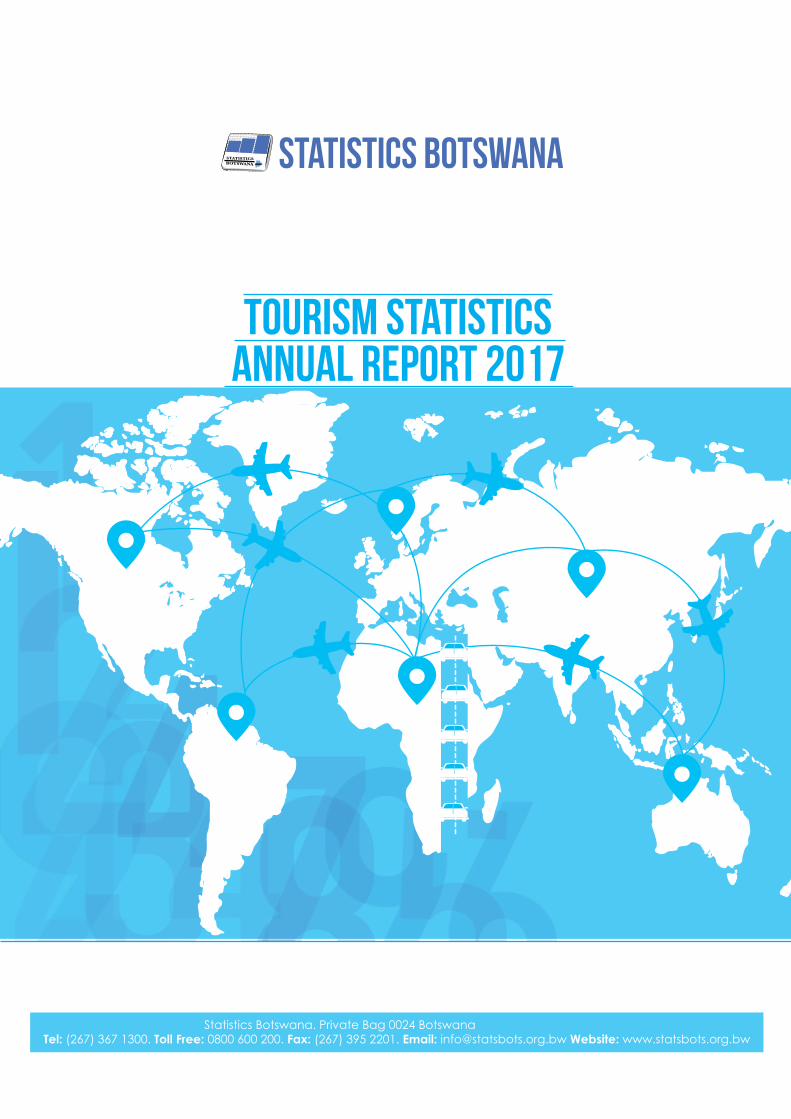
ANNUAL REPORT 2017TOURISM STATISTICS
Statistics Botswana. Private Bag 0024 BotswanaTel: (267) 367 1300. Toll Free: 0800 600 200. Fax: (267) 395 2201. Email: [email protected] Website: www.statsbots.org.bw
-----------------------------
Tourism Statistics Annual Report 20172
TOURISM STATISTICS ANNUAL REPORT 2017
Tourism Statistics Annual Report 2017 3
TOURISM STATISTICS ANNUAL REPORT 2017
Published by
Statistics Botswana, Private Bag 0024, GaboroneTel: (267) 3671300Fax: (267) 3952201
E-mail: [email protected]: www.statsbots.org.bw
ISBN: 978-99968-458-4-0
COPYRIGHT RESERVEDExtracts may be published if source is duly acknowledged.
Tourism Statistics Annual Report 20174
PREFACE
This tourism annual report provides the latest statistics on both visitors and non-visitors during 2017 and follows the 2016 report released in September 2018.
The information contained in this publication is compiled from completed immigration embarkation forms. International travelers entering and leaving the country are required to complete embarkation forms at all gazetted points of entry/departure. This covers all land borders as well as airports.
Users who require more information can contact the Directorate of Stakeholder Relations on 3671300. All Statistics Botswana outputs/publications are available on the website at www.statsbots.org.bw and at the Statistics Botswana Information Resource Centre (Head-Office, Gaborone).
I sincerely thank all stakeholders involved in the formulation of this report, particularly the Department of Immigration and Citizenship for the administrative data used to compile this Tourism Statistics Annual Report. I also thank all other stakeholders for their continued support as we strive to better serve users of our services.
……………………….Dr Burton S. MguniStatistician General March 2019
Tourism Statistics Annual Report 2017 5
TABLE OF CONTENTS
PREFACE .........................................................................................................................................................................4
List of Tables ...................................................................................................................................................................6
List of Figures ..................................................................................................................................................................6
Executive Summary .......................................................................................................................................................7
1.0 Introduction and Background ........................................................................................................................8 1.1 Introduction………………………………………………………………………………………………………......8
1.1.1 Arrangement of Report.………………………………………………………………………………….........8 1.1.2 Limitations of the Report…………….…………………………………………………………………...........81.2 Background…………………………………………………………………………………………………………..8
2.0 International Tourist Arrivals ...........................................................................................................................92.1 Tourists by Country and Region of Residence ........................................................................................92.2 Top Ten Leading Overseas Countries ......................................................................................................9 2.3 Top Ten Leading SADC Countries ..........................................................................................................112.4 Tourists by Purpose of Entry .....................................................................................................................12
2.5 Tourists by Mode of Arrival……………………………………………………………………………................12 2.6 Tourists by Month of Arrival.……………………………………………………………………………...............13
2.7 Tourists by Age Distribution ......................................................................................................................142.8 Tourists by Sex Distribution .......................................................................................................................15
2.9 Tourists by Sex and Purpose of Entry…………………………………………………………………...............15
3.0 Overall Travelers (Arrivals and Departures)…………………………………………………………....................17 3.1 Purpose of Entry…………………………………..…………………………………………………………..........17
3.2 Month of Arrival and Departure………………………………………………………………………..............18 3.3 Mode of Travel .........................................................................................................................................19
3.4 Age Group ................................................................................................................................................20 3.5 Nationality .................................................................................................................................................203.6 Border Posts ...............................................................................................................................................21
4.0 Technical Notes ............................................................................................................................................224.1 Data Source and Methodology .............................................................................................................22
4.2 Definitions of Terms ……………………………………………………………………………………….............22
5.0 Appendices ...................................................................................................................................................24
Tourism Statistics Annual Report 20176
List of Tables
Table 1: Top Ten Overseas Countries by Type and Country of Residence, 2017 ..............................................10Table 2: Top Ten SADC Countries by Type of Tourist and Country of Residence, 2017 ....................................11Table 3: Distribution of Tourists by Type and Purpose of Entry, 2017 ....................................................................12Table 4: Distribution of Tourists by Mode of Travel and Purpose of Entry, 2017 ..................................................13Table 5: Number of Tourists by Age Group, 2017 ..................................................................................................14Table 6: Number of Tourists by Sex and Purpose of Entry, 2017 ...........................................................................15Table 7: Distribution of Arrivals and Departures by Mode of Travel, 2017 ..........................................................19
List of Figures
Figure 1: Distribution of Tourists from Leading Overseas Countries, 2017……………………….............................10Figure 2: Distribution of Tourists from Leading SADC Countries, 2017………………..………….............................11Figure 3: Number of Tourists by Month of Arrival, 2017………………………………………………….......................13Figure 4: Percentage Distribution of Tourists by Age Group, 2017 ......................................................................14Figure 5: Percentage Distribution of Tourists by Sex, 2017 ....................................................................................15Figure 6: Distribution of Tourists by Sex and Purpose of Entry, 2017 .....................................................................16Figure 7: Total Number of Arrivals and Departures from 2005 to 2017 ...............................................................17Figure 8: Percentage Distribution of Arrivals by Purpose of Entry, 2017 ..............................................................18Figure 9: Arrivals and Departures by Month 2017 .................................................................................................18Figure 10: Distribution of Arrivals/ Departures by Age Group, 2017 ....................................................................20Figure 11: Ten Busiest Border Posts, 2017 ................................................................................................................21
Tourism Statistics Annual Report 2017 7
EXECUTIVE SUMMARY
Tourists refer to both same day visitors and overnight tourists. In 2017, the country received a total of 1, 774, 960 visitors, with 91.4 percent attributable to tourists (overnight visitors) while same day visitors accounted for 8.6 percent (152, 372). An increase of 3.7 percent was recorded for the numbers of visitors during 2017. Visitors from Zimbabwe account for 33.4 percent while those from South Africa represented 32.9 percent of total visitors during the year.
Tourists from the top ten overseas countries accounted for 11.4 percent of total tourists during the year. Tourists who came for “Holiday” accounted for 28.3 percent of total tourists during 2017, while those who came for “Business” and “Visiting Friends & Relatives” (VFR) represented 23.2 percent and 22.5 percent respectively. Tourists who entered the country by air represented 6.7 percent of total tourists during the year. Among the tourists who came by air, Sir Seretse Khama International Airport accounted for 54.4 percent while those who entered through Maun Airport represented 29.9 percent.
December was the most popular month of arrival for tourists during 2017, with 11.0 percent, followed by July and August at 9.8 percent and 9.5 percent respectively. Ages ranging from 25 to 44 years combined, accounted for 53.1 percent of total tourists during the year.
A figure of 2, 305,205 was recorded for all arrivals while 2, 308,137 was recorded for all departures during 2017. Travellers in transit accounted for 26.2 percent of all arrivals, followed by those that came in for Holiday at 21.8 percent. Zimbabwe nationals accounted for 35.0 percent of arrivals and 35.9 percent of departures during the year under review. Arrivals of South African nationality accounted for 30.6 percent while departures represented 30.3 percent of all departures during 2017.
Ramokgwebana Border Post was the busiest during 2017, having received 21.9 percent of all arrivals while 19.9 percent of all departures went out through the same border post.
Tourism Statistics Annual Report 20178
CHAPTER 1: INTRODUCTION AND BACKGROUND
1.1 Introduction
This report presents the most recent statistics on arrivals and departures during 2017. The report is categorised into two parts, the first part giving information on tourists only while the second part presents information on all arrivals and departures during the year under review.
1.1.1 Arrangement of the Report
This report categorises the travellers into two parts. The first part presents characteristics of visitors in Chapter 2. The second part, presented in Chapter 3 focuses on all travellers entering and departing the country. Chapter 4 gives Sources and Methods and definitions of terms used in the report, while Chapter 5 contains appendices, consisting of main tables on which smaller tables and graphs, included in the body of the report are based.
1.1.2 Limitations of the Report
The focus of data collected is currently on non-citizens (temporary residents and foreign nationals) only. This report does not provide inbound and outbound data on citizens. As a consequence of having both automated and non-automated border posts in operation, it is not possible to calculate the actual length of stay of visitors even though data on the amount of time (days) granted is captured in the Immigration Entry/Departure forms. As people can enter the country through an automated border post but depart through a non-automated border post, this makes it difficult to calculate the actual length of stay in the country as data from automated and non-automated borders cannot be reconciled.
1.2 Background
The Tourism statistics report is an annual publication that depicts the statistics of non-citizens including temporary residents entering and leaving the country. The common terms used for these are Arrivals and Departures.
The statistics carried in this report include Arrivals and Departures of visitors and non-visitors by country and region of nationality, residence, purpose of entry, mode of travel used, point of entry and exit as well as gender and age distribution. The information contained in this report is derived from the Department of Immigration and Citizenship Arrival/Departure forms, which are completed by non-citizens at points of entry and exit.
The Department of Immigration and Citizenship has automated the busiest border posts and is therefore able to provide Statistics Botswana with data electronically. These borders account for over 90 percent of all inbound and outbound travellers.
Forms from the non-automated borders are captured by Statistics Botswana and the information is then merged with that from the automated borders before analysis. Botswana citizens are exempted from completing the immigration Entry/Departure forms. The figures on Arrivals and Departures contained in this publication therefore only cover non-citizens, both visitors and temporary residents of Botswana. However, with the increasing demand for statistics on outbound travellers, including information on citizens, it will be necessary to collect and compile data on citizens in future.
Tourism Statistics Annual Report 2017 9
CHAPTER 2: TOURISTS
This chapter gives information on inbound visitors who came into the country in 2017. These visitors are classified into same-day visitors and tourists. Same-day visitors are mostly excursionists who take a trip that does not include an overnight stay at their destination, while tourists (overnight) represents visitors who spend at least a night at the country being visited. The chapter details statistics compiled according to country and region of residence, purpose of visit, mode of travel, month of visit, point of entry as well as the demographic characteristics of the visitor.
In compilation of this report, half of transit travellers are regarded as visitors. This is taking into consideration the fact that some of these transit travellers end up having expenditure in the country as they are transiting. This expenditure may be incurred through having to spend a night in the country and/or any other expenditure. As a result, tourist statistics discussed here includes half of transit travellers. The country of residence as opposed to nationality, is used as reference when compiling tourist statistics.
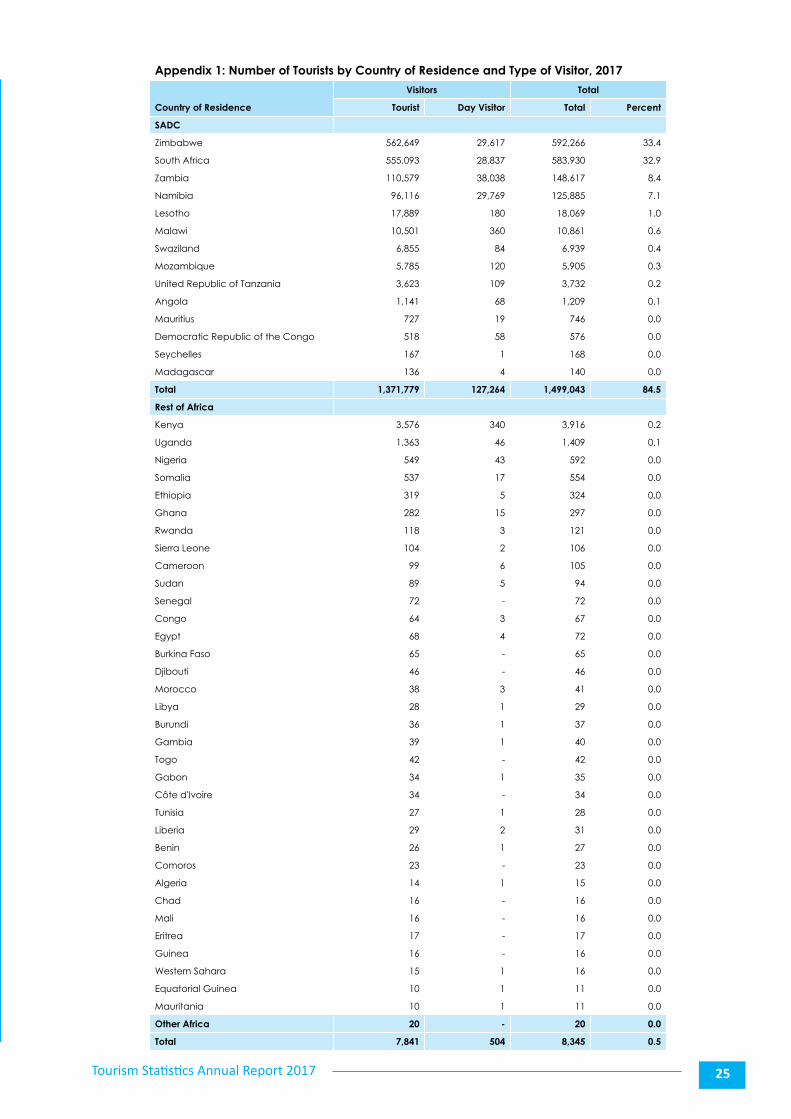
2.1 Tourists by Country and Region of Residence
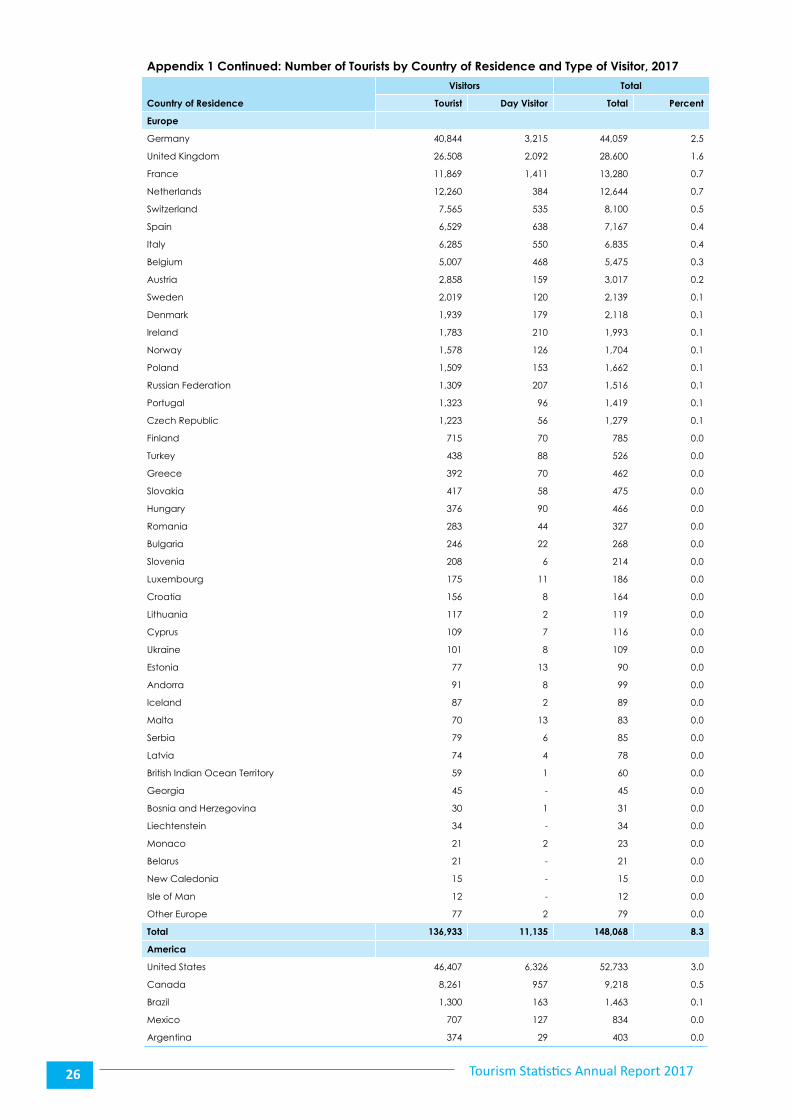
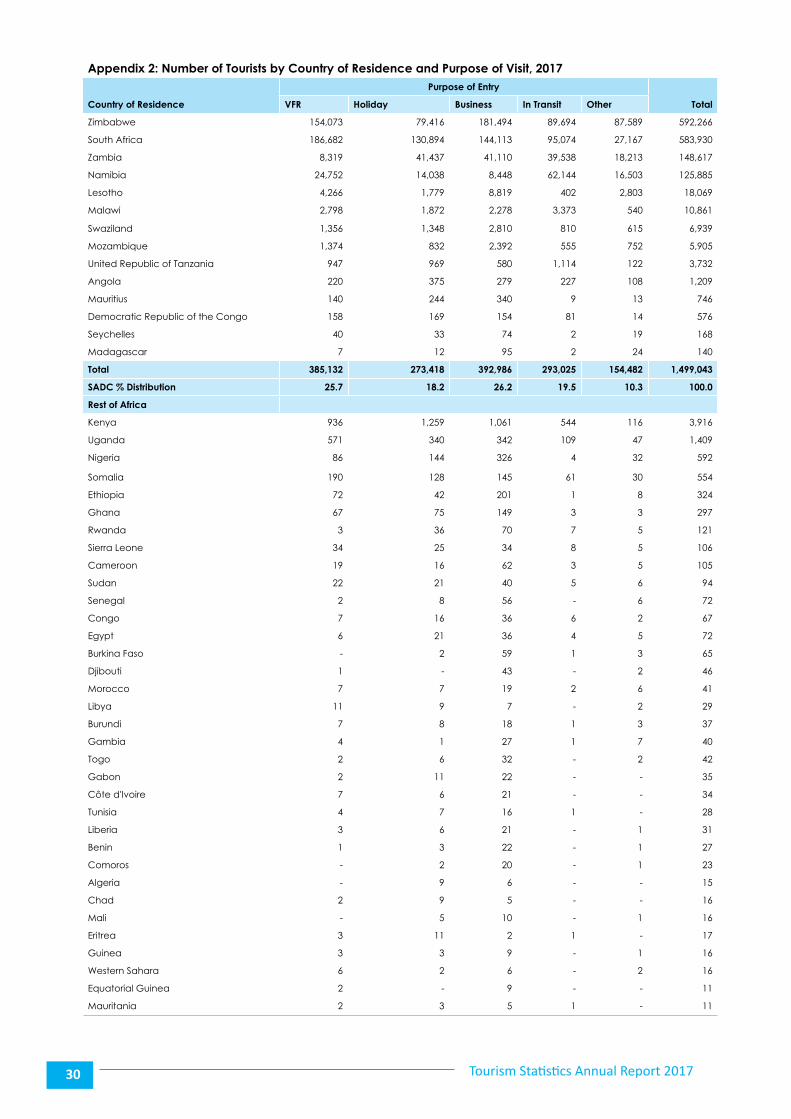
Appendices 1 and 2 are dedicated to tourists only. Appendix 1 gives both overnight tourists and same day tourists by country of residence as well as percentage distributions of total tourists at country level. Appendix 2 presents tourists by Country of Residence as well as Purpose of Visit.
During 2017, Botswana received a total of 1,774,960 visitors, with 91.4 percent (1,622,588) accounted for by tourists (overnight visitors) while 8.6 percent (152,372) was attributed to same-day visitors. The total number of tourists shows a 3.7 percent (62,726) increase compared to 1,712,234 during the previous year. As can be seen from Appendices 1 and 2, most visitors came from Zimbabwe and South Africa, with the two countries contributing 33.4 percent (592,226) and 32.9 percent (583,930) respectively, of the total visitors during the year. The majority of tourists, 84.5 percent (1,499,043), reside in the SADC Region.
2.2 Top Ten Leading Overseas Countries
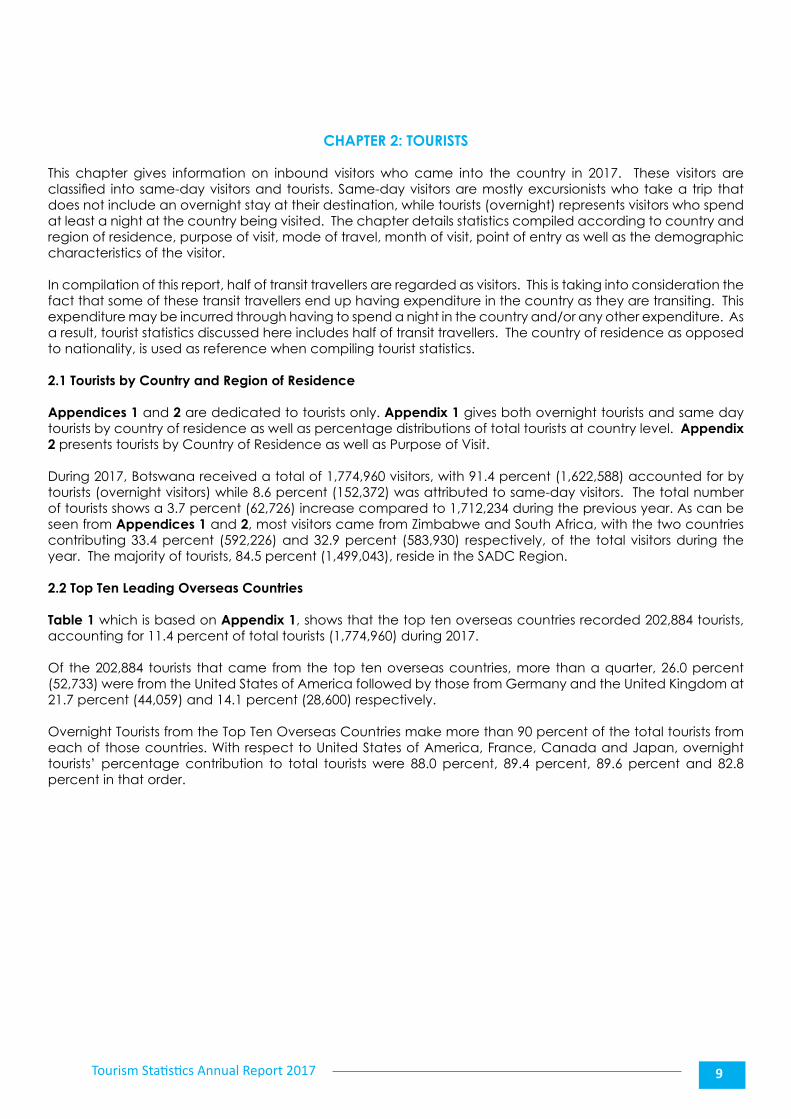
Table 1 which is based on Appendix 1, shows that the top ten overseas countries recorded 202,884 tourists, accounting for 11.4 percent of total tourists (1,774,960) during 2017.
Of the 202,884 tourists that came from the top ten overseas countries, more than a quarter, 26.0 percent (52,733) were from the United States of America followed by those from Germany and the United Kingdom at 21.7 percent (44,059) and 14.1 percent (28,600) respectively.
Overnight Tourists from the Top Ten Overseas Countries make more than 90 percent of the total tourists from each of those countries. With respect to United States of America, France, Canada and Japan, overnight tourists’ percentage contribution to total tourists were 88.0 percent, 89.4 percent, 89.6 percent and 82.8 percent in that order.
Tourism Statistics Annual Report 201710
Figure 1, which is based on Table 1 and Appendix 1, show that most overnight tourists from the top ten overseas countries came from the United States of America followed by Germany and the United Kingdom.
Table 1: Top Ten Overseas Countries by Type and Country of Residence, 2017
Country of Residence
Tourists (Overnight) Total
Overnight Day Visitors Total Percentage
United States 46 407 6 326 52 733 26.0
Germany 40 844 3 215 44 059 21.7
United Kingdom 26 508 2 092 28 600 14.1
Australia 16 203 1 767 17 970 8.9
France 11 869 1 411 13 280 6.5
Netherlands 12 260 384 12 644 6.2
Canada 8 261 957 9 218 4.5
Japan 7 549 1 564 9 113 4.5
Switzerland 7 565 535 8 100 4.0
Spain 6 529 638 7 167 3.5
Total 183 995 18 889 202 884 100.0
All other Countries 1 414 265 130 228 1 572 076
Grand Total 1 598 260 149 117 1 774 960
Figure 1: Distribution of Tourists from Top Ten Overseas Countries, 2017 in Thousands
- 5.0
10.0 15.0 20.0 25.0 30.0 35.0 40.0 45.0 50.0
UnitedStates
Germany UnitedKingdom
Australia France Netherlands
Canada Japan Switzerland
Spain
Overnight 46.4 40.8 26.5 16.2 11.9 12.3 8.3 7.5 7.6 6.5Day Visitors 6.3 3.2 2.1 1.8 1.4 0.4 1.0 1.6 0.5 0.6
Num
ber o
f Tou
rists
('0
00)
Country of Residence
Tourism Statistics Annual Report 2017 11
2.3 Top Ten Leading SADC Countries
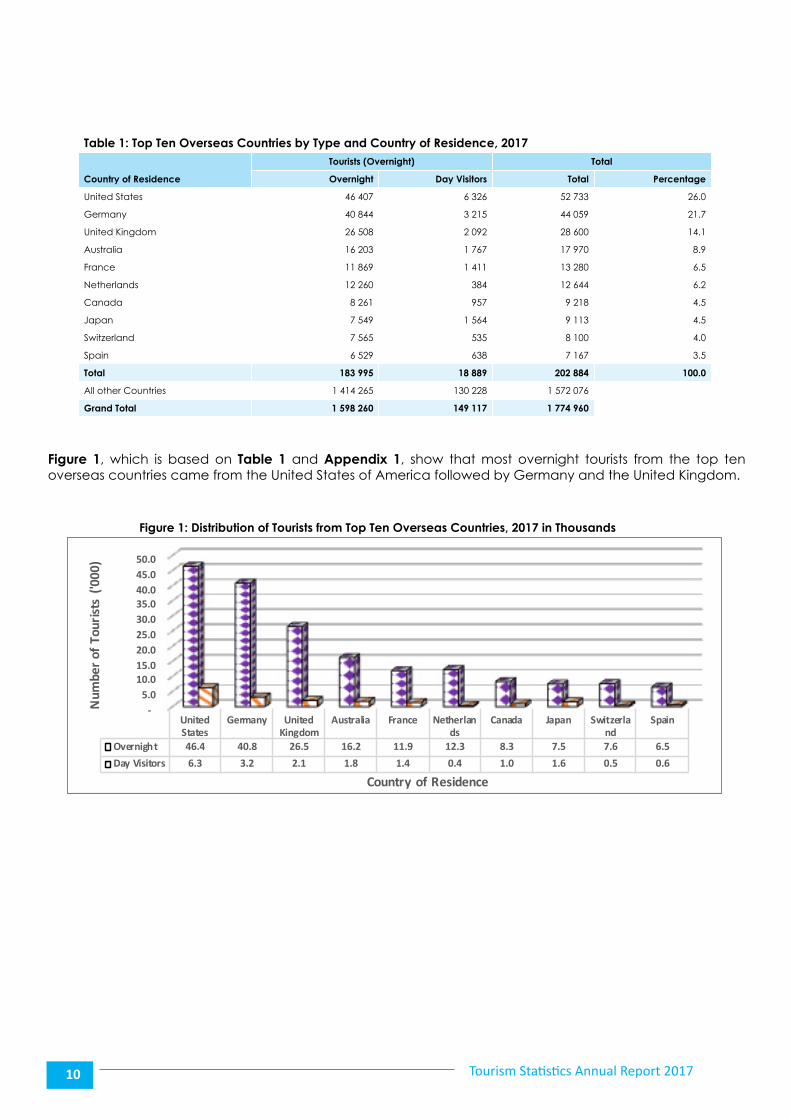
Figure 2 and Table 2 show the top ten SADC countries that provided Botswana with tourists during 2017. Tourists residing in the top ten countries of the SADC region make up 84.4 percent (1,497,413) of the total tourists during the year under review. This shows a decrease of 2.9 percentage points as compared to the region’s contribution of 87.3 percent during the previous year. Zimbabwe and South Africa were the major contributors at 39.6 percent (592,266) and 39.0 percent (583,930) respectively. Other countries can be observed on Table 2 and Figure 2.
Overnight Tourists constituted at least 90 percent of total tourists at country level for the top ten SADC countries, with the exception of Zambia and Namibia. Day trippers from Zambia and Namibia respectively accounted for 29.9 percent (38, 038) and 23.4 percent (29, 769) of all day trippers from the ten leading SADC countries.
Table 2: Top Ten Leading SADC Countries by Type of Tourist and Country of Residence, 2017.
Country of Residence
Type of Tourist Total
Overnight Tourists Same Day Number Percentage
Zimbabwe 562 649 29 617 592 266 39.6
South Africa 555 093 28 837 583 930 39.0
Zambia 110 579 38 038 148 617 9.9
Namibia 96 116 29 769 125 885 8.4
Lesotho 17 889 180 18 069 1.2
Malawi 10 501 360 10 861 0.7
Swaziland 6 855 84 6 939 0.5
Mozambique 5 785 120 5 905 0.4
Tanzania 3 623 109 3 732 0.2
Angola 1 141 68 1 209 0.1
Total 1 370 231 127 182 1 497 413 100.0
All other Countries 252 357 25 190 277 547
Grand Total 1 622 588 152 372 1 774 960
Figure 2: Distribution of Tourists from leading SADC Countries, 2017 in Thousands
-
100.0
200.0
300.0
400.0
500.0
600.0
Zimbabwe
SouthAfrica
Zambia Namibia
Lesotho Malawi Swaziland
Mozambique
Tanzania
Angola
Overnight 562.6 555.1 110.6 96.1 17.9 10.5 6.9 5.8 3.6 1.1Day Visitors 29.6 28.8 38.0 29.8 0.2 0.4 0.1 0.1 0.1 0.1
Num
ber o
f Tou
rists
('00
0)
Country of Residence
Tourism Statistics Annual Report 201712
2.4 Tourists by Purpose of Entry
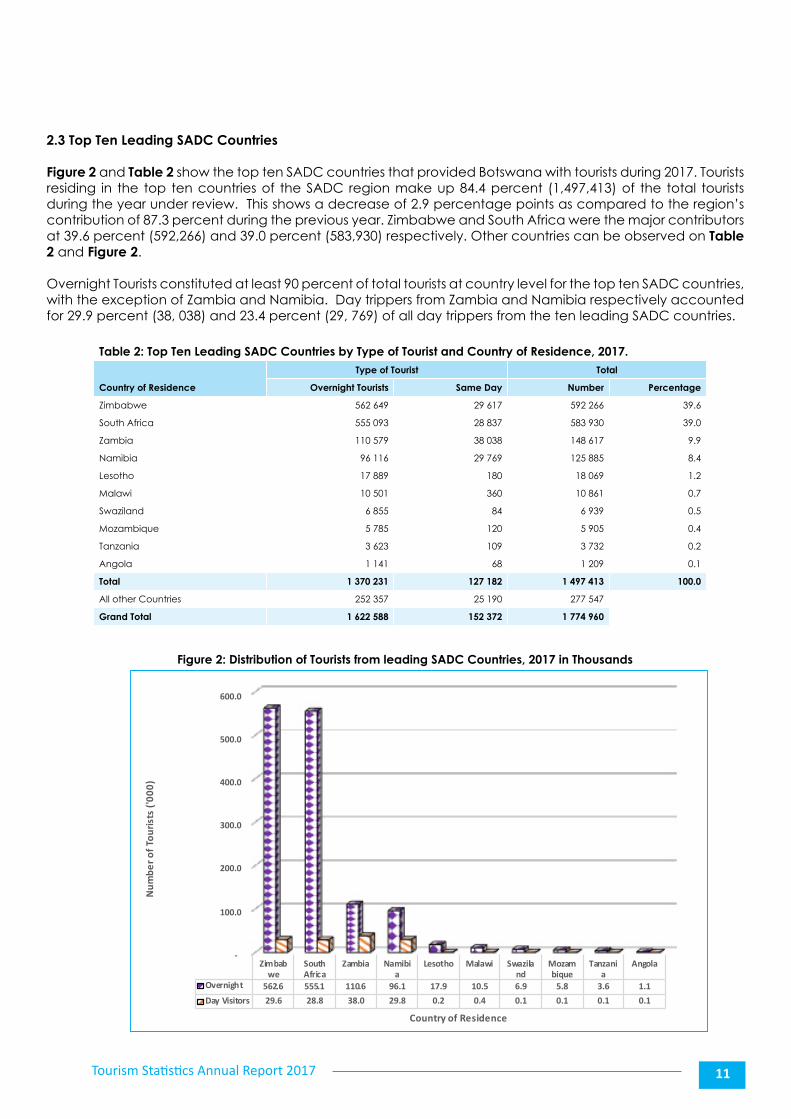
Table 3 presents the number of tourists by purpose of entry as well as associated percentage distributions. Compared to the previous year, 2017 recorded an increase of 3.7 percent (62, 726) in the total number of tourists, from 1,712,234 during 2016 to 1,774,960 currently. A significant increase in purpose of entry was observed for those on ‘Holiday’, at 81.8 percent (225, 992) from 276, 317 in 2016 to 502,309 currently. Decreases were recorded for ‘Visiting Friends & Relatives’ and Business at 23.5 percent (93, 709) from 492, 377 to 398, 668 and 21.4 percent (112, 117) from 524, 097 to 411, 980 respectively, when comparing situations in 2016 and 2017.
There has been an increase in the number of tourists who came for purposes of “Religious, Conferencing, Sports, Medical & Shopping activities” which are grouped together under one category called ‘Other’ Purposes. The number of tourists has increased two fold from 63, 007 in 2016 to 156, 756 in 2017. These tourists represented 8.8 percent of all tourists who came to Botswana during the year under review. In 2017 most of the Tourists came for Holiday at 28.3 percent (502, 309) followed by those who were on Business at 23.2 percent (411, 980).
2.5 Tourists by Mode of Arrival
Table 4 presents tourists by mode of travel. There are mainly three modes of travel used in Botswana; these being Road, Rail and Air. Air Travel is presented by major Airports, with Airstrips grouped together under one category called ‘Other”. Percentages distributions for type of tourist by airport are calculated as a percentage of the total for individual type of tourist by air, while percentages for type of tourist by Air and Road are calculated as a percentage of the overall total of tourists.
Road accounted for the highest percentage of tourist who came into the country at 93.3 percent (1,655,489), followed by those who flew-in at 6.7 percent (119,409). Air travel showed a slight decline of 0.1 percent (137) from 119, 546 in 2016 to 119,409 currently. Rail Travel recorded 62 tourist arrivals compared to 52 arrivals in 2016.A total of 119, 409 tourists came by air transport representing 6.7 percent of all tourists. Majority of tourists travelling by air, 54.4 percent (64,933) entered the country through Sir Seretse Khama International Airport. These were followed by those who landed in Maun Airport at 29.9 percent (35,650). Tourist arrivals through Kasane airport accounted for 12.3 percent (14,664) of total Air arrivals.
A further analysis of Air travellers by purpose of entry shows that most of the tourists who were Visiting Friends and Relatives (VFR) came through SSK Airport, at 85.0 percent of visitors who came for that purpose by air. Those who came for Business through SSK Airport accounted for 92.1 percent of all tourists arriving for that purpose by air (Table 4). The tourists who came for Holiday purpose entered the country through Maun and Kasane airports mainly, with Maun accounting for 57.5 percent while Kasane received 20.0 percent of tourist arrivals who came for Holiday by air. This scenario owes to the proximity of these two airports to the major tourist attractions of Moremi Game Reserve, the Okavango Delta and Chobe National Park.
The In-transit arrivals came in mostly through Kasane Airport, with this airport constituting 86.3 percent of all Air Tourists who were In-Transit. Sir Seretse Khama International Airport accounted for the bulk of ‘Other’ visitors at 82.1 percent. This is due to Gaborone as the main entry point for Meetings, Incentives, Conferences, and Meetings (MICE) from both regional and international visitors.
Table 3: Distribution of Tourists by Type and Purpose of Entry, 2017
Type of Visitor by Purpose of Visit
Tourist (Overnight) Day Visitor Total
Number Percentage Number Percentage Number Percentage
VFR 372 425 23.0 26 243 17.2 398 668 22.5
Holiday/Tourist 456 589 28.1 45 720 30.0 502 309 28.3
Business 381 382 23.5 30 598 20.1 411 980 23.2
In Transit 269 998 16.6 35 249 23.1 305 247 17.2
Other 142 194 8.8 14 562 9.6 156 756 8.8
Total 1 622 588 100 152 372 100 1 774 960 100
Tourism Statistics Annual Report 2017 13
Table 4: Distribution of Tourists by Mode of Travel, Point of Entry and Purpose of Entry - 2017
Mode of Travel
Visiting Friends or Family Holiday Business In Transit Other TOTAL
Number % Number % Number % Number % Number % Number %
Air 11 156 2.8 58 185 11.6 46 804 11.4 1999 0.7 1,265 0.8 119 409 6.7
SSK Airport 9 478 85.0 11 096 19.1 43 126 92.1 194 9.7 1 039 82.1 64 933 54.4
Maun Airport 891 8.0 33 451 57.5 1 152 2.5 51 2.6 105 8.3 35 650 29.9
Kasane Airport 220 2.0 11 614 20.0 1 043 2.2 1725 86.3 62 4.9 14 664 12.3
Francistown Airport 544 4.9 476 0.8 1 367 2.9 25 1.3 36 2.8 2 448 2.1
Other (Airstrips) 23 0.2 1 548 2.7 116 0.2 4 0.2 23 1.8 1 714 1.4
Rail 8.3 35 650 29.9 2 26 - 62 0.0
Road 387 512 444 090 365 174 303 222 155 491 1 655 489 93.3
TOTAL 398 668 502 309 411 980 305 247 156 756 1 774 960 100
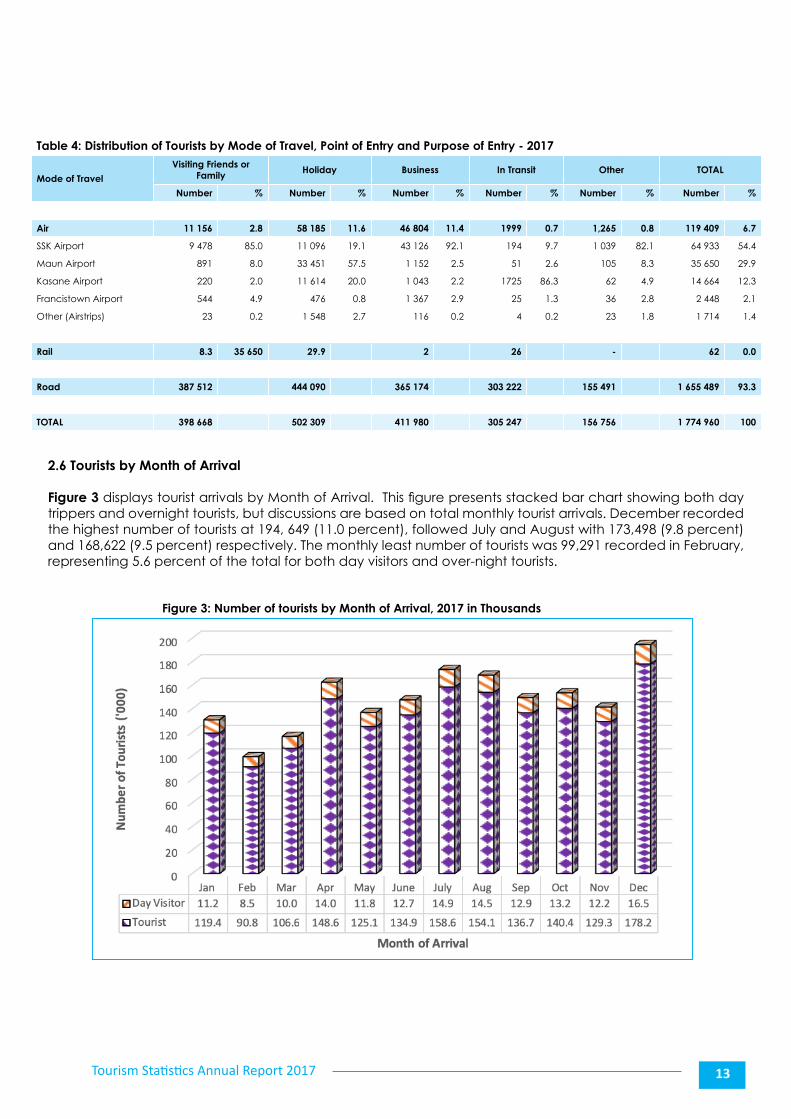
2.6 Tourists by Month of Arrival
Figure 3 displays tourist arrivals by Month of Arrival. This figure presents stacked bar chart showing both day trippers and overnight tourists, but discussions are based on total monthly tourist arrivals. December recorded the highest number of tourists at 194, 649 (11.0 percent), followed July and August with 173,498 (9.8 percent) and 168,622 (9.5 percent) respectively. The monthly least number of tourists was 99,291 recorded in February, representing 5.6 percent of the total for both day visitors and over-night tourists.
Figure 3: Number of tourists by Month of Arrival, 2017 in Thousands
Tourism Statistics Annual Report 201714
Table 5: Number of Tourists by Age Group, 2017
Age Group
Overnight Day Visitor Total
Number Percent Number Percent Number Percent
<=19 106 388 6.6 10 045 6.6 116 433 6.6
20-24 95 454 5.9 10 833 7.1 106 287 6.0
25-29 174 886 10.8 21 212 13.9 196 098 11.0
30-34 246 051 15.2 22 590 14.8 268 641 15.1
35-39 240 694 14.8 20 253 13.3 260 947 14.7
40-44 204 746 12.6 14 451 9.5 219 197 12.3
45-49 157 942 9.7 14 921 9.8 172 863 9.7
50-54 118 436 7.3 10 404 6.8 128 840 7.3
55-59 99 469 6.1 9 296 6.1 108 765 6.1
60-64 76 194 4.7 7 051 4.6 83 245 4.7
65+ 102 201 6.3 11 316 7.4 113 517 6.4
Unknown 127 0.0 - - 127 0.0
TOTAL 1 622 588 100 152 372 100 1 774 960 100
Figure 4: Percentage Distribution of Tourists by Age Group, 2017 in Thousands
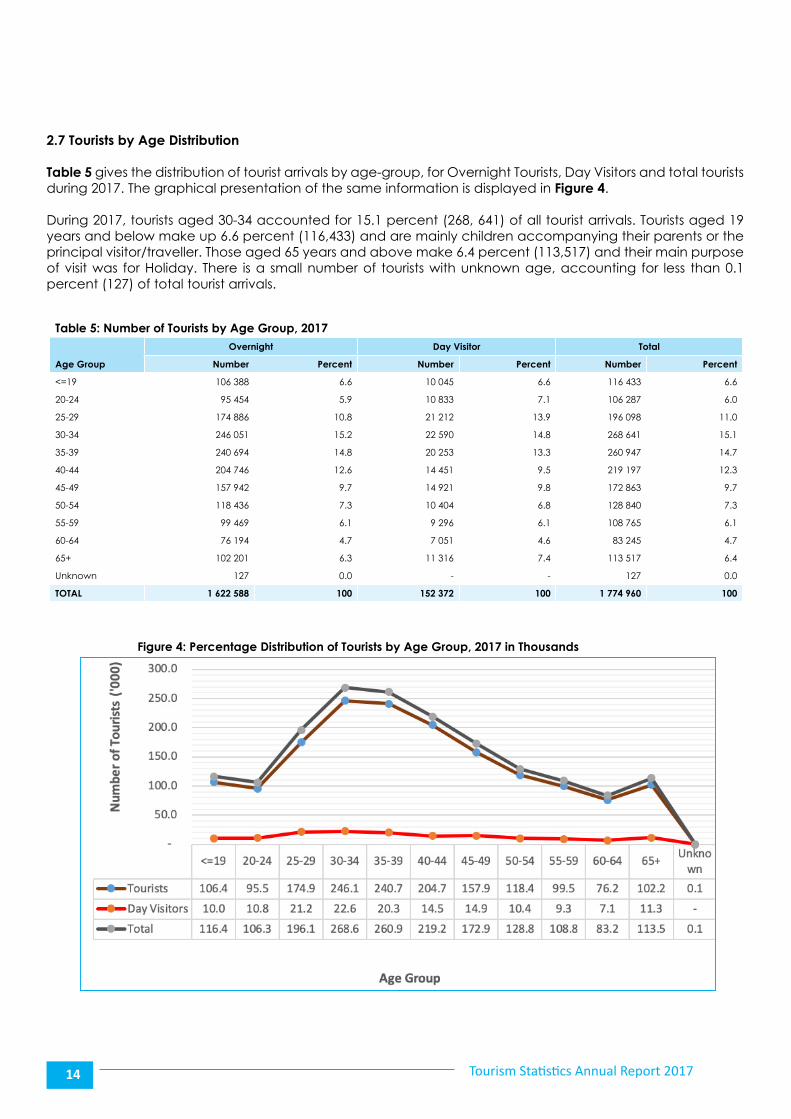
2.7 Tourists by Age Distribution
Table 5 gives the distribution of tourist arrivals by age-group, for Overnight Tourists, Day Visitors and total tourists during 2017. The graphical presentation of the same information is displayed in Figure 4.
During 2017, tourists aged 30-34 accounted for 15.1 percent (268, 641) of all tourist arrivals. Tourists aged 19 years and below make up 6.6 percent (116,433) and are mainly children accompanying their parents or the principal visitor/traveller. Those aged 65 years and above make 6.4 percent (113,517) and their main purpose of visit was for Holiday. There is a small number of tourists with unknown age, accounting for less than 0.1 percent (127) of total tourist arrivals.
Tourism Statistics Annual Report 2017 15
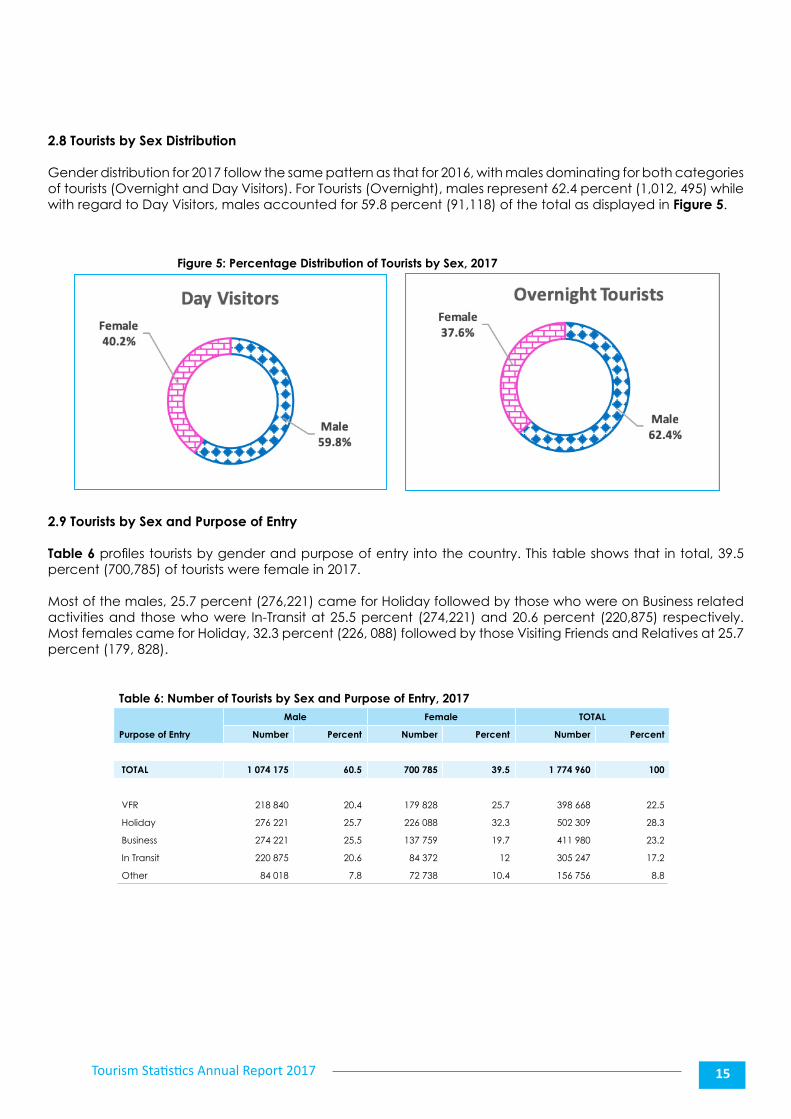
2.8 Tourists by Sex Distribution
Gender distribution for 2017 follow the same pattern as that for 2016, with males dominating for both categories of tourists (Overnight and Day Visitors). For Tourists (Overnight), males represent 62.4 percent (1,012, 495) while with regard to Day Visitors, males accounted for 59.8 percent (91,118) of the total as displayed in Figure 5.
Figure 5: Percentage Distribution of Tourists by Sex, 2017
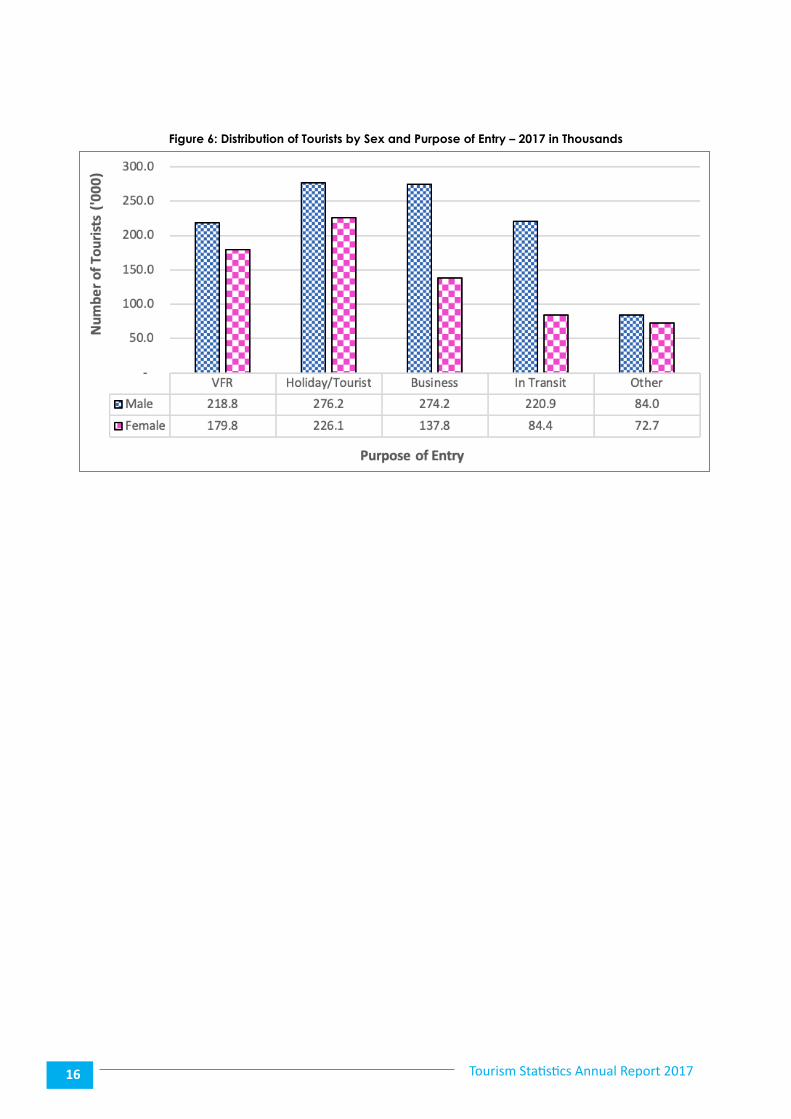
2.9 Tourists by Sex and Purpose of Entry
Table 6 profiles tourists by gender and purpose of entry into the country. This table shows that in total, 39.5 percent (700,785) of tourists were female in 2017.
Most of the males, 25.7 percent (276,221) came for Holiday followed by those who were on Business related activities and those who were In-Transit at 25.5 percent (274,221) and 20.6 percent (220,875) respectively. Most females came for Holiday, 32.3 percent (226, 088) followed by those Visiting Friends and Relatives at 25.7 percent (179, 828).
Table 6: Number of Tourists by Sex and Purpose of Entry, 2017
Purpose of Entry
Male Female TOTAL
Number Percent Number Percent Number Percent
TOTAL 1 074 175 60.5 700 785 39.5 1 774 960 100
VFR 218 840 20.4 179 828 25.7 398 668 22.5
Holiday 276 221 25.7 226 088 32.3 502 309 28.3
Business 274 221 25.5 137 759 19.7 411 980 23.2
In Transit 220 875 20.6 84 372 12 305 247 17.2
Other 84 018 7.8 72 738 10.4 156 756 8.8
Tourism Statistics Annual Report 201716
Figure 6: Distribution of Tourists by Sex and Purpose of Entry – 2017 in Thousands
Tourism Statistics Annual Report 2017 17
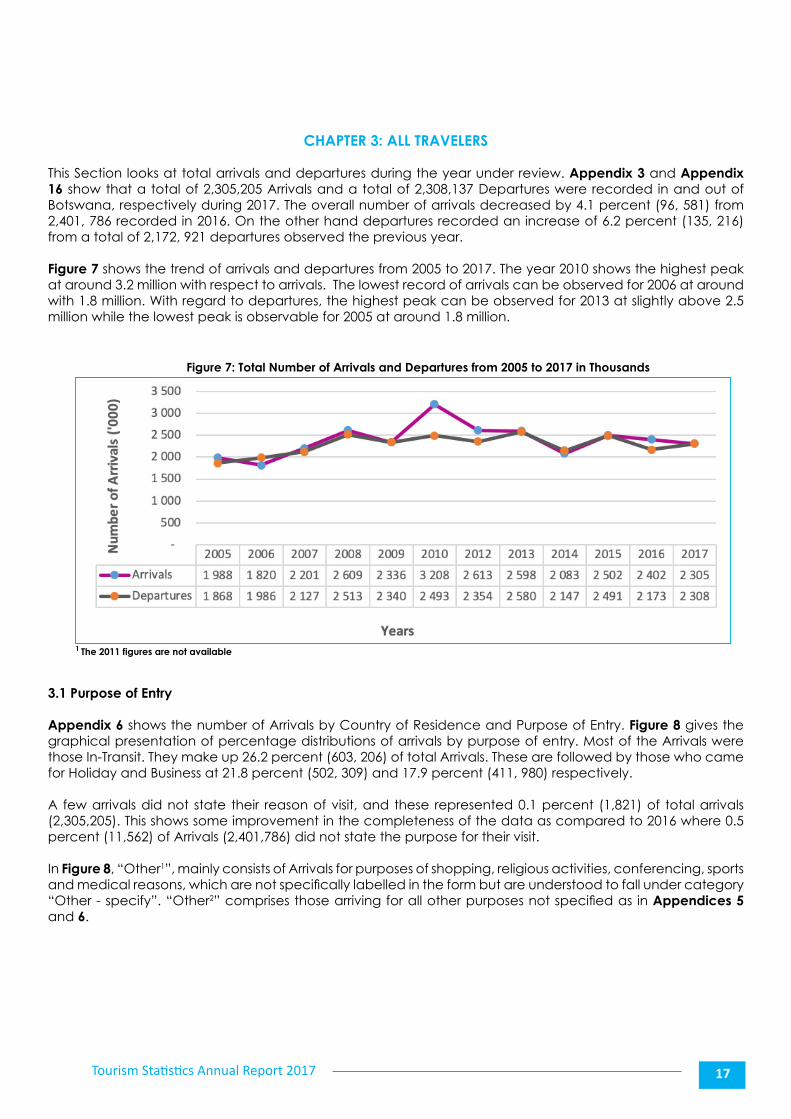
Figure 7: Total Number of Arrivals and Departures from 2005 to 2017 in Thousands
CHAPTER 3: ALL TRAVELERS
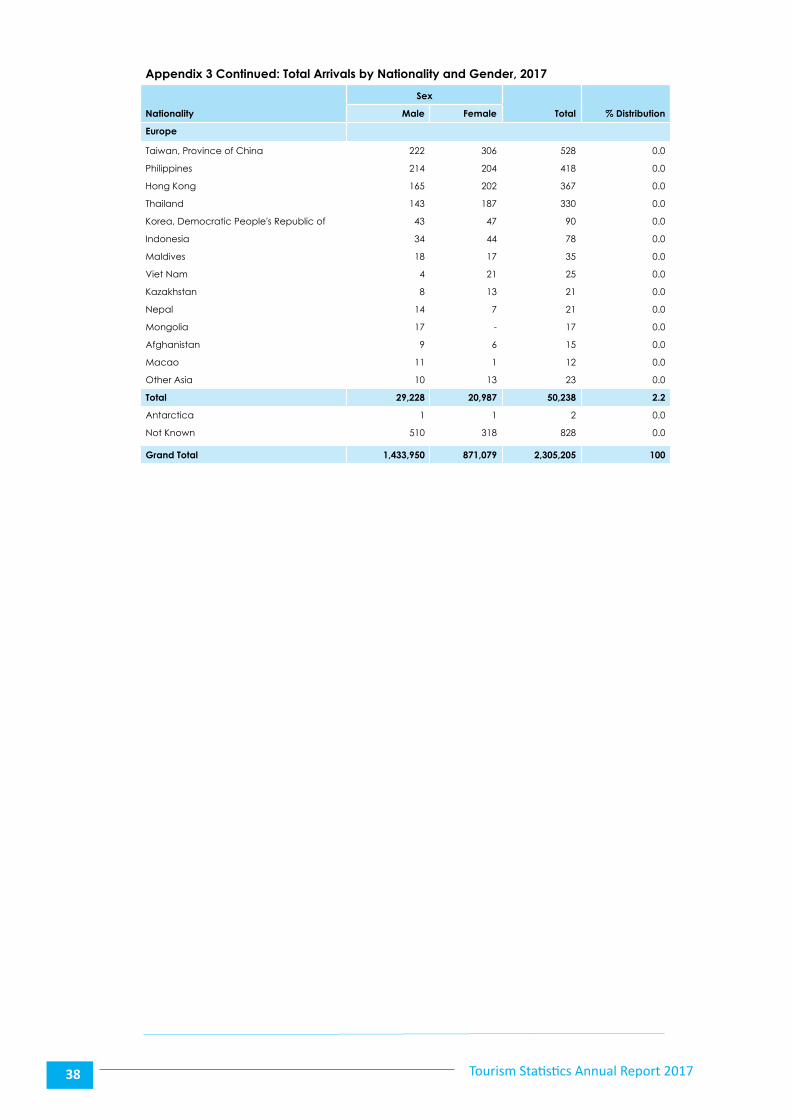
This Section looks at total arrivals and departures during the year under review. Appendix 3 and Appendix 16 show that a total of 2,305,205 Arrivals and a total of 2,308,137 Departures were recorded in and out of Botswana, respectively during 2017. The overall number of arrivals decreased by 4.1 percent (96, 581) from 2,401, 786 recorded in 2016. On the other hand departures recorded an increase of 6.2 percent (135, 216) from a total of 2,172, 921 departures observed the previous year.
Figure 7 shows the trend of arrivals and departures from 2005 to 2017. The year 2010 shows the highest peak at around 3.2 million with respect to arrivals. The lowest record of arrivals can be observed for 2006 at around with 1.8 million. With regard to departures, the highest peak can be observed for 2013 at slightly above 2.5 million while the lowest peak is observable for 2005 at around 1.8 million.
1 The 2011 figures are not available
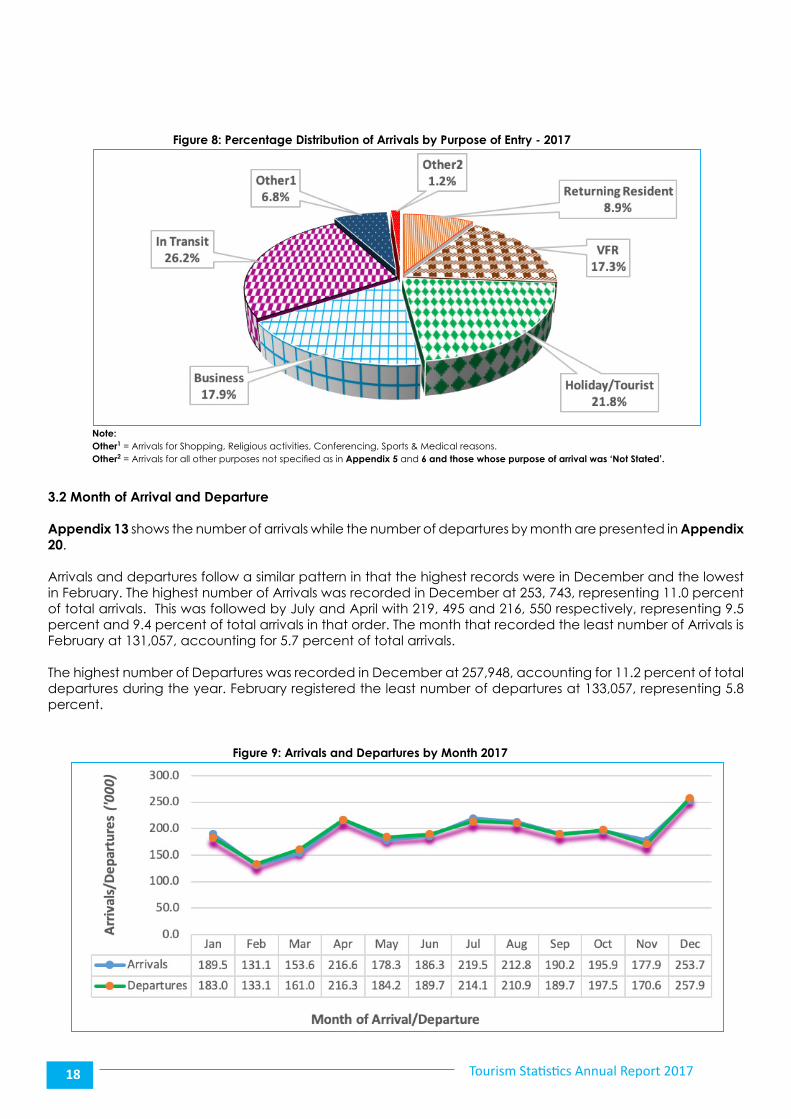
3.1 Purpose of Entry
Appendix 6 shows the number of Arrivals by Country of Residence and Purpose of Entry. Figure 8 gives the graphical presentation of percentage distributions of arrivals by purpose of entry. Most of the Arrivals were those In-Transit. They make up 26.2 percent (603, 206) of total Arrivals. These are followed by those who came for Holiday and Business at 21.8 percent (502, 309) and 17.9 percent (411, 980) respectively. A few arrivals did not state their reason of visit, and these represented 0.1 percent (1,821) of total arrivals (2,305,205). This shows some improvement in the completeness of the data as compared to 2016 where 0.5 percent (11,562) of Arrivals (2,401,786) did not state the purpose for their visit.
In Figure 8, “Other1”, mainly consists of Arrivals for purposes of shopping, religious activities, conferencing, sports and medical reasons, which are not specifically labelled in the form but are understood to fall under category “Other - specify”. “Other2” comprises those arriving for all other purposes not specified as in Appendices 5 and 6.
Tourism Statistics Annual Report 201718
3.2 Month of Arrival and Departure
Appendix 13 shows the number of arrivals while the number of departures by month are presented in Appendix 20.
Arrivals and departures follow a similar pattern in that the highest records were in December and the lowest in February. The highest number of Arrivals was recorded in December at 253, 743, representing 11.0 percent of total arrivals. This was followed by July and April with 219, 495 and 216, 550 respectively, representing 9.5 percent and 9.4 percent of total arrivals in that order. The month that recorded the least number of Arrivals is February at 131,057, accounting for 5.7 percent of total arrivals.
The highest number of Departures was recorded in December at 257,948, accounting for 11.2 percent of total departures during the year. February registered the least number of departures at 133,057, representing 5.8 percent.
Figure 8: Percentage Distribution of Arrivals by Purpose of Entry - 2017
Figure 9: Arrivals and Departures by Month 2017
Note: Other1 = Arrivals for Shopping, Religious activities, Conferencing, Sports & Medical reasons. Other2 = Arrivals for all other purposes not specified as in Appendix 5 and 6 and those whose purpose of arrival was ‘Not Stated’.
Tourism Statistics Annual Report 2017 19
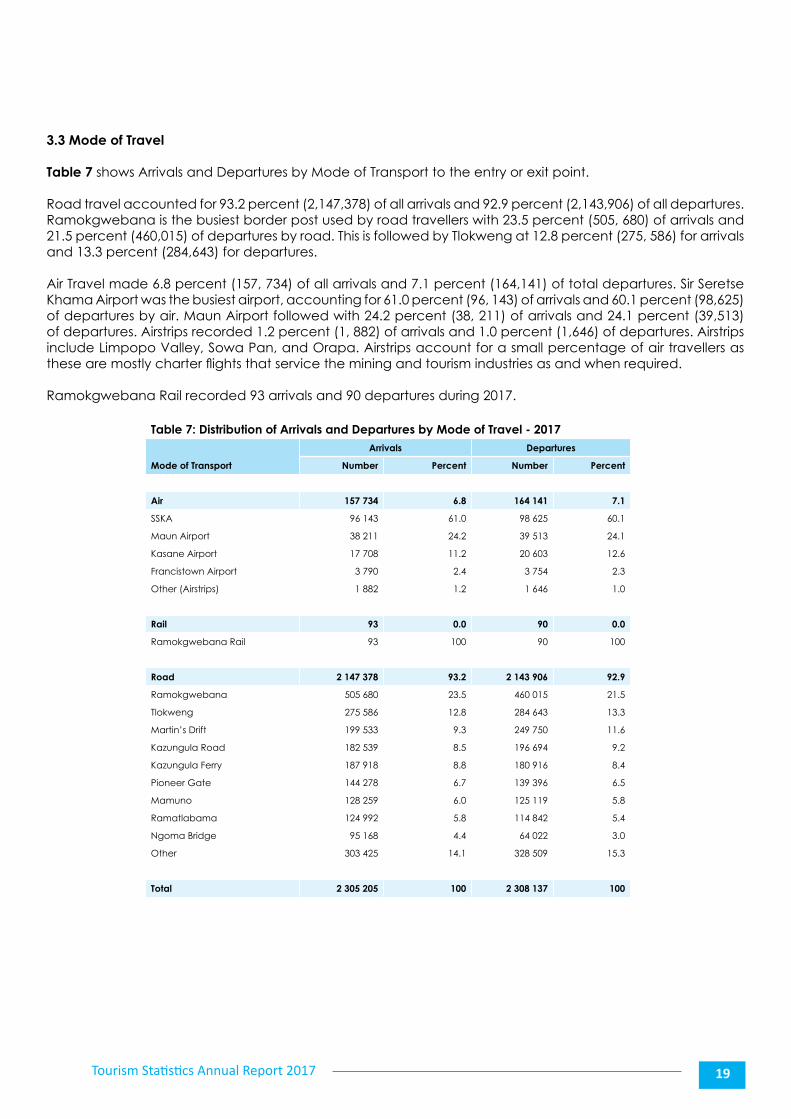
3.3 Mode of Travel
Table 7 shows Arrivals and Departures by Mode of Transport to the entry or exit point.
Road travel accounted for 93.2 percent (2,147,378) of all arrivals and 92.9 percent (2,143,906) of all departures. Ramokgwebana is the busiest border post used by road travellers with 23.5 percent (505, 680) of arrivals and 21.5 percent (460,015) of departures by road. This is followed by Tlokweng at 12.8 percent (275, 586) for arrivals and 13.3 percent (284,643) for departures.
Air Travel made 6.8 percent (157, 734) of all arrivals and 7.1 percent (164,141) of total departures. Sir Seretse Khama Airport was the busiest airport, accounting for 61.0 percent (96, 143) of arrivals and 60.1 percent (98,625) of departures by air. Maun Airport followed with 24.2 percent (38, 211) of arrivals and 24.1 percent (39,513) of departures. Airstrips recorded 1.2 percent (1, 882) of arrivals and 1.0 percent (1,646) of departures. Airstrips include Limpopo Valley, Sowa Pan, and Orapa. Airstrips account for a small percentage of air travellers as these are mostly charter flights that service the mining and tourism industries as and when required. Ramokgwebana Rail recorded 93 arrivals and 90 departures during 2017.
Table 7: Distribution of Arrivals and Departures by Mode of Travel - 2017
Mode of Transport
Arrivals Departures
Number Percent Number Percent
Air 157 734 6.8 164 141 7.1
SSKA 96 143 61.0 98 625 60.1
Maun Airport 38 211 24.2 39 513 24.1
Kasane Airport 17 708 11.2 20 603 12.6
Francistown Airport 3 790 2.4 3 754 2.3
Other (Airstrips) 1 882 1.2 1 646 1.0
Rail 93 0.0 90 0.0
Ramokgwebana Rail 93 100 90 100
Road 2 147 378 93.2 2 143 906 92.9
Ramokgwebana 505 680 23.5 460 015 21.5
Tlokweng 275 586 12.8 284 643 13.3
Martin’s Drift 199 533 9.3 249 750 11.6
Kazungula Road 182 539 8.5 196 694 9.2
Kazungula Ferry 187 918 8.8 180 916 8.4
Pioneer Gate 144 278 6.7 139 396 6.5
Mamuno 128 259 6.0 125 119 5.8
Ramatlabama 124 992 5.8 114 842 5.4
Ngoma Bridge 95 168 4.4 64 022 3.0
Other 303 425 14.1 328 509 15.3
Total 2 305 205 100 2 308 137 100
Tourism Statistics Annual Report 201720
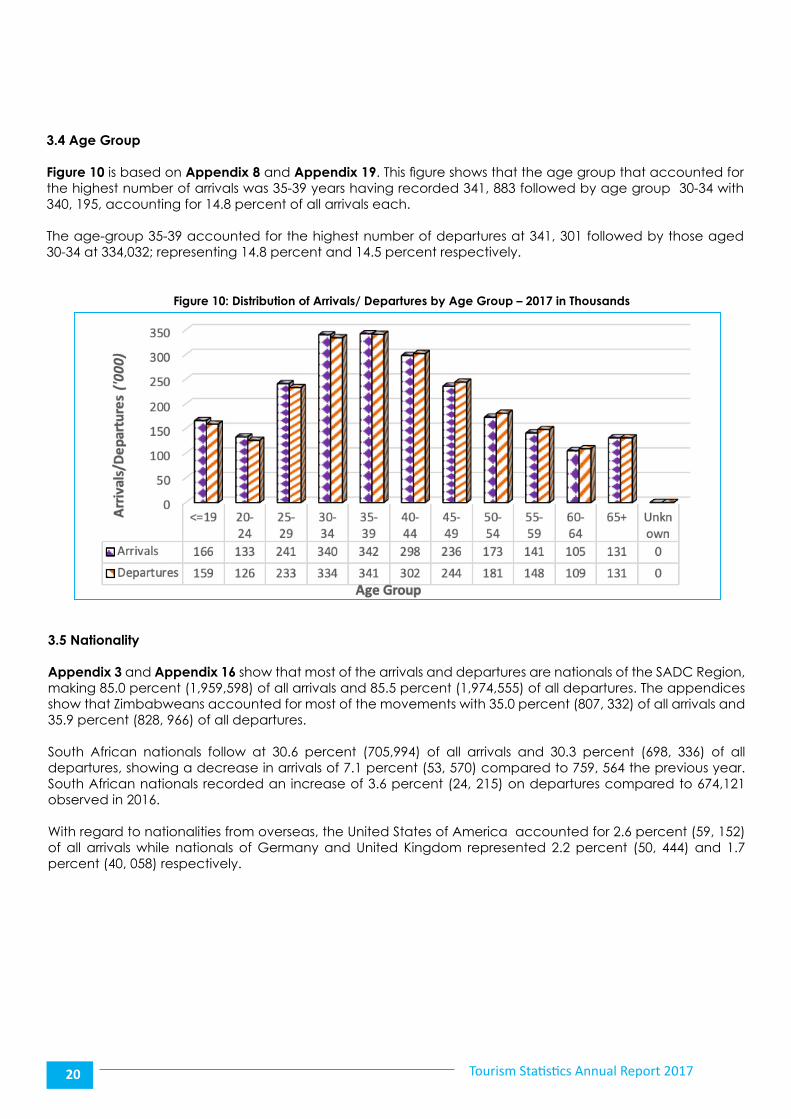
3.4 Age Group
Figure 10 is based on Appendix 8 and Appendix 19. This figure shows that the age group that accounted for the highest number of arrivals was 35-39 years having recorded 341, 883 followed by age group 30-34 with 340, 195, accounting for 14.8 percent of all arrivals each.
The age-group 35-39 accounted for the highest number of departures at 341, 301 followed by those aged 30-34 at 334,032; representing 14.8 percent and 14.5 percent respectively.
3.5 Nationality
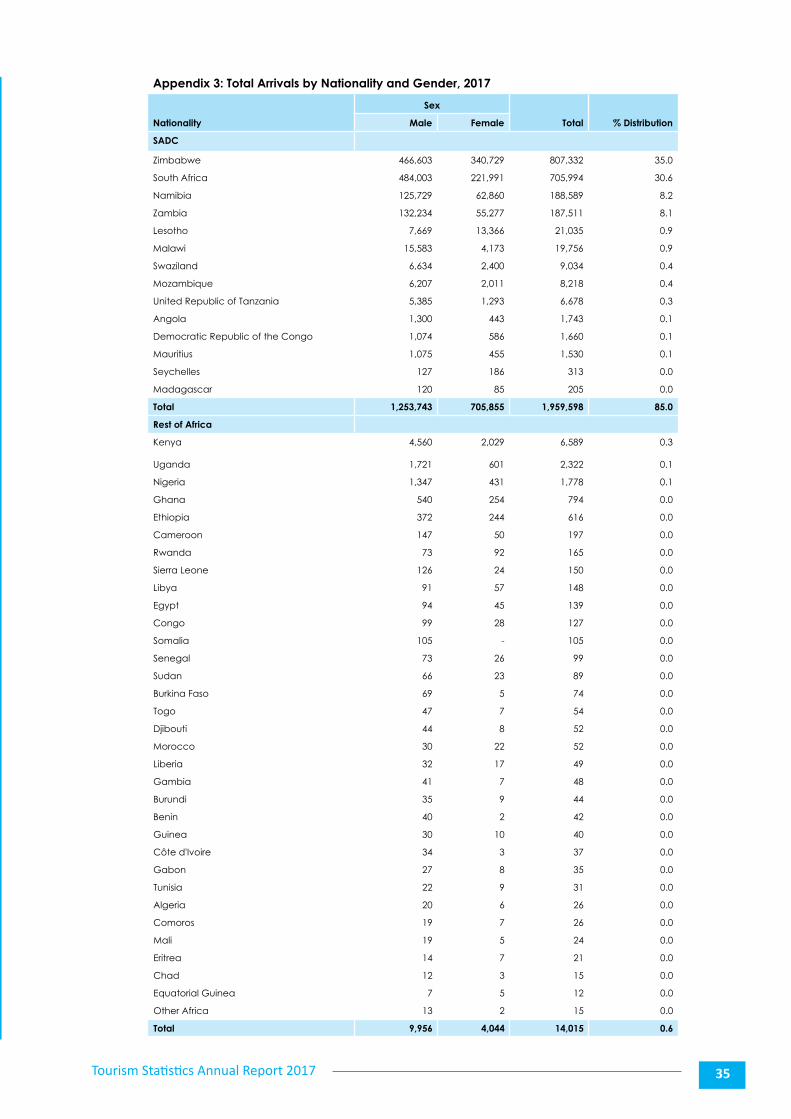
Appendix 3 and Appendix 16 show that most of the arrivals and departures are nationals of the SADC Region, making 85.0 percent (1,959,598) of all arrivals and 85.5 percent (1,974,555) of all departures. The appendices show that Zimbabweans accounted for most of the movements with 35.0 percent (807, 332) of all arrivals and 35.9 percent (828, 966) of all departures.
South African nationals follow at 30.6 percent (705,994) of all arrivals and 30.3 percent (698, 336) of all departures, showing a decrease in arrivals of 7.1 percent (53, 570) compared to 759, 564 the previous year. South African nationals recorded an increase of 3.6 percent (24, 215) on departures compared to 674,121 observed in 2016.
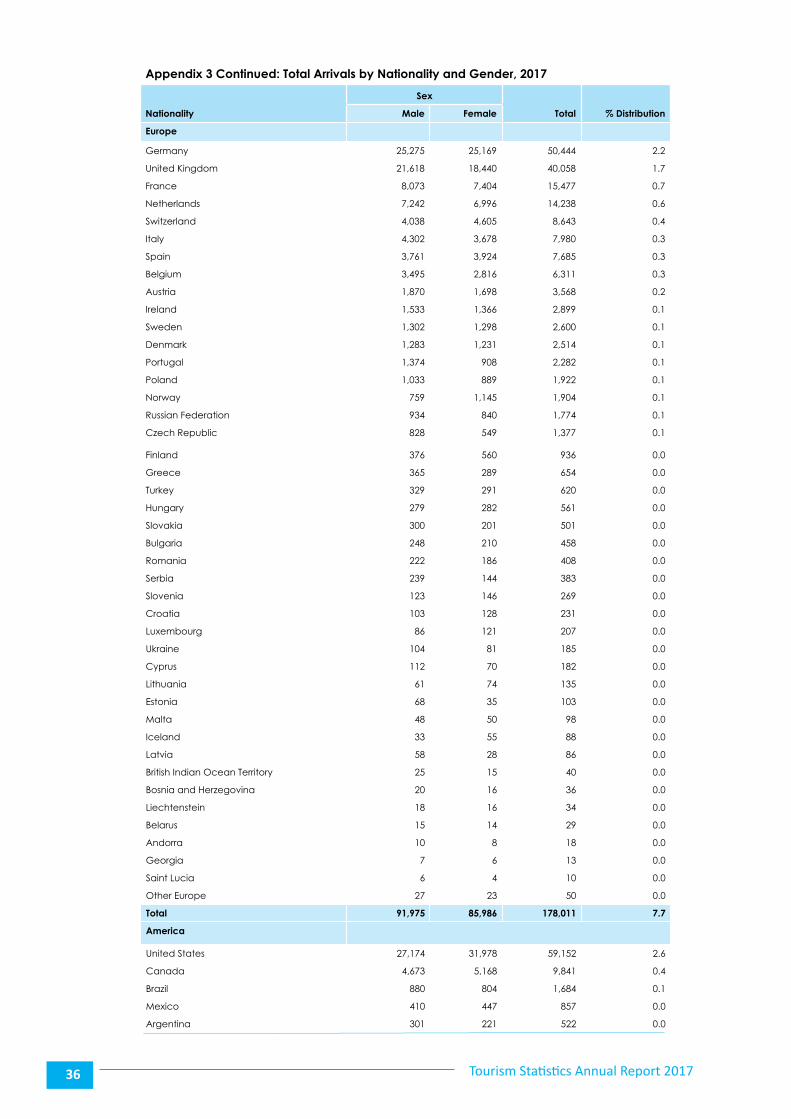
With regard to nationalities from overseas, the United States of America accounted for 2.6 percent (59, 152) of all arrivals while nationals of Germany and United Kingdom represented 2.2 percent (50, 444) and 1.7 percent (40, 058) respectively.
Figure 10: Distribution of Arrivals/ Departures by Age Group – 2017 in Thousands
Tourism Statistics Annual Report 2017 21
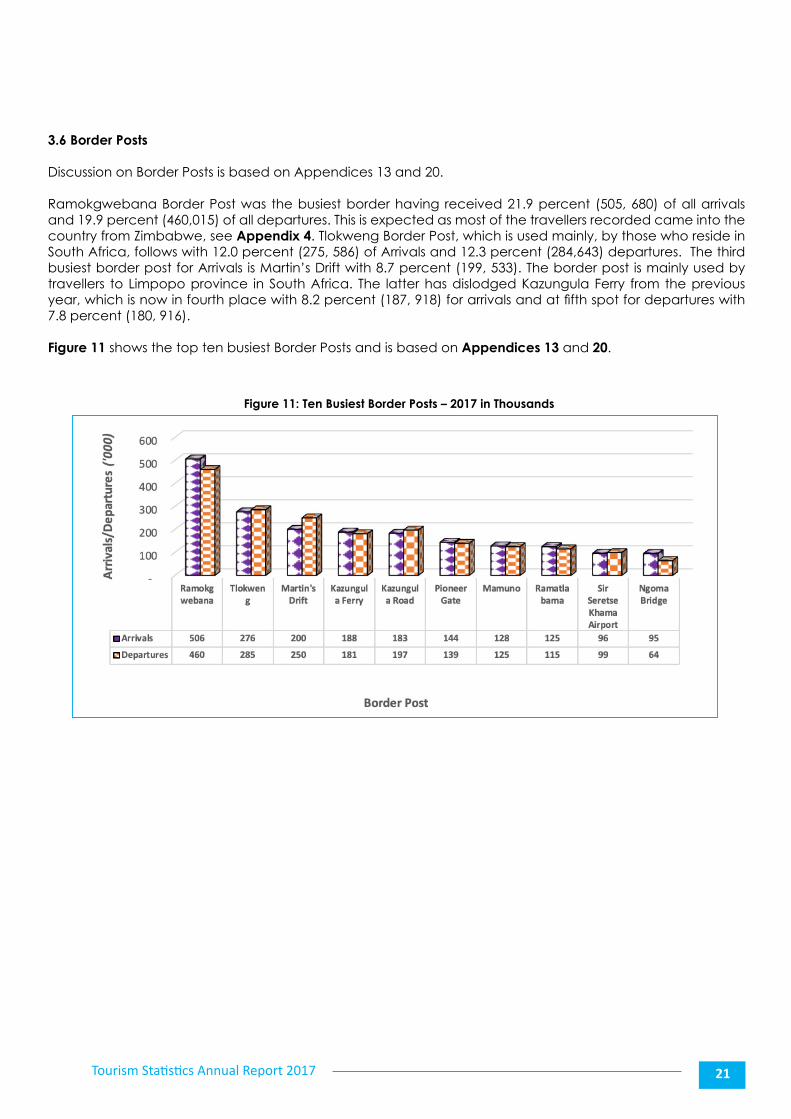
3.6 Border Posts
Discussion on Border Posts is based on Appendices 13 and 20. Ramokgwebana Border Post was the busiest border having received 21.9 percent (505, 680) of all arrivals and 19.9 percent (460,015) of all departures. This is expected as most of the travellers recorded came into the country from Zimbabwe, see Appendix 4. Tlokweng Border Post, which is used mainly, by those who reside in South Africa, follows with 12.0 percent (275, 586) of Arrivals and 12.3 percent (284,643) departures. The third busiest border post for Arrivals is Martin’s Drift with 8.7 percent (199, 533). The border post is mainly used by travellers to Limpopo province in South Africa. The latter has dislodged Kazungula Ferry from the previous year, which is now in fourth place with 8.2 percent (187, 918) for arrivals and at fifth spot for departures with 7.8 percent (180, 916).
Figure 11 shows the top ten busiest Border Posts and is based on Appendices 13 and 20.
Figure 11: Ten Busiest Border Posts – 2017 in Thousands
Tourism Statistics Annual Report 201722
CHAPTER 4: TECHNICAL NOTES
This chapter presents data sources, methodology and definitions of terms used in production of tourism statistics. This is meant to enable the users to interpret the statistics carried in the report with understanding of how the raw data is sourced, how processing and compilation of the report is done and what the various terms used in the report mean.
4.1 Data Source and Methodology
The data used in the production of this report is sourced from administrative records of the Department of Immigration and Citizenship. Over 90 percent of the data is electronically captured and provided by this department to Statistics Botswana. The busiest points of entry/exit, which handle high volumes of travellers, have been automated. The data is captured into the Passport and Border Control System (PBCS). The remaining percentage of the data comes from the non-automated borders and is manually captured by Data Processing staff at Statistics Botswana. These two datasets are then merged for processing.
International Tourist data is collected using Arrival and Departure forms that are filled in by non-citizens at all gazetted points of entry and exit (Land Borders and Airports). Each form asks questions on personal characteristics of the traveller which include among others, sex, age, country of nationality, country of residence and purpose of entry. By default data is also collected on month of travel, mode of transport and point of entry.
Percentages are independently rounded, therefore in some cases they may not add to the total. The results and analysis presented in the report follow the guidelines, definitions and classifications recommended by United Nations World Tourism Organization (UNWTO) and the United Nations Statistical Commission (UNSC). This publication is produced in line with internationally accepted statistical standards and guidelines.
4.2 Definition of Terms
Traveller- An individual who moves between different geographic locations (in this case countries) for any purpose and any duration.
Foreigner – An international traveller who is not a Botswana Citizen nor holder of a temporary resident status.
Overseas – All countries and territories outside the continent of Africa.
Visitor - Refers to any person travelling to a place other than that of his/her usual environment for less than twelve months and whose main purpose of the trip is other than the exercise of an activity remunerated from the place visited.
Tourist (Overnight) – An international visitor who stays at least one night in a collective or private accommodation in the country visited.
Same-day visitor – An international visitor who does not spend the night in either a collective or private accommodation in the country visited.Excursionist – A same-day visitor whose trip does not include an overnight stay (usually visiting for leisure).
Resident – Refers to a non-citizen residing in Botswana on a permanent or temporary basis.
Country of Nationality – A country where citizenship is held.
Non-resident – Refers to a foreigner (excluding resident) entering or departing the country.
Tourism Statistics Annual Report 2017 23
Country of residence – A country where one usually resides but may not necessarily be the same as the country of origin (nationality) or country of passport.
Point of entry – Official border post (land border and airport).
VFR – Refers to travelling for purpose of visiting friends and relatives.

5.0 APPENDICES Appendix 1
Tourism Statistics Annual Report 2017 25
Appendix 1: Number of Tourists by Country of Residence and Type of Visitor, 2017
Country of Residence
Visitors Total
Tourist Day Visitor Total Percent
SADC
Zimbabwe 562,649 29,617 592,266 33.4
South Africa 555,093 28,837 583,930 32.9
Zambia 110,579 38,038 148,617 8.4
Namibia 96,116 29,769 125,885 7.1
Lesotho 17,889 180 18,069 1.0
Malawi 10,501 360 10,861 0.6
Swaziland 6,855 84 6,939 0.4
Mozambique 5,785 120 5,905 0.3
United Republic of Tanzania 3,623 109 3,732 0.2
Angola 1,141 68 1,209 0.1
Mauritius 727 19 746 0.0
Democratic Republic of the Congo 518 58 576 0.0
Seychelles 167 1 168 0.0
Madagascar 136 4 140 0.0
Total 1,371,779 127,264 1,499,043 84.5
Rest of Africa
Kenya 3,576 340 3,916 0.2
Uganda 1,363 46 1,409 0.1
Nigeria 549 43 592 0.0
Somalia 537 17 554 0.0
Ethiopia 319 5 324 0.0
Ghana 282 15 297 0.0
Rwanda 118 3 121 0.0
Sierra Leone 104 2 106 0.0
Cameroon 99 6 105 0.0
Sudan 89 5 94 0.0
Senegal 72 - 72 0.0
Congo 64 3 67 0.0
Egypt 68 4 72 0.0
Burkina Faso 65 - 65 0.0
Djibouti 46 - 46 0.0
Morocco 38 3 41 0.0
Libya 28 1 29 0.0
Burundi 36 1 37 0.0
Gambia 39 1 40 0.0
Togo 42 - 42 0.0
Gabon 34 1 35 0.0
Côte d'Ivoire 34 - 34 0.0
Tunisia 27 1 28 0.0
Liberia 29 2 31 0.0
Benin 26 1 27 0.0
Comoros 23 - 23 0.0
Algeria 14 1 15 0.0
Chad 16 - 16 0.0
Mali 16 - 16 0.0
Eritrea 17 - 17 0.0
Guinea 16 - 16 0.0
Western Sahara 15 1 16 0.0
Equatorial Guinea 10 1 11 0.0
Mauritania 10 1 11 0.0
Other Africa 20 - 20 0.0
Total 7,841 504 8,345 0.5
Tourism Statistics Annual Report 201726
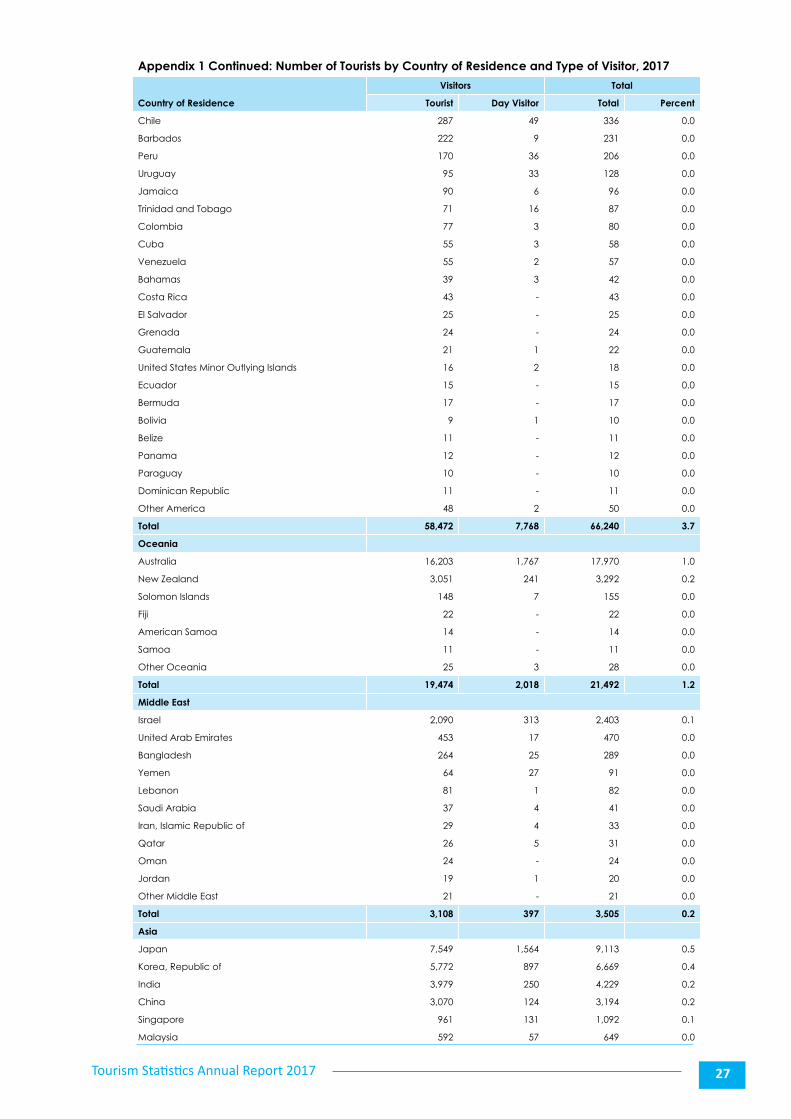
Appendix 1 Continued: Number of Tourists by Country of Residence and Type of Visitor, 2017
Country of Residence
Visitors Total
Tourist Day Visitor Total Percent
Europe
Germany 40,844 3,215 44,059 2.5
United Kingdom 26,508 2,092 28,600 1.6
France 11,869 1,411 13,280 0.7
Netherlands 12,260 384 12,644 0.7
Switzerland 7,565 535 8,100 0.5
Spain 6,529 638 7,167 0.4
Italy 6,285 550 6,835 0.4
Belgium 5,007 468 5,475 0.3
Austria 2,858 159 3,017 0.2
Sweden 2,019 120 2,139 0.1
Denmark 1,939 179 2,118 0.1
Ireland 1,783 210 1,993 0.1
Norway 1,578 126 1,704 0.1
Poland 1,509 153 1,662 0.1
Russian Federation 1,309 207 1,516 0.1
Portugal 1,323 96 1,419 0.1
Czech Republic 1,223 56 1,279 0.1
Finland 715 70 785 0.0
Turkey 438 88 526 0.0
Greece 392 70 462 0.0
Slovakia 417 58 475 0.0
Hungary 376 90 466 0.0
Romania 283 44 327 0.0
Bulgaria 246 22 268 0.0
Slovenia 208 6 214 0.0
Luxembourg 175 11 186 0.0
Croatia 156 8 164 0.0
Lithuania 117 2 119 0.0
Cyprus 109 7 116 0.0
Ukraine 101 8 109 0.0
Estonia 77 13 90 0.0
Andorra 91 8 99 0.0
Iceland 87 2 89 0.0
Malta 70 13 83 0.0
Serbia 79 6 85 0.0
Latvia 74 4 78 0.0
British Indian Ocean Territory 59 1 60 0.0
Georgia 45 - 45 0.0
Bosnia and Herzegovina 30 1 31 0.0
Liechtenstein 34 - 34 0.0
Monaco 21 2 23 0.0
Belarus 21 - 21 0.0
New Caledonia 15 - 15 0.0
Isle of Man 12 - 12 0.0
Other Europe 77 2 79 0.0
Total 136,933 11,135 148,068 8.3
America
United States 46,407 6,326 52,733 3.0
Canada 8,261 957 9,218 0.5
Brazil 1,300 163 1,463 0.1
Mexico 707 127 834 0.0
Argentina 374 29 403 0.0
Tourism Statistics Annual Report 2017 27
Appendix 1 Continued: Number of Tourists by Country of Residence and Type of Visitor, 2017
Country of Residence
Visitors Total
Tourist Day Visitor Total Percent
Chile 287 49 336 0.0
Barbados 222 9 231 0.0
Peru 170 36 206 0.0
Uruguay 95 33 128 0.0
Jamaica 90 6 96 0.0
Trinidad and Tobago 71 16 87 0.0
Colombia 77 3 80 0.0
Cuba 55 3 58 0.0
Venezuela 55 2 57 0.0
Bahamas 39 3 42 0.0
Costa Rica 43 - 43 0.0
El Salvador 25 - 25 0.0
Grenada 24 - 24 0.0
Guatemala 21 1 22 0.0
United States Minor Outlying Islands 16 2 18 0.0
Ecuador 15 - 15 0.0
Bermuda 17 - 17 0.0
Bolivia 9 1 10 0.0
Belize 11 - 11 0.0
Panama 12 - 12 0.0
Paraguay 10 - 10 0.0
Dominican Republic 11 - 11 0.0
Other America 48 2 50 0.0
Total 58,472 7,768 66,240 3.7
Oceania
Australia 16,203 1,767 17,970 1.0
New Zealand 3,051 241 3,292 0.2
Solomon Islands 148 7 155 0.0
Fiji 22 - 22 0.0
American Samoa 14 - 14 0.0
Samoa 11 - 11 0.0
Other Oceania 25 3 28 0.0
Total 19,474 2,018 21,492 1.2
Middle East
Israel 2,090 313 2,403 0.1
United Arab Emirates 453 17 470 0.0
Bangladesh 264 25 289 0.0
Yemen 64 27 91 0.0
Lebanon 81 1 82 0.0
Saudi Arabia 37 4 41 0.0
Iran, Islamic Republic of 29 4 33 0.0
Qatar 26 5 31 0.0
Oman 24 - 24 0.0
Jordan 19 1 20 0.0
Other Middle East 21 - 21 0.0
Total 3,108 397 3,505 0.2
Asia
Japan 7,549 1,564 9,113 0.5
Korea, Republic of 5,772 897 6,669 0.4
India 3,979 250 4,229 0.2
China 3,070 124 3,194 0.2
Singapore 961 131 1,092 0.1
Malaysia 592 57 649 0.0
Tourism Statistics Annual Report 201728
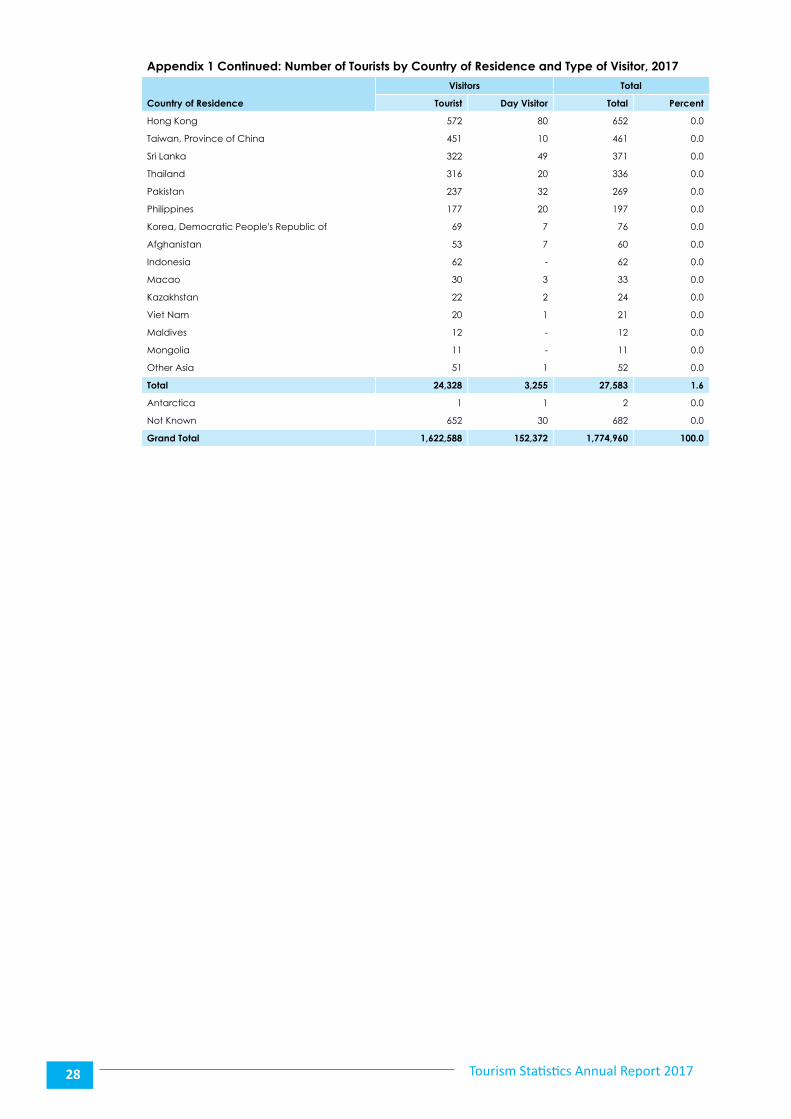
Appendix 1 Continued: Number of Tourists by Country of Residence and Type of Visitor, 2017
Country of Residence
Visitors Total
Tourist Day Visitor Total Percent
Hong Kong 572 80 652 0.0
Taiwan, Province of China 451 10 461 0.0
Sri Lanka 322 49 371 0.0
Thailand 316 20 336 0.0
Pakistan 237 32 269 0.0
Philippines 177 20 197 0.0
Korea, Democratic People's Republic of 69 7 76 0.0
Afghanistan 53 7 60 0.0
Indonesia 62 - 62 0.0
Macao 30 3 33 0.0
Kazakhstan 22 2 24 0.0
Viet Nam 20 1 21 0.0
Maldives 12 - 12 0.0
Mongolia 11 - 11 0.0
Other Asia 51 1 52 0.0
Total 24,328 3,255 27,583 1.6
Antarctica 1 1 2 0.0
Not Known 652 30 682 0.0
Grand Total 1,622,588 152,372 1,774,960 100.0
Appendix 2
Tourism Statistics Annual Report 201730
Appendix 2: Number of Tourists by Country of Residence and Purpose of Visit, 2017
Country of Residence
Purpose of Entry
TotalVFR Holiday Business In Transit Other
Zimbabwe 154,073 79,416 181,494 89,694 87,589 592,266
South Africa 186,682 130,894 144,113 95,074 27,167 583,930
Zambia 8,319 41,437 41,110 39,538 18,213 148,617
Namibia 24,752 14,038 8,448 62,144 16,503 125,885
Lesotho 4,266 1,779 8,819 402 2,803 18,069
Malawi 2,798 1,872 2,278 3,373 540 10,861
Swaziland 1,356 1,348 2,810 810 615 6,939
Mozambique 1,374 832 2,392 555 752 5,905
United Republic of Tanzania 947 969 580 1,114 122 3,732
Angola 220 375 279 227 108 1,209
Mauritius 140 244 340 9 13 746
Democratic Republic of the Congo 158 169 154 81 14 576
Seychelles 40 33 74 2 19 168
Madagascar 7 12 95 2 24 140
Total 385,132 273,418 392,986 293,025 154,482 1,499,043
SADC % Distribution 25.7 18.2 26.2 19.5 10.3 100.0
Rest of Africa
Kenya 936 1,259 1,061 544 116 3,916
Uganda 571 340 342 109 47 1,409
Nigeria 86 144 326 4 32 592
Somalia 190 128 145 61 30 554
Ethiopia 72 42 201 1 8 324
Ghana 67 75 149 3 3 297
Rwanda 3 36 70 7 5 121
Sierra Leone 34 25 34 8 5 106
Cameroon 19 16 62 3 5 105
Sudan 22 21 40 5 6 94
Senegal 2 8 56 - 6 72
Congo 7 16 36 6 2 67
Egypt 6 21 36 4 5 72
Burkina Faso - 2 59 1 3 65
Djibouti 1 - 43 - 2 46
Morocco 7 7 19 2 6 41
Libya 11 9 7 - 2 29
Burundi 7 8 18 1 3 37
Gambia 4 1 27 1 7 40
Togo 2 6 32 - 2 42
Gabon 2 11 22 - - 35
Côte d'Ivoire 7 6 21 - - 34
Tunisia 4 7 16 1 - 28
Liberia 3 6 21 - 1 31
Benin 1 3 22 - 1 27
Comoros - 2 20 - 1 23
Algeria - 9 6 - - 15
Chad 2 9 5 - - 16
Mali - 5 10 - 1 16
Eritrea 3 11 2 1 - 17
Guinea 3 3 9 - 1 16
Western Sahara 6 2 6 - 2 16
Equatorial Guinea 2 - 9 - - 11
Mauritania 2 3 5 1 - 11
Tourism Statistics Annual Report 2017 31
Appendix 2 Continued: Number of Tourists by Country of Residence and Purpose of Visit, 2017
Country of Residence
Purpose of Entry
TotalVFR Holiday Business In Transit Other
Other Africa 3 9 6 2 - 20
Total 2,085 2,250 2,943 765 302 8,345
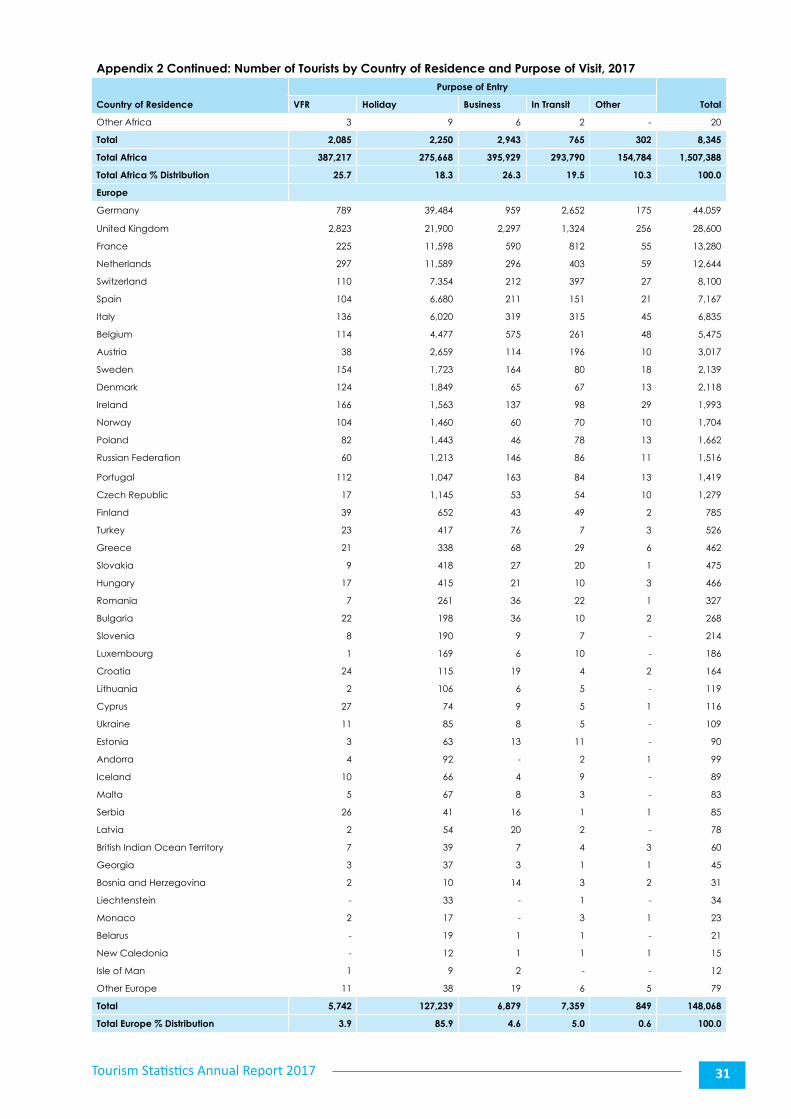
Total Africa 387,217 275,668 395,929 293,790 154,784 1,507,388
Total Africa % Distribution 25.7 18.3 26.3 19.5 10.3 100.0
Europe
Germany 789 39,484 959 2,652 175 44,059
United Kingdom 2,823 21,900 2,297 1,324 256 28,600
France 225 11,598 590 812 55 13,280
Netherlands 297 11,589 296 403 59 12,644
Switzerland 110 7,354 212 397 27 8,100
Spain 104 6,680 211 151 21 7,167
Italy 136 6,020 319 315 45 6,835
Belgium 114 4,477 575 261 48 5,475
Austria 38 2,659 114 196 10 3,017
Sweden 154 1,723 164 80 18 2,139
Denmark 124 1,849 65 67 13 2,118
Ireland 166 1,563 137 98 29 1,993
Norway 104 1,460 60 70 10 1,704
Poland 82 1,443 46 78 13 1,662
Russian Federation 60 1,213 146 86 11 1,516
Portugal 112 1,047 163 84 13 1,419
Czech Republic 17 1,145 53 54 10 1,279
Finland 39 652 43 49 2 785
Turkey 23 417 76 7 3 526
Greece 21 338 68 29 6 462
Slovakia 9 418 27 20 1 475
Hungary 17 415 21 10 3 466
Romania 7 261 36 22 1 327
Bulgaria 22 198 36 10 2 268
Slovenia 8 190 9 7 - 214
Luxembourg 1 169 6 10 - 186
Croatia 24 115 19 4 2 164
Lithuania 2 106 6 5 - 119
Cyprus 27 74 9 5 1 116
Ukraine 11 85 8 5 - 109
Estonia 3 63 13 11 - 90
Andorra 4 92 - 2 1 99
Iceland 10 66 4 9 - 89
Malta 5 67 8 3 - 83
Serbia 26 41 16 1 1 85
Latvia 2 54 20 2 - 78
British Indian Ocean Territory 7 39 7 4 3 60
Georgia 3 37 3 1 1 45
Bosnia and Herzegovina 2 10 14 3 2 31
Liechtenstein - 33 - 1 - 34
Monaco 2 17 - 3 1 23
Belarus - 19 1 1 - 21
New Caledonia - 12 1 1 1 15
Isle of Man 1 9 2 - - 12
Other Europe 11 38 19 6 5 79
Total 5,742 127,239 6,879 7,359 849 148,068
Total Europe % Distribution 3.9 85.9 4.6 5.0 0.6 100.0
Tourism Statistics Annual Report 201732
Appendix 2 Continued: Number of Tourists by Country of Residence and Purpose of Visit, 2017
Country of Residence
Purpose of Entry
TotalVFR Holiday Business In Transit Other
America
United States 2,130 45,977 2,286 1,948 392 52,733
Canada 58 8,276 455 372 57 9,218
Brazil 33 1,250 104 51 25 1,463
Mexico 13 776 21 14 10 834
Argentina 9 368 15 10 1 403
Chile 15 297 18 5 1 336
Barbados 4 175 26 17 9 231
Peru 6 176 13 10 1 206
Uruguay 3 117 2 6 - 128
Jamaica 13 42 31 3 7 96
Trinidad and Tobago 8 46 22 1 10 87
Colombia 9 55 13 1 2 80
Cuba 25 17 12 1 3 58
Venezuela 6 36 13 1 1 57
Costa Rica 1 41 - 1 - 43
Bahamas 4 20 7 11 - 42
El Salvador - 24 1 - - 25
Grenada 2 2 14 - 6 24
Guatemala - 17 2 2 1 22
United States Minor Outlying Islands 4 6 4 3 1 18
Bermuda - 16 - 1 - 17
Ecuador - 11 4 - - 15
Panama 1 7 4 - - 12
Belize 4 5 2 - - 11
Dominican Republic - 6 5 - - 11
Bolivia 2 7 1 - - 10
Paraguay 2 4 2 2 - 10
Other America 7 28 12 2 1 50
Total 2,359 57,802 3,089 2,462 528 66,240
Total America % Distribution 3.6 87.3 4.7 3.7 0.8 100.0
Oceania
Australia 756 15,504 737 851 122 17,970
New Zealand 170 2,786 123 170 43 3,292
Solomon Islands 50 42 32 18 13 155
Fiji 1 5 10 - 6 22
American Samoa 2 4 6 1 1 14
Samoa 2 2 5 1 1 11
Other Oceania 4 14 8 2 - 28
Total 985 18,357 921 1,043 186 21,492
Total Oceania % Distribution 4.6 85.4 4.3 4.9 0.9 100.0
Middle East
Israel 71 1,779 487 49 17 2,403
United Arab Emirates 47 177 236 8 2 470
Bangladesh 12 152 124 - 1 289
Yemen 11 18 22 15 25 91
Lebanon 14 15 43 4 6 82
Saudi Arabia 3 30 7 1 - 41
Iran, Islamic Republic of 11 14 7 1 - 33
Qatar 14 15 - 2 - 31
Oman 1 21 2 - - 24
Jordan 3 6 11 - - 20
Tourism Statistics Annual Report 2017 33
Appendix 2 Continued: Number of Tourists by Country of Residence and Purpose of Visit, 2017
Country of Residence
Purpose of Entry
TotalVFR Holiday Business In Transit Other
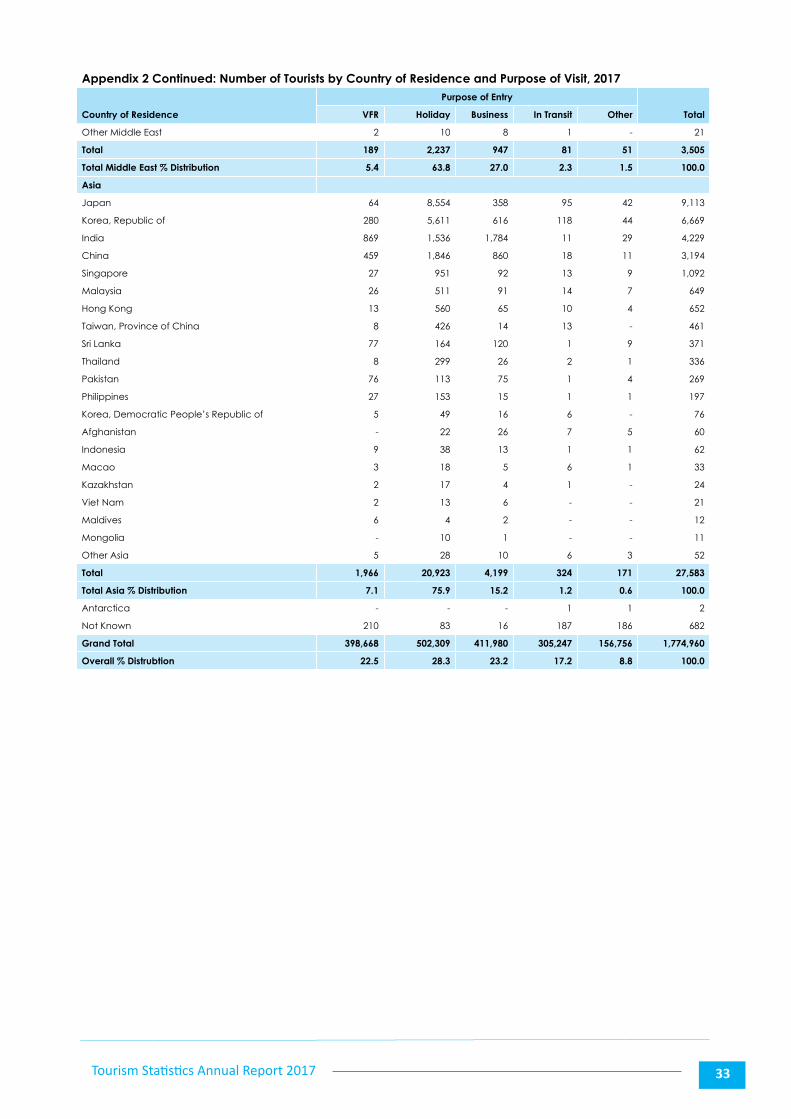
Other Middle East 2 10 8 1 - 21
Total 189 2,237 947 81 51 3,505
Total Middle East % Distribution 5.4 63.8 27.0 2.3 1.5 100.0
Asia
Japan 64 8,554 358 95 42 9,113
Korea, Republic of 280 5,611 616 118 44 6,669
India 869 1,536 1,784 11 29 4,229
China 459 1,846 860 18 11 3,194
Singapore 27 951 92 13 9 1,092
Malaysia 26 511 91 14 7 649
Hong Kong 13 560 65 10 4 652
Taiwan, Province of China 8 426 14 13 - 461
Sri Lanka 77 164 120 1 9 371
Thailand 8 299 26 2 1 336
Pakistan 76 113 75 1 4 269
Philippines 27 153 15 1 1 197
Korea, Democratic People’s Republic of 5 49 16 6 - 76
Afghanistan - 22 26 7 5 60
Indonesia 9 38 13 1 1 62
Macao 3 18 5 6 1 33
Kazakhstan 2 17 4 1 - 24
Viet Nam 2 13 6 - - 21
Maldives 6 4 2 - - 12
Mongolia - 10 1 - - 11
Other Asia 5 28 10 6 3 52
Total 1,966 20,923 4,199 324 171 27,583
Total Asia % Distribution 7.1 75.9 15.2 1.2 0.6 100.0
Antarctica - - - 1 1 2
Not Known 210 83 16 187 186 682
Grand Total 398,668 502,309 411,980 305,247 156,756 1,774,960
Overall % Distrubtion 22.5 28.3 23.2 17.2 8.8 100.0

Appendix 3
Tourism Statistics Annual Report 2017 35
Appendix 3: Total Arrivals by Nationality and Gender, 2017
Nationality
Sex
Total % DistributionMale Female
SADC
Zimbabwe 466,603 340,729 807,332 35.0
South Africa 484,003 221,991 705,994 30.6
Namibia 125,729 62,860 188,589 8.2
Zambia 132,234 55,277 187,511 8.1
Lesotho 7,669 13,366 21,035 0.9
Malawi 15,583 4,173 19,756 0.9
Swaziland 6,634 2,400 9,034 0.4
Mozambique 6,207 2,011 8,218 0.4
United Republic of Tanzania 5,385 1,293 6,678 0.3
Angola 1,300 443 1,743 0.1
Democratic Republic of the Congo 1,074 586 1,660 0.1
Mauritius 1,075 455 1,530 0.1
Seychelles 127 186 313 0.0
Madagascar 120 85 205 0.0
Total 1,253,743 705,855 1,959,598 85.0
Rest of Africa
Kenya 4,560 2,029 6,589 0.3
Uganda 1,721 601 2,322 0.1
Nigeria 1,347 431 1,778 0.1
Ghana 540 254 794 0.0
Ethiopia 372 244 616 0.0
Cameroon 147 50 197 0.0
Rwanda 73 92 165 0.0
Sierra Leone 126 24 150 0.0
Libya 91 57 148 0.0
Egypt 94 45 139 0.0
Congo 99 28 127 0.0
Somalia 105 - 105 0.0
Senegal 73 26 99 0.0
Sudan 66 23 89 0.0
Burkina Faso 69 5 74 0.0
Togo 47 7 54 0.0
Djibouti 44 8 52 0.0
Morocco 30 22 52 0.0
Liberia 32 17 49 0.0
Gambia 41 7 48 0.0
Burundi 35 9 44 0.0
Benin 40 2 42 0.0
Guinea 30 10 40 0.0
Côte d'Ivoire 34 3 37 0.0
Gabon 27 8 35 0.0
Tunisia 22 9 31 0.0
Algeria 20 6 26 0.0
Comoros 19 7 26 0.0
Mali 19 5 24 0.0
Eritrea 14 7 21 0.0
Chad 12 3 15 0.0
Equatorial Guinea 7 5 12 0.0
Other Africa 13 2 15 0.0
Total 9,956 4,044 14,015 0.6
Tourism Statistics Annual Report 201736
Appendix 3 Continued: Total Arrivals by Nationality and Gender, 2017
Nationality
Sex
Total % DistributionMale Female
Europe
Germany 25,275 25,169 50,444 2.2
United Kingdom 21,618 18,440 40,058 1.7
France 8,073 7,404 15,477 0.7
Netherlands 7,242 6,996 14,238 0.6
Switzerland 4,038 4,605 8,643 0.4
Italy 4,302 3,678 7,980 0.3
Spain 3,761 3,924 7,685 0.3
Belgium 3,495 2,816 6,311 0.3
Austria 1,870 1,698 3,568 0.2
Ireland 1,533 1,366 2,899 0.1
Sweden 1,302 1,298 2,600 0.1
Denmark 1,283 1,231 2,514 0.1
Portugal 1,374 908 2,282 0.1
Poland 1,033 889 1,922 0.1
Norway 759 1,145 1,904 0.1
Russian Federation 934 840 1,774 0.1
Czech Republic 828 549 1,377 0.1
Finland 376 560 936 0.0
Greece 365 289 654 0.0
Turkey 329 291 620 0.0
Hungary 279 282 561 0.0
Slovakia 300 201 501 0.0
Bulgaria 248 210 458 0.0
Romania 222 186 408 0.0
Serbia 239 144 383 0.0
Slovenia 123 146 269 0.0
Croatia 103 128 231 0.0
Luxembourg 86 121 207 0.0
Ukraine 104 81 185 0.0
Cyprus 112 70 182 0.0
Lithuania 61 74 135 0.0
Estonia 68 35 103 0.0
Malta 48 50 98 0.0
Iceland 33 55 88 0.0
Latvia 58 28 86 0.0
British Indian Ocean Territory 25 15 40 0.0
Bosnia and Herzegovina 20 16 36 0.0
Liechtenstein 18 16 34 0.0
Belarus 15 14 29 0.0
Andorra 10 8 18 0.0
Georgia 7 6 13 0.0
Saint Lucia 6 4 10 0.0
Other Europe 27 23 50 0.0
Total 91,975 85,986 178,011 7.7
America
United States 27,174 31,978 59,152 2.6
Canada 4,673 5,168 9,841 0.4
Brazil 880 804 1,684 0.1
Mexico 410 447 857 0.0
Argentina 301 221 522 0.0
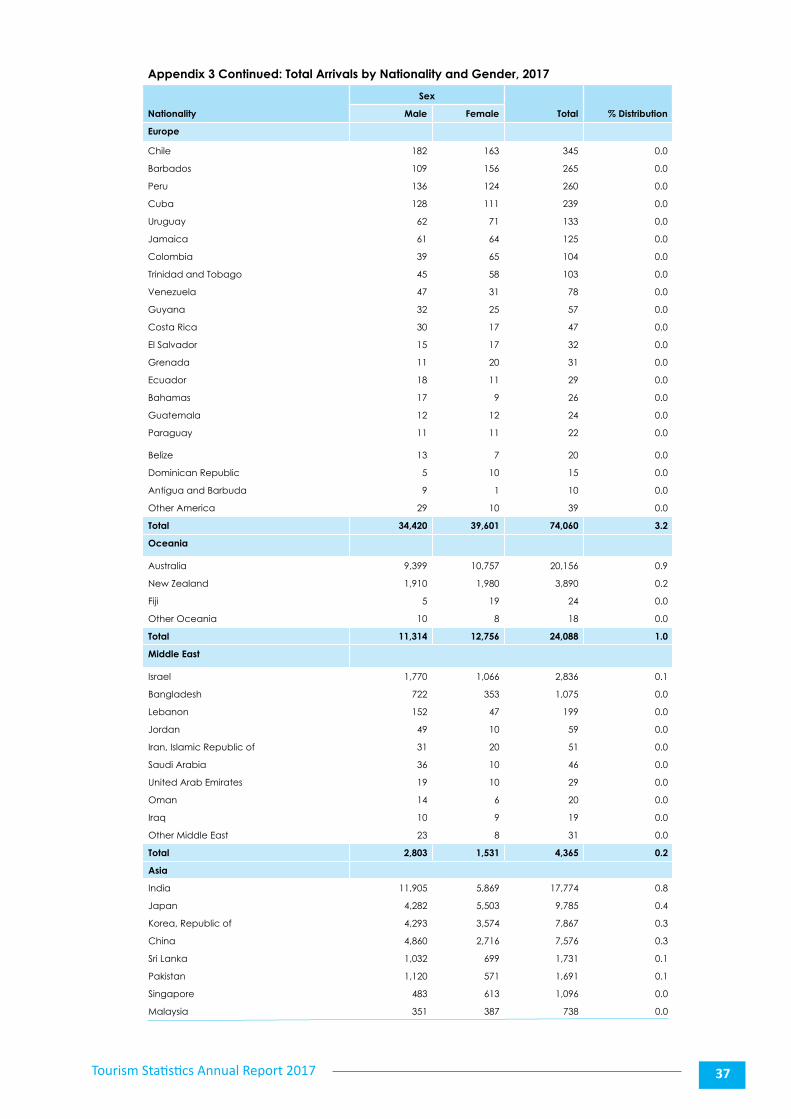
Tourism Statistics Annual Report 2017 37
Appendix 3 Continued: Total Arrivals by Nationality and Gender, 2017
Nationality
Sex
Total % DistributionMale Female
Europe
Chile 182 163 345 0.0
Barbados 109 156 265 0.0
Peru 136 124 260 0.0
Cuba 128 111 239 0.0
Uruguay 62 71 133 0.0
Jamaica 61 64 125 0.0
Colombia 39 65 104 0.0
Trinidad and Tobago 45 58 103 0.0
Venezuela 47 31 78 0.0
Guyana 32 25 57 0.0
Costa Rica 30 17 47 0.0
El Salvador 15 17 32 0.0
Grenada 11 20 31 0.0
Ecuador 18 11 29 0.0
Bahamas 17 9 26 0.0
Guatemala 12 12 24 0.0
Paraguay 11 11 22 0.0
Belize 13 7 20 0.0
Dominican Republic 5 10 15 0.0
Antigua and Barbuda 9 1 10 0.0
Other America 29 10 39 0.0
Total 34,420 39,601 74,060 3.2
Oceania
Australia 9,399 10,757 20,156 0.9
New Zealand 1,910 1,980 3,890 0.2
Fiji 5 19 24 0.0
Other Oceania 10 8 18 0.0
Total 11,314 12,756 24,088 1.0
Middle East
Israel 1,770 1,066 2,836 0.1
Bangladesh 722 353 1,075 0.0
Lebanon 152 47 199 0.0
Jordan 49 10 59 0.0
Iran, Islamic Republic of 31 20 51 0.0
Saudi Arabia 36 10 46 0.0
United Arab Emirates 19 10 29 0.0
Oman 14 6 20 0.0
Iraq 10 9 19 0.0
Other Middle East 23 8 31 0.0
Total 2,803 1,531 4,365 0.2
Asia
India 11,905 5,869 17,774 0.8
Japan 4,282 5,503 9,785 0.4
Korea, Republic of 4,293 3,574 7,867 0.3
China 4,860 2,716 7,576 0.3
Sri Lanka 1,032 699 1,731 0.1
Pakistan 1,120 571 1,691 0.1
Singapore 483 613 1,096 0.0
Malaysia 351 387 738 0.0
Tourism Statistics Annual Report 201738
Appendix 3 Continued: Total Arrivals by Nationality and Gender, 2017
Nationality
Sex
Total % DistributionMale Female
Europe
Taiwan, Province of China 222 306 528 0.0
Philippines 214 204 418 0.0
Hong Kong 165 202 367 0.0
Thailand 143 187 330 0.0
Korea, Democratic People's Republic of 43 47 90 0.0
Indonesia 34 44 78 0.0
Maldives 18 17 35 0.0
Viet Nam 4 21 25 0.0
Kazakhstan 8 13 21 0.0
Nepal 14 7 21 0.0
Mongolia 17 - 17 0.0
Afghanistan 9 6 15 0.0
Macao 11 1 12 0.0
Other Asia 10 13 23 0.0
Total 29,228 20,987 50,238 2.2
Antarctica 1 1 2 0.0
Not Known 510 318 828 0.0
Grand Total 1,433,950 871,079 2,305,205 100

Appendix 4
Tourism Statistics Annual Report 201740
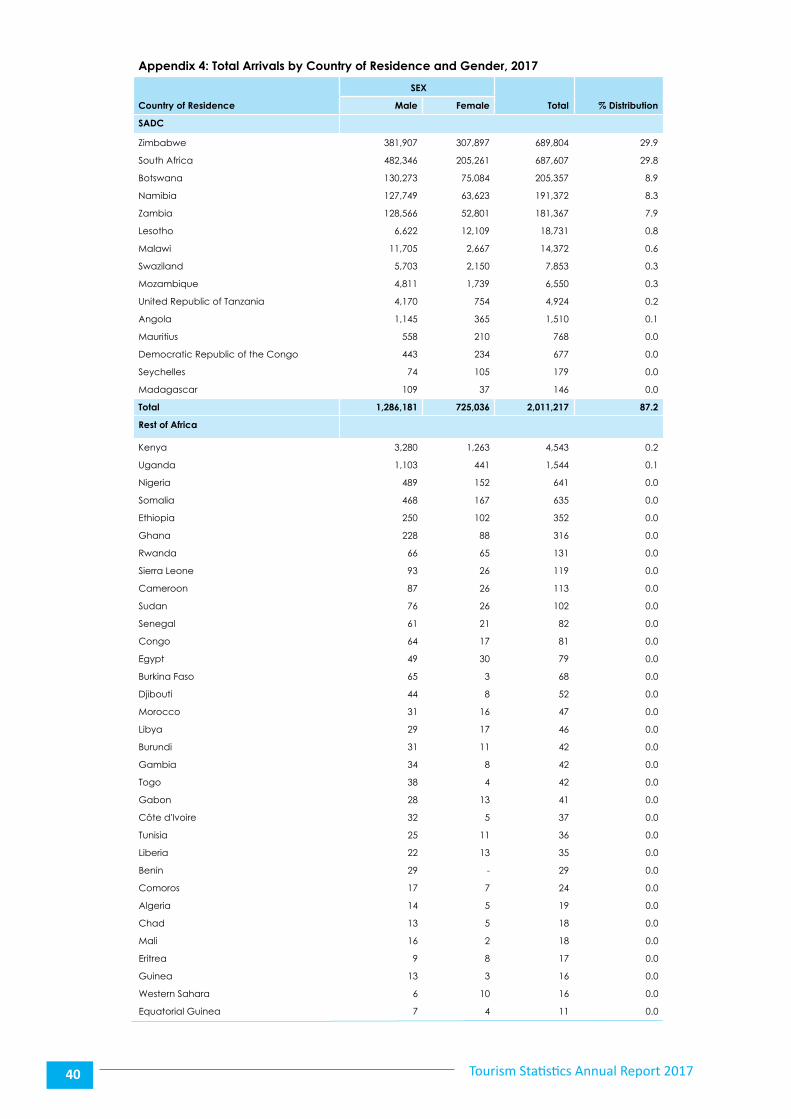
Appendix 4: Total Arrivals by Country of Residence and Gender, 2017
Country of Residence
SEX
Total % Distribution Male Female
SADC
Zimbabwe 381,907 307,897 689,804 29.9
South Africa 482,346 205,261 687,607 29.8
Botswana 130,273 75,084 205,357 8.9
Namibia 127,749 63,623 191,372 8.3
Zambia 128,566 52,801 181,367 7.9
Lesotho 6,622 12,109 18,731 0.8
Malawi 11,705 2,667 14,372 0.6
Swaziland 5,703 2,150 7,853 0.3
Mozambique 4,811 1,739 6,550 0.3
United Republic of Tanzania 4,170 754 4,924 0.2
Angola 1,145 365 1,510 0.1
Mauritius 558 210 768 0.0
Democratic Republic of the Congo 443 234 677 0.0
Seychelles 74 105 179 0.0
Madagascar 109 37 146 0.0
Total 1,286,181 725,036 2,011,217 87.2
Rest of Africa
Kenya 3,280 1,263 4,543 0.2
Uganda 1,103 441 1,544 0.1
Nigeria 489 152 641 0.0
Somalia 468 167 635 0.0
Ethiopia 250 102 352 0.0
Ghana 228 88 316 0.0
Rwanda 66 65 131 0.0
Sierra Leone 93 26 119 0.0
Cameroon 87 26 113 0.0
Sudan 76 26 102 0.0
Senegal 61 21 82 0.0
Congo 64 17 81 0.0
Egypt 49 30 79 0.0
Burkina Faso 65 3 68 0.0
Djibouti 44 8 52 0.0
Morocco 31 16 47 0.0
Libya 29 17 46 0.0
Burundi 31 11 42 0.0
Gambia 34 8 42 0.0
Togo 38 4 42 0.0
Gabon 28 13 41 0.0
Côte d'Ivoire 32 5 37 0.0
Tunisia 25 11 36 0.0
Liberia 22 13 35 0.0
Benin 29 - 29 0.0
Comoros 17 7 24 0.0
Algeria 14 5 19 0.0
Chad 13 5 18 0.0
Mali 16 2 18 0.0
Eritrea 9 8 17 0.0
Guinea 13 3 16 0.0
Western Sahara 6 10 16 0.0
Equatorial Guinea 7 4 11 0.0
Tourism Statistics Annual Report 2017 41
Appendix 4 Continued: Total Arrivals by Country of Residence and Gender, 2017
Country of Residence
SEX
Total % Distribution Male Female
Mauritania 9 2 11 0.0
Other Africa 15 7 22 0.0
Total 6,841 2,586 9,427 0.4
Europe
Germany 23,778 24,030 47,808 2.1
United Kingdom 15,710 14,739 30,449 1.3
France 7,436 7,022 14,458 0.6
Netherlands 6,711 6,659 13,370 0.6
Switzerland 4,096 4,560 8,656 0.4
Spain 3,640 3,796 7,436 0.3
Italy 3,842 3,428 7,270 0.3
Belgium 3,218 2,660 5,878 0.3
Austria 1,701 1,599 3,300 0.1
Sweden 1,104 1,165 2,269 0.1
Denmark 1,095 1,147 2,242 0.1
Ireland 1,072 1,050 2,122 0.1
Norway 692 1,110 1,802 0.1
Poland 946 822 1,768 0.1
Russian Federation 865 779 1,644 0.1
Portugal 881 653 1,534 0.1
Czech Republic 819 551 1,370 0.1
Finland 342 505 847 0.0
Turkey 267 277 544 0.0
Greece 274 227 501 0.0
Slovakia 294 205 499 0.0
Hungary 232 256 488 0.0
Romania 179 174 353 0.0
Bulgaria 164 118 282 0.0
Slovenia 114 123 237 0.0
Luxembourg 78 121 199 0.0
Croatia 82 89 171 0.0
Lithuania 57 67 124 0.0
Cyprus 74 48 122 0.0
Ukraine 72 44 116 0.0
Estonia 67 35 102 0.0
Andorra 45 56 101 0.0
Iceland 42 56 98 0.0
Malta 48 41 89 0.0
Serbia 58 29 87 0.0
Latvia 56 26 82 0.0
British Indian Ocean Territory 39 26 65 0.0
Georgia 26 19 45 0.0
Bosnia and Herzegovina 24 13 37 0.0
Liechtenstein 19 15 34 0.0
Monaco 13 12 25 0.0
Belarus 9 12 21 0.0
New Caledonia 12 3 15 0.0
Isle of Man 8 4 12 0.0
Saint Lucia 6 4 10 0.0
Other Europe 40 34 74 0.0
Total 80,347 78,409 158,756 6.9
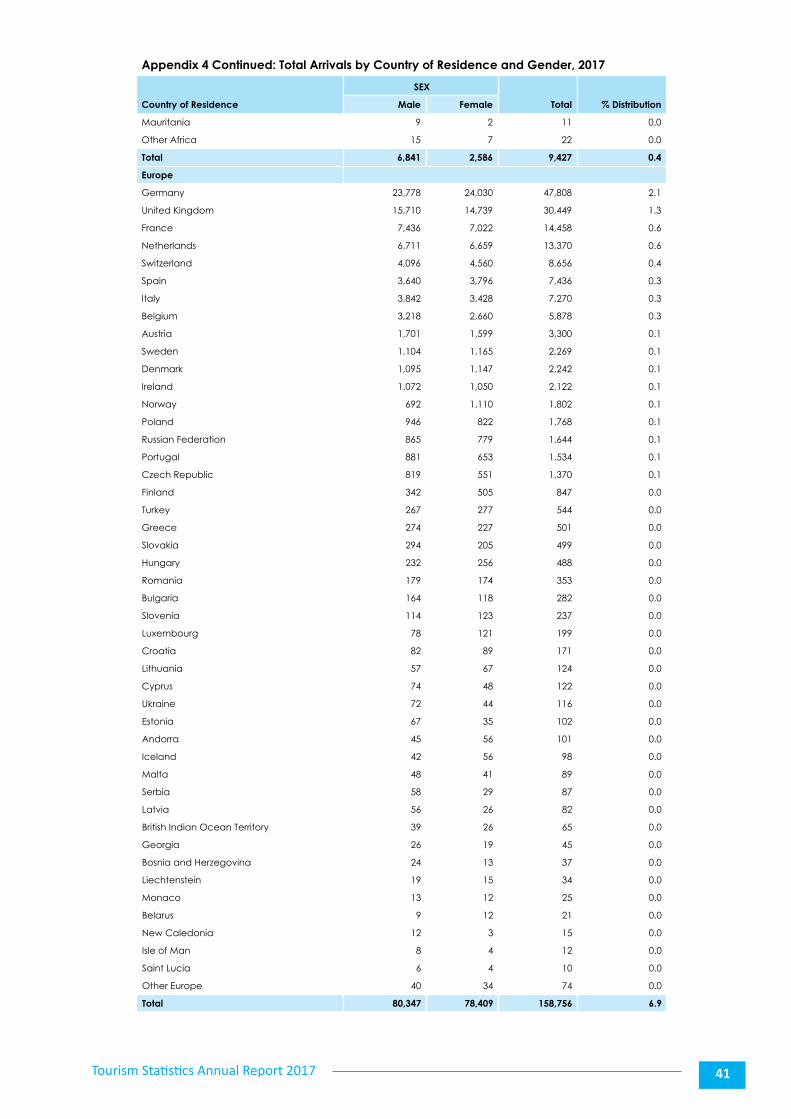
Tourism Statistics Annual Report 201742
Appendix 4 Continued: Total Arrivals by Country of Residence and Gender, 2017
Country of Residence
SEX
Total % Distribution Male Female
America
United States 25,407 30,325 55,732 2.4
Canada 4,566 5,081 9,647 0.4
Brazil 795 746 1,541 0.1
Mexico 409 441 850 0.0
Argentina 240 179 419 0.0
Chile 176 170 346 0.0
Barbados 109 146 255 0.0
Peru 118 102 220 0.0
Uruguay 63 74 137 0.0
Jamaica 39 61 100 0.0
Trinidad and Tobago 35 53 88 0.0
Colombia 34 48 82 0.0
Cuba 32 33 65 0.0
Venezuela 35 23 58 0.0
Bahamas 38 16 54 0.0
Costa Rica 27 17 44 0.0
El Salvador 16 9 25 0.0
Grenada 5 19 24 0.0
Guatemala 13 10 23 0.0
United States Minor Outlying Islands 18 4 22 0.0
Ecuador 10 9 19 0.0
Bermuda 9 9 18 0.0
Bolivia 6 6 12 0.0
Belize 8 4 12 0.0
Panama 8 4 12 0.0
Paraguay 7 5 12 0.0
Dominican Republic 6 5 11 0.0
Guyana 6 4 10 0.0
Aruba 2 8 10 0.0
Other America 17 15 32 0.0
Total 32,254 37,626 69,880 3.0
Oceanina
Australia 8,782 10,344 19,126 0.8
New Zealand 1,661 1,855 3,516 0.2
Solomon Islands 119 53 172 0.0
Fiji 4 18 22 0.0
American Samoa 9 6 15 0.0
Samoa 5 7 12 0.0
Other Oceania 23 6 29 0.0
Total 10,603 12,289 22,892 1.0
Middle East
Israel 1,515 967 2,482 0.1
United Arab Emirates 363 120 483 0.0
Bangladesh 216 81 297 0.0
Yemen 65 42 107 0.0
Lebanon 46 42 88 0.0
Saudi Arabia 32 9 41 0.0
Iran, Islamic Republic of 18 16 34 0.0
Qatar 21 12 33 0.0
Oman 16 8 24 0.0
Jordan 15 5 20 0.0
Tourism Statistics Annual Report 2017 43
Appendix 4 Continued: Total Arrivals by Country of Residence and Gender, 2017
Country of Residence
SEX
Total % Distribution Male Female
Other Middle East 18 3 21 0.0
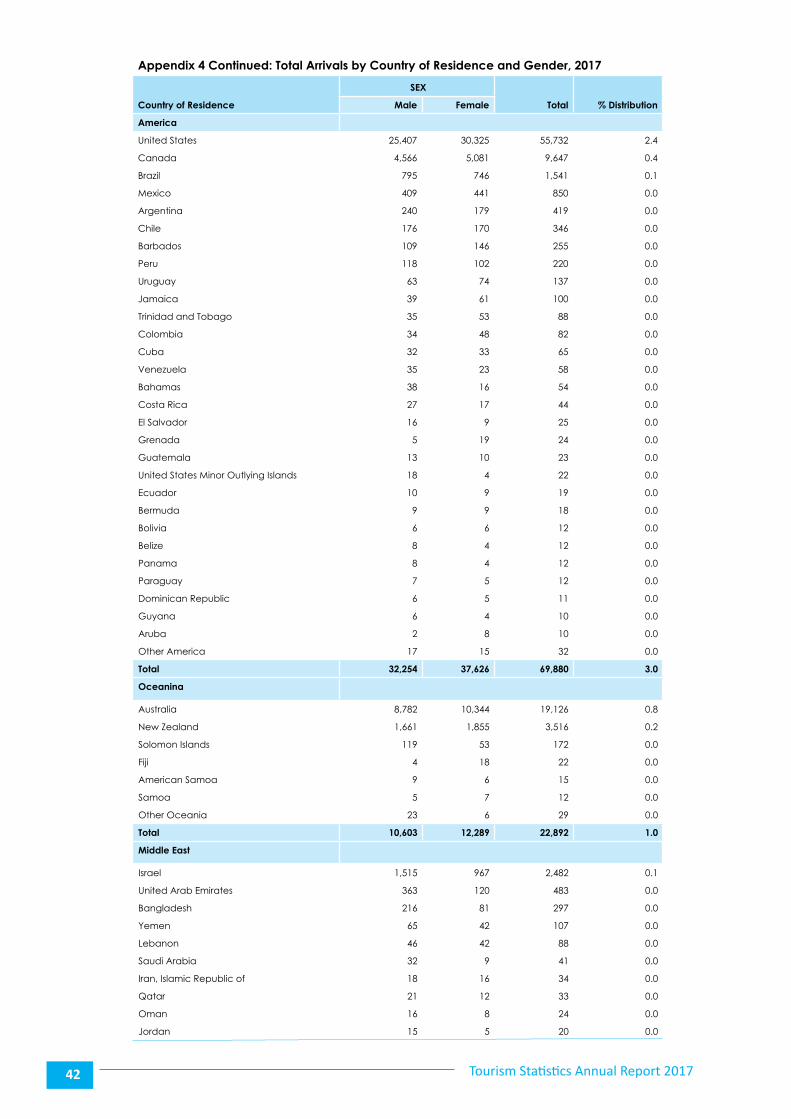
Total 2,325 1,305 3,630 0.2
Alsia
Japan 3,950 5,322 9,272 0.4
Korea, Republic of 3,608 3,291 6,899 0.3
India 3,174 1,262 4,436 0.2
China 1,944 1,382 3,326 0.1
Singapore 506 606 1,112 0.0
Malaysia 323 347 670 0.0
Hong Kong 331 333 664 0.0
Taiwan, Province of China 204 273 477 0.0
Sri Lanka 225 179 404 0.0
Thailand 160 184 344 0.0
Pakistan 181 103 284 0.0
Philippines 99 116 215 0.0
Korea, Democratic People's Republic of 46 42 88 0.0
Afghanistan 40 27 67 0.0
Indonesia 32 32 64 0.0
Macao 30 8 38 0.0
Kazakhstan 13 12 25 0.0
Viet Nam 11 13 24 0.0
Maldives 5 7 12 0.0
Mongolia 11 - 11 0.0
Myanmar 5 5 10 0.0
Other Asia 29 18 47 0.0
Total 14,927 13,562 28,489 1.2
Antarctica 1 1 2 0.0
Not Known 583 329 912 0.0
Grand Total 1,434,062 871,143 2,305,205 100.0

Appendix 5
Tourism Statistics Annual Report 2017 45
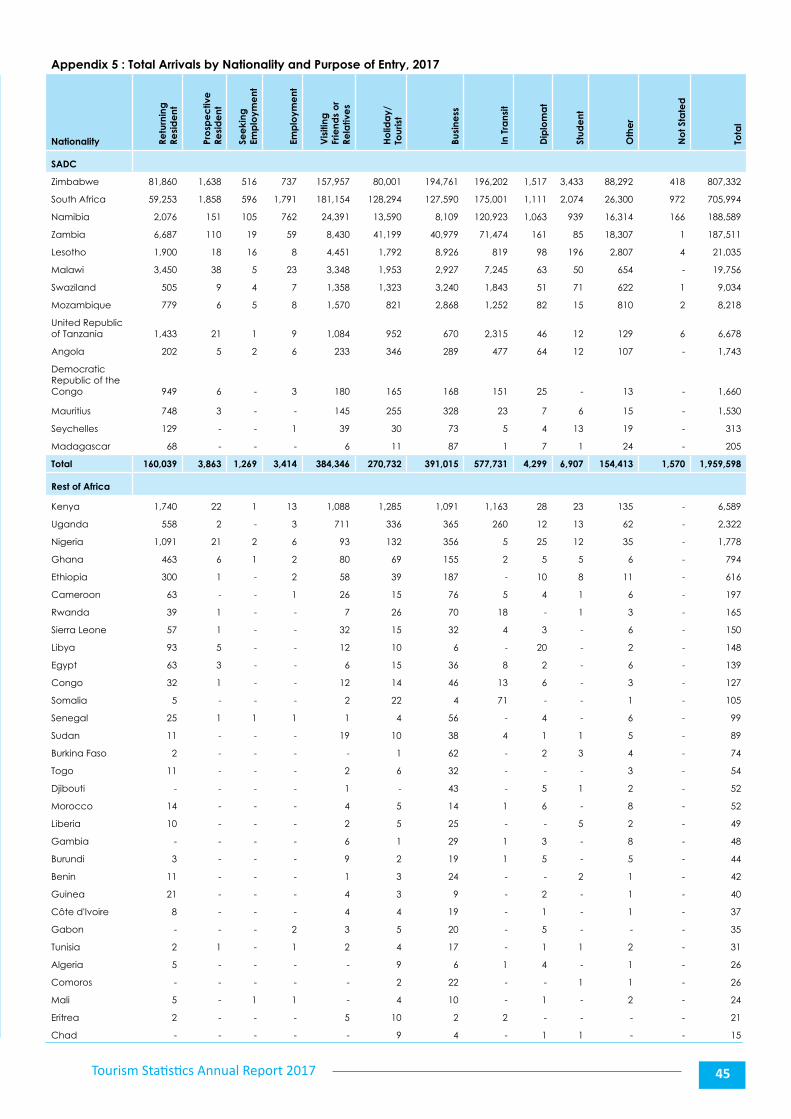
Appendix 5 : Total Arrivals by Nationality and Purpose of Entry, 2017
Nationality Retu
rnin
g
Resi
de
nt
Pro
spe
ctiv
e
Resi
de
nt
See
king
Em
plo
yme
nt
Emp
loym
ent
Vis
iting
Fr
iend
s o
r Re
lativ
es
Ho
lida
y/To
uris
t
Busi
ness
In T
rans
it
Dip
lom
at
Stud
ent
Oth
er
No
t Sta
ted
Tota
l
SADC
Zimbabwe 81,860 1,638 516 737 157,957 80,001 194,761 196,202 1,517 3,433 88,292 418 807,332
South Africa 59,253 1,858 596 1,791 181,154 128,294 127,590 175,001 1,111 2,074 26,300 972 705,994
Namibia 2,076 151 105 762 24,391 13,590 8,109 120,923 1,063 939 16,314 166 188,589
Zambia 6,687 110 19 59 8,430 41,199 40,979 71,474 161 85 18,307 1 187,511
Lesotho 1,900 18 16 8 4,451 1,792 8,926 819 98 196 2,807 4 21,035
Malawi 3,450 38 5 23 3,348 1,953 2,927 7,245 63 50 654 - 19,756
Swaziland 505 9 4 7 1,358 1,323 3,240 1,843 51 71 622 1 9,034
Mozambique 779 6 5 8 1,570 821 2,868 1,252 82 15 810 2 8,218
United Republic of Tanzania 1,433 21 1 9 1,084 952 670 2,315 46 12 129 6 6,678
Angola 202 5 2 6 233 346 289 477 64 12 107 - 1,743
Democratic Republic of the Congo 949 6 - 3 180 165 168 151 25 - 13 - 1,660
Mauritius 748 3 - - 145 255 328 23 7 6 15 - 1,530
Seychelles 129 - - 1 39 30 73 5 4 13 19 - 313
Madagascar 68 - - - 6 11 87 1 7 1 24 - 205
Total 160,039 3,863 1,269 3,414 384,346 270,732 391,015 577,731 4,299 6,907 154,413 1,570 1,959,598
Rest of Africa
Kenya 1,740 22 1 13 1,088 1,285 1,091 1,163 28 23 135 - 6,589
Uganda 558 2 - 3 711 336 365 260 12 13 62 - 2,322
Nigeria 1,091 21 2 6 93 132 356 5 25 12 35 - 1,778
Ghana 463 6 1 2 80 69 155 2 5 5 6 - 794
Ethiopia 300 1 - 2 58 39 187 - 10 8 11 - 616
Cameroon 63 - - 1 26 15 76 5 4 1 6 - 197
Rwanda 39 1 - - 7 26 70 18 - 1 3 - 165
Sierra Leone 57 1 - - 32 15 32 4 3 - 6 - 150
Libya 93 5 - - 12 10 6 - 20 - 2 - 148
Egypt 63 3 - - 6 15 36 8 2 - 6 - 139
Congo 32 1 - - 12 14 46 13 6 - 3 - 127
Somalia 5 - - - 2 22 4 71 - - 1 - 105
Senegal 25 1 1 1 1 4 56 - 4 - 6 - 99
Sudan 11 - - - 19 10 38 4 1 1 5 - 89
Burkina Faso 2 - - - - 1 62 - 2 3 4 - 74
Togo 11 - - - 2 6 32 - - - 3 - 54
Djibouti - - - - 1 - 43 - 5 1 2 - 52
Morocco 14 - - - 4 5 14 1 6 - 8 - 52
Liberia 10 - - - 2 5 25 - - 5 2 - 49
Gambia - - - - 6 1 29 1 3 - 8 - 48
Burundi 3 - - - 9 2 19 1 5 - 5 - 44
Benin 11 - - - 1 3 24 - - 2 1 - 42
Guinea 21 - - - 4 3 9 - 2 - 1 - 40
Côte d'Ivoire 8 - - - 4 4 19 - 1 - 1 - 37
Gabon - - - 2 3 5 20 - 5 - - - 35
Tunisia 2 1 - 1 2 4 17 - 1 1 2 - 31
Algeria 5 - - - - 9 6 1 4 - 1 - 26
Comoros - - - - - 2 22 - - 1 1 - 26
Mali 5 - 1 1 - 4 10 - 1 - 2 - 24
Eritrea 2 - - - 5 10 2 2 - - - - 21
Chad - - - - - 9 4 - 1 1 - - 15
Tourism Statistics Annual Report 201746
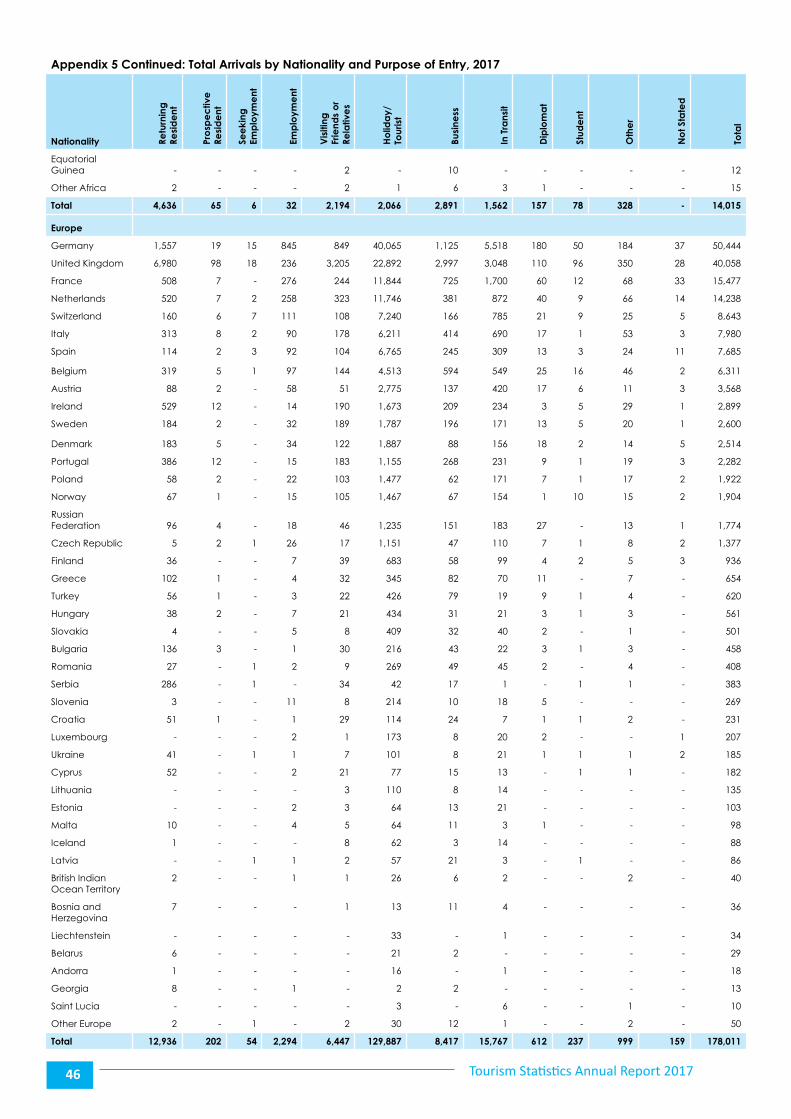
Appendix 5 Continued: Total Arrivals by Nationality and Purpose of Entry, 2017
Nationality Retu
rnin
g
Resi
de
nt
Pro
spe
ctiv
e
Resi
de
nt
See
king
Em
plo
yme
nt
Emp
loym
ent
Vis
iting
Fr
iend
s o
r Re
lativ
es
Ho
lida
y/To
uris
t
Busi
ness
In T
rans
it
Dip
lom
at
Stud
ent
Oth
er
No
t Sta
ted
Tota
l
Equatorial Guinea - - - - 2 - 10 - - - - - 12
Other Africa 2 - - - 2 1 6 3 1 - - - 15
Total 4,636 65 6 32 2,194 2,066 2,891 1,562 157 78 328 - 14,015
Europe
Germany 1,557 19 15 845 849 40,065 1,125 5,518 180 50 184 37 50,444
United Kingdom 6,980 98 18 236 3,205 22,892 2,997 3,048 110 96 350 28 40,058
France 508 7 - 276 244 11,844 725 1,700 60 12 68 33 15,477
Netherlands 520 7 2 258 323 11,746 381 872 40 9 66 14 14,238
Switzerland 160 6 7 111 108 7,240 166 785 21 9 25 5 8,643
Italy 313 8 2 90 178 6,211 414 690 17 1 53 3 7,980
Spain 114 2 3 92 104 6,765 245 309 13 3 24 11 7,685
Belgium 319 5 1 97 144 4,513 594 549 25 16 46 2 6,311
Austria 88 2 - 58 51 2,775 137 420 17 6 11 3 3,568
Ireland 529 12 - 14 190 1,673 209 234 3 5 29 1 2,899
Sweden 184 2 - 32 189 1,787 196 171 13 5 20 1 2,600
Denmark 183 5 - 34 122 1,887 88 156 18 2 14 5 2,514
Portugal 386 12 - 15 183 1,155 268 231 9 1 19 3 2,282
Poland 58 2 - 22 103 1,477 62 171 7 1 17 2 1,922
Norway 67 1 - 15 105 1,467 67 154 1 10 15 2 1,904
Russian Federation 96 4 - 18 46 1,235 151 183 27 - 13 1 1,774
Czech Republic 5 2 1 26 17 1,151 47 110 7 1 8 2 1,377
Finland 36 - - 7 39 683 58 99 4 2 5 3 936
Greece 102 1 - 4 32 345 82 70 11 - 7 - 654
Turkey 56 1 - 3 22 426 79 19 9 1 4 - 620
Hungary 38 2 - 7 21 434 31 21 3 1 3 - 561
Slovakia 4 - - 5 8 409 32 40 2 - 1 - 501
Bulgaria 136 3 - 1 30 216 43 22 3 1 3 - 458
Romania 27 - 1 2 9 269 49 45 2 - 4 - 408
Serbia 286 - 1 - 34 42 17 1 - 1 1 - 383
Slovenia 3 - - 11 8 214 10 18 5 - - - 269
Croatia 51 1 - 1 29 114 24 7 1 1 2 - 231
Luxembourg - - - 2 1 173 8 20 2 - - 1 207
Ukraine 41 - 1 1 7 101 8 21 1 1 1 2 185
Cyprus 52 - - 2 21 77 15 13 - 1 1 - 182
Lithuania - - - - 3 110 8 14 - - - - 135
Estonia - - - 2 3 64 13 21 - - - - 103
Malta 10 - - 4 5 64 11 3 1 - - - 98
Iceland 1 - - - 8 62 3 14 - - - - 88
Latvia - - 1 1 2 57 21 3 - 1 - - 86
British Indian Ocean Territory
2 - - 1 1 26 6 2 - - 2 - 40
Bosnia and Herzegovina
7 - - - 1 13 11 4 - - - - 36
Liechtenstein - - - - - 33 - 1 - - - - 34
Belarus 6 - - - - 21 2 - - - - - 29
Andorra 1 - - - - 16 - 1 - - - - 18
Georgia 8 - - 1 - 2 2 - - - - - 13
Saint Lucia - - - - - 3 - 6 - - 1 - 10
Other Europe 2 - 1 - 2 30 12 1 - - 2 - 50
Total 12,936 202 54 2,294 6,447 129,887 8,417 15,767 612 237 999 159 178,011
Tourism Statistics Annual Report 2017 47
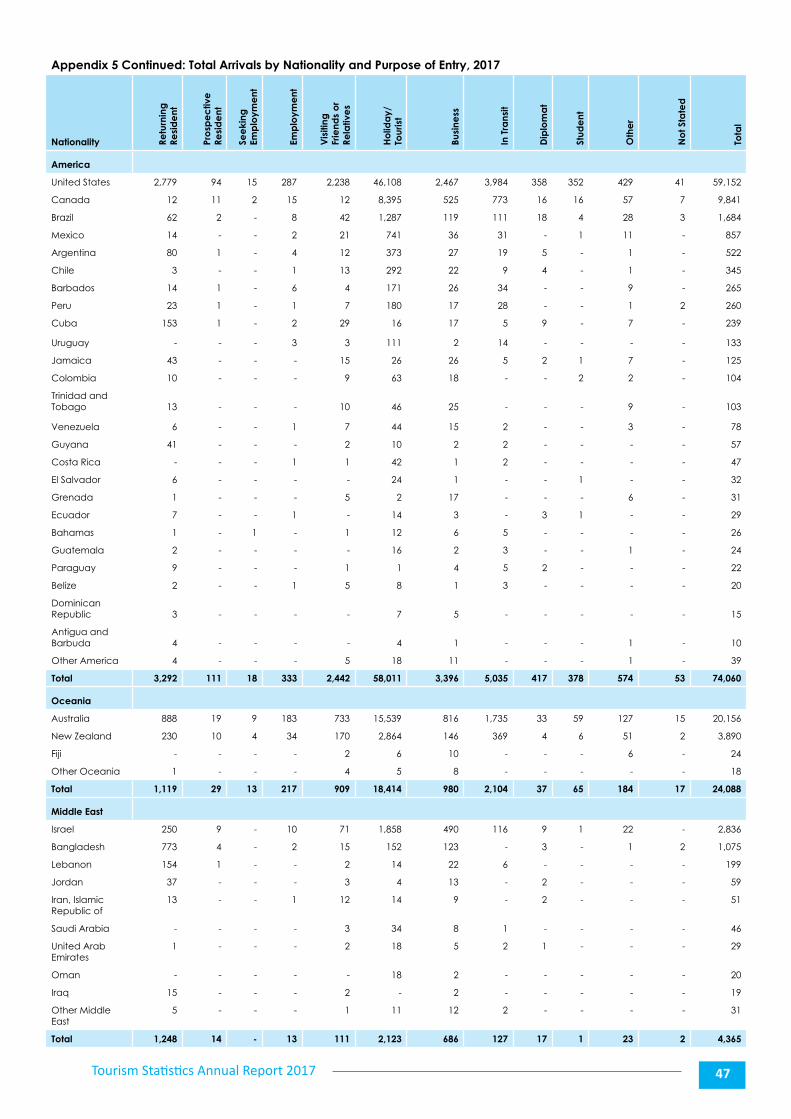
Appendix 5 Continued: Total Arrivals by Nationality and Purpose of Entry, 2017
Nationality Retu
rnin
g
Resi
de
nt
Pro
spe
ctiv
e
Resi
de
nt
See
king
Em
plo
yme
nt
Emp
loym
ent
Vis
iting
Fr
iend
s o
r Re
lativ
es
Ho
lida
y/To
uris
t
Busi
ness
In T
rans
it
Dip
lom
at
Stud
ent
Oth
er
No
t Sta
ted
Tota
l
America
United States 2,779 94 15 287 2,238 46,108 2,467 3,984 358 352 429 41 59,152
Canada 12 11 2 15 12 8,395 525 773 16 16 57 7 9,841
Brazil 62 2 - 8 42 1,287 119 111 18 4 28 3 1,684
Mexico 14 - - 2 21 741 36 31 - 1 11 - 857
Argentina 80 1 - 4 12 373 27 19 5 - 1 - 522
Chile 3 - - 1 13 292 22 9 4 - 1 - 345
Barbados 14 1 - 6 4 171 26 34 - - 9 - 265
Peru 23 1 - 1 7 180 17 28 - - 1 2 260
Cuba 153 1 - 2 29 16 17 5 9 - 7 - 239
Uruguay - - - 3 3 111 2 14 - - - - 133
Jamaica 43 - - - 15 26 26 5 2 1 7 - 125
Colombia 10 - - - 9 63 18 - - 2 2 - 104
Trinidad and Tobago 13 - - - 10 46 25 - - - 9 - 103
Venezuela 6 - - 1 7 44 15 2 - - 3 - 78
Guyana 41 - - - 2 10 2 2 - - - - 57
Costa Rica - - - 1 1 42 1 2 - - - - 47
El Salvador 6 - - - - 24 1 - - 1 - - 32
Grenada 1 - - - 5 2 17 - - - 6 - 31
Ecuador 7 - - 1 - 14 3 - 3 1 - - 29
Bahamas 1 - 1 - 1 12 6 5 - - - - 26
Guatemala 2 - - - - 16 2 3 - - 1 - 24
Paraguay 9 - - - 1 1 4 5 2 - - - 22
Belize 2 - - 1 5 8 1 3 - - - - 20
Dominican Republic 3 - - - - 7 5 - - - - - 15
Antigua and Barbuda 4 - - - - 4 1 - - - 1 - 10
Other America 4 - - - 5 18 11 - - - 1 - 39
Total 3,292 111 18 333 2,442 58,011 3,396 5,035 417 378 574 53 74,060
Oceania
Australia 888 19 9 183 733 15,539 816 1,735 33 59 127 15 20,156
New Zealand 230 10 4 34 170 2,864 146 369 4 6 51 2 3,890
Fiji - - - - 2 6 10 - - - 6 - 24
Other Oceania 1 - - - 4 5 8 - - - - - 18
Total 1,119 29 13 217 909 18,414 980 2,104 37 65 184 17 24,088
Middle East
Israel 250 9 - 10 71 1,858 490 116 9 1 22 - 2,836
Bangladesh 773 4 - 2 15 152 123 - 3 - 1 2 1,075
Lebanon 154 1 - - 2 14 22 6 - - - - 199
Jordan 37 - - - 3 4 13 - 2 - - - 59
Iran, Islamic Republic of
13 - - 1 12 14 9 - 2 - - - 51
Saudi Arabia - - - - 3 34 8 1 - - - - 46
United Arab Emirates
1 - - - 2 18 5 2 1 - - - 29
Oman - - - - - 18 2 - - - - - 20
Iraq 15 - - - 2 - 2 - - - - - 19
Other Middle East
5 - - - 1 11 12 2 - - - - 31
Total 1,248 14 - 13 111 2,123 686 127 17 1 23 2 4,365
Tourism Statistics Annual Report 201748
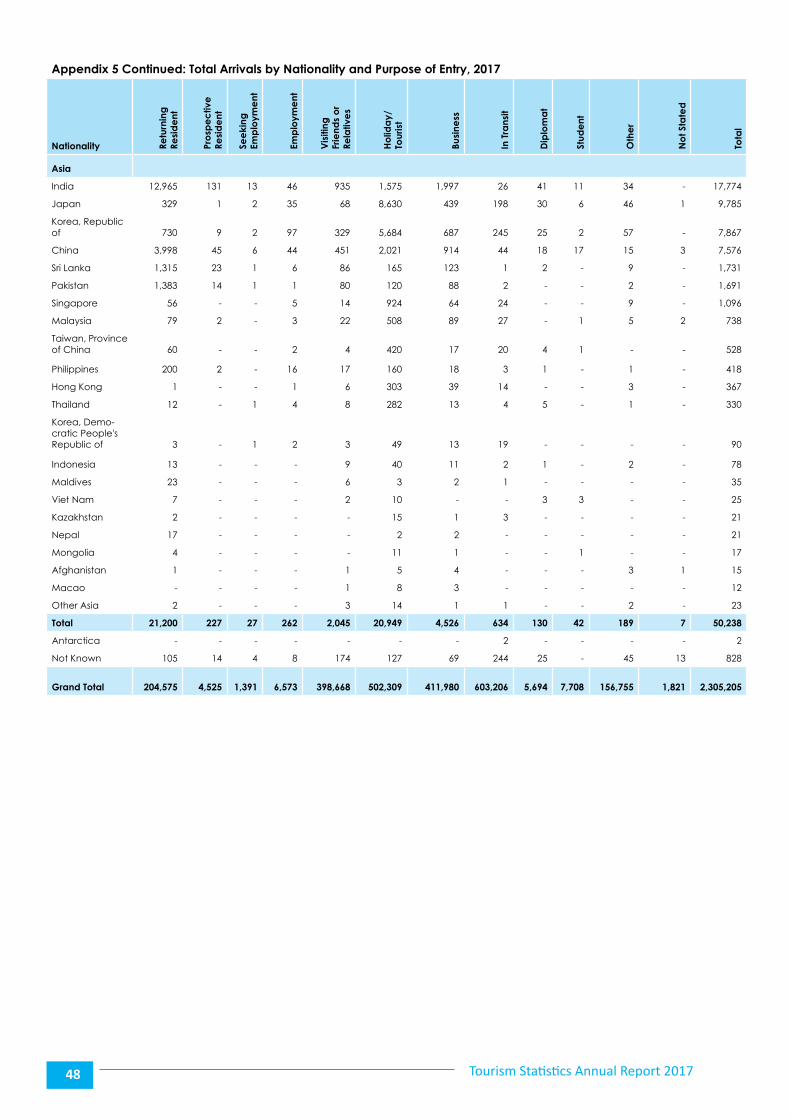
Appendix 5 Continued: Total Arrivals by Nationality and Purpose of Entry, 2017
Nationality Retu
rnin
g
Resi
de
nt
Pro
spe
ctiv
e
Resi
de
nt
See
king
Em
plo
yme
nt
Emp
loym
ent
Vis
iting
Fr
iend
s o
r Re
lativ
es
Ho
lida
y/To
uris
t
Busi
ness
In T
rans
it
Dip
lom
at
Stud
ent
Oth
er
No
t Sta
ted
Tota
l
Asia
India 12,965 131 13 46 935 1,575 1,997 26 41 11 34 - 17,774
Japan 329 1 2 35 68 8,630 439 198 30 6 46 1 9,785
Korea, Republic of 730 9 2 97 329 5,684 687 245 25 2 57 - 7,867
China 3,998 45 6 44 451 2,021 914 44 18 17 15 3 7,576
Sri Lanka 1,315 23 1 6 86 165 123 1 2 - 9 - 1,731
Pakistan 1,383 14 1 1 80 120 88 2 - - 2 - 1,691
Singapore 56 - - 5 14 924 64 24 - - 9 - 1,096
Malaysia 79 2 - 3 22 508 89 27 - 1 5 2 738
Taiwan, Province of China 60 - - 2 4 420 17 20 4 1 - - 528
Philippines 200 2 - 16 17 160 18 3 1 - 1 - 418
Hong Kong 1 - - 1 6 303 39 14 - - 3 - 367
Thailand 12 - 1 4 8 282 13 4 5 - 1 - 330
Korea, Demo-cratic People's Republic of 3 - 1 2 3 49 13 19 - - - - 90
Indonesia 13 - - - 9 40 11 2 1 - 2 - 78
Maldives 23 - - - 6 3 2 1 - - - - 35
Viet Nam 7 - - - 2 10 - - 3 3 - - 25
Kazakhstan 2 - - - - 15 1 3 - - - - 21
Nepal 17 - - - - 2 2 - - - - - 21
Mongolia 4 - - - - 11 1 - - 1 - - 17
Afghanistan 1 - - - 1 5 4 - - - 3 1 15
Macao - - - - 1 8 3 - - - - - 12
Other Asia 2 - - - 3 14 1 1 - - 2 - 23
Total 21,200 227 27 262 2,045 20,949 4,526 634 130 42 189 7 50,238
Antarctica - - - - - - - 2 - - - - 2
Not Known 105 14 4 8 174 127 69 244 25 - 45 13 828
Grand Total 204,575 4,525
1,391 6,573 398,668 502,309 411,980 603,206 5,694 7,708 156,755 1,821 2,305,205

Appendix 6
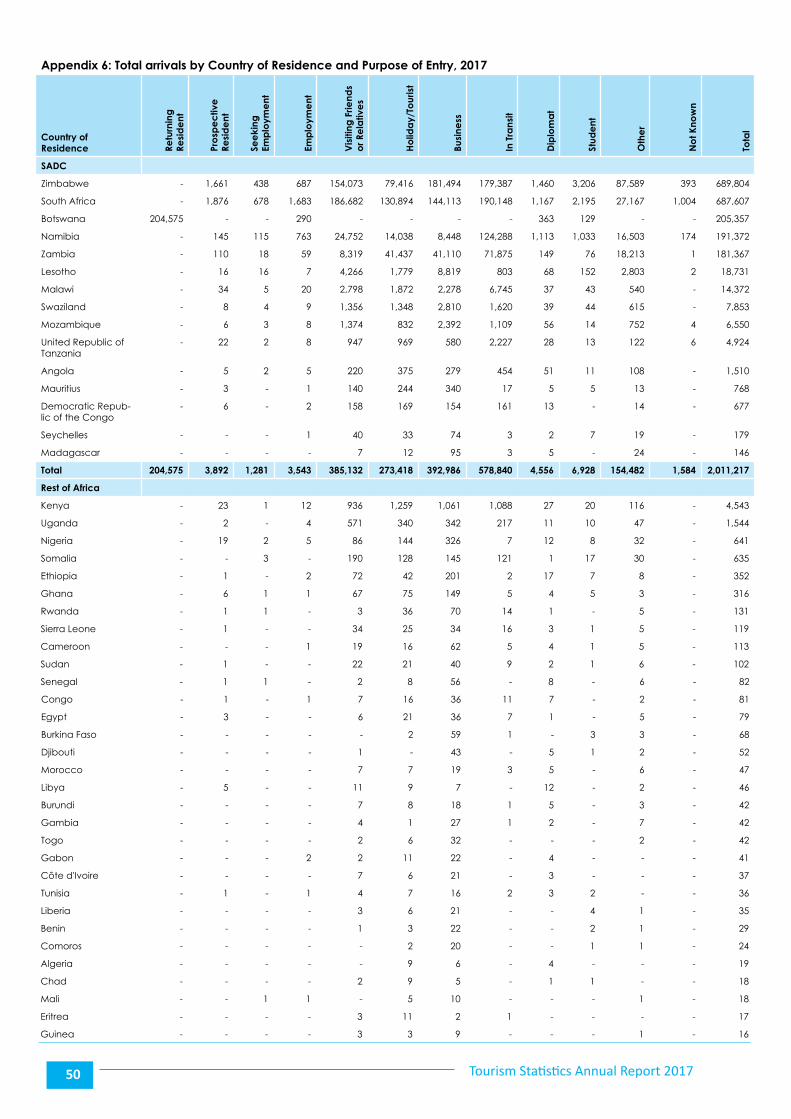
Tourism Statistics Annual Report 201750
Appendix 6: Total arrivals by Country of Residence and Purpose of Entry, 2017
Country of Residence Re
turn
ing
Re
sid
ent
Pro
spe
ctiv
e
Resi
de
nt
See
king
Em
plo
yme
nt
Emp
loym
ent
Vis
iting
Frie
nds
or R
ela
tive
s
Ho
lida
y/To
uris
t
Busi
ness
In T
rans
it
Dip
lom
at
Stud
ent
Oth
er
No
t Kno
wn
Tota
l
SADC
Zimbabwe - 1,661 438 687 154,073 79,416 181,494 179,387 1,460 3,206 87,589 393 689,804
South Africa - 1,876 678 1,683 186,682 130,894 144,113 190,148 1,167 2,195 27,167 1,004 687,607
Botswana 204,575 - - 290 - - - - 363 129 - - 205,357
Namibia - 145 115 763 24,752 14,038 8,448 124,288 1,113 1,033 16,503 174 191,372
Zambia - 110 18 59 8,319 41,437 41,110 71,875 149 76 18,213 1 181,367
Lesotho - 16 16 7 4,266 1,779 8,819 803 68 152 2,803 2 18,731
Malawi - 34 5 20 2,798 1,872 2,278 6,745 37 43 540 - 14,372
Swaziland - 8 4 9 1,356 1,348 2,810 1,620 39 44 615 - 7,853
Mozambique - 6 3 8 1,374 832 2,392 1,109 56 14 752 4 6,550
United Republic of Tanzania
- 22 2 8 947 969 580 2,227 28 13 122 6 4,924
Angola - 5 2 5 220 375 279 454 51 11 108 - 1,510
Mauritius - 3 - 1 140 244 340 17 5 5 13 - 768
Democratic Repub-lic of the Congo
- 6 - 2 158 169 154 161 13 - 14 - 677
Seychelles - - - 1 40 33 74 3 2 7 19 - 179
Madagascar - - - - 7 12 95 3 5 - 24 - 146
Total 204,575 3,892 1,281 3,543 385,132 273,418 392,986 578,840 4,556 6,928 154,482 1,584 2,011,217
Rest of Africa
Kenya - 23 1 12 936 1,259 1,061 1,088 27 20 116 - 4,543
Uganda - 2 - 4 571 340 342 217 11 10 47 - 1,544
Nigeria - 19 2 5 86 144 326 7 12 8 32 - 641
Somalia - - 3 - 190 128 145 121 1 17 30 - 635
Ethiopia - 1 - 2 72 42 201 2 17 7 8 - 352
Ghana - 6 1 1 67 75 149 5 4 5 3 - 316
Rwanda - 1 1 - 3 36 70 14 1 - 5 - 131
Sierra Leone - 1 - - 34 25 34 16 3 1 5 - 119
Cameroon - - - 1 19 16 62 5 4 1 5 - 113
Sudan - 1 - - 22 21 40 9 2 1 6 - 102
Senegal - 1 1 - 2 8 56 - 8 - 6 - 82
Congo - 1 - 1 7 16 36 11 7 - 2 - 81
Egypt - 3 - - 6 21 36 7 1 - 5 - 79
Burkina Faso - - - - - 2 59 1 - 3 3 - 68
Djibouti - - - - 1 - 43 - 5 1 2 - 52
Morocco - - - - 7 7 19 3 5 - 6 - 47
Libya - 5 - - 11 9 7 - 12 - 2 - 46
Burundi - - - - 7 8 18 1 5 - 3 - 42
Gambia - - - - 4 1 27 1 2 - 7 - 42
Togo - - - - 2 6 32 - - - 2 - 42
Gabon - - - 2 2 11 22 - 4 - - - 41
Côte d'Ivoire - - - - 7 6 21 - 3 - - - 37
Tunisia - 1 - 1 4 7 16 2 3 2 - - 36
Liberia - - - - 3 6 21 - - 4 1 - 35
Benin - - - - 1 3 22 - - 2 1 - 29
Comoros - - - - - 2 20 - - 1 1 - 24
Algeria - - - - - 9 6 - 4 - - - 19
Chad - - - - 2 9 5 - 1 1 - - 18
Mali - - 1 1 - 5 10 - - - 1 - 18
Eritrea - - - - 3 11 2 1 - - - - 17
Guinea - - - - 3 3 9 - - - 1 - 16
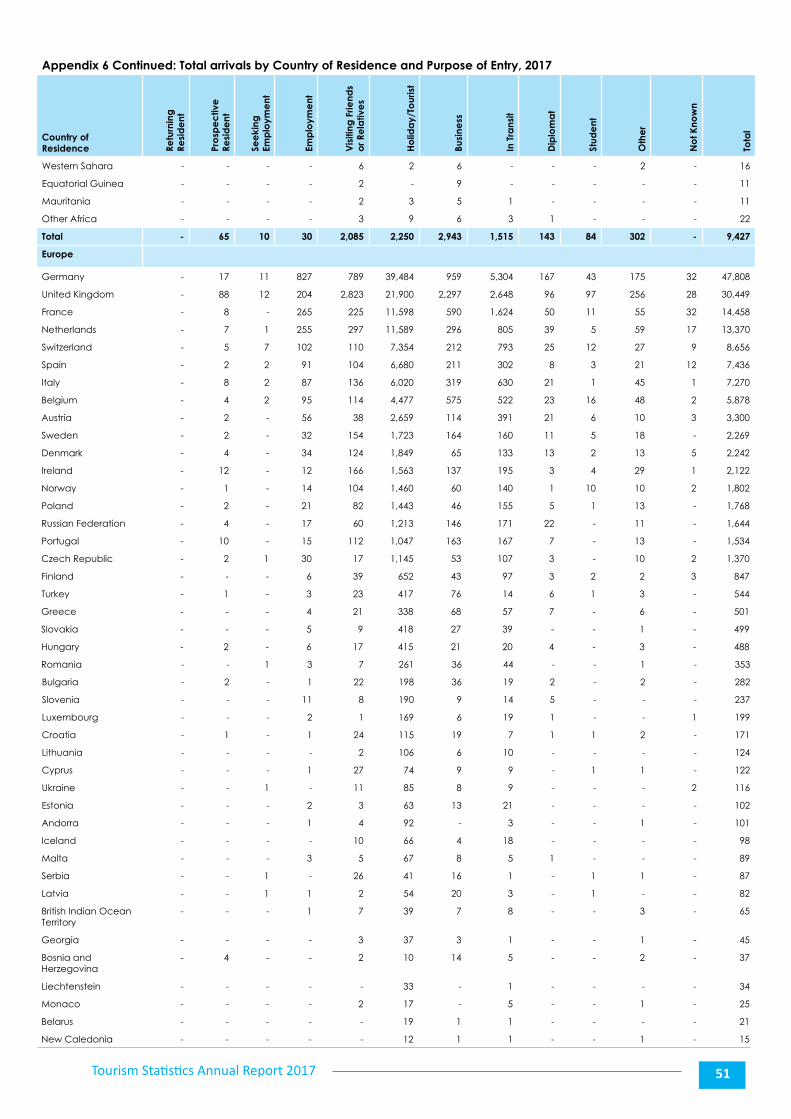
Tourism Statistics Annual Report 2017 51
Appendix 6 Continued: Total arrivals by Country of Residence and Purpose of Entry, 2017
Country of Residence Re
turn
ing
Re
sid
ent
Pro
spe
ctiv
e
Resi
de
nt
See
king
Em
plo
yme
nt
Emp
loym
ent
Vis
iting
Frie
nds
or R
ela
tive
s
Ho
lida
y/To
uris
t
Busi
ness
In T
rans
it
Dip
lom
at
Stud
ent
Oth
er
No
t Kno
wn
Tota
l
Western Sahara - - - - 6 2 6 - - - 2 - 16
Equatorial Guinea - - - - 2 - 9 - - - - - 11
Mauritania - - - - 2 3 5 1 - - - - 11
Other Africa - - - - 3 9 6 3 1 - - - 22
Total - 65 10 30 2,085 2,250 2,943 1,515 143 84 302 - 9,427
Europe
Germany - 17 11 827 789 39,484 959 5,304 167 43 175 32 47,808
United Kingdom - 88 12 204 2,823 21,900 2,297 2,648 96 97 256 28 30,449
France - 8 - 265 225 11,598 590 1,624 50 11 55 32 14,458
Netherlands - 7 1 255 297 11,589 296 805 39 5 59 17 13,370
Switzerland - 5 7 102 110 7,354 212 793 25 12 27 9 8,656
Spain - 2 2 91 104 6,680 211 302 8 3 21 12 7,436
Italy - 8 2 87 136 6,020 319 630 21 1 45 1 7,270
Belgium - 4 2 95 114 4,477 575 522 23 16 48 2 5,878
Austria - 2 - 56 38 2,659 114 391 21 6 10 3 3,300
Sweden - 2 - 32 154 1,723 164 160 11 5 18 - 2,269
Denmark - 4 - 34 124 1,849 65 133 13 2 13 5 2,242
Ireland - 12 - 12 166 1,563 137 195 3 4 29 1 2,122
Norway - 1 - 14 104 1,460 60 140 1 10 10 2 1,802
Poland - 2 - 21 82 1,443 46 155 5 1 13 - 1,768
Russian Federation - 4 - 17 60 1,213 146 171 22 - 11 - 1,644
Portugal - 10 - 15 112 1,047 163 167 7 - 13 - 1,534
Czech Republic - 2 1 30 17 1,145 53 107 3 - 10 2 1,370
Finland - - - 6 39 652 43 97 3 2 2 3 847
Turkey - 1 - 3 23 417 76 14 6 1 3 - 544
Greece - - - 4 21 338 68 57 7 - 6 - 501
Slovakia - - - 5 9 418 27 39 - - 1 - 499
Hungary - 2 - 6 17 415 21 20 4 - 3 - 488
Romania - - 1 3 7 261 36 44 - - 1 - 353
Bulgaria - 2 - 1 22 198 36 19 2 - 2 - 282
Slovenia - - - 11 8 190 9 14 5 - - - 237
Luxembourg - - - 2 1 169 6 19 1 - - 1 199
Croatia - 1 - 1 24 115 19 7 1 1 2 - 171
Lithuania - - - - 2 106 6 10 - - - - 124
Cyprus - - - 1 27 74 9 9 - 1 1 - 122
Ukraine - - 1 - 11 85 8 9 - - - 2 116
Estonia - - - 2 3 63 13 21 - - - - 102
Andorra - - - 1 4 92 - 3 - - 1 - 101
Iceland - - - - 10 66 4 18 - - - - 98
Malta - - - 3 5 67 8 5 1 - - - 89
Serbia - - 1 - 26 41 16 1 - 1 1 - 87
Latvia - - 1 1 2 54 20 3 - 1 - - 82
British Indian Ocean Territory
- - - 1 7 39 7 8 - - 3 - 65
Georgia - - - - 3 37 3 1 - - 1 - 45
Bosnia and Herzegovina
- 4 - - 2 10 14 5 - - 2 - 37
Liechtenstein - - - - - 33 - 1 - - - - 34
Monaco - - - - 2 17 - 5 - - 1 - 25
Belarus - - - - - 19 1 1 - - - - 21
New Caledonia - - - - - 12 1 1 - - 1 - 15
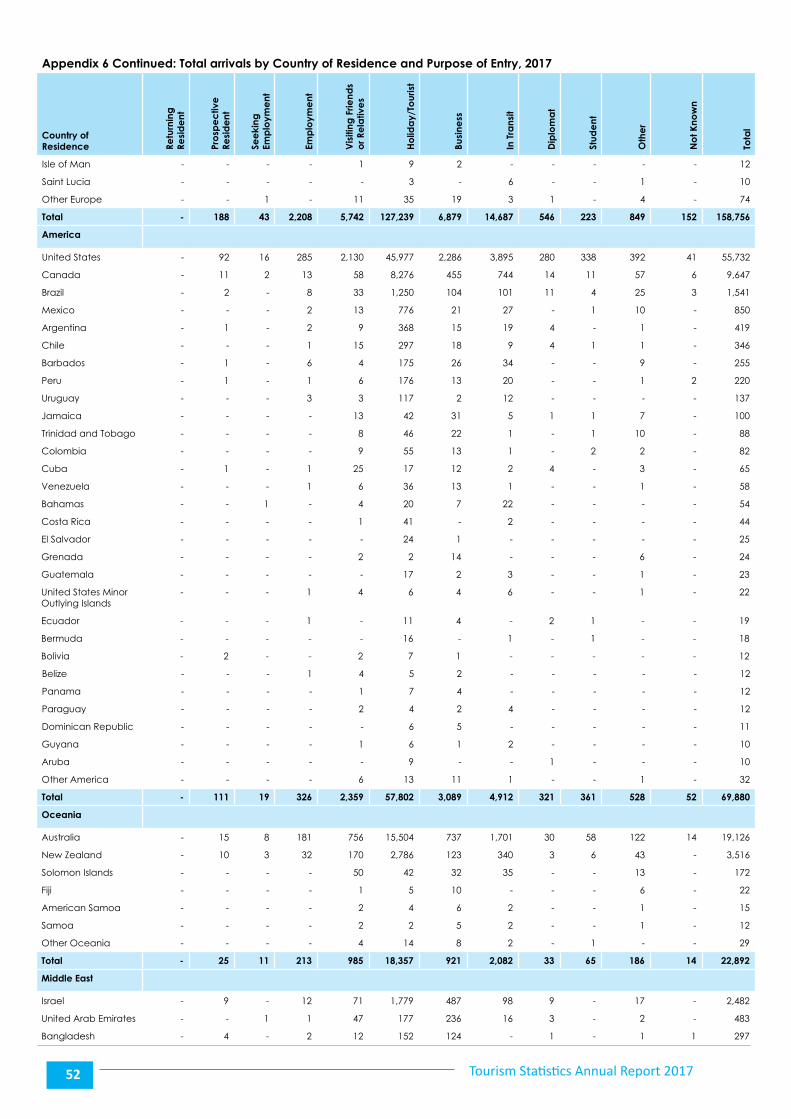
Tourism Statistics Annual Report 201752
Appendix 6 Continued: Total arrivals by Country of Residence and Purpose of Entry, 2017
Country of Residence Re
turn
ing
Re
sid
ent
Pro
spe
ctiv
e
Resi
de
nt
See
king
Em
plo
yme
nt
Emp
loym
ent
Vis
iting
Frie
nds
or R
ela
tive
s
Ho
lida
y/To
uris
t
Busi
ness
In T
rans
it
Dip
lom
at
Stud
ent
Oth
er
No
t Kno
wn
Tota
l
Isle of Man - - - - 1 9 2 - - - - - 12
Saint Lucia - - - - - 3 - 6 - - 1 - 10
Other Europe - - 1 - 11 35 19 3 1 - 4 - 74
Total - 188 43 2,208 5,742 127,239 6,879 14,687 546 223 849 152 158,756
America
United States - 92 16 285 2,130 45,977 2,286 3,895 280 338 392 41 55,732
Canada - 11 2 13 58 8,276 455 744 14 11 57 6 9,647
Brazil - 2 - 8 33 1,250 104 101 11 4 25 3 1,541
Mexico - - - 2 13 776 21 27 - 1 10 - 850
Argentina - 1 - 2 9 368 15 19 4 - 1 - 419
Chile - - - 1 15 297 18 9 4 1 1 - 346
Barbados - 1 - 6 4 175 26 34 - - 9 - 255
Peru - 1 - 1 6 176 13 20 - - 1 2 220
Uruguay - - - 3 3 117 2 12 - - - - 137
Jamaica - - - - 13 42 31 5 1 1 7 - 100
Trinidad and Tobago - - - - 8 46 22 1 - 1 10 - 88
Colombia - - - - 9 55 13 1 - 2 2 - 82
Cuba - 1 - 1 25 17 12 2 4 - 3 - 65
Venezuela - - - 1 6 36 13 1 - - 1 - 58
Bahamas - - 1 - 4 20 7 22 - - - - 54
Costa Rica - - - - 1 41 - 2 - - - - 44
El Salvador - - - - - 24 1 - - - - - 25
Grenada - - - - 2 2 14 - - - 6 - 24
Guatemala - - - - - 17 2 3 - - 1 - 23
United States Minor Outlying Islands
- - - 1 4 6 4 6 - - 1 - 22
Ecuador - - - 1 - 11 4 - 2 1 - - 19
Bermuda - - - - - 16 - 1 - 1 - - 18
Bolivia - 2 - - 2 7 1 - - - - - 12
Belize - - - 1 4 5 2 - - - - - 12
Panama - - - - 1 7 4 - - - - - 12
Paraguay - - - - 2 4 2 4 - - - - 12
Dominican Republic - - - - - 6 5 - - - - - 11
Guyana - - - - 1 6 1 2 - - - - 10
Aruba - - - - - 9 - - 1 - - - 10
Other America - - - - 6 13 11 1 - - 1 - 32
Total - 111 19 326 2,359 57,802 3,089 4,912 321 361 528 52 69,880
Oceania
Australia - 15 8 181 756 15,504 737 1,701 30 58 122 14 19,126
New Zealand - 10 3 32 170 2,786 123 340 3 6 43 - 3,516
Solomon Islands - - - - 50 42 32 35 - - 13 - 172
Fiji - - - - 1 5 10 - - - 6 - 22
American Samoa - - - - 2 4 6 2 - - 1 - 15
Samoa - - - - 2 2 5 2 - - 1 - 12
Other Oceania - - - - 4 14 8 2 - 1 - - 29
Total - 25 11 213 985 18,357 921 2,082 33 65 186 14 22,892
Middle East
Israel - 9 - 12 71 1,779 487 98 9 - 17 - 2,482
United Arab Emirates - - 1 1 47 177 236 16 3 - 2 - 483
Bangladesh - 4 - 2 12 152 124 - 1 - 1 1 297
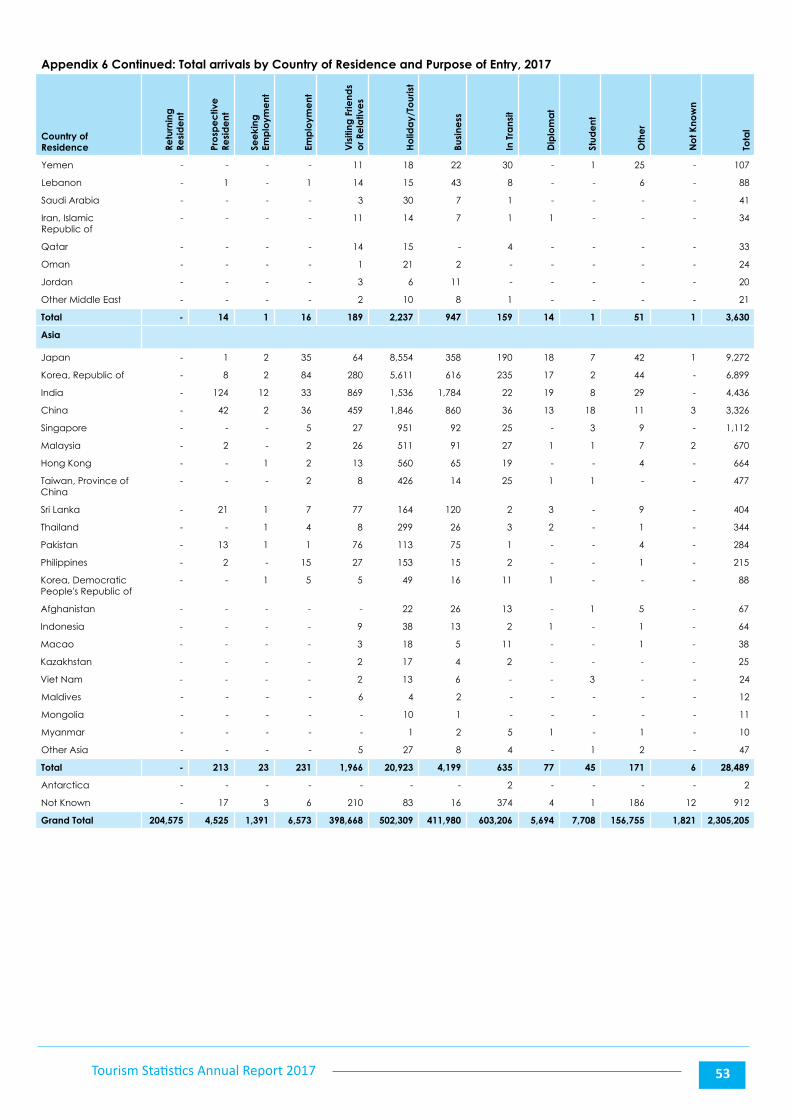
Tourism Statistics Annual Report 2017 53
Appendix 6 Continued: Total arrivals by Country of Residence and Purpose of Entry, 2017
Country of Residence Re
turn
ing
Re
sid
ent
Pro
spe
ctiv
e
Resi
de
nt
See
king
Em
plo
yme
nt
Emp
loym
ent
Vis
iting
Frie
nds
or R
ela
tive
s
Ho
lida
y/To
uris
t
Busi
ness
In T
rans
it
Dip
lom
at
Stud
ent
Oth
er
No
t Kno
wn
Tota
l
Yemen - - - - 11 18 22 30 - 1 25 - 107
Lebanon - 1 - 1 14 15 43 8 - - 6 - 88
Saudi Arabia - - - - 3 30 7 1 - - - - 41
Iran, Islamic Republic of
- - - - 11 14 7 1 1 - - - 34
Qatar - - - - 14 15 - 4 - - - - 33
Oman - - - - 1 21 2 - - - - - 24
Jordan - - - - 3 6 11 - - - - - 20
Other Middle East - - - - 2 10 8 1 - - - - 21
Total - 14 1 16 189 2,237 947 159 14 1 51 1 3,630
Asia
Japan - 1 2 35 64 8,554 358 190 18 7 42 1 9,272
Korea, Republic of - 8 2 84 280 5,611 616 235 17 2 44 - 6,899
India - 124 12 33 869 1,536 1,784 22 19 8 29 - 4,436
China - 42 2 36 459 1,846 860 36 13 18 11 3 3,326
Singapore - - - 5 27 951 92 25 - 3 9 - 1,112
Malaysia - 2 - 2 26 511 91 27 1 1 7 2 670
Hong Kong - - 1 2 13 560 65 19 - - 4 - 664
Taiwan, Province of China
- - - 2 8 426 14 25 1 1 - - 477
Sri Lanka - 21 1 7 77 164 120 2 3 - 9 - 404
Thailand - - 1 4 8 299 26 3 2 - 1 - 344
Pakistan - 13 1 1 76 113 75 1 - - 4 - 284
Philippines - 2 - 15 27 153 15 2 - - 1 - 215
Korea, Democratic People's Republic of
- - 1 5 5 49 16 11 1 - - - 88
Afghanistan - - - - - 22 26 13 - 1 5 - 67
Indonesia - - - - 9 38 13 2 1 - 1 - 64
Macao - - - - 3 18 5 11 - - 1 - 38
Kazakhstan - - - - 2 17 4 2 - - - - 25
Viet Nam - - - - 2 13 6 - - 3 - - 24
Maldives - - - - 6 4 2 - - - - - 12
Mongolia - - - - - 10 1 - - - - - 11
Myanmar - - - - - 1 2 5 1 - 1 - 10
Other Asia - - - - 5 27 8 4 - 1 2 - 47
Total - 213 23 231 1,966 20,923 4,199 635 77 45 171 6 28,489
Antarctica - - - - - - - 2 - - - - 2
Not Known - 17 3 6 210 83 16 374 4 1 186 12 912
Grand Total 204,575 4,525 1,391 6,573 398,668 502,309 411,980 603,206 5,694 7,708 156,755 1,821 2,305,205

Appendix 7
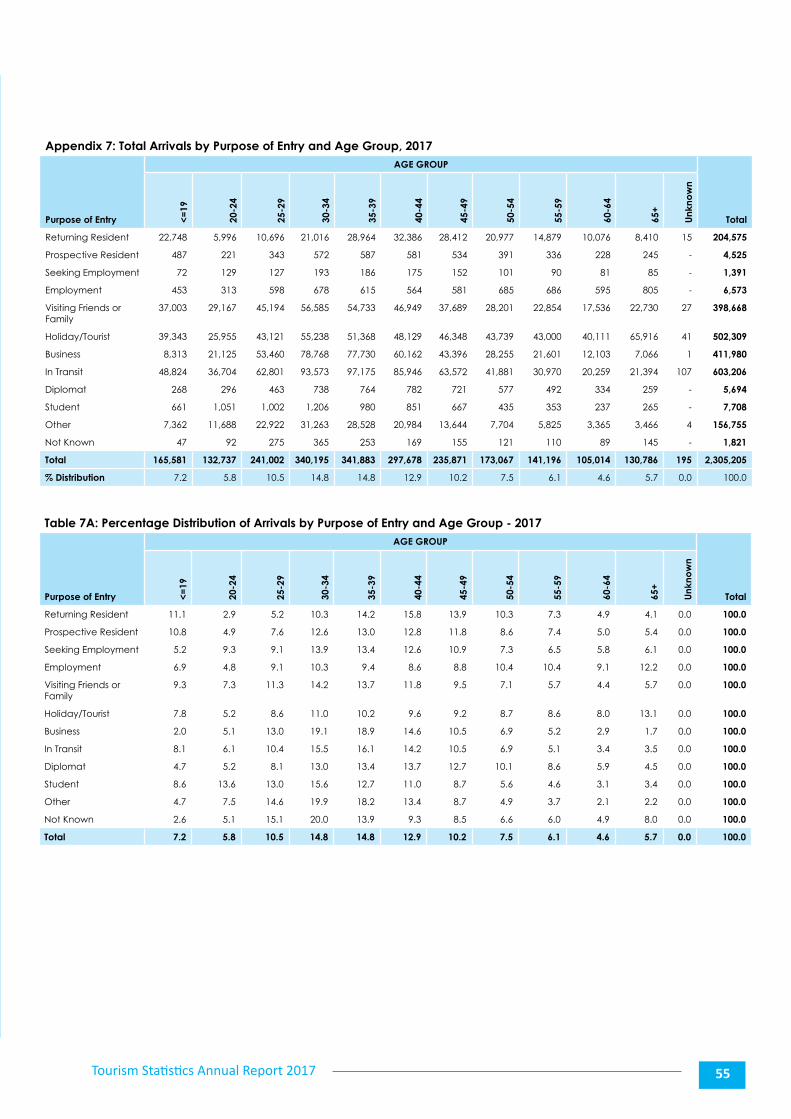
Tourism Statistics Annual Report 2017 55
Appendix 7: Total Arrivals by Purpose of Entry and Age Group, 2017
Purpose of Entry
AGE GROUP
Total<=19
20-2
4
25-2
9
30-3
4
35-3
9
40-4
4
45-4
9
50-5
4
55-5
9
60-6
4
65+
Unk
now
n
Returning Resident 22,748 5,996 10,696 21,016 28,964 32,386 28,412 20,977 14,879 10,076 8,410 15 204,575
Prospective Resident 487 221 343 572 587 581 534 391 336 228 245 - 4,525
Seeking Employment 72 129 127 193 186 175 152 101 90 81 85 - 1,391
Employment 453 313 598 678 615 564 581 685 686 595 805 - 6,573
Visiting Friends or Family
37,003 29,167 45,194 56,585 54,733 46,949 37,689 28,201 22,854 17,536 22,730 27 398,668
Holiday/Tourist 39,343 25,955 43,121 55,238 51,368 48,129 46,348 43,739 43,000 40,111 65,916 41 502,309
Business 8,313 21,125 53,460 78,768 77,730 60,162 43,396 28,255 21,601 12,103 7,066 1 411,980
In Transit 48,824 36,704 62,801 93,573 97,175 85,946 63,572 41,881 30,970 20,259 21,394 107 603,206
Diplomat 268 296 463 738 764 782 721 577 492 334 259 - 5,694
Student 661 1,051 1,002 1,206 980 851 667 435 353 237 265 - 7,708
Other 7,362 11,688 22,922 31,263 28,528 20,984 13,644 7,704 5,825 3,365 3,466 4 156,755
Not Known 47 92 275 365 253 169 155 121 110 89 145 - 1,821
Total 165,581 132,737 241,002 340,195 341,883 297,678 235,871 173,067 141,196 105,014 130,786 195 2,305,205
% Distribution 7.2 5.8 10.5 14.8 14.8 12.9 10.2 7.5 6.1 4.6 5.7 0.0 100.0
Table 7A: Percentage Distribution of Arrivals by Purpose of Entry and Age Group - 2017
Purpose of Entry
AGE GROUP
Total<=19
20-2
4
25-2
9
30-3
4
35-3
9
40-4
4
45-4
9
50-5
4
55-5
9
60-6
4
65+
Unk
now
n
Returning Resident 11.1 2.9 5.2 10.3 14.2 15.8 13.9 10.3 7.3 4.9 4.1 0.0 100.0
Prospective Resident 10.8 4.9 7.6 12.6 13.0 12.8 11.8 8.6 7.4 5.0 5.4 0.0 100.0
Seeking Employment 5.2 9.3 9.1 13.9 13.4 12.6 10.9 7.3 6.5 5.8 6.1 0.0 100.0
Employment 6.9 4.8 9.1 10.3 9.4 8.6 8.8 10.4 10.4 9.1 12.2 0.0 100.0
Visiting Friends or Family
9.3 7.3 11.3 14.2 13.7 11.8 9.5 7.1 5.7 4.4 5.7 0.0 100.0
Holiday/Tourist 7.8 5.2 8.6 11.0 10.2 9.6 9.2 8.7 8.6 8.0 13.1 0.0 100.0
Business 2.0 5.1 13.0 19.1 18.9 14.6 10.5 6.9 5.2 2.9 1.7 0.0 100.0
In Transit 8.1 6.1 10.4 15.5 16.1 14.2 10.5 6.9 5.1 3.4 3.5 0.0 100.0
Diplomat 4.7 5.2 8.1 13.0 13.4 13.7 12.7 10.1 8.6 5.9 4.5 0.0 100.0
Student 8.6 13.6 13.0 15.6 12.7 11.0 8.7 5.6 4.6 3.1 3.4 0.0 100.0
Other 4.7 7.5 14.6 19.9 18.2 13.4 8.7 4.9 3.7 2.1 2.2 0.0 100.0
Not Known 2.6 5.1 15.1 20.0 13.9 9.3 8.5 6.6 6.0 4.9 8.0 0.0 100.0
Total 7.2 5.8 10.5 14.8 14.8 12.9 10.2 7.5 6.1 4.6 5.7 0.0 100.0
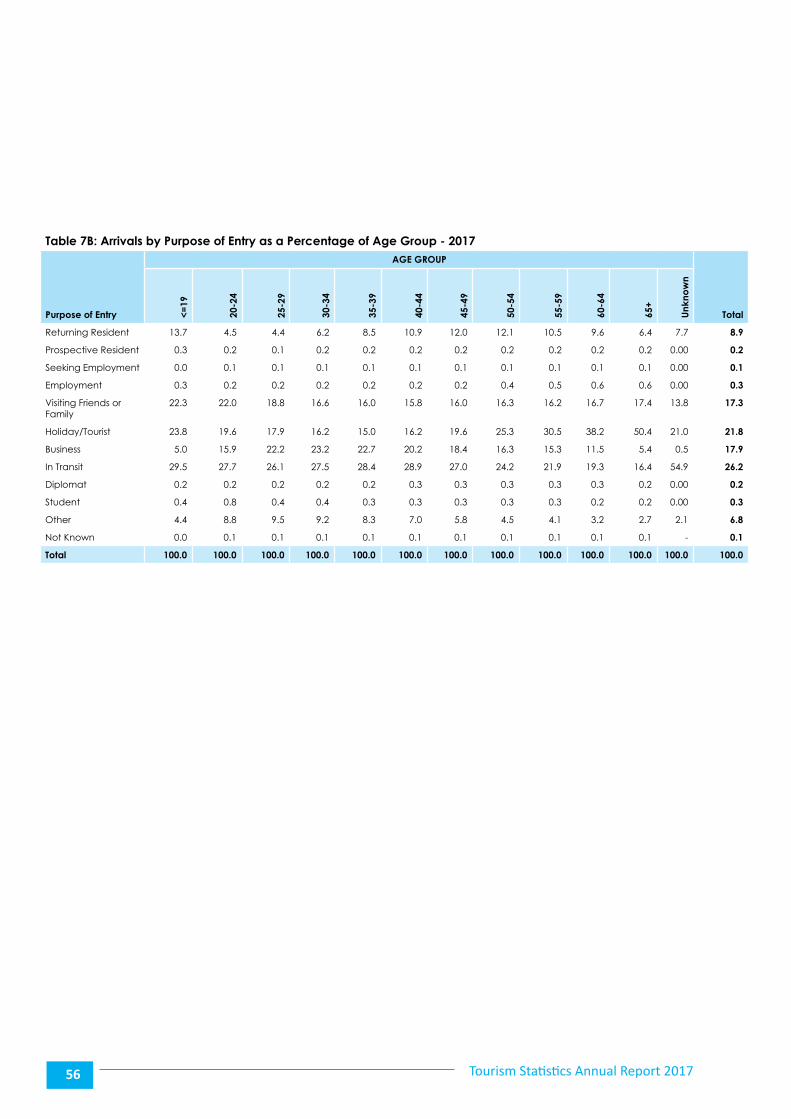
Tourism Statistics Annual Report 201756
Table 7B: Arrivals by Purpose of Entry as a Percentage of Age Group - 2017
Purpose of Entry
AGE GROUP
Total<=19
20-2
4
25-2
9
30-3
4
35-3
9
40-4
4
45-4
9
50-5
4
55-5
9
60-6
4
65+
Unk
now
n
Returning Resident 13.7 4.5 4.4 6.2 8.5 10.9 12.0 12.1 10.5 9.6 6.4 7.7 8.9
Prospective Resident 0.3 0.2 0.1 0.2 0.2 0.2 0.2 0.2 0.2 0.2 0.2 0.00 0.2
Seeking Employment 0.0 0.1 0.1 0.1 0.1 0.1 0.1 0.1 0.1 0.1 0.1 0.00 0.1
Employment 0.3 0.2 0.2 0.2 0.2 0.2 0.2 0.4 0.5 0.6 0.6 0.00 0.3
Visiting Friends or Family
22.3 22.0 18.8 16.6 16.0 15.8 16.0 16.3 16.2 16.7 17.4 13.8 17.3
Holiday/Tourist 23.8 19.6 17.9 16.2 15.0 16.2 19.6 25.3 30.5 38.2 50.4 21.0 21.8
Business 5.0 15.9 22.2 23.2 22.7 20.2 18.4 16.3 15.3 11.5 5.4 0.5 17.9
In Transit 29.5 27.7 26.1 27.5 28.4 28.9 27.0 24.2 21.9 19.3 16.4 54.9 26.2
Diplomat 0.2 0.2 0.2 0.2 0.2 0.3 0.3 0.3 0.3 0.3 0.2 0.00 0.2
Student 0.4 0.8 0.4 0.4 0.3 0.3 0.3 0.3 0.3 0.2 0.2 0.00 0.3
Other 4.4 8.8 9.5 9.2 8.3 7.0 5.8 4.5 4.1 3.2 2.7 2.1 6.8
Not Known 0.0 0.1 0.1 0.1 0.1 0.1 0.1 0.1 0.1 0.1 0.1 - 0.1
Total 100.0 100.0 100.0 100.0 100.0 100.0 100.0 100.0 100.0 100.0 100.0 100.0 100.0

Appendix 8
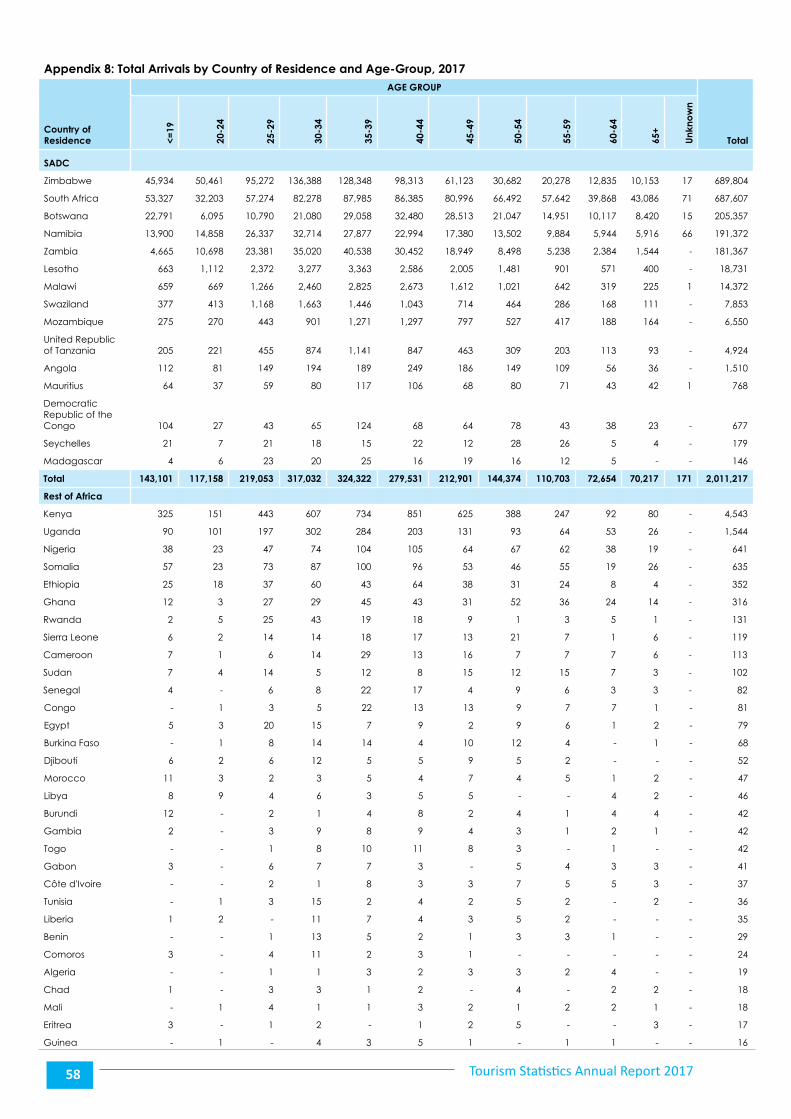
Tourism Statistics Annual Report 201758
Appendix 8: Total Arrivals by Country of Residence and Age-Group, 2017
Country of Residence
AGE GROUP
Total<=19
20-2
4
25-2
9
30-3
4
35-3
9
40-4
4
45-4
9
50-5
4
55-5
9
60-6
4
65+
Unk
now
n
SADC
Zimbabwe 45,934 50,461 95,272 136,388 128,348 98,313 61,123 30,682 20,278 12,835 10,153 17 689,804
South Africa 53,327 32,203 57,274 82,278 87,985 86,385 80,996 66,492 57,642 39,868 43,086 71 687,607
Botswana 22,791 6,095 10,790 21,080 29,058 32,480 28,513 21,047 14,951 10,117 8,420 15 205,357
Namibia 13,900 14,858 26,337 32,714 27,877 22,994 17,380 13,502 9,884 5,944 5,916 66 191,372
Zambia 4,665 10,698 23,381 35,020 40,538 30,452 18,949 8,498 5,238 2,384 1,544 - 181,367
Lesotho 663 1,112 2,372 3,277 3,363 2,586 2,005 1,481 901 571 400 - 18,731
Malawi 659 669 1,266 2,460 2,825 2,673 1,612 1,021 642 319 225 1 14,372
Swaziland 377 413 1,168 1,663 1,446 1,043 714 464 286 168 111 - 7,853
Mozambique 275 270 443 901 1,271 1,297 797 527 417 188 164 - 6,550
United Republic of Tanzania 205 221 455 874 1,141 847 463 309 203 113 93 - 4,924
Angola 112 81 149 194 189 249 186 149 109 56 36 - 1,510
Mauritius 64 37 59 80 117 106 68 80 71 43 42 1 768
Democratic Republic of the Congo 104 27 43 65 124 68 64 78 43 38 23 - 677
Seychelles 21 7 21 18 15 22 12 28 26 5 4 - 179
Madagascar 4 6 23 20 25 16 19 16 12 5 - - 146
Total 143,101 117,158 219,053 317,032 324,322 279,531 212,901 144,374 110,703 72,654 70,217 171 2,011,217
Rest of Africa
Kenya 325 151 443 607 734 851 625 388 247 92 80 - 4,543
Uganda 90 101 197 302 284 203 131 93 64 53 26 - 1,544
Nigeria 38 23 47 74 104 105 64 67 62 38 19 - 641
Somalia 57 23 73 87 100 96 53 46 55 19 26 - 635
Ethiopia 25 18 37 60 43 64 38 31 24 8 4 - 352
Ghana 12 3 27 29 45 43 31 52 36 24 14 - 316
Rwanda 2 5 25 43 19 18 9 1 3 5 1 - 131
Sierra Leone 6 2 14 14 18 17 13 21 7 1 6 - 119
Cameroon 7 1 6 14 29 13 16 7 7 7 6 - 113
Sudan 7 4 14 5 12 8 15 12 15 7 3 - 102
Senegal 4 - 6 8 22 17 4 9 6 3 3 - 82
Congo - 1 3 5 22 13 13 9 7 7 1 - 81
Egypt 5 3 20 15 7 9 2 9 6 1 2 - 79
Burkina Faso - 1 8 14 14 4 10 12 4 - 1 - 68
Djibouti 6 2 6 12 5 5 9 5 2 - - - 52
Morocco 11 3 2 3 5 4 7 4 5 1 2 - 47
Libya 8 9 4 6 3 5 5 - - 4 2 - 46
Burundi 12 - 2 1 4 8 2 4 1 4 4 - 42
Gambia 2 - 3 9 8 9 4 3 1 2 1 - 42
Togo - - 1 8 10 11 8 3 - 1 - - 42
Gabon 3 - 6 7 7 3 - 5 4 3 3 - 41
Côte d'Ivoire - - 2 1 8 3 3 7 5 5 3 - 37
Tunisia - 1 3 15 2 4 2 5 2 - 2 - 36
Liberia 1 2 - 11 7 4 3 5 2 - - - 35
Benin - - 1 13 5 2 1 3 3 1 - - 29
Comoros 3 - 4 11 2 3 1 - - - - - 24
Algeria - - 1 1 3 2 3 3 2 4 - - 19
Chad 1 - 3 3 1 2 - 4 - 2 2 - 18
Mali - 1 4 1 1 3 2 1 2 2 1 - 18
Eritrea 3 - 1 2 - 1 2 5 - - 3 - 17
Guinea - 1 - 4 3 5 1 - 1 1 - - 16
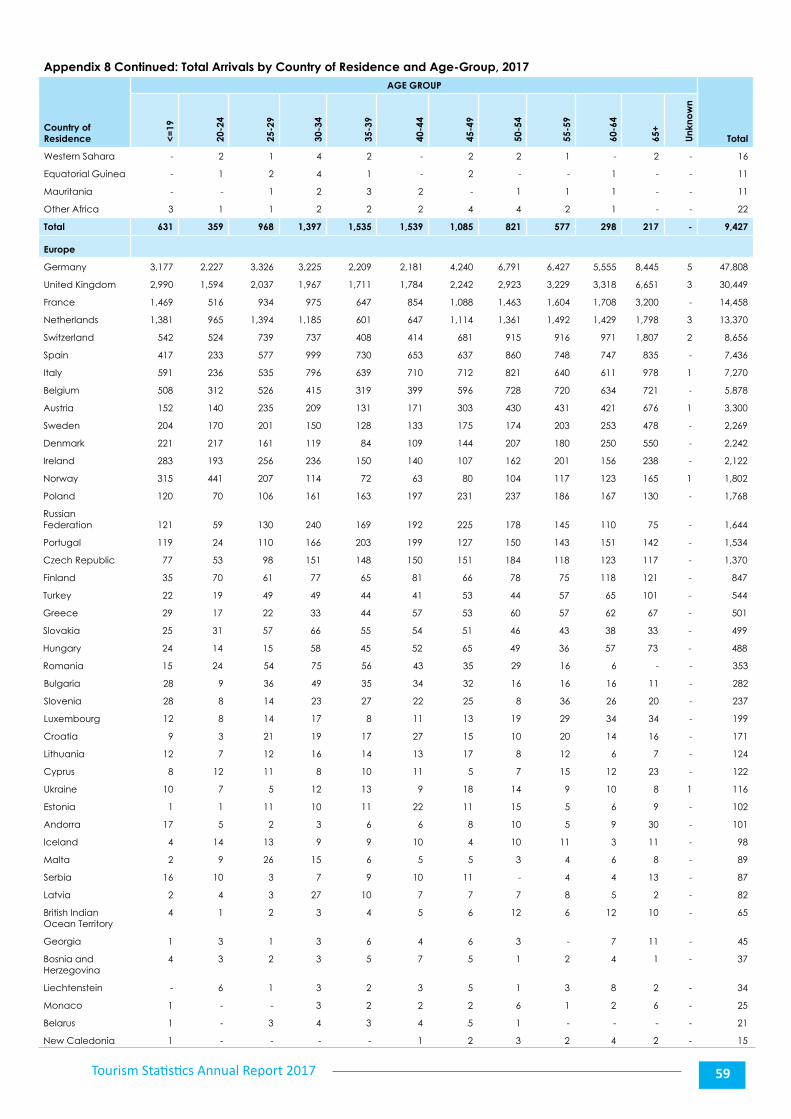
Tourism Statistics Annual Report 2017 59
Appendix 8 Continued: Total Arrivals by Country of Residence and Age-Group, 2017
Country of Residence
AGE GROUP
Total<=19
20-2
4
25-2
9
30-3
4
35-3
9
40-4
4
45-4
9
50-5
4
55-5
9
60-6
4
65+
Unk
now
n
Western Sahara - 2 1 4 2 - 2 2 1 - 2 - 16
Equatorial Guinea - 1 2 4 1 - 2 - - 1 - - 11
Mauritania - - 1 2 3 2 - 1 1 1 - - 11
Other Africa 3 1 1 2 2 2 4 4 2 1 - - 22
Total 631 359 968 1,397 1,535 1,539 1,085 821 577 298 217 - 9,427
Europe
Germany 3,177 2,227 3,326 3,225 2,209 2,181 4,240 6,791 6,427 5,555 8,445 5 47,808
United Kingdom 2,990 1,594 2,037 1,967 1,711 1,784 2,242 2,923 3,229 3,318 6,651 3 30,449
France 1,469 516 934 975 647 854 1,088 1,463 1,604 1,708 3,200 - 14,458
Netherlands 1,381 965 1,394 1,185 601 647 1,114 1,361 1,492 1,429 1,798 3 13,370
Switzerland 542 524 739 737 408 414 681 915 916 971 1,807 2 8,656
Spain 417 233 577 999 730 653 637 860 748 747 835 - 7,436
Italy 591 236 535 796 639 710 712 821 640 611 978 1 7,270
Belgium 508 312 526 415 319 399 596 728 720 634 721 - 5,878
Austria 152 140 235 209 131 171 303 430 431 421 676 1 3,300
Sweden 204 170 201 150 128 133 175 174 203 253 478 - 2,269
Denmark 221 217 161 119 84 109 144 207 180 250 550 - 2,242
Ireland 283 193 256 236 150 140 107 162 201 156 238 - 2,122
Norway 315 441 207 114 72 63 80 104 117 123 165 1 1,802
Poland 120 70 106 161 163 197 231 237 186 167 130 - 1,768
Russian Federation 121 59 130 240 169 192 225 178 145 110 75 - 1,644
Portugal 119 24 110 166 203 199 127 150 143 151 142 - 1,534
Czech Republic 77 53 98 151 148 150 151 184 118 123 117 - 1,370
Finland 35 70 61 77 65 81 66 78 75 118 121 - 847
Turkey 22 19 49 49 44 41 53 44 57 65 101 - 544
Greece 29 17 22 33 44 57 53 60 57 62 67 - 501
Slovakia 25 31 57 66 55 54 51 46 43 38 33 - 499
Hungary 24 14 15 58 45 52 65 49 36 57 73 - 488
Romania 15 24 54 75 56 43 35 29 16 6 - - 353
Bulgaria 28 9 36 49 35 34 32 16 16 16 11 - 282
Slovenia 28 8 14 23 27 22 25 8 36 26 20 - 237
Luxembourg 12 8 14 17 8 11 13 19 29 34 34 - 199
Croatia 9 3 21 19 17 27 15 10 20 14 16 - 171
Lithuania 12 7 12 16 14 13 17 8 12 6 7 - 124
Cyprus 8 12 11 8 10 11 5 7 15 12 23 - 122
Ukraine 10 7 5 12 13 9 18 14 9 10 8 1 116
Estonia 1 1 11 10 11 22 11 15 5 6 9 - 102
Andorra 17 5 2 3 6 6 8 10 5 9 30 - 101
Iceland 4 14 13 9 9 10 4 10 11 3 11 - 98
Malta 2 9 26 15 6 5 5 3 4 6 8 - 89
Serbia 16 10 3 7 9 10 11 - 4 4 13 - 87
Latvia 2 4 3 27 10 7 7 7 8 5 2 - 82
British Indian Ocean Territory
4 1 2 3 4 5 6 12 6 12 10 - 65
Georgia 1 3 1 3 6 4 6 3 - 7 11 - 45
Bosnia and Herzegovina
4 3 2 3 5 7 5 1 2 4 1 - 37
Liechtenstein - 6 1 3 2 3 5 1 3 8 2 - 34
Monaco 1 - - 3 2 2 2 6 1 2 6 - 25
Belarus 1 - 3 4 3 4 5 1 - - - - 21
New Caledonia 1 - - - - 1 2 3 2 4 2 - 15
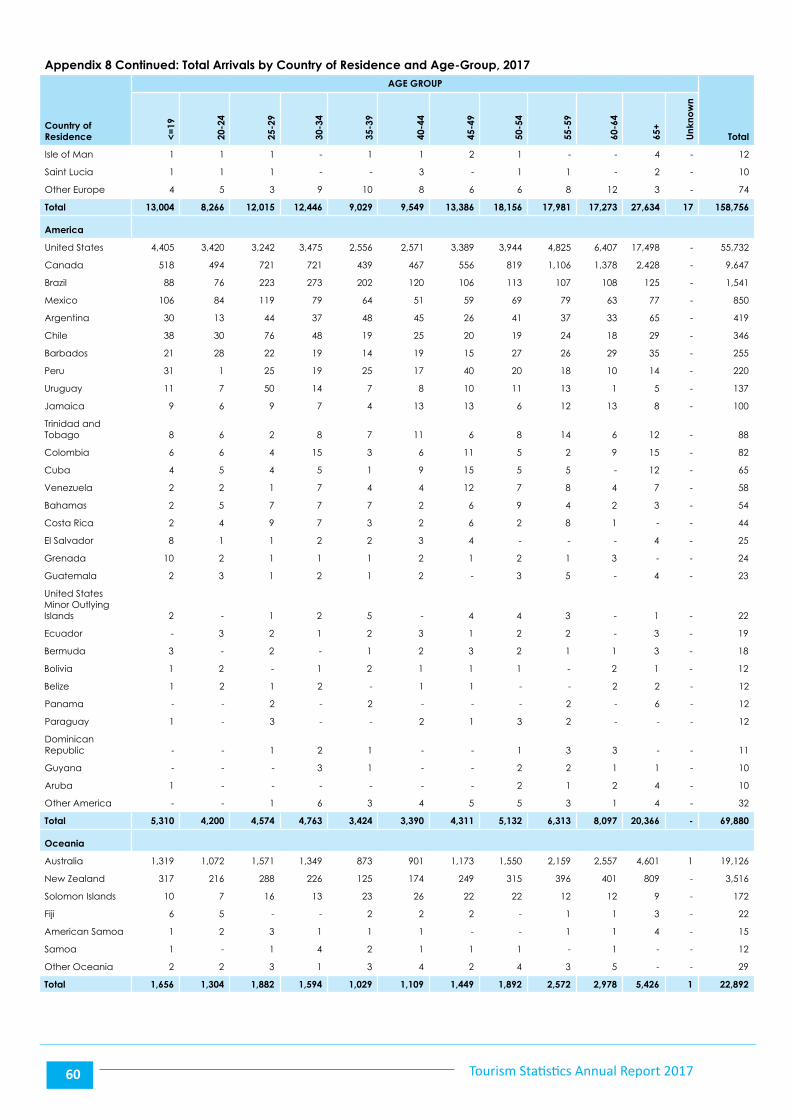
Tourism Statistics Annual Report 201760
Appendix 8 Continued: Total Arrivals by Country of Residence and Age-Group, 2017
Country of Residence
AGE GROUP
Total<=19
20-2
4
25-2
9
30-3
4
35-3
9
40-4
4
45-4
9
50-5
4
55-5
9
60-6
4
65+
Unk
now
n
Isle of Man 1 1 1 - 1 1 2 1 - - 4 - 12
Saint Lucia 1 1 1 - - 3 - 1 1 - 2 - 10
Other Europe 4 5 3 9 10 8 6 6 8 12 3 - 74
Total 13,004 8,266 12,015 12,446 9,029 9,549 13,386 18,156 17,981 17,273 27,634 17 158,756
America
United States 4,405 3,420 3,242 3,475 2,556 2,571 3,389 3,944 4,825 6,407 17,498 - 55,732
Canada 518 494 721 721 439 467 556 819 1,106 1,378 2,428 - 9,647
Brazil 88 76 223 273 202 120 106 113 107 108 125 - 1,541
Mexico 106 84 119 79 64 51 59 69 79 63 77 - 850
Argentina 30 13 44 37 48 45 26 41 37 33 65 - 419
Chile 38 30 76 48 19 25 20 19 24 18 29 - 346
Barbados 21 28 22 19 14 19 15 27 26 29 35 - 255
Peru 31 1 25 19 25 17 40 20 18 10 14 - 220
Uruguay 11 7 50 14 7 8 10 11 13 1 5 - 137
Jamaica 9 6 9 7 4 13 13 6 12 13 8 - 100
Trinidad and Tobago 8 6 2 8 7 11 6 8 14 6 12 - 88
Colombia 6 6 4 15 3 6 11 5 2 9 15 - 82
Cuba 4 5 4 5 1 9 15 5 5 - 12 - 65
Venezuela 2 2 1 7 4 4 12 7 8 4 7 - 58
Bahamas 2 5 7 7 7 2 6 9 4 2 3 - 54
Costa Rica 2 4 9 7 3 2 6 2 8 1 - - 44
El Salvador 8 1 1 2 2 3 4 - - - 4 - 25
Grenada 10 2 1 1 1 2 1 2 1 3 - - 24
Guatemala 2 3 1 2 1 2 - 3 5 - 4 - 23
United States Minor Outlying Islands 2 - 1 2 5 - 4 4 3 - 1 - 22
Ecuador - 3 2 1 2 3 1 2 2 - 3 - 19
Bermuda 3 - 2 - 1 2 3 2 1 1 3 - 18
Bolivia 1 2 - 1 2 1 1 1 - 2 1 - 12
Belize 1 2 1 2 - 1 1 - - 2 2 - 12
Panama - - 2 - 2 - - - 2 - 6 - 12
Paraguay 1 - 3 - - 2 1 3 2 - - - 12
Dominican Republic - - 1 2 1 - - 1 3 3 - - 11
Guyana - - - 3 1 - - 2 2 1 1 - 10
Aruba 1 - - - - - - 2 1 2 4 - 10
Other America - - 1 6 3 4 5 5 3 1 4 - 32
Total 5,310 4,200 4,574 4,763 3,424 3,390 4,311 5,132 6,313 8,097 20,366 - 69,880
Oceania
Australia 1,319 1,072 1,571 1,349 873 901 1,173 1,550 2,159 2,557 4,601 1 19,126
New Zealand 317 216 288 226 125 174 249 315 396 401 809 - 3,516
Solomon Islands 10 7 16 13 23 26 22 22 12 12 9 - 172
Fiji 6 5 - - 2 2 2 - 1 1 3 - 22
American Samoa 1 2 3 1 1 1 - - 1 1 4 - 15
Samoa 1 - 1 4 2 1 1 1 - 1 - - 12
Other Oceania 2 2 3 1 3 4 2 4 3 5 - - 29
Total 1,656 1,304 1,882 1,594 1,029 1,109 1,449 1,892 2,572 2,978 5,426 1 22,892
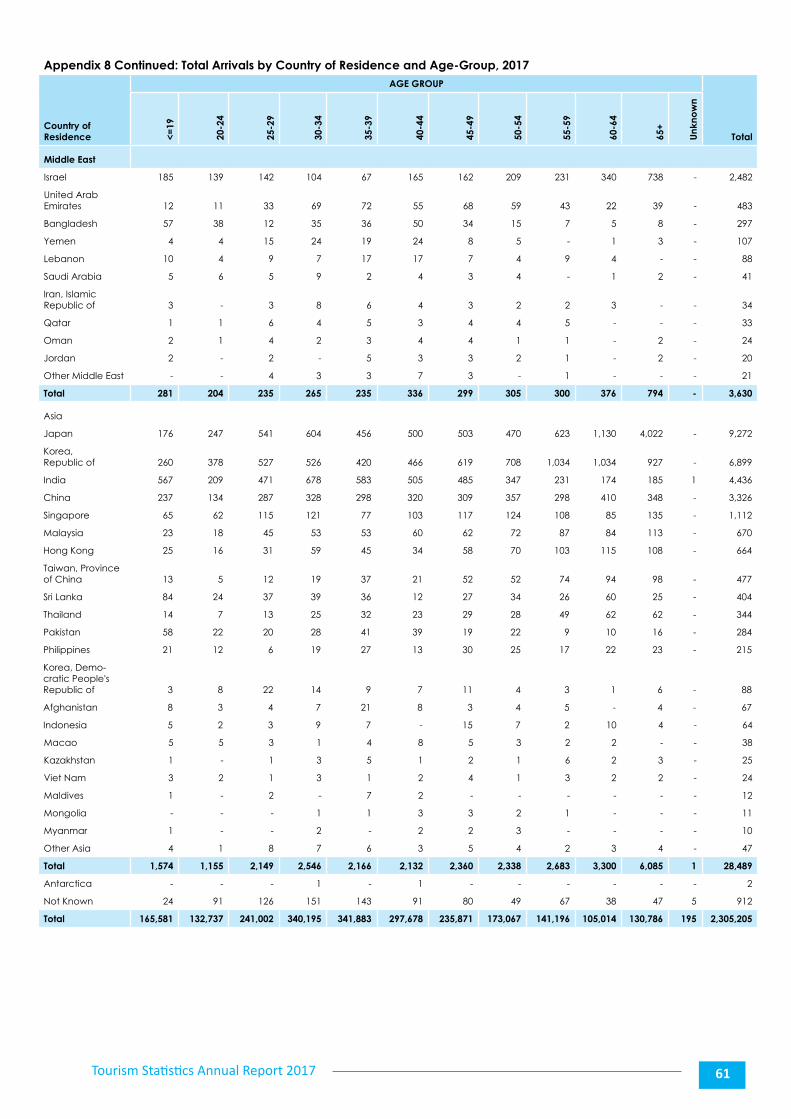
Tourism Statistics Annual Report 2017 61
Appendix 8 Continued: Total Arrivals by Country of Residence and Age-Group, 2017
Country of Residence
AGE GROUP
Total<=19
20-2
4
25-2
9
30-3
4
35-3
9
40-4
4
45-4
9
50-5
4
55-5
9
60-6
4
65+
Unk
now
n
Middle East
Israel 185 139 142 104 67 165 162 209 231 340 738 - 2,482
United Arab Emirates 12 11 33 69 72 55 68 59 43 22 39 - 483
Bangladesh 57 38 12 35 36 50 34 15 7 5 8 - 297
Yemen 4 4 15 24 19 24 8 5 - 1 3 - 107
Lebanon 10 4 9 7 17 17 7 4 9 4 - - 88
Saudi Arabia 5 6 5 9 2 4 3 4 - 1 2 - 41
Iran, Islamic Republic of 3 - 3 8 6 4 3 2 2 3 - - 34
Qatar 1 1 6 4 5 3 4 4 5 - - - 33
Oman 2 1 4 2 3 4 4 1 1 - 2 - 24
Jordan 2 - 2 - 5 3 3 2 1 - 2 - 20
Other Middle East - - 4 3 3 7 3 - 1 - - - 21
Total 281 204 235 265 235 336 299 305 300 376 794 - 3,630
Asia
Japan 176 247 541 604 456 500 503 470 623 1,130 4,022 - 9,272
Korea, Republic of 260 378 527 526 420 466 619 708 1,034 1,034 927 - 6,899
India 567 209 471 678 583 505 485 347 231 174 185 1 4,436
China 237 134 287 328 298 320 309 357 298 410 348 - 3,326
Singapore 65 62 115 121 77 103 117 124 108 85 135 - 1,112
Malaysia 23 18 45 53 53 60 62 72 87 84 113 - 670
Hong Kong 25 16 31 59 45 34 58 70 103 115 108 - 664
Taiwan, Province of China 13 5 12 19 37 21 52 52 74 94 98 - 477
Sri Lanka 84 24 37 39 36 12 27 34 26 60 25 - 404
Thailand 14 7 13 25 32 23 29 28 49 62 62 - 344
Pakistan 58 22 20 28 41 39 19 22 9 10 16 - 284
Philippines 21 12 6 19 27 13 30 25 17 22 23 - 215
Korea, Demo-cratic People's Republic of 3 8 22 14 9 7 11 4 3 1 6 - 88
Afghanistan 8 3 4 7 21 8 3 4 5 - 4 - 67
Indonesia 5 2 3 9 7 - 15 7 2 10 4 - 64
Macao 5 5 3 1 4 8 5 3 2 2 - - 38
Kazakhstan 1 - 1 3 5 1 2 1 6 2 3 - 25
Viet Nam 3 2 1 3 1 2 4 1 3 2 2 - 24
Maldives 1 - 2 - 7 2 - - - - - - 12
Mongolia - - - 1 1 3 3 2 1 - - - 11
Myanmar 1 - - 2 - 2 2 3 - - - - 10
Other Asia 4 1 8 7 6 3 5 4 2 3 4 - 47
Total 1,574 1,155 2,149 2,546 2,166 2,132 2,360 2,338 2,683 3,300 6,085 1 28,489
Antarctica - - - 1 - 1 - - - - - - 2
Not Known 24 91 126 151 143 91 80 49 67 38 47 5 912
Total 165,581 132,737 241,002 340,195 341,883 297,678 235,871 173,067 141,196 105,014 130,786 195 2,305,205

Tourism Statistics Annual Report 201762
Appendix 9
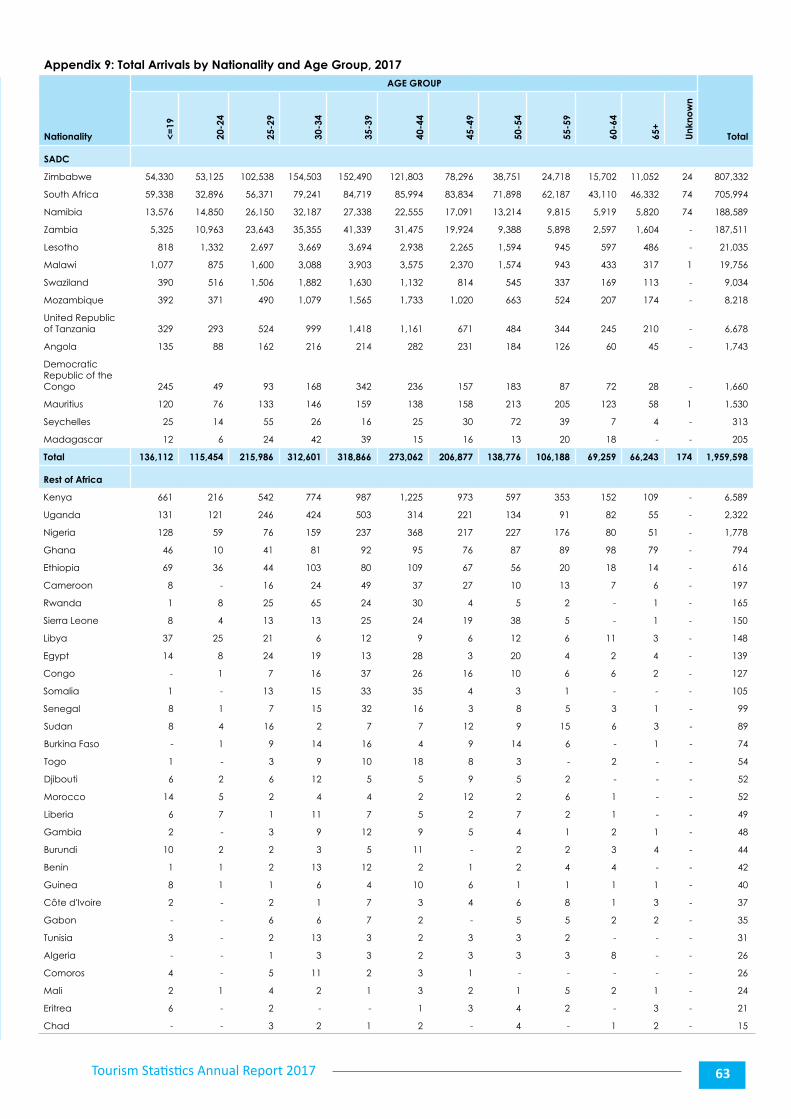
Tourism Statistics Annual Report 2017 63
Appendix 9: Total Arrivals by Nationality and Age Group, 2017
Nationality
AGE GROUP
Total<=19
20-2
4
25-2
9
30-3
4
35-3
9
40-4
4
45-4
9
50-5
4
55-5
9
60-6
4
65+
Unk
now
n
SADC
Zimbabwe 54,330 53,125 102,538 154,503 152,490 121,803 78,296 38,751 24,718 15,702 11,052 24 807,332
South Africa 59,338 32,896 56,371 79,241 84,719 85,994 83,834 71,898 62,187 43,110 46,332 74 705,994
Namibia 13,576 14,850 26,150 32,187 27,338 22,555 17,091 13,214 9,815 5,919 5,820 74 188,589
Zambia 5,325 10,963 23,643 35,355 41,339 31,475 19,924 9,388 5,898 2,597 1,604 - 187,511
Lesotho 818 1,332 2,697 3,669 3,694 2,938 2,265 1,594 945 597 486 - 21,035
Malawi 1,077 875 1,600 3,088 3,903 3,575 2,370 1,574 943 433 317 1 19,756
Swaziland 390 516 1,506 1,882 1,630 1,132 814 545 337 169 113 - 9,034
Mozambique 392 371 490 1,079 1,565 1,733 1,020 663 524 207 174 - 8,218
United Republic of Tanzania 329 293 524 999 1,418 1,161 671 484 344 245 210 - 6,678
Angola 135 88 162 216 214 282 231 184 126 60 45 - 1,743
Democratic Republic of the Congo 245 49 93 168 342 236 157 183 87 72 28 - 1,660
Mauritius 120 76 133 146 159 138 158 213 205 123 58 1 1,530
Seychelles 25 14 55 26 16 25 30 72 39 7 4 - 313
Madagascar 12 6 24 42 39 15 16 13 20 18 - - 205
Total 136,112 115,454 215,986 312,601 318,866 273,062 206,877 138,776 106,188 69,259 66,243 174 1,959,598
Rest of Africa
Kenya 661 216 542 774 987 1,225 973 597 353 152 109 - 6,589
Uganda 131 121 246 424 503 314 221 134 91 82 55 - 2,322
Nigeria 128 59 76 159 237 368 217 227 176 80 51 - 1,778
Ghana 46 10 41 81 92 95 76 87 89 98 79 - 794
Ethiopia 69 36 44 103 80 109 67 56 20 18 14 - 616
Cameroon 8 - 16 24 49 37 27 10 13 7 6 - 197
Rwanda 1 8 25 65 24 30 4 5 2 - 1 - 165
Sierra Leone 8 4 13 13 25 24 19 38 5 - 1 - 150
Libya 37 25 21 6 12 9 6 12 6 11 3 - 148
Egypt 14 8 24 19 13 28 3 20 4 2 4 - 139
Congo - 1 7 16 37 26 16 10 6 6 2 - 127
Somalia 1 - 13 15 33 35 4 3 1 - - - 105
Senegal 8 1 7 15 32 16 3 8 5 3 1 - 99
Sudan 8 4 16 2 7 7 12 9 15 6 3 - 89
Burkina Faso - 1 9 14 16 4 9 14 6 - 1 - 74
Togo 1 - 3 9 10 18 8 3 - 2 - - 54
Djibouti 6 2 6 12 5 5 9 5 2 - - - 52
Morocco 14 5 2 4 4 2 12 2 6 1 - - 52
Liberia 6 7 1 11 7 5 2 7 2 1 - - 49
Gambia 2 - 3 9 12 9 5 4 1 2 1 - 48
Burundi 10 2 2 3 5 11 - 2 2 3 4 - 44
Benin 1 1 2 13 12 2 1 2 4 4 - - 42
Guinea 8 1 1 6 4 10 6 1 1 1 1 - 40
Côte d'Ivoire 2 - 2 1 7 3 4 6 8 1 3 - 37
Gabon - - 6 6 7 2 - 5 5 2 2 - 35
Tunisia 3 - 2 13 3 2 3 3 2 - - - 31
Algeria - - 1 3 3 2 3 3 3 8 - - 26
Comoros 4 - 5 11 2 3 1 - - - - - 26
Mali 2 1 4 2 1 3 2 1 5 2 1 - 24
Eritrea 6 - 2 - - 1 3 4 2 - 3 - 21
Chad - - 3 2 1 2 - 4 - 1 2 - 15
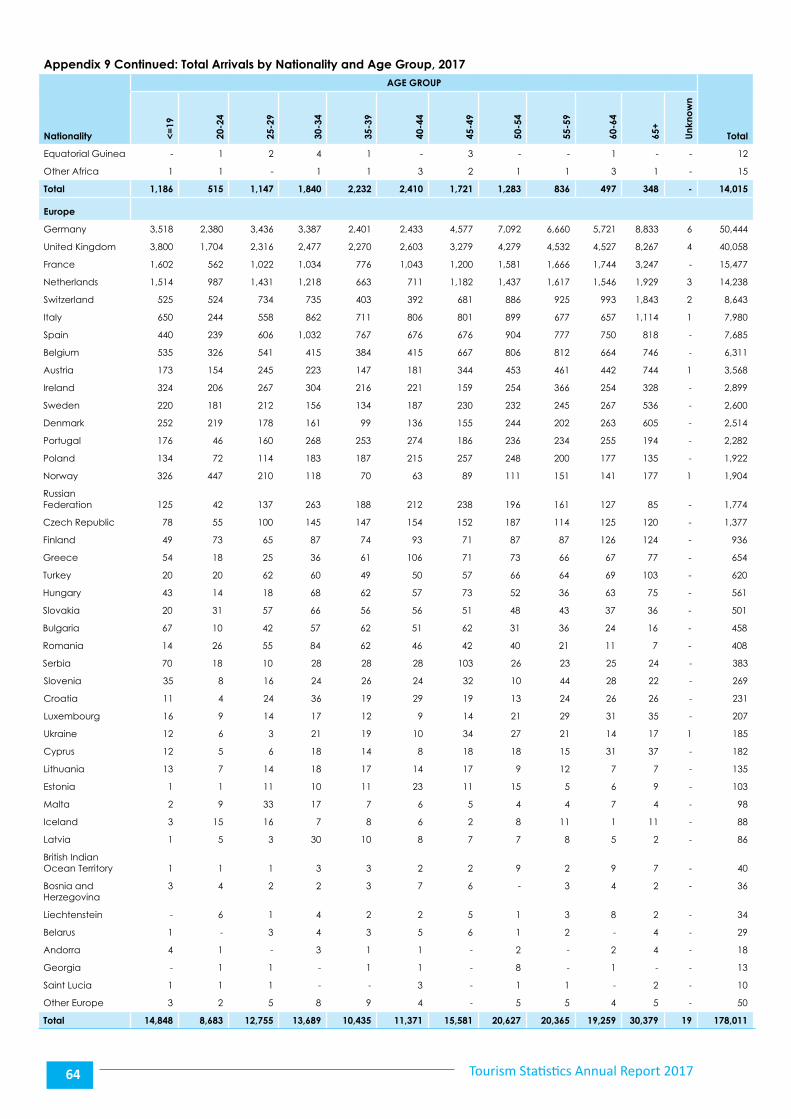
Tourism Statistics Annual Report 201764
Appendix 9 Continued: Total Arrivals by Nationality and Age Group, 2017
Nationality
AGE GROUP
Total<=19
20-2
4
25-2
9
30-3
4
35-3
9
40-4
4
45-4
9
50-5
4
55-5
9
60-6
4
65+
Unk
now
n
Equatorial Guinea - 1 2 4 1 - 3 - - 1 - - 12
Other Africa 1 1 - 1 1 3 2 1 1 3 1 - 15
Total 1,186 515 1,147 1,840 2,232 2,410 1,721 1,283 836 497 348 - 14,015
Europe
Germany 3,518 2,380 3,436 3,387 2,401 2,433 4,577 7,092 6,660 5,721 8,833 6 50,444
United Kingdom 3,800 1,704 2,316 2,477 2,270 2,603 3,279 4,279 4,532 4,527 8,267 4 40,058
France 1,602 562 1,022 1,034 776 1,043 1,200 1,581 1,666 1,744 3,247 - 15,477
Netherlands 1,514 987 1,431 1,218 663 711 1,182 1,437 1,617 1,546 1,929 3 14,238
Switzerland 525 524 734 735 403 392 681 886 925 993 1,843 2 8,643
Italy 650 244 558 862 711 806 801 899 677 657 1,114 1 7,980
Spain 440 239 606 1,032 767 676 676 904 777 750 818 - 7,685
Belgium 535 326 541 415 384 415 667 806 812 664 746 - 6,311
Austria 173 154 245 223 147 181 344 453 461 442 744 1 3,568
Ireland 324 206 267 304 216 221 159 254 366 254 328 - 2,899
Sweden 220 181 212 156 134 187 230 232 245 267 536 - 2,600
Denmark 252 219 178 161 99 136 155 244 202 263 605 - 2,514
Portugal 176 46 160 268 253 274 186 236 234 255 194 - 2,282
Poland 134 72 114 183 187 215 257 248 200 177 135 - 1,922
Norway 326 447 210 118 70 63 89 111 151 141 177 1 1,904
Russian Federation 125 42 137 263 188 212 238 196 161 127 85 - 1,774
Czech Republic 78 55 100 145 147 154 152 187 114 125 120 - 1,377
Finland 49 73 65 87 74 93 71 87 87 126 124 - 936
Greece 54 18 25 36 61 106 71 73 66 67 77 - 654
Turkey 20 20 62 60 49 50 57 66 64 69 103 - 620
Hungary 43 14 18 68 62 57 73 52 36 63 75 - 561
Slovakia 20 31 57 66 56 56 51 48 43 37 36 - 501
Bulgaria 67 10 42 57 62 51 62 31 36 24 16 - 458
Romania 14 26 55 84 62 46 42 40 21 11 7 - 408
Serbia 70 18 10 28 28 28 103 26 23 25 24 - 383
Slovenia 35 8 16 24 26 24 32 10 44 28 22 - 269
Croatia 11 4 24 36 19 29 19 13 24 26 26 - 231
Luxembourg 16 9 14 17 12 9 14 21 29 31 35 - 207
Ukraine 12 6 3 21 19 10 34 27 21 14 17 1 185
Cyprus 12 5 6 18 14 8 18 18 15 31 37 - 182
Lithuania 13 7 14 18 17 14 17 9 12 7 7 - 135
Estonia 1 1 11 10 11 23 11 15 5 6 9 - 103
Malta 2 9 33 17 7 6 5 4 4 7 4 - 98
Iceland 3 15 16 7 8 6 2 8 11 1 11 - 88
Latvia 1 5 3 30 10 8 7 7 8 5 2 - 86
British Indian Ocean Territory 1 1 1 3 3 2 2 9 2 9 7 - 40
Bosnia and Herzegovina
3 4 2 2 3 7 6 - 3 4 2 - 36
Liechtenstein - 6 1 4 2 2 5 1 3 8 2 - 34
Belarus 1 - 3 4 3 5 6 1 2 - 4 - 29
Andorra 4 1 - 3 1 1 - 2 - 2 4 - 18
Georgia - 1 1 - 1 1 - 8 - 1 - - 13
Saint Lucia 1 1 1 - - 3 - 1 1 - 2 - 10
Other Europe 3 2 5 8 9 4 - 5 5 4 5 - 50
Total 14,848 8,683 12,755 13,689 10,435 11,371 15,581 20,627 20,365 19,259 30,379 19 178,011
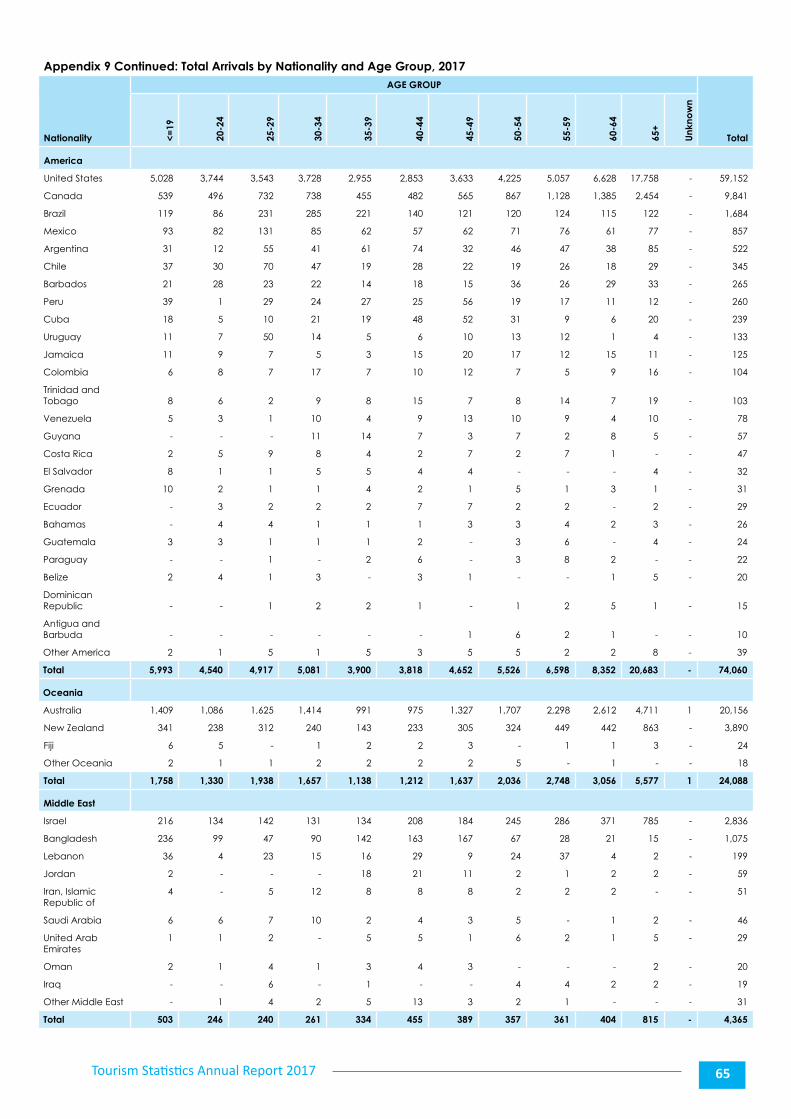
Tourism Statistics Annual Report 2017 65
Appendix 9 Continued: Total Arrivals by Nationality and Age Group, 2017
Nationality
AGE GROUP
Total<=19
20-2
4
25-2
9
30-3
4
35-3
9
40-4
4
45-4
9
50-5
4
55-5
9
60-6
4
65+
Unk
now
n
America
United States 5,028 3,744 3,543 3,728 2,955 2,853 3,633 4,225 5,057 6,628 17,758 - 59,152
Canada 539 496 732 738 455 482 565 867 1,128 1,385 2,454 - 9,841
Brazil 119 86 231 285 221 140 121 120 124 115 122 - 1,684
Mexico 93 82 131 85 62 57 62 71 76 61 77 - 857
Argentina 31 12 55 41 61 74 32 46 47 38 85 - 522
Chile 37 30 70 47 19 28 22 19 26 18 29 - 345
Barbados 21 28 23 22 14 18 15 36 26 29 33 - 265
Peru 39 1 29 24 27 25 56 19 17 11 12 - 260
Cuba 18 5 10 21 19 48 52 31 9 6 20 - 239
Uruguay 11 7 50 14 5 6 10 13 12 1 4 - 133
Jamaica 11 9 7 5 3 15 20 17 12 15 11 - 125
Colombia 6 8 7 17 7 10 12 7 5 9 16 - 104
Trinidad and Tobago 8 6 2 9 8 15 7 8 14 7 19 - 103
Venezuela 5 3 1 10 4 9 13 10 9 4 10 - 78
Guyana - - - 11 14 7 3 7 2 8 5 - 57
Costa Rica 2 5 9 8 4 2 7 2 7 1 - - 47
El Salvador 8 1 1 5 5 4 4 - - - 4 - 32
Grenada 10 2 1 1 4 2 1 5 1 3 1 - 31
Ecuador - 3 2 2 2 7 7 2 2 - 2 - 29
Bahamas - 4 4 1 1 1 3 3 4 2 3 - 26
Guatemala 3 3 1 1 1 2 - 3 6 - 4 - 24
Paraguay - - 1 - 2 6 - 3 8 2 - - 22
Belize 2 4 1 3 - 3 1 - - 1 5 - 20
Dominican Republic - - 1 2 2 1 - 1 2 5 1 - 15
Antigua and Barbuda - - - - - - 1 6 2 1 - - 10
Other America 2 1 5 1 5 3 5 5 2 2 8 - 39
Total 5,993 4,540 4,917 5,081 3,900 3,818 4,652 5,526 6,598 8,352 20,683 - 74,060
Oceania
Australia 1,409 1,086 1,625 1,414 991 975 1,327 1,707 2,298 2,612 4,711 1 20,156
New Zealand 341 238 312 240 143 233 305 324 449 442 863 - 3,890
Fiji 6 5 - 1 2 2 3 - 1 1 3 - 24
Other Oceania 2 1 1 2 2 2 2 5 - 1 - - 18
Total 1,758 1,330 1,938 1,657 1,138 1,212 1,637 2,036 2,748 3,056 5,577 1 24,088
Middle East
Israel 216 134 142 131 134 208 184 245 286 371 785 - 2,836
Bangladesh 236 99 47 90 142 163 167 67 28 21 15 - 1,075
Lebanon 36 4 23 15 16 29 9 24 37 4 2 - 199
Jordan 2 - - - 18 21 11 2 1 2 2 - 59
Iran, Islamic Republic of
4 - 5 12 8 8 8 2 2 2 - - 51
Saudi Arabia 6 6 7 10 2 4 3 5 - 1 2 - 46
United Arab Emirates
1 1 2 - 5 5 1 6 2 1 5 - 29
Oman 2 1 4 1 3 4 3 - - - 2 - 20
Iraq - - 6 - 1 - - 4 4 2 2 - 19
Other Middle East - 1 4 2 5 13 3 2 1 - - - 31
Total 503 246 240 261 334 455 389 357 361 404 815 - 4,365
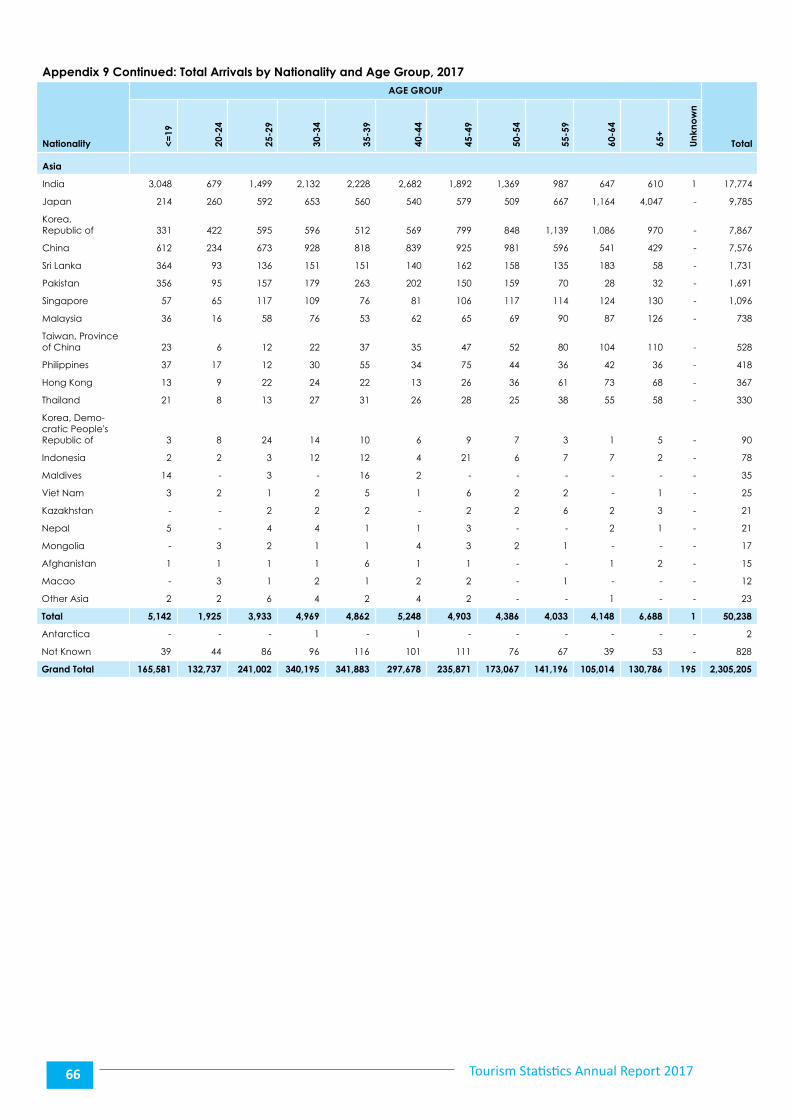
Tourism Statistics Annual Report 201766
Appendix 9 Continued: Total Arrivals by Nationality and Age Group, 2017
Nationality
AGE GROUP
Total<=19
20-2
4
25-2
9
30-3
4
35-3
9
40-4
4
45-4
9
50-5
4
55-5
9
60-6
4
65+
Unk
now
n
Asia
India 3,048 679 1,499 2,132 2,228 2,682 1,892 1,369 987 647 610 1 17,774
Japan 214 260 592 653 560 540 579 509 667 1,164 4,047 - 9,785
Korea, Republic of 331 422 595 596 512 569 799 848 1,139 1,086 970 - 7,867
China 612 234 673 928 818 839 925 981 596 541 429 - 7,576
Sri Lanka 364 93 136 151 151 140 162 158 135 183 58 - 1,731
Pakistan 356 95 157 179 263 202 150 159 70 28 32 - 1,691
Singapore 57 65 117 109 76 81 106 117 114 124 130 - 1,096
Malaysia 36 16 58 76 53 62 65 69 90 87 126 - 738
Taiwan, Province of China 23 6 12 22 37 35 47 52 80 104 110 - 528
Philippines 37 17 12 30 55 34 75 44 36 42 36 - 418
Hong Kong 13 9 22 24 22 13 26 36 61 73 68 - 367
Thailand 21 8 13 27 31 26 28 25 38 55 58 - 330
Korea, Demo-cratic People's Republic of 3 8 24 14 10 6 9 7 3 1 5 - 90
Indonesia 2 2 3 12 12 4 21 6 7 7 2 - 78
Maldives 14 - 3 - 16 2 - - - - - - 35
Viet Nam 3 2 1 2 5 1 6 2 2 - 1 - 25
Kazakhstan - - 2 2 2 - 2 2 6 2 3 - 21
Nepal 5 - 4 4 1 1 3 - - 2 1 - 21
Mongolia - 3 2 1 1 4 3 2 1 - - - 17
Afghanistan 1 1 1 1 6 1 1 - - 1 2 - 15
Macao - 3 1 2 1 2 2 - 1 - - - 12
Other Asia 2 2 6 4 2 4 2 - - 1 - - 23
Total 5,142 1,925 3,933 4,969 4,862 5,248 4,903 4,386 4,033 4,148 6,688 1 50,238
Antarctica - - - 1 - 1 - - - - - - 2
Not Known 39 44 86 96 116 101 111 76 67 39 53 - 828
Grand Total 165,581 132,737 241,002 340,195 341,883 297,678 235,871 173,067 141,196 105,014 130,786 195 2,305,205

Tourism Statistics Annual Report 2017 67
Appendix 10
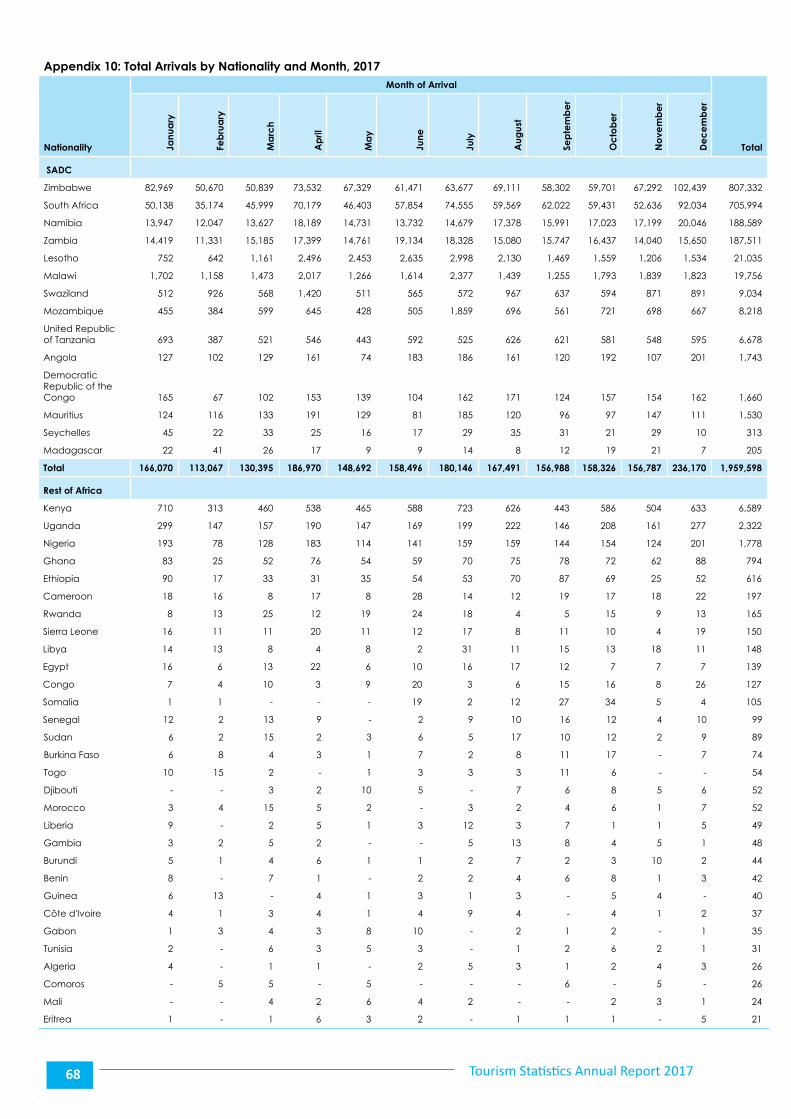
Tourism Statistics Annual Report 201768
Appendix 10: Total Arrivals by Nationality and Month, 2017
Nationality
Month of Arrival
TotalJanu
ary
Feb
rua
ry
Ma
rch
Ap
ril
Ma
y
June
July
Aug
ust
Sep
tem
be
r
Oc
tob
er
No
vem
be
r
De
ce
mb
er
SADC
Zimbabwe 82,969 50,670 50,839 73,532 67,329 61,471 63,677 69,111 58,302 59,701 67,292 102,439 807,332
South Africa 50,138 35,174 45,999 70,179 46,403 57,854 74,555 59,569 62,022 59,431 52,636 92,034 705,994
Namibia 13,947 12,047 13,627 18,189 14,731 13,732 14,679 17,378 15,991 17,023 17,199 20,046 188,589
Zambia 14,419 11,331 15,185 17,399 14,761 19,134 18,328 15,080 15,747 16,437 14,040 15,650 187,511
Lesotho 752 642 1,161 2,496 2,453 2,635 2,998 2,130 1,469 1,559 1,206 1,534 21,035
Malawi 1,702 1,158 1,473 2,017 1,266 1,614 2,377 1,439 1,255 1,793 1,839 1,823 19,756
Swaziland 512 926 568 1,420 511 565 572 967 637 594 871 891 9,034
Mozambique 455 384 599 645 428 505 1,859 696 561 721 698 667 8,218
United Republic of Tanzania 693 387 521 546 443 592 525 626 621 581 548 595 6,678
Angola 127 102 129 161 74 183 186 161 120 192 107 201 1,743
Democratic Republic of the Congo 165 67 102 153 139 104 162 171 124 157 154 162 1,660
Mauritius 124 116 133 191 129 81 185 120 96 97 147 111 1,530
Seychelles 45 22 33 25 16 17 29 35 31 21 29 10 313
Madagascar 22 41 26 17 9 9 14 8 12 19 21 7 205
Total 166,070 113,067 130,395 186,970 148,692 158,496 180,146 167,491 156,988 158,326 156,787 236,170 1,959,598
Rest of Africa
Kenya 710 313 460 538 465 588 723 626 443 586 504 633 6,589
Uganda 299 147 157 190 147 169 199 222 146 208 161 277 2,322
Nigeria 193 78 128 183 114 141 159 159 144 154 124 201 1,778
Ghana 83 25 52 76 54 59 70 75 78 72 62 88 794
Ethiopia 90 17 33 31 35 54 53 70 87 69 25 52 616
Cameroon 18 16 8 17 8 28 14 12 19 17 18 22 197
Rwanda 8 13 25 12 19 24 18 4 5 15 9 13 165
Sierra Leone 16 11 11 20 11 12 17 8 11 10 4 19 150
Libya 14 13 8 4 8 2 31 11 15 13 18 11 148
Egypt 16 6 13 22 6 10 16 17 12 7 7 7 139
Congo 7 4 10 3 9 20 3 6 15 16 8 26 127
Somalia 1 1 - - - 19 2 12 27 34 5 4 105
Senegal 12 2 13 9 - 2 9 10 16 12 4 10 99
Sudan 6 2 15 2 3 6 5 17 10 12 2 9 89
Burkina Faso 6 8 4 3 1 7 2 8 11 17 - 7 74
Togo 10 15 2 - 1 3 3 3 11 6 - - 54
Djibouti - - 3 2 10 5 - 7 6 8 5 6 52
Morocco 3 4 15 5 2 - 3 2 4 6 1 7 52
Liberia 9 - 2 5 1 3 12 3 7 1 1 5 49
Gambia 3 2 5 2 - - 5 13 8 4 5 1 48
Burundi 5 1 4 6 1 1 2 7 2 3 10 2 44
Benin 8 - 7 1 - 2 2 4 6 8 1 3 42
Guinea 6 13 - 4 1 3 1 3 - 5 4 - 40
Côte d'Ivoire 4 1 3 4 1 4 9 4 - 4 1 2 37
Gabon 1 3 4 3 8 10 - 2 1 2 - 1 35
Tunisia 2 - 6 3 5 3 - 1 2 6 2 1 31
Algeria 4 - 1 1 - 2 5 3 1 2 4 3 26
Comoros - 5 5 - 5 - - - 6 - 5 - 26
Mali - - 4 2 6 4 2 - - 2 3 1 24
Eritrea 1 - 1 6 3 2 - 1 1 1 - 5 21
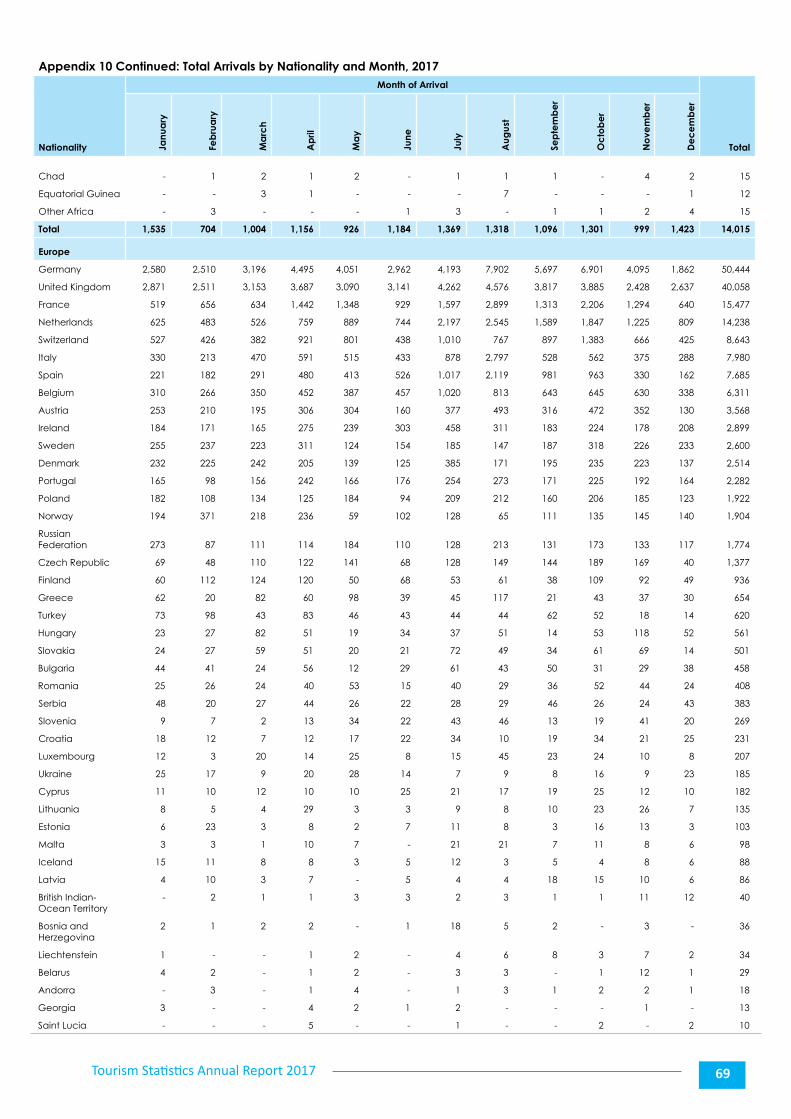
Tourism Statistics Annual Report 2017 69
Appendix 10 Continued: Total Arrivals by Nationality and Month, 2017
Nationality
Month of Arrival
TotalJanu
ary
Feb
rua
ry
Ma
rch
Ap
ril
Ma
y
June
July
Aug
ust
Sep
tem
be
r
Oc
tob
er
No
vem
be
r
De
ce
mb
er
Chad - 1 2 1 2 - 1 1 1 - 4 2 15
Equatorial Guinea - - 3 1 - - - 7 - - - 1 12
Other Africa - 3 - - - 1 3 - 1 1 2 4 15
Total 1,535 704 1,004 1,156 926 1,184 1,369 1,318 1,096 1,301 999 1,423 14,015
Europe
Germany 2,580 2,510 3,196 4,495 4,051 2,962 4,193 7,902 5,697 6,901 4,095 1,862 50,444
United Kingdom 2,871 2,511 3,153 3,687 3,090 3,141 4,262 4,576 3,817 3,885 2,428 2,637 40,058
France 519 656 634 1,442 1,348 929 1,597 2,899 1,313 2,206 1,294 640 15,477
Netherlands 625 483 526 759 889 744 2,197 2,545 1,589 1,847 1,225 809 14,238
Switzerland 527 426 382 921 801 438 1,010 767 897 1,383 666 425 8,643
Italy 330 213 470 591 515 433 878 2,797 528 562 375 288 7,980
Spain 221 182 291 480 413 526 1,017 2,119 981 963 330 162 7,685
Belgium 310 266 350 452 387 457 1,020 813 643 645 630 338 6,311
Austria 253 210 195 306 304 160 377 493 316 472 352 130 3,568
Ireland 184 171 165 275 239 303 458 311 183 224 178 208 2,899
Sweden 255 237 223 311 124 154 185 147 187 318 226 233 2,600
Denmark 232 225 242 205 139 125 385 171 195 235 223 137 2,514
Portugal 165 98 156 242 166 176 254 273 171 225 192 164 2,282
Poland 182 108 134 125 184 94 209 212 160 206 185 123 1,922
Norway 194 371 218 236 59 102 128 65 111 135 145 140 1,904
Russian Federation 273 87 111 114 184 110 128 213 131 173 133 117 1,774
Czech Republic 69 48 110 122 141 68 128 149 144 189 169 40 1,377
Finland 60 112 124 120 50 68 53 61 38 109 92 49 936
Greece 62 20 82 60 98 39 45 117 21 43 37 30 654
Turkey 73 98 43 83 46 43 44 44 62 52 18 14 620
Hungary 23 27 82 51 19 34 37 51 14 53 118 52 561
Slovakia 24 27 59 51 20 21 72 49 34 61 69 14 501
Bulgaria 44 41 24 56 12 29 61 43 50 31 29 38 458
Romania 25 26 24 40 53 15 40 29 36 52 44 24 408
Serbia 48 20 27 44 26 22 28 29 46 26 24 43 383
Slovenia 9 7 2 13 34 22 43 46 13 19 41 20 269
Croatia 18 12 7 12 17 22 34 10 19 34 21 25 231
Luxembourg 12 3 20 14 25 8 15 45 23 24 10 8 207
Ukraine 25 17 9 20 28 14 7 9 8 16 9 23 185
Cyprus 11 10 12 10 10 25 21 17 19 25 12 10 182
Lithuania 8 5 4 29 3 3 9 8 10 23 26 7 135
Estonia 6 23 3 8 2 7 11 8 3 16 13 3 103
Malta 3 3 1 10 7 - 21 21 7 11 8 6 98
Iceland 15 11 8 8 3 5 12 3 5 4 8 6 88
Latvia 4 10 3 7 - 5 4 4 18 15 10 6 86
British Indian-Ocean Territory
- 2 1 1 3 3 2 3 1 1 11 12 40
Bosnia and Herzegovina
2 1 2 2 - 1 18 5 2 - 3 - 36
Liechtenstein 1 - - 1 2 - 4 6 8 3 7 2 34
Belarus 4 2 - 1 2 - 3 3 - 1 12 1 29
Andorra - 3 - 1 4 - 1 3 1 2 2 1 18
Georgia 3 - - 4 2 1 2 - - - 1 - 13
Saint Lucia - - - 5 - - 1 - - 2 - 2 10
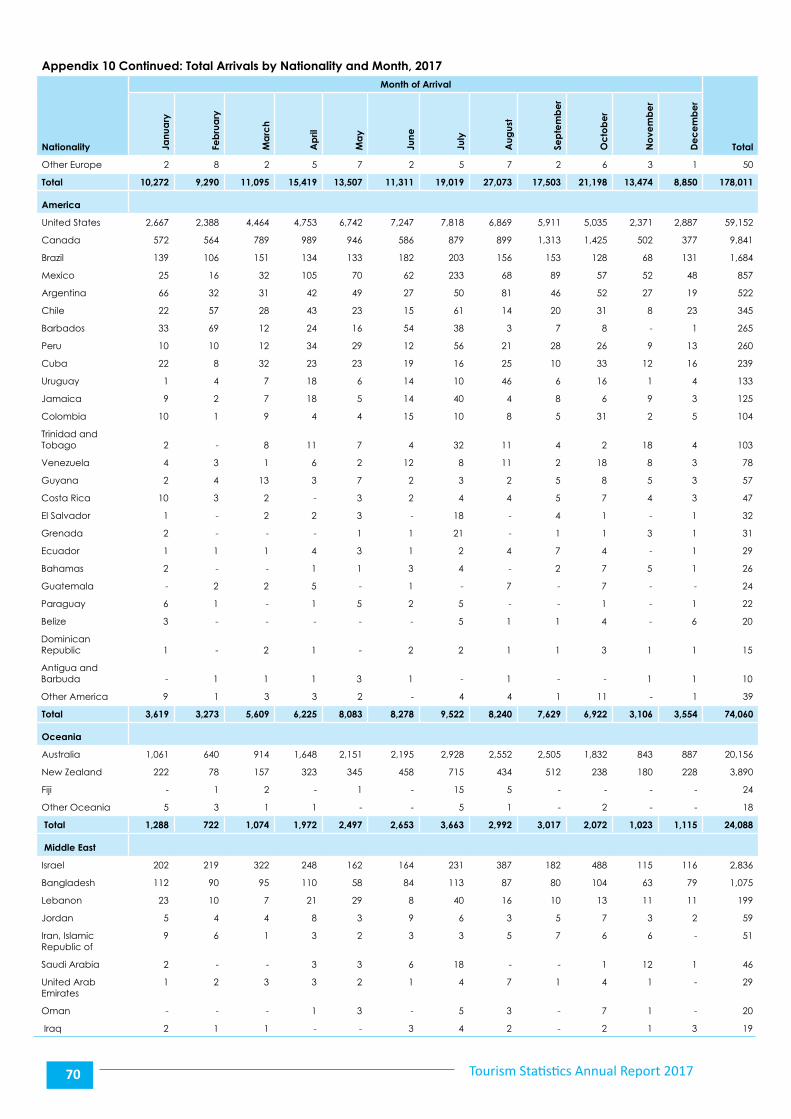
Tourism Statistics Annual Report 201770
Appendix 10 Continued: Total Arrivals by Nationality and Month, 2017
Nationality
Month of Arrival
TotalJanu
ary
Feb
rua
ry
Ma
rch
Ap
ril
Ma
y
June
July
Aug
ust
Sep
tem
be
r
Oc
tob
er
No
vem
be
r
De
ce
mb
er
Other Europe 2 8 2 5 7 2 5 7 2 6 3 1 50
Total 10,272 9,290 11,095 15,419 13,507 11,311 19,019 27,073 17,503 21,198 13,474 8,850 178,011
America
United States 2,667 2,388 4,464 4,753 6,742 7,247 7,818 6,869 5,911 5,035 2,371 2,887 59,152
Canada 572 564 789 989 946 586 879 899 1,313 1,425 502 377 9,841
Brazil 139 106 151 134 133 182 203 156 153 128 68 131 1,684
Mexico 25 16 32 105 70 62 233 68 89 57 52 48 857
Argentina 66 32 31 42 49 27 50 81 46 52 27 19 522
Chile 22 57 28 43 23 15 61 14 20 31 8 23 345
Barbados 33 69 12 24 16 54 38 3 7 8 - 1 265
Peru 10 10 12 34 29 12 56 21 28 26 9 13 260
Cuba 22 8 32 23 23 19 16 25 10 33 12 16 239
Uruguay 1 4 7 18 6 14 10 46 6 16 1 4 133
Jamaica 9 2 7 18 5 14 40 4 8 6 9 3 125
Colombia 10 1 9 4 4 15 10 8 5 31 2 5 104
Trinidad and Tobago 2 - 8 11 7 4 32 11 4 2 18 4 103
Venezuela 4 3 1 6 2 12 8 11 2 18 8 3 78
Guyana 2 4 13 3 7 2 3 2 5 8 5 3 57
Costa Rica 10 3 2 - 3 2 4 4 5 7 4 3 47
El Salvador 1 - 2 2 3 - 18 - 4 1 - 1 32
Grenada 2 - - - 1 1 21 - 1 1 3 1 31
Ecuador 1 1 1 4 3 1 2 4 7 4 - 1 29
Bahamas 2 - - 1 1 3 4 - 2 7 5 1 26
Guatemala - 2 2 5 - 1 - 7 - 7 - - 24
Paraguay 6 1 - 1 5 2 5 - - 1 - 1 22
Belize 3 - - - - - 5 1 1 4 - 6 20
DominicanRepublic 1 - 2 1 - 2 2 1 1 3 1 1 15
Antigua and Barbuda - 1 1 1 3 1 - 1 - - 1 1 10
Other America 9 1 3 3 2 - 4 4 1 11 - 1 39
Total 3,619 3,273 5,609 6,225 8,083 8,278 9,522 8,240 7,629 6,922 3,106 3,554 74,060
Oceania
Australia 1,061 640 914 1,648 2,151 2,195 2,928 2,552 2,505 1,832 843 887 20,156
New Zealand 222 78 157 323 345 458 715 434 512 238 180 228 3,890
Fiji - 1 2 - 1 - 15 5 - - - - 24
Other Oceania 5 3 1 1 - - 5 1 - 2 - - 18
Total 1,288 722 1,074 1,972 2,497 2,653 3,663 2,992 3,017 2,072 1,023 1,115 24,088
Middle East
Israel 202 219 322 248 162 164 231 387 182 488 115 116 2,836
Bangladesh 112 90 95 110 58 84 113 87 80 104 63 79 1,075
Lebanon 23 10 7 21 29 8 40 16 10 13 11 11 199
Jordan 5 4 4 8 3 9 6 3 5 7 3 2 59
Iran, Islamic Republic of
9 6 1 3 2 3 3 5 7 6 6 - 51
Saudi Arabia 2 - - 3 3 6 18 - - 1 12 1 46
United Arab Emirates
1 2 3 3 2 1 4 7 1 4 1 - 29
Oman - - - 1 3 - 5 3 - 7 1 - 20
Iraq 2 1 1 - - 3 4 2 - 2 1 3 19
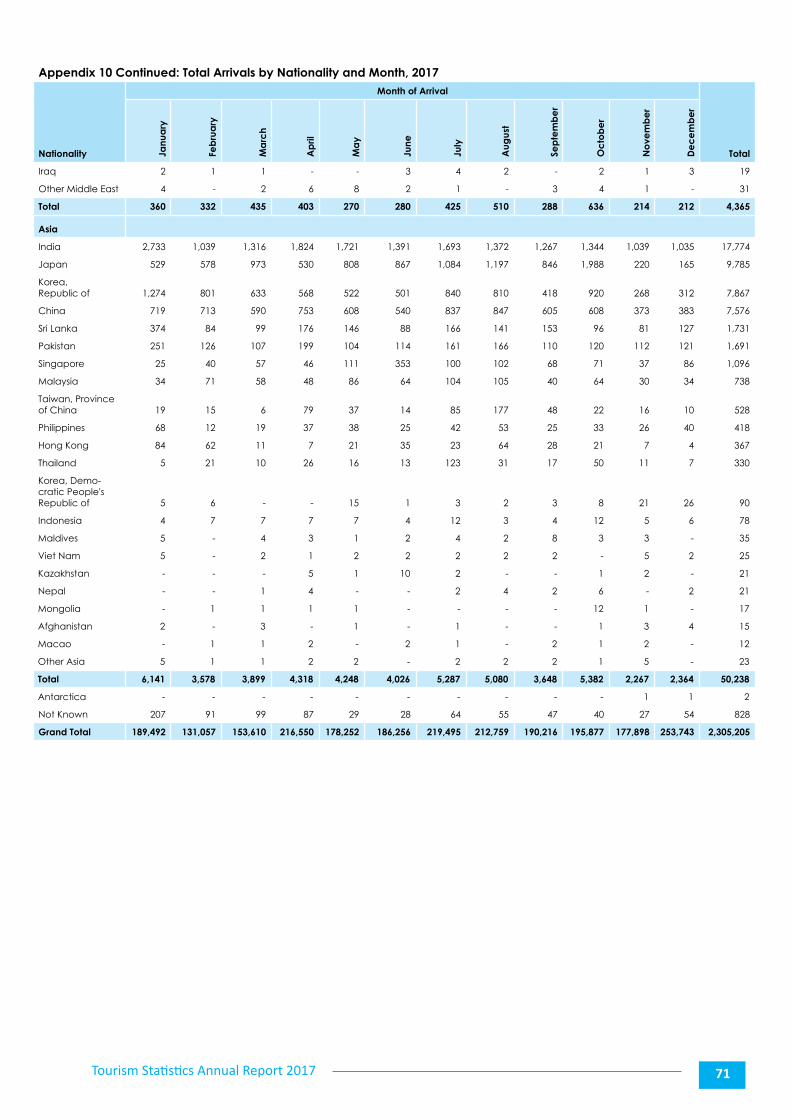
Tourism Statistics Annual Report 2017 71
Appendix 10 Continued: Total Arrivals by Nationality and Month, 2017
Nationality
Month of Arrival
TotalJanu
ary
Feb
rua
ry
Ma
rch
Ap
ril
Ma
y
June
July
Aug
ust
Sep
tem
be
r
Oc
tob
er
No
vem
be
r
De
ce
mb
er
Iraq 2 1 1 - - 3 4 2 - 2 1 3 19
Other Middle East 4 - 2 6 8 2 1 - 3 4 1 - 31
Total 360 332 435 403 270 280 425 510 288 636 214 212 4,365
Asia
India 2,733 1,039 1,316 1,824 1,721 1,391 1,693 1,372 1,267 1,344 1,039 1,035 17,774
Japan 529 578 973 530 808 867 1,084 1,197 846 1,988 220 165 9,785
Korea, Republic of 1,274 801 633 568 522 501 840 810 418 920 268 312 7,867
China 719 713 590 753 608 540 837 847 605 608 373 383 7,576
Sri Lanka 374 84 99 176 146 88 166 141 153 96 81 127 1,731
Pakistan 251 126 107 199 104 114 161 166 110 120 112 121 1,691
Singapore 25 40 57 46 111 353 100 102 68 71 37 86 1,096
Malaysia 34 71 58 48 86 64 104 105 40 64 30 34 738
Taiwan, Province of China 19 15 6 79 37 14 85 177 48 22 16 10 528
Philippines 68 12 19 37 38 25 42 53 25 33 26 40 418
Hong Kong 84 62 11 7 21 35 23 64 28 21 7 4 367
Thailand 5 21 10 26 16 13 123 31 17 50 11 7 330
Korea, Demo-cratic People's Republic of 5 6 - - 15 1 3 2 3 8 21 26 90
Indonesia 4 7 7 7 7 4 12 3 4 12 5 6 78
Maldives 5 - 4 3 1 2 4 2 8 3 3 - 35
Viet Nam 5 - 2 1 2 2 2 2 2 - 5 2 25
Kazakhstan - - - 5 1 10 2 - - 1 2 - 21
Nepal - - 1 4 - - 2 4 2 6 - 2 21
Mongolia - 1 1 1 1 - - - - 12 1 - 17
Afghanistan 2 - 3 - 1 - 1 - - 1 3 4 15
Macao - 1 1 2 - 2 1 - 2 1 2 - 12
Other Asia 5 1 1 2 2 - 2 2 2 1 5 - 23
Total 6,141 3,578 3,899 4,318 4,248 4,026 5,287 5,080 3,648 5,382 2,267 2,364 50,238
Antarctica - - - - - - - - - - 1 1 2
Not Known 207 91 99 87 29 28 64 55 47 40 27 54 828
Grand Total 189,492 131,057 153,610 216,550 178,252 186,256 219,495 212,759 190,216 195,877 177,898 253,743 2,305,205

Tourism Statistics Annual Report 201772
Appendix 11
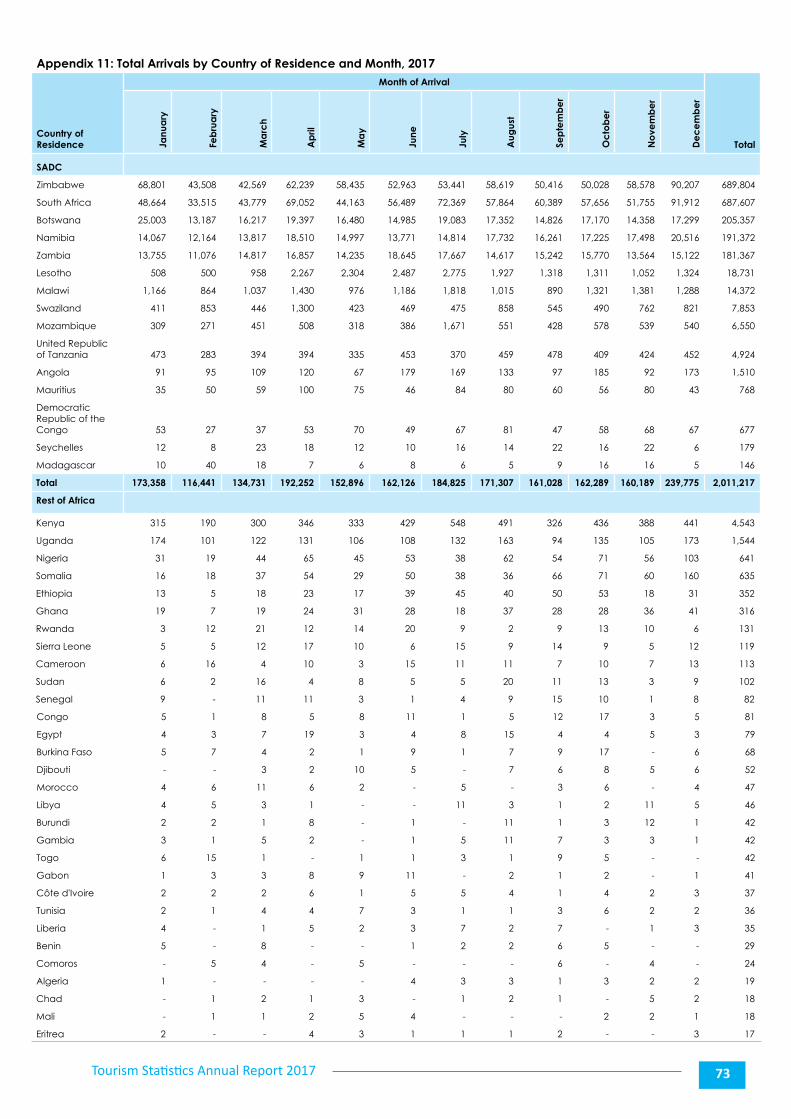
Tourism Statistics Annual Report 2017 73
Appendix 11: Total Arrivals by Country of Residence and Month, 2017
Country of Residence
Month of Arrival
TotalJanu
ary
Feb
rua
ry
Ma
rch
Ap
ril
Ma
y
June
July
Aug
ust
Sep
tem
be
r
Oc
tob
er
No
vem
be
r
De
ce
mb
er
SADC
Zimbabwe 68,801 43,508 42,569 62,239 58,435 52,963 53,441 58,619 50,416 50,028 58,578 90,207 689,804
South Africa 48,664 33,515 43,779 69,052 44,163 56,489 72,369 57,864 60,389 57,656 51,755 91,912 687,607
Botswana 25,003 13,187 16,217 19,397 16,480 14,985 19,083 17,352 14,826 17,170 14,358 17,299 205,357
Namibia 14,067 12,164 13,817 18,510 14,997 13,771 14,814 17,732 16,261 17,225 17,498 20,516 191,372
Zambia 13,755 11,076 14,817 16,857 14,235 18,645 17,667 14,617 15,242 15,770 13,564 15,122 181,367
Lesotho 508 500 958 2,267 2,304 2,487 2,775 1,927 1,318 1,311 1,052 1,324 18,731
Malawi 1,166 864 1,037 1,430 976 1,186 1,818 1,015 890 1,321 1,381 1,288 14,372
Swaziland 411 853 446 1,300 423 469 475 858 545 490 762 821 7,853
Mozambique 309 271 451 508 318 386 1,671 551 428 578 539 540 6,550
United Republic of Tanzania 473 283 394 394 335 453 370 459 478 409 424 452 4,924
Angola 91 95 109 120 67 179 169 133 97 185 92 173 1,510
Mauritius 35 50 59 100 75 46 84 80 60 56 80 43 768
Democratic Republic of the Congo 53 27 37 53 70 49 67 81 47 58 68 67 677
Seychelles 12 8 23 18 12 10 16 14 22 16 22 6 179
Madagascar 10 40 18 7 6 8 6 5 9 16 16 5 146
Total 173,358 116,441 134,731 192,252 152,896 162,126 184,825 171,307 161,028 162,289 160,189 239,775 2,011,217
Rest of Africa
Kenya 315 190 300 346 333 429 548 491 326 436 388 441 4,543
Uganda 174 101 122 131 106 108 132 163 94 135 105 173 1,544
Nigeria 31 19 44 65 45 53 38 62 54 71 56 103 641
Somalia 16 18 37 54 29 50 38 36 66 71 60 160 635
Ethiopia 13 5 18 23 17 39 45 40 50 53 18 31 352
Ghana 19 7 19 24 31 28 18 37 28 28 36 41 316
Rwanda 3 12 21 12 14 20 9 2 9 13 10 6 131
Sierra Leone 5 5 12 17 10 6 15 9 14 9 5 12 119
Cameroon 6 16 4 10 3 15 11 11 7 10 7 13 113
Sudan 6 2 16 4 8 5 5 20 11 13 3 9 102
Senegal 9 - 11 11 3 1 4 9 15 10 1 8 82
Congo 5 1 8 5 8 11 1 5 12 17 3 5 81
Egypt 4 3 7 19 3 4 8 15 4 4 5 3 79
Burkina Faso 5 7 4 2 1 9 1 7 9 17 - 6 68
Djibouti - - 3 2 10 5 - 7 6 8 5 6 52
Morocco 4 6 11 6 2 - 5 - 3 6 - 4 47
Libya 4 5 3 1 - - 11 3 1 2 11 5 46
Burundi 2 2 1 8 - 1 - 11 1 3 12 1 42
Gambia 3 1 5 2 - 1 5 11 7 3 3 1 42
Togo 6 15 1 - 1 1 3 1 9 5 - - 42
Gabon 1 3 3 8 9 11 - 2 1 2 - 1 41
Côte d'Ivoire 2 2 2 6 1 5 5 4 1 4 2 3 37
Tunisia 2 1 4 4 7 3 1 1 3 6 2 2 36
Liberia 4 - 1 5 2 3 7 2 7 - 1 3 35
Benin 5 - 8 - - 1 2 2 6 5 - - 29
Comoros - 5 4 - 5 - - - 6 - 4 - 24
Algeria 1 - - - - 4 3 3 1 3 2 2 19
Chad - 1 2 1 3 - 1 2 1 - 5 2 18
Mali - 1 1 2 5 4 - - - 2 2 1 18
Eritrea 2 - - 4 3 1 1 1 2 - - 3 17
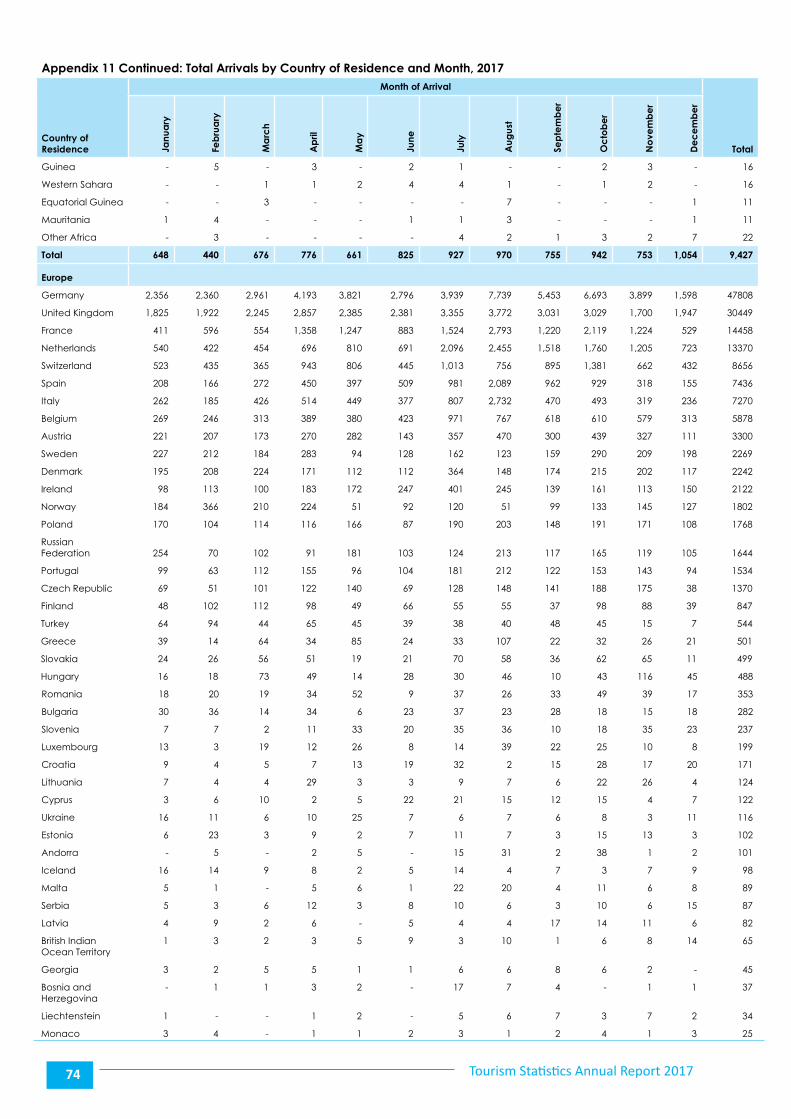
Tourism Statistics Annual Report 201774
Appendix 11 Continued: Total Arrivals by Country of Residence and Month, 2017
Country of Residence
Month of Arrival
TotalJanu
ary
Feb
rua
ry
Ma
rch
Ap
ril
Ma
y
June
July
Aug
ust
Sep
tem
be
r
Oc
tob
er
No
vem
be
r
De
ce
mb
er
Guinea - 5 - 3 - 2 1 - - 2 3 - 16
Western Sahara - - 1 1 2 4 4 1 - 1 2 - 16
Equatorial Guinea - - 3 - - - - 7 - - - 1 11
Mauritania 1 4 - - - 1 1 3 - - - 1 11
Other Africa - 3 - - - - 4 2 1 3 2 7 22
Total 648 440 676 776 661 825 927 970 755 942 753 1,054 9,427
Europe
Germany 2,356 2,360 2,961 4,193 3,821 2,796 3,939 7,739 5,453 6,693 3,899 1,598 47808
United Kingdom 1,825 1,922 2,245 2,857 2,385 2,381 3,355 3,772 3,031 3,029 1,700 1,947 30449
France 411 596 554 1,358 1,247 883 1,524 2,793 1,220 2,119 1,224 529 14458
Netherlands 540 422 454 696 810 691 2,096 2,455 1,518 1,760 1,205 723 13370
Switzerland 523 435 365 943 806 445 1,013 756 895 1,381 662 432 8656
Spain 208 166 272 450 397 509 981 2,089 962 929 318 155 7436
Italy 262 185 426 514 449 377 807 2,732 470 493 319 236 7270
Belgium 269 246 313 389 380 423 971 767 618 610 579 313 5878
Austria 221 207 173 270 282 143 357 470 300 439 327 111 3300
Sweden 227 212 184 283 94 128 162 123 159 290 209 198 2269
Denmark 195 208 224 171 112 112 364 148 174 215 202 117 2242
Ireland 98 113 100 183 172 247 401 245 139 161 113 150 2122
Norway 184 366 210 224 51 92 120 51 99 133 145 127 1802
Poland 170 104 114 116 166 87 190 203 148 191 171 108 1768
Russian Federation 254 70 102 91 181 103 124 213 117 165 119 105 1644
Portugal 99 63 112 155 96 104 181 212 122 153 143 94 1534
Czech Republic 69 51 101 122 140 69 128 148 141 188 175 38 1370
Finland 48 102 112 98 49 66 55 55 37 98 88 39 847
Turkey 64 94 44 65 45 39 38 40 48 45 15 7 544
Greece 39 14 64 34 85 24 33 107 22 32 26 21 501
Slovakia 24 26 56 51 19 21 70 58 36 62 65 11 499
Hungary 16 18 73 49 14 28 30 46 10 43 116 45 488
Romania 18 20 19 34 52 9 37 26 33 49 39 17 353
Bulgaria 30 36 14 34 6 23 37 23 28 18 15 18 282
Slovenia 7 7 2 11 33 20 35 36 10 18 35 23 237
Luxembourg 13 3 19 12 26 8 14 39 22 25 10 8 199
Croatia 9 4 5 7 13 19 32 2 15 28 17 20 171
Lithuania 7 4 4 29 3 3 9 7 6 22 26 4 124
Cyprus 3 6 10 2 5 22 21 15 12 15 4 7 122
Ukraine 16 11 6 10 25 7 6 7 6 8 3 11 116
Estonia 6 23 3 9 2 7 11 7 3 15 13 3 102
Andorra - 5 - 2 5 - 15 31 2 38 1 2 101
Iceland 16 14 9 8 2 5 14 4 7 3 7 9 98
Malta 5 1 - 5 6 1 22 20 4 11 6 8 89
Serbia 5 3 6 12 3 8 10 6 3 10 6 15 87
Latvia 4 9 2 6 - 5 4 4 17 14 11 6 82
British Indian Ocean Territory
1 3 2 3 5 9 3 10 1 6 8 14 65
Georgia 3 2 5 5 1 1 6 6 8 6 2 - 45
Bosnia and Herzegovina
- 1 1 3 2 - 17 7 4 - 1 1 37
Liechtenstein 1 - - 1 2 - 5 6 7 3 7 2 34
Monaco 3 4 - 1 1 2 3 1 2 4 1 3 25
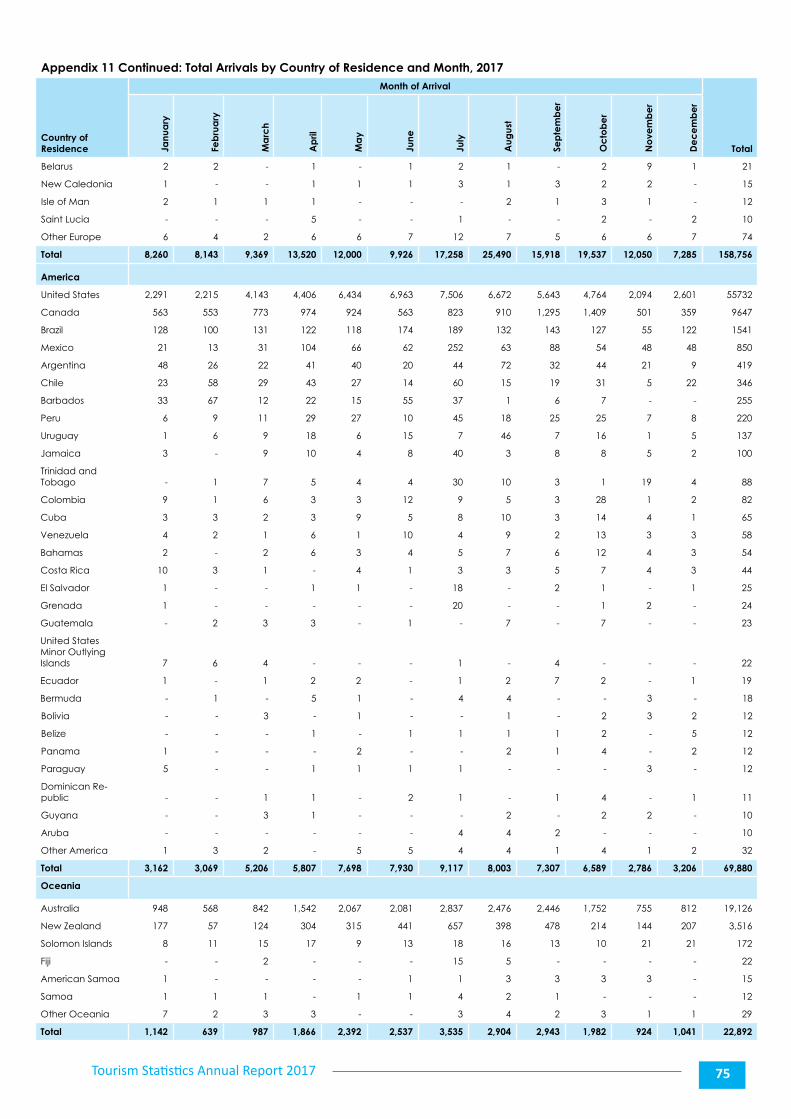
Tourism Statistics Annual Report 2017 75
Appendix 11 Continued: Total Arrivals by Country of Residence and Month, 2017
Country of Residence
Month of Arrival
TotalJanu
ary
Feb
rua
ry
Ma
rch
Ap
ril
Ma
y
June
July
Aug
ust
Sep
tem
be
r
Oc
tob
er
No
vem
be
r
De
ce
mb
er
Belarus 2 2 - 1 - 1 2 1 - 2 9 1 21
New Caledonia 1 - - 1 1 1 3 1 3 2 2 - 15
Isle of Man 2 1 1 1 - - - 2 1 3 1 - 12
Saint Lucia - - - 5 - - 1 - - 2 - 2 10
Other Europe 6 4 2 6 6 7 12 7 5 6 6 7 74
Total 8,260 8,143 9,369 13,520 12,000 9,926 17,258 25,490 15,918 19,537 12,050 7,285 158,756
America
United States 2,291 2,215 4,143 4,406 6,434 6,963 7,506 6,672 5,643 4,764 2,094 2,601 55732
Canada 563 553 773 974 924 563 823 910 1,295 1,409 501 359 9647
Brazil 128 100 131 122 118 174 189 132 143 127 55 122 1541
Mexico 21 13 31 104 66 62 252 63 88 54 48 48 850
Argentina 48 26 22 41 40 20 44 72 32 44 21 9 419
Chile 23 58 29 43 27 14 60 15 19 31 5 22 346
Barbados 33 67 12 22 15 55 37 1 6 7 - - 255
Peru 6 9 11 29 27 10 45 18 25 25 7 8 220
Uruguay 1 6 9 18 6 15 7 46 7 16 1 5 137
Jamaica 3 - 9 10 4 8 40 3 8 8 5 2 100
Trinidad and Tobago - 1 7 5 4 4 30 10 3 1 19 4 88
Colombia 9 1 6 3 3 12 9 5 3 28 1 2 82
Cuba 3 3 2 3 9 5 8 10 3 14 4 1 65
Venezuela 4 2 1 6 1 10 4 9 2 13 3 3 58
Bahamas 2 - 2 6 3 4 5 7 6 12 4 3 54
Costa Rica 10 3 1 - 4 1 3 3 5 7 4 3 44
El Salvador 1 - - 1 1 - 18 - 2 1 - 1 25
Grenada 1 - - - - - 20 - - 1 2 - 24
Guatemala - 2 3 3 - 1 - 7 - 7 - - 23
United States Minor Outlying Islands 7 6 4 - - - 1 - 4 - - - 22
Ecuador 1 - 1 2 2 - 1 2 7 2 - 1 19
Bermuda - 1 - 5 1 - 4 4 - - 3 - 18
Bolivia - - 3 - 1 - - 1 - 2 3 2 12
Belize - - - 1 - 1 1 1 1 2 - 5 12
Panama 1 - - - 2 - - 2 1 4 - 2 12
Paraguay 5 - - 1 1 1 1 - - - 3 - 12
Dominican Re-public - - 1 1 - 2 1 - 1 4 - 1 11
Guyana - - 3 1 - - - 2 - 2 2 - 10
Aruba - - - - - - 4 4 2 - - - 10
Other America 1 3 2 - 5 5 4 4 1 4 1 2 32
Total 3,162 3,069 5,206 5,807 7,698 7,930 9,117 8,003 7,307 6,589 2,786 3,206 69,880
Oceania
Australia 948 568 842 1,542 2,067 2,081 2,837 2,476 2,446 1,752 755 812 19,126
New Zealand 177 57 124 304 315 441 657 398 478 214 144 207 3,516
Solomon Islands 8 11 15 17 9 13 18 16 13 10 21 21 172
Fiji - - 2 - - - 15 5 - - - - 22
American Samoa 1 - - - - 1 1 3 3 3 3 - 15
Samoa 1 1 1 - 1 1 4 2 1 - - - 12
Other Oceania 7 2 3 3 - - 3 4 2 3 1 1 29
Total 1,142 639 987 1,866 2,392 2,537 3,535 2,904 2,943 1,982 924 1,041 22,892
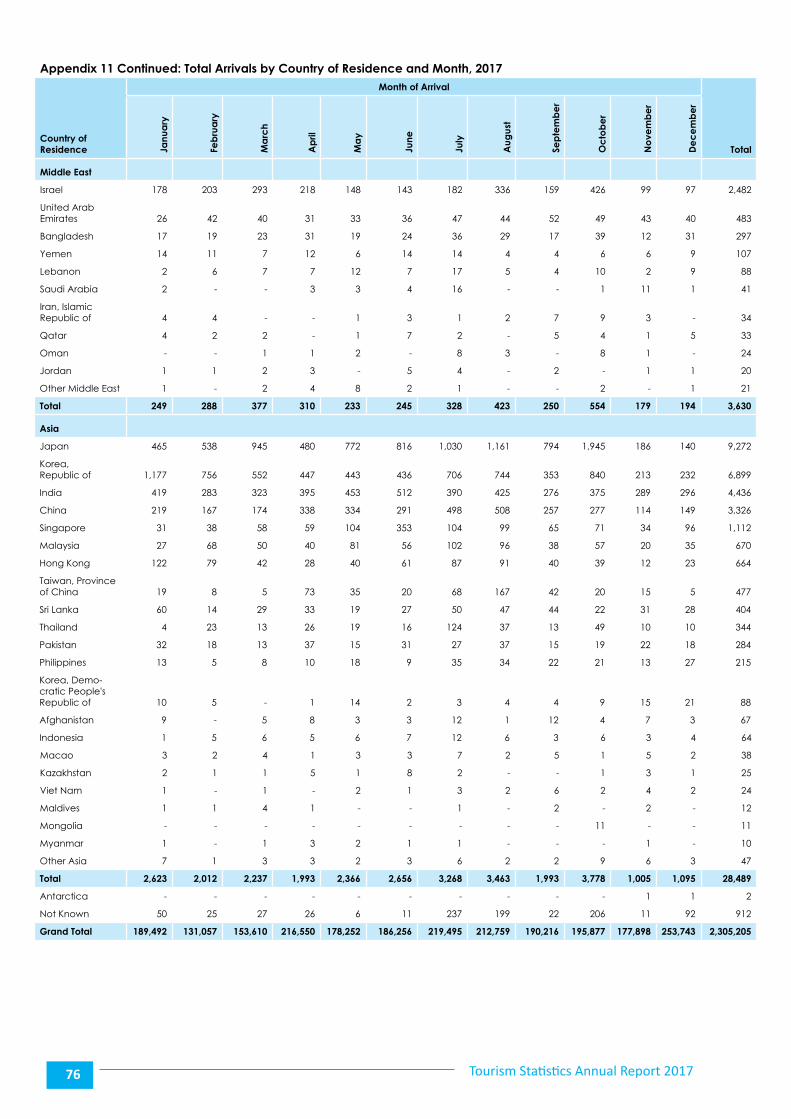
Tourism Statistics Annual Report 201776
Appendix 11 Continued: Total Arrivals by Country of Residence and Month, 2017
Country of Residence
Month of Arrival
TotalJanu
ary
Feb
rua
ry
Ma
rch
Ap
ril
Ma
y
June
July
Aug
ust
Sep
tem
be
r
Oc
tob
er
No
vem
be
r
De
ce
mb
er
Middle East
Israel 178 203 293 218 148 143 182 336 159 426 99 97 2,482
United Arab Emirates 26 42 40 31 33 36 47 44 52 49 43 40 483
Bangladesh 17 19 23 31 19 24 36 29 17 39 12 31 297
Yemen 14 11 7 12 6 14 14 4 4 6 6 9 107
Lebanon 2 6 7 7 12 7 17 5 4 10 2 9 88
Saudi Arabia 2 - - 3 3 4 16 - - 1 11 1 41
Iran, Islamic Republic of 4 4 - - 1 3 1 2 7 9 3 - 34
Qatar 4 2 2 - 1 7 2 - 5 4 1 5 33
Oman - - 1 1 2 - 8 3 - 8 1 - 24
Jordan 1 1 2 3 - 5 4 - 2 - 1 1 20
Other Middle East 1 - 2 4 8 2 1 - - 2 - 1 21
Total 249 288 377 310 233 245 328 423 250 554 179 194 3,630
Asia
Japan 465 538 945 480 772 816 1,030 1,161 794 1,945 186 140 9,272
Korea, Republic of 1,177 756 552 447 443 436 706 744 353 840 213 232 6,899
India 419 283 323 395 453 512 390 425 276 375 289 296 4,436
China 219 167 174 338 334 291 498 508 257 277 114 149 3,326
Singapore 31 38 58 59 104 353 104 99 65 71 34 96 1,112
Malaysia 27 68 50 40 81 56 102 96 38 57 20 35 670
Hong Kong 122 79 42 28 40 61 87 91 40 39 12 23 664
Taiwan, Province of China 19 8 5 73 35 20 68 167 42 20 15 5 477
Sri Lanka 60 14 29 33 19 27 50 47 44 22 31 28 404
Thailand 4 23 13 26 19 16 124 37 13 49 10 10 344
Pakistan 32 18 13 37 15 31 27 37 15 19 22 18 284
Philippines 13 5 8 10 18 9 35 34 22 21 13 27 215
Korea, Demo-cratic People's Republic of 10 5 - 1 14 2 3 4 4 9 15 21 88
Afghanistan 9 - 5 8 3 3 12 1 12 4 7 3 67
Indonesia 1 5 6 5 6 7 12 6 3 6 3 4 64
Macao 3 2 4 1 3 3 7 2 5 1 5 2 38
Kazakhstan 2 1 1 5 1 8 2 - - 1 3 1 25
Viet Nam 1 - 1 - 2 1 3 2 6 2 4 2 24
Maldives 1 1 4 1 - - 1 - 2 - 2 - 12
Mongolia - - - - - - - - - 11 - - 11
Myanmar 1 - 1 3 2 1 1 - - - 1 - 10
Other Asia 7 1 3 3 2 3 6 2 2 9 6 3 47
Total 2,623 2,012 2,237 1,993 2,366 2,656 3,268 3,463 1,993 3,778 1,005 1,095 28,489
Antarctica - - - - - - - - - - 1 1 2
Not Known 50 25 27 26 6 11 237 199 22 206 11 92 912
Grand Total 189,492 131,057 153,610 216,550 178,252 186,256 219,495 212,759 190,216 195,877 177,898 253,743 2,305,205

Tourism Statistics Annual Report 2017 77
Appendix 12
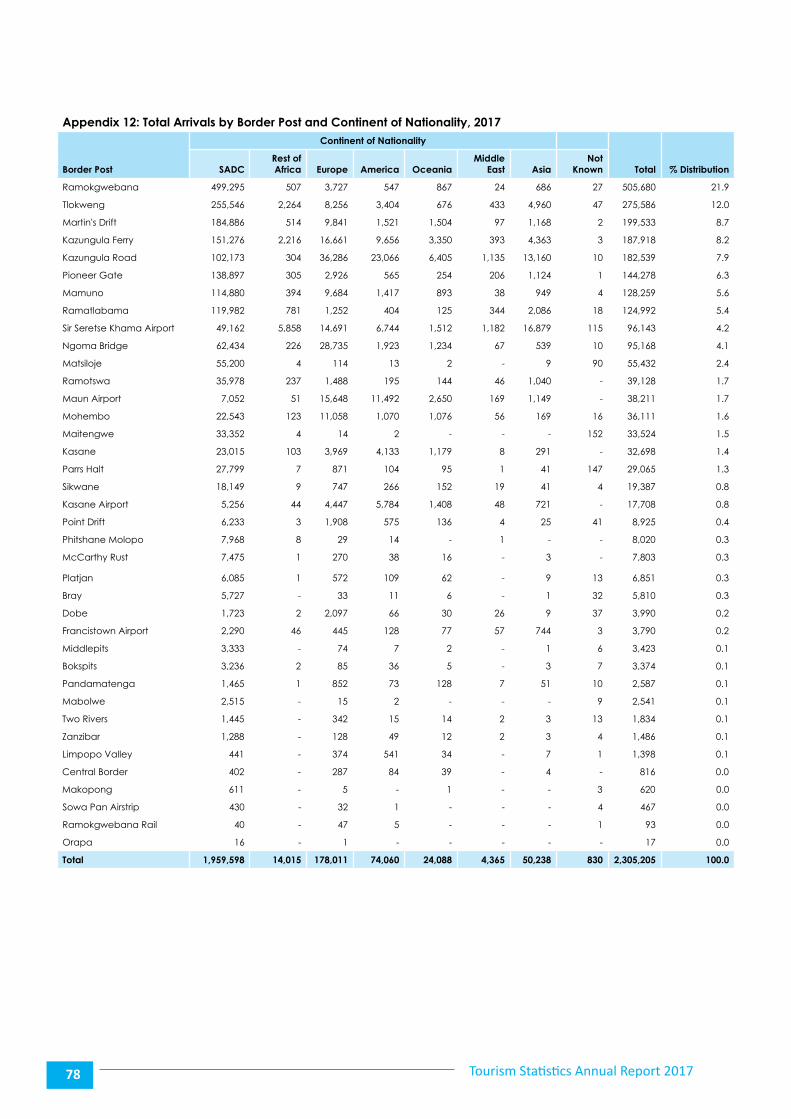
Tourism Statistics Annual Report 201778
Appendix 12: Total Arrivals by Border Post and Continent of Nationality, 2017
Border Post
Continent of Nationality
Total % DistributionSADCRest of Africa Europe America Oceania
Middle East Asia
Not Known
Ramokgwebana 499,295 507 3,727 547 867 24 686 27 505,680 21.9
Tlokweng 255,546 2,264 8,256 3,404 676 433 4,960 47 275,586 12.0
Martin's Drift 184,886 514 9,841 1,521 1,504 97 1,168 2 199,533 8.7
Kazungula Ferry 151,276 2,216 16,661 9,656 3,350 393 4,363 3 187,918 8.2
Kazungula Road 102,173 304 36,286 23,066 6,405 1,135 13,160 10 182,539 7.9
Pioneer Gate 138,897 305 2,926 565 254 206 1,124 1 144,278 6.3
Mamuno 114,880 394 9,684 1,417 893 38 949 4 128,259 5.6
Ramatlabama 119,982 781 1,252 404 125 344 2,086 18 124,992 5.4
Sir Seretse Khama Airport 49,162 5,858 14,691 6,744 1,512 1,182 16,879 115 96,143 4.2
Ngoma Bridge 62,434 226 28,735 1,923 1,234 67 539 10 95,168 4.1
Matsiloje 55,200 4 114 13 2 - 9 90 55,432 2.4
Ramotswa 35,978 237 1,488 195 144 46 1,040 - 39,128 1.7
Maun Airport 7,052 51 15,648 11,492 2,650 169 1,149 - 38,211 1.7
Mohembo 22,543 123 11,058 1,070 1,076 56 169 16 36,111 1.6
Maitengwe 33,352 4 14 2 - - - 152 33,524 1.5
Kasane 23,015 103 3,969 4,133 1,179 8 291 - 32,698 1.4
Parrs Halt 27,799 7 871 104 95 1 41 147 29,065 1.3
Sikwane 18,149 9 747 266 152 19 41 4 19,387 0.8
Kasane Airport 5,256 44 4,447 5,784 1,408 48 721 - 17,708 0.8
Point Drift 6,233 3 1,908 575 136 4 25 41 8,925 0.4
Phitshane Molopo 7,968 8 29 14 - 1 - - 8,020 0.3
McCarthy Rust 7,475 1 270 38 16 - 3 - 7,803 0.3
Platjan 6,085 1 572 109 62 - 9 13 6,851 0.3
Bray 5,727 - 33 11 6 - 1 32 5,810 0.3
Dobe 1,723 2 2,097 66 30 26 9 37 3,990 0.2
Francistown Airport 2,290 46 445 128 77 57 744 3 3,790 0.2
Middlepits 3,333 - 74 7 2 - 1 6 3,423 0.1
Bokspits 3,236 2 85 36 5 - 3 7 3,374 0.1
Pandamatenga 1,465 1 852 73 128 7 51 10 2,587 0.1
Mabolwe 2,515 - 15 2 - - - 9 2,541 0.1
Two Rivers 1,445 - 342 15 14 2 3 13 1,834 0.1
Zanzibar 1,288 - 128 49 12 2 3 4 1,486 0.1
Limpopo Valley 441 - 374 541 34 - 7 1 1,398 0.1
Central Border 402 - 287 84 39 - 4 - 816 0.0
Makopong 611 - 5 - 1 - - 3 620 0.0
Sowa Pan Airstrip 430 - 32 1 - - - 4 467 0.0
Ramokgwebana Rail 40 - 47 5 - - - 1 93 0.0
Orapa 16 - 1 - - - - - 17 0.0
Total 1,959,598 14,015 178,011 74,060 24,088 4,365 50,238 830 2,305,205 100.0

Appendix 13
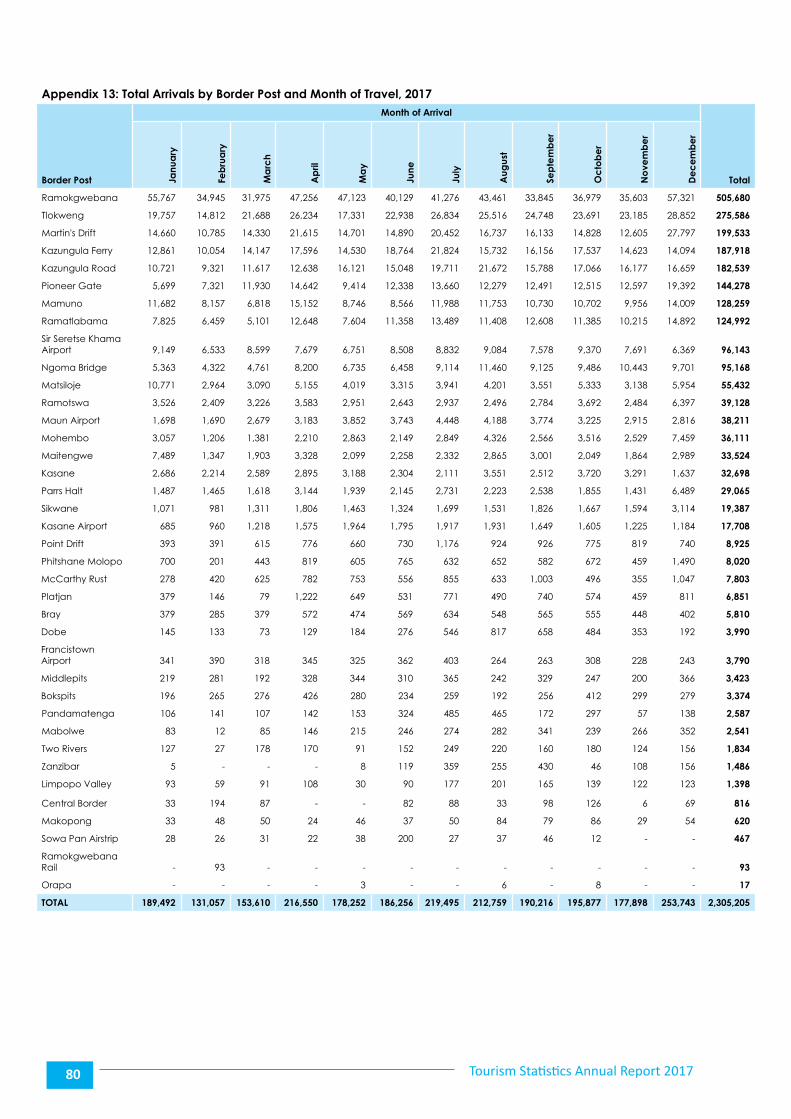
Tourism Statistics Annual Report 201780
Appendix 13: Total Arrivals by Border Post and Month of Travel, 2017
Border Post
Month of Arrival
TotalJanu
ary
Feb
rua
ry
Ma
rch
Ap
ril
Ma
y
June
July
Aug
ust
Sep
tem
be
r
Oc
tob
er
No
vem
be
r
De
ce
mb
er
Ramokgwebana 55,767 34,945 31,975 47,256 47,123 40,129 41,276 43,461 33,845 36,979 35,603 57,321 505,680
Tlokweng 19,757 14,812 21,688 26,234 17,331 22,938 26,834 25,516 24,748 23,691 23,185 28,852 275,586
Martin's Drift 14,660 10,785 14,330 21,615 14,701 14,890 20,452 16,737 16,133 14,828 12,605 27,797 199,533
Kazungula Ferry 12,861 10,054 14,147 17,596 14,530 18,764 21,824 15,732 16,156 17,537 14,623 14,094 187,918
Kazungula Road 10,721 9,321 11,617 12,638 16,121 15,048 19,711 21,672 15,788 17,066 16,177 16,659 182,539
Pioneer Gate 5,699 7,321 11,930 14,642 9,414 12,338 13,660 12,279 12,491 12,515 12,597 19,392 144,278
Mamuno 11,682 8,157 6,818 15,152 8,746 8,566 11,988 11,753 10,730 10,702 9,956 14,009 128,259
Ramatlabama 7,825 6,459 5,101 12,648 7,604 11,358 13,489 11,408 12,608 11,385 10,215 14,892 124,992
Sir Seretse Khama Airport 9,149 6,533 8,599 7,679 6,751 8,508 8,832 9,084 7,578 9,370 7,691 6,369 96,143
Ngoma Bridge 5,363 4,322 4,761 8,200 6,735 6,458 9,114 11,460 9,125 9,486 10,443 9,701 95,168
Matsiloje 10,771 2,964 3,090 5,155 4,019 3,315 3,941 4,201 3,551 5,333 3,138 5,954 55,432
Ramotswa 3,526 2,409 3,226 3,583 2,951 2,643 2,937 2,496 2,784 3,692 2,484 6,397 39,128
Maun Airport 1,698 1,690 2,679 3,183 3,852 3,743 4,448 4,188 3,774 3,225 2,915 2,816 38,211
Mohembo 3,057 1,206 1,381 2,210 2,863 2,149 2,849 4,326 2,566 3,516 2,529 7,459 36,111
Maitengwe 7,489 1,347 1,903 3,328 2,099 2,258 2,332 2,865 3,001 2,049 1,864 2,989 33,524
Kasane 2,686 2,214 2,589 2,895 3,188 2,304 2,111 3,551 2,512 3,720 3,291 1,637 32,698
Parrs Halt 1,487 1,465 1,618 3,144 1,939 2,145 2,731 2,223 2,538 1,855 1,431 6,489 29,065
Sikwane 1,071 981 1,311 1,806 1,463 1,324 1,699 1,531 1,826 1,667 1,594 3,114 19,387
Kasane Airport 685 960 1,218 1,575 1,964 1,795 1,917 1,931 1,649 1,605 1,225 1,184 17,708
Point Drift 393 391 615 776 660 730 1,176 924 926 775 819 740 8,925
Phitshane Molopo 700 201 443 819 605 765 632 652 582 672 459 1,490 8,020
McCarthy Rust 278 420 625 782 753 556 855 633 1,003 496 355 1,047 7,803
Platjan 379 146 79 1,222 649 531 771 490 740 574 459 811 6,851
Bray 379 285 379 572 474 569 634 548 565 555 448 402 5,810
Dobe 145 133 73 129 184 276 546 817 658 484 353 192 3,990
Francistown Airport 341 390 318 345 325 362 403 264 263 308 228 243 3,790
Middlepits 219 281 192 328 344 310 365 242 329 247 200 366 3,423
Bokspits 196 265 276 426 280 234 259 192 256 412 299 279 3,374
Pandamatenga 106 141 107 142 153 324 485 465 172 297 57 138 2,587
Mabolwe 83 12 85 146 215 246 274 282 341 239 266 352 2,541
Two Rivers 127 27 178 170 91 152 249 220 160 180 124 156 1,834
Zanzibar 5 - - - 8 119 359 255 430 46 108 156 1,486
Limpopo Valley 93 59 91 108 30 90 177 201 165 139 122 123 1,398
Central Border 33 194 87 - - 82 88 33 98 126 6 69 816
Makopong 33 48 50 24 46 37 50 84 79 86 29 54 620
Sowa Pan Airstrip 28 26 31 22 38 200 27 37 46 12 - - 467
Ramokgwebana Rail - 93 - - - - - - - - - - 93
Orapa - - - - 3 - - 6 - 8 - - 17
TOTAL 189,492 131,057 153,610 216,550 178,252 186,256 219,495 212,759 190,216 195,877 177,898 253,743 2,305,205

Appendix 14
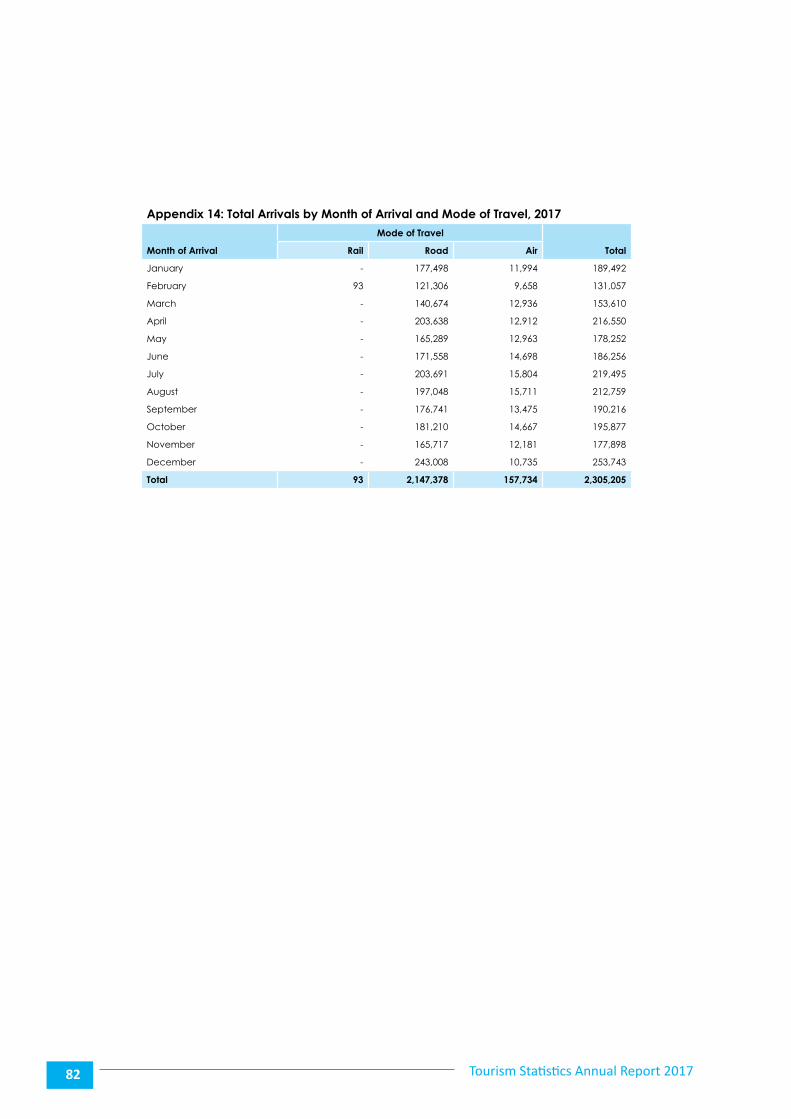
Tourism Statistics Annual Report 201782
Appendix 14: Total Arrivals by Month of Arrival and Mode of Travel, 2017
Month of Arrival
Mode of Travel
TotalRail Road Air
January - 177,498 11,994 189,492
February 93 121,306 9,658 131,057
March - 140,674 12,936 153,610
April - 203,638 12,912 216,550
May - 165,289 12,963 178,252
June - 171,558 14,698 186,256
July - 203,691 15,804 219,495
August - 197,048 15,711 212,759
September - 176,741 13,475 190,216
October - 181,210 14,667 195,877
November - 165,717 12,181 177,898
December - 243,008 10,735 253,743
Total 93 2,147,378 157,734 2,305,205

Appendix 15
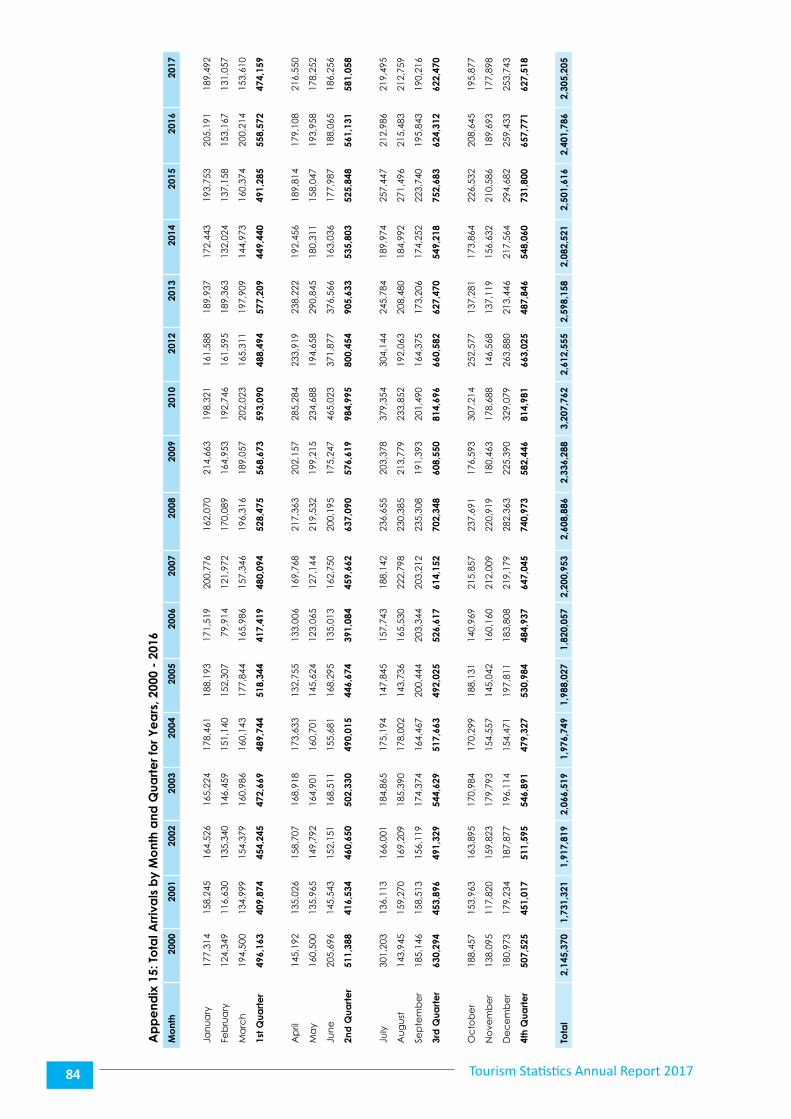
Tourism Statistics Annual Report 201784
Ap
pe
ndix
15:
To
tal A
rriv
als
by
Mo
nth
and
Qua
rte
r fo
r Ye
ars
, 200
0 -
2016
Mo
nth
2000
2001
2002
2003
2004
2005
2006
2007
2008
2009
2010
2012
2013
2014
2015
2016
2017
Janu
ary
177
,314
1
58,2
45
164
,526
1
65,2
24
178
,461
1
88,1
93
171
,519
2
00,7
76
162
,070
2
14,6
63
198
,321
1
61,5
88
189
,937
1
72,4
43
193
,753
2
05,1
91
189
,492
Febr
uary
124
,349
1
16,6
30
135
,340
1
46,4
59
151
,140
1
52,3
07
79,
914
121
,972
1
70,0
89
164
,953
1
92,7
46
161
,595
1
89,3
63
132
,024
1
37,1
58
153
,167
1
31,0
57
Mar
ch 1
94,5
00
134
,999
1
54,3
79
160
,986
1
60,1
43
177
,844
1
65,9
86
157
,346
1
96,3
16
189
,057
2
02,0
23
165
,311
1
97,9
09
144
,973
1
60,3
74
200
,214
1
53,6
10
1st Q
uart
er
496
,163
4
09,8
74
454
,245
4
72,6
69
489
,744
5
18,3
44
417
,419
4
80,0
94
528
,475
5
68,6
73
593
,090
4
88,4
94
577
,209
4
49,4
40
491
,285
5
58,5
72
474
,159
Apr
il 1
45,1
92
135
,026
1
58,7
07
168
,918
1
73,6
33
132
,755
1
33,0
06
169
,768
2
17,3
63
202
,157
2
85,2
84
233
,919
2
38,2
22
192
,456
1
89,8
14
179
,108
2
16,5
50
May
160
,500
1
35,9
65
149
,792
1
64,9
01
160
,701
1
45,6
24
123
,065
1
27,1
44
219
,532
1
99,2
15
234
,688
1
94,6
58
290
,845
1
80,3
11
158
,047
1
93,9
58
178
,252
June
205
,696
1
45,5
43
152
,151
1
68,5
11
155
,681
1
68,2
95
135
,013
1
62,7
50
200
,195
1
75,2
47
465
,023
3
71,8
77
376
,566
1
63,0
36
177
,987
1
88,0
65
186
,256
2nd
Qua
rte
r 5
11,3
88
416
,534
4
60,6
50
502
,330
4
90,0
15
446
,674
3
91,0
84
459
,662
6
37,0
90
576
,619
9
84,9
95
800
,454
9
05,6
33
535
,803
5
25,8
48
561
,131
5
81,0
58
July
301
,203
1
36,1
13
166
,001
1
84,8
65
175
,194
1
47,8
45
157
,743
1
88,1
42
236
,655
2
03,3
78
379
,354
3
04,1
44
245
,784
1
89,9
74
257
,447
2
12,9
86
219
,495
Aug
ust
143
,945
1
59,2
70
169
,209
1
85,3
90
178
,002
1
43,7
36
165
,530
2
22,7
98
230
,385
2
13,7
79
233
,852
1
92,0
63
208
,480
1
84,9
92
271
,496
2
15,4
83
212
,759
Sept
embe
r 1
85,1
46
158
,513
1
56,1
19
174
,374
1
64,4
67
200
,444
2
03,3
44
203
,212
2
35,3
08
191
,393
2
01,4
90
164
,375
1
73,2
06
174
,252
2
23,7
40
195
,843
1
90,2
16
3rd
Qua
rte
r 6
30,2
94
453
,896
4
91,3
29
544
,629
5
17,6
63
492
,025
5
26,6
17
614
,152
7
02,3
48
608
,550
8
14,6
96
660
,582
6
27,4
70
549
,218
7
52,6
83
624
,312
6
22,4
70
Oct
ober
188
,457
1
53,9
63
163
,895
1
70,9
84
170
,299
1
88,1
31
140
,969
2
15,8
57
237
,691
1
76,5
93
307
,214
2
52,5
77
137
,281
1
73,8
64
226
,532
2
08,6
45
195
,877
Nov
embe
r 1
38,0
95
117
,820
1
59,8
23
179
,793
1
54,5
57
145
,042
1
60,1
60
212
,009
2
20,9
19
180
,463
1
78,6
88
146
,568
1
37,1
19
156
,632
2
10,5
86
189
,693
1
77,8
98
Dec
embe
r 1
80,9
73
179
,234
1
87,8
77
196
,114
1
54,4
71
197
,811
1
83,8
08
219
,179
2
82,3
63
225
,390
3
29,0
79
263
,880
2
13,4
46
217
,564
2
94,6
82
259
,433
2
53,7
43
4th
Qua
rte
r 5
07,5
25
451
,017
5
11,5
95
546
,891
4
79,3
27
530
,984
4
84,9
37
647
,045
7
40,9
73
582
,446
8
14,9
81
663
,025
4
87,8
46
548
,060
7
31,8
00
657
,771
6
27,5
18
Tota
l2,
145,
370
1,73
1,32
1 1
,917
,819
2,
066,
519
1,9
76,7
49
1,98
8,02
7 1
,820
,057
2,
200,
953
2,6
08,8
86
2,3
36,2
88
3,20
7,76
2 2,
612,
555
2,59
8,15
8 2
,082
,521
2
,501
,616
2
,401
,786
2
,305
,205

Appendix 16
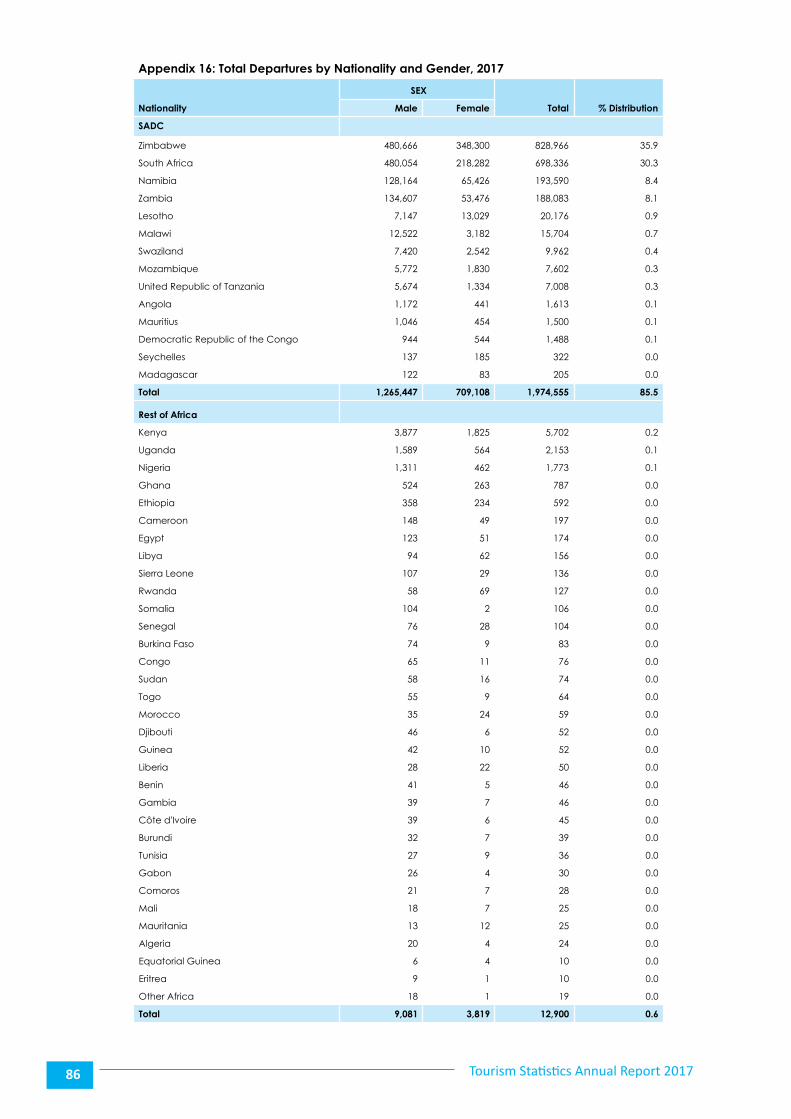
Tourism Statistics Annual Report 201786
Appendix 16: Total Departures by Nationality and Gender, 2017
Nationality
SEX
Total % Distribution Male Female
SADC
Zimbabwe 480,666 348,300 828,966 35.9
South Africa 480,054 218,282 698,336 30.3
Namibia 128,164 65,426 193,590 8.4
Zambia 134,607 53,476 188,083 8.1
Lesotho 7,147 13,029 20,176 0.9
Malawi 12,522 3,182 15,704 0.7
Swaziland 7,420 2,542 9,962 0.4
Mozambique 5,772 1,830 7,602 0.3
United Republic of Tanzania 5,674 1,334 7,008 0.3
Angola 1,172 441 1,613 0.1
Mauritius 1,046 454 1,500 0.1
Democratic Republic of the Congo 944 544 1,488 0.1
Seychelles 137 185 322 0.0
Madagascar 122 83 205 0.0
Total 1,265,447 709,108 1,974,555 85.5
Rest of Africa
Kenya 3,877 1,825 5,702 0.2
Uganda 1,589 564 2,153 0.1
Nigeria 1,311 462 1,773 0.1
Ghana 524 263 787 0.0
Ethiopia 358 234 592 0.0
Cameroon 148 49 197 0.0
Egypt 123 51 174 0.0
Libya 94 62 156 0.0
Sierra Leone 107 29 136 0.0
Rwanda 58 69 127 0.0
Somalia 104 2 106 0.0
Senegal 76 28 104 0.0
Burkina Faso 74 9 83 0.0
Congo 65 11 76 0.0
Sudan 58 16 74 0.0
Togo 55 9 64 0.0
Morocco 35 24 59 0.0
Djibouti 46 6 52 0.0
Guinea 42 10 52 0.0
Liberia 28 22 50 0.0
Benin 41 5 46 0.0
Gambia 39 7 46 0.0
Côte d'Ivoire 39 6 45 0.0
Burundi 32 7 39 0.0
Tunisia 27 9 36 0.0
Gabon 26 4 30 0.0
Comoros 21 7 28 0.0
Mali 18 7 25 0.0
Mauritania 13 12 25 0.0
Algeria 20 4 24 0.0
Equatorial Guinea 6 4 10 0.0
Eritrea 9 1 10 0.0
Other Africa 18 1 19 0.0
Total 9,081 3,819 12,900 0.6
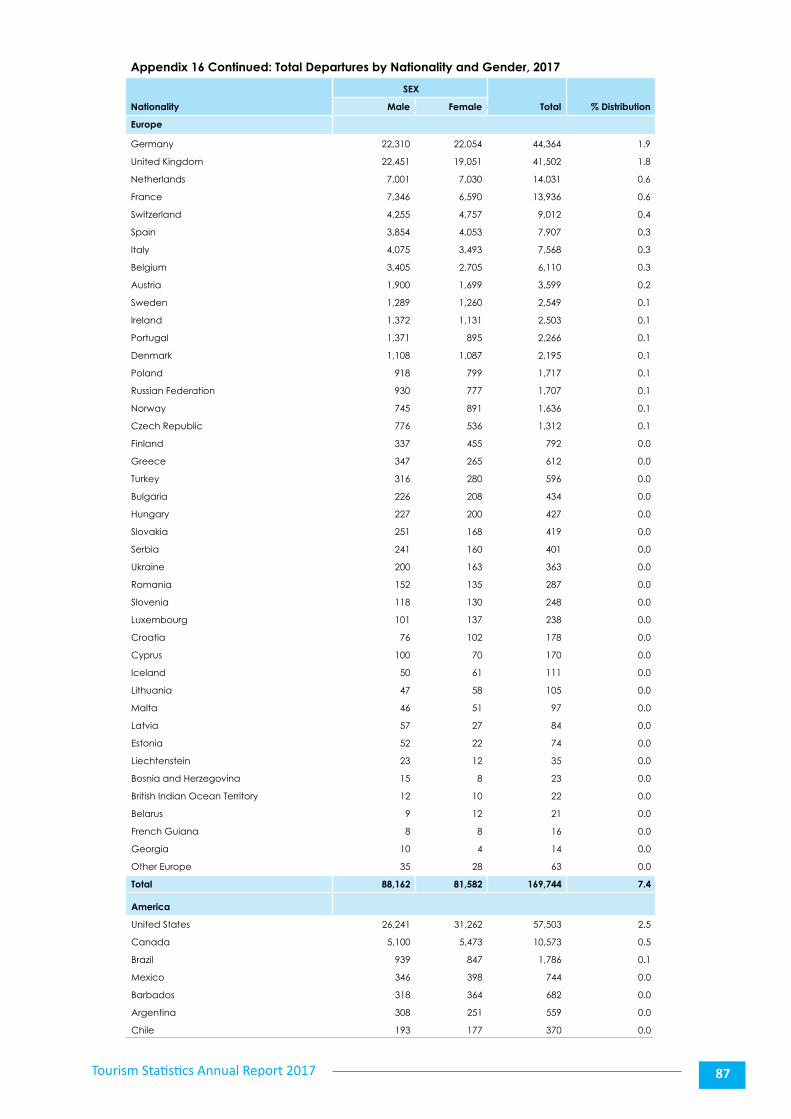
Tourism Statistics Annual Report 2017 87
Appendix 16 Continued: Total Departures by Nationality and Gender, 2017
Nationality
SEX
Total % Distribution Male Female
Europe
Germany 22,310 22,054 44,364 1.9
United Kingdom 22,451 19,051 41,502 1.8
Netherlands 7,001 7,030 14,031 0.6
France 7,346 6,590 13,936 0.6
Switzerland 4,255 4,757 9,012 0.4
Spain 3,854 4,053 7,907 0.3
Italy 4,075 3,493 7,568 0.3
Belgium 3,405 2,705 6,110 0.3
Austria 1,900 1,699 3,599 0.2
Sweden 1,289 1,260 2,549 0.1
Ireland 1,372 1,131 2,503 0.1
Portugal 1,371 895 2,266 0.1
Denmark 1,108 1,087 2,195 0.1
Poland 918 799 1,717 0.1
Russian Federation 930 777 1,707 0.1
Norway 745 891 1,636 0.1
Czech Republic 776 536 1,312 0.1
Finland 337 455 792 0.0
Greece 347 265 612 0.0
Turkey 316 280 596 0.0
Bulgaria 226 208 434 0.0
Hungary 227 200 427 0.0
Slovakia 251 168 419 0.0
Serbia 241 160 401 0.0
Ukraine 200 163 363 0.0
Romania 152 135 287 0.0
Slovenia 118 130 248 0.0
Luxembourg 101 137 238 0.0
Croatia 76 102 178 0.0
Cyprus 100 70 170 0.0
Iceland 50 61 111 0.0
Lithuania 47 58 105 0.0
Malta 46 51 97 0.0
Latvia 57 27 84 0.0
Estonia 52 22 74 0.0
Liechtenstein 23 12 35 0.0
Bosnia and Herzegovina 15 8 23 0.0
British Indian Ocean Territory 12 10 22 0.0
Belarus 9 12 21 0.0
French Guiana 8 8 16 0.0
Georgia 10 4 14 0.0
Other Europe 35 28 63 0.0
Total 88,162 81,582 169,744 7.4
America
United States 26,241 31,262 57,503 2.5
Canada 5,100 5,473 10,573 0.5
Brazil 939 847 1,786 0.1
Mexico 346 398 744 0.0
Barbados 318 364 682 0.0
Argentina 308 251 559 0.0
Chile 193 177 370 0.0
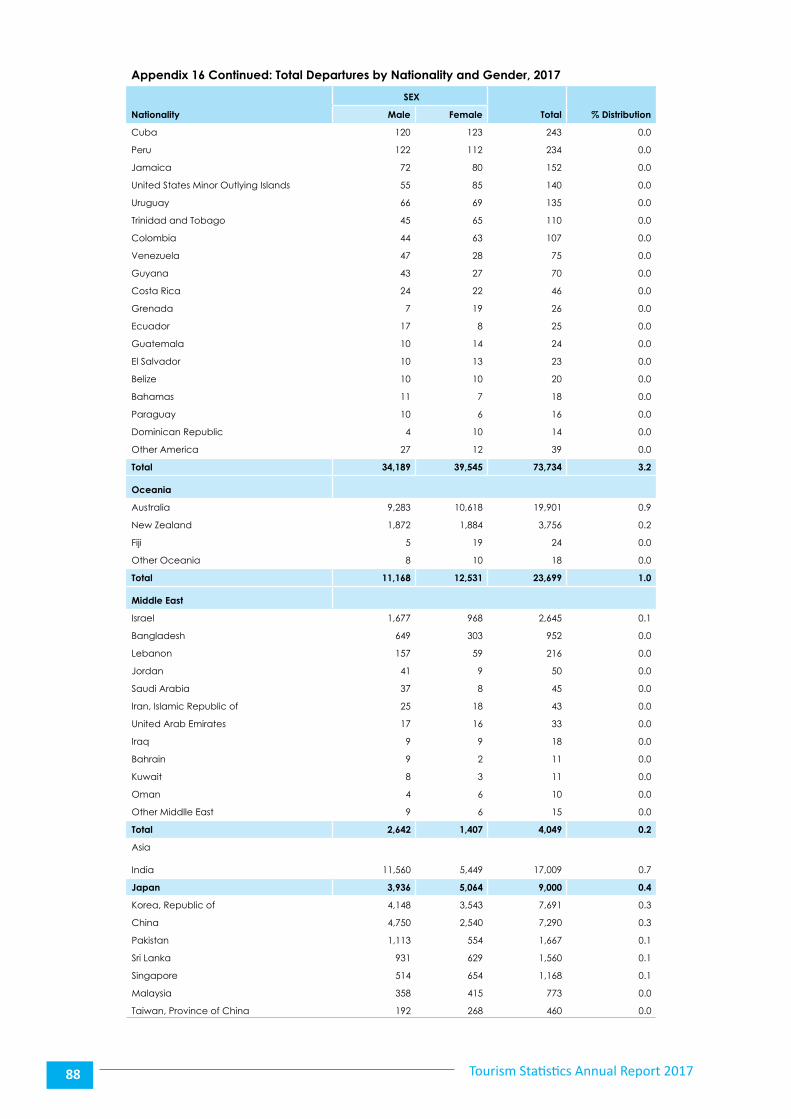
Tourism Statistics Annual Report 201788
Appendix 16 Continued: Total Departures by Nationality and Gender, 2017
Nationality
SEX
Total % Distribution Male Female
Cuba 120 123 243 0.0
Peru 122 112 234 0.0
Jamaica 72 80 152 0.0
United States Minor Outlying Islands 55 85 140 0.0
Uruguay 66 69 135 0.0
Trinidad and Tobago 45 65 110 0.0
Colombia 44 63 107 0.0
Venezuela 47 28 75 0.0
Guyana 43 27 70 0.0
Costa Rica 24 22 46 0.0
Grenada 7 19 26 0.0
Ecuador 17 8 25 0.0
Guatemala 10 14 24 0.0
El Salvador 10 13 23 0.0
Belize 10 10 20 0.0
Bahamas 11 7 18 0.0
Paraguay 10 6 16 0.0
Dominican Republic 4 10 14 0.0
Other America 27 12 39 0.0
Total 34,189 39,545 73,734 3.2
Oceania
Australia 9,283 10,618 19,901 0.9
New Zealand 1,872 1,884 3,756 0.2
Fiji 5 19 24 0.0
Other Oceania 8 10 18 0.0
Total 11,168 12,531 23,699 1.0
Middle East
Israel 1,677 968 2,645 0.1
Bangladesh 649 303 952 0.0
Lebanon 157 59 216 0.0
Jordan 41 9 50 0.0
Saudi Arabia 37 8 45 0.0
Iran, Islamic Republic of 25 18 43 0.0
United Arab Emirates 17 16 33 0.0
Iraq 9 9 18 0.0
Bahrain 9 2 11 0.0
Kuwait 8 3 11 0.0
Oman 4 6 10 0.0
Other Middlle East 9 6 15 0.0
Total 2,642 1,407 4,049 0.2
Asia
India 11,560 5,449 17,009 0.7
Japan 3,936 5,064 9,000 0.4
Korea, Republic of 4,148 3,543 7,691 0.3
China 4,750 2,540 7,290 0.3
Pakistan 1,113 554 1,667 0.1
Sri Lanka 931 629 1,560 0.1
Singapore 514 654 1,168 0.1
Malaysia 358 415 773 0.0
Taiwan, Province of China 192 268 460 0.0
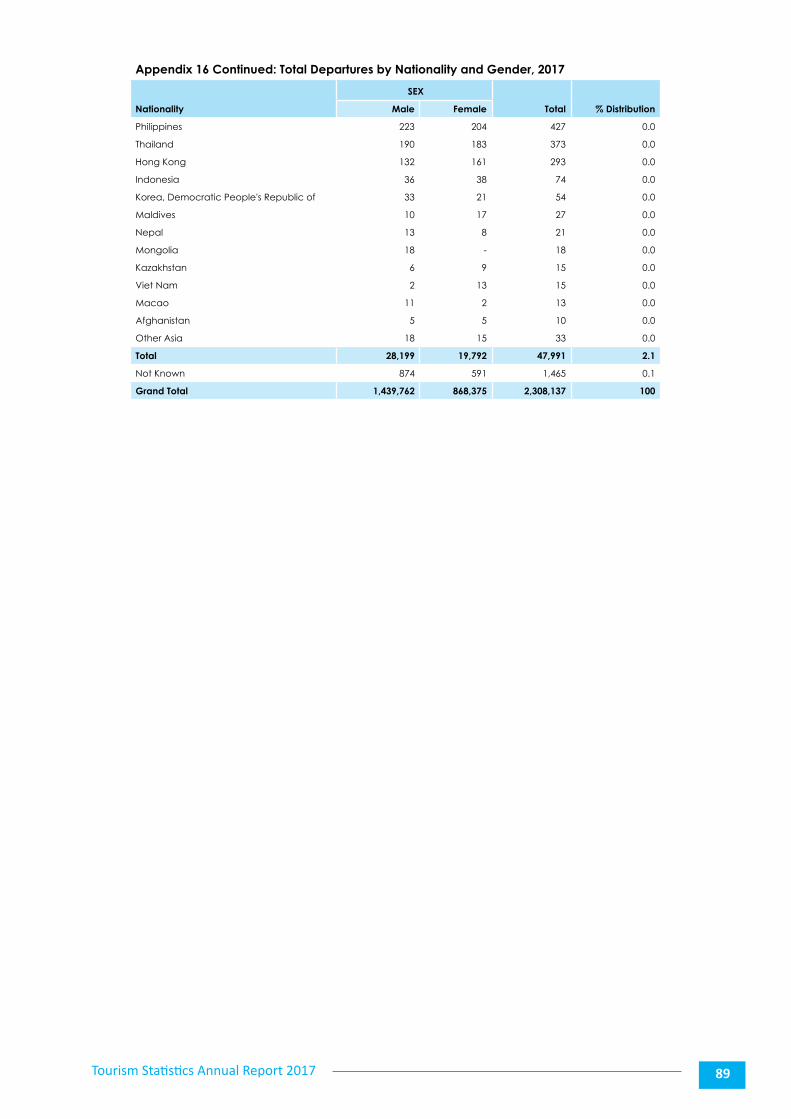
Tourism Statistics Annual Report 2017 89
Appendix 16 Continued: Total Departures by Nationality and Gender, 2017
Nationality
SEX
Total % Distribution Male Female
Philippines 223 204 427 0.0
Thailand 190 183 373 0.0
Hong Kong 132 161 293 0.0
Indonesia 36 38 74 0.0
Korea, Democratic People's Republic of 33 21 54 0.0
Maldives 10 17 27 0.0
Nepal 13 8 21 0.0
Mongolia 18 - 18 0.0
Kazakhstan 6 9 15 0.0
Viet Nam 2 13 15 0.0
Macao 11 2 13 0.0
Afghanistan 5 5 10 0.0
Other Asia 18 15 33 0.0
Total 28,199 19,792 47,991 2.1
Not Known 874 591 1,465 0.1
Grand Total 1,439,762 868,375 2,308,137 100

Appendix 17
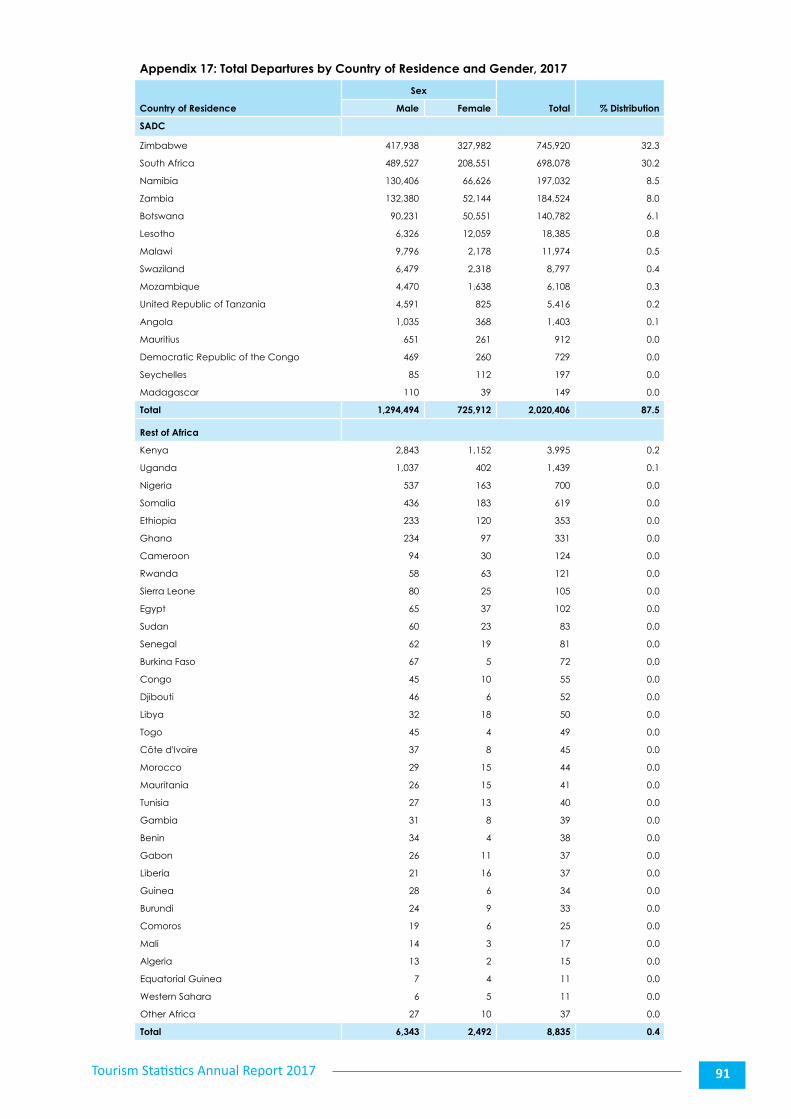
Tourism Statistics Annual Report 2017 91
Appendix 17: Total Departures by Country of Residence and Gender, 2017
Country of Residence
Sex
Total % DistributionMale Female
SADC
Zimbabwe 417,938 327,982 745,920 32.3
South Africa 489,527 208,551 698,078 30.2
Namibia 130,406 66,626 197,032 8.5
Zambia 132,380 52,144 184,524 8.0
Botswana 90,231 50,551 140,782 6.1
Lesotho 6,326 12,059 18,385 0.8
Malawi 9,796 2,178 11,974 0.5
Swaziland 6,479 2,318 8,797 0.4
Mozambique 4,470 1,638 6,108 0.3
United Republic of Tanzania 4,591 825 5,416 0.2
Angola 1,035 368 1,403 0.1
Mauritius 651 261 912 0.0
Democratic Republic of the Congo 469 260 729 0.0
Seychelles 85 112 197 0.0
Madagascar 110 39 149 0.0
Total 1,294,494 725,912 2,020,406 87.5
Rest of Africa
Kenya 2,843 1,152 3,995 0.2
Uganda 1,037 402 1,439 0.1
Nigeria 537 163 700 0.0
Somalia 436 183 619 0.0
Ethiopia 233 120 353 0.0
Ghana 234 97 331 0.0
Cameroon 94 30 124 0.0
Rwanda 58 63 121 0.0
Sierra Leone 80 25 105 0.0
Egypt 65 37 102 0.0
Sudan 60 23 83 0.0
Senegal 62 19 81 0.0
Burkina Faso 67 5 72 0.0
Congo 45 10 55 0.0
Djibouti 46 6 52 0.0
Libya 32 18 50 0.0
Togo 45 4 49 0.0
Côte d'Ivoire 37 8 45 0.0
Morocco 29 15 44 0.0
Mauritania 26 15 41 0.0
Tunisia 27 13 40 0.0
Gambia 31 8 39 0.0
Benin 34 4 38 0.0
Gabon 26 11 37 0.0
Liberia 21 16 37 0.0
Guinea 28 6 34 0.0
Burundi 24 9 33 0.0
Comoros 19 6 25 0.0
Mali 14 3 17 0.0
Algeria 13 2 15 0.0
Equatorial Guinea 7 4 11 0.0
Western Sahara 6 5 11 0.0
Other Africa 27 10 37 0.0
Total 6,343 2,492 8,835 0.4
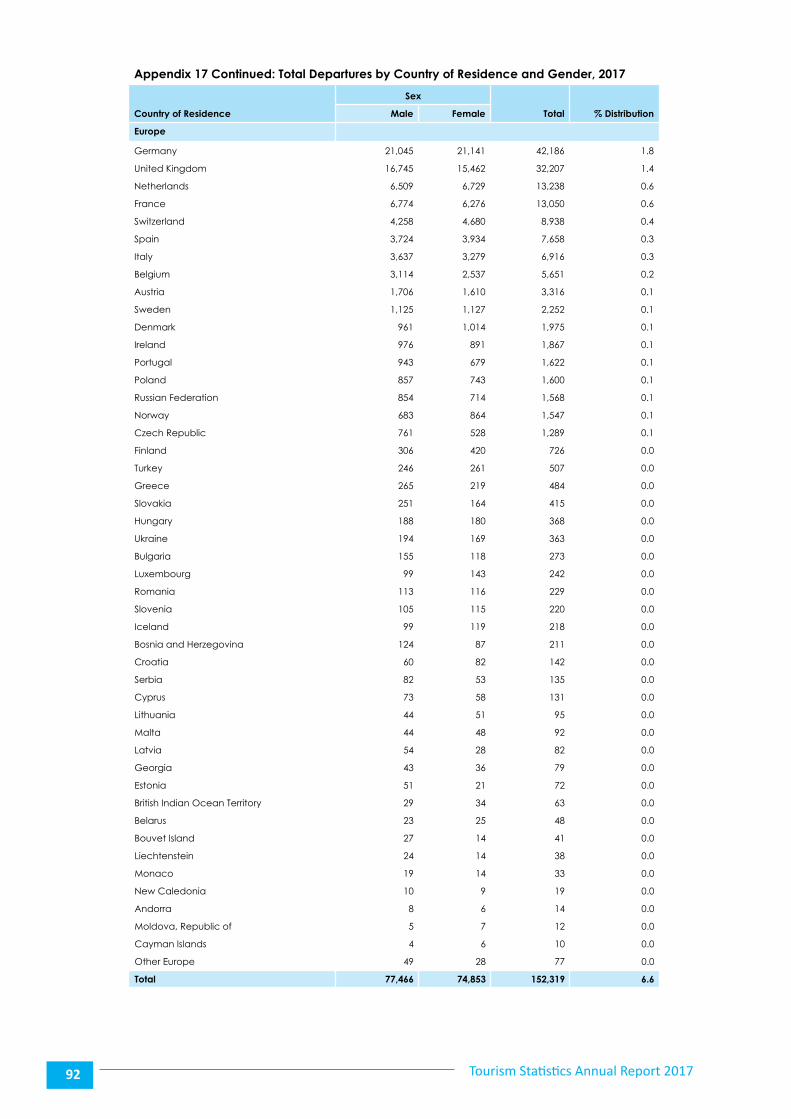
Tourism Statistics Annual Report 201792
Appendix 17 Continued: Total Departures by Country of Residence and Gender, 2017
Country of Residence
Sex
Total % DistributionMale Female
Europe
Germany 21,045 21,141 42,186 1.8
United Kingdom 16,745 15,462 32,207 1.4
Netherlands 6,509 6,729 13,238 0.6
France 6,774 6,276 13,050 0.6
Switzerland 4,258 4,680 8,938 0.4
Spain 3,724 3,934 7,658 0.3
Italy 3,637 3,279 6,916 0.3
Belgium 3,114 2,537 5,651 0.2
Austria 1,706 1,610 3,316 0.1
Sweden 1,125 1,127 2,252 0.1
Denmark 961 1,014 1,975 0.1
Ireland 976 891 1,867 0.1
Portugal 943 679 1,622 0.1
Poland 857 743 1,600 0.1
Russian Federation 854 714 1,568 0.1
Norway 683 864 1,547 0.1
Czech Republic 761 528 1,289 0.1
Finland 306 420 726 0.0
Turkey 246 261 507 0.0
Greece 265 219 484 0.0
Slovakia 251 164 415 0.0
Hungary 188 180 368 0.0
Ukraine 194 169 363 0.0
Bulgaria 155 118 273 0.0
Luxembourg 99 143 242 0.0
Romania 113 116 229 0.0
Slovenia 105 115 220 0.0
Iceland 99 119 218 0.0
Bosnia and Herzegovina 124 87 211 0.0
Croatia 60 82 142 0.0
Serbia 82 53 135 0.0
Cyprus 73 58 131 0.0
Lithuania 44 51 95 0.0
Malta 44 48 92 0.0
Latvia 54 28 82 0.0
Georgia 43 36 79 0.0
Estonia 51 21 72 0.0
British Indian Ocean Territory 29 34 63 0.0
Belarus 23 25 48 0.0
Bouvet Island 27 14 41 0.0
Liechtenstein 24 14 38 0.0
Monaco 19 14 33 0.0
New Caledonia 10 9 19 0.0
Andorra 8 6 14 0.0
Moldova, Republic of 5 7 12 0.0
Cayman Islands 4 6 10 0.0
Other Europe 49 28 77 0.0
Total 77,466 74,853 152,319 6.6
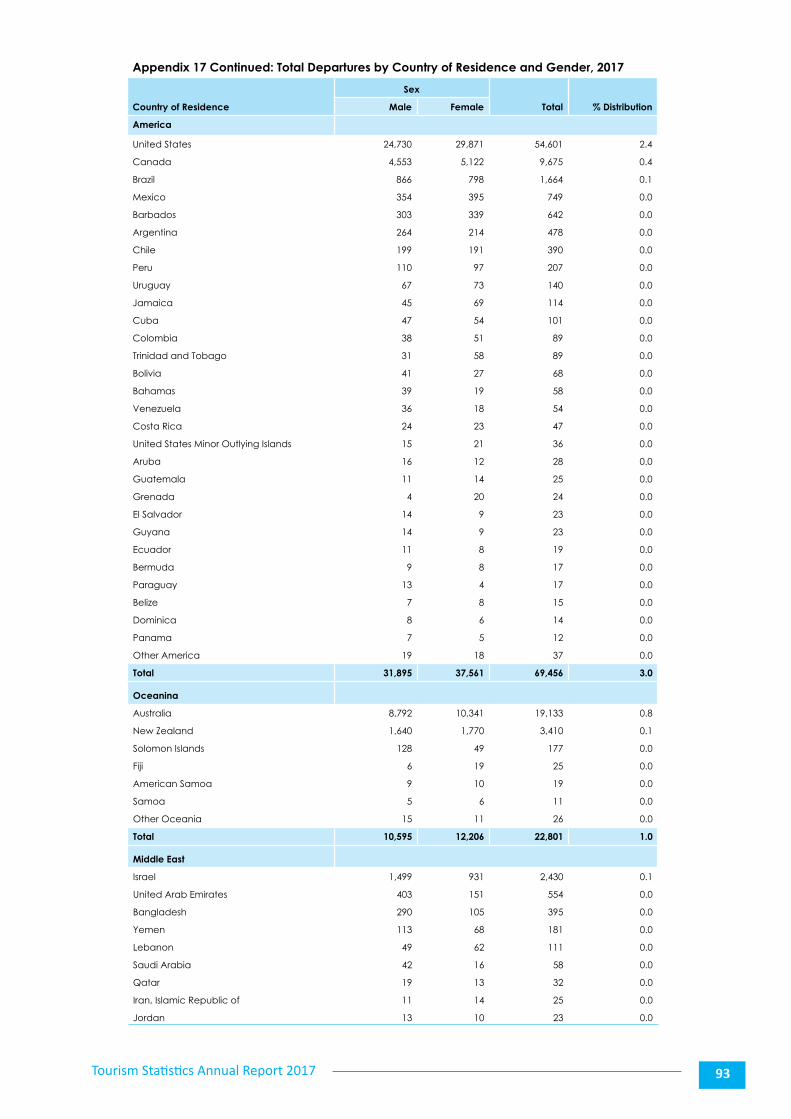
Tourism Statistics Annual Report 2017 93
Appendix 17 Continued: Total Departures by Country of Residence and Gender, 2017
Country of Residence
Sex
Total % DistributionMale Female
America
United States 24,730 29,871 54,601 2.4
Canada 4,553 5,122 9,675 0.4
Brazil 866 798 1,664 0.1
Mexico 354 395 749 0.0
Barbados 303 339 642 0.0
Argentina 264 214 478 0.0
Chile 199 191 390 0.0
Peru 110 97 207 0.0
Uruguay 67 73 140 0.0
Jamaica 45 69 114 0.0
Cuba 47 54 101 0.0
Colombia 38 51 89 0.0
Trinidad and Tobago 31 58 89 0.0
Bolivia 41 27 68 0.0
Bahamas 39 19 58 0.0
Venezuela 36 18 54 0.0
Costa Rica 24 23 47 0.0
United States Minor Outlying Islands 15 21 36 0.0
Aruba 16 12 28 0.0
Guatemala 11 14 25 0.0
Grenada 4 20 24 0.0
El Salvador 14 9 23 0.0
Guyana 14 9 23 0.0
Ecuador 11 8 19 0.0
Bermuda 9 8 17 0.0
Paraguay 13 4 17 0.0
Belize 7 8 15 0.0
Dominica 8 6 14 0.0
Panama 7 5 12 0.0
Other America 19 18 37 0.0
Total 31,895 37,561 69,456 3.0
Oceanina
Australia 8,792 10,341 19,133 0.8
New Zealand 1,640 1,770 3,410 0.1
Solomon Islands 128 49 177 0.0
Fiji 6 19 25 0.0
American Samoa 9 10 19 0.0
Samoa 5 6 11 0.0
Other Oceania 15 11 26 0.0
Total 10,595 12,206 22,801 1.0
Middle East
Israel 1,499 931 2,430 0.1
United Arab Emirates 403 151 554 0.0
Bangladesh 290 105 395 0.0
Yemen 113 68 181 0.0
Lebanon 49 62 111 0.0
Saudi Arabia 42 16 58 0.0
Qatar 19 13 32 0.0
Iran, Islamic Republic of 11 14 25 0.0
Jordan 13 10 23 0.0
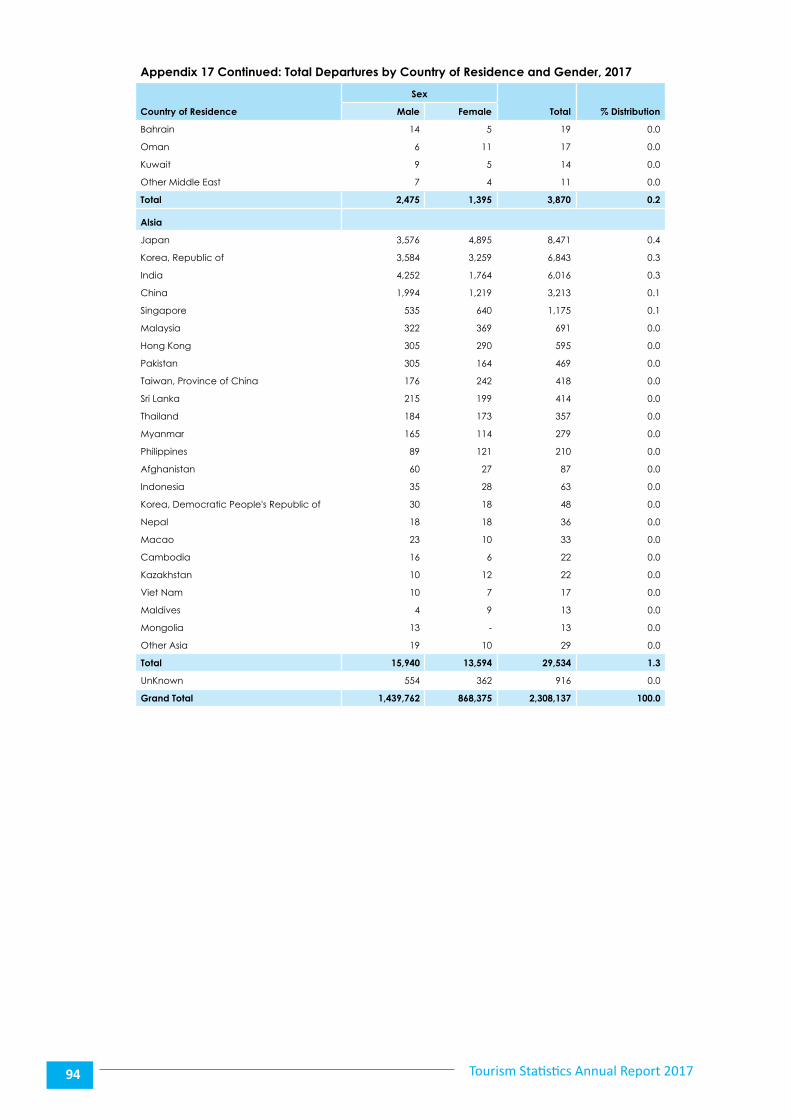
Tourism Statistics Annual Report 201794
Appendix 17 Continued: Total Departures by Country of Residence and Gender, 2017
Country of Residence
Sex
Total % DistributionMale Female
Bahrain 14 5 19 0.0
Oman 6 11 17 0.0
Kuwait 9 5 14 0.0
Other Middle East 7 4 11 0.0
Total 2,475 1,395 3,870 0.2
Alsia
Japan 3,576 4,895 8,471 0.4
Korea, Republic of 3,584 3,259 6,843 0.3
India 4,252 1,764 6,016 0.3
China 1,994 1,219 3,213 0.1
Singapore 535 640 1,175 0.1
Malaysia 322 369 691 0.0
Hong Kong 305 290 595 0.0
Pakistan 305 164 469 0.0
Taiwan, Province of China 176 242 418 0.0
Sri Lanka 215 199 414 0.0
Thailand 184 173 357 0.0
Myanmar 165 114 279 0.0
Philippines 89 121 210 0.0
Afghanistan 60 27 87 0.0
Indonesia 35 28 63 0.0
Korea, Democratic People's Republic of 30 18 48 0.0
Nepal 18 18 36 0.0
Macao 23 10 33 0.0
Cambodia 16 6 22 0.0
Kazakhstan 10 12 22 0.0
Viet Nam 10 7 17 0.0
Maldives 4 9 13 0.0
Mongolia 13 - 13 0.0
Other Asia 19 10 29 0.0
Total 15,940 13,594 29,534 1.3
UnKnown 554 362 916 0.0
Grand Total 1,439,762 868,375 2,308,137 100.0

Appendix 18
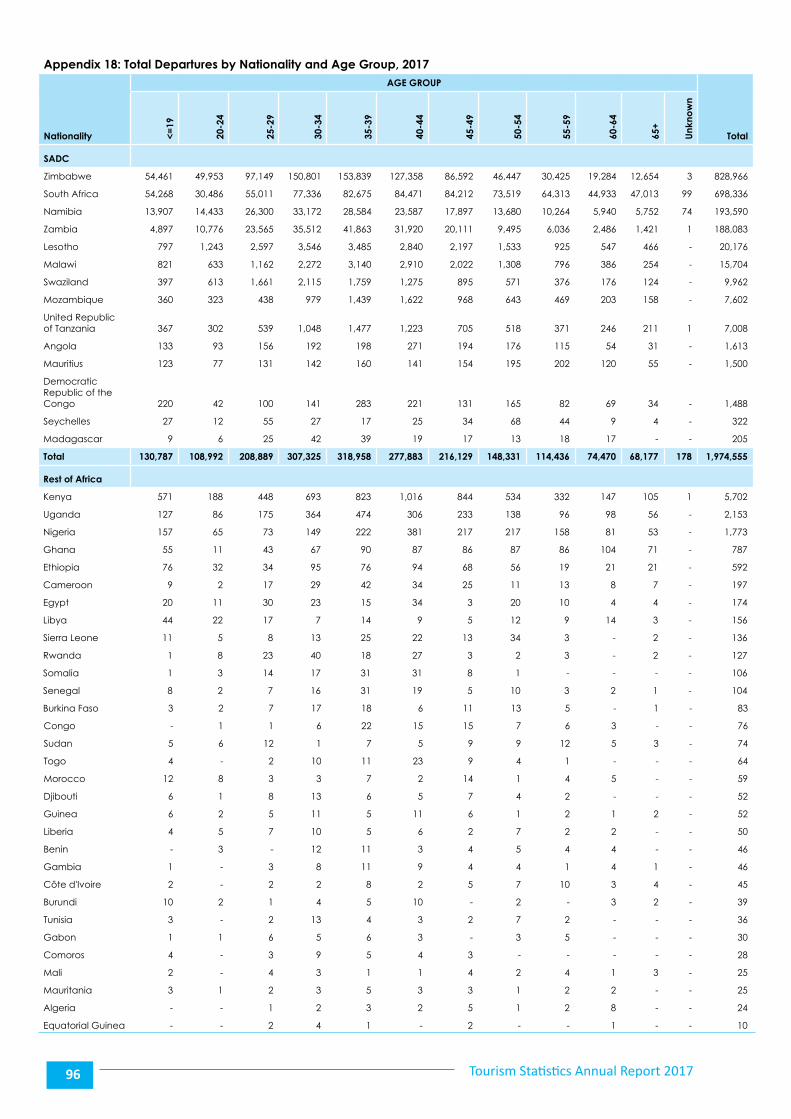
Tourism Statistics Annual Report 201796
Appendix 18: Total Departures by Nationality and Age Group, 2017
Nationality
AGE GROUP
Total<=19
20-2
4
25-2
9
30-3
4
35-3
9
40-4
4
45-4
9
50-5
4
55-5
9
60-6
4
65+
Unk
now
n
SADC
Zimbabwe 54,461 49,953 97,149 150,801 153,839 127,358 86,592 46,447 30,425 19,284 12,654 3 828,966
South Africa 54,268 30,486 55,011 77,336 82,675 84,471 84,212 73,519 64,313 44,933 47,013 99 698,336
Namibia 13,907 14,433 26,300 33,172 28,584 23,587 17,897 13,680 10,264 5,940 5,752 74 193,590
Zambia 4,897 10,776 23,565 35,512 41,863 31,920 20,111 9,495 6,036 2,486 1,421 1 188,083
Lesotho 797 1,243 2,597 3,546 3,485 2,840 2,197 1,533 925 547 466 - 20,176
Malawi 821 633 1,162 2,272 3,140 2,910 2,022 1,308 796 386 254 - 15,704
Swaziland 397 613 1,661 2,115 1,759 1,275 895 571 376 176 124 - 9,962
Mozambique 360 323 438 979 1,439 1,622 968 643 469 203 158 - 7,602
United Republic of Tanzania 367 302 539 1,048 1,477 1,223 705 518 371 246 211 1 7,008
Angola 133 93 156 192 198 271 194 176 115 54 31 - 1,613
Mauritius 123 77 131 142 160 141 154 195 202 120 55 - 1,500
Democratic Republic of the Congo 220 42 100 141 283 221 131 165 82 69 34 - 1,488
Seychelles 27 12 55 27 17 25 34 68 44 9 4 - 322
Madagascar 9 6 25 42 39 19 17 13 18 17 - - 205
Total 130,787 108,992 208,889 307,325 318,958 277,883 216,129 148,331 114,436 74,470 68,177 178 1,974,555
Rest of Africa
Kenya 571 188 448 693 823 1,016 844 534 332 147 105 1 5,702
Uganda 127 86 175 364 474 306 233 138 96 98 56 - 2,153
Nigeria 157 65 73 149 222 381 217 217 158 81 53 - 1,773
Ghana 55 11 43 67 90 87 86 87 86 104 71 - 787
Ethiopia 76 32 34 95 76 94 68 56 19 21 21 - 592
Cameroon 9 2 17 29 42 34 25 11 13 8 7 - 197
Egypt 20 11 30 23 15 34 3 20 10 4 4 - 174
Libya 44 22 17 7 14 9 5 12 9 14 3 - 156
Sierra Leone 11 5 8 13 25 22 13 34 3 - 2 - 136
Rwanda 1 8 23 40 18 27 3 2 3 - 2 - 127
Somalia 1 3 14 17 31 31 8 1 - - - - 106
Senegal 8 2 7 16 31 19 5 10 3 2 1 - 104
Burkina Faso 3 2 7 17 18 6 11 13 5 - 1 - 83
Congo - 1 1 6 22 15 15 7 6 3 - - 76
Sudan 5 6 12 1 7 5 9 9 12 5 3 - 74
Togo 4 - 2 10 11 23 9 4 1 - - - 64
Morocco 12 8 3 3 7 2 14 1 4 5 - - 59
Djibouti 6 1 8 13 6 5 7 4 2 - - - 52
Guinea 6 2 5 11 5 11 6 1 2 1 2 - 52
Liberia 4 5 7 10 5 6 2 7 2 2 - - 50
Benin - 3 - 12 11 3 4 5 4 4 - - 46
Gambia 1 - 3 8 11 9 4 4 1 4 1 - 46
Côte d'Ivoire 2 - 2 2 8 2 5 7 10 3 4 - 45
Burundi 10 2 1 4 5 10 - 2 - 3 2 - 39
Tunisia 3 - 2 13 4 3 2 7 2 - - - 36
Gabon 1 1 6 5 6 3 - 3 5 - - - 30
Comoros 4 - 3 9 5 4 3 - - - - - 28
Mali 2 - 4 3 1 1 4 2 4 1 3 - 25
Mauritania 3 1 2 3 5 3 3 1 2 2 - - 25
Algeria - - 1 2 3 2 5 1 2 8 - - 24
Equatorial Guinea - - 2 4 1 - 2 - - 1 - - 10
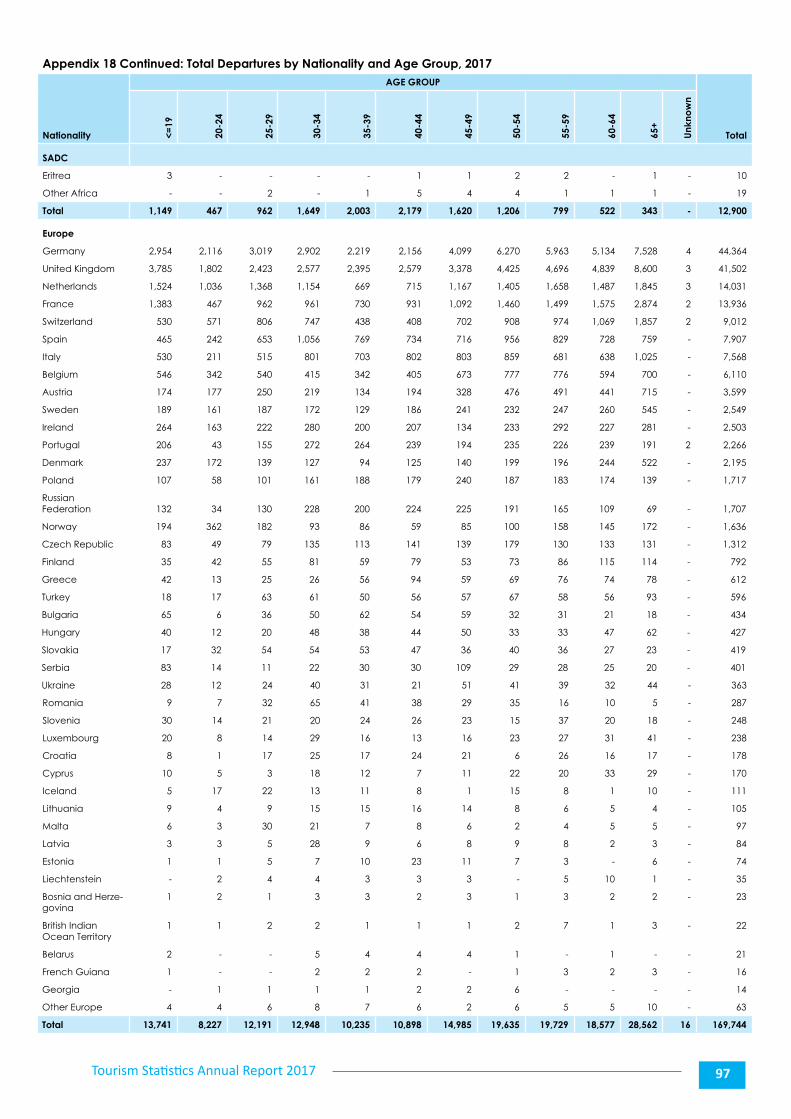
Tourism Statistics Annual Report 2017 97
Appendix 18 Continued: Total Departures by Nationality and Age Group, 2017
Nationality
AGE GROUP
Total<=19
20-2
4
25-2
9
30-3
4
35-3
9
40-4
4
45-4
9
50-5
4
55-5
9
60-6
4
65+
Unk
now
n
SADC
Eritrea 3 - - - - 1 1 2 2 - 1 - 10
Other Africa - - 2 - 1 5 4 4 1 1 1 - 19
Total 1,149 467 962 1,649 2,003 2,179 1,620 1,206 799 522 343 - 12,900
Europe
Germany 2,954 2,116 3,019 2,902 2,219 2,156 4,099 6,270 5,963 5,134 7,528 4 44,364
United Kingdom 3,785 1,802 2,423 2,577 2,395 2,579 3,378 4,425 4,696 4,839 8,600 3 41,502
Netherlands 1,524 1,036 1,368 1,154 669 715 1,167 1,405 1,658 1,487 1,845 3 14,031
France 1,383 467 962 961 730 931 1,092 1,460 1,499 1,575 2,874 2 13,936
Switzerland 530 571 806 747 438 408 702 908 974 1,069 1,857 2 9,012
Spain 465 242 653 1,056 769 734 716 956 829 728 759 - 7,907
Italy 530 211 515 801 703 802 803 859 681 638 1,025 - 7,568
Belgium 546 342 540 415 342 405 673 777 776 594 700 - 6,110
Austria 174 177 250 219 134 194 328 476 491 441 715 - 3,599
Sweden 189 161 187 172 129 186 241 232 247 260 545 - 2,549
Ireland 264 163 222 280 200 207 134 233 292 227 281 - 2,503
Portugal 206 43 155 272 264 239 194 235 226 239 191 2 2,266
Denmark 237 172 139 127 94 125 140 199 196 244 522 - 2,195
Poland 107 58 101 161 188 179 240 187 183 174 139 - 1,717
Russian Federation 132 34 130 228 200 224 225 191 165 109 69 - 1,707
Norway 194 362 182 93 86 59 85 100 158 145 172 - 1,636
Czech Republic 83 49 79 135 113 141 139 179 130 133 131 - 1,312
Finland 35 42 55 81 59 79 53 73 86 115 114 - 792
Greece 42 13 25 26 56 94 59 69 76 74 78 - 612
Turkey 18 17 63 61 50 56 57 67 58 56 93 - 596
Bulgaria 65 6 36 50 62 54 59 32 31 21 18 - 434
Hungary 40 12 20 48 38 44 50 33 33 47 62 - 427
Slovakia 17 32 54 54 53 47 36 40 36 27 23 - 419
Serbia 83 14 11 22 30 30 109 29 28 25 20 - 401
Ukraine 28 12 24 40 31 21 51 41 39 32 44 - 363
Romania 9 7 32 65 41 38 29 35 16 10 5 - 287
Slovenia 30 14 21 20 24 26 23 15 37 20 18 - 248
Luxembourg 20 8 14 29 16 13 16 23 27 31 41 - 238
Croatia 8 1 17 25 17 24 21 6 26 16 17 - 178
Cyprus 10 5 3 18 12 7 11 22 20 33 29 - 170
Iceland 5 17 22 13 11 8 1 15 8 1 10 - 111
Lithuania 9 4 9 15 15 16 14 8 6 5 4 - 105
Malta 6 3 30 21 7 8 6 2 4 5 5 - 97
Latvia 3 3 5 28 9 6 8 9 8 2 3 - 84
Estonia 1 1 5 7 10 23 11 7 3 - 6 - 74
Liechtenstein - 2 4 4 3 3 3 - 5 10 1 - 35
Bosnia and Herze-govina
1 2 1 3 3 2 3 1 3 2 2 - 23
British Indian Ocean Territory
1 1 2 2 1 1 1 2 7 1 3 - 22
Belarus 2 - - 5 4 4 4 1 - 1 - - 21
French Guiana 1 - - 2 2 2 - 1 3 2 3 - 16
Georgia - 1 1 1 1 2 2 6 - - - - 14
Other Europe 4 4 6 8 7 6 2 6 5 5 10 - 63
Total 13,741 8,227 12,191 12,948 10,235 10,898 14,985 19,635 19,729 18,577 28,562 16 169,744
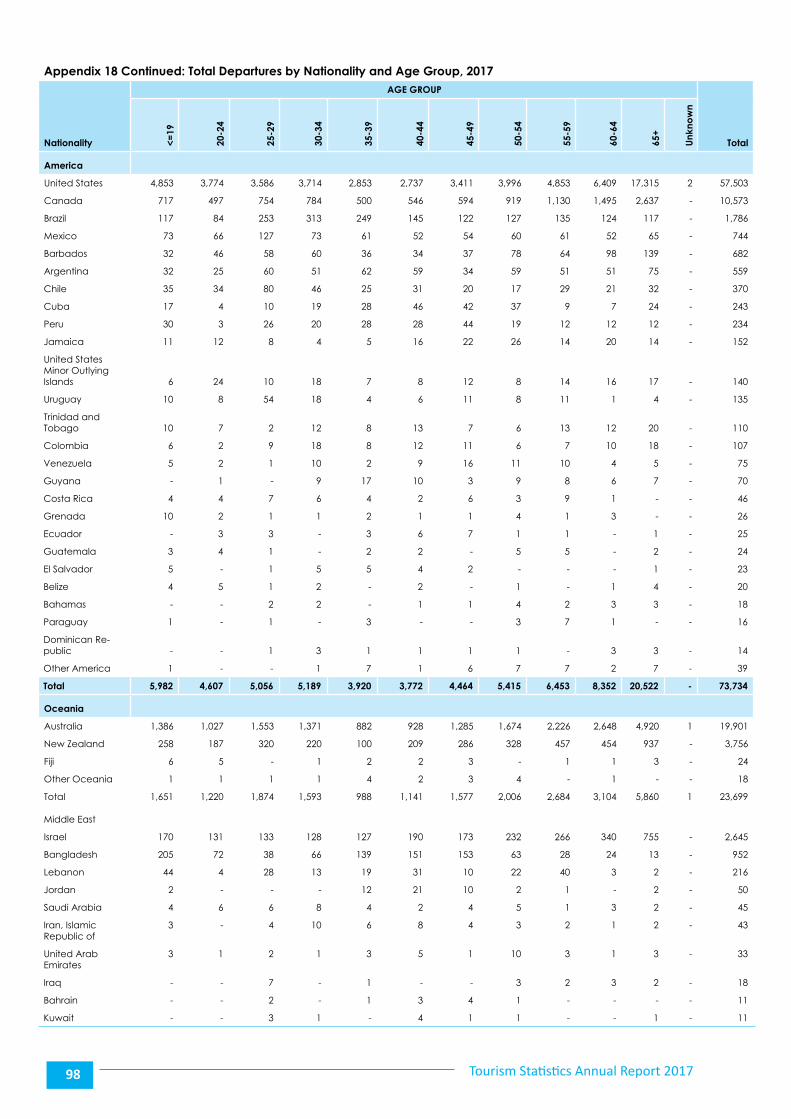
Tourism Statistics Annual Report 201798
Appendix 18 Continued: Total Departures by Nationality and Age Group, 2017
Nationality
AGE GROUP
Total<=19
20-2
4
25-2
9
30-3
4
35-3
9
40-4
4
45-4
9
50-5
4
55-5
9
60-6
4
65+
Unk
now
n
America
United States 4,853 3,774 3,586 3,714 2,853 2,737 3,411 3,996 4,853 6,409 17,315 2 57,503
Canada 717 497 754 784 500 546 594 919 1,130 1,495 2,637 - 10,573
Brazil 117 84 253 313 249 145 122 127 135 124 117 - 1,786
Mexico 73 66 127 73 61 52 54 60 61 52 65 - 744
Barbados 32 46 58 60 36 34 37 78 64 98 139 - 682
Argentina 32 25 60 51 62 59 34 59 51 51 75 - 559
Chile 35 34 80 46 25 31 20 17 29 21 32 - 370
Cuba 17 4 10 19 28 46 42 37 9 7 24 - 243
Peru 30 3 26 20 28 28 44 19 12 12 12 - 234
Jamaica 11 12 8 4 5 16 22 26 14 20 14 - 152
United States Minor Outlying Islands 6 24 10 18 7 8 12 8 14 16 17 - 140
Uruguay 10 8 54 18 4 6 11 8 11 1 4 - 135
Trinidad and Tobago 10 7 2 12 8 13 7 6 13 12 20 - 110
Colombia 6 2 9 18 8 12 11 6 7 10 18 - 107
Venezuela 5 2 1 10 2 9 16 11 10 4 5 - 75
Guyana - 1 - 9 17 10 3 9 8 6 7 - 70
Costa Rica 4 4 7 6 4 2 6 3 9 1 - - 46
Grenada 10 2 1 1 2 1 1 4 1 3 - - 26
Ecuador - 3 3 - 3 6 7 1 1 - 1 - 25
Guatemala 3 4 1 - 2 2 - 5 5 - 2 - 24
El Salvador 5 - 1 5 5 4 2 - - - 1 - 23
Belize 4 5 1 2 - 2 - 1 - 1 4 - 20
Bahamas - - 2 2 - 1 1 4 2 3 3 - 18
Paraguay 1 - 1 - 3 - - 3 7 1 - - 16
Dominican Re-public - - 1 3 1 1 1 1 - 3 3 - 14
Other America 1 - - 1 7 1 6 7 7 2 7 - 39
Total 5,982 4,607 5,056 5,189 3,920 3,772 4,464 5,415 6,453 8,352 20,522 - 73,734
Oceania
Australia 1,386 1,027 1,553 1,371 882 928 1,285 1,674 2,226 2,648 4,920 1 19,901
New Zealand 258 187 320 220 100 209 286 328 457 454 937 - 3,756
Fiji 6 5 - 1 2 2 3 - 1 1 3 - 24
Other Oceania 1 1 1 1 4 2 3 4 - 1 - - 18
Total 1,651 1,220 1,874 1,593 988 1,141 1,577 2,006 2,684 3,104 5,860 1 23,699
Middle East
Israel 170 131 133 128 127 190 173 232 266 340 755 - 2,645
Bangladesh 205 72 38 66 139 151 153 63 28 24 13 - 952
Lebanon 44 4 28 13 19 31 10 22 40 3 2 - 216
Jordan 2 - - - 12 21 10 2 1 - 2 - 50
Saudi Arabia 4 6 6 8 4 2 4 5 1 3 2 - 45
Iran, Islamic Republic of
3 - 4 10 6 8 4 3 2 1 2 - 43
United Arab Emirates
3 1 2 1 3 5 1 10 3 1 3 - 33
Iraq - - 7 - 1 - - 3 2 3 2 - 18
Bahrain - - 2 - 1 3 4 1 - - - - 11
Kuwait - - 3 1 - 4 1 1 - - 1 - 11
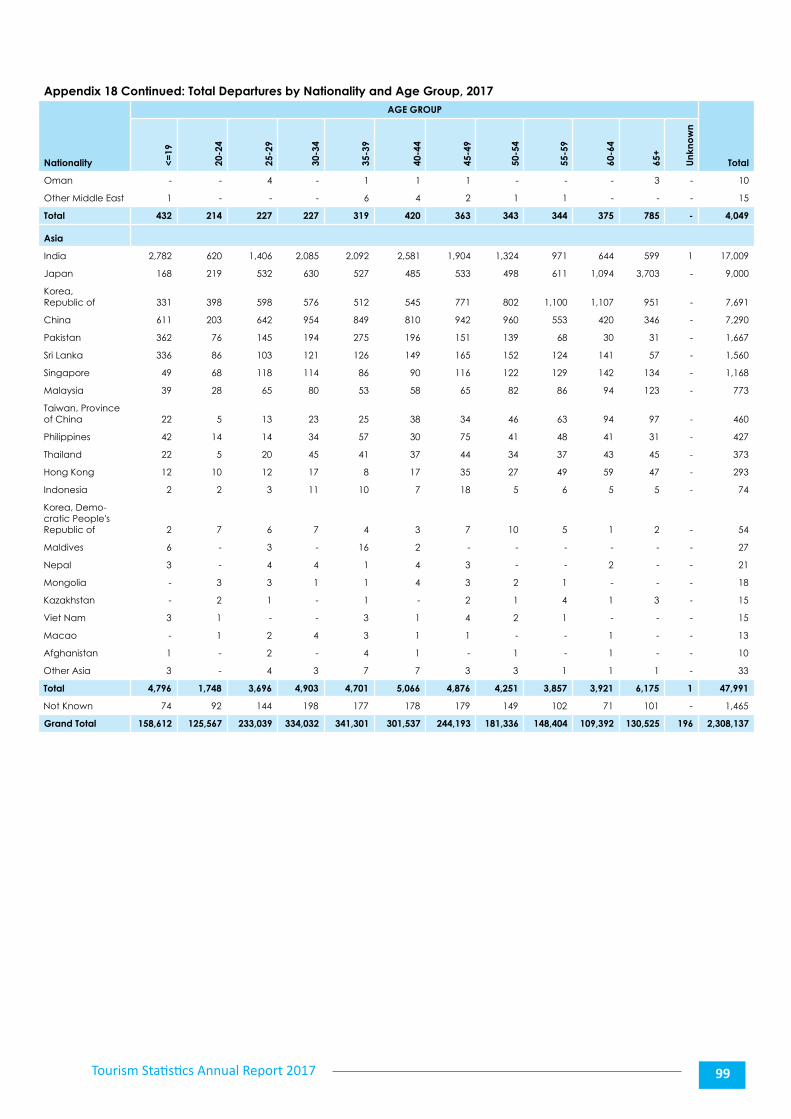
Tourism Statistics Annual Report 2017 99
Appendix 18 Continued: Total Departures by Nationality and Age Group, 2017
Nationality
AGE GROUP
Total<=19
20-2
4
25-2
9
30-3
4
35-3
9
40-4
4
45-4
9
50-5
4
55-5
9
60-6
4
65+
Unk
now
n
Oman - - 4 - 1 1 1 - - - 3 - 10
Other Middle East 1 - - - 6 4 2 1 1 - - - 15
Total 432 214 227 227 319 420 363 343 344 375 785 - 4,049
Asia
India 2,782 620 1,406 2,085 2,092 2,581 1,904 1,324 971 644 599 1 17,009
Japan 168 219 532 630 527 485 533 498 611 1,094 3,703 - 9,000
Korea, Republic of 331 398 598 576 512 545 771 802 1,100 1,107 951 - 7,691
China 611 203 642 954 849 810 942 960 553 420 346 - 7,290
Pakistan 362 76 145 194 275 196 151 139 68 30 31 - 1,667
Sri Lanka 336 86 103 121 126 149 165 152 124 141 57 - 1,560
Singapore 49 68 118 114 86 90 116 122 129 142 134 - 1,168
Malaysia 39 28 65 80 53 58 65 82 86 94 123 - 773
Taiwan, Province of China 22 5 13 23 25 38 34 46 63 94 97 - 460
Philippines 42 14 14 34 57 30 75 41 48 41 31 - 427
Thailand 22 5 20 45 41 37 44 34 37 43 45 - 373
Hong Kong 12 10 12 17 8 17 35 27 49 59 47 - 293
Indonesia 2 2 3 11 10 7 18 5 6 5 5 - 74
Korea, Demo-cratic People's Republic of 2 7 6 7 4 3 7 10 5 1 2 - 54
Maldives 6 - 3 - 16 2 - - - - - - 27
Nepal 3 - 4 4 1 4 3 - - 2 - - 21
Mongolia - 3 3 1 1 4 3 2 1 - - - 18
Kazakhstan - 2 1 - 1 - 2 1 4 1 3 - 15
Viet Nam 3 1 - - 3 1 4 2 1 - - - 15
Macao - 1 2 4 3 1 1 - - 1 - - 13
Afghanistan 1 - 2 - 4 1 - 1 - 1 - - 10
Other Asia 3 - 4 3 7 7 3 3 1 1 1 - 33
Total 4,796 1,748 3,696 4,903 4,701 5,066 4,876 4,251 3,857 3,921 6,175 1 47,991
Not Known 74 92 144 198 177 178 179 149 102 71 101 - 1,465
Grand Total 158,612 125,567 233,039 334,032 341,301 301,537 244,193 181,336 148,404 109,392 130,525 196 2,308,137

Appendix 19
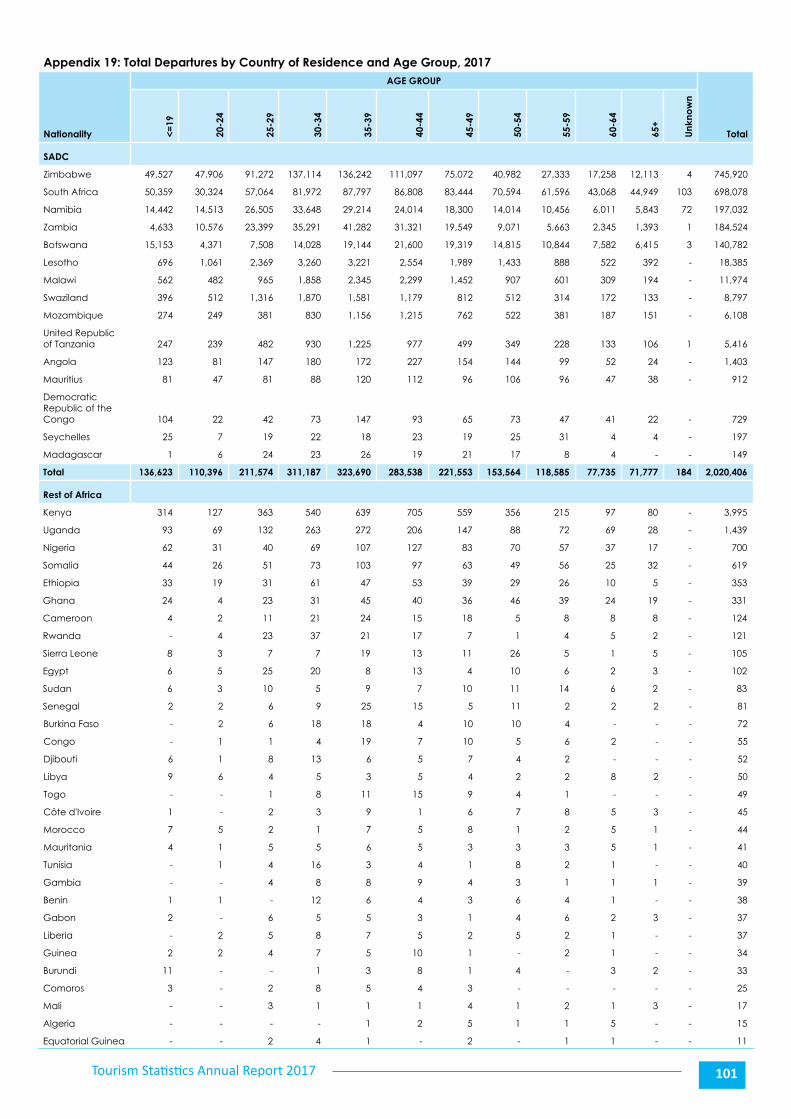
Tourism Statistics Annual Report 2017 101
Appendix 19: Total Departures by Country of Residence and Age Group, 2017
Nationality
AGE GROUP
Total<=19
20-2
4
25-2
9
30-3
4
35-3
9
40-4
4
45-4
9
50-5
4
55-5
9
60-6
4
65+
Unk
now
n
SADC
Zimbabwe 49,527 47,906 91,272 137,114 136,242 111,097 75,072 40,982 27,333 17,258 12,113 4 745,920
South Africa 50,359 30,324 57,064 81,972 87,797 86,808 83,444 70,594 61,596 43,068 44,949 103 698,078
Namibia 14,442 14,513 26,505 33,648 29,214 24,014 18,300 14,014 10,456 6,011 5,843 72 197,032
Zambia 4,633 10,576 23,399 35,291 41,282 31,321 19,549 9,071 5,663 2,345 1,393 1 184,524
Botswana 15,153 4,371 7,508 14,028 19,144 21,600 19,319 14,815 10,844 7,582 6,415 3 140,782
Lesotho 696 1,061 2,369 3,260 3,221 2,554 1,989 1,433 888 522 392 - 18,385
Malawi 562 482 965 1,858 2,345 2,299 1,452 907 601 309 194 - 11,974
Swaziland 396 512 1,316 1,870 1,581 1,179 812 512 314 172 133 - 8,797
Mozambique 274 249 381 830 1,156 1,215 762 522 381 187 151 - 6,108
United Republic of Tanzania 247 239 482 930 1,225 977 499 349 228 133 106 1 5,416
Angola 123 81 147 180 172 227 154 144 99 52 24 - 1,403
Mauritius 81 47 81 88 120 112 96 106 96 47 38 - 912
Democratic Republic of the Congo 104 22 42 73 147 93 65 73 47 41 22 - 729
Seychelles 25 7 19 22 18 23 19 25 31 4 4 - 197
Madagascar 1 6 24 23 26 19 21 17 8 4 - - 149
Total 136,623 110,396 211,574 311,187 323,690 283,538 221,553 153,564 118,585 77,735 71,777 184 2,020,406
Rest of Africa
Kenya 314 127 363 540 639 705 559 356 215 97 80 - 3,995
Uganda 93 69 132 263 272 206 147 88 72 69 28 - 1,439
Nigeria 62 31 40 69 107 127 83 70 57 37 17 - 700
Somalia 44 26 51 73 103 97 63 49 56 25 32 - 619
Ethiopia 33 19 31 61 47 53 39 29 26 10 5 - 353
Ghana 24 4 23 31 45 40 36 46 39 24 19 - 331
Cameroon 4 2 11 21 24 15 18 5 8 8 8 - 124
Rwanda - 4 23 37 21 17 7 1 4 5 2 - 121
Sierra Leone 8 3 7 7 19 13 11 26 5 1 5 - 105
Egypt 6 5 25 20 8 13 4 10 6 2 3 - 102
Sudan 6 3 10 5 9 7 10 11 14 6 2 - 83
Senegal 2 2 6 9 25 15 5 11 2 2 2 - 81
Burkina Faso - 2 6 18 18 4 10 10 4 - - - 72
Congo - 1 1 4 19 7 10 5 6 2 - - 55
Djibouti 6 1 8 13 6 5 7 4 2 - - - 52
Libya 9 6 4 5 3 5 4 2 2 8 2 - 50
Togo - - 1 8 11 15 9 4 1 - - - 49
Côte d'Ivoire 1 - 2 3 9 1 6 7 8 5 3 - 45
Morocco 7 5 2 1 7 5 8 1 2 5 1 - 44
Mauritania 4 1 5 5 6 5 3 3 3 5 1 - 41
Tunisia - 1 4 16 3 4 1 8 2 1 - - 40
Gambia - - 4 8 8 9 4 3 1 1 1 - 39
Benin 1 1 - 12 6 4 3 6 4 1 - - 38
Gabon 2 - 6 5 5 3 1 4 6 2 3 - 37
Liberia - 2 5 8 7 5 2 5 2 1 - - 37
Guinea 2 2 4 7 5 10 1 - 2 1 - - 34
Burundi 11 - - 1 3 8 1 4 - 3 2 - 33
Comoros 3 - 2 8 5 4 3 - - - - - 25
Mali - - 3 1 1 1 4 1 2 1 3 - 17
Algeria - - - - 1 2 5 1 1 5 - - 15
Equatorial Guinea - - 2 4 1 - 2 - 1 1 - - 11
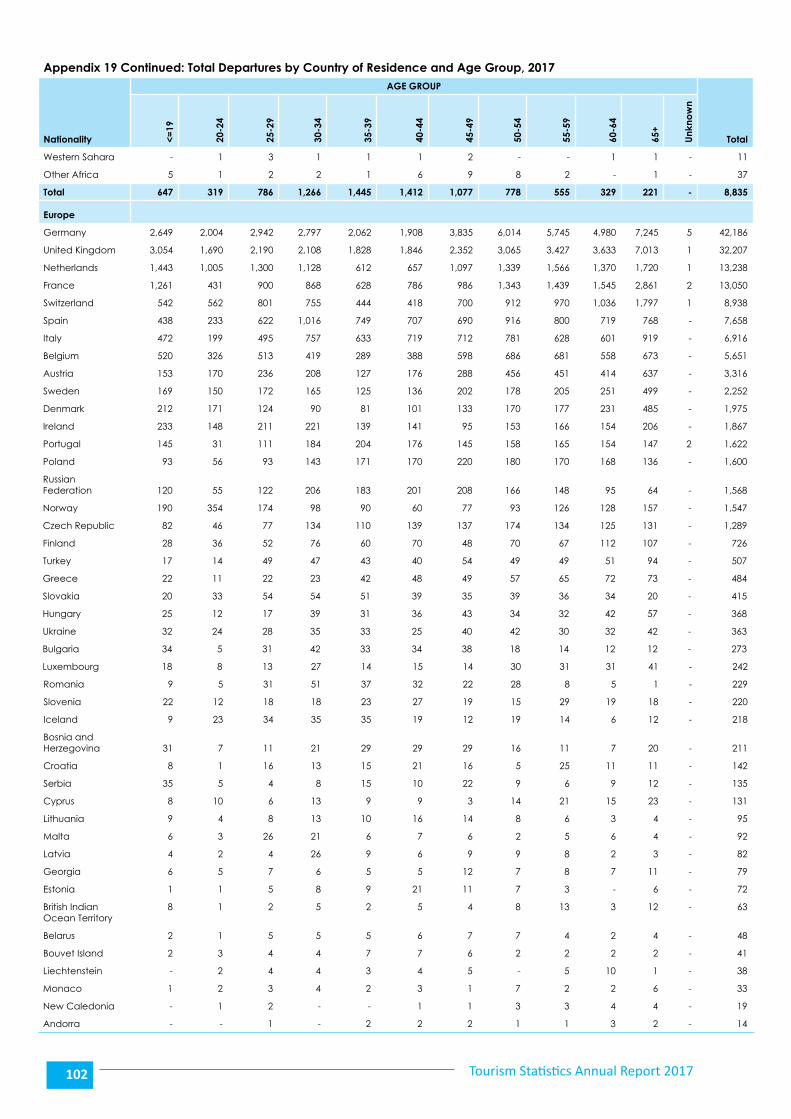
Tourism Statistics Annual Report 2017102
Appendix 19 Continued: Total Departures by Country of Residence and Age Group, 2017
Nationality
AGE GROUP
Total<=19
20-2
4
25-2
9
30-3
4
35-3
9
40-4
4
45-4
9
50-5
4
55-5
9
60-6
4
65+
Unk
now
n
Western Sahara - 1 3 1 1 1 2 - - 1 1 - 11
Other Africa 5 1 2 2 1 6 9 8 2 - 1 - 37
Total 647 319 786 1,266 1,445 1,412 1,077 778 555 329 221 - 8,835
Europe
Germany 2,649 2,004 2,942 2,797 2,062 1,908 3,835 6,014 5,745 4,980 7,245 5 42,186
United Kingdom 3,054 1,690 2,190 2,108 1,828 1,846 2,352 3,065 3,427 3,633 7,013 1 32,207
Netherlands 1,443 1,005 1,300 1,128 612 657 1,097 1,339 1,566 1,370 1,720 1 13,238
France 1,261 431 900 868 628 786 986 1,343 1,439 1,545 2,861 2 13,050
Switzerland 542 562 801 755 444 418 700 912 970 1,036 1,797 1 8,938
Spain 438 233 622 1,016 749 707 690 916 800 719 768 - 7,658
Italy 472 199 495 757 633 719 712 781 628 601 919 - 6,916
Belgium 520 326 513 419 289 388 598 686 681 558 673 - 5,651
Austria 153 170 236 208 127 176 288 456 451 414 637 - 3,316
Sweden 169 150 172 165 125 136 202 178 205 251 499 - 2,252
Denmark 212 171 124 90 81 101 133 170 177 231 485 - 1,975
Ireland 233 148 211 221 139 141 95 153 166 154 206 - 1,867
Portugal 145 31 111 184 204 176 145 158 165 154 147 2 1,622
Poland 93 56 93 143 171 170 220 180 170 168 136 - 1,600
Russian Federation 120 55 122 206 183 201 208 166 148 95 64 - 1,568
Norway 190 354 174 98 90 60 77 93 126 128 157 - 1,547
Czech Republic 82 46 77 134 110 139 137 174 134 125 131 - 1,289
Finland 28 36 52 76 60 70 48 70 67 112 107 - 726
Turkey 17 14 49 47 43 40 54 49 49 51 94 - 507
Greece 22 11 22 23 42 48 49 57 65 72 73 - 484
Slovakia 20 33 54 54 51 39 35 39 36 34 20 - 415
Hungary 25 12 17 39 31 36 43 34 32 42 57 - 368
Ukraine 32 24 28 35 33 25 40 42 30 32 42 - 363
Bulgaria 34 5 31 42 33 34 38 18 14 12 12 - 273
Luxembourg 18 8 13 27 14 15 14 30 31 31 41 - 242
Romania 9 5 31 51 37 32 22 28 8 5 1 - 229
Slovenia 22 12 18 18 23 27 19 15 29 19 18 - 220
Iceland 9 23 34 35 35 19 12 19 14 6 12 - 218
Bosnia and Herzegovina 31 7 11 21 29 29 29 16 11 7 20 - 211
Croatia 8 1 16 13 15 21 16 5 25 11 11 - 142
Serbia 35 5 4 8 15 10 22 9 6 9 12 - 135
Cyprus 8 10 6 13 9 9 3 14 21 15 23 - 131
Lithuania 9 4 8 13 10 16 14 8 6 3 4 - 95
Malta 6 3 26 21 6 7 6 2 5 6 4 - 92
Latvia 4 2 4 26 9 6 9 9 8 2 3 - 82
Georgia 6 5 7 6 5 5 12 7 8 7 11 - 79
Estonia 1 1 5 8 9 21 11 7 3 - 6 - 72
British Indian Ocean Territory
8 1 2 5 2 5 4 8 13 3 12 - 63
Belarus 2 1 5 5 5 6 7 7 4 2 4 - 48
Bouvet Island 2 3 4 4 7 7 6 2 2 2 2 - 41
Liechtenstein - 2 4 4 3 4 5 - 5 10 1 - 38
Monaco 1 2 3 4 2 3 1 7 2 2 6 - 33
New Caledonia - 1 2 - - 1 1 3 3 4 4 - 19
Andorra - - 1 - 2 2 2 1 1 3 2 - 14
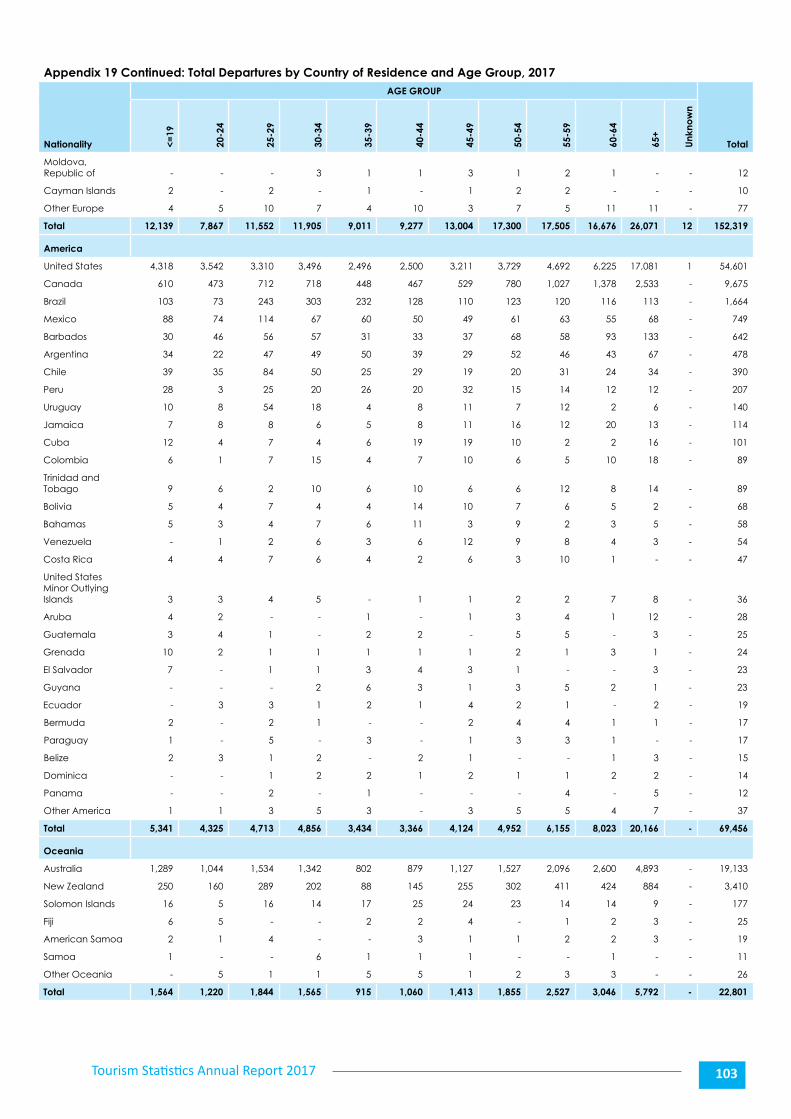
Tourism Statistics Annual Report 2017 103
Appendix 19 Continued: Total Departures by Country of Residence and Age Group, 2017
Nationality
AGE GROUP
Total<=19
20-2
4
25-2
9
30-3
4
35-3
9
40-4
4
45-4
9
50-5
4
55-5
9
60-6
4
65+
Unk
now
n
Moldova, Republic of - - - 3 1 1 3 1 2 1 - - 12
Cayman Islands 2 - 2 - 1 - 1 2 2 - - - 10
Other Europe 4 5 10 7 4 10 3 7 5 11 11 - 77
Total 12,139 7,867 11,552 11,905 9,011 9,277 13,004 17,300 17,505 16,676 26,071 12 152,319
America
United States 4,318 3,542 3,310 3,496 2,496 2,500 3,211 3,729 4,692 6,225 17,081 1 54,601
Canada 610 473 712 718 448 467 529 780 1,027 1,378 2,533 - 9,675
Brazil 103 73 243 303 232 128 110 123 120 116 113 - 1,664
Mexico 88 74 114 67 60 50 49 61 63 55 68 - 749
Barbados 30 46 56 57 31 33 37 68 58 93 133 - 642
Argentina 34 22 47 49 50 39 29 52 46 43 67 - 478
Chile 39 35 84 50 25 29 19 20 31 24 34 - 390
Peru 28 3 25 20 26 20 32 15 14 12 12 - 207
Uruguay 10 8 54 18 4 8 11 7 12 2 6 - 140
Jamaica 7 8 8 6 5 8 11 16 12 20 13 - 114
Cuba 12 4 7 4 6 19 19 10 2 2 16 - 101
Colombia 6 1 7 15 4 7 10 6 5 10 18 - 89
Trinidad and Tobago 9 6 2 10 6 10 6 6 12 8 14 - 89
Bolivia 5 4 7 4 4 14 10 7 6 5 2 - 68
Bahamas 5 3 4 7 6 11 3 9 2 3 5 - 58
Venezuela - 1 2 6 3 6 12 9 8 4 3 - 54
Costa Rica 4 4 7 6 4 2 6 3 10 1 - - 47
United States Minor Outlying Islands 3 3 4 5 - 1 1 2 2 7 8 - 36
Aruba 4 2 - - 1 - 1 3 4 1 12 - 28
Guatemala 3 4 1 - 2 2 - 5 5 - 3 - 25
Grenada 10 2 1 1 1 1 1 2 1 3 1 - 24
El Salvador 7 - 1 1 3 4 3 1 - - 3 - 23
Guyana - - - 2 6 3 1 3 5 2 1 - 23
Ecuador - 3 3 1 2 1 4 2 1 - 2 - 19
Bermuda 2 - 2 1 - - 2 4 4 1 1 - 17
Paraguay 1 - 5 - 3 - 1 3 3 1 - - 17
Belize 2 3 1 2 - 2 1 - - 1 3 - 15
Dominica - - 1 2 2 1 2 1 1 2 2 - 14
Panama - - 2 - 1 - - - 4 - 5 - 12
Other America 1 1 3 5 3 - 3 5 5 4 7 - 37
Total 5,341 4,325 4,713 4,856 3,434 3,366 4,124 4,952 6,155 8,023 20,166 - 69,456
Oceania
Australia 1,289 1,044 1,534 1,342 802 879 1,127 1,527 2,096 2,600 4,893 - 19,133
New Zealand 250 160 289 202 88 145 255 302 411 424 884 - 3,410
Solomon Islands 16 5 16 14 17 25 24 23 14 14 9 - 177
Fiji 6 5 - - 2 2 4 - 1 2 3 - 25
American Samoa 2 1 4 - - 3 1 1 2 2 3 - 19
Samoa 1 - - 6 1 1 1 - - 1 - - 11
Other Oceania - 5 1 1 5 5 1 2 3 3 - - 26
Total 1,564 1,220 1,844 1,565 915 1,060 1,413 1,855 2,527 3,046 5,792 - 22,801
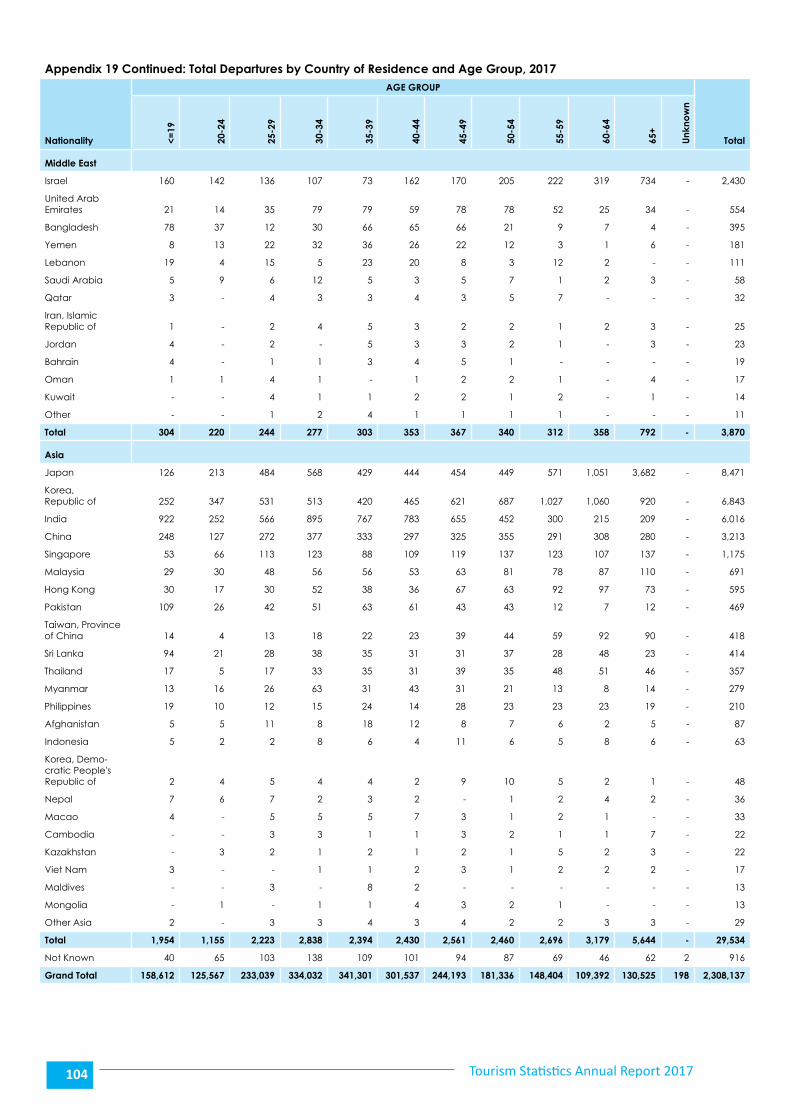
Tourism Statistics Annual Report 2017104
Appendix 19 Continued: Total Departures by Country of Residence and Age Group, 2017
Nationality
AGE GROUP
Total<=19
20-2
4
25-2
9
30-3
4
35-3
9
40-4
4
45-4
9
50-5
4
55-5
9
60-6
4
65+
Unk
now
n
Middle East
Israel 160 142 136 107 73 162 170 205 222 319 734 - 2,430
United Arab Emirates 21 14 35 79 79 59 78 78 52 25 34 - 554
Bangladesh 78 37 12 30 66 65 66 21 9 7 4 - 395
Yemen 8 13 22 32 36 26 22 12 3 1 6 - 181
Lebanon 19 4 15 5 23 20 8 3 12 2 - - 111
Saudi Arabia 5 9 6 12 5 3 5 7 1 2 3 - 58
Qatar 3 - 4 3 3 4 3 5 7 - - - 32
Iran, Islamic Republic of 1 - 2 4 5 3 2 2 1 2 3 - 25
Jordan 4 - 2 - 5 3 3 2 1 - 3 - 23
Bahrain 4 - 1 1 3 4 5 1 - - - - 19
Oman 1 1 4 1 - 1 2 2 1 - 4 - 17
Kuwait - - 4 1 1 2 2 1 2 - 1 - 14
Other - - 1 2 4 1 1 1 1 - - - 11
Total 304 220 244 277 303 353 367 340 312 358 792 - 3,870
Asia
Japan 126 213 484 568 429 444 454 449 571 1,051 3,682 - 8,471
Korea, Republic of 252 347 531 513 420 465 621 687 1,027 1,060 920 - 6,843
India 922 252 566 895 767 783 655 452 300 215 209 - 6,016
China 248 127 272 377 333 297 325 355 291 308 280 - 3,213
Singapore 53 66 113 123 88 109 119 137 123 107 137 - 1,175
Malaysia 29 30 48 56 56 53 63 81 78 87 110 - 691
Hong Kong 30 17 30 52 38 36 67 63 92 97 73 - 595
Pakistan 109 26 42 51 63 61 43 43 12 7 12 - 469
Taiwan, Province of China 14 4 13 18 22 23 39 44 59 92 90 - 418
Sri Lanka 94 21 28 38 35 31 31 37 28 48 23 - 414
Thailand 17 5 17 33 35 31 39 35 48 51 46 - 357
Myanmar 13 16 26 63 31 43 31 21 13 8 14 - 279
Philippines 19 10 12 15 24 14 28 23 23 23 19 - 210
Afghanistan 5 5 11 8 18 12 8 7 6 2 5 - 87
Indonesia 5 2 2 8 6 4 11 6 5 8 6 - 63
Korea, Demo-cratic People's Republic of 2 4 5 4 4 2 9 10 5 2 1 - 48
Nepal 7 6 7 2 3 2 - 1 2 4 2 - 36
Macao 4 - 5 5 5 7 3 1 2 1 - - 33
Cambodia - - 3 3 1 1 3 2 1 1 7 - 22
Kazakhstan - 3 2 1 2 1 2 1 5 2 3 - 22
Viet Nam 3 - - 1 1 2 3 1 2 2 2 - 17
Maldives - - 3 - 8 2 - - - - - - 13
Mongolia - 1 - 1 1 4 3 2 1 - - - 13
Other Asia 2 - 3 3 4 3 4 2 2 3 3 - 29
Total 1,954 1,155 2,223 2,838 2,394 2,430 2,561 2,460 2,696 3,179 5,644 - 29,534
Not Known 40 65 103 138 109 101 94 87 69 46 62 2 916
Grand Total 158,612 125,567 233,039 334,032 341,301 301,537 244,193 181,336 148,404 109,392 130,525 198 2,308,137

Appendix 20
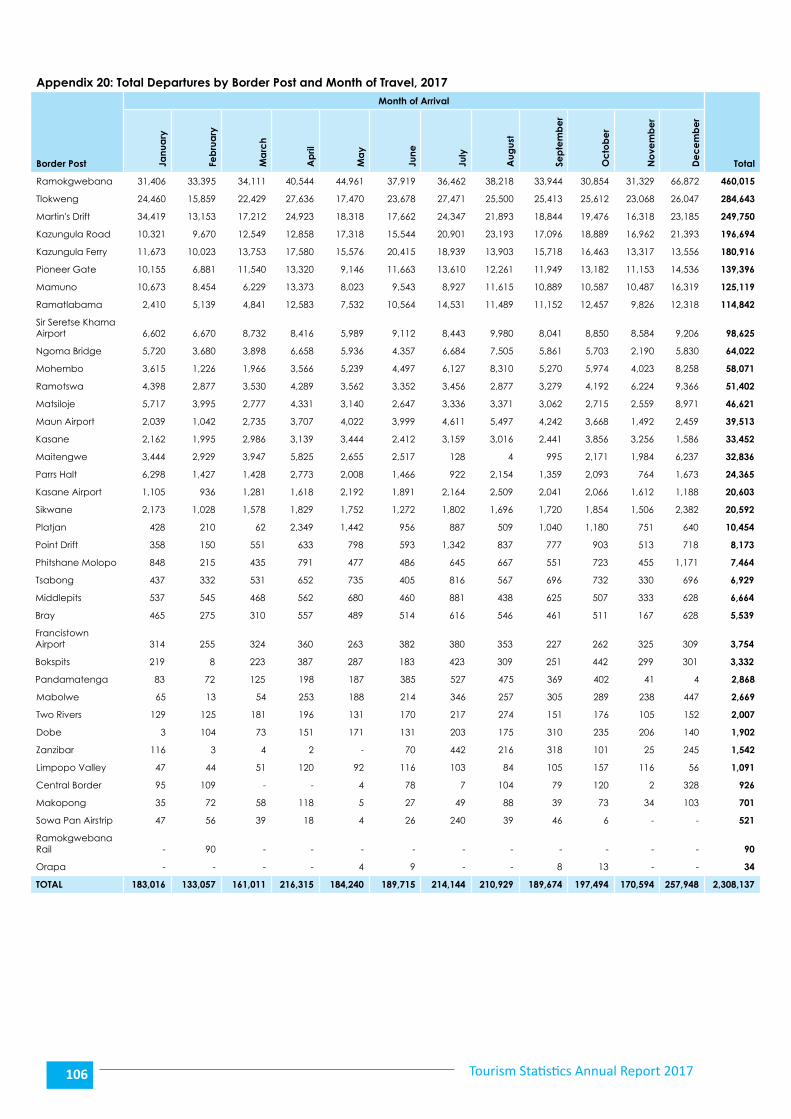
Tourism Statistics Annual Report 2017106
Appendix 20: Total Departures by Border Post and Month of Travel, 2017
Border Post
Month of Arrival
TotalJanu
ary
Feb
rua
ry
Ma
rch
Ap
ril
Ma
y
June
July
Aug
ust
Sep
tem
be
r
Oc
tob
er
No
vem
be
r
De
ce
mb
er
Ramokgwebana 31,406 33,395 34,111 40,544 44,961 37,919 36,462 38,218 33,944 30,854 31,329 66,872 460,015
Tlokweng 24,460 15,859 22,429 27,636 17,470 23,678 27,471 25,500 25,413 25,612 23,068 26,047 284,643
Martin's Drift 34,419 13,153 17,212 24,923 18,318 17,662 24,347 21,893 18,844 19,476 16,318 23,185 249,750
Kazungula Road 10,321 9,670 12,549 12,858 17,318 15,544 20,901 23,193 17,096 18,889 16,962 21,393 196,694
Kazungula Ferry 11,673 10,023 13,753 17,580 15,576 20,415 18,939 13,903 15,718 16,463 13,317 13,556 180,916
Pioneer Gate 10,155 6,881 11,540 13,320 9,146 11,663 13,610 12,261 11,949 13,182 11,153 14,536 139,396
Mamuno 10,673 8,454 6,229 13,373 8,023 9,543 8,927 11,615 10,889 10,587 10,487 16,319 125,119
Ramatlabama 2,410 5,139 4,841 12,583 7,532 10,564 14,531 11,489 11,152 12,457 9,826 12,318 114,842
Sir Seretse Khama Airport 6,602 6,670 8,732 8,416 5,989 9,112 8,443 9,980 8,041 8,850 8,584 9,206 98,625
Ngoma Bridge 5,720 3,680 3,898 6,658 5,936 4,357 6,684 7,505 5,861 5,703 2,190 5,830 64,022
Mohembo 3,615 1,226 1,966 3,566 5,239 4,497 6,127 8,310 5,270 5,974 4,023 8,258 58,071
Ramotswa 4,398 2,877 3,530 4,289 3,562 3,352 3,456 2,877 3,279 4,192 6,224 9,366 51,402
Matsiloje 5,717 3,995 2,777 4,331 3,140 2,647 3,336 3,371 3,062 2,715 2,559 8,971 46,621
Maun Airport 2,039 1,042 2,735 3,707 4,022 3,999 4,611 5,497 4,242 3,668 1,492 2,459 39,513
Kasane 2,162 1,995 2,986 3,139 3,444 2,412 3,159 3,016 2,441 3,856 3,256 1,586 33,452
Maitengwe 3,444 2,929 3,947 5,825 2,655 2,517 128 4 995 2,171 1,984 6,237 32,836
Parrs Halt 6,298 1,427 1,428 2,773 2,008 1,466 922 2,154 1,359 2,093 764 1,673 24,365
Kasane Airport 1,105 936 1,281 1,618 2,192 1,891 2,164 2,509 2,041 2,066 1,612 1,188 20,603
Sikwane 2,173 1,028 1,578 1,829 1,752 1,272 1,802 1,696 1,720 1,854 1,506 2,382 20,592
Platjan 428 210 62 2,349 1,442 956 887 509 1,040 1,180 751 640 10,454
Point Drift 358 150 551 633 798 593 1,342 837 777 903 513 718 8,173
Phitshane Molopo 848 215 435 791 477 486 645 667 551 723 455 1,171 7,464
Tsabong 437 332 531 652 735 405 816 567 696 732 330 696 6,929
Middlepits 537 545 468 562 680 460 881 438 625 507 333 628 6,664
Bray 465 275 310 557 489 514 616 546 461 511 167 628 5,539
Francistown Airport 314 255 324 360 263 382 380 353 227 262 325 309 3,754
Bokspits 219 8 223 387 287 183 423 309 251 442 299 301 3,332
Pandamatenga 83 72 125 198 187 385 527 475 369 402 41 4 2,868
Mabolwe 65 13 54 253 188 214 346 257 305 289 238 447 2,669
Two Rivers 129 125 181 196 131 170 217 274 151 176 105 152 2,007
Dobe 3 104 73 151 171 131 203 175 310 235 206 140 1,902
Zanzibar 116 3 4 2 - 70 442 216 318 101 25 245 1,542
Limpopo Valley 47 44 51 120 92 116 103 84 105 157 116 56 1,091
Central Border 95 109 - - 4 78 7 104 79 120 2 328 926
Makopong 35 72 58 118 5 27 49 88 39 73 34 103 701
Sowa Pan Airstrip 47 56 39 18 4 26 240 39 46 6 - - 521
Ramokgwebana Rail - 90 - - - - - - - - - - 90
Orapa - - - - 4 9 - - 8 13 - - 34
TOTAL 183,016 133,057 161,011 216,315 184,240 189,715 214,144 210,929 189,674 197,494 170,594 257,948 2,308,137

Appendix 21
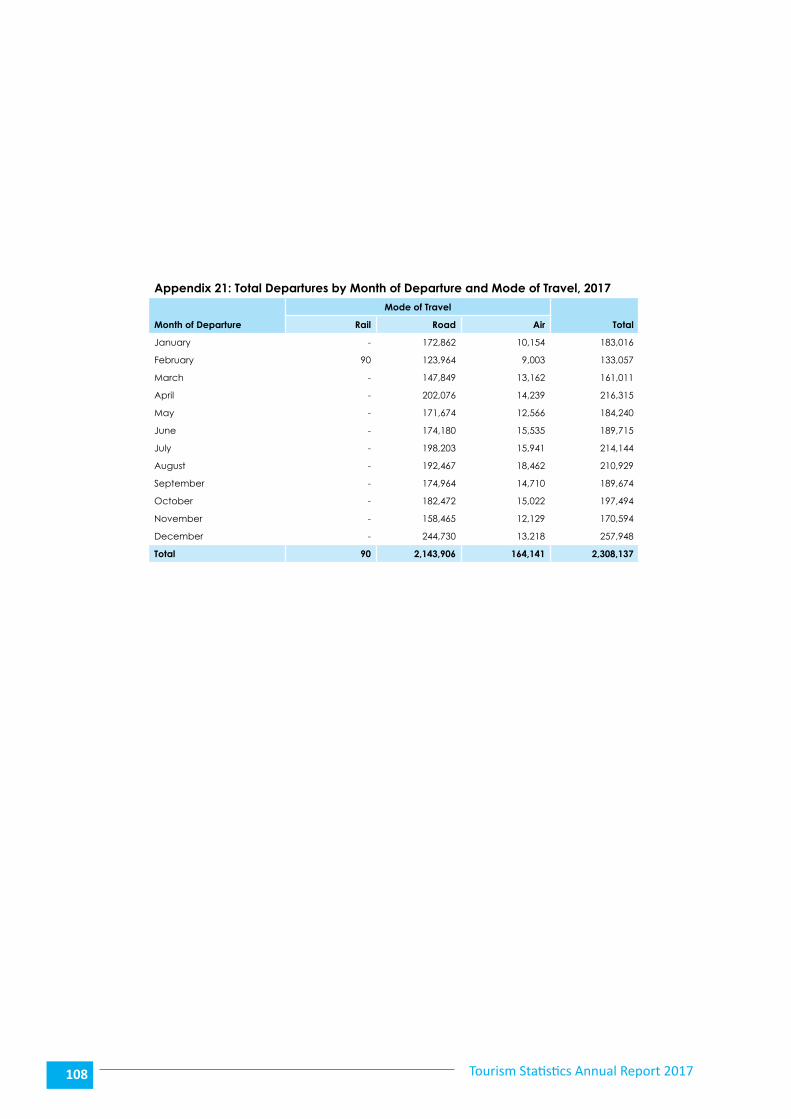
Tourism Statistics Annual Report 2017108
Appendix 21: Total Departures by Month of Departure and Mode of Travel, 2017
Month of Departure
Mode of Travel
TotalRail Road Air
January - 172,862 10,154 183,016
February 90 123,964 9,003 133,057
March - 147,849 13,162 161,011
April - 202,076 14,239 216,315
May - 171,674 12,566 184,240
June - 174,180 15,535 189,715
July - 198,203 15,941 214,144
August - 192,467 18,462 210,929
September - 174,964 14,710 189,674
October - 182,472 15,022 197,494
November - 158,465 12,129 170,594
December - 244,730 13,218 257,948
Total 90 2,143,906 164,141 2,308,137

Tourism Statistics Annual Report 2017 109
ISBN: 978-99968-458-4-0
-----------------------------
Recommended