TOURISM STATISTICS TOURISM STATISTICS ––CURRENT STATUSCURRENT STATUS

3
TOURISM STATISTICS
WHAT IS TOURISM STATISTICSUSES OF TOURISM STATISTICSUSERS OF TOURISM STATISTICSCURRENT INVENTORYCHALLENGESOPPORTUNITIES
4
What is Tourism Statistics?
“Tourism Statistics refers to applying statistical techniques to the collection, computation, analysis and distribution of data on tourism”
5
USES OF TOURISM STATISITCS
To evaluate the scope and trends in the industryBasis for decision making and policy formulationProvide competitive advantage over countries not using tourism statisticsMeasure performance… destination vs destination and the region vs the world
6
USERS OF TOURISM STATISTICS
GovernmentFor investment planningFor strategic planning and marketing of tourism
Private SectorIdentify market trendsLearn from competitorsTo understand current clientele Identify new opportunities

7
USERS OF TOURISM STATISTICS (cont’d)
Universities & CollegesAcademic exercises
Regional & International AgenciesCaribbean Development BankWorld Tourism OrganizationInternational Monetary FundWorld Bank
8
CURRENT INVENTORY
Primary Data Sources for Tourism Statistics in the Caribbean
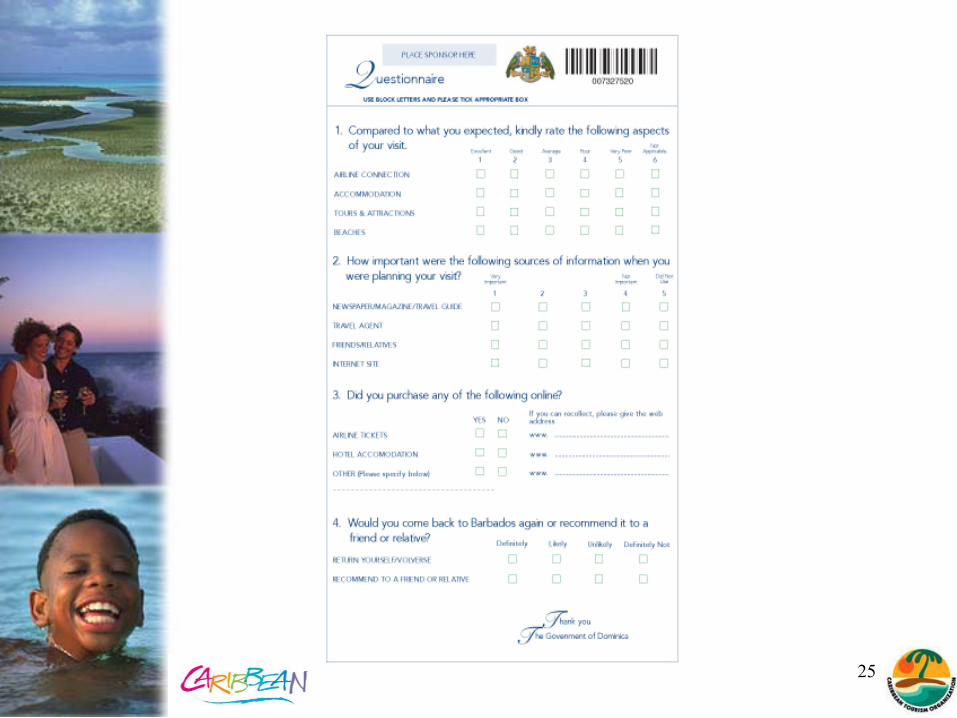
Immigration CardsLegal document which is the property of the Immigration Department
Hotel Registration DataSurveys
9
CURRENT INVENTORY
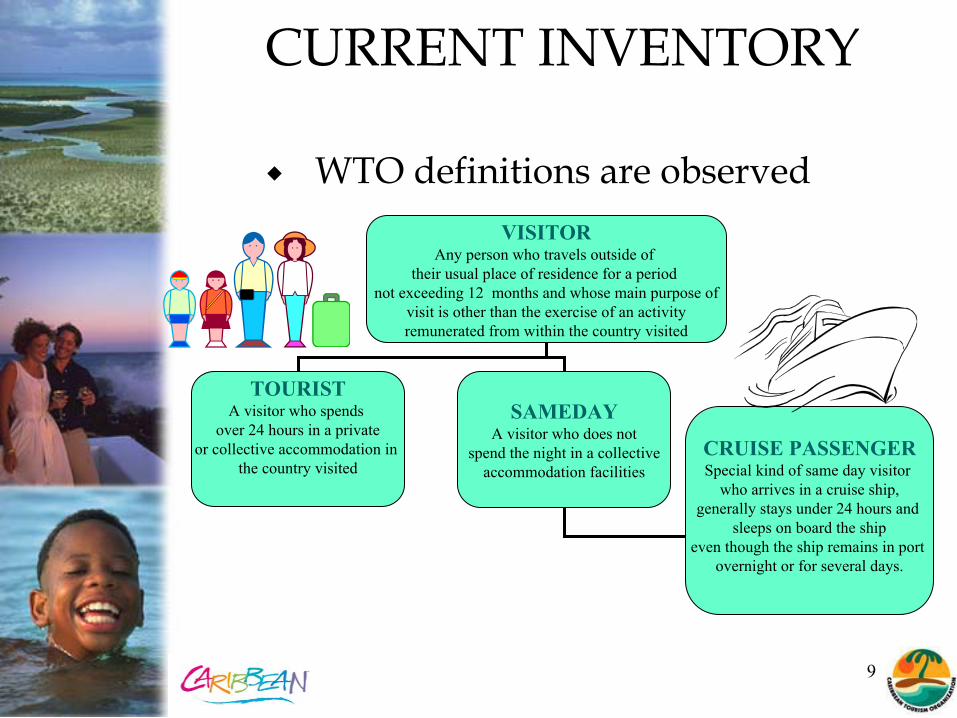
VISITORAny person who travels outside of
their usual place of residence for a period not exceeding 12 months and whose main purpose of
visit is other than the exercise of an activity remunerated from within the country visited
TOURISTA visitor who spends
over 24 hours in a privateor collective accommodation in
the country visited
SAMEDAYA visitor who does not
spend the night in a collectiveaccommodation facilities
CRUISE PASSENGERSpecial kind of same day visitor
who arrives in a cruise ship,generally stays under 24 hours and
sleeps on board the shipeven though the ship remains in port
overnight or for several days.
WTO definitions are observed
10
CURRENT INVENTORYTourism performance indicators from 32 Caribbean destinations
Number of Visitor Arrivals – Tourist (Stay-Over) Arrivals, Same-Day Visitor & Cruise Passenger ArrivalsProfilesActivities during the tripExpenditure levelsAccommodation statisticsEconomic Data
Survey Results from some destinations
11
CURRENT INVENTORY
32 destinations of which 2 have not reported any data since 2002 Either the National Tourism Office or the Central Statistical Office is generally responsible for generating tourism statistics for each destinationReports are received as soft copy in Microsoft Word, Excel or PDF formatEach destination’s monthly report is uniquely designed with varying levels of detail.
12
CURRENT INVENTORY
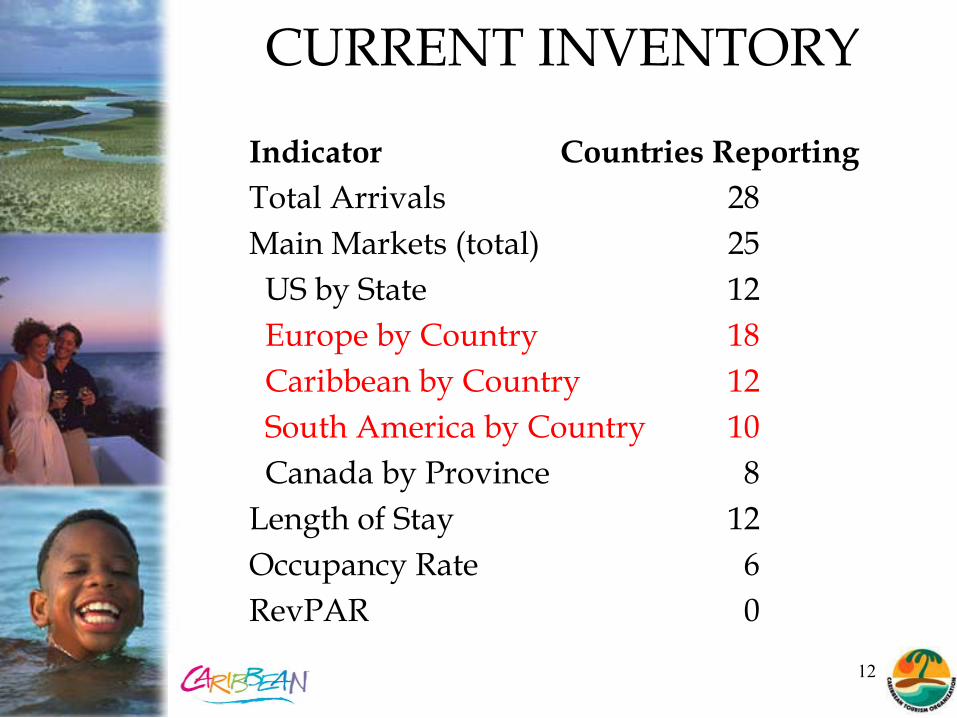
Indicator Countries ReportingTotal Arrivals 28Main Markets (total) 25US by State 12 Europe by Country 18 Caribbean by Country 12 South America by Country 10 Canada by Province 8
Length of Stay 12Occupancy Rate 6 RevPAR 0
13
CURRENT INVENTORY
Timeliness varies from country to countryThe need to revise data is low; statistics are accurate when received50%of all destinations will respond to the annual performance questionnaireOn average, 6-10 responses are received to the Budget and Employment questionnaireTourist Accommodations data and Visitor expenditure estimates are in short supply and non-existent in some countries
14
CURRENT INVENTORY
Statistical PublicationsLatest – Bi-weekly publication containing tables of tourist arrivals by season, main markets and month for each destination. YTD totals are given for Cruise Passenger arrivals.Caribbean Tourism Statistical Report (format under review) – Annual publication of tourism related statistics. This report
Carries analysis of tourism performance at both the regional and country levels; Examines the various profiles (POV, POS, Age & Sex etc.);Gives socio-economic data (Expenditure, Contribution to GDP, NTO Budgets)
Key Statistics (proposed revival) – Quarterly publication
15
CHALLENGESTimeliness & ComparabilityMeasurement of TourismFilling data gapsChanges to the Immigration Processing and access to the E\D CardsInter-Agencies conflictsDeveloping new indicators to cover as wide a field as possible in accordance with multi-disciplinary and integrated approach to tourism development
16
OPPORTUNITIES
Improve on our data management systemsCTO MIST Version 2
Using New TechnologiesUse of O/ICR (Optical\Intelligent Character Recognition)
Data transfers from Immigration systemsSupport the implementation of Tourism Satellite Accounts thru partnerships with other regional institutions including CARICOM, CDB, UWI

17
THANK YOU
18
CTOCTO ~ ~ MMANAGEMENT ANAGEMENT IINFORMATION SYSTEM NFORMATION SYSTEM
For TOURISM For TOURISM (CTO (CTO –– MIST)MIST)
19
CTO MIST
Desktop application for the data entry of E\D Cards and a reporting application for the production of management reports.
20
CTO MIST (Data Entry Application)
The Data Entry system has been developed using a three tier architecture.This means the system has been split into three levels
the Front End/user interface,the Middle Tier/Business Objects and rules developed in Microsoft Visual FoxPro 9.0 SP1and the Back End/ Database developed in Microsoft SQL Server 2005
21
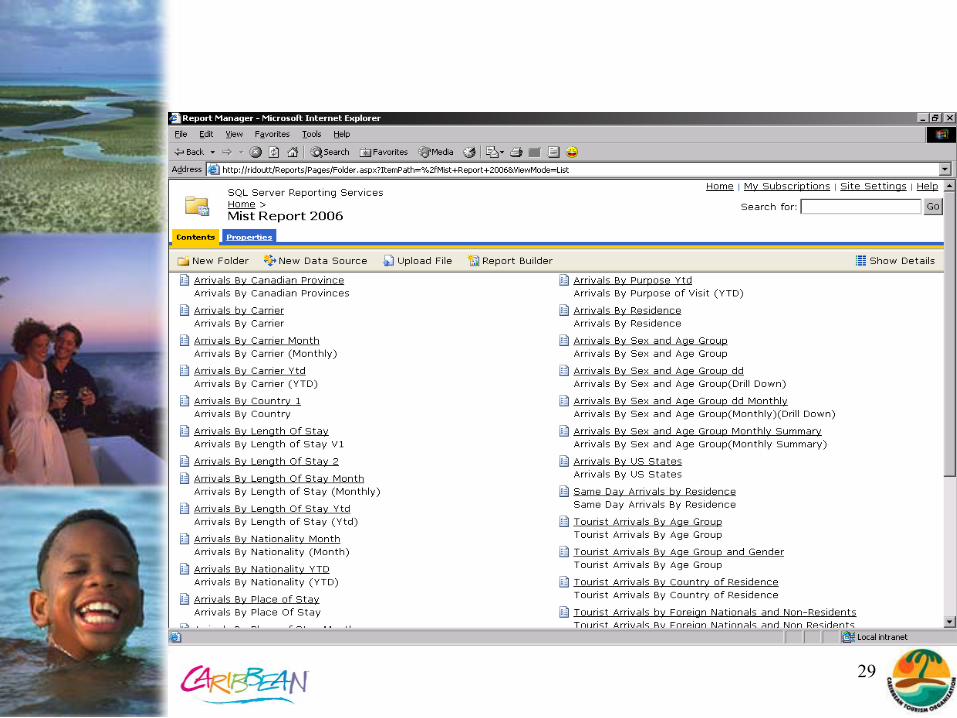
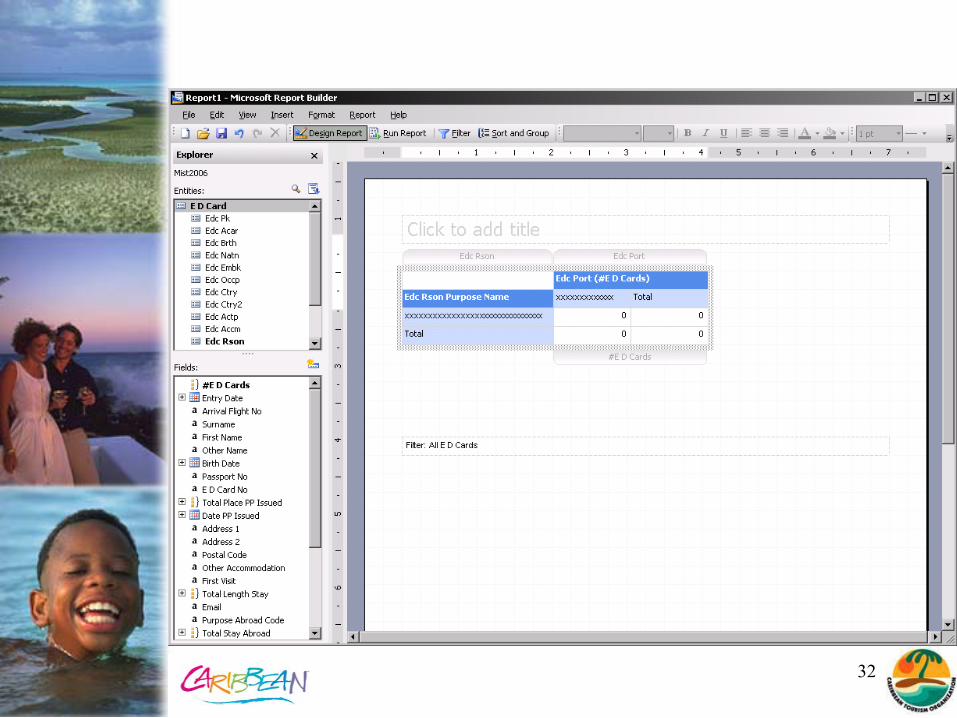
CTO MIST (Reporting Application)
Utilizes SQL Server Reporting Services along with the Report Builder and Analysis Services for providing “Cube Analysis” of the data.
22
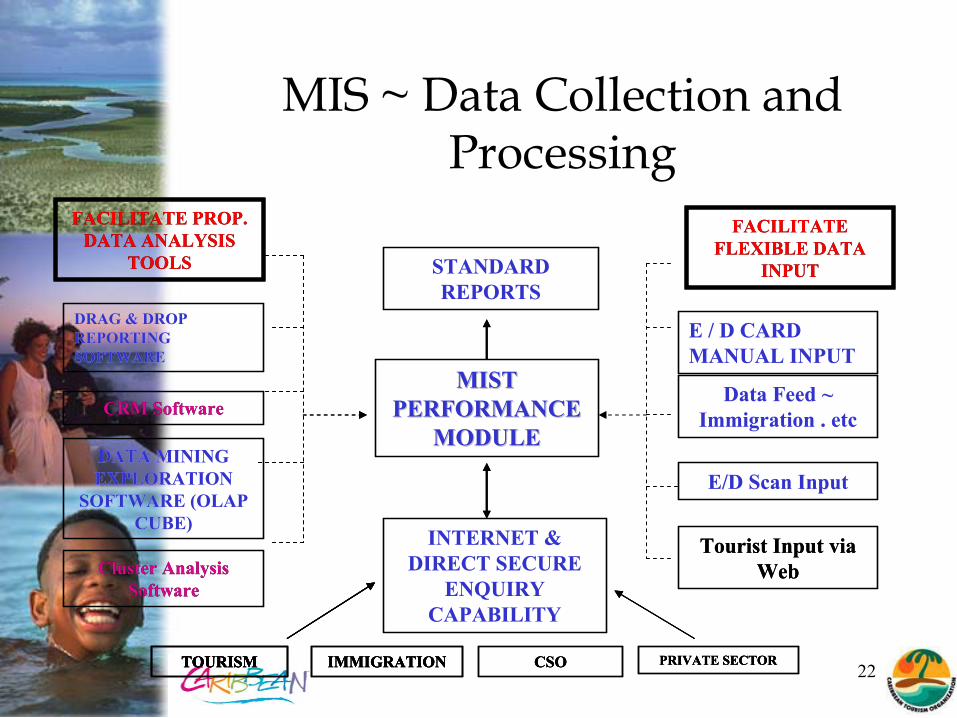
MIS ~ Data Collection and Processing
DRAG & DROP REPORTING SOFTWARE
CRM Software
DATA MINING EXPLORATION
SOFTWARE (OLAP CUBE)
Cluster Analysis Software
FACILITATE PROP. DATA ANALYSIS
TOOLS
IMMIGRATION CSOTOURISM PRIVATE SECTOR
MIST MIST PERFORMANCE PERFORMANCE
MODULEMODULE
STANDARD REPORTS
INTERNET & DIRECT SECURE
ENQUIRY CAPABILITY
TOURISM IMMIGRATIONTOURISM
E / D CARD MANUAL INPUT
Data Feed ~ Immigration . etc
E/D Scan Input
Tourist Input via Web
FACILITATE FLEXIBLE DATA
INPUT
CSO PRIVATE SECTORIMMIGRATIONTOURISM
DRAG & DROP REPORTING SOFTWARE
CRM Software
DATA MINING EXPLORATION
SOFTWARE (OLAP CUBE)
Cluster Analysis Software
FACILITATE PROP. DATA ANALYSIS
TOOLS
MIST MIST PERFORMANCE PERFORMANCE
MODULEMODULE
STANDARD REPORTS
INTERNET & DIRECT SECURE
ENQUIRY CAPABILITY
E / D CARD MANUAL INPUT
Data Feed ~ Immigration . etc
E/D Scan Input
Tourist Input via Web
FACILITATE FLEXIBLE DATA
INPUT
CSO PRIVATE SECTORIMMIGRATIONTOURISM

23
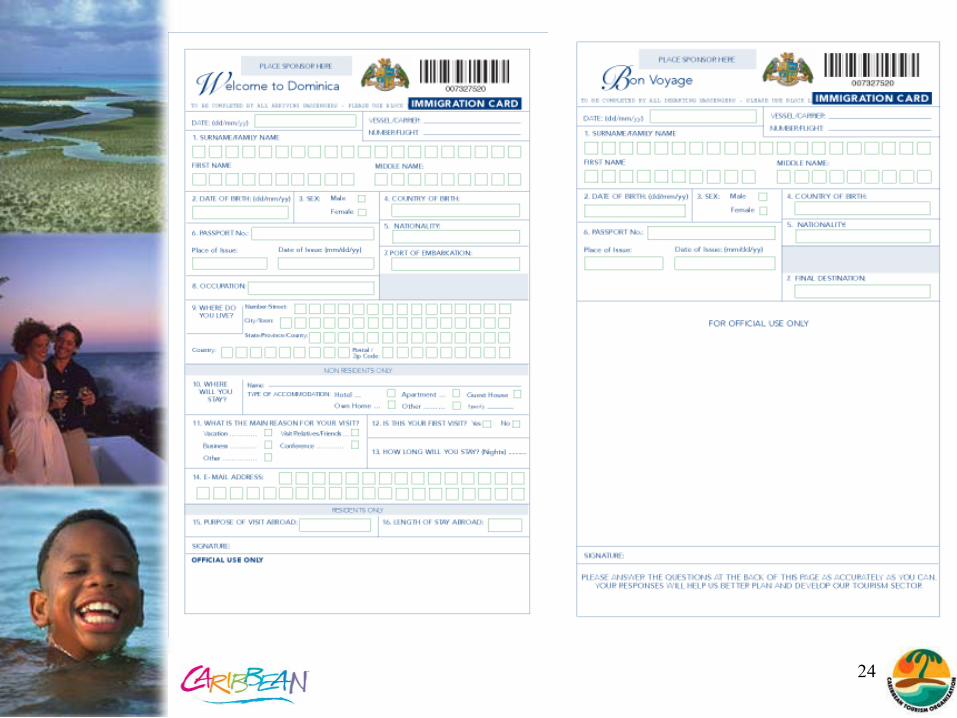
Information Database ~ Based on CTO “Standard
Card” ?
24
25
26
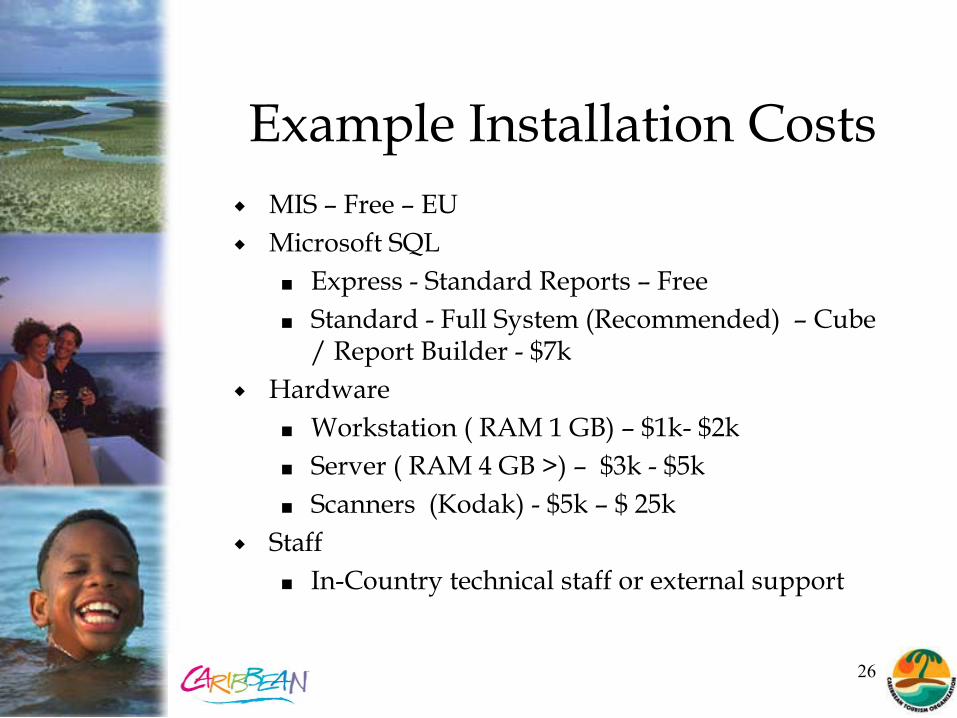
Example Installation CostsMIS – Free – EUMicrosoft SQL
Express - Standard Reports – FreeStandard - Full System (Recommended) – Cube / Report Builder - $7k
Hardware Workstation ( RAM 1 GB) – $1k- $2kServer ( RAM 4 GB >) – $3k - $5kScanners (Kodak) - $5k – $ 25k
StaffIn-Country technical staff or external support
27
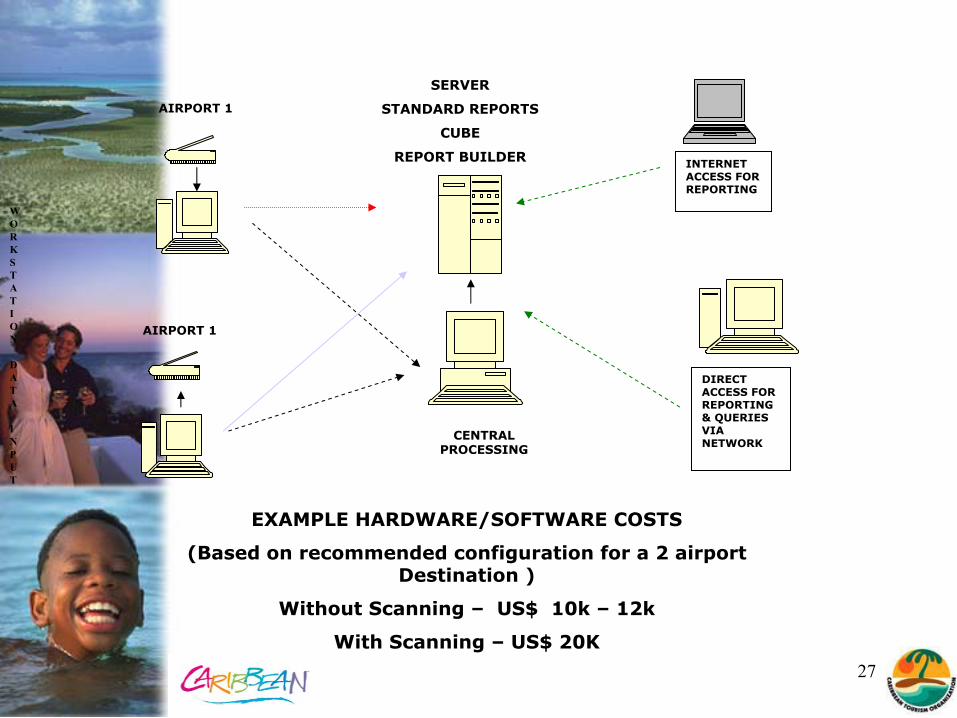
INTERNET ACCESS FOR REPORTING
DIRECT ACCESS FOR REPORTING & QUERIESVIA NETWORK
WORKSTATION
DATA
INPUT
SERVER
STANDARD REPORTS
CUBE
REPORT BUILDER
AIRPORT 1
AIRPORT 1
CENTRAL PROCESSING
EXAMPLE HARDWARE/SOFTWARE COSTS
(Based on recommended configuration for a 2 airport Destination )
Without Scanning – US$ 10k – 12k
With Scanning – US$ 20K

28
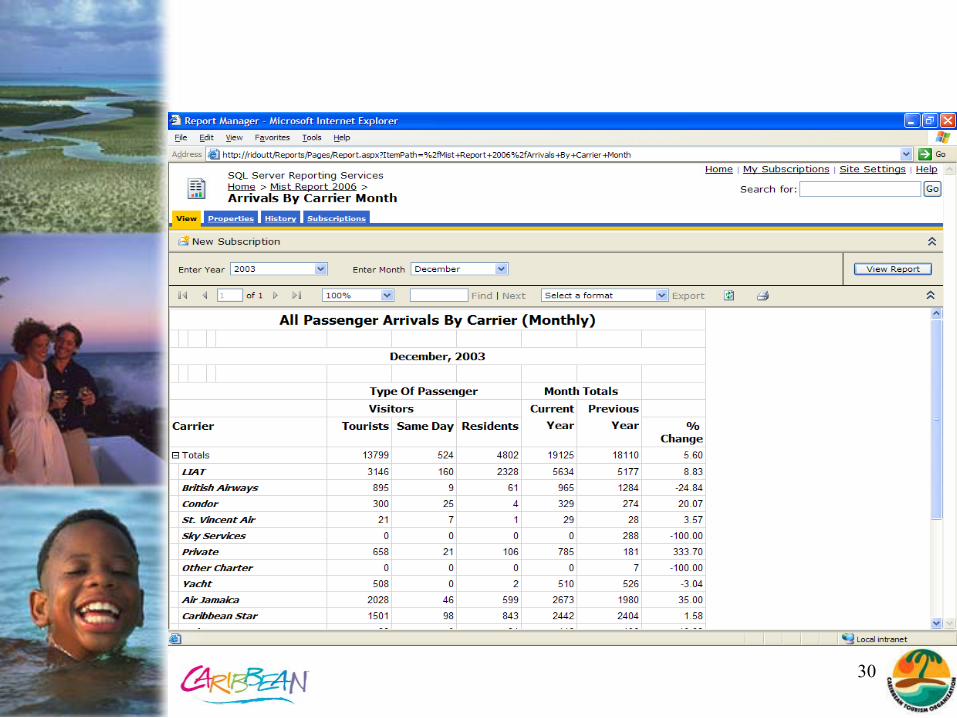
STANDARD REPORTS
29
30

31
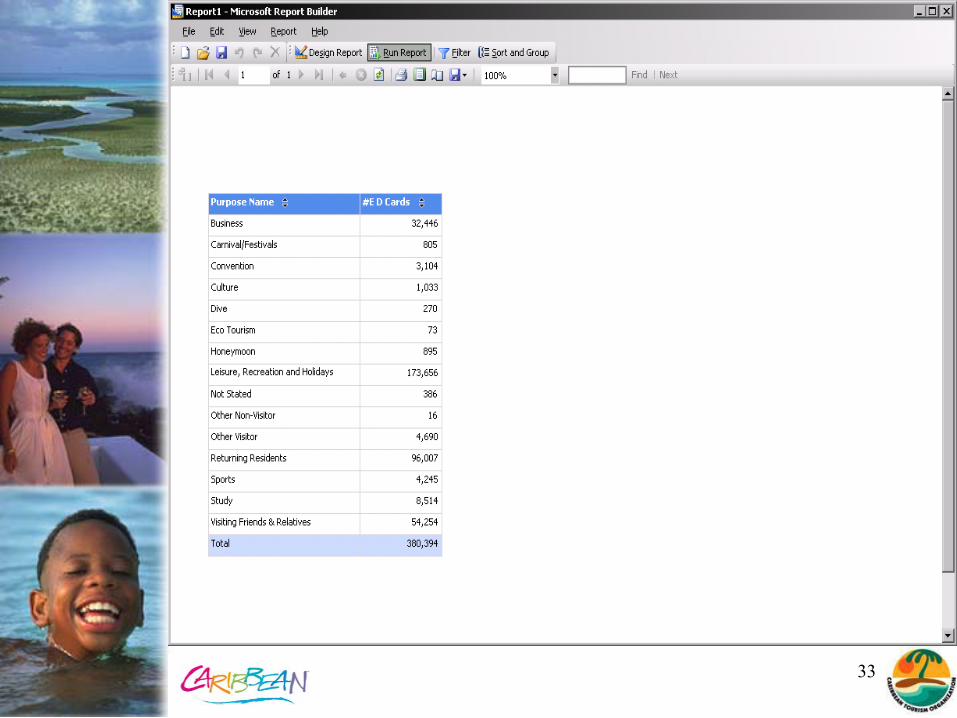
REPORT BUILDER Ad Hoc Reporting
32
33
34
WHERE ARE WE?
DEVELOPMENT COMPLETE !
In House Final Testing Finished“Country Panel Testing” completed Pre Installation “Live In-Country Test “-November 2006Country Customisation / Installation commenced January 2007
35
WHERE ARE WE?
MIST is installed in 12 countries;Jamaica uses the scanning optionBarbados imports from a data file (implementation in progress)
Invitation extended to other members to use MIST (in progress)
Introduced Ongoing Support and Maintenance – Initially to be
Call Centre & Hand Holding ~ CTOTechnical Maintenance Outsourced on “shared cost basis”
Recommended