YEARBOOK 2018TOURISM
Tourism YEARBOOK 2018 Ministry of Tourism Republic of Maldives
ii
Copyright ©Ministry of Tourism, 2018 Tourism Yearbook 2018 Produced and Published by; Statistics & Research Section Ministry of Tourism 5th Floor, Velaanaage Ameer Ahmed Magu Male’ 20094 Republic of Maldives Tel: +960 3022 200 Fax: +960 332 2512 E-mail: [email protected] Website: www.tourism.gov.mv Data Compilation & Verification: Statistics & Research Section Ministry of Tourism Layout & Design: Statistics & Research Section Ministry of Tourism
iii
Except where otherwise indicated, data used in this publication have been collected from relevant Government Authorities and the Maldives tourism industry. The Ministry of Tourism wishes to express its gratitude to the following government institutions for their contribution in the compilation of this publication;
Ministry of Finance and Treasury Maldives Emigration National Bureau of Statistics Maldives Inland Revenue Authority Maldives Monetary Authority Maldives Customs Services Faculty of Hospitality and Tourism Studies / Maldives National University
Ministry of Tourism also acknowledges with appreciation the Maldives tourism industry for their continued cooperation and assistance in the compilation of data for this publication.
ACKNOWLEDGEMENTS
iv
INTRODUCTION
Tourism Yearbook 2018 has been produced and published by the Statistics & Research Section of the Ministry of Tourism. This publication briefly presents the overall performance of the tourism industry of the Maldives through 2013 to 2017. This publication is divided into 6 sections
1. Tourist Accommodation 2. Tourist Arrival Trends 3. Economic Indicators 4. Airline Statistics 5. Additional Tables 6. Tourism Highlights 2017
Each section provides important data and information. Together, the sections provide a comprehensive picture of tourism in the Maldives.
v
Table of Contents Acknowledgements.......................................................................................................................... iii Introduction .......................................................................................................................................................... iv SECTION 1 - TOURIST ACCOMMODATION 1.1 Accommodation Facilities ………………………………..………………………………………………………..….……….1
Table 1: Accommodation Establishments & Bed Capacity, 2013 - 2017 .............................1 1.2 Distribution of Accommodation Facilities by Atolls …………………………………………………………………3
Table 2: Accommodation Facilities by Atolls, 2017.…...........................................................3 1.3 Capacity & Utilization ……………………………………………………………………………………………………...……..3
Table 3: Bed Nights, Occupancy Rate & Average Duration of Stay, 2013 - 2017...................4 Figure 1: Bed Nights vs. Occupancy Rate, 2013 - 2017 ……….………...………………………………….5 Table 4: Occupancy Rates of Resorts & Hotels by Month, 2013 – 2017 ...............................5
SECTION 2 - TOURIST ARRIVAL TRENDS 2.1 Global Arrival Trends ..................................................................................................................7
Table 5: International Tourist Arrivals Worldwide, 2013 - 2017 ..........................................7 2.2 Maldives Arrival Trends ………......................................................................................................8
Table 6: Monthly Arrivals to the Maldives, 2013 - 2017 ......................................................8 2.3 Tourist Arrivals by Regions ………................................................................................................ 9
Figure 2: Market Share by Regions, 2013 - 2017 .................................................................9 2.4 Top Ten Markets, 2017 .............................................................................................................11
Table 7: Tourist Arrivals and Market Share of Top Ten Markets, 2017 ...............................11 2.4.1. China…………………………………………………………….………………………………….……..………..12
Table 8: Chinese Arrivals and Growth Rate, 2013 - 2017 ………………………………………….…...12 Figure 3: Chinese Arrivals & Market Share, 2013 - 2017 …………….......................................12 Figure 4: Chinese Monthly Arrival Trends, 2013 - 2017 .......................................................12
2.4.2. Germany ……………………………..……………………………………………………………………………13 Table 9: German Arrivals and Growth Rate, 2013 - 2017 ……………………………………………....13 Figure 5: German Arrivals & Market Share, 2013 - 2017 ………………….................................13 Figure 6: German Monthly Arrival Trends, 2013 - 2017.......................................................13
2.4.3. United Kingdom (U.K.) ……………………………..………………………………………………..………14 Table 10: U.K. Arrivals and Growth Rate, 2013 - 2017 …………………………………………………...14 Figure 7: U.K. Arrivals & Market Share, 2013 - 2017 ………………….......................................14 Figure 8: U.K. Monthly Arrival Trends, 2013 - 2017............................................................14
2.4.4. Italy ……………………………..…………………………………………………………………………..………15 Table 11: Italian Arrivals and Growth Rate, 2013 - 2017 ………………………………………….……..15 Figure 9: Italian Arrivals & Market Share, 2013 - 2017 …………………...................................15 Figure 10: Italian Monthly Arrival Trends, 2013 - 2017.......................................................15
2.4.5. India ………..………………….…………………………….……………………………………………..………16 Table 12: Indian Arrivals and Growth Rate, 2013 - 2017 ………………………………………………...16 Figure 11: Indian Arrivals & Market Share, 2013 - 2017 …………………...................................16 Figure 12: Indian Monthly Arrival Trends, 2013 - 2017.......................................................16
2.4.6. Russia ……………………………..………………………………….………………………………..……..……17 Table 13: Russian Arrivals and Growth Rate, 2013 - 2017 ……………………………………………...17 Figure 13: Russian Arrivals & Market Share, 2013 - 2017 …………………................................17 Figure 14: Russian Monthly Arrival Trends, 2013 - 2017......................................................17
vi
2.4.7. France ……………………………..………………………………………………………………….…..……… 18 Table 14: French Arrivals and Growth Rate, 2013 - 2017 ………………………………………………...18 Figure 15: French Arrivals & Market Share, 2013 - 2017 …………………..................................18 Figure 16: French Monthly Arrival Trends, 2013 - 2017.......................................................18
2.4.8. Japan ……………………………..………………..…………………………….……………………..…..…… 19 Table 15: Japanese Arrivals and Growth Rate, 2013 - 2017 …………………………………………...19 Figure 17: Japanese Arrivals & Market Share, 2013 - 2017 ………………….............................19 Figure 18: German Monthly Arrival Trends, 2013 - 2017.....................................................19
2.4.9. U.S.A ……………………………..…………………………………………………………….…………..………20 Table 16: U.S.A Arrivals and Growth Rate, 2013 - 2017 ………………………………………….….....20 Figure 19: U.S.A Arrivals & Market Share, 2013 - 2017 …………………...................................20 Figure 20: U.S.A Monthly Arrival Trends, 2013 - 2017........................................................20
2.4.10. Korea ……………………………..………………………………….……………………………………..………21 Table 17: Korean Arrivals and Growth Rate, 2013 - 2017 ……………………………………………...21 Figure 21: Korean Arrivals & Market Share, 2013 - 2017 …………………................................21 Figure 22: Korean Monthly Arrival Trends, 2013 - 2017.....................................................21
SECTION 3 - ECONOMIC INDICATORS 3.1 Tourism Contribution to GDP ……………………………………………………………………………………………… 23
Figure 23: GDP Contribution by Major Economic Sectors of Maldives, 2017 ……………….. 23 Table 18: Tourism Contribution to GDP, 2013 - 2017 ....................................................... 23
3.2 Tourism Revenue ……………………………………………………………………...…………………………………….…. 24 Table 19: Tourism Revenue, 2013 - 2017 ..........................................................................24
3.3 Tourism Receipts …………………………………………………………………………………………………….……………25 Table 20: Tourism Receipts, 2013 - 2017 ...........................................................................25
3.4 Tourism Expenditure ……………………………………………………………………………………………….…………. 25 Table 21: Government Expenditure on Tourism, 2013 - 2017 ..........................................25
SECTION 4 - AIRLINE STATISTICS 4.1 Traffic by Domestic Carriers …………….……………………………………..……………………………………..…….27
Table 22: Passenger Arrivals by Domestic Carriers, 2013 - 2017 ………………………..............27 4.2 Traffic by International Carriers ……………………………………………………………………………………..……27
Table 23: International Carriers by Type, 2013 - 2017 ......................................................27 Table 24: Passenger Arrivals by International Scheduled Carriers, 2013 - 2017 ...............27
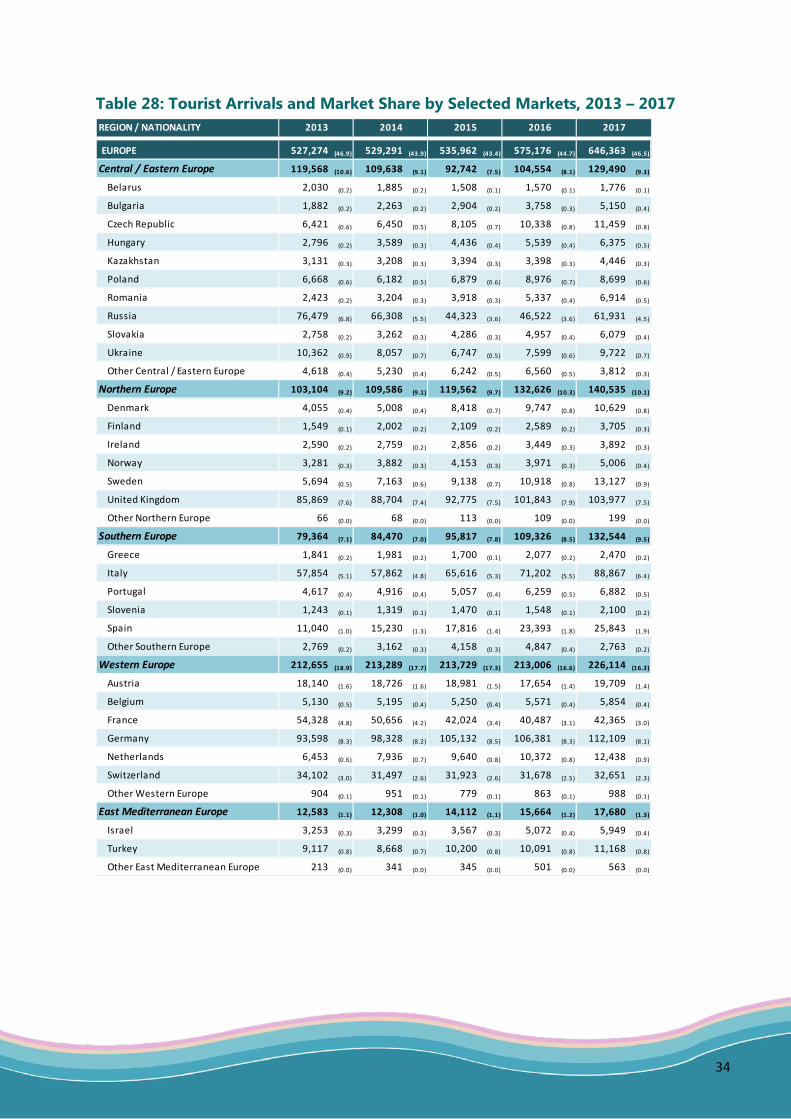
SECTION 5 - ADDITIONAL TABLES Table 25: Bed Capacity of Tourist Resorts, 2013 - 2017..................................................................29 Table 26: Distribution of Resorts by Atolls, 2013 - 2017 ................................................................32 Table 27: Bed Capacity of Tourist Hotels, 2013 - 2017 ...................................................................33 Table 28: Tourist Arrivals & Market Share by Selected Markets, 2013 - 2017 ...............................34 Table 29: Growth Trends of Selected Markets, 2013 - 2017...........................................................36 Table 30: Tourist Arrivals by Gender, 2013 - 2017 ……………………………………………………………….…... 38 Table 31: Seasonal Variation of Tourist Arrivals, 2013 - 2017 ........................................................38 Table 32: Inbound and Outbound Travel, 2013 - 2017 ………………………………………………….….…..…. 38 Table 33: Graduates from Faculty of Hospitality & Tourism Industry, 2013 - 2017 .......................38 Table 34: Tourist Arrivals by Nationality at end September 2018 .................................................39 Table 35: Tourism Indicators, end September 2018 ......................................................................41 SECTION 6 - TOURISM HIGHLIGHTS, 2017………………………………….………………………………..…………... 43
SECTION 1
TOURIST ACCOMMODATION
1
1.1- Accommodation Facilities
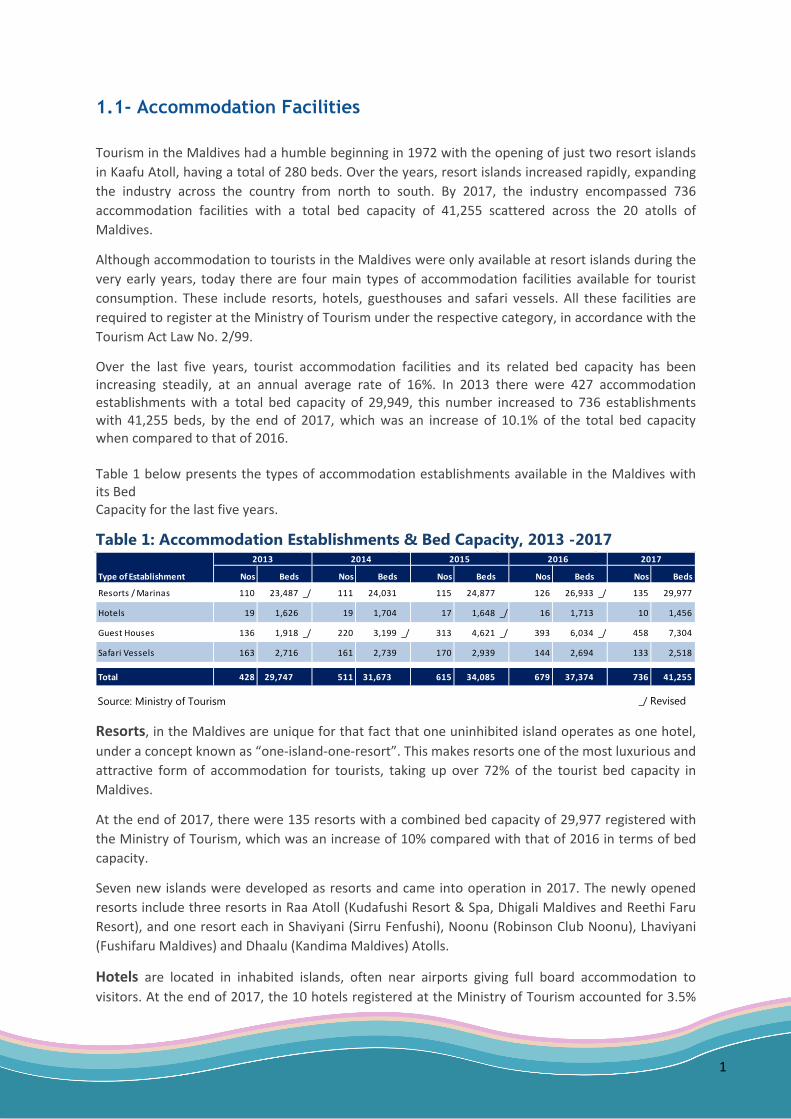
Tourism in the Maldives had a humble beginning in 1972 with the opening of just two resort islands in Kaafu Atoll, having a total of 280 beds. Over the years, resort islands increased rapidly, expanding the industry across the country from north to south. By 2017, the industry encompassed 736 accommodation facilities with a total bed capacity of 41,255 scattered across the 20 atolls of Maldives.
Although accommodation to tourists in the Maldives were only available at resort islands during the very early years, today there are four main types of accommodation facilities available for tourist consumption. These include resorts, hotels, guesthouses and safari vessels. All these facilities are required to register at the Ministry of Tourism under the respective category, in accordance with the Tourism Act Law No. 2/99.
Over the last five years, tourist accommodation facilities and its related bed capacity has been increasing steadily, at an annual average rate of 16%. In 2013 there were 427 accommodation establishments with a total bed capacity of 29,949, this number increased to 736 establishments with 41,255 beds, by the end of 2017, which was an increase of 10.1% of the total bed capacity when compared to that of 2016.
Table 1 below presents the types of accommodation establishments available in the Maldives with its Bed Capacity for the last five years.
Table 1: Accommodation Establishments & Bed Capacity, 2013 -2017
Resorts, in the Maldives are unique for that fact that one uninhibited island operates as one hotel, under a concept known as “one-island-one-resort”. This makes resorts one of the most luxurious and attractive form of accommodation for tourists, taking up over 72% of the tourist bed capacity in Maldives.
At the end of 2017, there were 135 resorts with a combined bed capacity of 29,977 registered with the Ministry of Tourism, which was an increase of 10% compared with that of 2016 in terms of bed capacity.
Seven new islands were developed as resorts and came into operation in 2017. The newly opened resorts include three resorts in Raa Atoll (Kudafushi Resort & Spa, Dhigali Maldives and Reethi Faru Resort), and one resort each in Shaviyani (Sirru Fenfushi), Noonu (Robinson Club Noonu), Lhaviyani (Fushifaru Maldives) and Dhaalu (Kandima Maldives) Atolls.
Hotels are located in inhabited islands, often near airports giving full board accommodation to visitors. At the end of 2017, the 10 hotels registered at the Ministry of Tourism accounted for 3.5%
Source: Ministry of Tourism
2013 2014 2015 2016 2017
Type of Establishment Nos Beds Nos Beds Nos Beds Nos Beds Nos Beds
Resorts / Marinas 110 23,487 _/ 111 24,031 115 24,877 126 26,933 _/ 135 29,977
Hotels 19 1,626 19 1,704 17 1,648 _/ 16 1,713 10 1,456
Guest Houses 136 1,918 _/ 220 3,199 _/ 313 4,621 _/ 393 6,034 _/ 458 7,304
Safari Vessels 163 2,716 161 2,739 170 2,939 144 2,694 133 2,518
Total 428 29,747 511 31,673 615 34,085 679 37,374 736 41,255
_/ Revised
2
of the total tourist bed capacity in Maldives. During the year 3 hotels shut down its operation and one hotel transformed into a guest house. Nevertheless one of the highlights of the hotel sector in 2017 was the opening of the Mercure Maldives Koodoo at Gaafu Alifu Koodoo with 136 beds.
Guest Houses sector has bloomed rapidly over the last 8 years. Mostly offering bed and breakfast to its visitors, the sector grew from just about 25 establishments located in the capital, Male’ in 2010 to over 450 establishments in 87 inhabited islands across the country. Guesthouses provide ideal accommodation facilities for mid to low market segments with a blend of island life. While 143 new guesthouses were registered in 2017, the bed capacity saw an increase of 21% from 6,044 in 2016 to 7,304 at the end of 2017. Guesthouses accounted for 18% of the total bed capacity of Maldives in 2017.
Safari Vessels are live-aboard floating beds providing accommodation facilities on board with amenities. These boats are equipped with professional diving equipment and qualified diving instructors. Furthermore, these vessels cruise around Maldives stopping over at different dive locations and uninhabited islands. Hence safari vessels are mostly opted and popular amongst divers. While Safari vessels accounted for 6% of the total bed capacity, 2017 concluded with 133 safari vessels with 2518 beds cruising around in the Maldives.
3
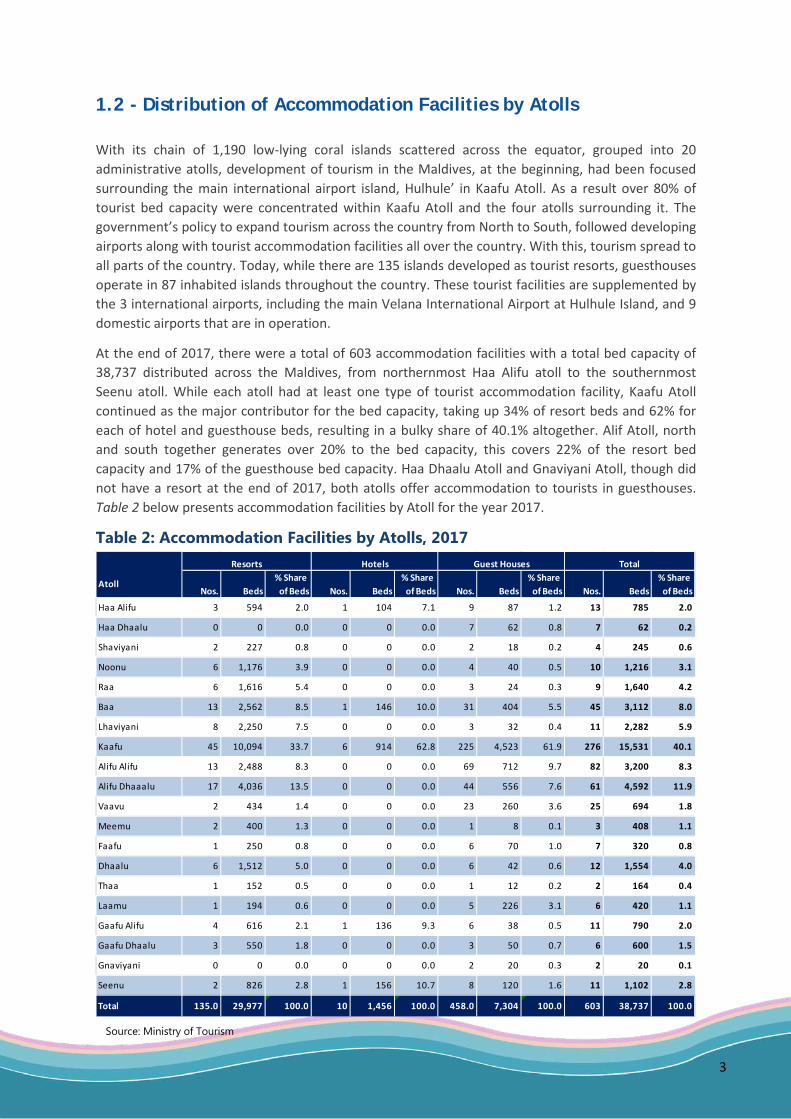
1.2 - Distribution of Accommodation Facilities by Atolls With its chain of 1,190 low-lying coral islands scattered across the equator, grouped into 20 administrative atolls, development of tourism in the Maldives, at the beginning, had been focused surrounding the main international airport island, Hulhule’ in Kaafu Atoll. As a result over 80% of tourist bed capacity were concentrated within Kaafu Atoll and the four atolls surrounding it. The government’s policy to expand tourism across the country from North to South, followed developing airports along with tourist accommodation facilities all over the country. With this, tourism spread to all parts of the country. Today, while there are 135 islands developed as tourist resorts, guesthouses operate in 87 inhabited islands throughout the country. These tourist facilities are supplemented by the 3 international airports, including the main Velana International Airport at Hulhule Island, and 9 domestic airports that are in operation.
At the end of 2017, there were a total of 603 accommodation facilities with a total bed capacity of 38,737 distributed across the Maldives, from northernmost Haa Alifu atoll to the southernmost Seenu atoll. While each atoll had at least one type of tourist accommodation facility, Kaafu Atoll continued as the major contributor for the bed capacity, taking up 34% of resort beds and 62% for each of hotel and guesthouse beds, resulting in a bulky share of 40.1% altogether. Alif Atoll, north and south together generates over 20% to the bed capacity, this covers 22% of the resort bed capacity and 17% of the guesthouse bed capacity. Haa Dhaalu Atoll and Gnaviyani Atoll, though did not have a resort at the end of 2017, both atolls offer accommodation to tourists in guesthouses. Table 2 below presents accommodation facilities by Atoll for the year 2017.
Table 2: Accommodation Facilities by Atolls, 2017
Resorts Hotels Guest Houses Total
AtollNos. Beds
% Share of Beds Nos. Beds
% Share of Beds Nos. Beds
% Share of Beds Nos. Beds
% Share of Beds
Haa Alifu 3 594 2.0 1 104 7.1 9 87 1.2 13 785 2.0
Haa Dhaalu 0 0 0.0 0 0 0.0 7 62 0.8 7 62 0.2
Shaviyani 2 227 0.8 0 0 0.0 2 18 0.2 4 245 0.6
Noonu 6 1,176 3.9 0 0 0.0 4 40 0.5 10 1,216 3.1
Raa 6 1,616 5.4 0 0 0.0 3 24 0.3 9 1,640 4.2
Baa 13 2,562 8.5 1 146 10.0 31 404 5.5 45 3,112 8.0
Lhaviyani 8 2,250 7.5 0 0 0.0 3 32 0.4 11 2,282 5.9
Kaafu 45 10,094 33.7 6 914 62.8 225 4,523 61.9 276 15,531 40.1
Alifu Alifu 13 2,488 8.3 0 0 0.0 69 712 9.7 82 3,200 8.3
Alifu Dhaaalu 17 4,036 13.5 0 0 0.0 44 556 7.6 61 4,592 11.9
Vaavu 2 434 1.4 0 0 0.0 23 260 3.6 25 694 1.8
Meemu 2 400 1.3 0 0 0.0 1 8 0.1 3 408 1.1
Faafu 1 250 0.8 0 0 0.0 6 70 1.0 7 320 0.8
Dhaalu 6 1,512 5.0 0 0 0.0 6 42 0.6 12 1,554 4.0
Thaa 1 152 0.5 0 0 0.0 1 12 0.2 2 164 0.4
Laamu 1 194 0.6 0 0 0.0 5 226 3.1 6 420 1.1
Gaafu Alifu 4 616 2.1 1 136 9.3 6 38 0.5 11 790 2.0
Gaafu Dhaalu 3 550 1.8 0 0 0.0 3 50 0.7 6 600 1.5
Gnaviyani 0 0 0.0 0 0 0.0 2 20 0.3 2 20 0.1
Seenu 2 826 2.8 1 156 10.7 8 120 1.6 11 1,102 2.8
Total 135.0 29,977 100.0 10 1,456 100.0 458.0 7,304 100.0 603 38,737 100.0
Source: Ministry of Tourism
4
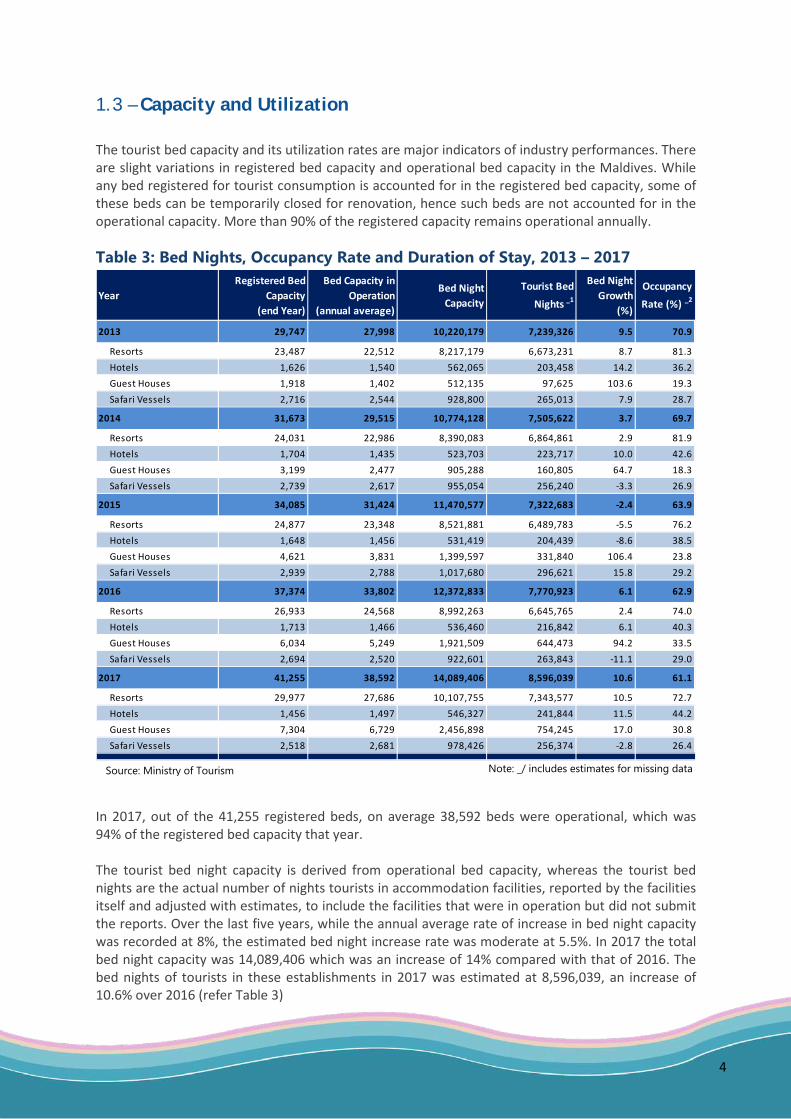
1.3 – Capacity and Utilization The tourist bed capacity and its utilization rates are major indicators of industry performances. There are slight variations in registered bed capacity and operational bed capacity in the Maldives. While any bed registered for tourist consumption is accounted for in the registered bed capacity, some of these beds can be temporarily closed for renovation, hence such beds are not accounted for in the operational capacity. More than 90% of the registered capacity remains operational annually. Table 3: Bed Nights, Occupancy Rate and Duration of Stay, 2013 – 2017 In 2017, out of the 41,255 registered beds, on average 38,592 beds were operational, which was 94% of the registered bed capacity that year. The tourist bed night capacity is derived from operational bed capacity, whereas the tourist bed nights are the actual number of nights tourists in accommodation facilities, reported by the facilities itself and adjusted with estimates, to include the facilities that were in operation but did not submit the reports. Over the last five years, while the annual average rate of increase in bed night capacity was recorded at 8%, the estimated bed night increase rate was moderate at 5.5%. In 2017 the total bed night capacity was 14,089,406 which was an increase of 14% compared with that of 2016. The bed nights of tourists in these establishments in 2017 was estimated at 8,596,039, an increase of 10.6% over 2016 (refer Table 3)
YearRegistered Bed
Capacity (end Year)
Bed Capacity in Operation
(annual average)
Bed Night Capacity
Tourist Bed
Nights _1
Bed Night Growth
(%)
Occupancy
Rate (%) _2
2013 29,747 27,998 10,220,179 7,239,326 9.5 70.9
Resorts 23,487 22,512 8,217,179 6,673,231 8.7 81.3Hotels 1,626 1,540 562,065 203,458 14.2 36.2Guest Houses 1,918 1,402 512,135 97,625 103.6 19.3Safari Vessels 2,716 2,544 928,800 265,013 7.9 28.7
2014 31,673 29,515 10,774,128 7,505,622 3.7 69.7
Resorts 24,031 22,986 8,390,083 6,864,861 2.9 81.9Hotels 1,704 1,435 523,703 223,717 10.0 42.6Guest Houses 3,199 2,477 905,288 160,805 64.7 18.3Safari Vessels 2,739 2,617 955,054 256,240 -3.3 26.9
2015 34,085 31,424 11,470,577 7,322,683 -2.4 63.9
Resorts 24,877 23,348 8,521,881 6,489,783 -5.5 76.2Hotels 1,648 1,456 531,419 204,439 -8.6 38.5Guest Houses 4,621 3,831 1,399,597 331,840 106.4 23.8Safari Vessels 2,939 2,788 1,017,680 296,621 15.8 29.2
2016 37,374 33,802 12,372,833 7,770,923 6.1 62.9
Resorts 26,933 24,568 8,992,263 6,645,765 2.4 74.0Hotels 1,713 1,466 536,460 216,842 6.1 40.3Guest Houses 6,034 5,249 1,921,509 644,473 94.2 33.5Safari Vessels 2,694 2,520 922,601 263,843 -11.1 29.0
2017 41,255 38,592 14,089,406 8,596,039 10.6 61.1
Resorts 29,977 27,686 10,107,755 7,343,577 10.5 72.7Hotels 1,456 1,497 546,327 241,844 11.5 44.2Guest Houses 7,304 6,729 2,456,898 754,245 17.0 30.8Safari Vessels 2,518 2,681 978,426 256,374 -2.8 26.4
Source: Ministry of Tourism Note: _/ includes estimates for missing data
5
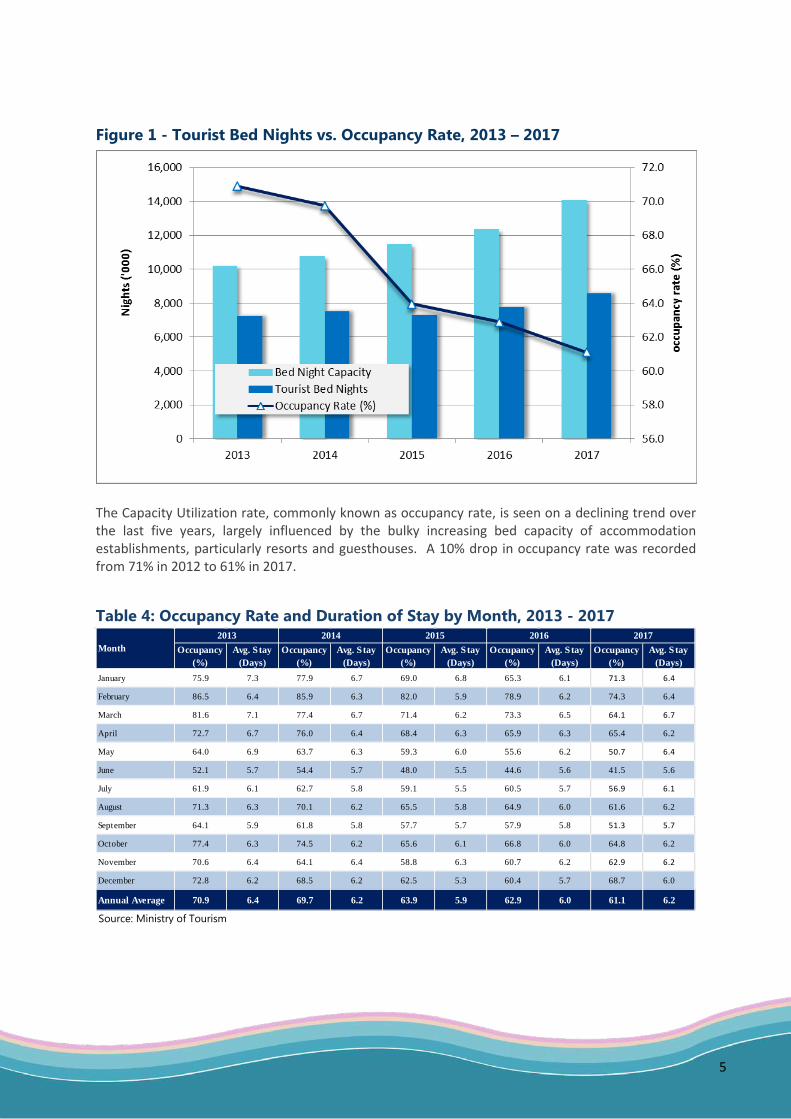
Figure 1 - Tourist Bed Nights vs. Occupancy Rate, 2013 – 2017
The Capacity Utilization rate, commonly known as occupancy rate, is seen on a declining trend over the last five years, largely influenced by the bulky increasing bed capacity of accommodation establishments, particularly resorts and guesthouses. A 10% drop in occupancy rate was recorded from 71% in 2012 to 61% in 2017.
Table 4: Occupancy Rate and Duration of Stay by Month, 2013 - 2017
Occupancy (%)
Avg. Stay (Days)
Occupancy (%)
Avg. Stay (Days)
Occupancy (%)
Avg. Stay (Days)
Occupancy (%)
Avg. Stay (Days)
Occupancy (%)
Avg. Stay (Days)
January 75.9 7.3 77.9 6.7 69.0 6.8 65.3 6.1 71.3 6.4
February 86.5 6.4 85.9 6.3 82.0 5.9 78.9 6.2 74.3 6.4
March 81.6 7.1 77.4 6.7 71.4 6.2 73.3 6.5 64.1 6.7
April 72.7 6.7 76.0 6.4 68.4 6.3 65.9 6.3 65.4 6.2
May 64.0 6.9 63.7 6.3 59.3 6.0 55.6 6.2 50.7 6.4
June 52.1 5.7 54.4 5.7 48.0 5.5 44.6 5.6 41.5 5.6
July 61.9 6.1 62.7 5.8 59.1 5.5 60.5 5.7 56.9 6.1
August 71.3 6.3 70.1 6.2 65.5 5.8 64.9 6.0 61.6 6.2
September 64.1 5.9 61.8 5.8 57.7 5.7 57.9 5.8 51.3 5.7
October 77.4 6.3 74.5 6.2 65.6 6.1 66.8 6.0 64.8 6.2
November 70.6 6.4 64.1 6.4 58.8 6.3 60.7 6.2 62.9 6.2
December 72.8 6.2 68.5 6.2 62.5 5.3 60.4 5.7 68.7 6.0
Annual Average 70.9 6.4 69.7 6.2 63.9 5.9 62.9 6.0 61.1 6.2
2017Month
2013 2014 2015 2016
Source: Ministry of Tourism
6
The monthly pattern of average occupancy rates of tourist establishments and average duration of stay over the last five years are presented in Table 4. As seen from the table, the Maldives experience, high occupancy rates through September till April. Lower rates are recoded through May till August. The European holiday season contributes greatly to this seasonality in the Maldives, as a high percent of tourist arrivals to the Maldives is dominated by European markets. Results for the month of February are further enhanced by the Chinese New Year holidays, complementing the tourist arrivals, occupancy rate as well as the duration of stay of the Maldives for the month (refer Table 4) The year 2017 started with strong results, with January and February demonstrating peak occupancy rates of 71.3% and 74.3% respectively. But from the month of March, Maldives started experiencing low rates of occupancy before rebounding in October. The month of June record the lowest occupancy over the past five years. The average duration of stay fluctuated similarly during 2017. Tourists stayed the longest at the first quarter of the year and softened during the second and third quarter. The average duration of stay of tourists rose from 6.0 in 2016 to 6.2 days at the end of 2017. The recovery of European market accounted for this upturn.
SECTION 2
TOURIST ARRIVAL TRENDS
7
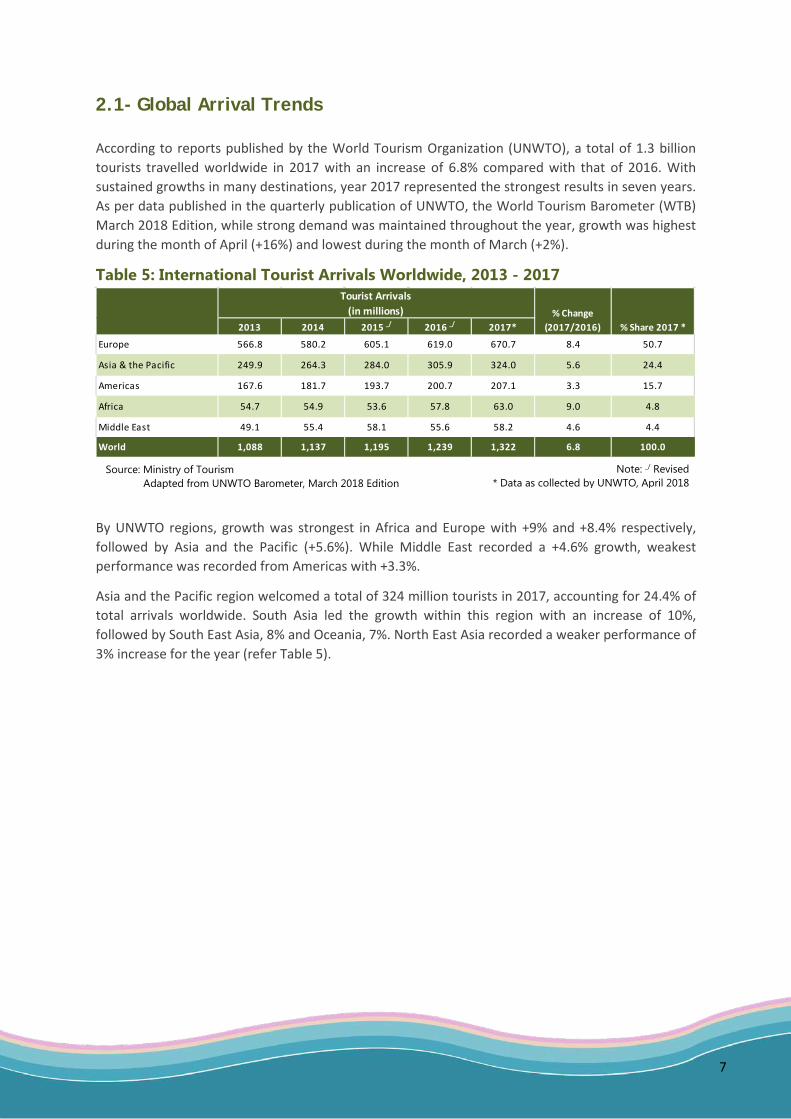
2.1- Global Arrival Trends According to reports published by the World Tourism Organization (UNWTO), a total of 1.3 billion tourists travelled worldwide in 2017 with an increase of 6.8% compared with that of 2016. With sustained growths in many destinations, year 2017 represented the strongest results in seven years. As per data published in the quarterly publication of UNWTO, the World Tourism Barometer (WTB) March 2018 Edition, while strong demand was maintained throughout the year, growth was highest during the month of April (+16%) and lowest during the month of March (+2%).
Table 5: International Tourist Arrivals Worldwide, 2013 - 2017
By UNWTO regions, growth was strongest in Africa and Europe with +9% and +8.4% respectively, followed by Asia and the Pacific (+5.6%). While Middle East recorded a +4.6% growth, weakest performance was recorded from Americas with +3.3%.
Asia and the Pacific region welcomed a total of 324 million tourists in 2017, accounting for 24.4% of total arrivals worldwide. South Asia led the growth within this region with an increase of 10%, followed by South East Asia, 8% and Oceania, 7%. North East Asia recorded a weaker performance of 3% increase for the year (refer Table 5).
Source: Ministry of Tourism Adapted from UNWTO Barometer, March 2018 Edition
Note: _/ Revised * Data as collected by UNWTO, April 2018
Tourist Arrivals(in millions)
2013 2014 2015 _/ 2016 _/ 2017*
Europe 566.8 580.2 605.1 619.0 670.7 8.4 50.7
Asia & the Pacific 249.9 264.3 284.0 305.9 324.0 5.6 24.4
Americas 167.6 181.7 193.7 200.7 207.1 3.3 15.7
Africa 54.7 54.9 53.6 57.8 63.0 9.0 4.8
Middle East 49.1 55.4 58.1 55.6 58.2 4.6 4.4
World 1,088 1,137 1,195 1,239 1,322 6.8 100.0
% Change (2017/2016) % Share 2017 *
8
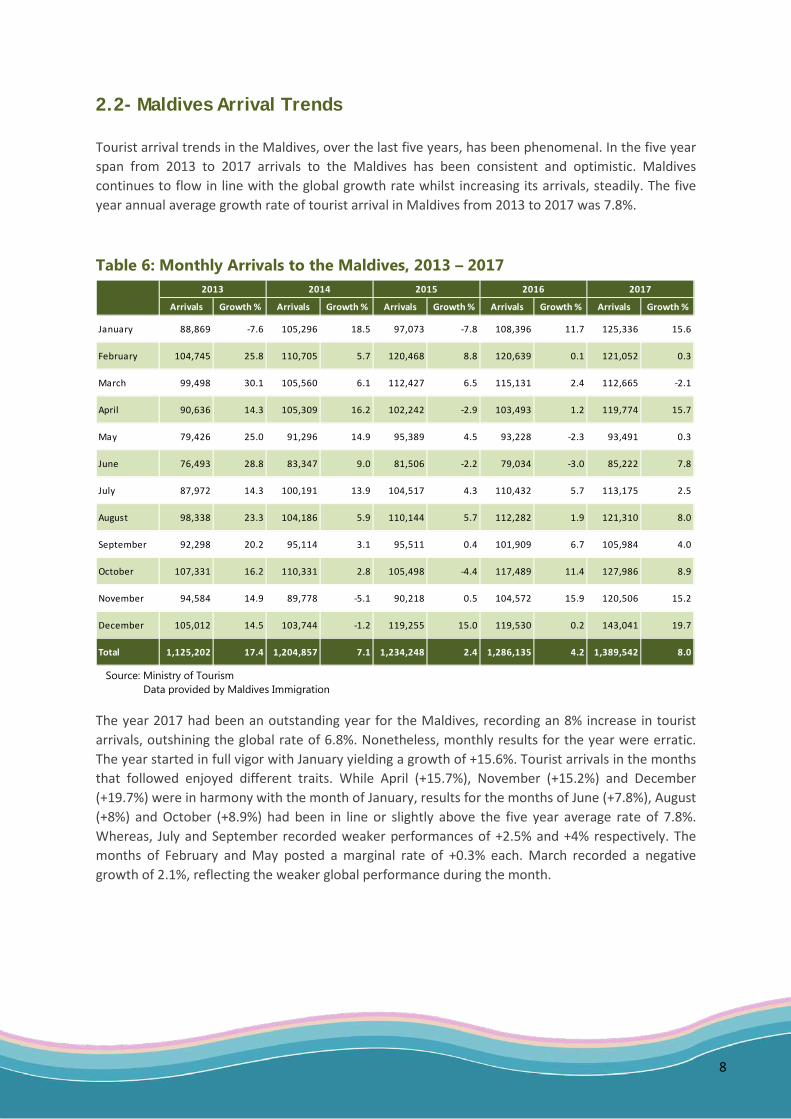
2.2- Maldives Arrival Trends Tourist arrival trends in the Maldives, over the last five years, has been phenomenal. In the five year span from 2013 to 2017 arrivals to the Maldives has been consistent and optimistic. Maldives continues to flow in line with the global growth rate whilst increasing its arrivals, steadily. The five year annual average growth rate of tourist arrival in Maldives from 2013 to 2017 was 7.8%.
Table 6: Monthly Arrivals to the Maldives, 2013 – 2017
The year 2017 had been an outstanding year for the Maldives, recording an 8% increase in tourist arrivals, outshining the global rate of 6.8%. Nonetheless, monthly results for the year were erratic. The year started in full vigor with January yielding a growth of +15.6%. Tourist arrivals in the months that followed enjoyed different traits. While April (+15.7%), November (+15.2%) and December (+19.7%) were in harmony with the month of January, results for the months of June (+7.8%), August (+8%) and October (+8.9%) had been in line or slightly above the five year average rate of 7.8%. Whereas, July and September recorded weaker performances of +2.5% and +4% respectively. The months of February and May posted a marginal rate of +0.3% each. March recorded a negative growth of 2.1%, reflecting the weaker global performance during the month.
Source: Ministry of Tourism Data provided by Maldives Immigration
2013 2014 2015 2016 2017
Arrivals Growth % Arrivals Growth % Arrivals Growth % Arrivals Growth % Arrivals Growth %
January 88,869 -7.6 105,296 18.5 97,073 -7.8 108,396 11.7 125,336 15.6
February 104,745 25.8 110,705 5.7 120,468 8.8 120,639 0.1 121,052 0.3
March 99,498 30.1 105,560 6.1 112,427 6.5 115,131 2.4 112,665 -2.1
April 90,636 14.3 105,309 16.2 102,242 -2.9 103,493 1.2 119,774 15.7
May 79,426 25.0 91,296 14.9 95,389 4.5 93,228 -2.3 93,491 0.3
June 76,493 28.8 83,347 9.0 81,506 -2.2 79,034 -3.0 85,222 7.8
July 87,972 14.3 100,191 13.9 104,517 4.3 110,432 5.7 113,175 2.5
August 98,338 23.3 104,186 5.9 110,144 5.7 112,282 1.9 121,310 8.0
September 92,298 20.2 95,114 3.1 95,511 0.4 101,909 6.7 105,984 4.0
October 107,331 16.2 110,331 2.8 105,498 -4.4 117,489 11.4 127,986 8.9
November 94,584 14.9 89,778 -5.1 90,218 0.5 104,572 15.9 120,506 15.2
December 105,012 14.5 103,744 -1.2 119,255 15.0 119,530 0.2 143,041 19.7
Total 1,125,202 17.4 1,204,857 7.1 1,234,248 2.4 1,286,135 4.2 1,389,542 8.0
9
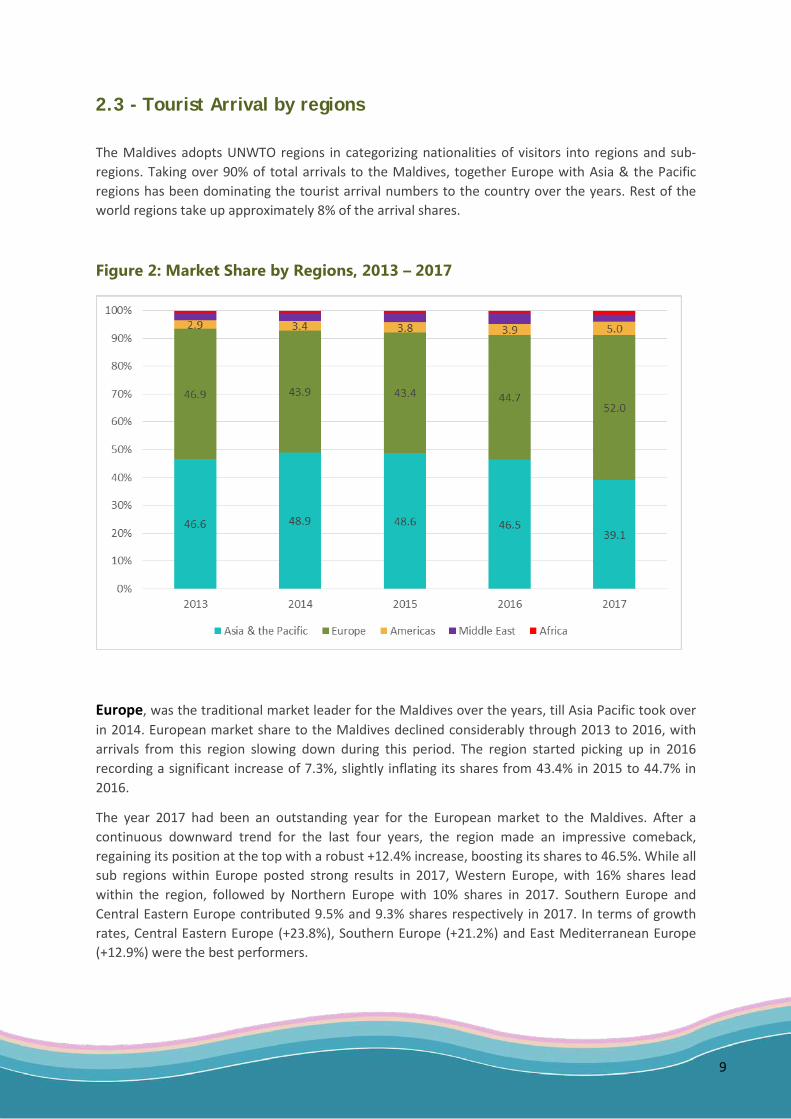
2.3 - Tourist Arrival by regions The Maldives adopts UNWTO regions in categorizing nationalities of visitors into regions and sub-regions. Taking over 90% of total arrivals to the Maldives, together Europe with Asia & the Pacific regions has been dominating the tourist arrival numbers to the country over the years. Rest of the world regions take up approximately 8% of the arrival shares.
Figure 2: Market Share by Regions, 2013 – 2017
Europe, was the traditional market leader for the Maldives over the years, till Asia Pacific took over in 2014. European market share to the Maldives declined considerably through 2013 to 2016, with arrivals from this region slowing down during this period. The region started picking up in 2016 recording a significant increase of 7.3%, slightly inflating its shares from 43.4% in 2015 to 44.7% in 2016.
The year 2017 had been an outstanding year for the European market to the Maldives. After a continuous downward trend for the last four years, the region made an impressive comeback, regaining its position at the top with a robust +12.4% increase, boosting its shares to 46.5%. While all sub regions within Europe posted strong results in 2017, Western Europe, with 16% shares lead within the region, followed by Northern Europe with 10% shares in 2017. Southern Europe and Central Eastern Europe contributed 9.5% and 9.3% shares respectively in 2017. In terms of growth rates, Central Eastern Europe (+23.8%), Southern Europe (+21.2%) and East Mediterranean Europe (+12.9%) were the best performers.
10
Asia & the Pacific lost its position to Europe and stepped down as the second tourist generating region to the Maldives in 2017. The market share of the region went down from a striking 46.6% in 2013, to 44.4% at the end of 2017. The region has been deteriorating since 2015 loosing on average 1.5% of its shares through 2015 to 2017. In spite of the declining shares, in 2017 this region enjoyed a positive growth of 3.2%.
The region grew at an average rate of 10.7% annually over the last five years, from 2013 to 2017. In 2017 Maldives received 617,099 tourists from this region. North East Asia was the leading sub region within this region with 28.3% shares, followed by South Asia with 8% shares. Best performer in terms of growth rate in 2017 was South East Asia with +21.4% increase compared with that of 2016. China, India, Japan and Korea were the major contributors from this region in 2017.
Americas was the third most tourist generating market region to the Maldives, with an average five year increase of 18.4%. Americas has been consistent in its robust growth during the last five year period, increasing its shares from 2.9% in 2013 to 4.5% in 2017. All major markets from this region posted positive growths during the year 2017, with Brazil registering the highest (40.9%).USA maintained its strong presence in this region accounting for 2.8% of the shares.
Middle East with double digit growth rates, was on a steady upward trend through 2013 till 2016 increasing its shares from 2.8% to 4.5%. The region, however recorded a negative growth of 4.2% during the year 2017, with its shares dropping to 3.5%. The slowdown of this region in 2017 was mainly due to the negative results recorded from its major performers such as Saudi Arabia, Qatar and Egypt. UAE performed extremely well in 2017 with a robust growth of +30.3%, increasing shares from 0.6% in 2016 to 0.8% in 2017.
African market to the Maldives though insignificant, remained stable over the last five years. Market share rose from 0.7% in 2013 to 1.1% by 2017. With a total of 14,678 tourists, Africa region registered a positive growth of 36.5% in 2017 compared with that of 2016.
11
2.4 - Top ten Markets, 2017
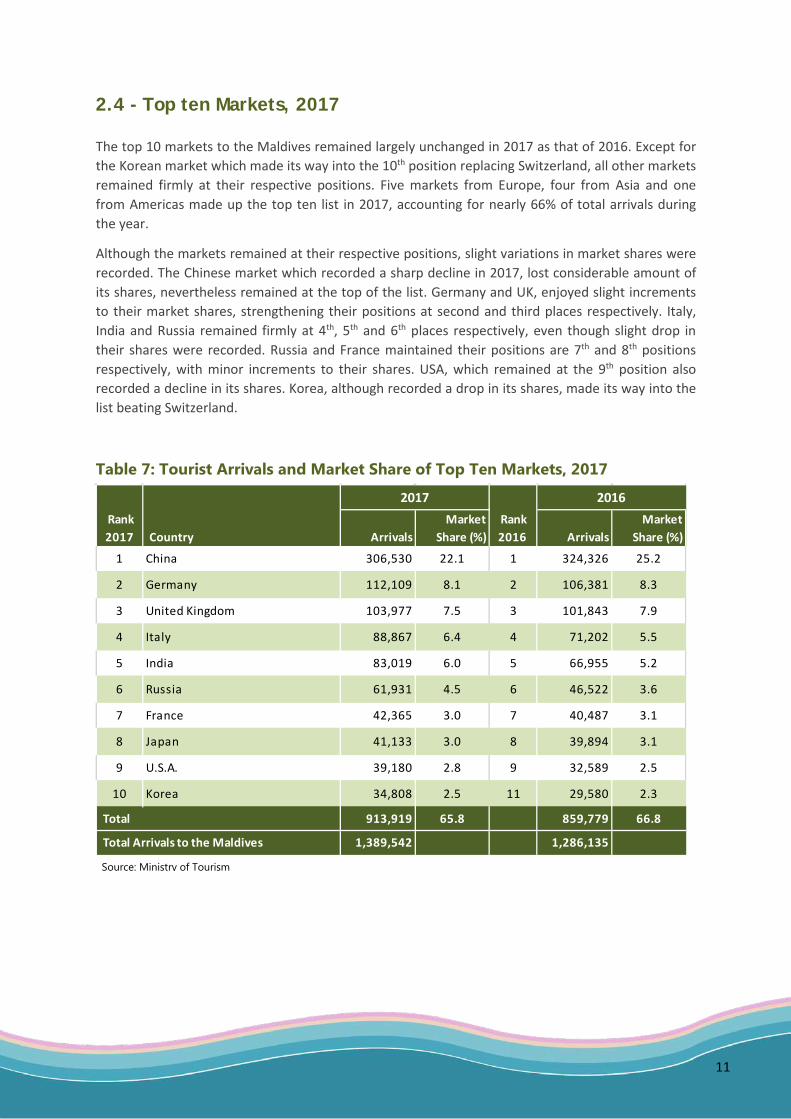
The top 10 markets to the Maldives remained largely unchanged in 2017 as that of 2016. Except for the Korean market which made its way into the 10th position replacing Switzerland, all other markets remained firmly at their respective positions. Five markets from Europe, four from Asia and one from Americas made up the top ten list in 2017, accounting for nearly 66% of total arrivals during the year.
Although the markets remained at their respective positions, slight variations in market shares were recorded. The Chinese market which recorded a sharp decline in 2017, lost considerable amount of its shares, nevertheless remained at the top of the list. Germany and UK, enjoyed slight increments to their market shares, strengthening their positions at second and third places respectively. Italy, India and Russia remained firmly at 4th, 5th and 6th places respectively, even though slight drop in their shares were recorded. Russia and France maintained their positions are 7th and 8th positions respectively, with minor increments to their shares. USA, which remained at the 9th position also recorded a decline in its shares. Korea, although recorded a drop in its shares, made its way into the list beating Switzerland.
Table 7: Tourist Arrivals and Market Share of Top Ten Markets, 2017
2017 2016 Rank 2017 Country Arrivals
Market Share (%)
Rank 2016 Arrivals
Market Share (%)
1 China 306,530 22.1 1 324,326 25.2
2 Germany 112,109 8.1 2 106,381 8.3
3 United Kingdom 103,977 7.5 3 101,843 7.9
4 Italy 88,867 6.4 4 71,202 5.5
5 India 83,019 6.0 5 66,955 5.2
6 Russia 61,931 4.5 6 46,522 3.6
7 France 42,365 3.0 7 40,487 3.1
8 Japan 41,133 3.0 8 39,894 3.1
9 U.S.A. 39,180 2.8 9 32,589 2.5
10 Korea 34,808 2.5 11 29,580 2.3
Total 913,919 65.8 859,779 66.8
Total Arrivals to the Maldives 1,389,542 1,286,135
Source: Ministry of Tourism
12
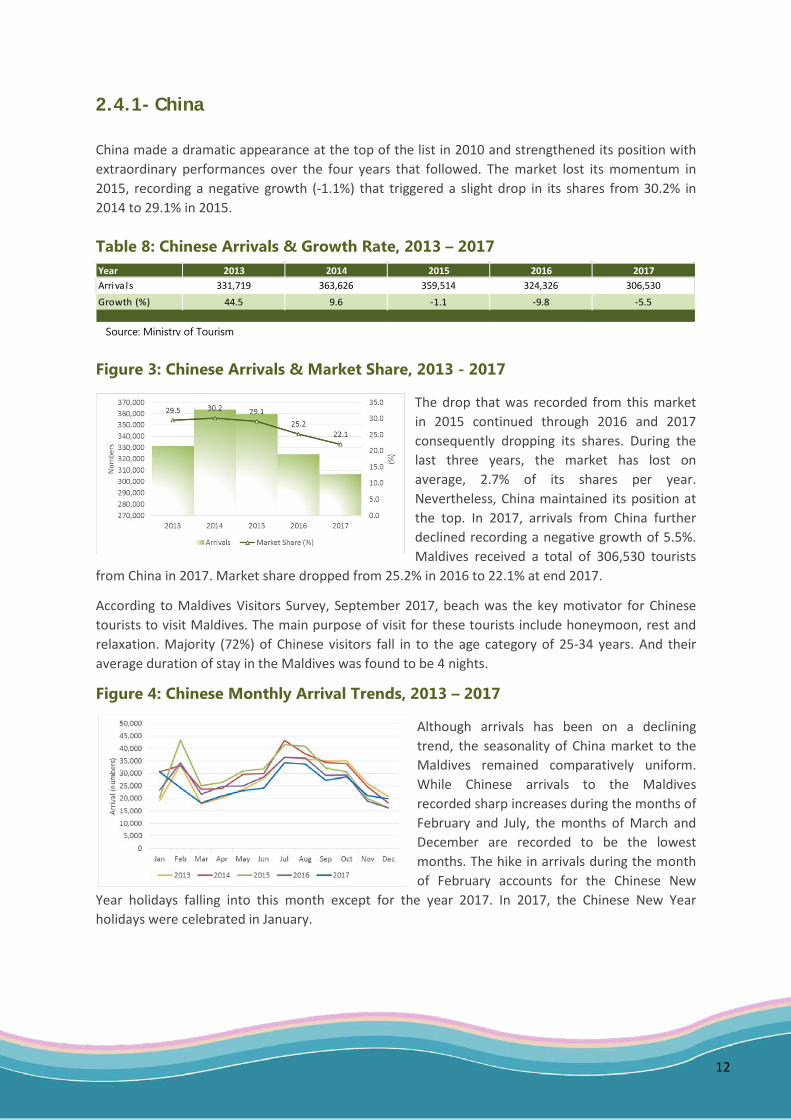
2.4.1- China China made a dramatic appearance at the top of the list in 2010 and strengthened its position with extraordinary performances over the four years that followed. The market lost its momentum in 2015, recording a negative growth (-1.1%) that triggered a slight drop in its shares from 30.2% in 2014 to 29.1% in 2015. Table 8: Chinese Arrivals & Growth Rate, 2013 – 2017
Figure 3: Chinese Arrivals & Market Share, 2013 - 2017
The drop that was recorded from this market in 2015 continued through 2016 and 2017 consequently dropping its shares. During the last three years, the market has lost on average, 2.7% of its shares per year. Nevertheless, China maintained its position at the top. In 2017, arrivals from China further declined recording a negative growth of 5.5%. Maldives received a total of 306,530 tourists
from China in 2017. Market share dropped from 25.2% in 2016 to 22.1% at end 2017.
According to Maldives Visitors Survey, September 2017, beach was the key motivator for Chinese tourists to visit Maldives. The main purpose of visit for these tourists include honeymoon, rest and relaxation. Majority (72%) of Chinese visitors fall in to the age category of 25-34 years. And their average duration of stay in the Maldives was found to be 4 nights.
Figure 4: Chinese Monthly Arrival Trends, 2013 – 2017
Although arrivals has been on a declining trend, the seasonality of China market to the Maldives remained comparatively uniform. While Chinese arrivals to the Maldives recorded sharp increases during the months of February and July, the months of March and December are recorded to be the lowest months. The hike in arrivals during the month of February accounts for the Chinese New
Year holidays falling into this month except for the year 2017. In 2017, the Chinese New Year holidays were celebrated in January.
Year 2013 2014 2015 2016 2017Arriva ls 331,719 363,626 359,514 324,326 306,530
Growth (%) 44.5 9.6 -1.1 -9.8 -5.5
Source: Ministry of Tourism
13
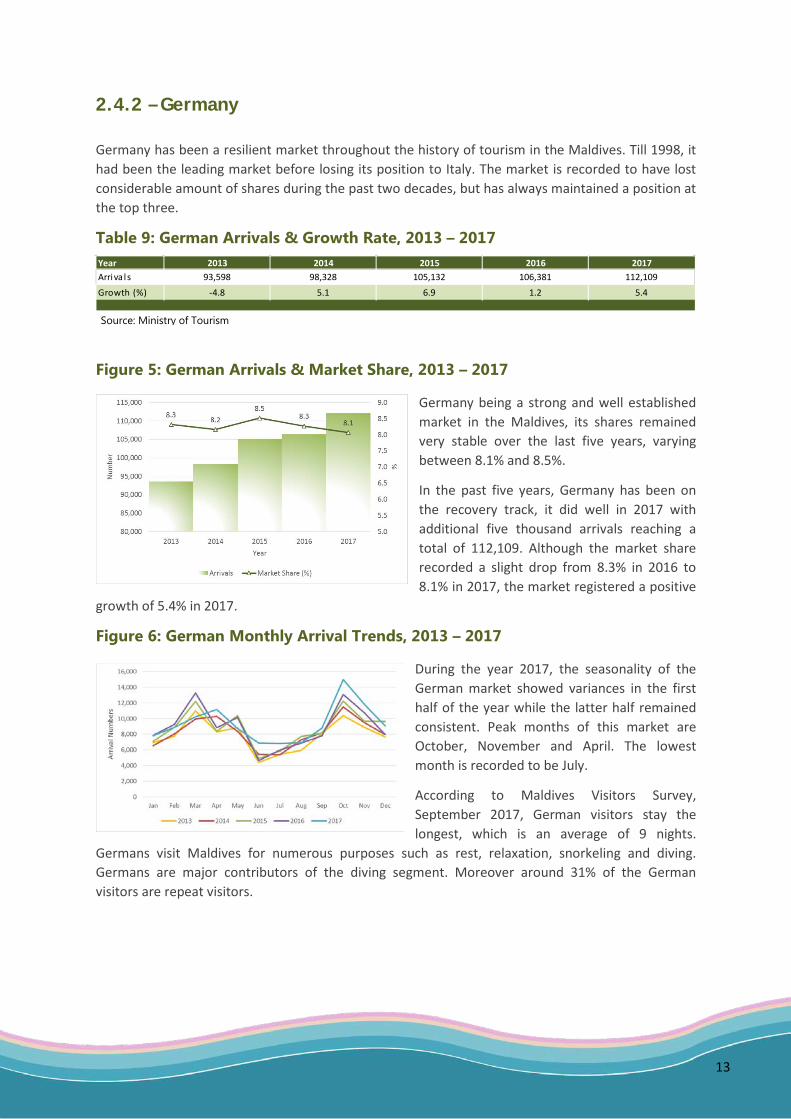
2.4.2 – Germany Germany has been a resilient market throughout the history of tourism in the Maldives. Till 1998, it had been the leading market before losing its position to Italy. The market is recorded to have lost considerable amount of shares during the past two decades, but has always maintained a position at the top three.
Table 9: German Arrivals & Growth Rate, 2013 – 2017
Figure 5: German Arrivals & Market Share, 2013 – 2017
Germany being a strong and well established market in the Maldives, its shares remained very stable over the last five years, varying between 8.1% and 8.5%.
In the past five years, Germany has been on the recovery track, it did well in 2017 with additional five thousand arrivals reaching a total of 112,109. Although the market share recorded a slight drop from 8.3% in 2016 to 8.1% in 2017, the market registered a positive
growth of 5.4% in 2017.
Figure 6: German Monthly Arrival Trends, 2013 – 2017
During the year 2017, the seasonality of the German market showed variances in the first half of the year while the latter half remained consistent. Peak months of this market are October, November and April. The lowest month is recorded to be July.
According to Maldives Visitors Survey, September 2017, German visitors stay the longest, which is an average of 9 nights.
Germans visit Maldives for numerous purposes such as rest, relaxation, snorkeling and diving. Germans are major contributors of the diving segment. Moreover around 31% of the German visitors are repeat visitors.
Source: Ministry of Tourism
Year 2013 2014 2015 2016 2017Arriva ls 93,598 98,328 105,132 106,381 112,109
Growth (%) -4.8 5.1 6.9 1.2 5.4
14
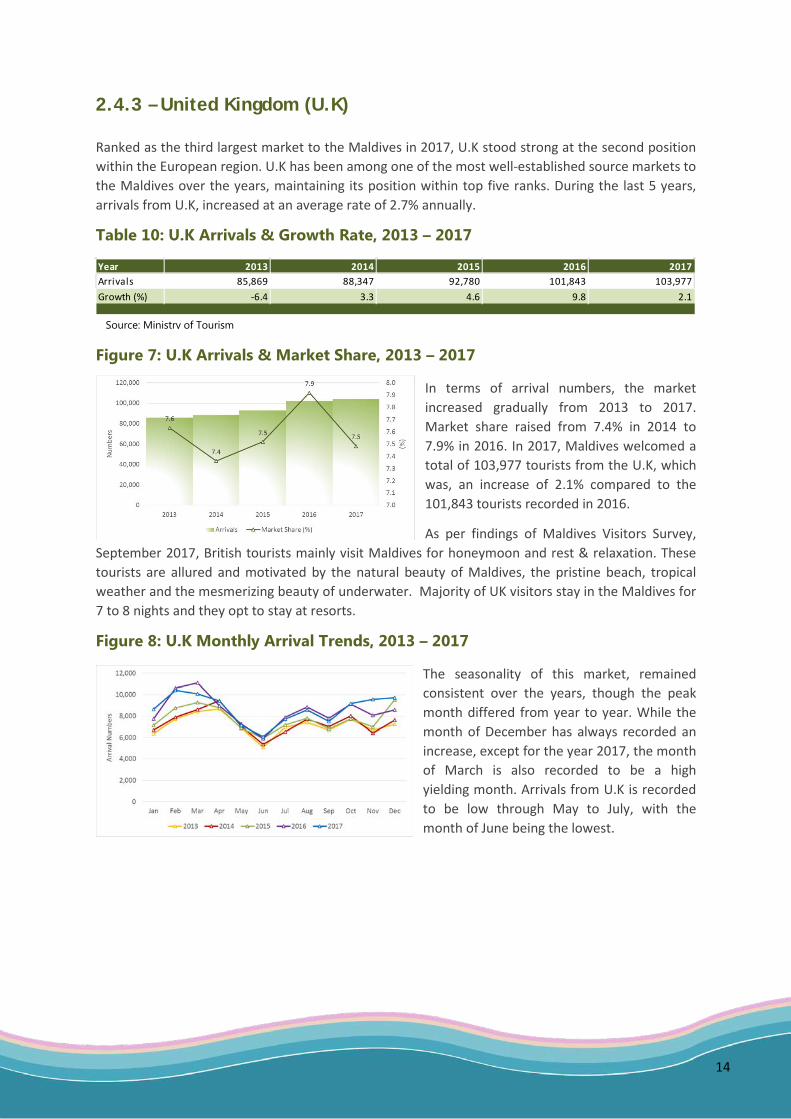
2.4.3 – United Kingdom (U.K) Ranked as the third largest market to the Maldives in 2017, U.K stood strong at the second position within the European region. U.K has been among one of the most well-established source markets to the Maldives over the years, maintaining its position within top five ranks. During the last 5 years, arrivals from U.K, increased at an average rate of 2.7% annually.
Table 10: U.K Arrivals & Growth Rate, 2013 – 2017
Figure 7: U.K Arrivals & Market Share, 2013 – 2017
In terms of arrival numbers, the market increased gradually from 2013 to 2017. Market share raised from 7.4% in 2014 to 7.9% in 2016. In 2017, Maldives welcomed a total of 103,977 tourists from the U.K, which was, an increase of 2.1% compared to the 101,843 tourists recorded in 2016.
As per findings of Maldives Visitors Survey, September 2017, British tourists mainly visit Maldives for honeymoon and rest & relaxation. These tourists are allured and motivated by the natural beauty of Maldives, the pristine beach, tropical weather and the mesmerizing beauty of underwater. Majority of UK visitors stay in the Maldives for 7 to 8 nights and they opt to stay at resorts.
Figure 8: U.K Monthly Arrival Trends, 2013 – 2017
The seasonality of this market, remained consistent over the years, though the peak month differed from year to year. While the month of December has always recorded an increase, except for the year 2017, the month of March is also recorded to be a high yielding month. Arrivals from U.K is recorded to be low through May to July, with the month of June being the lowest.
Year 2013 2014 2015 2016 2017Arrivals 85,869 88,347 92,780 101,843 103,977Growth (%) -6.4 3.3 4.6 9.8 2.1
Source: Ministry of Tourism
15
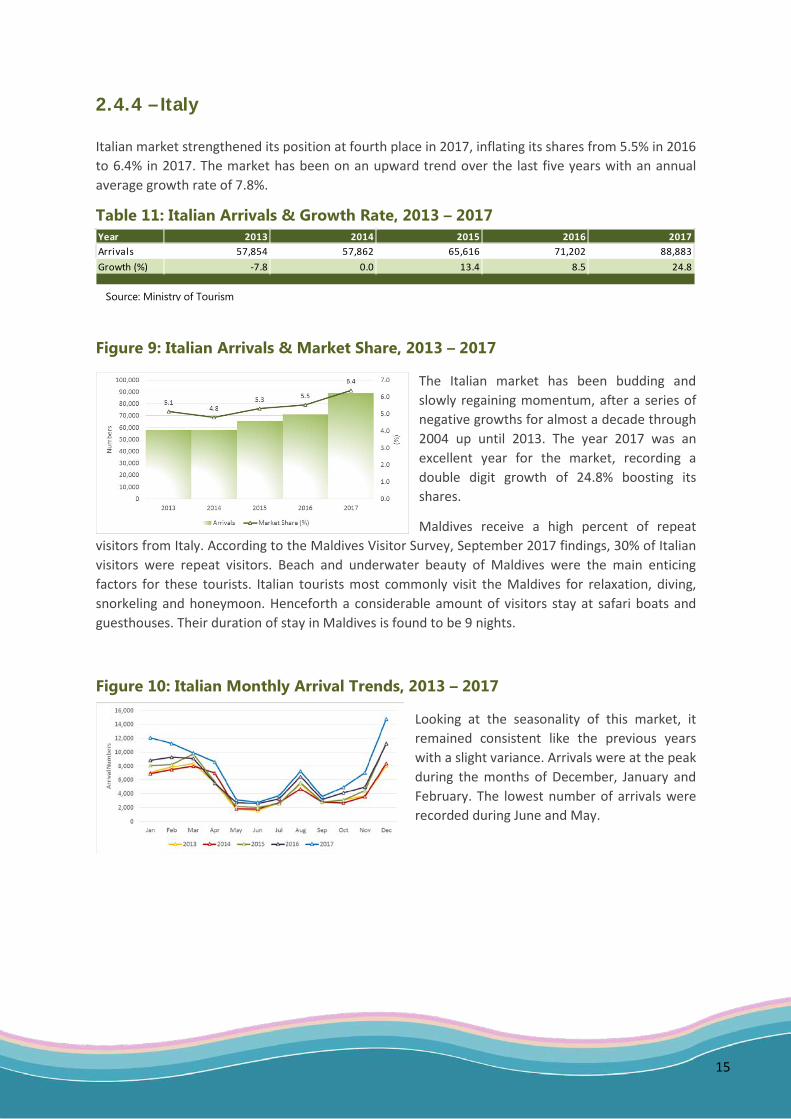
2.4.4 – Italy
Italian market strengthened its position at fourth place in 2017, inflating its shares from 5.5% in 2016 to 6.4% in 2017. The market has been on an upward trend over the last five years with an annual average growth rate of 7.8%.
Table 11: Italian Arrivals & Growth Rate, 2013 – 2017
Figure 9: Italian Arrivals & Market Share, 2013 – 2017
The Italian market has been budding and slowly regaining momentum, after a series of negative growths for almost a decade through 2004 up until 2013. The year 2017 was an excellent year for the market, recording a double digit growth of 24.8% boosting its shares.
Maldives receive a high percent of repeat visitors from Italy. According to the Maldives Visitor Survey, September 2017 findings, 30% of Italian visitors were repeat visitors. Beach and underwater beauty of Maldives were the main enticing factors for these tourists. Italian tourists most commonly visit the Maldives for relaxation, diving, snorkeling and honeymoon. Henceforth a considerable amount of visitors stay at safari boats and guesthouses. Their duration of stay in Maldives is found to be 9 nights.
Figure 10: Italian Monthly Arrival Trends, 2013 – 2017
Looking at the seasonality of this market, it remained consistent like the previous years with a slight variance. Arrivals were at the peak during the months of December, January and February. The lowest number of arrivals were recorded during June and May.
Year 2013 2014 2015 2016 2017Arrivals 57,854 57,862 65,616 71,202 88,883Growth (%) -7.8 0.0 13.4 8.5 24.8
Source: Ministry of Tourism
16
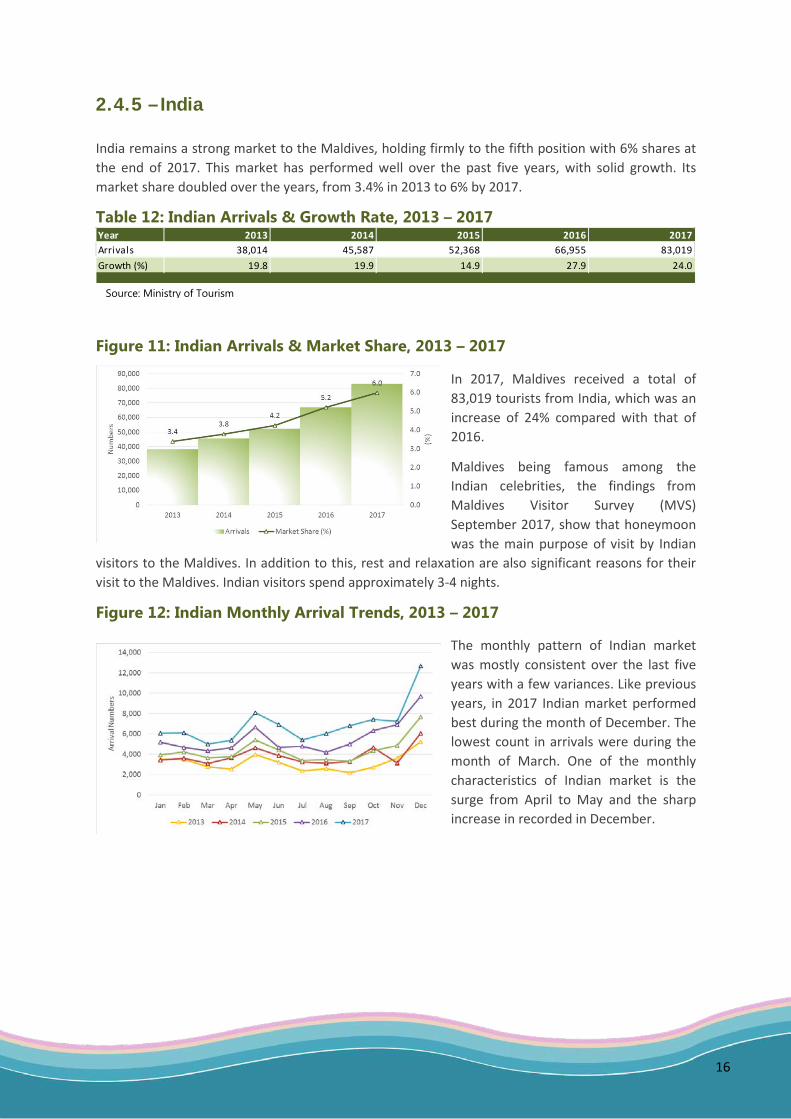
2.4.5 – India
India remains a strong market to the Maldives, holding firmly to the fifth position with 6% shares at the end of 2017. This market has performed well over the past five years, with solid growth. Its market share doubled over the years, from 3.4% in 2013 to 6% by 2017.
Table 12: Indian Arrivals & Growth Rate, 2013 – 2017
Figure 11: Indian Arrivals & Market Share, 2013 – 2017
In 2017, Maldives received a total of 83,019 tourists from India, which was an increase of 24% compared with that of 2016.
Maldives being famous among the Indian celebrities, the findings from Maldives Visitor Survey (MVS) September 2017, show that honeymoon was the main purpose of visit by Indian
visitors to the Maldives. In addition to this, rest and relaxation are also significant reasons for their visit to the Maldives. Indian visitors spend approximately 3-4 nights.
Figure 12: Indian Monthly Arrival Trends, 2013 – 2017
The monthly pattern of Indian market was mostly consistent over the last five years with a few variances. Like previous years, in 2017 Indian market performed best during the month of December. The lowest count in arrivals were during the month of March. One of the monthly characteristics of Indian market is the surge from April to May and the sharp increase in recorded in December.
Year 2013 2014 2015 2016 2017Arrivals 38,014 45,587 52,368 66,955 83,019Growth (%) 19.8 19.9 14.9 27.9 24.0
Source: Ministry of Tourism
17
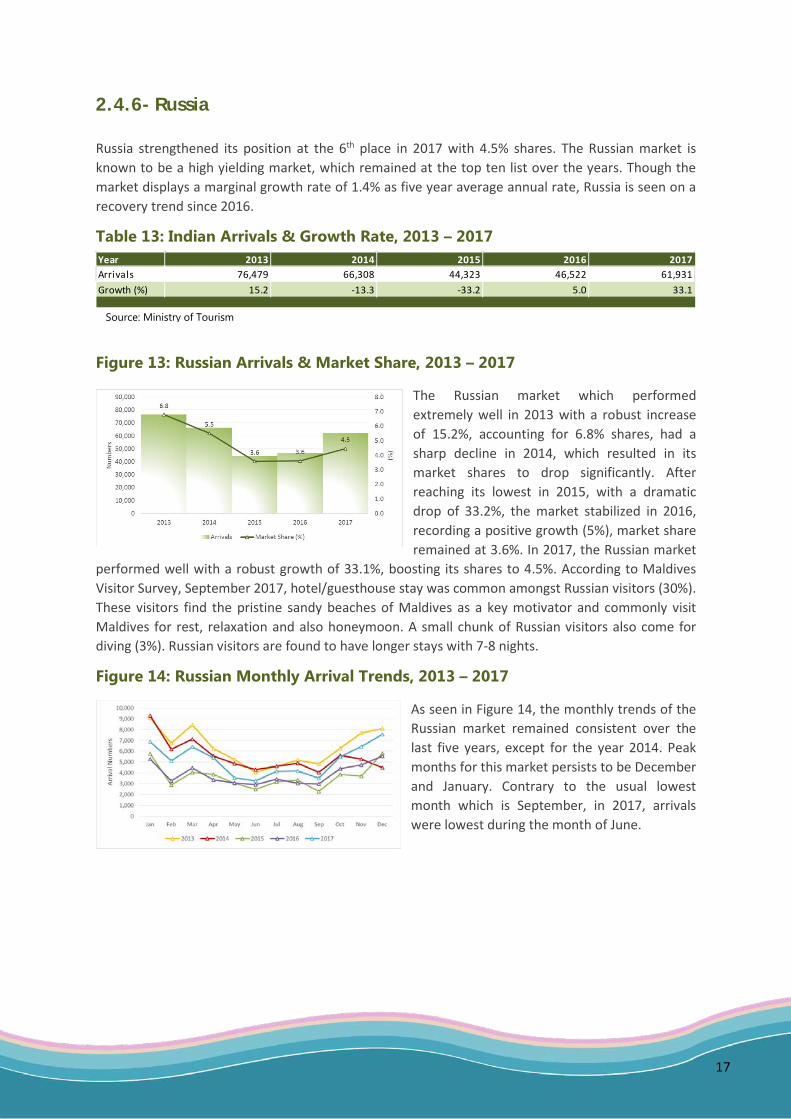
2.4.6- Russia
Russia strengthened its position at the 6th place in 2017 with 4.5% shares. The Russian market is known to be a high yielding market, which remained at the top ten list over the years. Though the market displays a marginal growth rate of 1.4% as five year average annual rate, Russia is seen on a recovery trend since 2016.
Table 13: Indian Arrivals & Growth Rate, 2013 – 2017
Figure 13: Russian Arrivals & Market Share, 2013 – 2017
The Russian market which performed extremely well in 2013 with a robust increase of 15.2%, accounting for 6.8% shares, had a sharp decline in 2014, which resulted in its market shares to drop significantly. After reaching its lowest in 2015, with a dramatic drop of 33.2%, the market stabilized in 2016, recording a positive growth (5%), market share remained at 3.6%. In 2017, the Russian market
performed well with a robust growth of 33.1%, boosting its shares to 4.5%. According to Maldives Visitor Survey, September 2017, hotel/guesthouse stay was common amongst Russian visitors (30%). These visitors find the pristine sandy beaches of Maldives as a key motivator and commonly visit Maldives for rest, relaxation and also honeymoon. A small chunk of Russian visitors also come for diving (3%). Russian visitors are found to have longer stays with 7-8 nights.
Figure 14: Russian Monthly Arrival Trends, 2013 – 2017
As seen in Figure 14, the monthly trends of the Russian market remained consistent over the last five years, except for the year 2014. Peak months for this market persists to be December and January. Contrary to the usual lowest month which is September, in 2017, arrivals were lowest during the month of June.
Year 2013 2014 2015 2016 2017Arrivals 76,479 66,308 44,323 46,522 61,931Growth (%) 15.2 -13.3 -33.2 5.0 33.1
Source: Ministry of Tourism
18
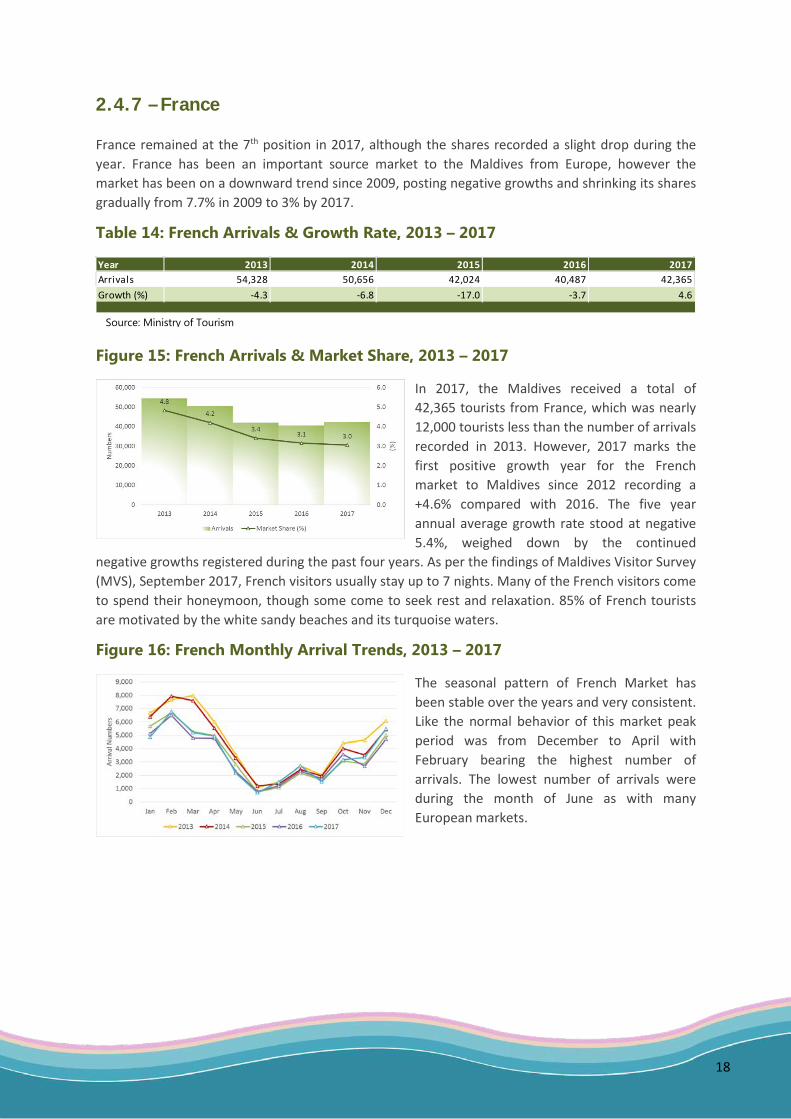
2.4.7 – France
France remained at the 7th position in 2017, although the shares recorded a slight drop during the year. France has been an important source market to the Maldives from Europe, however the market has been on a downward trend since 2009, posting negative growths and shrinking its shares gradually from 7.7% in 2009 to 3% by 2017.
Table 14: French Arrivals & Growth Rate, 2013 – 2017
Figure 15: French Arrivals & Market Share, 2013 – 2017
In 2017, the Maldives received a total of 42,365 tourists from France, which was nearly 12,000 tourists less than the number of arrivals recorded in 2013. However, 2017 marks the first positive growth year for the French market to Maldives since 2012 recording a +4.6% compared with 2016. The five year annual average growth rate stood at negative 5.4%, weighed down by the continued
negative growths registered during the past four years. As per the findings of Maldives Visitor Survey (MVS), September 2017, French visitors usually stay up to 7 nights. Many of the French visitors come to spend their honeymoon, though some come to seek rest and relaxation. 85% of French tourists are motivated by the white sandy beaches and its turquoise waters.
Figure 16: French Monthly Arrival Trends, 2013 – 2017
The seasonal pattern of French Market has been stable over the years and very consistent. Like the normal behavior of this market peak period was from December to April with February bearing the highest number of arrivals. The lowest number of arrivals were during the month of June as with many European markets.
Year 2013 2014 2015 2016 2017Arrivals 54,328 50,656 42,024 40,487 42,365Growth (%) -4.3 -6.8 -17.0 -3.7 4.6
Source: Ministry of Tourism
19
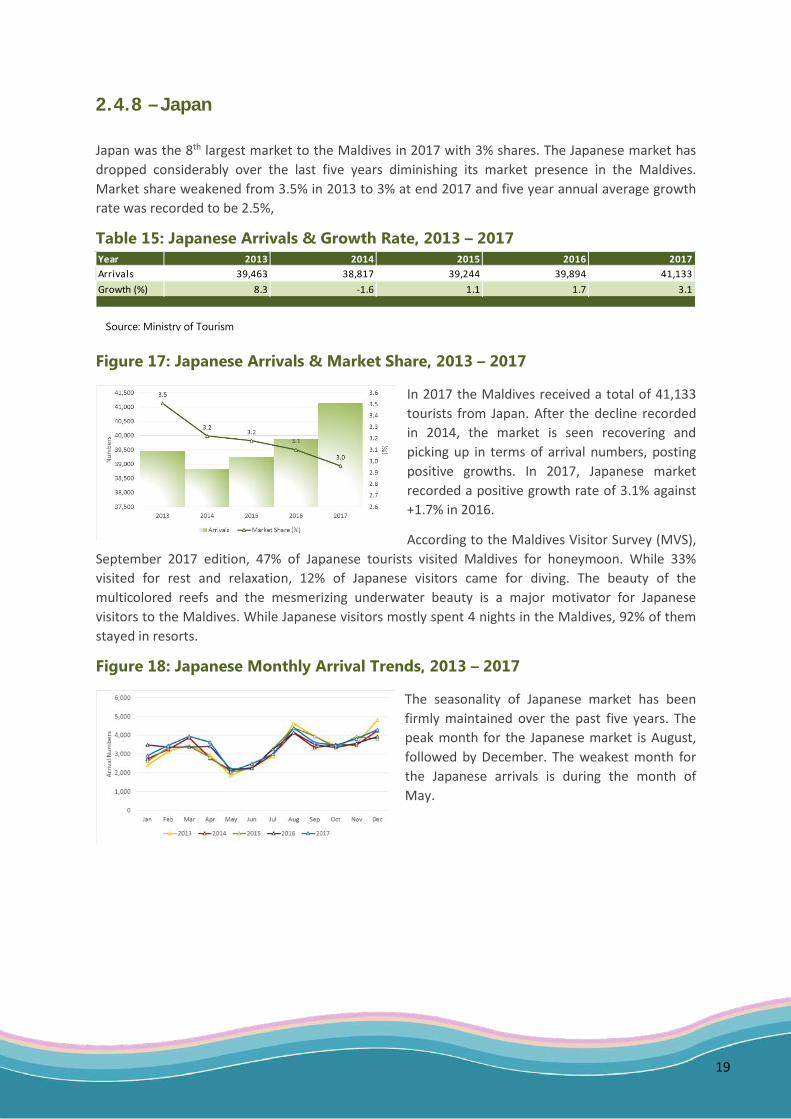
2.4.8 – Japan
Japan was the 8th largest market to the Maldives in 2017 with 3% shares. The Japanese market has dropped considerably over the last five years diminishing its market presence in the Maldives. Market share weakened from 3.5% in 2013 to 3% at end 2017 and five year annual average growth rate was recorded to be 2.5%,
Table 15: Japanese Arrivals & Growth Rate, 2013 – 2017
Figure 17: Japanese Arrivals & Market Share, 2013 – 2017
In 2017 the Maldives received a total of 41,133 tourists from Japan. After the decline recorded in 2014, the market is seen recovering and picking up in terms of arrival numbers, posting positive growths. In 2017, Japanese market recorded a positive growth rate of 3.1% against +1.7% in 2016.
According to the Maldives Visitor Survey (MVS), September 2017 edition, 47% of Japanese tourists visited Maldives for honeymoon. While 33% visited for rest and relaxation, 12% of Japanese visitors came for diving. The beauty of the multicolored reefs and the mesmerizing underwater beauty is a major motivator for Japanese visitors to the Maldives. While Japanese visitors mostly spent 4 nights in the Maldives, 92% of them stayed in resorts.
Figure 18: Japanese Monthly Arrival Trends, 2013 – 2017
The seasonality of Japanese market has been firmly maintained over the past five years. The peak month for the Japanese market is August, followed by December. The weakest month for the Japanese arrivals is during the month of May.
Year 2013 2014 2015 2016 2017Arrivals 39,463 38,817 39,244 39,894 41,133Growth (%) 8.3 -1.6 1.1 1.7 3.1
Source: Ministry of Tourism
20
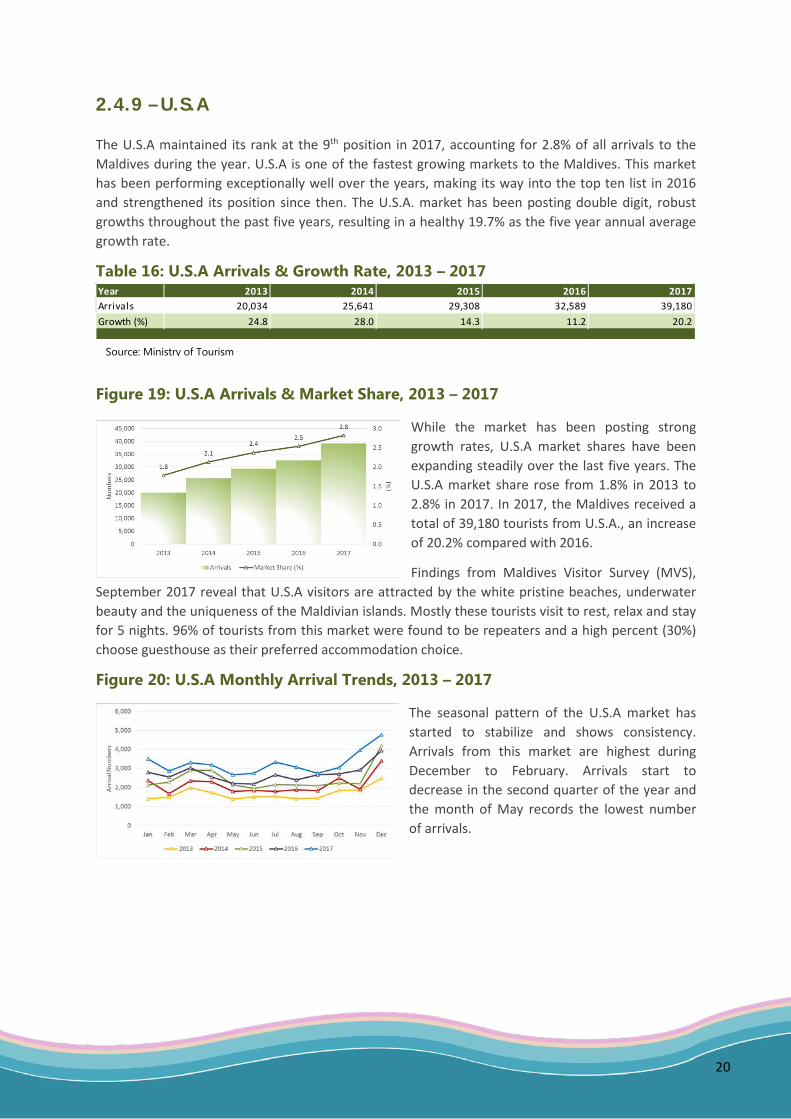
2.4.9 – U.S.A
The U.S.A maintained its rank at the 9th position in 2017, accounting for 2.8% of all arrivals to the Maldives during the year. U.S.A is one of the fastest growing markets to the Maldives. This market has been performing exceptionally well over the years, making its way into the top ten list in 2016 and strengthened its position since then. The U.S.A. market has been posting double digit, robust growths throughout the past five years, resulting in a healthy 19.7% as the five year annual average growth rate.
Table 16: U.S.A Arrivals & Growth Rate, 2013 – 2017
Figure 19: U.S.A Arrivals & Market Share, 2013 – 2017
While the market has been posting strong growth rates, U.S.A market shares have been expanding steadily over the last five years. The U.S.A market share rose from 1.8% in 2013 to 2.8% in 2017. In 2017, the Maldives received a total of 39,180 tourists from U.S.A., an increase of 20.2% compared with 2016.
Findings from Maldives Visitor Survey (MVS), September 2017 reveal that U.S.A visitors are attracted by the white pristine beaches, underwater beauty and the uniqueness of the Maldivian islands. Mostly these tourists visit to rest, relax and stay for 5 nights. 96% of tourists from this market were found to be repeaters and a high percent (30%) choose guesthouse as their preferred accommodation choice.
Figure 20: U.S.A Monthly Arrival Trends, 2013 – 2017
The seasonal pattern of the U.S.A market has started to stabilize and shows consistency. Arrivals from this market are highest during December to February. Arrivals start to decrease in the second quarter of the year and the month of May records the lowest number of arrivals.
Year 2013 2014 2015 2016 2017Arrivals 20,034 25,641 29,308 32,589 39,180Growth (%) 24.8 28.0 14.3 11.2 20.2
Source: Ministry of Tourism
21
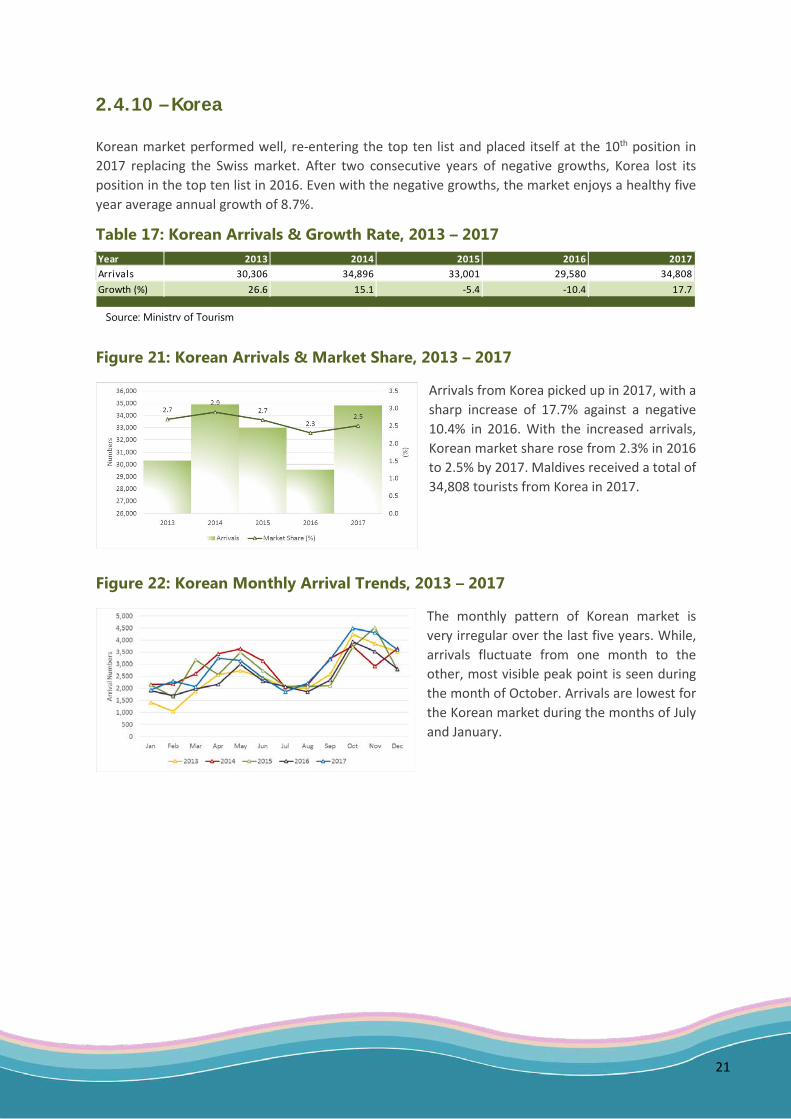
2.4.10 – Korea
Korean market performed well, re-entering the top ten list and placed itself at the 10th position in 2017 replacing the Swiss market. After two consecutive years of negative growths, Korea lost its position in the top ten list in 2016. Even with the negative growths, the market enjoys a healthy five year average annual growth of 8.7%.
Table 17: Korean Arrivals & Growth Rate, 2013 – 2017
Figure 21: Korean Arrivals & Market Share, 2013 – 2017
Arrivals from Korea picked up in 2017, with a sharp increase of 17.7% against a negative 10.4% in 2016. With the increased arrivals, Korean market share rose from 2.3% in 2016 to 2.5% by 2017. Maldives received a total of 34,808 tourists from Korea in 2017.
Figure 22: Korean Monthly Arrival Trends, 2013 – 2017
The monthly pattern of Korean market is very irregular over the last five years. While, arrivals fluctuate from one month to the other, most visible peak point is seen during the month of October. Arrivals are lowest for the Korean market during the months of July and January.
Source: Ministry of Tourism
Year 2013 2014 2015 2016 2017Arrivals 30,306 34,896 33,001 29,580 34,808Growth (%) 26.6 15.1 -5.4 -10.4 17.7

22
SECTION 3
ECONOMIC INDICATORS
23
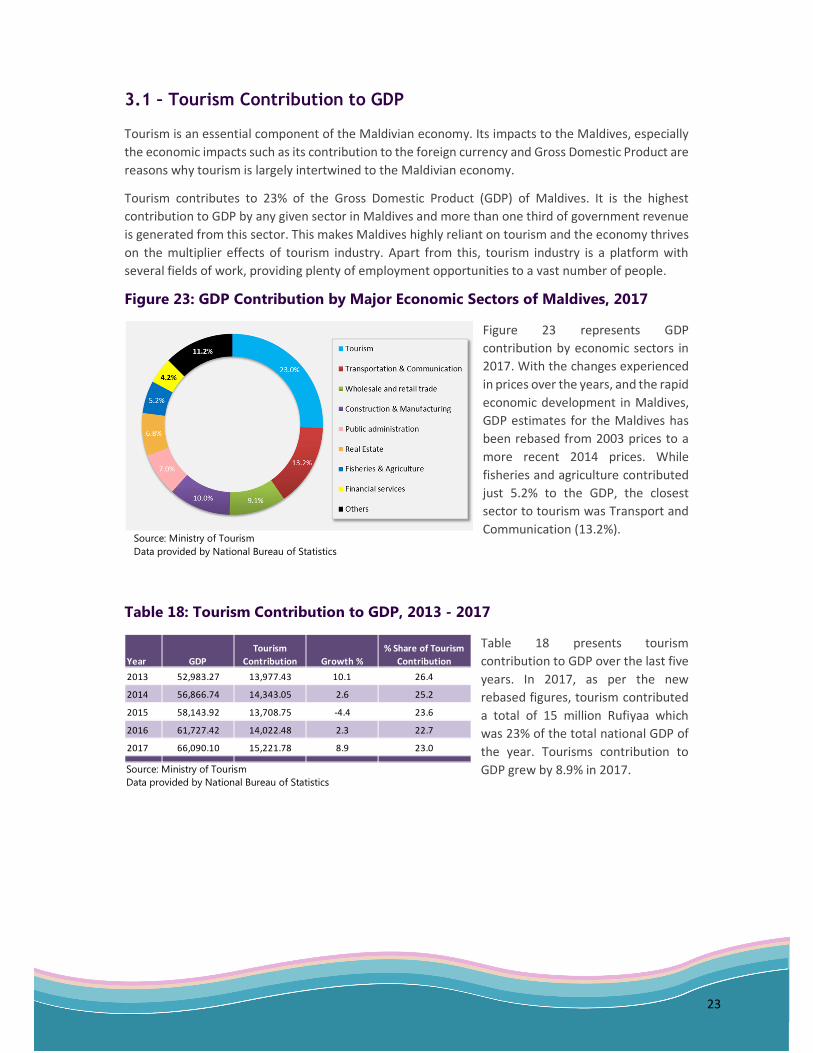
3.1 – Tourism Contribution to GDP
Tourism is an essential component of the Maldivian economy. Its impacts to the Maldives, especially
the economic impacts such as its contribution to the foreign currency and Gross Domestic Product are
reasons why tourism is largely intertwined to the Maldivian economy.
Tourism contributes to 23% of the Gross Domestic Product (GDP) of Maldives. It is the highest
contribution to GDP by any given sector in Maldives and more than one third of government revenue
is generated from this sector. This makes Maldives highly reliant on tourism and the economy thrives
on the multiplier effects of tourism industry. Apart from this, tourism industry is a platform with
several fields of work, providing plenty of employment opportunities to a vast number of people.
Figure 23: GDP Contribution by Major Economic Sectors of Maldives, 2017
Figure 23 represents GDP
contribution by economic sectors in
2017. With the changes experienced
in prices over the years, and the rapid
economic development in Maldives,
GDP estimates for the Maldives has
been rebased from 2003 prices to a
more recent 2014 prices. While
fisheries and agriculture contributed
just 5.2% to the GDP, the closest
sector to tourism was Transport and
Communication (13.2%).
Table 18: Tourism Contribution to GDP, 2013 - 2017
Table 18 presents tourism
contribution to GDP over the last five
years. In 2017, as per the new
rebased figures, tourism contributed
a total of 15 million Rufiyaa which
was 23% of the total national GDP of
the year. Tourisms contribution to
GDP grew by 8.9% in 2017.
Source: Ministry of Tourism
Data provided by National Bureau of Statistics
Year GDP
Tourism
Contribution Growth %
% Share of Tourism
Contribution
2013 52,983.27 13,977.43 10.1 26.4
2014 56,866.74 14,343.05 2.6 25.2
2015 58,143.92 13,708.75 -4.4 23.6
2016 61,727.42 14,022.48 2.3 22.7
2017 66,090.10 15,221.78 8.9 23.0
Source: Ministry of Tourism
Data provided by National Bureau of Statistics
24
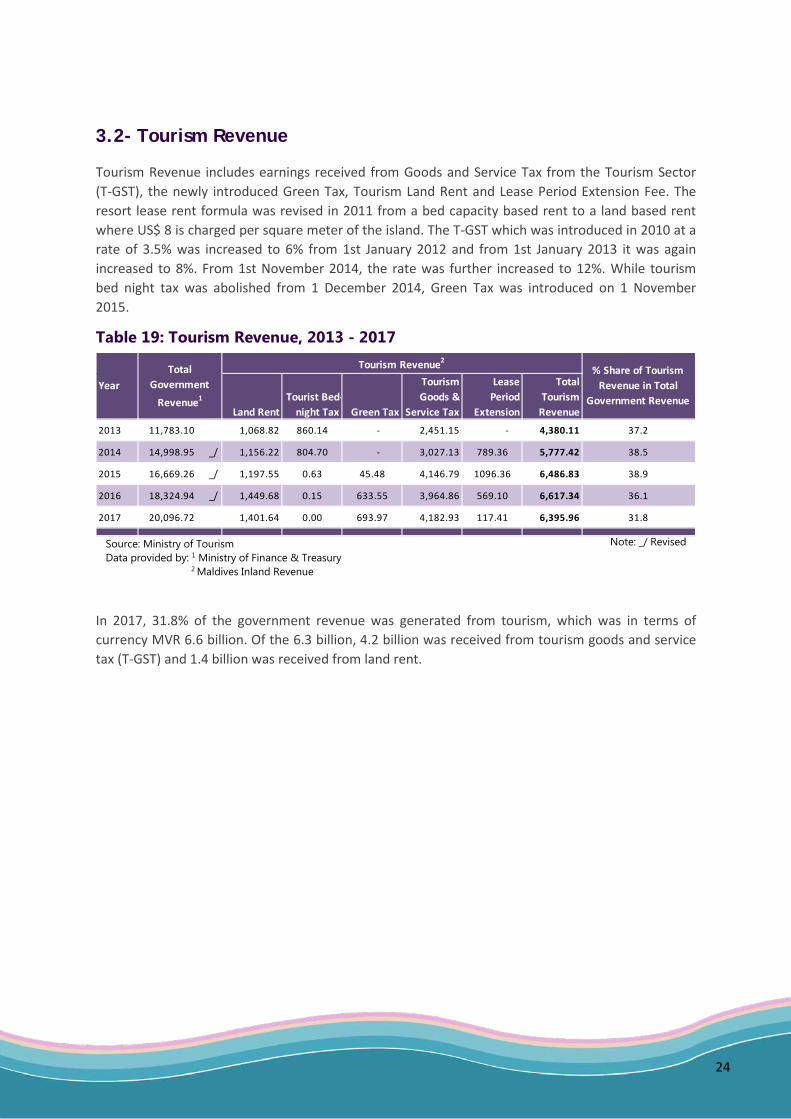
3.2- Tourism Revenue
Tourism Revenue includes earnings received from Goods and Service Tax from the Tourism Sector (T-GST), the newly introduced Green Tax, Tourism Land Rent and Lease Period Extension Fee. The resort lease rent formula was revised in 2011 from a bed capacity based rent to a land based rent where US$ 8 is charged per square meter of the island. The T-GST which was introduced in 2010 at a rate of 3.5% was increased to 6% from 1st January 2012 and from 1st January 2013 it was again increased to 8%. From 1st November 2014, the rate was further increased to 12%. While tourism bed night tax was abolished from 1 December 2014, Green Tax was introduced on 1 November 2015.
Table 19: Tourism Revenue, 2013 - 2017
In 2017, 31.8% of the government revenue was generated from tourism, which was in terms of currency MVR 6.6 billion. Of the 6.3 billion, 4.2 billion was received from tourism goods and service tax (T-GST) and 1.4 billion was received from land rent.
Source: Ministry of Tourism Data provided by: 1 Ministry of Finance & Treasury 2 Maldives Inland Revenue
Note: _/ Revised
Tourism Revenue2
Land RentTourist Bed-
night Tax Green Tax
Tourism Goods &
Service Tax
Lease Period
Extension
Total Tourism
Revenue
2013 11,783.10 1,068.82 860.14 - 2,451.15 - 4,380.11 37.2
2014 14,998.95 _/ 1,156.22 804.70 - 3,027.13 789.36 5,777.42 38.5
2015 16,669.26 _/ 1,197.55 0.63 45.48 4,146.79 1096.36 6,486.83 38.9
2016 18,324.94 _/ 1,449.68 0.15 633.55 3,964.86 569.10 6,617.34 36.1
2017 20,096.72 1,401.64 0.00 693.97 4,182.93 117.41 6,395.96 31.8
% Share of Tourism Revenue in Total
Government RevenueYear
Total Government
Revenue1
25
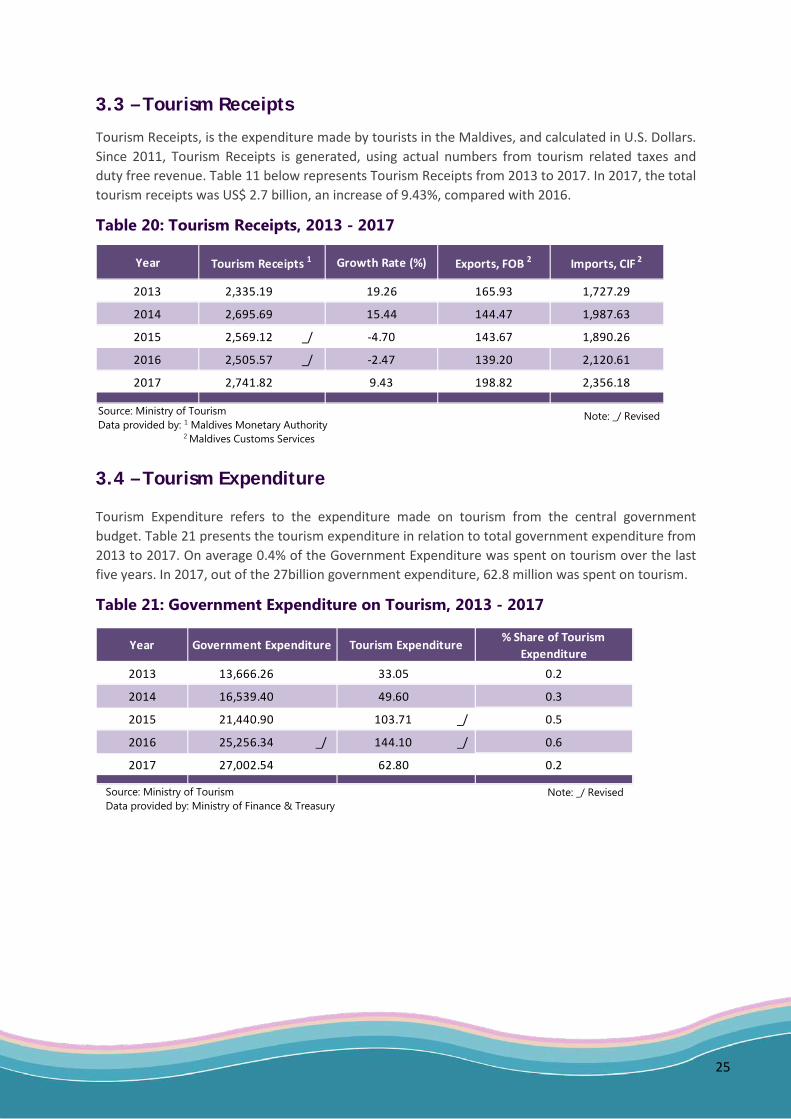
3.3 – Tourism Receipts
Tourism Receipts, is the expenditure made by tourists in the Maldives, and calculated in U.S. Dollars. Since 2011, Tourism Receipts is generated, using actual numbers from tourism related taxes and duty free revenue. Table 11 below represents Tourism Receipts from 2013 to 2017. In 2017, the total tourism receipts was US$ 2.7 billion, an increase of 9.43%, compared with 2016.
Table 20: Tourism Receipts, 2013 - 2017
3.4 – Tourism Expenditure
Tourism Expenditure refers to the expenditure made on tourism from the central government budget. Table 21 presents the tourism expenditure in relation to total government expenditure from 2013 to 2017. On average 0.4% of the Government Expenditure was spent on tourism over the last five years. In 2017, out of the 27billion government expenditure, 62.8 million was spent on tourism.
Table 21: Government Expenditure on Tourism, 2013 - 2017
Source: Ministry of Tourism Data provided by: 1 Maldives Monetary Authority 2 Maldives Customs Services
Note: _/ Revised
Year Tourism Receipts 1 Growth Rate (%) Exports, FOB 2 Imports, CIF 2
2013 2,335.19 19.26 165.93 1,727.29
2014 2,695.69 15.44 144.47 1,987.63
2015 2,569.12 _/ -4.70 143.67 1,890.26
2016 2,505.57 _/ -2.47 139.20 2,120.61
2017 2,741.82 9.43 198.82 2,356.18
Year % Share of Tourism Expenditure
2013 13,666.26 33.05 0.2
2014 16,539.40 49.60 0.3
2015 21,440.90 103.71 _/ 0.5
2016 25,256.34 _/ 144.10 _/ 0.6
2017 27,002.54 62.80 0.2
Government Expenditure Tourism Expenditure
Source: Ministry of Tourism Data provided by: Ministry of Finance & Treasury
Note: _/ Revised

26
SECTION 4
AIRLINE STATISTICS
27
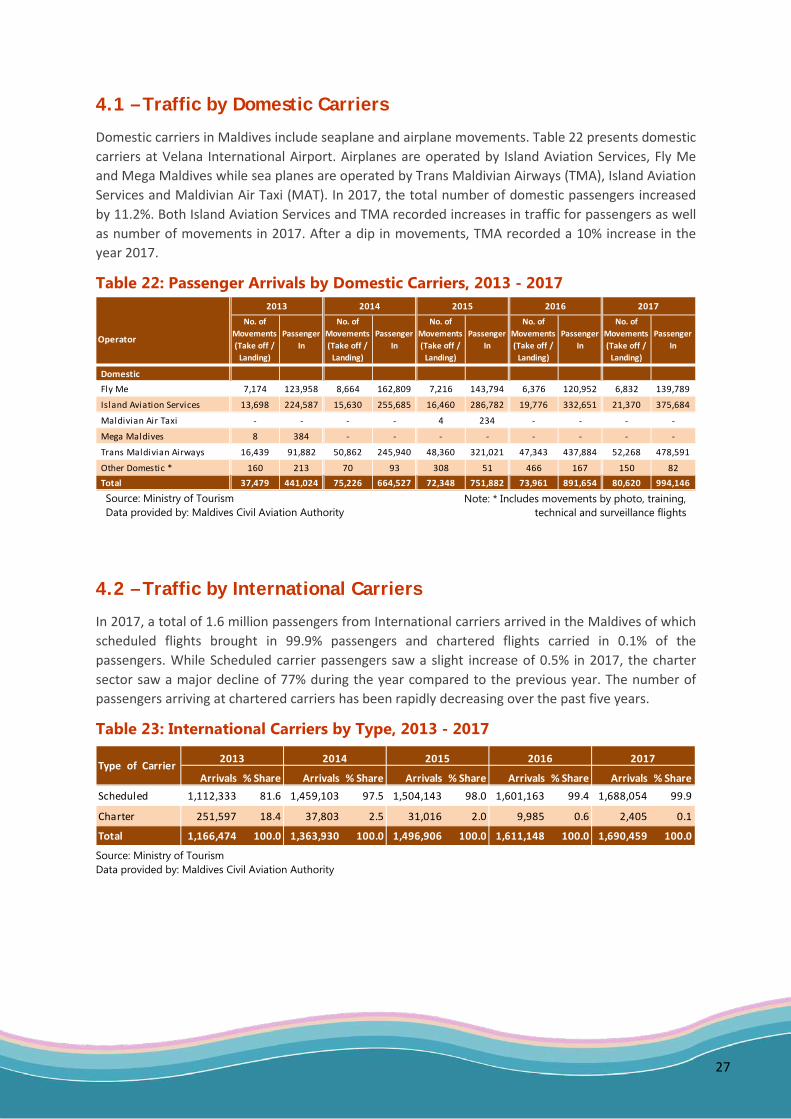
4.1 – Traffic by Domestic Carriers
Domestic carriers in Maldives include seaplane and airplane movements. Table 22 presents domestic carriers at Velana International Airport. Airplanes are operated by Island Aviation Services, Fly Me and Mega Maldives while sea planes are operated by Trans Maldivian Airways (TMA), Island Aviation Services and Maldivian Air Taxi (MAT). In 2017, the total number of domestic passengers increased by 11.2%. Both Island Aviation Services and TMA recorded increases in traffic for passengers as well as number of movements in 2017. After a dip in movements, TMA recorded a 10% increase in the year 2017.
Table 22: Passenger Arrivals by Domestic Carriers, 2013 - 2017
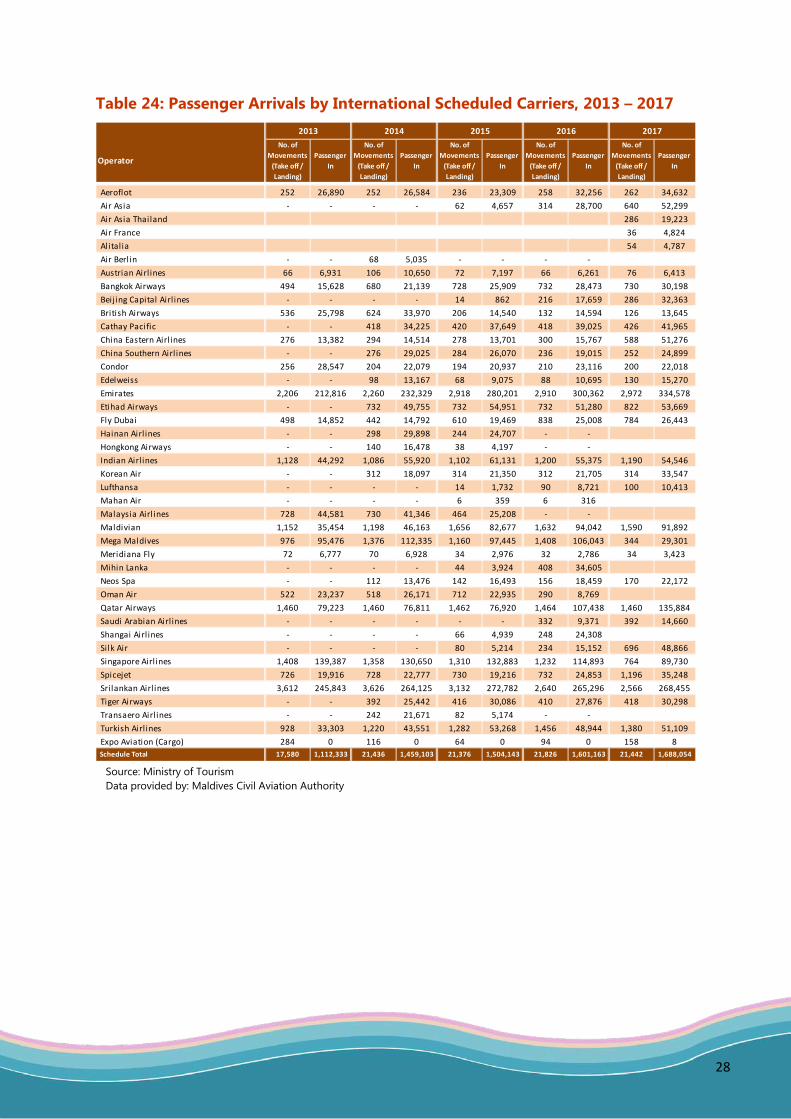
4.2 – Traffic by International Carriers
In 2017, a total of 1.6 million passengers from International carriers arrived in the Maldives of which scheduled flights brought in 99.9% passengers and chartered flights carried in 0.1% of the passengers. While Scheduled carrier passengers saw a slight increase of 0.5% in 2017, the charter sector saw a major decline of 77% during the year compared to the previous year. The number of passengers arriving at chartered carriers has been rapidly decreasing over the past five years.
Table 23: International Carriers by Type, 2013 - 2017
Source: Ministry of Tourism Data provided by: Maldives Civil Aviation Authority
Note: * Includes movements by photo, training, technical and surveillance flights
2013 2014 2015 2016 2017
Operator
No. of Movements (Take off /
Landing)
Passenger In
No. of Movements (Take off /
Landing)
Passenger In
No. of Movements (Take off /
Landing)
Passenger In
No. of Movements (Take off /
Landing)
Passenger In
No. of Movements (Take off /
Landing)
Passenger In
DomesticFly Me 7,174 123,958 8,664 162,809 7,216 143,794 6,376 120,952 6,832 139,789
Island Aviation Services 13,698 224,587 15,630 255,685 16,460 286,782 19,776 332,651 21,370 375,684
Maldivian Air Taxi - - - - 4 234 - - - -
Mega Maldives 8 384 - - - - - - - -
Trans Maldivian Airways 16,439 91,882 50,862 245,940 48,360 321,021 47,343 437,884 52,268 478,591
Other Domestic * 160 213 70 93 308 51 466 167 150 82Total 37,479 441,024 75,226 664,527 72,348 751,882 73,961 891,654 80,620 994,146
2013 2014 2015 2016 2017
Arrivals % Share Arrivals % Share Arrivals % Share Arrivals % Share Arrivals % ShareScheduled 1,112,333 81.6 1,459,103 97.5 1,504,143 98.0 1,601,163 99.4 1,688,054 99.9
Charter 251,597 18.4 37,803 2.5 31,016 2.0 9,985 0.6 2,405 0.1
Total 1,166,474 100.0 1,363,930 100.0 1,496,906 100.0 1,611,148 100.0 1,690,459 100.0
Type of Carrier
Source: Ministry of Tourism Data provided by: Maldives Civil Aviation Authority
28
Table 24: Passenger Arrivals by International Scheduled Carriers, 2013 – 2017 2013 2014 2015 2016 2017
Operator
No. of Movements
(Take off / Landing)
Passenger In
No. of Movements
(Take off / Landing)
Passenger In
No. of Movements
(Take off / Landing)
Passenger In
No. of Movements
(Take off / Landing)
Passenger In
No. of Movements
(Take off / Landing)
Passenger In
Aeroflot 252 26,890 252 26,584 236 23,309 258 32,256 262 34,632Air Asia - - - - 62 4,657 314 28,700 640 52,299Air Asia Thailand 286 19,223Air France 36 4,824Alitalia 54 4,787Air Berlin - - 68 5,035 - - - -Austrian Airl ines 66 6,931 106 10,650 72 7,197 66 6,261 76 6,413Bangkok Airways 494 15,628 680 21,139 728 25,909 732 28,473 730 30,198Beijing Capital Airl ines - - - - 14 862 216 17,659 286 32,363British Airways 536 25,798 624 33,970 206 14,540 132 14,594 126 13,645Cathay Pacific - - 418 34,225 420 37,649 418 39,025 426 41,965China Eastern Airl ines 276 13,382 294 14,514 278 13,701 300 15,767 588 51,276China Southern Airl ines - - 276 29,025 284 26,070 236 19,015 252 24,899Condor 256 28,547 204 22,079 194 20,937 210 23,116 200 22,018Edelweiss - - 98 13,167 68 9,075 88 10,695 130 15,270Emirates 2,206 212,816 2,260 232,329 2,918 280,201 2,910 300,362 2,972 334,578Etihad Airways - - 732 49,755 732 54,951 732 51,280 822 53,669Fly Dubai 498 14,852 442 14,792 610 19,469 838 25,008 784 26,443Hainan Airl ines - - 298 29,898 244 24,707 - -Hongkong Airways - - 140 16,478 38 4,197 - -Indian Airl ines 1,128 44,292 1,086 55,920 1,102 61,131 1,200 55,375 1,190 54,546Korean Air - - 312 18,097 314 21,350 312 21,705 314 33,547Lufthansa - - - - 14 1,732 90 8,721 100 10,413Mahan Air - - - - 6 359 6 316Malaysia Airl ines 728 44,581 730 41,346 464 25,208 - -Maldivian 1,152 35,454 1,198 46,163 1,656 82,677 1,632 94,042 1,590 91,892Mega Maldives 976 95,476 1,376 112,335 1,160 97,445 1,408 106,043 344 29,301Meridiana Fly 72 6,777 70 6,928 34 2,976 32 2,786 34 3,423Mihin Lanka - - - - 44 3,924 408 34,605Neos Spa - - 112 13,476 142 16,493 156 18,459 170 22,172Oman Air 522 23,237 518 26,171 712 22,935 290 8,769Qatar Airways 1,460 79,223 1,460 76,811 1,462 76,920 1,464 107,438 1,460 135,884Saudi Arabian Airl ines - - - - - - 332 9,371 392 14,660Shangai Airl ines - - - - 66 4,939 248 24,308Silk Air - - - - 80 5,214 234 15,152 696 48,866Singapore Airl ines 1,408 139,387 1,358 130,650 1,310 132,883 1,232 114,893 764 89,730Spicejet 726 19,916 728 22,777 730 19,216 732 24,853 1,196 35,248Srilankan Airl ines 3,612 245,843 3,626 264,125 3,132 272,782 2,640 265,296 2,566 268,455Tiger Airways - - 392 25,442 416 30,086 410 27,876 418 30,298Transaero Airl ines - - 242 21,671 82 5,174 - -Turkish Airl ines 928 33,303 1,220 43,551 1,282 53,268 1,456 48,944 1,380 51,109Expo Aviation (Cargo) 284 0 116 0 64 0 94 0 158 8Schedule Total 17,580 1,112,333 21,436 1,459,103 21,376 1,504,143 21,826 1,601,163 21,442 1,688,054
Source: Ministry of Tourism Data provided by: Maldives Civil Aviation Authority

SECTION 5
ADDITIONAL TABLES
29
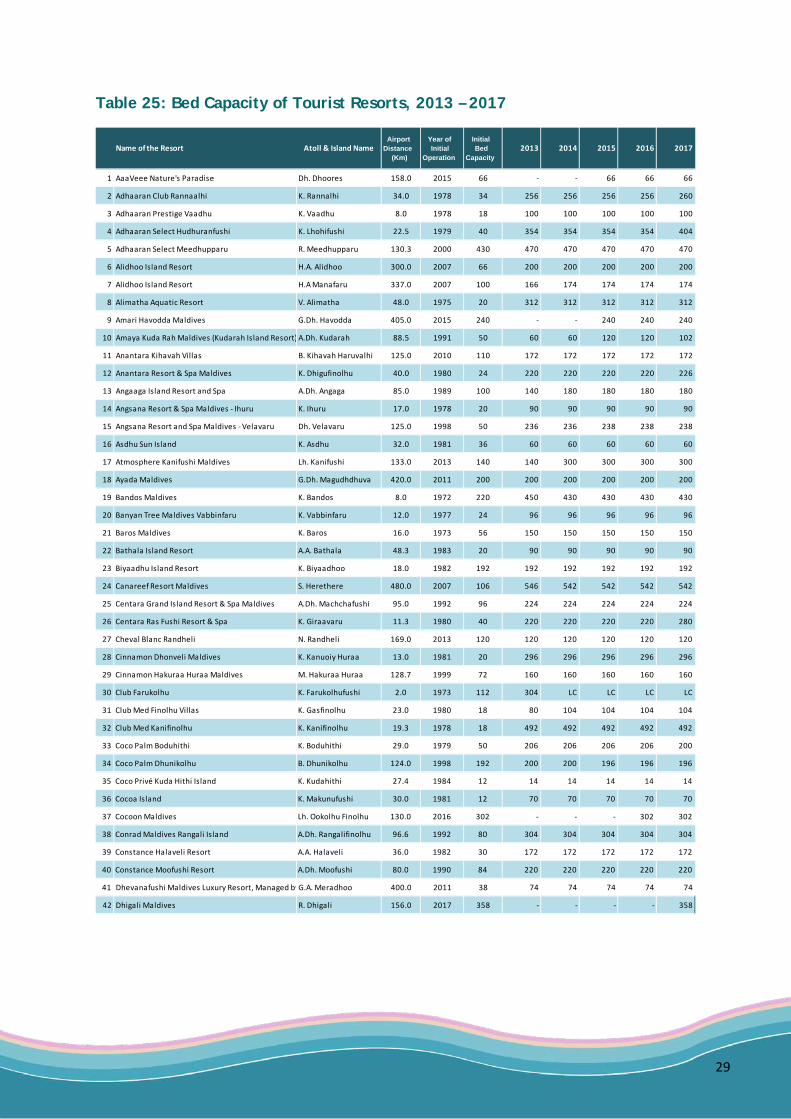
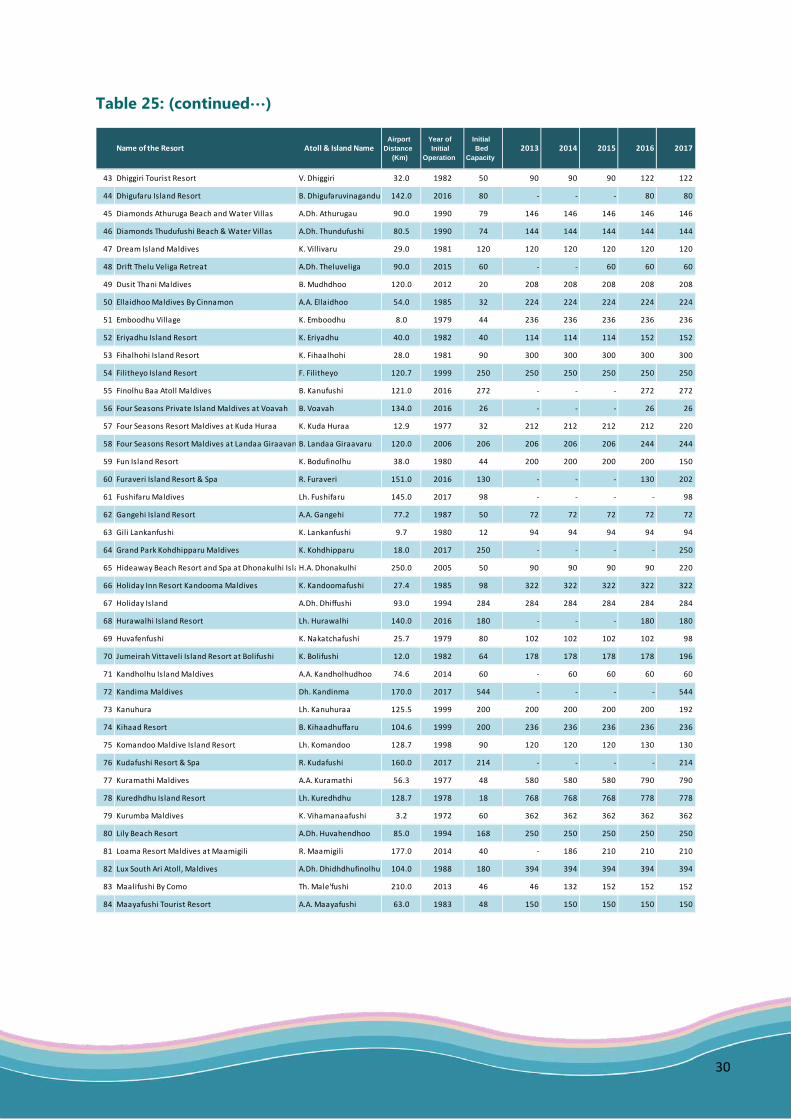
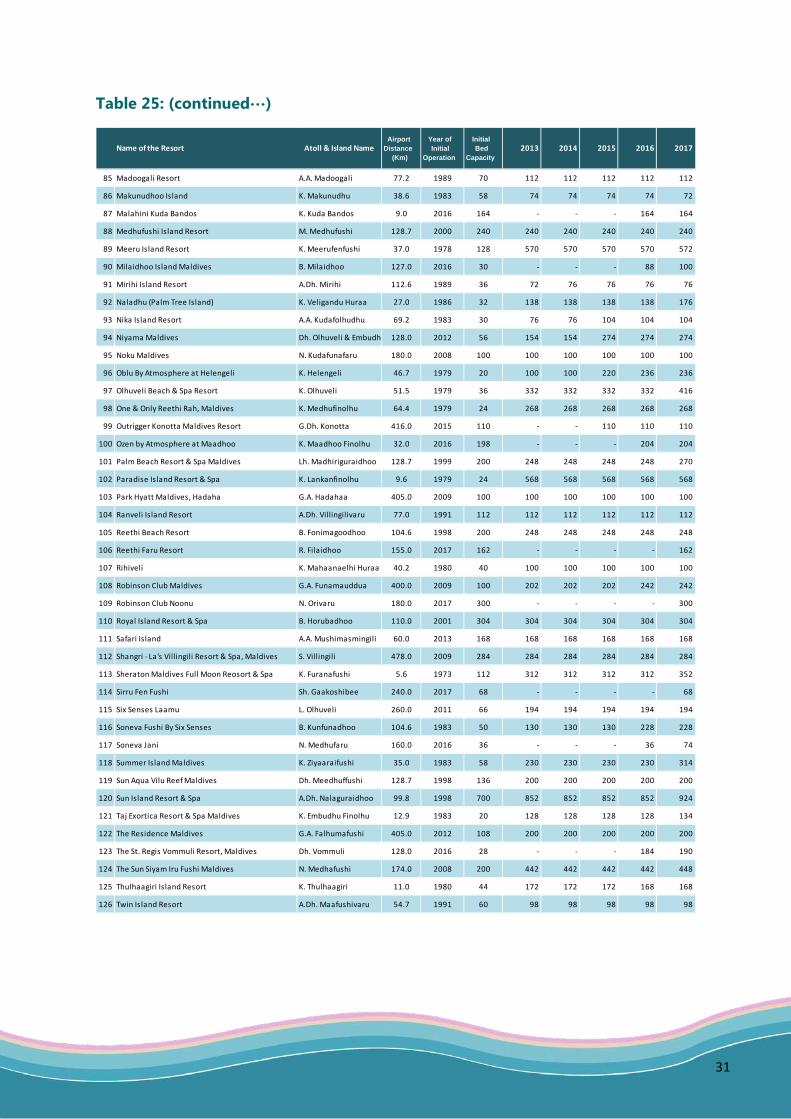
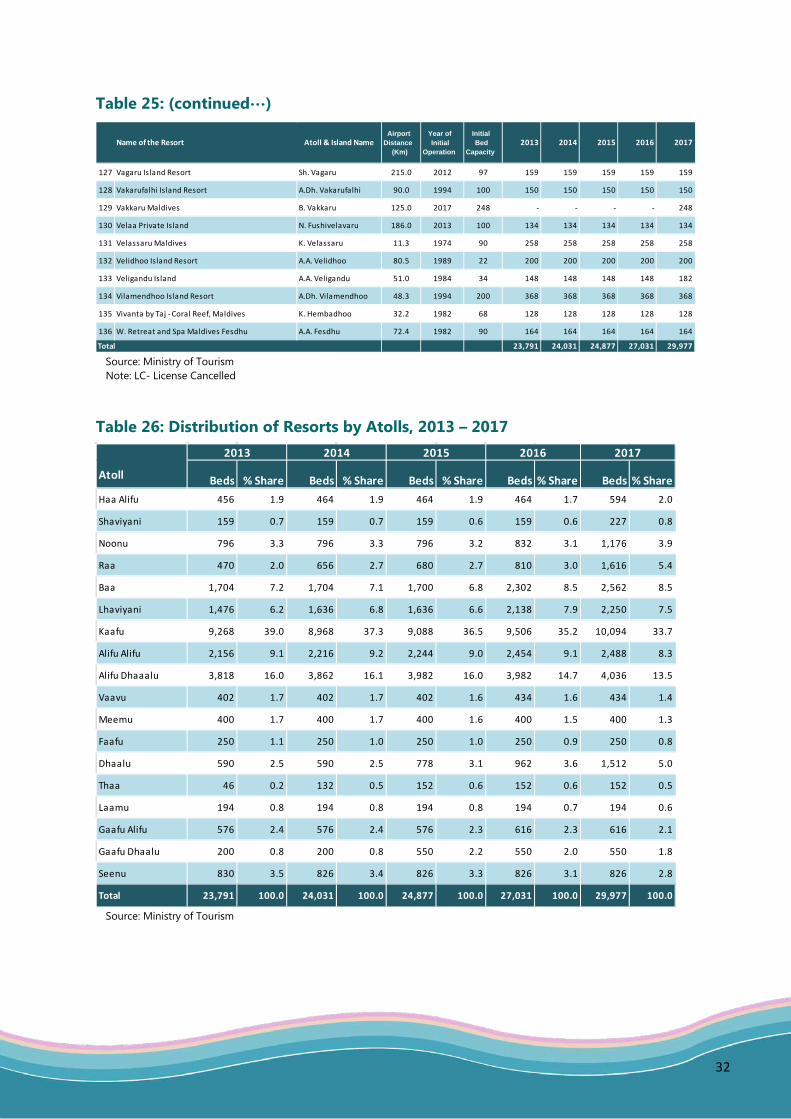
Table 25: Bed Capacity of Tourist Resorts, 2013 – 2017
Name of the Resort Atoll & Island NameAirport
Distance (Km)
Year of Initial
Operation
Initial Bed
Capacity2013 2014 2015 2016 2017
1 AaaVeee Nature's Paradise Dh. Dhoores 158.0 2015 66 - - 66 66 66
2 Adhaaran Club Rannaalhi K. Rannalhi 34.0 1978 34 256 256 256 256 260
3 Adhaaran Prestige Vaadhu K. Vaadhu 8.0 1978 18 100 100 100 100 100
4 Adhaaran Select Hudhuranfushi K. Lhohifushi 22.5 1979 40 354 354 354 354 404
5 Adhaaran Select Meedhupparu R. Meedhupparu 130.3 2000 430 470 470 470 470 470
6 Alidhoo Island Resort H.A. Alidhoo 300.0 2007 66 200 200 200 200 200
7 Alidhoo Island Resort H.A Manafaru 337.0 2007 100 166 174 174 174 174
8 Alimatha Aquatic Resort V. Alimatha 48.0 1975 20 312 312 312 312 312
9 Amari Havodda Maldives G.Dh. Havodda 405.0 2015 240 - - 240 240 240
10 Amaya Kuda Rah Maldives (Kudarah Island Resort) A.Dh. Kudarah 88.5 1991 50 60 60 120 120 102
11 Anantara Kihavah Villas B. Kihavah Haruvalhi 125.0 2010 110 172 172 172 172 172
12 Anantara Resort & Spa Maldives K. Dhigufinolhu 40.0 1980 24 220 220 220 220 226
13 Angaaga Island Resort and Spa A.Dh. Angaga 85.0 1989 100 140 180 180 180 180
14 Angsana Resort & Spa Maldives - Ihuru K. Ihuru 17.0 1978 20 90 90 90 90 90
15 Angsana Resort and Spa Maldives - Velavaru Dh. Velavaru 125.0 1998 50 236 236 238 238 238
16 Asdhu Sun Island K. Asdhu 32.0 1981 36 60 60 60 60 60
17 Atmosphere Kanifushi Maldives Lh. Kanifushi 133.0 2013 140 140 300 300 300 300
18 Ayada Maldives G.Dh. Magudhdhuva 420.0 2011 200 200 200 200 200 200
19 Bandos Maldives K. Bandos 8.0 1972 220 450 430 430 430 430
20 Banyan Tree Maldives Vabbinfaru K. Vabbinfaru 12.0 1977 24 96 96 96 96 96
21 Baros Maldives K. Baros 16.0 1973 56 150 150 150 150 150
22 Bathala Island Resort A.A. Bathala 48.3 1983 20 90 90 90 90 90
23 Biyaadhu Island Resort K. Biyaadhoo 18.0 1982 192 192 192 192 192 192
24 Canareef Resort Maldives S. Herethere 480.0 2007 106 546 542 542 542 542
25 Centara Grand Island Resort & Spa Maldives A.Dh. Machchafushi 95.0 1992 96 224 224 224 224 224
26 Centara Ras Fushi Resort & Spa K. Giraavaru 11.3 1980 40 220 220 220 220 280
27 Cheval Blanc Randheli N. Randheli 169.0 2013 120 120 120 120 120 120
28 Cinnamon Dhonveli Maldives K. Kanuoiy Huraa 13.0 1981 20 296 296 296 296 296
29 Cinnamon Hakuraa Huraa Maldives M. Hakuraa Huraa 128.7 1999 72 160 160 160 160 160
30 Club Farukolhu K. Farukolhufushi 2.0 1973 112 304 LC LC LC LC
31 Club Med Finolhu Villas K. Gasfinolhu 23.0 1980 18 80 104 104 104 104
32 Club Med Kanifinolhu K. Kanifinolhu 19.3 1978 18 492 492 492 492 492
33 Coco Palm Boduhithi K. Boduhithi 29.0 1979 50 206 206 206 206 200
34 Coco Palm Dhunikolhu B. Dhunikolhu 124.0 1998 192 200 200 196 196 196
35 Coco Privé Kuda Hithi Island K. Kudahithi 27.4 1984 12 14 14 14 14 14
36 Cocoa Island K. Makunufushi 30.0 1981 12 70 70 70 70 70
37 Cocoon Maldives Lh. Ookolhu Finolhu 130.0 2016 302 - - - 302 302
38 Conrad Maldives Rangali Island A.Dh. Rangalifinolhu 96.6 1992 80 304 304 304 304 304
39 Constance Halaveli Resort A.A. Halaveli 36.0 1982 30 172 172 172 172 172
40 Constance Moofushi Resort A.Dh. Moofushi 80.0 1990 84 220 220 220 220 220
41 Dhevanafushi Maldives Luxury Resort, Managed by G.A. Meradhoo 400.0 2011 38 74 74 74 74 74
42 Dhigali Maldives R. Dhigali 156.0 2017 358 - - - - 358
30
Table 25: (continued…)
Name of the Resort Atoll & Island NameAirport
Distance (Km)
Year of Initial
Operation
Initial Bed
Capacity2013 2014 2015 2016 2017
43 Dhiggiri Tourist Resort V. Dhiggiri 32.0 1982 50 90 90 90 122 122
44 Dhigufaru Island Resort B. Dhigufaruvinagandu 142.0 2016 80 - - - 80 80
45 Diamonds Athuruga Beach and Water Villas A.Dh. Athurugau 90.0 1990 79 146 146 146 146 146
46 Diamonds Thudufushi Beach & Water Villas A.Dh. Thundufushi 80.5 1990 74 144 144 144 144 144
47 Dream Island Maldives K. Villivaru 29.0 1981 120 120 120 120 120 120
48 Drift Thelu Veliga Retreat A.Dh. Theluveliga 90.0 2015 60 - - 60 60 60
49 Dusit Thani Maldives B. Mudhdhoo 120.0 2012 20 208 208 208 208 208
50 Ellaidhoo Maldives By Cinnamon A.A. Ellaidhoo 54.0 1985 32 224 224 224 224 224
51 Emboodhu Village K. Emboodhu 8.0 1979 44 236 236 236 236 236
52 Eriyadhu Island Resort K. Eriyadhu 40.0 1982 40 114 114 114 152 152
53 Fihalhohi Island Resort K. Fihaalhohi 28.0 1981 90 300 300 300 300 300
54 Filitheyo Island Resort F. Filitheyo 120.7 1999 250 250 250 250 250 250
55 Finolhu Baa Atoll Maldives B. Kanufushi 121.0 2016 272 - - - 272 272
56 Four Seasons Private Island Maldives at Voavah B. Voavah 134.0 2016 26 - - - 26 26
57 Four Seasons Resort Maldives at Kuda Huraa K. Kuda Huraa 12.9 1977 32 212 212 212 212 220
58 Four Seasons Resort Maldives at Landaa GiraavaruB. Landaa Giraavaru 120.0 2006 206 206 206 206 244 244
59 Fun Island Resort K. Bodufinolhu 38.0 1980 44 200 200 200 200 150
60 Furaveri Island Resort & Spa R. Furaveri 151.0 2016 130 - - - 130 202
61 Fushifaru Maldives Lh. Fushifaru 145.0 2017 98 - - - - 98
62 Gangehi Island Resort A.A. Gangehi 77.2 1987 50 72 72 72 72 72
63 Gili Lankanfushi K. Lankanfushi 9.7 1980 12 94 94 94 94 94
64 Grand Park Kohdhipparu Maldives K. Kohdhipparu 18.0 2017 250 - - - - 250
65 Hideaway Beach Resort and Spa at Dhonakulhi Isla H.A. Dhonakulhi 250.0 2005 50 90 90 90 90 220
66 Holiday Inn Resort Kandooma Maldives K. Kandoomafushi 27.4 1985 98 322 322 322 322 322
67 Holiday Island A.Dh. Dhiffushi 93.0 1994 284 284 284 284 284 284
68 Hurawalhi Island Resort Lh. Hurawalhi 140.0 2016 180 - - - 180 180
69 Huvafenfushi K. Nakatchafushi 25.7 1979 80 102 102 102 102 98
70 Jumeirah Vittaveli Island Resort at Bolifushi K. Bolifushi 12.0 1982 64 178 178 178 178 196
71 Kandholhu Island Maldives A.A. Kandholhudhoo 74.6 2014 60 - 60 60 60 60
72 Kandima Maldives Dh. Kandinma 170.0 2017 544 - - - - 544
73 Kanuhura Lh. Kanuhuraa 125.5 1999 200 200 200 200 200 192
74 Kihaad Resort B. Kihaadhuffaru 104.6 1999 200 236 236 236 236 236
75 Komandoo Maldive Island Resort Lh. Komandoo 128.7 1998 90 120 120 120 130 130
76 Kudafushi Resort & Spa R. Kudafushi 160.0 2017 214 - - - - 214
77 Kuramathi Maldives A.A. Kuramathi 56.3 1977 48 580 580 580 790 790
78 Kuredhdhu Island Resort Lh. Kuredhdhu 128.7 1978 18 768 768 768 778 778
79 Kurumba Maldives K. Vihamanaafushi 3.2 1972 60 362 362 362 362 362
80 Lily Beach Resort A.Dh. Huvahendhoo 85.0 1994 168 250 250 250 250 250
81 Loama Resort Maldives at Maamigili R. Maamigili 177.0 2014 40 - 186 210 210 210
82 Lux South Ari Atoll, Maldives A.Dh. Dhidhdhufinolhu 104.0 1988 180 394 394 394 394 394
83 Maalifushi By Como Th. Male'fushi 210.0 2013 46 46 132 152 152 152
84 Maayafushi Tourist Resort A.A. Maayafushi 63.0 1983 48 150 150 150 150 150
31
Table 25: (continued…)
Name of the Resort Atoll & Island Name
Airport Distance
(Km)
Year of Initial
Operation
Initial Bed
Capacity2013 2014 2015 2016 2017
85 Madoogali Resort A.A. Madoogali 77.2 1989 70 112 112 112 112 112
86 Makunudhoo Island K. Makunudhu 38.6 1983 58 74 74 74 74 72
87 Malahini Kuda Bandos K. Kuda Bandos 9.0 2016 164 - - - 164 164
88 Medhufushi Island Resort M. Medhufushi 128.7 2000 240 240 240 240 240 240
89 Meeru Island Resort K. Meerufenfushi 37.0 1978 128 570 570 570 570 572
90 Milaidhoo Island Maldives B. Milaidhoo 127.0 2016 30 - - - 88 100
91 Mirihi Island Resort A.Dh. Mirihi 112.6 1989 36 72 76 76 76 76
92 Naladhu (Palm Tree Island) K. Veligandu Huraa 27.0 1986 32 138 138 138 138 176
93 Nika Island Resort A.A. Kudafolhudhu 69.2 1983 30 76 76 104 104 104
94 Niyama Maldives Dh. Olhuveli & Embudhu 128.0 2012 56 154 154 274 274 274
95 Noku Maldives N. Kudafunafaru 180.0 2008 100 100 100 100 100 100
96 Oblu By Atmosphere at Helengeli K. Helengeli 46.7 1979 20 100 100 220 236 236
97 Olhuveli Beach & Spa Resort K. Olhuveli 51.5 1979 36 332 332 332 332 416
98 One & Only Reethi Rah, Maldives K. Medhufinolhu 64.4 1979 24 268 268 268 268 268
99 Outrigger Konotta Maldives Resort G.Dh. Konotta 416.0 2015 110 - - 110 110 110
100 Ozen by Atmosphere at Maadhoo K. Maadhoo Finolhu 32.0 2016 198 - - - 204 204
101 Palm Beach Resort & Spa Maldives Lh. Madhiriguraidhoo 128.7 1999 200 248 248 248 248 270
102 Paradise Island Resort & Spa K. Lankanfinolhu 9.6 1979 24 568 568 568 568 568
103 Park Hyatt Maldives, Hadaha G.A. Hadahaa 405.0 2009 100 100 100 100 100 100
104 Ranveli Island Resort A.Dh. Villingilivaru 77.0 1991 112 112 112 112 112 112
105 Reethi Beach Resort B. Fonimagoodhoo 104.6 1998 200 248 248 248 248 248
106 Reethi Faru Resort R. Filaidhoo 155.0 2017 162 - - - - 162
107 Rihiveli K. Mahaanaelhi Huraa 40.2 1980 40 100 100 100 100 100
108 Robinson Club Maldives G.A. Funamauddua 400.0 2009 100 202 202 202 242 242
109 Robinson Club Noonu N. Orivaru 180.0 2017 300 - - - - 300
110 Royal Island Resort & Spa B. Horubadhoo 110.0 2001 304 304 304 304 304 304
111 Safari Island A.A. Mushimasmingili 60.0 2013 168 168 168 168 168 168
112 Shangri - La's Villingili Resort & Spa, Maldives S. Villingili 478.0 2009 284 284 284 284 284 284
113 Sheraton Maldives Full Moon Reosort & Spa K. Furanafushi 5.6 1973 112 312 312 312 312 352
114 Sirru Fen Fushi Sh. Gaakoshibee 240.0 2017 68 - - - - 68
115 Six Senses Laamu L. Olhuveli 260.0 2011 66 194 194 194 194 194
116 Soneva Fushi By Six Senses B. Kunfunadhoo 104.6 1983 50 130 130 130 228 228
117 Soneva Jani N. Medhufaru 160.0 2016 36 - - - 36 74
118 Summer Island Maldives K. Ziyaaraifushi 35.0 1983 58 230 230 230 230 314
119 Sun Aqua Vilu Reef Maldives Dh. Meedhuffushi 128.7 1998 136 200 200 200 200 200
120 Sun Island Resort & Spa A.Dh. Nalaguraidhoo 99.8 1998 700 852 852 852 852 924
121 Taj Exortica Resort & Spa Maldives K. Embudhu Finolhu 12.9 1983 20 128 128 128 128 134
122 The Residence Maldives G.A. Falhumafushi 405.0 2012 108 200 200 200 200 200
123 The St. Regis Vommuli Resort, Maldives Dh. Vommuli 128.0 2016 28 - - - 184 190
124 The Sun Siyam Iru Fushi Maldives N. Medhafushi 174.0 2008 200 442 442 442 442 448
125 Thulhaagiri Island Resort K. Thulhaagiri 11.0 1980 44 172 172 172 168 168
126 Twin Island Resort A.Dh. Maafushivaru 54.7 1991 60 98 98 98 98 98
32
Table 25: (continued…)
Table 26: Distribution of Resorts by Atolls, 2013 – 2017
Name of the Resort Atoll & Island NameAirport
Distance (Km)
Year of Initial
Operation
Initial Bed
Capacity2013 2014 2015 2016 2017
127 Vagaru Island Resort Sh. Vagaru 215.0 2012 97 159 159 159 159 159
128 Vakarufalhi Island Resort A.Dh. Vakarufalhi 90.0 1994 100 150 150 150 150 150
129 Vakkaru Maldives B. Vakkaru 125.0 2017 248 - - - - 248
130 Velaa Private Island N. Fushivelavaru 186.0 2013 100 134 134 134 134 134
131 Velassaru Maldives K. Velassaru 11.3 1974 90 258 258 258 258 258
132 Velidhoo Island Resort A.A. Velidhoo 80.5 1989 22 200 200 200 200 200
133 Veligandu Island A.A. Veligandu 51.0 1984 34 148 148 148 148 182
134 Vilamendhoo Island Resort A.Dh. Vilamendhoo 48.3 1994 200 368 368 368 368 368
135 Vivanta by Taj - Coral Reef, Maldives K. Hembadhoo 32.2 1982 68 128 128 128 128 128
136 W. Retreat and Spa Maldives Fesdhu A.A. Fesdhu 72.4 1982 90 164 164 164 164 164
Total 23,791 24,031 24,877 27,031 29,977
Source: Ministry of Tourism Note: LC- License Cancelled
Source: Ministry of Tourism
2013 2014 2015 2016 2017
Atoll Beds % Share Beds % Share Beds % Share Beds % Share Beds % ShareHaa Alifu 456 1.9 464 1.9 464 1.9 464 1.7 594 2.0
Shaviyani 159 0.7 159 0.7 159 0.6 159 0.6 227 0.8
Noonu 796 3.3 796 3.3 796 3.2 832 3.1 1,176 3.9
Raa 470 2.0 656 2.7 680 2.7 810 3.0 1,616 5.4
Baa 1,704 7.2 1,704 7.1 1,700 6.8 2,302 8.5 2,562 8.5
Lhaviyani 1,476 6.2 1,636 6.8 1,636 6.6 2,138 7.9 2,250 7.5
Kaafu 9,268 39.0 8,968 37.3 9,088 36.5 9,506 35.2 10,094 33.7
Alifu Alifu 2,156 9.1 2,216 9.2 2,244 9.0 2,454 9.1 2,488 8.3
Alifu Dhaaalu 3,818 16.0 3,862 16.1 3,982 16.0 3,982 14.7 4,036 13.5
Vaavu 402 1.7 402 1.7 402 1.6 434 1.6 434 1.4
Meemu 400 1.7 400 1.7 400 1.6 400 1.5 400 1.3
Faafu 250 1.1 250 1.0 250 1.0 250 0.9 250 0.8
Dhaalu 590 2.5 590 2.5 778 3.1 962 3.6 1,512 5.0
Thaa 46 0.2 132 0.5 152 0.6 152 0.6 152 0.5
Laamu 194 0.8 194 0.8 194 0.8 194 0.7 194 0.6
Gaafu Alifu 576 2.4 576 2.4 576 2.3 616 2.3 616 2.1
Gaafu Dhaalu 200 0.8 200 0.8 550 2.2 550 2.0 550 1.8
Seenu 830 3.5 826 3.4 826 3.3 826 3.1 826 2.8
Total 23,791 100.0 24,031 100.0 24,877 100.0 27,031 100.0 29,977 100.0
33
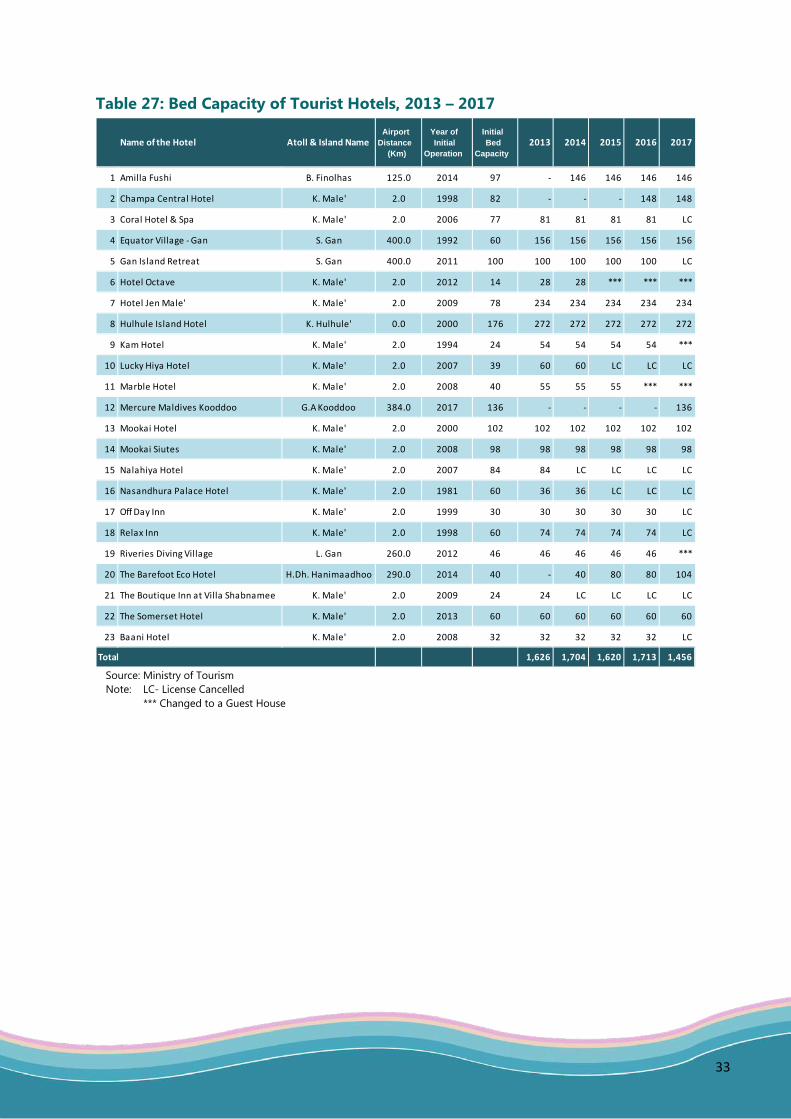
Table 27: Bed Capacity of Tourist Hotels, 2013 – 2017
Name of the Hotel Atoll & Island NameAirport
Distance (Km)
Year of Initial
Operation
Initial Bed
Capacity2013 2014 2015 2016 2017
1 Amilla Fushi B. Finolhas 125.0 2014 97 - 146 146 146 146
2 Champa Central Hotel K. Male' 2.0 1998 82 - - - 148 148
3 Coral Hotel & Spa K. Male' 2.0 2006 77 81 81 81 81 LC
4 Equator Village - Gan S. Gan 400.0 1992 60 156 156 156 156 156
5 Gan Island Retreat S. Gan 400.0 2011 100 100 100 100 100 LC
6 Hotel Octave K. Male' 2.0 2012 14 28 28 *** *** ***
7 Hotel Jen Male' K. Male' 2.0 2009 78 234 234 234 234 234
8 Hulhule Island Hotel K. Hulhule' 0.0 2000 176 272 272 272 272 272
9 Kam Hotel K. Male' 2.0 1994 24 54 54 54 54 ***
10 Lucky Hiya Hotel K. Male' 2.0 2007 39 60 60 LC LC LC
11 Marble Hotel K. Male' 2.0 2008 40 55 55 55 *** ***
12 Mercure Maldives Kooddoo G.A Kooddoo 384.0 2017 136 - - - - 136
13 Mookai Hotel K. Male' 2.0 2000 102 102 102 102 102 102
14 Mookai Siutes K. Male' 2.0 2008 98 98 98 98 98 98
15 Nalahiya Hotel K. Male' 2.0 2007 84 84 LC LC LC LC
16 Nasandhura Palace Hotel K. Male' 2.0 1981 60 36 36 LC LC LC
17 Off Day Inn K. Male' 2.0 1999 30 30 30 30 30 LC
18 Relax Inn K. Male' 2.0 1998 60 74 74 74 74 LC
19 Riveries Diving Village L. Gan 260.0 2012 46 46 46 46 46 ***
20 The Barefoot Eco Hotel H.Dh. Hanimaadhoo 290.0 2014 40 - 40 80 80 104
21 The Boutique Inn at Villa Shabnamee K. Male' 2.0 2009 24 24 LC LC LC LC
22 The Somerset Hotel K. Male' 2.0 2013 60 60 60 60 60 60
23 Baani Hotel K. Male' 2.0 2008 32 32 32 32 32 LC
Total 1,626 1,704 1,620 1,713 1,456
Source: Ministry of Tourism Note: LC- License Cancelled *** Changed to a Guest House
34
Table 28: Tourist Arrivals and Market Share by Selected Markets, 2013 – 2017
REGION / NATIONALITY 2013 2014 2015 2016 2017
EUROPE 527,274 (46.9) 529,291 (43.9) 535,962 (43.4) 575,176 (44.7) 646,363 (46.5)
Central / Eastern Europe 119,568 (10.6) 109,638 (9.1) 92,742 (7.5) 104,554 (8.1) 129,490 (9.3)
Belarus 2,030 (0.2) 1,885 (0.2) 1,508 (0.1) 1,570 (0.1) 1,776 (0.1)
Bulgaria 1,882 (0.2) 2,263 (0.2) 2,904 (0.2) 3,758 (0.3) 5,150 (0.4)
Czech Republic 6,421 (0.6) 6,450 (0.5) 8,105 (0.7) 10,338 (0.8) 11,459 (0.8)
Hungary 2,796 (0.2) 3,589 (0.3) 4,436 (0.4) 5,539 (0.4) 6,375 (0.5)
Kazakhstan 3,131 (0.3) 3,208 (0.3) 3,394 (0.3) 3,398 (0.3) 4,446 (0.3)
Poland 6,668 (0.6) 6,182 (0.5) 6,879 (0.6) 8,976 (0.7) 8,699 (0.6)
Romania 2,423 (0.2) 3,204 (0.3) 3,918 (0.3) 5,337 (0.4) 6,914 (0.5)
Russia 76,479 (6.8) 66,308 (5.5) 44,323 (3.6) 46,522 (3.6) 61,931 (4.5)
Slovakia 2,758 (0.2) 3,262 (0.3) 4,286 (0.3) 4,957 (0.4) 6,079 (0.4)
Ukraine 10,362 (0.9) 8,057 (0.7) 6,747 (0.5) 7,599 (0.6) 9,722 (0.7)
Other Central / Eastern Europe 4,618 (0.4) 5,230 (0.4) 6,242 (0.5) 6,560 (0.5) 3,812 (0.3)
Northern Europe 103,104 (9.2) 109,586 (9.1) 119,562 (9.7) 132,626 (10.3) 140,535 (10.1)
Denmark 4,055 (0.4) 5,008 (0.4) 8,418 (0.7) 9,747 (0.8) 10,629 (0.8)
Finland 1,549 (0.1) 2,002 (0.2) 2,109 (0.2) 2,589 (0.2) 3,705 (0.3)
Ireland 2,590 (0.2) 2,759 (0.2) 2,856 (0.2) 3,449 (0.3) 3,892 (0.3)
Norway 3,281 (0.3) 3,882 (0.3) 4,153 (0.3) 3,971 (0.3) 5,006 (0.4)
Sweden 5,694 (0.5) 7,163 (0.6) 9,138 (0.7) 10,918 (0.8) 13,127 (0.9)
United Kingdom 85,869 (7.6) 88,704 (7.4) 92,775 (7.5) 101,843 (7.9) 103,977 (7.5)
Other Northern Europe 66 (0.0) 68 (0.0) 113 (0.0) 109 (0.0) 199 (0.0)
Southern Europe 79,364 (7.1) 84,470 (7.0) 95,817 (7.8) 109,326 (8.5) 132,544 (9.5)
Greece 1,841 (0.2) 1,981 (0.2) 1,700 (0.1) 2,077 (0.2) 2,470 (0.2)
Italy 57,854 (5.1) 57,862 (4.8) 65,616 (5.3) 71,202 (5.5) 88,867 (6.4)
Portugal 4,617 (0.4) 4,916 (0.4) 5,057 (0.4) 6,259 (0.5) 6,882 (0.5)
Slovenia 1,243 (0.1) 1,319 (0.1) 1,470 (0.1) 1,548 (0.1) 2,100 (0.2)
Spain 11,040 (1.0) 15,230 (1.3) 17,816 (1.4) 23,393 (1.8) 25,843 (1.9)
Other Southern Europe 2,769 (0.2) 3,162 (0.3) 4,158 (0.3) 4,847 (0.4) 2,763 (0.2)
Western Europe 212,655 (18.9) 213,289 (17.7) 213,729 (17.3) 213,006 (16.6) 226,114 (16.3)
Austria 18,140 (1.6) 18,726 (1.6) 18,981 (1.5) 17,654 (1.4) 19,709 (1.4)
Belgium 5,130 (0.5) 5,195 (0.4) 5,250 (0.4) 5,571 (0.4) 5,854 (0.4)
France 54,328 (4.8) 50,656 (4.2) 42,024 (3.4) 40,487 (3.1) 42,365 (3.0)
Germany 93,598 (8.3) 98,328 (8.2) 105,132 (8.5) 106,381 (8.3) 112,109 (8.1)
Netherlands 6,453 (0.6) 7,936 (0.7) 9,640 (0.8) 10,372 (0.8) 12,438 (0.9)
Switzerland 34,102 (3.0) 31,497 (2.6) 31,923 (2.6) 31,678 (2.5) 32,651 (2.3)
Other Western Europe 904 (0.1) 951 (0.1) 779 (0.1) 863 (0.1) 988 (0.1)
East Mediterranean Europe 12,583 (1.1) 12,308 (1.0) 14,112 (1.1) 15,664 (1.2) 17,680 (1.3)
Israel 3,253 (0.3) 3,299 (0.3) 3,567 (0.3) 5,072 (0.4) 5,949 (0.4)
Turkey 9,117 (0.8) 8,668 (0.7) 10,200 (0.8) 10,091 (0.8) 11,168 (0.8)
Other East Mediterranean Europe 213 (0.0) 341 (0.0) 345 (0.0) 501 (0.0) 563 (0.0)
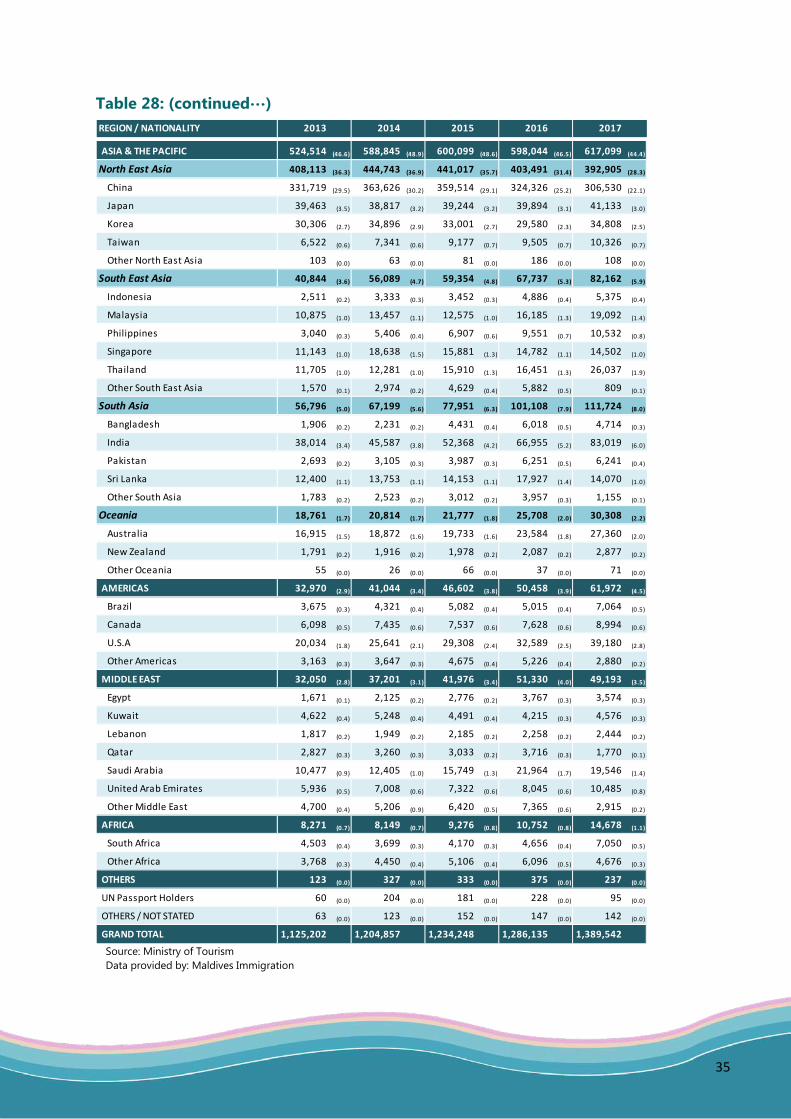
35
Table 28: (continued…)
REGION / NATIONALITY 2013 2014 2015 2016 2017
ASIA & THE PACIFIC 524,514 (46.6) 588,845 (48.9) 600,099 (48.6) 598,044 (46.5) 617,099 (44.4)
North East Asia 408,113 (36.3) 444,743 (36.9) 441,017 (35.7) 403,491 (31.4) 392,905 (28.3)
China 331,719 (29.5) 363,626 (30.2) 359,514 (29.1) 324,326 (25.2) 306,530 (22.1)
Japan 39,463 (3.5) 38,817 (3.2) 39,244 (3.2) 39,894 (3.1) 41,133 (3.0)
Korea 30,306 (2.7) 34,896 (2.9) 33,001 (2.7) 29,580 (2.3) 34,808 (2.5)
Taiwan 6,522 (0.6) 7,341 (0.6) 9,177 (0.7) 9,505 (0.7) 10,326 (0.7)
Other North East Asia 103 (0.0) 63 (0.0) 81 (0.0) 186 (0.0) 108 (0.0)
South East Asia 40,844 (3.6) 56,089 (4.7) 59,354 (4.8) 67,737 (5.3) 82,162 (5.9)
Indonesia 2,511 (0.2) 3,333 (0.3) 3,452 (0.3) 4,886 (0.4) 5,375 (0.4)
Malaysia 10,875 (1.0) 13,457 (1.1) 12,575 (1.0) 16,185 (1.3) 19,092 (1.4)
Philippines 3,040 (0.3) 5,406 (0.4) 6,907 (0.6) 9,551 (0.7) 10,532 (0.8)
Singapore 11,143 (1.0) 18,638 (1.5) 15,881 (1.3) 14,782 (1.1) 14,502 (1.0)
Thailand 11,705 (1.0) 12,281 (1.0) 15,910 (1.3) 16,451 (1.3) 26,037 (1.9)
Other South East Asia 1,570 (0.1) 2,974 (0.2) 4,629 (0.4) 5,882 (0.5) 809 (0.1)
South Asia 56,796 (5.0) 67,199 (5.6) 77,951 (6.3) 101,108 (7.9) 111,724 (8.0)
Bangladesh 1,906 (0.2) 2,231 (0.2) 4,431 (0.4) 6,018 (0.5) 4,714 (0.3)
India 38,014 (3.4) 45,587 (3.8) 52,368 (4.2) 66,955 (5.2) 83,019 (6.0)
Pakistan 2,693 (0.2) 3,105 (0.3) 3,987 (0.3) 6,251 (0.5) 6,241 (0.4)
Sri Lanka 12,400 (1.1) 13,753 (1.1) 14,153 (1.1) 17,927 (1.4) 14,070 (1.0)
Other South Asia 1,783 (0.2) 2,523 (0.2) 3,012 (0.2) 3,957 (0.3) 1,155 (0.1)
Oceania 18,761 (1.7) 20,814 (1.7) 21,777 (1.8) 25,708 (2.0) 30,308 (2.2)
Australia 16,915 (1.5) 18,872 (1.6) 19,733 (1.6) 23,584 (1.8) 27,360 (2.0)
New Zealand 1,791 (0.2) 1,916 (0.2) 1,978 (0.2) 2,087 (0.2) 2,877 (0.2)
Other Oceania 55 (0.0) 26 (0.0) 66 (0.0) 37 (0.0) 71 (0.0)
AMERICAS 32,970 (2.9) 41,044 (3.4) 46,602 (3.8) 50,458 (3.9) 61,972 (4.5)
Brazil 3,675 (0.3) 4,321 (0.4) 5,082 (0.4) 5,015 (0.4) 7,064 (0.5)
Canada 6,098 (0.5) 7,435 (0.6) 7,537 (0.6) 7,628 (0.6) 8,994 (0.6)
U.S.A 20,034 (1.8) 25,641 (2.1) 29,308 (2.4) 32,589 (2.5) 39,180 (2.8)
Other Americas 3,163 (0.3) 3,647 (0.3) 4,675 (0.4) 5,226 (0.4) 2,880 (0.2)
MIDDLE EAST 32,050 (2.8) 37,201 (3.1) 41,976 (3.4) 51,330 (4.0) 49,193 (3.5)
Egypt 1,671 (0.1) 2,125 (0.2) 2,776 (0.2) 3,767 (0.3) 3,574 (0.3)
Kuwait 4,622 (0.4) 5,248 (0.4) 4,491 (0.4) 4,215 (0.3) 4,576 (0.3)
Lebanon 1,817 (0.2) 1,949 (0.2) 2,185 (0.2) 2,258 (0.2) 2,444 (0.2)
Qatar 2,827 (0.3) 3,260 (0.3) 3,033 (0.2) 3,716 (0.3) 1,770 (0.1)
Saudi Arabia 10,477 (0.9) 12,405 (1.0) 15,749 (1.3) 21,964 (1.7) 19,546 (1.4)
United Arab Emirates 5,936 (0.5) 7,008 (0.6) 7,322 (0.6) 8,045 (0.6) 10,485 (0.8)
Other Middle East 4,700 (0.4) 5,206 (0.9) 6,420 (0.5) 7,365 (0.6) 2,915 (0.2)
AFRICA 8,271 (0.7) 8,149 (0.7) 9,276 (0.8) 10,752 (0.8) 14,678 (1.1)
South Africa 4,503 (0.4) 3,699 (0.3) 4,170 (0.3) 4,656 (0.4) 7,050 (0.5)
Other Africa 3,768 (0.3) 4,450 (0.4) 5,106 (0.4) 6,096 (0.5) 4,676 (0.3)
OTHERS 123 (0.0) 327 (0.0) 333 (0.0) 375 (0.0) 237 (0.0)
UN Passport Holders 60 (0.0) 204 (0.0) 181 (0.0) 228 (0.0) 95 (0.0)
OTHERS / NOT STATED 63 (0.0) 123 (0.0) 152 (0.0) 147 (0.0) 142 (0.0)
GRAND TOTAL 1,125,202 1,204,857 1,234,248 1,286,135 1,389,542
Source: Ministry of Tourism Data provided by: Maldives Immigration
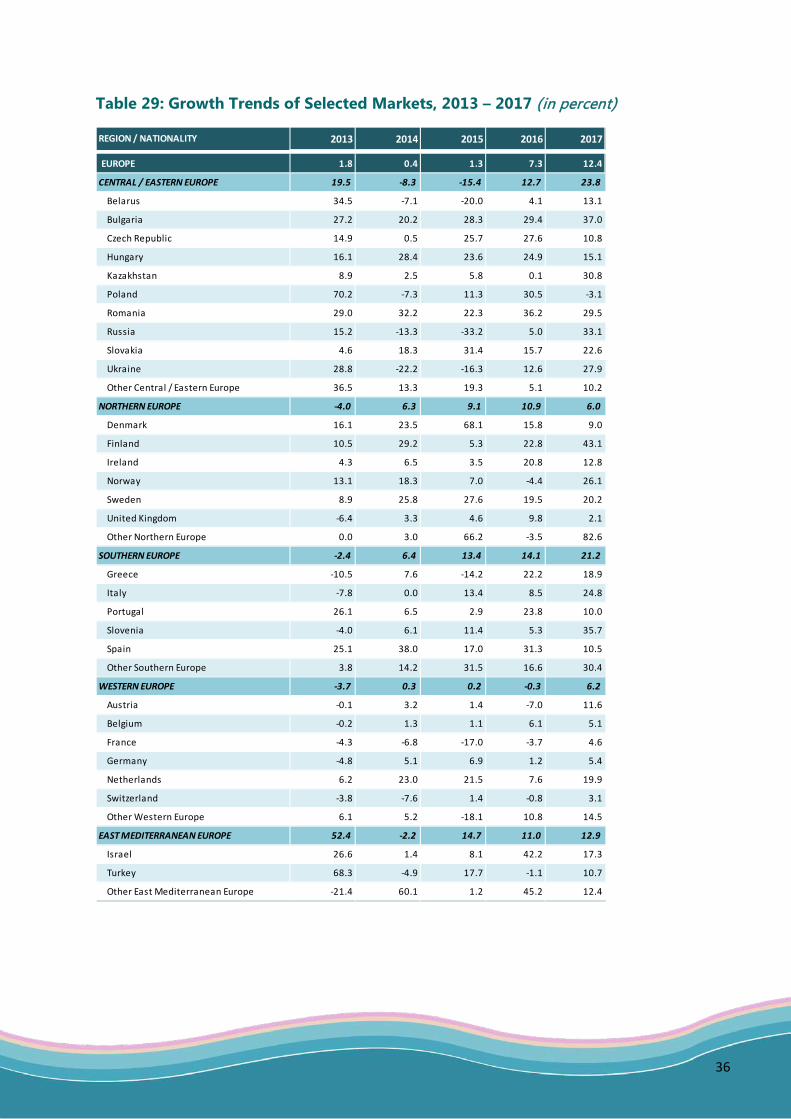
36
Table 29: Growth Trends of Selected Markets, 2013 – 2017 (in percent)
REGION / NATIONALITY 2013 2014 2015 2016 2017
EUROPE 1.8 0.4 1.3 7.3 12.4
CENTRAL / EASTERN EUROPE 19.5 -8.3 -15.4 12.7 23.8
Belarus 34.5 -7.1 -20.0 4.1 13.1
Bulgaria 27.2 20.2 28.3 29.4 37.0
Czech Republic 14.9 0.5 25.7 27.6 10.8
Hungary 16.1 28.4 23.6 24.9 15.1
Kazakhstan 8.9 2.5 5.8 0.1 30.8
Poland 70.2 -7.3 11.3 30.5 -3.1
Romania 29.0 32.2 22.3 36.2 29.5
Russia 15.2 -13.3 -33.2 5.0 33.1
Slovakia 4.6 18.3 31.4 15.7 22.6
Ukraine 28.8 -22.2 -16.3 12.6 27.9
Other Central / Eastern Europe 36.5 13.3 19.3 5.1 10.2
NORTHERN EUROPE -4.0 6.3 9.1 10.9 6.0
Denmark 16.1 23.5 68.1 15.8 9.0
Finland 10.5 29.2 5.3 22.8 43.1
Ireland 4.3 6.5 3.5 20.8 12.8
Norway 13.1 18.3 7.0 -4.4 26.1
Sweden 8.9 25.8 27.6 19.5 20.2
United Kingdom -6.4 3.3 4.6 9.8 2.1
Other Northern Europe 0.0 3.0 66.2 -3.5 82.6
SOUTHERN EUROPE -2.4 6.4 13.4 14.1 21.2
Greece -10.5 7.6 -14.2 22.2 18.9
Italy -7.8 0.0 13.4 8.5 24.8
Portugal 26.1 6.5 2.9 23.8 10.0
Slovenia -4.0 6.1 11.4 5.3 35.7
Spain 25.1 38.0 17.0 31.3 10.5
Other Southern Europe 3.8 14.2 31.5 16.6 30.4
WESTERN EUROPE -3.7 0.3 0.2 -0.3 6.2
Austria -0.1 3.2 1.4 -7.0 11.6
Belgium -0.2 1.3 1.1 6.1 5.1
France -4.3 -6.8 -17.0 -3.7 4.6
Germany -4.8 5.1 6.9 1.2 5.4
Netherlands 6.2 23.0 21.5 7.6 19.9
Switzerland -3.8 -7.6 1.4 -0.8 3.1
Other Western Europe 6.1 5.2 -18.1 10.8 14.5
EAST MEDITERRANEAN EUROPE 52.4 -2.2 14.7 11.0 12.9
Israel 26.6 1.4 8.1 42.2 17.3
Turkey 68.3 -4.9 17.7 -1.1 10.7
Other East Mediterranean Europe -21.4 60.1 1.2 45.2 12.4
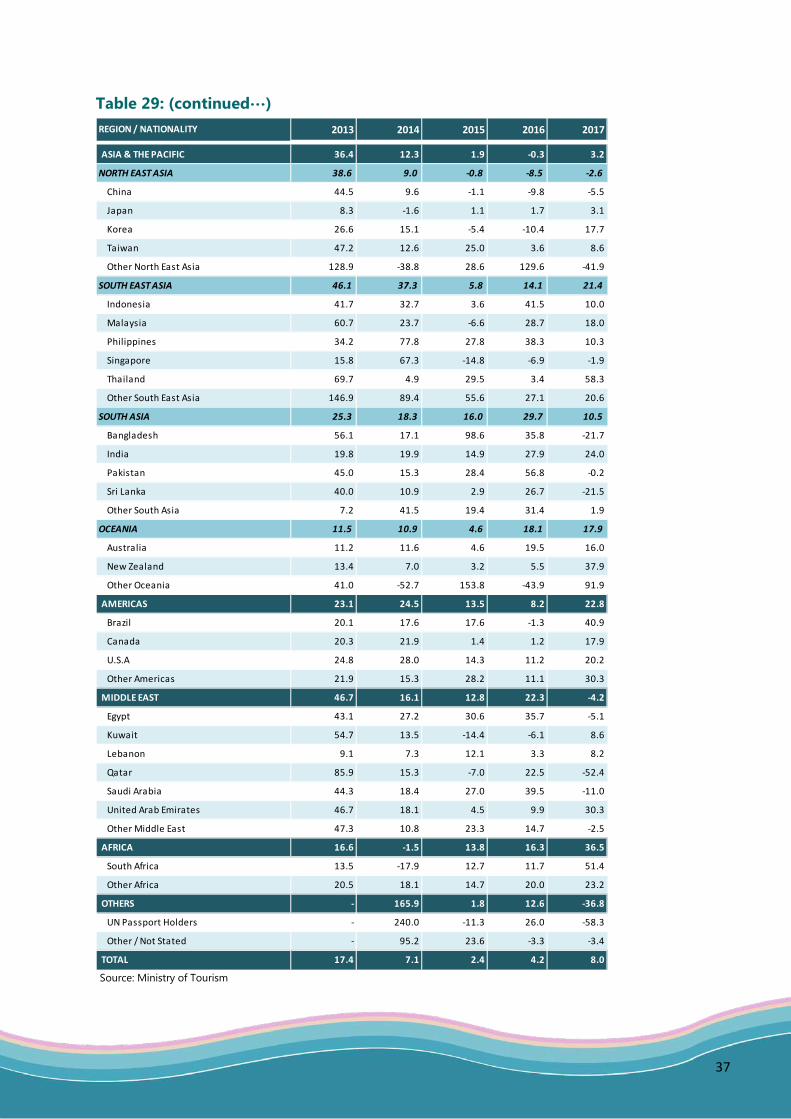
37
Table 29: (continued…)
REGION / NATIONALITY 2013 2014 2015 2016 2017
ASIA & THE PACIFIC 36.4 12.3 1.9 -0.3 3.2
NORTH EAST ASIA 38.6 9.0 -0.8 -8.5 -2.6
China 44.5 9.6 -1.1 -9.8 -5.5
Japan 8.3 -1.6 1.1 1.7 3.1
Korea 26.6 15.1 -5.4 -10.4 17.7
Taiwan 47.2 12.6 25.0 3.6 8.6
Other North East Asia 128.9 -38.8 28.6 129.6 -41.9
SOUTH EAST ASIA 46.1 37.3 5.8 14.1 21.4
Indonesia 41.7 32.7 3.6 41.5 10.0
Malaysia 60.7 23.7 -6.6 28.7 18.0
Philippines 34.2 77.8 27.8 38.3 10.3
Singapore 15.8 67.3 -14.8 -6.9 -1.9
Thailand 69.7 4.9 29.5 3.4 58.3
Other South East Asia 146.9 89.4 55.6 27.1 20.6
SOUTH ASIA 25.3 18.3 16.0 29.7 10.5
Bangladesh 56.1 17.1 98.6 35.8 -21.7
India 19.8 19.9 14.9 27.9 24.0
Pakistan 45.0 15.3 28.4 56.8 -0.2
Sri Lanka 40.0 10.9 2.9 26.7 -21.5
Other South Asia 7.2 41.5 19.4 31.4 1.9
OCEANIA 11.5 10.9 4.6 18.1 17.9
Australia 11.2 11.6 4.6 19.5 16.0
New Zealand 13.4 7.0 3.2 5.5 37.9
Other Oceania 41.0 -52.7 153.8 -43.9 91.9
AMERICAS 23.1 24.5 13.5 8.2 22.8
Brazil 20.1 17.6 17.6 -1.3 40.9
Canada 20.3 21.9 1.4 1.2 17.9
U.S.A 24.8 28.0 14.3 11.2 20.2
Other Americas 21.9 15.3 28.2 11.1 30.3
MIDDLE EAST 46.7 16.1 12.8 22.3 -4.2
Egypt 43.1 27.2 30.6 35.7 -5.1
Kuwait 54.7 13.5 -14.4 -6.1 8.6
Lebanon 9.1 7.3 12.1 3.3 8.2
Qatar 85.9 15.3 -7.0 22.5 -52.4
Saudi Arabia 44.3 18.4 27.0 39.5 -11.0
United Arab Emirates 46.7 18.1 4.5 9.9 30.3
Other Middle East 47.3 10.8 23.3 14.7 -2.5
AFRICA 16.6 -1.5 13.8 16.3 36.5
South Africa 13.5 -17.9 12.7 11.7 51.4
Other Africa 20.5 18.1 14.7 20.0 23.2
OTHERS - 165.9 1.8 12.6 -36.8
UN Passport Holders - 240.0 -11.3 26.0 -58.3
Other / Not Stated - 95.2 23.6 -3.3 -3.4
TOTAL 17.4 7.1 2.4 4.2 8.0
Source: Ministry of Tourism
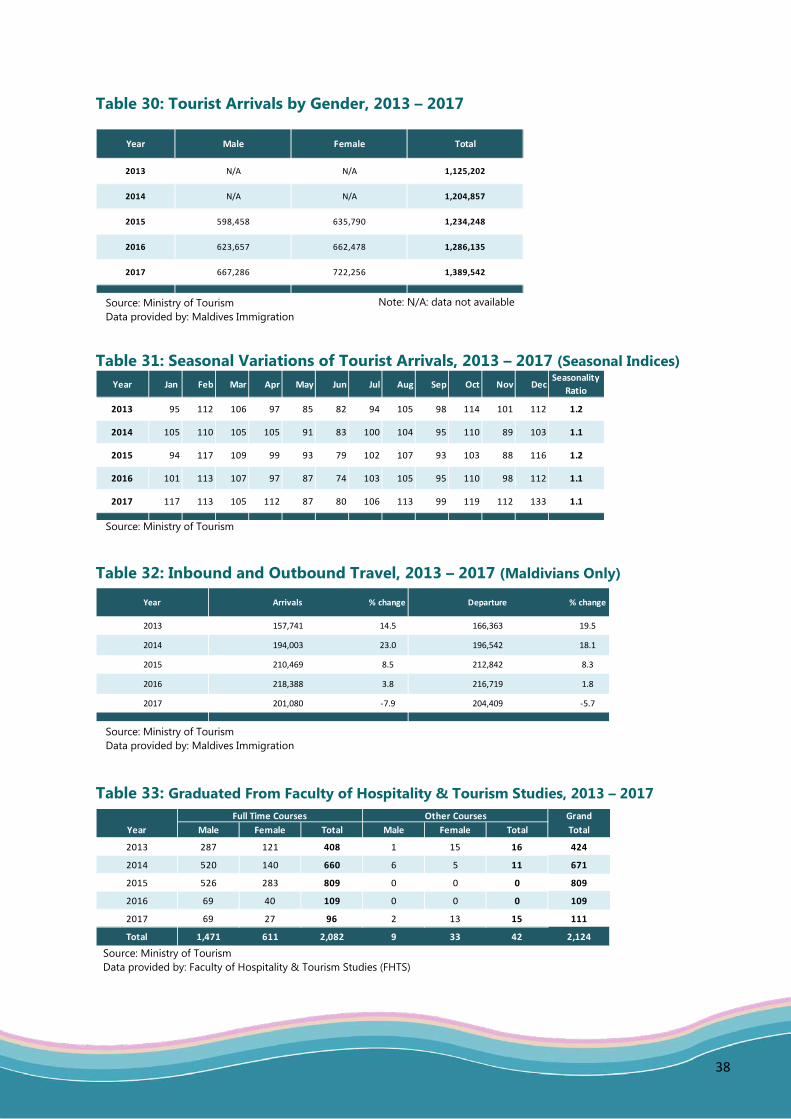
38
Table 30: Tourist Arrivals by Gender, 2013 – 2017
Table 31: Seasonal Variations of Tourist Arrivals, 2013 – 2017 (Seasonal Indices)
Table 32: Inbound and Outbound Travel, 2013 – 2017 (Maldivians Only)
Table 33: Graduated From Faculty of Hospitality & Tourism Studies, 2013 – 2017
Year Male Female Total
2013 N/A N/A 1,125,202
2014 N/A N/A 1,204,857
2015 598,458 635,790 1,234,248
2016 623,657 662,478 1,286,135
2017 667,286 722,256 1,389,542
Source: Ministry of Tourism Data provided by: Maldives Immigration
Year Jan Feb Mar Apr May Jun Jul Aug Sep Oct Nov DecSeasonality
Ratio
2013 95 112 106 97 85 82 94 105 98 114 101 112 1.2
2014 105 110 105 105 91 83 100 104 95 110 89 103 1.1
2015 94 117 109 99 93 79 102 107 93 103 88 116 1.2
2016 101 113 107 97 87 74 103 105 95 110 98 112 1.1
2017 117 113 105 112 87 80 106 113 99 119 112 133 1.1
Source: Ministry of Tourism
Source: Ministry of Tourism Data provided by: Maldives Immigration
Full Time Courses Other Courses GrandYear Male Female Total Male Female Total Total
2013 287 121 408 1 15 16 424
2014 520 140 660 6 5 11 671
2015 526 283 809 0 0 0 809
2016 69 40 109 0 0 0 109
2017 69 27 96 2 13 15 111
Total 1,471 611 2,082 9 33 42 2,124
Source: Ministry of Tourism Data provided by: Faculty of Hospitality & Tourism Studies (FHTS)
Note: N/A: data not available
Year Arrivals % change Departure % change
2013 157,741 14.5 166,363 19.5
2014 194,003 23.0 196,542 18.1
2015 210,469 8.5 212,842 8.3
2016 218,388 3.8 216,719 1.8
2017 201,080 -7.9 204,409 -5.7
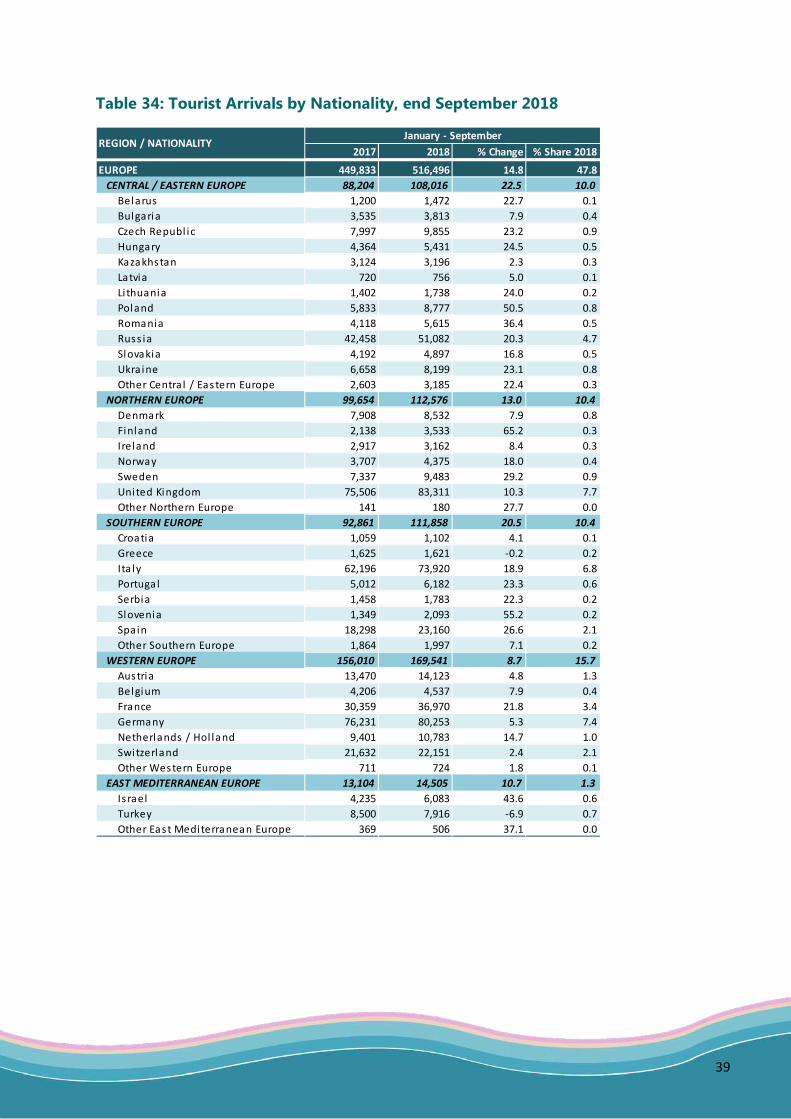
39
Table 34: Tourist Arrivals by Nationality, end September 2018
January - September2017 2018 % Change % Share 2018
EUROPE 449,833 516,496 14.8 47.8CENTRAL / EASTERN EUROPE 88,204 108,016 22.5 10.0
Belarus 1,200 1,472 22.7 0.1Bulgaria 3,535 3,813 7.9 0.4Czech Republ ic 7,997 9,855 23.2 0.9Hungary 4,364 5,431 24.5 0.5Kazakhstan 3,124 3,196 2.3 0.3Latvia 720 756 5.0 0.1Li thuania 1,402 1,738 24.0 0.2Poland 5,833 8,777 50.5 0.8Romania 4,118 5,615 36.4 0.5Russ ia 42,458 51,082 20.3 4.7Slovakia 4,192 4,897 16.8 0.5Ukra ine 6,658 8,199 23.1 0.8Other Centra l / Eastern Europe 2,603 3,185 22.4 0.3
NORTHERN EUROPE 99,654 112,576 13.0 10.4Denmark 7,908 8,532 7.9 0.8Finland 2,138 3,533 65.2 0.3Ireland 2,917 3,162 8.4 0.3Norway 3,707 4,375 18.0 0.4Sweden 7,337 9,483 29.2 0.9United Kingdom 75,506 83,311 10.3 7.7Other Northern Europe 141 180 27.7 0.0
SOUTHERN EUROPE 92,861 111,858 20.5 10.4Croatia 1,059 1,102 4.1 0.1Greece 1,625 1,621 -0.2 0.2Ita ly 62,196 73,920 18.9 6.8Portugal 5,012 6,182 23.3 0.6Serbia 1,458 1,783 22.3 0.2Slovenia 1,349 2,093 55.2 0.2Spain 18,298 23,160 26.6 2.1Other Southern Europe 1,864 1,997 7.1 0.2
WESTERN EUROPE 156,010 169,541 8.7 15.7Austria 13,470 14,123 4.8 1.3Belgium 4,206 4,537 7.9 0.4France 30,359 36,970 21.8 3.4Germany 76,231 80,253 5.3 7.4Netherlands / Hol land 9,401 10,783 14.7 1.0Switzerland 21,632 22,151 2.4 2.1Other Western Europe 711 724 1.8 0.1
EAST MEDITERRANEAN EUROPE 13,104 14,505 10.7 1.3Is rael 4,235 6,083 43.6 0.6Turkey 8,500 7,916 -6.9 0.7Other East Mediterranean Europe 369 506 37.1 0.0
REGION / NATIONALITY
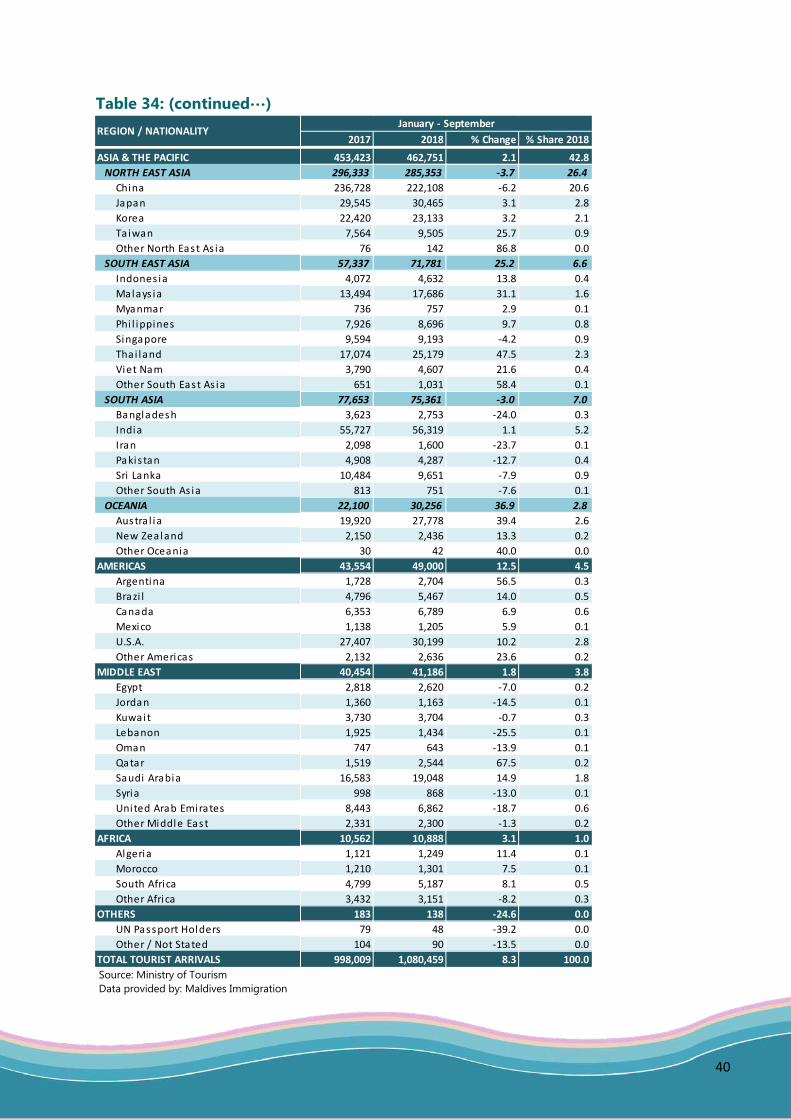
40
Table 34: (continued…)
January - September
2017 2018 % Change % Share 2018
ASIA & THE PACIFIC 453,423 462,751 2.1 42.8NORTH EAST ASIA 296,333 285,353 -3.7 26.4
China 236,728 222,108 -6.2 20.6Japan 29,545 30,465 3.1 2.8Korea 22,420 23,133 3.2 2.1Taiwan 7,564 9,505 25.7 0.9Other North East As ia 76 142 86.8 0.0
SOUTH EAST ASIA 57,337 71,781 25.2 6.6Indones ia 4,072 4,632 13.8 0.4Malays ia 13,494 17,686 31.1 1.6Myanmar 736 757 2.9 0.1Phi l ippines 7,926 8,696 9.7 0.8Singapore 9,594 9,193 -4.2 0.9Thai land 17,074 25,179 47.5 2.3Viet Nam 3,790 4,607 21.6 0.4Other South East As ia 651 1,031 58.4 0.1
SOUTH ASIA 77,653 75,361 -3.0 7.0Bangladesh 3,623 2,753 -24.0 0.3India 55,727 56,319 1.1 5.2Iran 2,098 1,600 -23.7 0.1Pakis tan 4,908 4,287 -12.7 0.4Sri Lanka 10,484 9,651 -7.9 0.9Other South As ia 813 751 -7.6 0.1
OCEANIA 22,100 30,256 36.9 2.8Austra l ia 19,920 27,778 39.4 2.6New Zealand 2,150 2,436 13.3 0.2Other Oceania 30 42 40.0 0.0
AMERICAS 43,554 49,000 12.5 4.5Argentina 1,728 2,704 56.5 0.3Brazi l 4,796 5,467 14.0 0.5Canada 6,353 6,789 6.9 0.6Mexico 1,138 1,205 5.9 0.1U.S.A. 27,407 30,199 10.2 2.8Other Americas 2,132 2,636 23.6 0.2
MIDDLE EAST 40,454 41,186 1.8 3.8Egypt 2,818 2,620 -7.0 0.2Jordan 1,360 1,163 -14.5 0.1Kuwait 3,730 3,704 -0.7 0.3Lebanon 1,925 1,434 -25.5 0.1Oman 747 643 -13.9 0.1Qatar 1,519 2,544 67.5 0.2Saudi Arabia 16,583 19,048 14.9 1.8Syria 998 868 -13.0 0.1United Arab Emirates 8,443 6,862 -18.7 0.6Other Middle East 2,331 2,300 -1.3 0.2
AFRICA 10,562 10,888 3.1 1.0Algeria 1,121 1,249 11.4 0.1Morocco 1,210 1,301 7.5 0.1South Africa 4,799 5,187 8.1 0.5Other Africa 3,432 3,151 -8.2 0.3
OTHERS 183 138 -24.6 0.0UN Passport Holders 79 48 -39.2 0.0Other / Not Stated 104 90 -13.5 0.0
TOTAL TOURIST ARRIVALS 998,009 1,080,459 8.3 100.0
REGION / NATIONALITY
Source: Ministry of Tourism Data provided by: Maldives Immigration
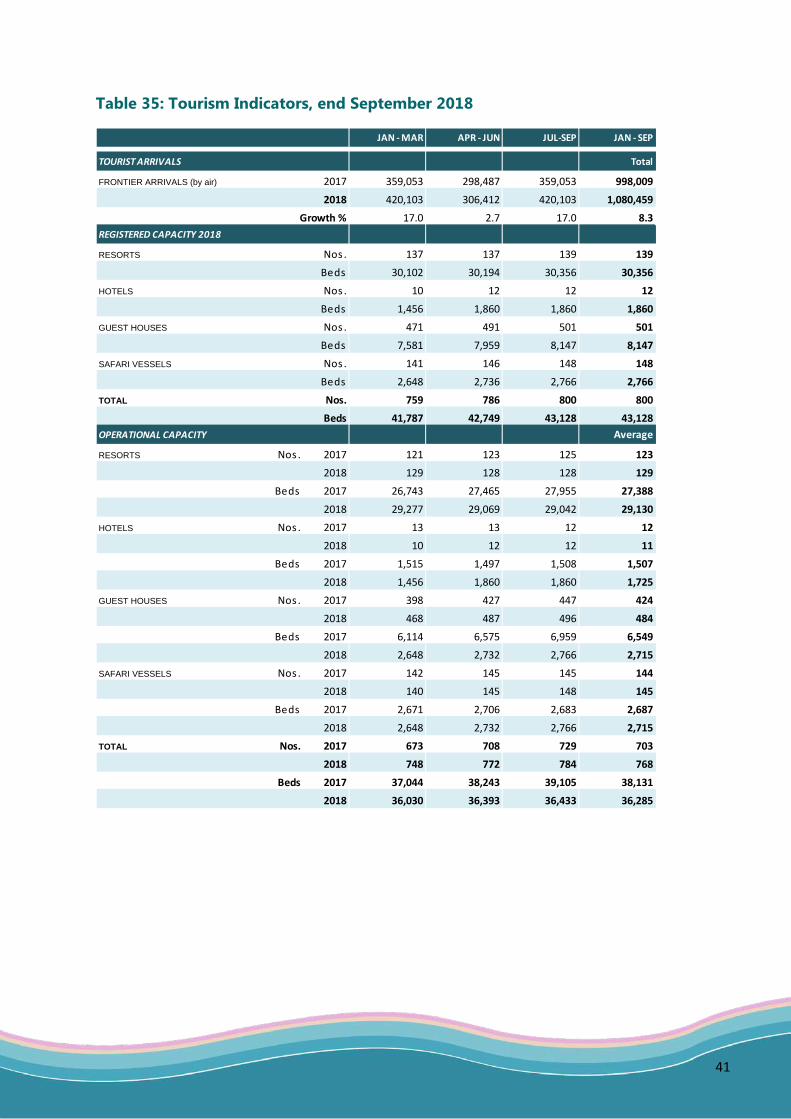
41
Table 35: Tourism Indicators, end September 2018
JAN - MAR APR - JUN JUL-SEP JAN - SEP
TOURIST ARRIVALS Total
FRONTIER ARRIVALS (by air) 2017 359,053 298,487 359,053 998,009
2018 420,103 306,412 420,103 1,080,459
Growth % 17.0 2.7 17.0 8.3REGISTERED CAPACITY 2018
RESORTS Nos. 137 137 139 139
Beds 30,102 30,194 30,356 30,356
HOTELS Nos. 10 12 12 12
Beds 1,456 1,860 1,860 1,860
GUEST HOUSES Nos. 471 491 501 501
Beds 7,581 7,959 8,147 8,147
SAFARI VESSELS Nos. 141 146 148 148
Beds 2,648 2,736 2,766 2,766
TOTAL Nos. 759 786 800 800
Beds 41,787 42,749 43,128 43,128OPERATIONAL CAPACITY Average
RESORTS Nos. 2017 121 123 125 123
2018 129 128 128 129
Beds 2017 26,743 27,465 27,955 27,388
2018 29,277 29,069 29,042 29,130
HOTELS Nos. 2017 13 13 12 12
2018 10 12 12 11
Beds 2017 1,515 1,497 1,508 1,507
2018 1,456 1,860 1,860 1,725
GUEST HOUSES Nos. 2017 398 427 447 424
2018 468 487 496 484
Beds 2017 6,114 6,575 6,959 6,549
2018 2,648 2,732 2,766 2,715
SAFARI VESSELS Nos. 2017 142 145 145 144
2018 140 145 148 145
Beds 2017 2,671 2,706 2,683 2,687
2018 2,648 2,732 2,766 2,715
TOTAL Nos. 2017 673 708 729 703
2018 748 772 784 768
Beds 2017 37,044 38,243 39,105 38,131
2018 36,030 36,393 36,433 36,285
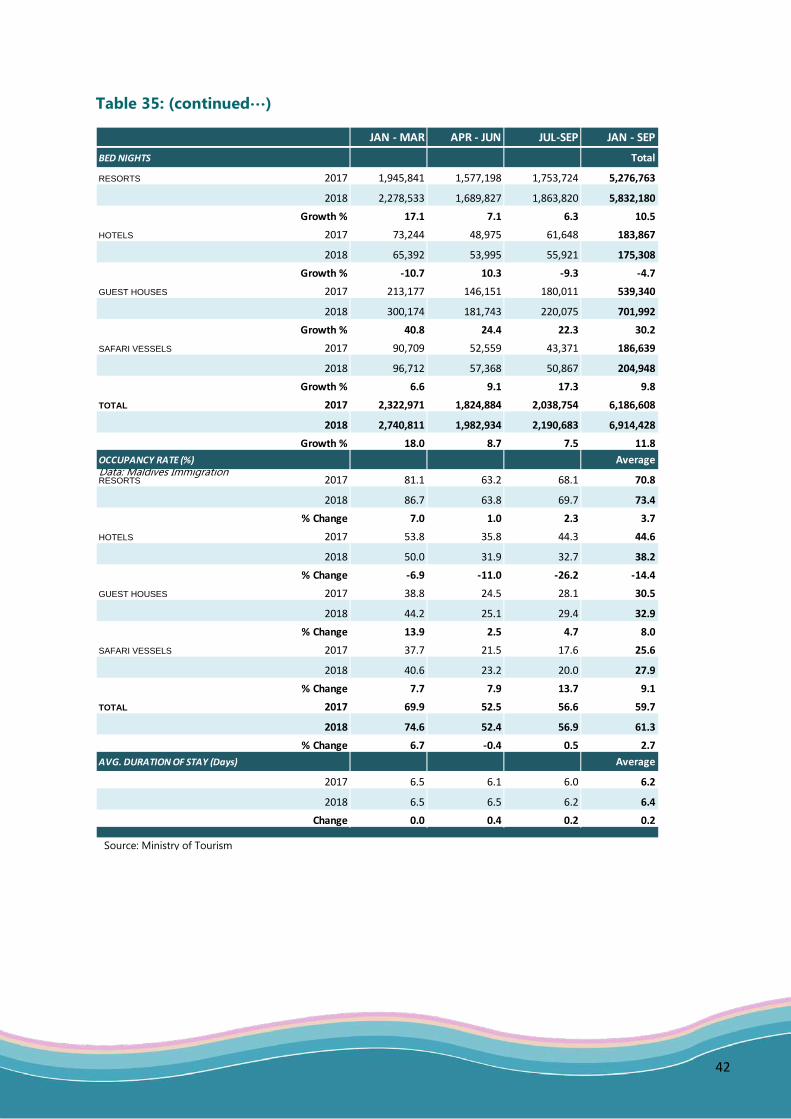
42
Table 35: (continued…)
Source: Ministry of Tourism Data: Maldives Immigration
JAN - MAR APR - JUN JUL-SEP JAN - SEP
BED NIGHTS Total
RESORTS 2017 1,945,841 1,577,198 1,753,724 5,276,763
2018 2,278,533 1,689,827 1,863,820 5,832,180
Growth % 17.1 7.1 6.3 10.5
HOTELS 2017 73,244 48,975 61,648 183,867
2018 65,392 53,995 55,921 175,308
Growth % -10.7 10.3 -9.3 -4.7
GUEST HOUSES 2017 213,177 146,151 180,011 539,340
2018 300,174 181,743 220,075 701,992
Growth % 40.8 24.4 22.3 30.2
SAFARI VESSELS 2017 90,709 52,559 43,371 186,639
2018 96,712 57,368 50,867 204,948
Growth % 6.6 9.1 17.3 9.8
TOTAL 2017 2,322,971 1,824,884 2,038,754 6,186,608
2018 2,740,811 1,982,934 2,190,683 6,914,428
Growth % 18.0 8.7 7.5 11.8OCCUPANCY RATE (%) Average
RESORTS 2017 81.1 63.2 68.1 70.8
2018 86.7 63.8 69.7 73.4
% Change 7.0 1.0 2.3 3.7
HOTELS 2017 53.8 35.8 44.3 44.6
2018 50.0 31.9 32.7 38.2
% Change -6.9 -11.0 -26.2 -14.4
GUEST HOUSES 2017 38.8 24.5 28.1 30.5
2018 44.2 25.1 29.4 32.9
% Change 13.9 2.5 4.7 8.0
SAFARI VESSELS 2017 37.7 21.5 17.6 25.6
2018 40.6 23.2 20.0 27.9
% Change 7.7 7.9 13.7 9.1
TOTAL 2017 69.9 52.5 56.6 59.7
2018 74.6 52.4 56.9 61.3
% Change 6.7 -0.4 0.5 2.7AVG. DURATION OF STAY (Days) Average
2017 6.5 6.1 6.0 6.2
2018 6.5 6.5 6.2 6.4
Change 0.0 0.4 0.2 0.2
Source: Ministry of Tourism
SECTION 6
TOURISM HIGHLIGHTS 2017
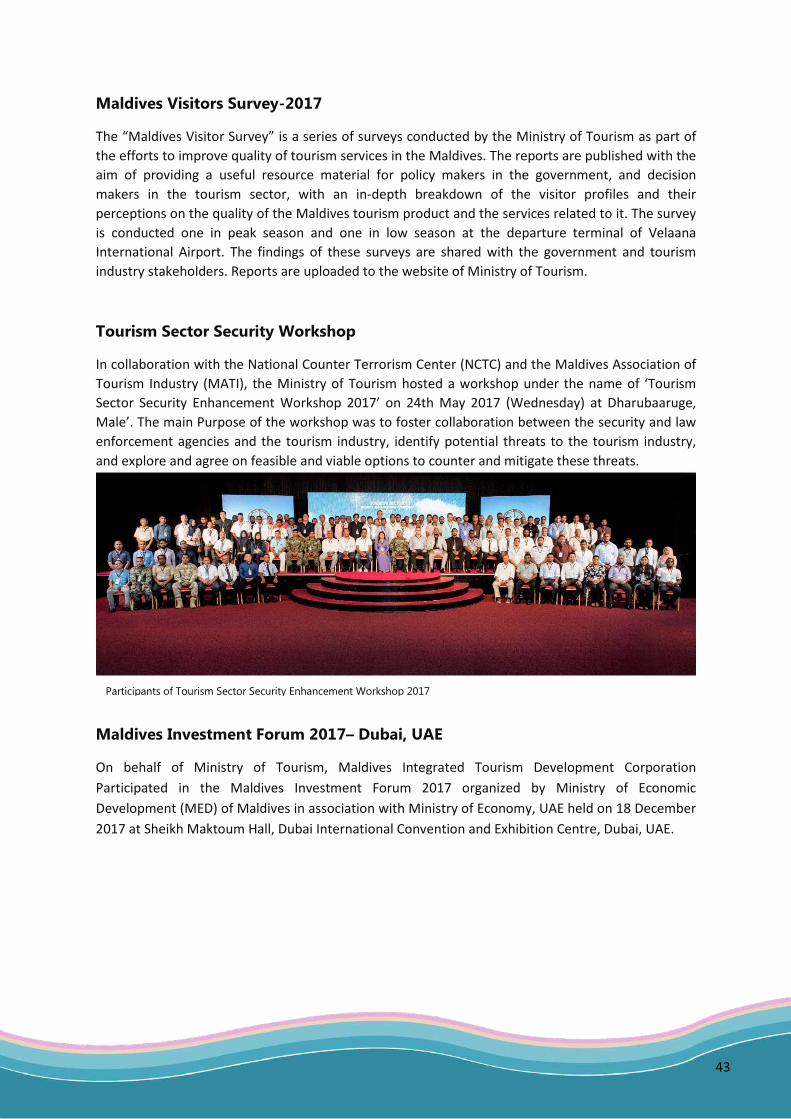
43
Maldives Visitors Survey-2017
The “Maldives Visitor Survey” is a series of surveys conducted by the Ministry of Tourism as part of the efforts to improve quality of tourism services in the Maldives. The reports are published with the aim of providing a useful resource material for policy makers in the government, and decision makers in the tourism sector, with an in-depth breakdown of the visitor profiles and their perceptions on the quality of the Maldives tourism product and the services related to it. The survey is conducted one in peak season and one in low season at the departure terminal of Velaana International Airport. The findings of these surveys are shared with the government and tourism industry stakeholders. Reports are uploaded to the website of Ministry of Tourism.
Tourism Sector Security Workshop
In collaboration with the National Counter Terrorism Center (NCTC) and the Maldives Association of Tourism Industry (MATI), the Ministry of Tourism hosted a workshop under the name of ‘Tourism Sector Security Enhancement Workshop 2017’ on 24th May 2017 (Wednesday) at Dharubaaruge, Male’. The main Purpose of the workshop was to foster collaboration between the security and law enforcement agencies and the tourism industry, identify potential threats to the tourism industry, and explore and agree on feasible and viable options to counter and mitigate these threats.
Maldives Investment Forum 2017– Dubai, UAE
On behalf of Ministry of Tourism, Maldives Integrated Tourism Development Corporation Participated in the Maldives Investment Forum 2017 organized by Ministry of Economic Development (MED) of Maldives in association with Ministry of Economy, UAE held on 18 December 2017 at Sheikh Maktoum Hall, Dubai International Convention and Exhibition Centre, Dubai, UAE.
Participants of Tourism Sector Security Enhancement Workshop 2017
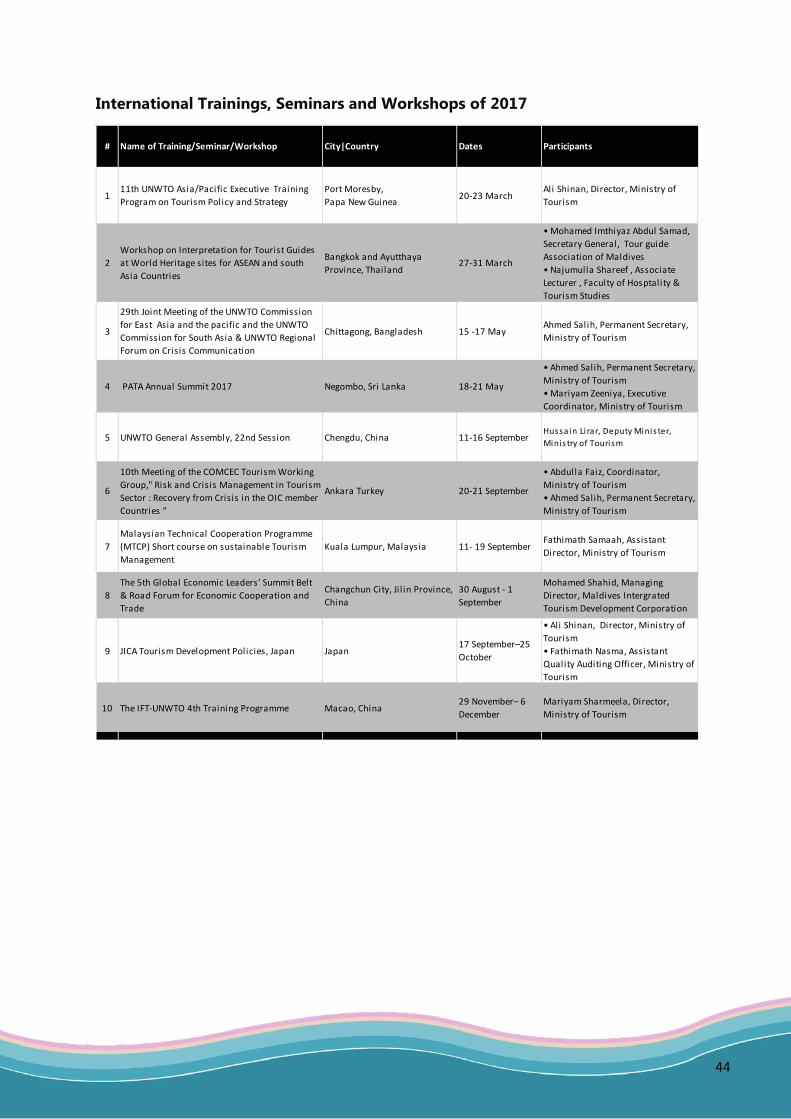
44
International Trainings, Seminars and Workshops of 2017
# Name of Training/Seminar/Workshop City|Country Dates Participants
111th UNWTO Asia/Pacific Executive Training Program on Tourism Policy and Strategy
Port Moresby, Papa New Guinea 20-23 March
Ali Shinan, Director, Ministry of Tourism
2Workshop on Interpretation for Tourist Guides at World Heritage sites for ASEAN and south Asia Countries
Bangkok and Ayutthaya Province, Thailand
27-31 March
• Mohamed Imthiyaz Abdul Samad, Secretary General, Tour guide Association of Maldives• Najumulla Shareef , Associate Lecturer , Faculty of Hosptality & Tourism Studies
3
29th Joint Meeting of the UNWTO Commission for East Asia and the pacific and the UNWTO Commission for South Asia & UNWTO Regional Forum on Crisis Communication
Chittagong, Bangladesh 15 -17 May Ahmed Salih, Permanent Secretary, Ministry of Tourism
4 PATA Annual Summit 2017 Negombo, Sri Lanka 18-21 May
• Ahmed Salih, Permanent Secretary, Ministry of Tourism• Mariyam Zeeniya, Executive Coordinator, Ministry of Tourism
5 UNWTO General Assembly, 22nd Session Chengdu, China 11-16 September Hussa in Li rar, Deputy Minis ter, Minis try of Tourism
6
10th Meeting of the COMCEC Tourism Working Group," Risk and Crisis Management in Tourism Sector : Recovery from Crisis in the OIC member Countries "
Ankara Turkey 20-21 September
• Abdulla Faiz, Coordinator, Ministry of Tourism• Ahmed Salih, Permanent Secretary, Ministry of Tourism
7Malaysian Technical Cooperation Programme (MTCP) Short course on sustainable Tourism Management
Kuala Lumpur, Malaysia 11- 19 September Fathimath Samaah, Assistant Director, Ministry of Tourism
8The 5th Global Economic Leaders’ Summit Belt & Road Forum for Economic Cooperation and Trade
Changchun City, Ji l in Province, China
30 August - 1 September
Mohamed Shahid, Managing Director, Maldives Intergrated Tourism Development Corporation
9 JICA Tourism Development Policies, Japan Japan17 September–25 October
• Ali Shinan, Director, Ministry of Tourism• Fathimath Nasma, Assistant Quality Auditing Officer, Ministry of Tourism
10 The IFT-UNWTO 4th Training Programme Macao, China29 November– 6 December
Mariyam Sharmeela, Director, Ministry of Tourism
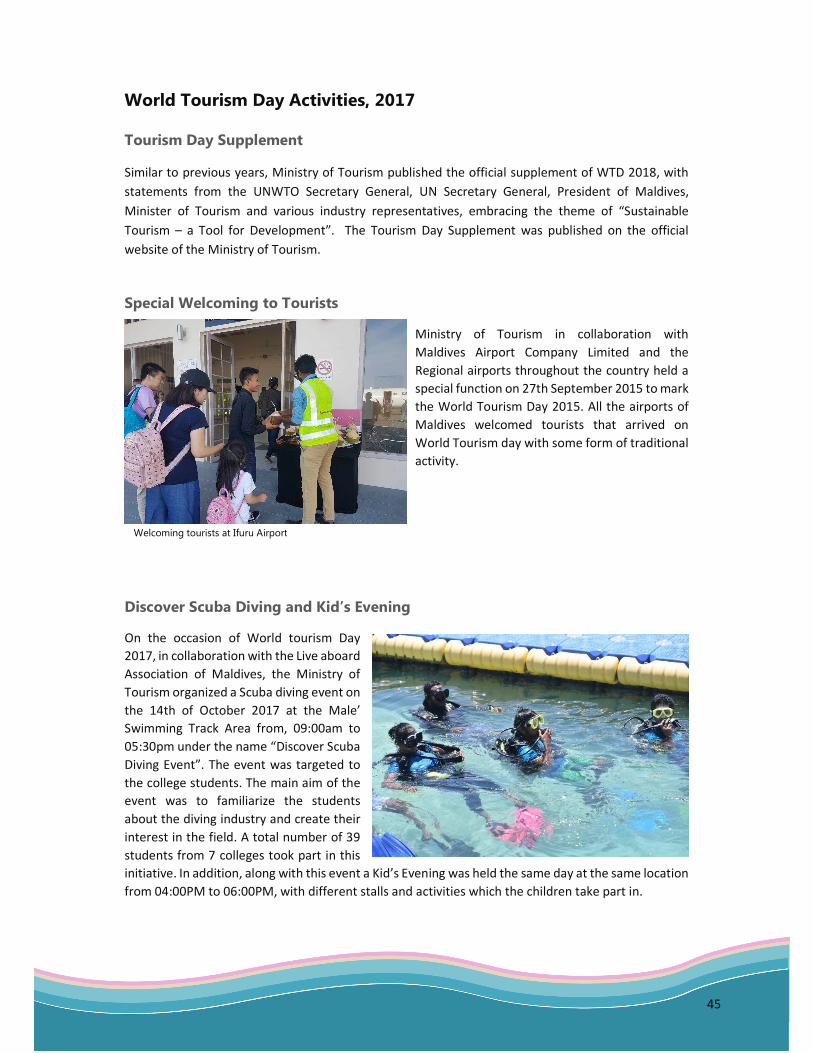
45
World Tourism Day Activities, 2017
Tourism Day Supplement
Similar to previous years, Ministry of Tourism published the official supplement of WTD 2018, with
statements from the UNWTO Secretary General, UN Secretary General, President of Maldives,
Minister of Tourism and various industry representatives, embracing the theme of “Sustainable
Tourism – a Tool for Development”. The Tourism Day Supplement was published on the official
website of the Ministry of Tourism.
Special Welcoming to Tourists
Ministry of Tourism in collaboration with
Maldives Airport Company Limited and the
Regional airports throughout the country held a
special function on 27th September 2015 to mark
the World Tourism Day 2015. All the airports of
Maldives welcomed tourists that arrived on
World Tourism day with some form of traditional
activity.
Discover Scuba Diving and Kid’s Evening
On the occasion of World tourism Day
2017, in collaboration with the Live aboard
Association of Maldives, the Ministry of
Tourism organized a Scuba diving event on
the 14th of October 2017 at the Male’
Swimming Track Area from, 09:00am to
05:30pm under the name “Discover Scuba
Diving Event”. The event was targeted to
the college students. The main aim of the
event was to familiarize the students
about the diving industry and create their
interest in the field. A total number of 39
students from 7 colleges took part in this
initiative. In addition, along with this event a Kid’s Evening was held the same day at the same location
from 04:00PM to 06:00PM, with different stalls and activities which the children take part in.
Welcoming tourists at Ifuru Airport
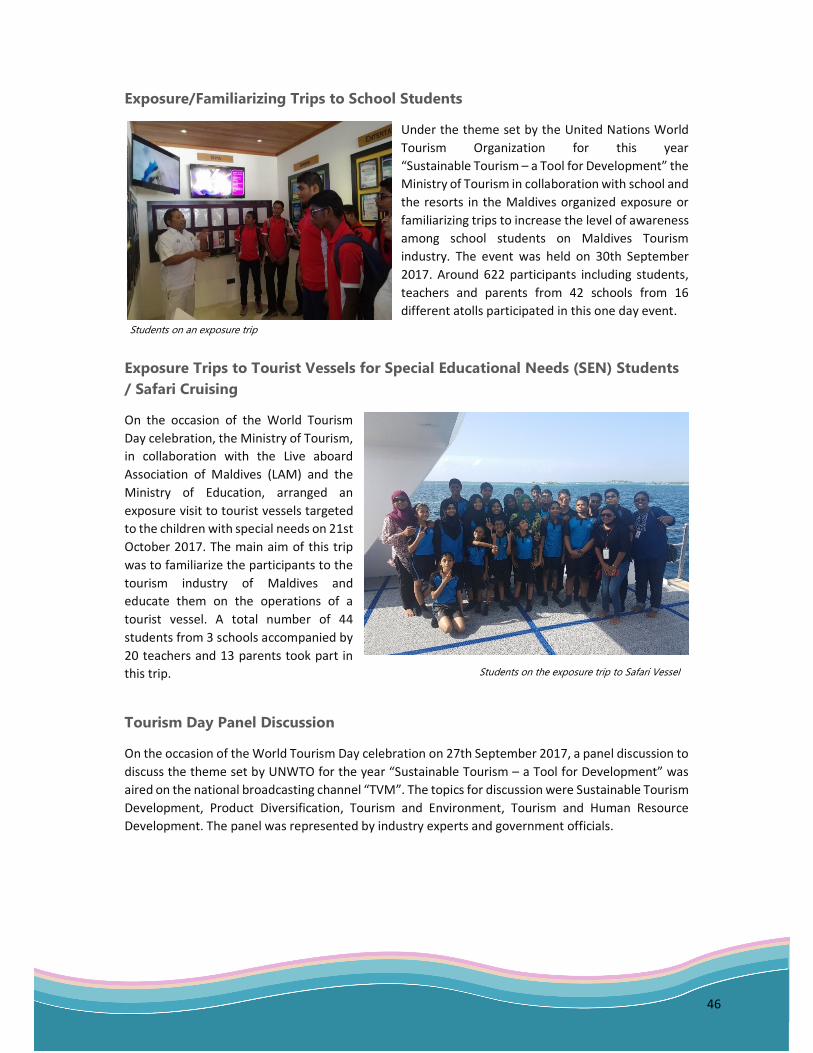
46
Exposure/Familiarizing Trips to School Students
Under the theme set by the United Nations World
Tourism Organization for this year
“Sustainable Tourism – a Tool for Development” the
Ministry of Tourism in collaboration with school and
the resorts in the Maldives organized exposure or
familiarizing trips to increase the level of awareness
among school students on Maldives Tourism
industry. The event was held on 30th September
2017. Around 622 participants including students,
teachers and parents from 42 schools from 16
different atolls participated in this one day event.
Exposure Trips to Tourist Vessels for Special Educational Needs (SEN) Students
/ Safari Cruising
On the occasion of the World Tourism
Day celebration, the Ministry of Tourism,
in collaboration with the Live aboard
Association of Maldives (LAM) and the
Ministry of Education, arranged an
exposure visit to tourist vessels targeted
to the children with special needs on 21st
October 2017. The main aim of this trip
was to familiarize the participants to the
tourism industry of Maldives and
educate them on the operations of a
tourist vessel. A total number of 44
students from 3 schools accompanied by
20 teachers and 13 parents took part in
this trip.
Tourism Day Panel Discussion
On the occasion of the World Tourism Day celebration on 27th September 2017, a panel discussion to
discuss the theme set by UNWTO for the year “Sustainable Tourism – a Tool for Development” was
aired on the national broadcasting channel “TVM”. The topics for discussion were Sustainable Tourism
Development, Product Diversification, Tourism and Environment, Tourism and Human Resource
Development. The panel was represented by industry experts and government officials.
Students on an exposure trip
Students on the exposure trip to Safari Vessel
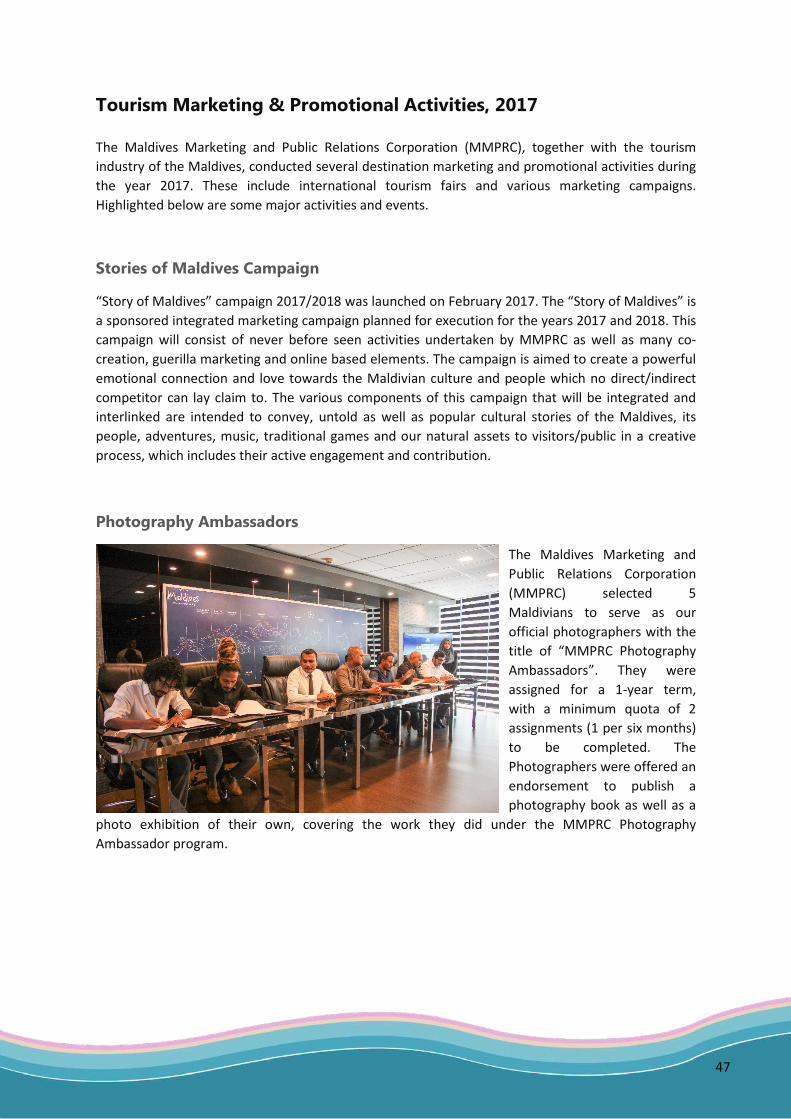
47
Tourism Marketing & Promotional Activities, 2017
The Maldives Marketing and Public Relations Corporation (MMPRC), together with the tourism industry of the Maldives, conducted several destination marketing and promotional activities during the year 2017. These include international tourism fairs and various marketing campaigns. Highlighted below are some major activities and events.
Stories of Maldives Campaign
“Story of Maldives” campaign 2017/2018 was launched on February 2017. The “Story of Maldives” is a sponsored integrated marketing campaign planned for execution for the years 2017 and 2018. This campaign will consist of never before seen activities undertaken by MMPRC as well as many co-creation, guerilla marketing and online based elements. The campaign is aimed to create a powerful emotional connection and love towards the Maldivian culture and people which no direct/indirect competitor can lay claim to. The various components of this campaign that will be integrated and interlinked are intended to convey, untold as well as popular cultural stories of the Maldives, its people, adventures, music, traditional games and our natural assets to visitors/public in a creative process, which includes their active engagement and contribution.
Photography Ambassadors
The Maldives Marketing and Public Relations Corporation (MMPRC) selected 5 Maldivians to serve as our official photographers with the title of “MMPRC Photography Ambassadors”. They were assigned for a 1-year term, with a minimum quota of 2 assignments (1 per six months) to be completed. The Photographers were offered an endorsement to publish a photography book as well as a
photo exhibition of their own, covering the work they did under the MMPRC Photography Ambassador program.
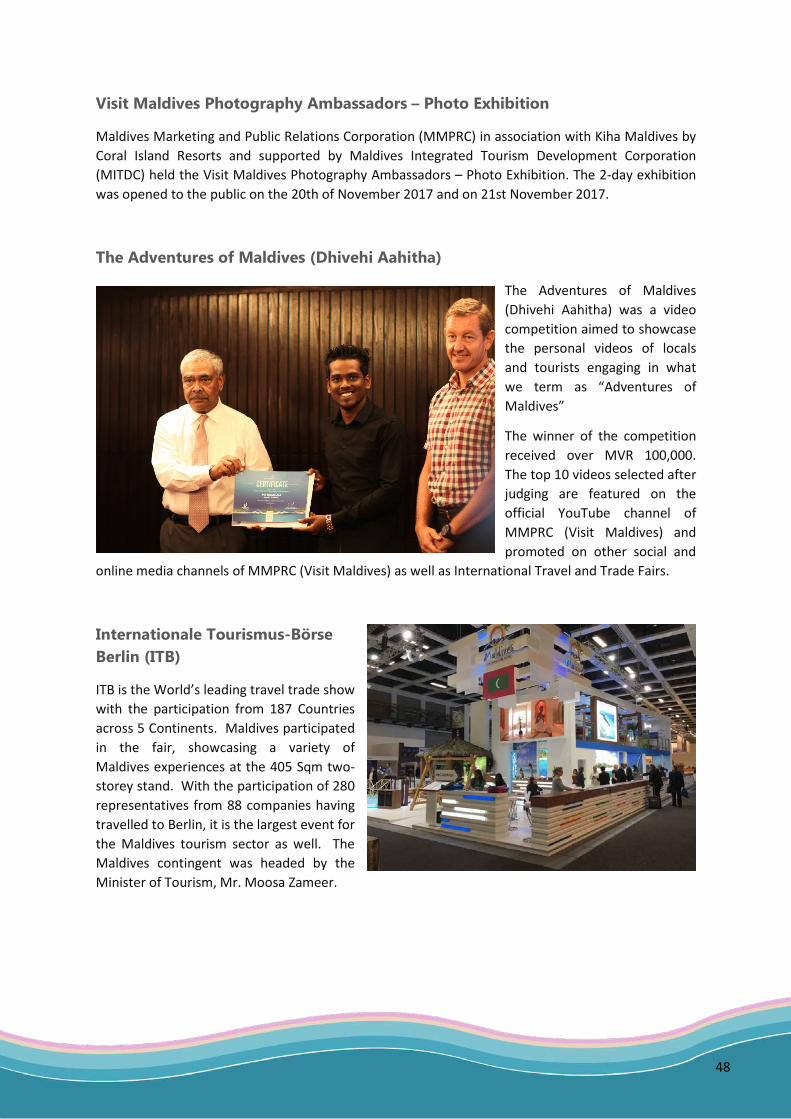
48
Visit Maldives Photography Ambassadors – Photo Exhibition
Maldives Marketing and Public Relations Corporation (MMPRC) in association with Kiha Maldives by Coral Island Resorts and supported by Maldives Integrated Tourism Development Corporation (MITDC) held the Visit Maldives Photography Ambassadors – Photo Exhibition. The 2-day exhibition was opened to the public on the 20th of November 2017 and on 21st November 2017.
The Adventures of Maldives (Dhivehi Aahitha)
The Adventures of Maldives (Dhivehi Aahitha) was a video competition aimed to showcase the personal videos of locals and tourists engaging in what we term as “Adventures of Maldives”
The winner of the competition received over MVR 100,000. The top 10 videos selected after judging are featured on the official YouTube channel of MMPRC (Visit Maldives) and promoted on other social and
online media channels of MMPRC (Visit Maldives) as well as International Travel and Trade Fairs.
Internationale Tourismus-Börse Berlin (ITB)
ITB is the World’s leading travel trade show with the participation from 187 Countries across 5 Continents. Maldives participated in the fair, showcasing a variety of Maldives experiences at the 405 Sqm two-storey stand. With the participation of 280 representatives from 88 companies having travelled to Berlin, it is the largest event for the Maldives tourism sector as well. The Maldives contingent was headed by the Minister of Tourism, Mr. Moosa Zameer.
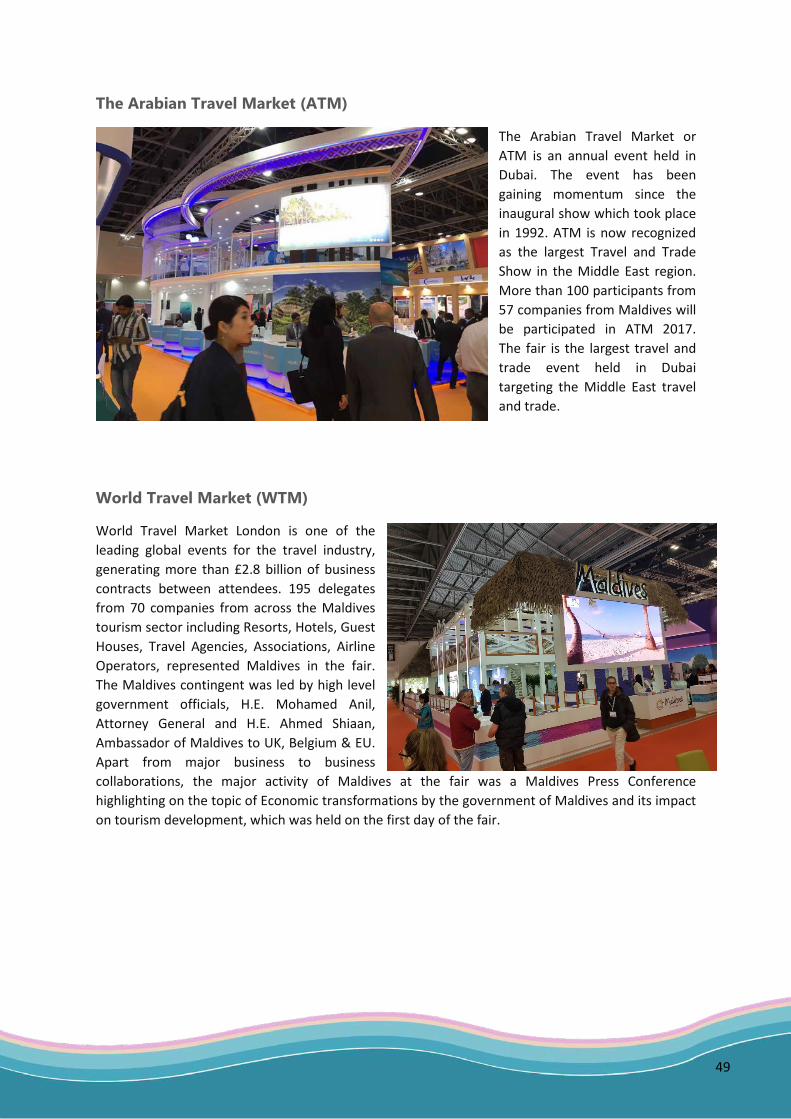
49
The Arabian Travel Market (ATM)
The Arabian Travel Market or ATM is an annual event held in Dubai. The event has been gaining momentum since the inaugural show which took place in 1992. ATM is now recognized as the largest Travel and Trade Show in the Middle East region. More than 100 participants from 57 companies from Maldives will be participated in ATM 2017. The fair is the largest travel and trade event held in Dubai targeting the Middle East travel and trade.
World Travel Market (WTM)
World Travel Market London is one of the leading global events for the travel industry, generating more than £2.8 billion of business contracts between attendees. 195 delegates from 70 companies from across the Maldives tourism sector including Resorts, Hotels, Guest Houses, Travel Agencies, Associations, Airline Operators, represented Maldives in the fair. The Maldives contingent was led by high level government officials, H.E. Mohamed Anil, Attorney General and H.E. Ahmed Shiaan, Ambassador of Maldives to UK, Belgium & EU. Apart from major business to business collaborations, the major activity of Maldives at the fair was a Maldives Press Conference highlighting on the topic of Economic transformations by the government of Maldives and its impact on tourism development, which was held on the first day of the fair.
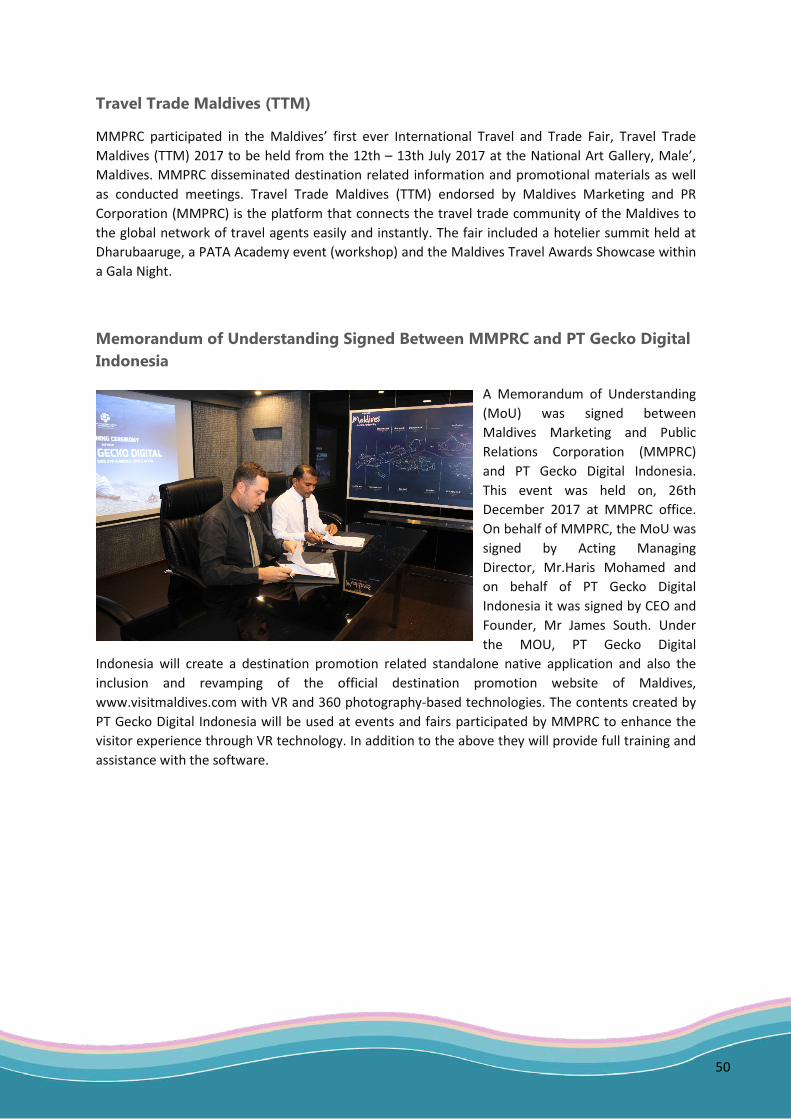
50
Travel Trade Maldives (TTM)
MMPRC participated in the Maldives’ first ever International Travel and Trade Fair, Travel Trade Maldives (TTM) 2017 to be held from the 12th – 13th July 2017 at the National Art Gallery, Male’, Maldives. MMPRC disseminated destination related information and promotional materials as well as conducted meetings. Travel Trade Maldives (TTM) endorsed by Maldives Marketing and PR Corporation (MMPRC) is the platform that connects the travel trade community of the Maldives to the global network of travel agents easily and instantly. The fair included a hotelier summit held at Dharubaaruge, a PATA Academy event (workshop) and the Maldives Travel Awards Showcase within a Gala Night.
Memorandum of Understanding Signed Between MMPRC and PT Gecko Digital Indonesia
A Memorandum of Understanding (MoU) was signed between Maldives Marketing and Public Relations Corporation (MMPRC) and PT Gecko Digital Indonesia. This event was held on, 26th December 2017 at MMPRC office. On behalf of MMPRC, the MoU was signed by Acting Managing Director, Mr.Haris Mohamed and on behalf of PT Gecko Digital Indonesia it was signed by CEO and Founder, Mr James South. Under the MOU, PT Gecko Digital
Indonesia will create a destination promotion related standalone native application and also the inclusion and revamping of the official destination promotion website of Maldives, www.visitmaldives.com with VR and 360 photography-based technologies. The contents created by PT Gecko Digital Indonesia will be used at events and fairs participated by MMPRC to enhance the visitor experience through VR technology. In addition to the above they will provide full training and assistance with the software.
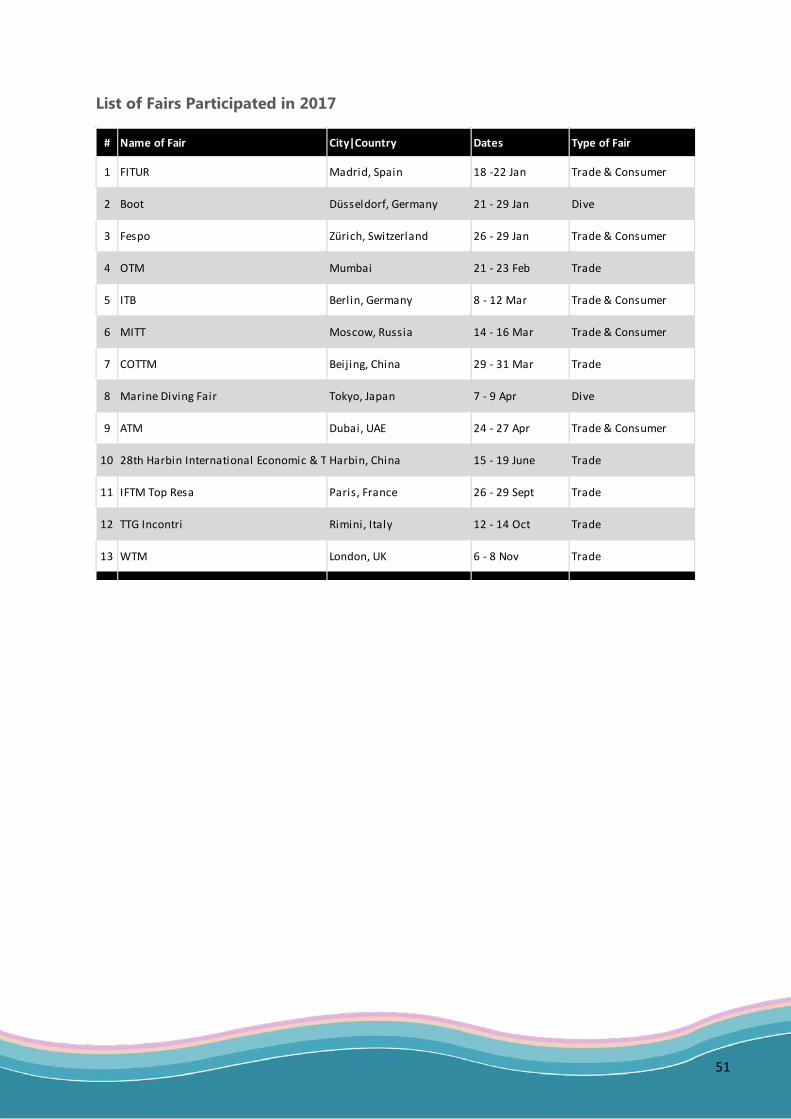
51
List of Fairs Participated in 2017
# Name of Fair City|Country Dates Type of Fair
1 FITUR Madrid, Spain 18 -22 Jan Trade & Consumer
2 Boot Düsseldorf, Germany 21 - 29 Jan Dive
3 Fespo Zürich, Switzerland 26 - 29 Jan Trade & Consumer
4 OTM Mumbai 21 - 23 Feb Trade
5 ITB Berlin, Germany 8 - 12 Mar Trade & Consumer
6 MITT Moscow, Russia 14 - 16 Mar Trade & Consumer
7 COTTM Beijing, China 29 - 31 Mar Trade
8 Marine Diving Fair Tokyo, Japan 7 - 9 Apr Dive
9 ATM Dubai, UAE 24 - 27 Apr Trade & Consumer
10 28th Harbin International Economic & T Harbin, China 15 - 19 June Trade
11 IFTM Top Resa Paris, France 26 - 29 Sept Trade
12 TTG Incontri Rimini, Italy 12 - 14 Oct Trade
13 WTM London, UK 6 - 8 Nov Trade

52
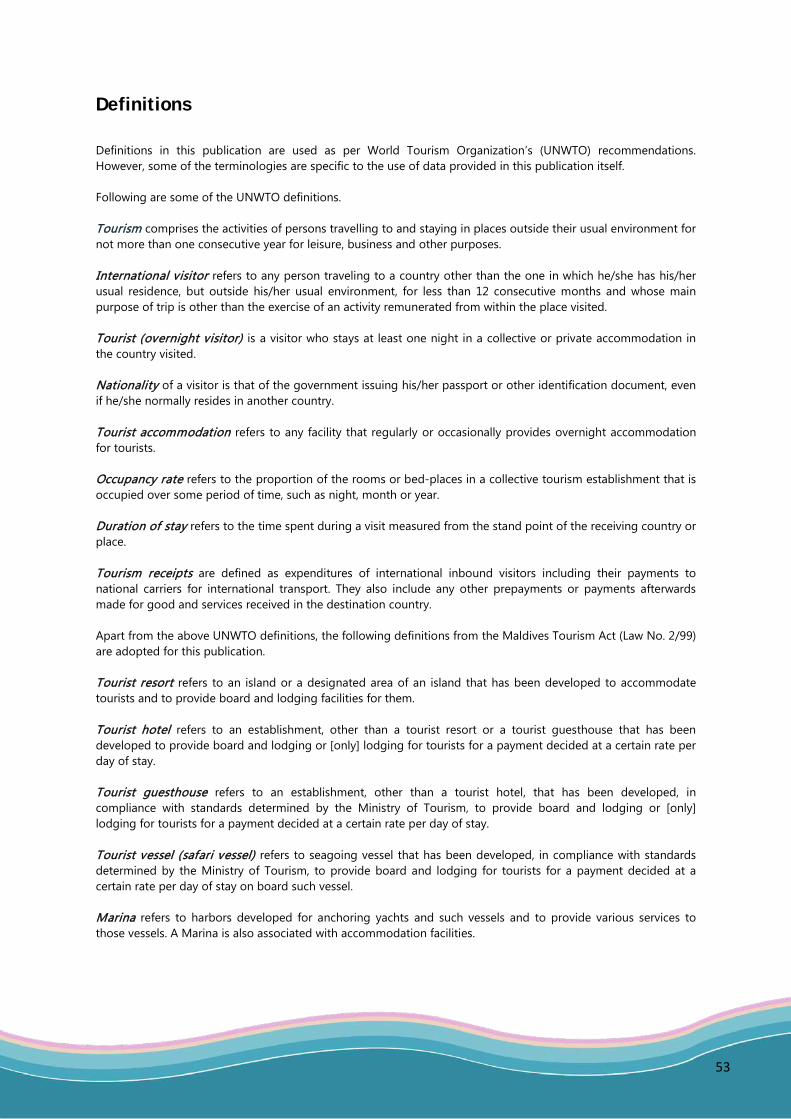
53
Definitions
Definitions in this publication are used as per World Tourism Organization’s (UNWTO) recommendations. However, some of the terminologies are specific to the use of data provided in this publication itself. Following are some of the UNWTO definitions. Tourism comprises the activities of persons travelling to and staying in places outside their usual environment for not more than one consecutive year for leisure, business and other purposes. International visitor refers to any person traveling to a country other than the one in which he/she has his/her usual residence, but outside his/her usual environment, for less than 12 consecutive months and whose main purpose of trip is other than the exercise of an activity remunerated from within the place visited. Tourist (overnight visitor) is a visitor who stays at least one night in a collective or private accommodation in the country visited. Nationality of a visitor is that of the government issuing his/her passport or other identification document, even if he/she normally resides in another country. Tourist accommodation refers to any facility that regularly or occasionally provides overnight accommodation for tourists. Occupancy rate refers to the proportion of the rooms or bed-places in a collective tourism establishment that is occupied over some period of time, such as night, month or year. Duration of stay refers to the time spent during a visit measured from the stand point of the receiving country or place. Tourism receipts are defined as expenditures of international inbound visitors including their payments to national carriers for international transport. They also include any other prepayments or payments afterwards made for good and services received in the destination country. Apart from the above UNWTO definitions, the following definitions from the Maldives Tourism Act (Law No. 2/99) are adopted for this publication. Tourist resort refers to an island or a designated area of an island that has been developed to accommodate tourists and to provide board and lodging facilities for them. Tourist hotel refers to an establishment, other than a tourist resort or a tourist guesthouse that has been developed to provide board and lodging or [only] lodging for tourists for a payment decided at a certain rate per day of stay. Tourist guesthouse refers to an establishment, other than a tourist hotel, that has been developed, in compliance with standards determined by the Ministry of Tourism, to provide board and lodging or [only] lodging for tourists for a payment decided at a certain rate per day of stay. Tourist vessel (safari vessel) refers to seagoing vessel that has been developed, in compliance with standards determined by the Ministry of Tourism, to provide board and lodging for tourists for a payment decided at a certain rate per day of stay on board such vessel. Marina refers to harbors developed for anchoring yachts and such vessels and to provide various services to those vessels. A Marina is also associated with accommodation facilities.
Recommended