Otto Gloeckel-Straße 2, A-8700 Leoben, Tel.: +43 3842 402 3501
www.kunststofftechnik.at
Ass.Prof. Dr. Thomas Lucyshyn 24th April 2014
Influence of material data on injection moulding simulation
Application examples
TRAINING IN THE FIELD OF POLYMER MATERIALS / PLASTICS
www.kunststofftechnik.at Thomas Lucyshyn 2
Content
Introduction
Melt Flow Rate (MFR) as reference value for viscosity
Pressure dependence of viscosity
Transition temperature
Thermal conductivity and specific heat capacity
pvT-data at different cooling rates
Summary
www.kunststofftechnik.at Thomas Lucyshyn 3
Content
Introduction
Melt Flow Rate (MFR) as reference value for viscosity
Pressure dependence of viscosity
Transition temperature
Thermal conductivity and specific heat capacity
pvT-data at different cooling rates
Summary
www.kunststofftechnik.at Thomas Lucyshyn 4
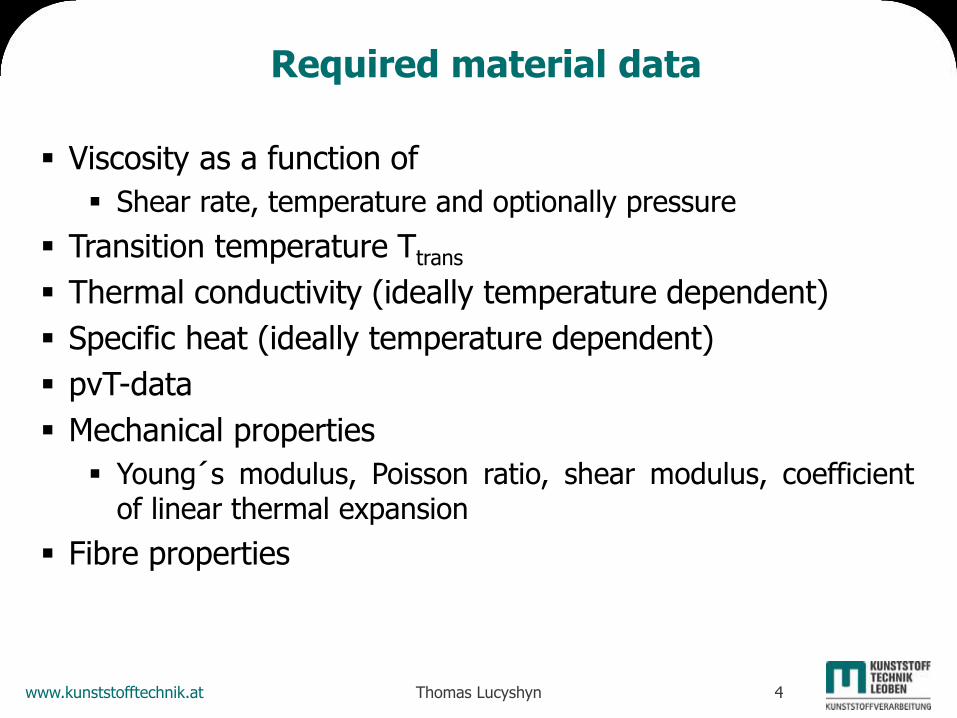
Required material data
Viscosity as a function of
Shear rate, temperature and optionally pressure
Transition temperature Ttrans
Thermal conductivity (ideally temperature dependent)
Specific heat (ideally temperature dependent)
pvT-data
Mechanical properties
Young´s modulus, Poisson ratio, shear modulus, coefficient of linear thermal expansion
Fibre properties
www.kunststofftechnik.at Thomas Lucyshyn 5
Material data for injection moulding simulation
Source: Internet
www.kunststofftechnik.at Thomas Lucyshyn 6
Content
Introduction
Melt Flow Rate (MFR) as reference value for viscosity
Pressure dependence of viscosity
Transition temperature
Thermal conductivity and specific heat capacity
pvT-data at different cooling rates
Summary
www.kunststofftechnik.at Thomas Lucyshyn 7
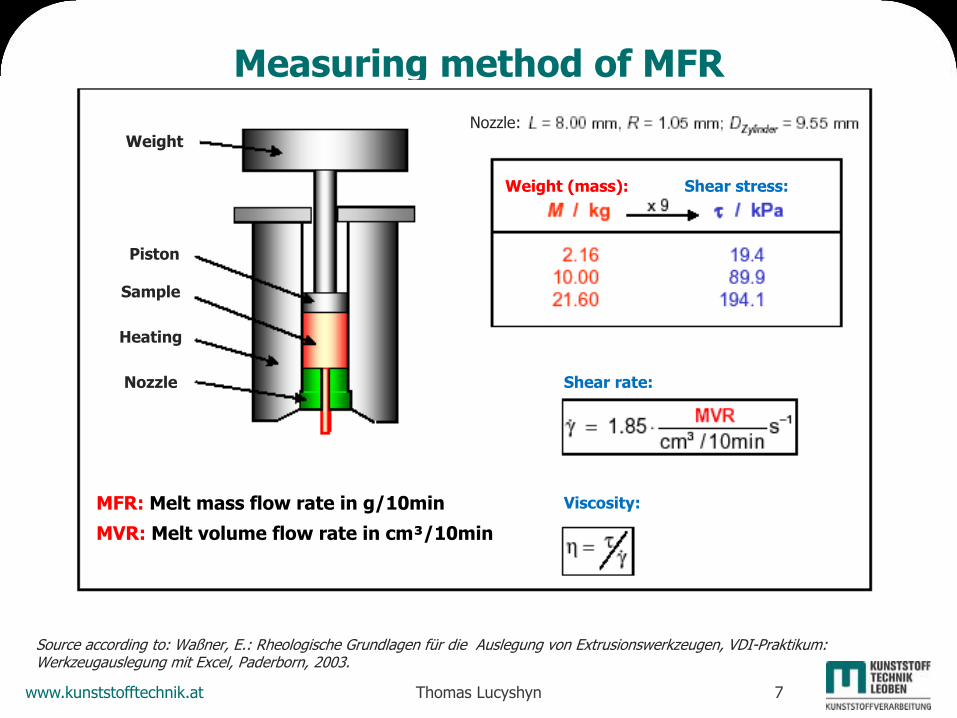
Measuring method of MFR
Source according to: Waßner, E.: Rheologische Grundlagen für die Auslegung von Extrusionswerkzeugen, VDI-Praktikum: Werkzeugauslegung mit Excel, Paderborn, 2003.
Weight
Piston
Sample
Heating
Nozzle Shear rate:
Viscosity:
Shear stress: Weight (mass):
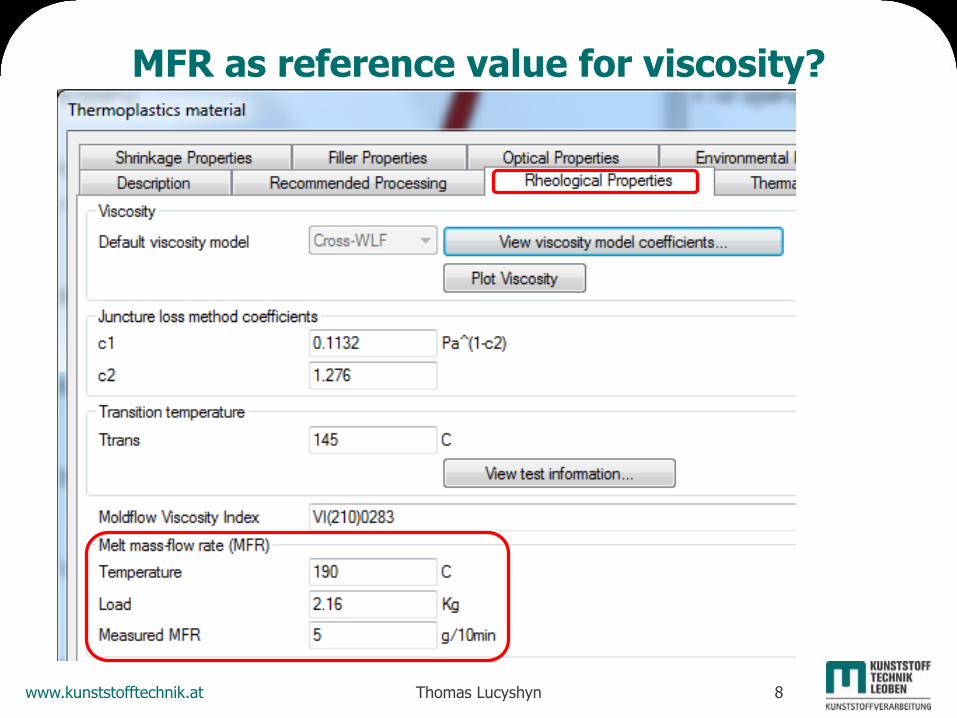
MFR: Melt mass flow rate in g/10min
MVR: Melt volume flow rate in cm³/10min
Nozzle:
www.kunststofftechnik.at Thomas Lucyshyn 8
MFR as reference value for viscosity?
www.kunststofftechnik.at Thomas Lucyshyn 9
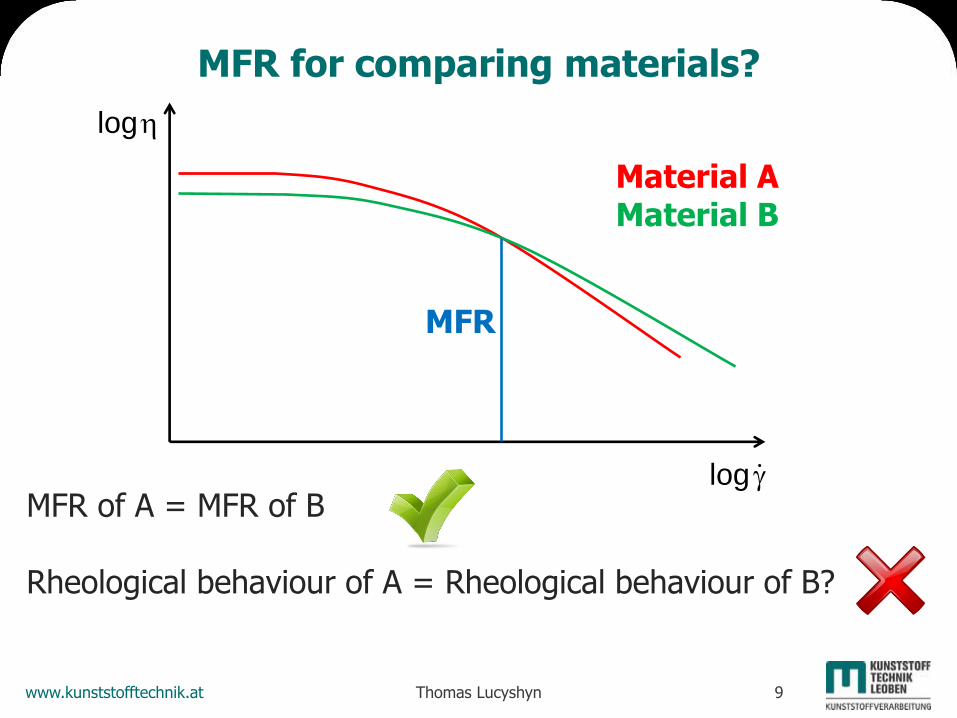
MFR for comparing materials?
MFR of A = MFR of B Rheological behaviour of A = Rheological behaviour of B?
MFR
log
log
Material A Material B
www.kunststofftechnik.at Thomas Lucyshyn 10
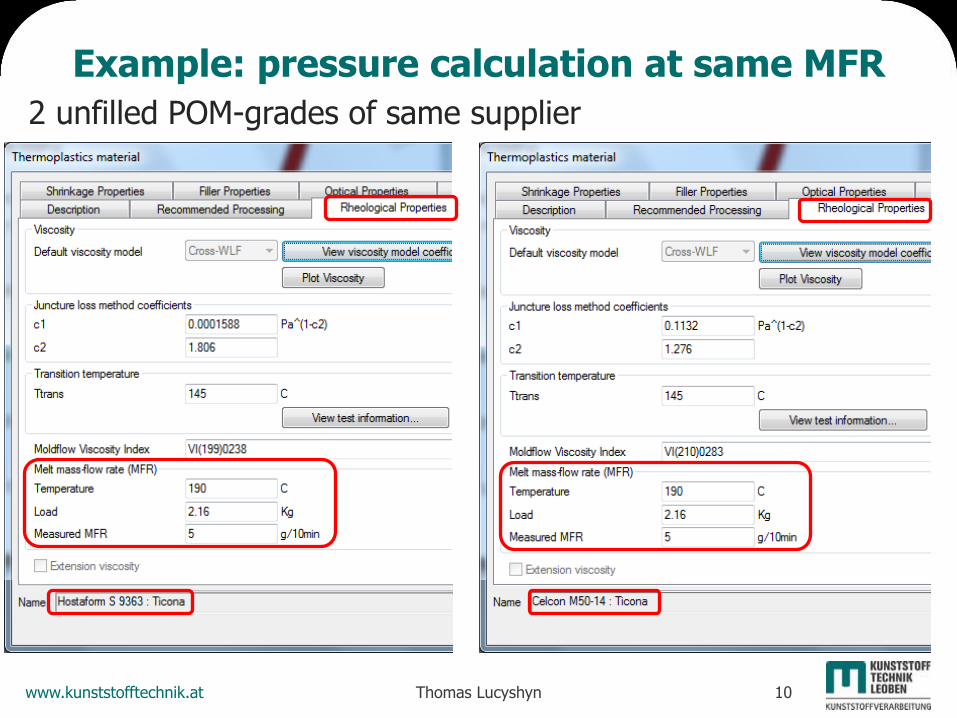
Example: pressure calculation at same MFR
2 unfilled POM-grades of same supplier
www.kunststofftechnik.at Thomas Lucyshyn 11
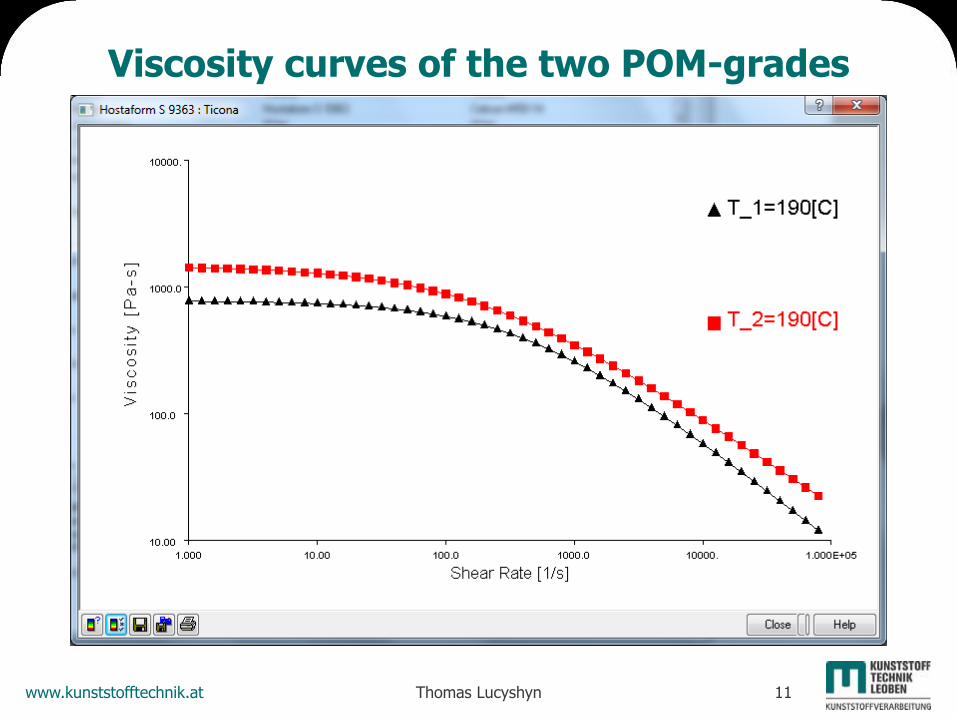
Viscosity curves of the two POM-grades
www.kunststofftechnik.at Thomas Lucyshyn 12
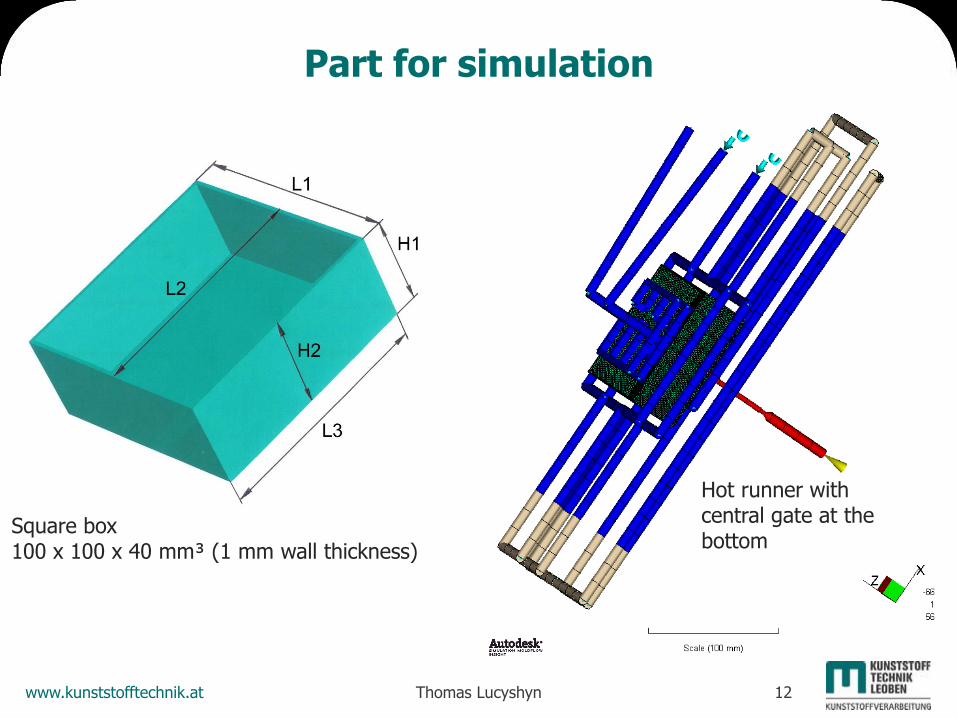
Part for simulation
Square box 100 x 100 x 40 mm³ (1 mm wall thickness)
Hot runner with central gate at the bottom
www.kunststofftechnik.at Thomas Lucyshyn 13
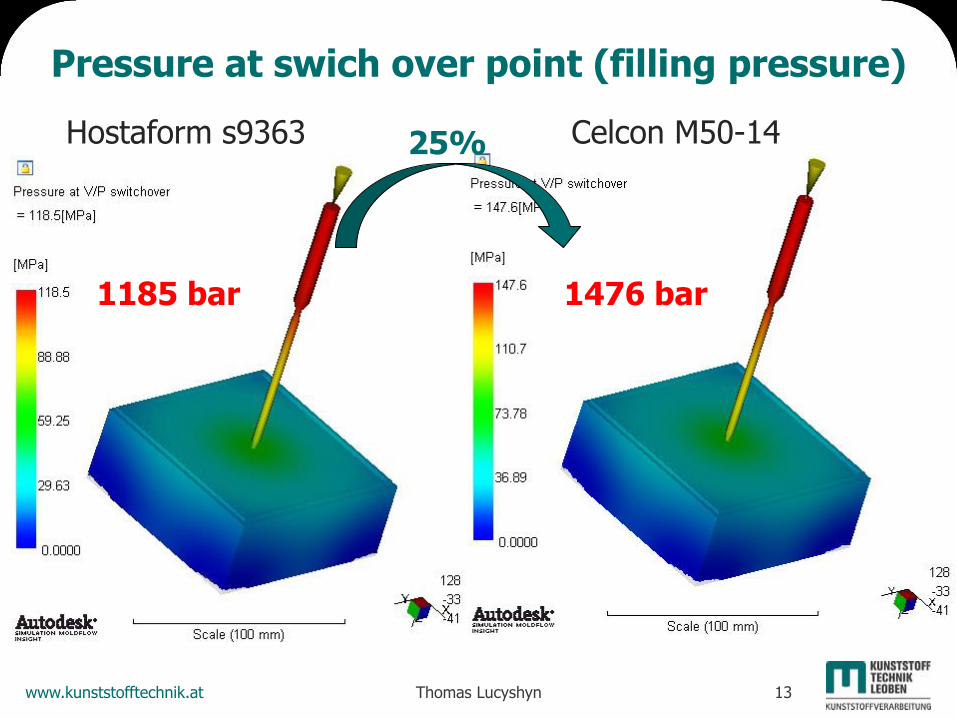
Pressure at swich over point (filling pressure)
Hostaform s9363 Celcon M50-14
1185 bar 1476 bar
25%
www.kunststofftechnik.at Thomas Lucyshyn 14
Content
Introduction
Melt Flow Rate (MFR) as reference value for viscosity
Pressure dependence of viscosity
Transition temperature
Thermal conductivity and specific heat capacity
pvT-data at different cooling rates
Summary
www.kunststofftechnik.at Thomas Lucyshyn 15
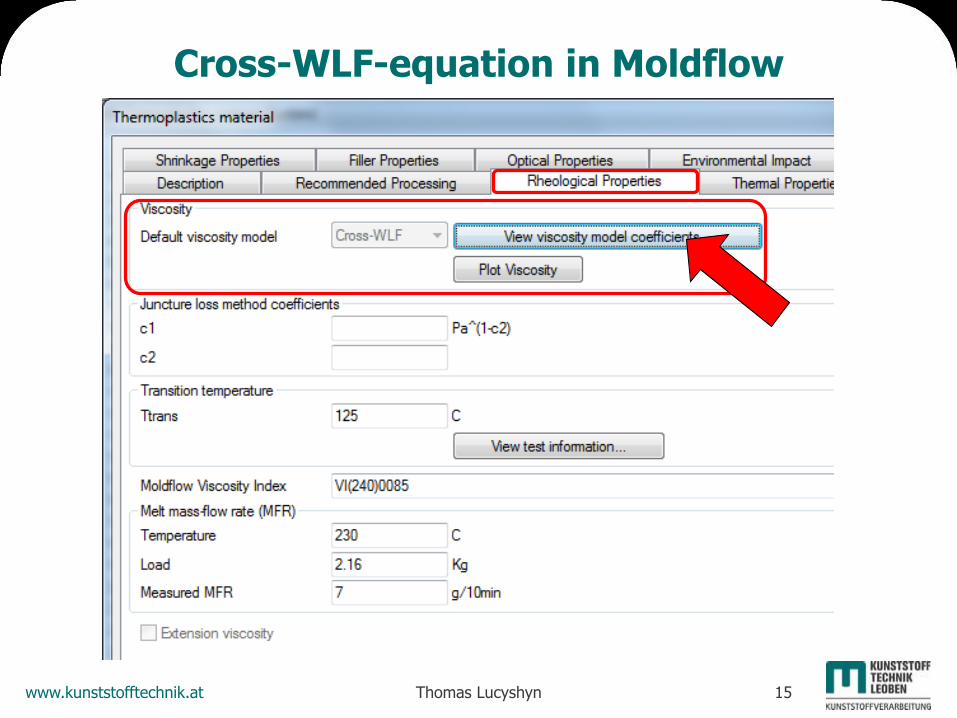
Cross-WLF-equation in Moldflow
www.kunststofftechnik.at Thomas Lucyshyn 16
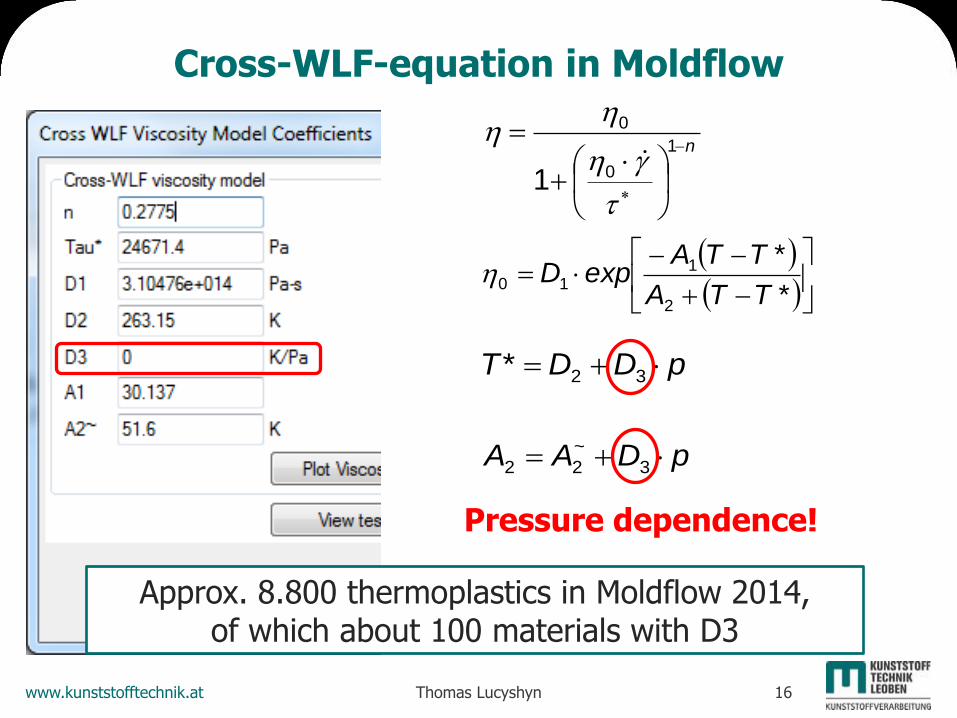
Cross-WLF-equation in Moldflow
n
1
0
0
1
(8)
*TTA
*TTAexpD
2
110
pDD*T 32
pDAA ~ 322
Pressure dependence!
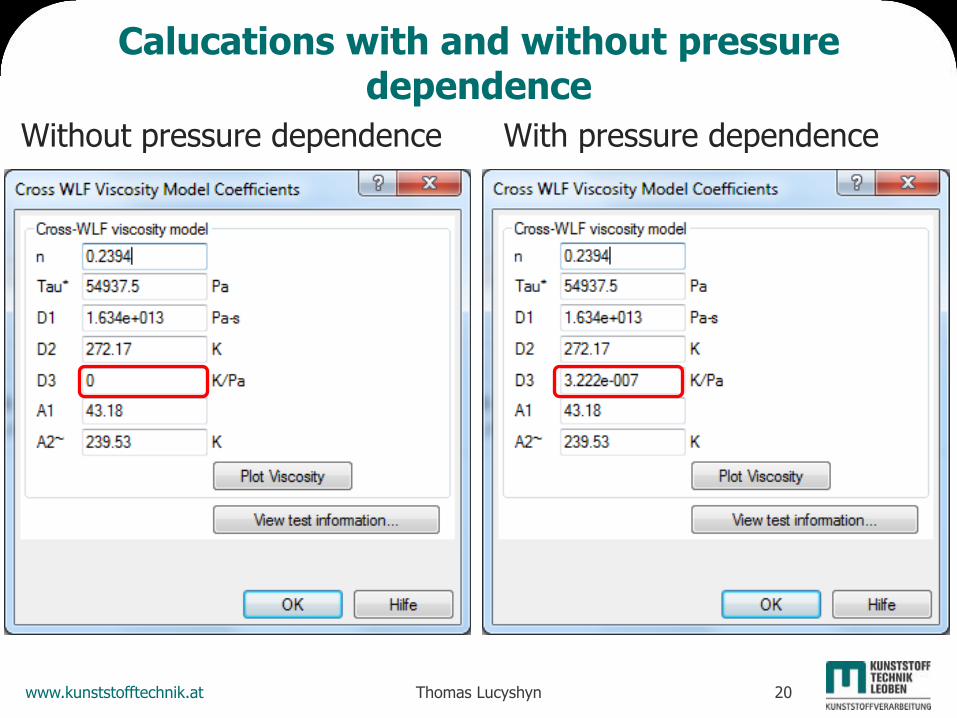
Approx. 8.800 thermoplastics in Moldflow 2014, of which about 100 materials with D3
www.kunststofftechnik.at Thomas Lucyshyn 17
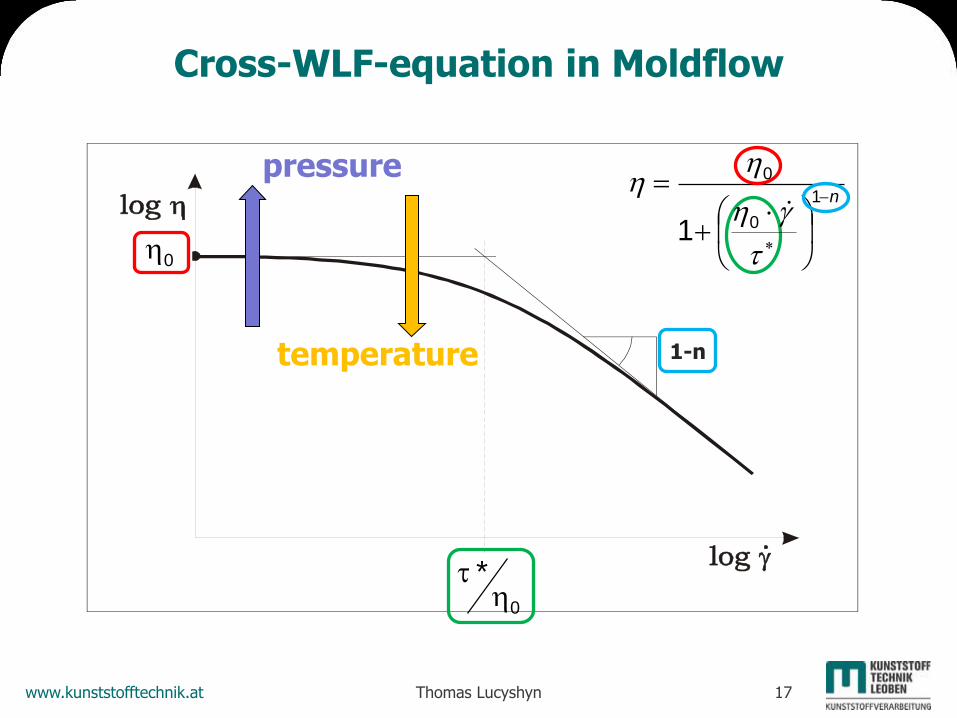
Cross-WLF-equation in Moldflow
CB1
A
n
1
0
0
1
(8)
0
0
*
1-n temperature
pressure
www.kunststofftechnik.at Thomas Lucyshyn 18
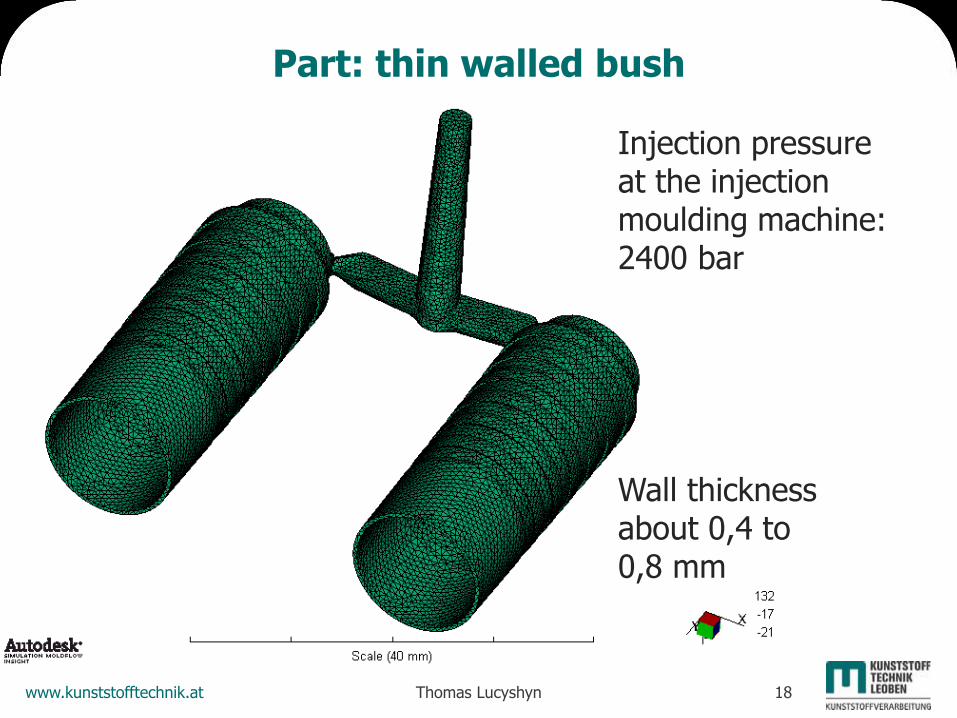
Part: thin walled bush
Wall thickness about 0,4 to 0,8 mm
Injection pressure at the injection moulding machine: 2400 bar
www.kunststofftechnik.at Thomas Lucyshyn 19
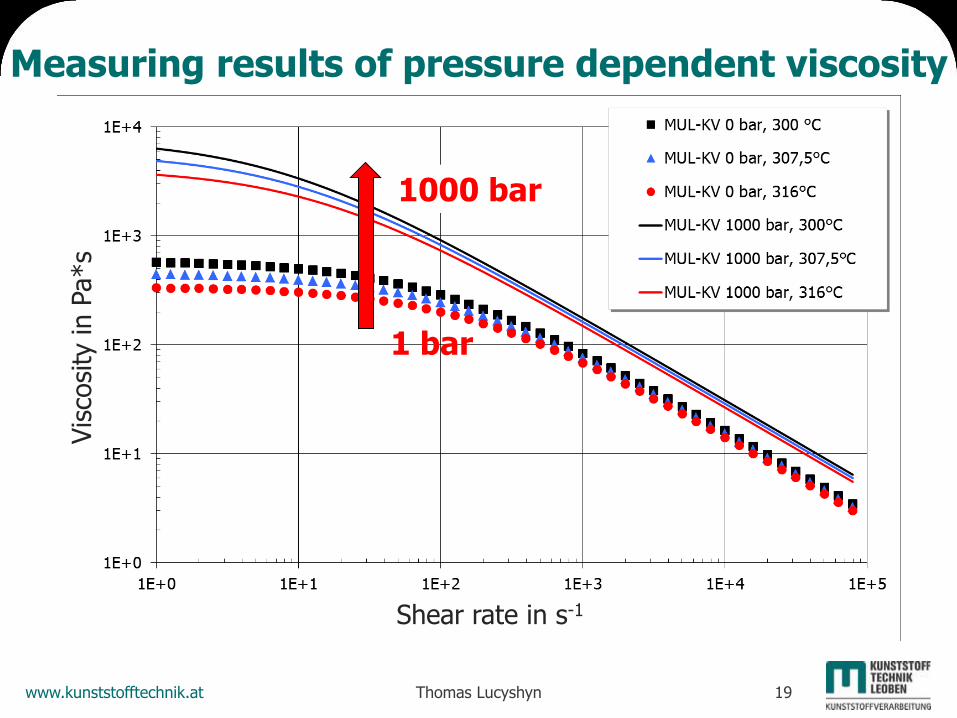
Measuring results of pressure dependent viscosity
1000 bar
1 bar
Vis
cosi
ty in P
a*s
Shear rate in s-1
www.kunststofftechnik.at Thomas Lucyshyn 20
Calucations with and without pressure dependence
Without pressure dependence With pressure dependence
www.kunststofftechnik.at Thomas Lucyshyn 21
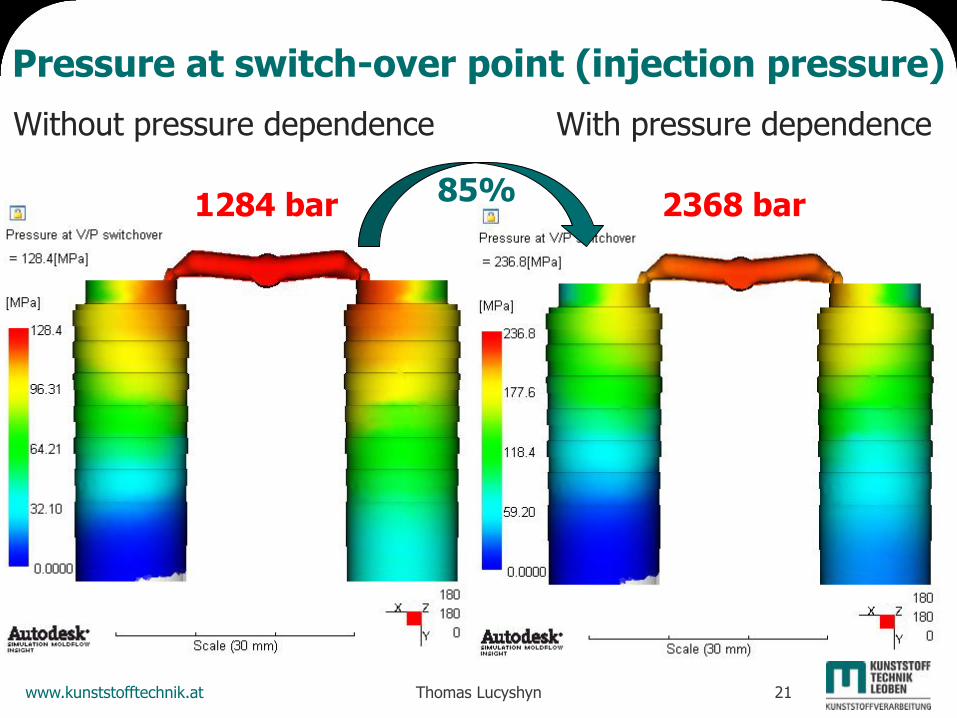
Pressure at switch-over point (injection pressure)
1284 bar
Without pressure dependence
2368 bar
With pressure dependence
85%
www.kunststofftechnik.at Thomas Lucyshyn 22
Content
Introduction
Melt Flow Rate (MFR) as reference value for viscosity
Pressure dependence of viscosity
Transition temperature
Thermal conductivity and specific heat capacity
pvT-data at different cooling rates
Summary
www.kunststofftechnik.at Thomas Lucyshyn 23
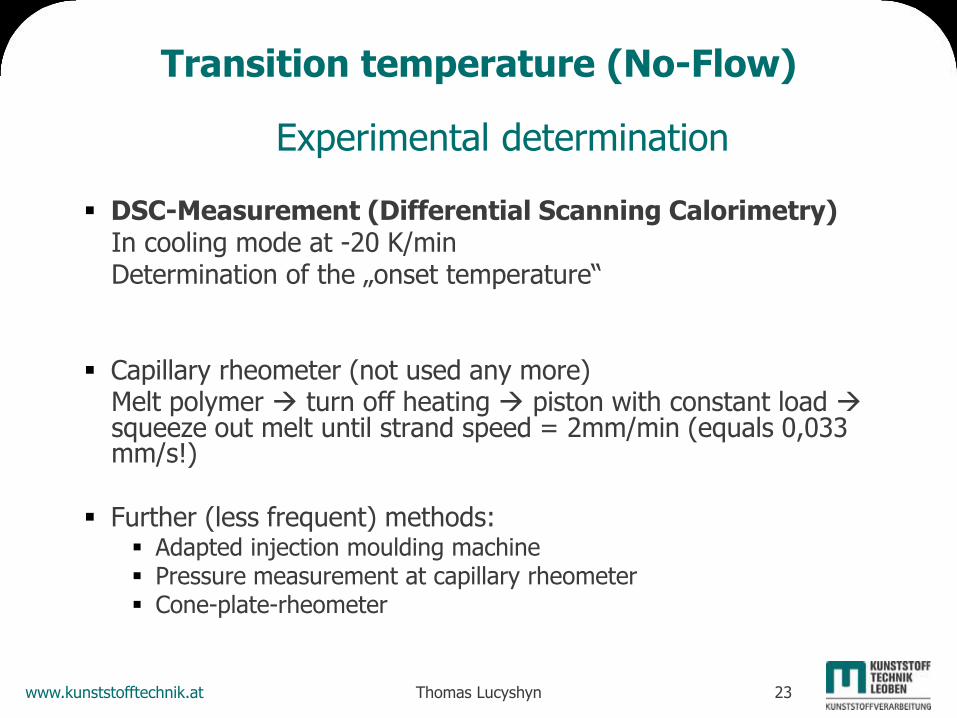
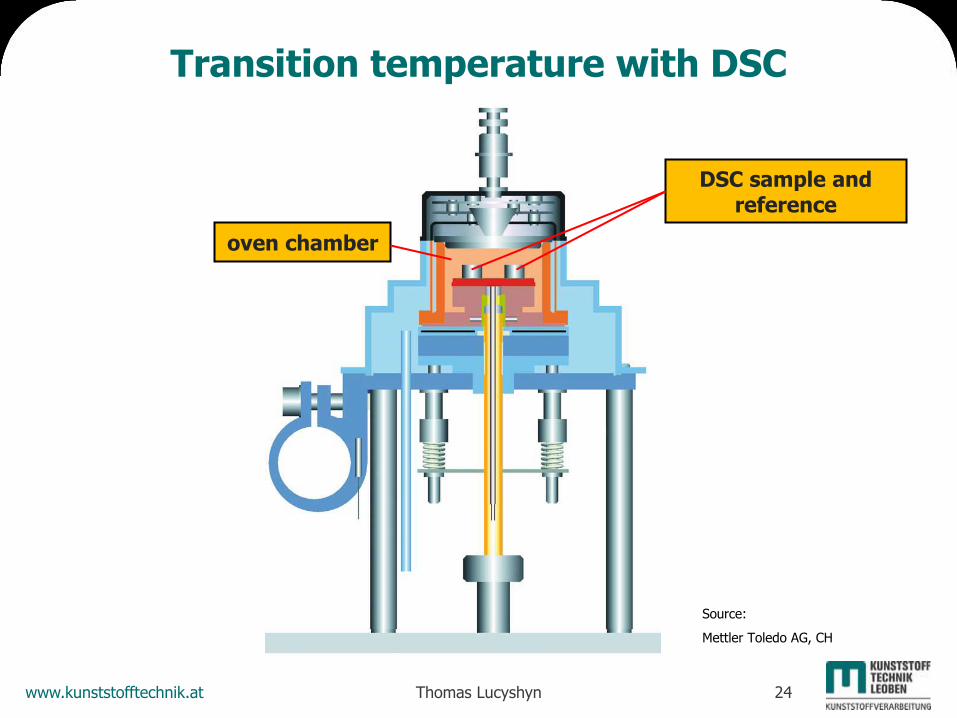
Transition temperature (No-Flow)
Experimental determination
DSC-Measurement (Differential Scanning Calorimetry) In cooling mode at -20 K/min Determination of the „onset temperature“
Capillary rheometer (not used any more) Melt polymer turn off heating piston with constant load
squeeze out melt until strand speed = 2mm/min (equals 0,033 mm/s!)
Further (less frequent) methods: Adapted injection moulding machine Pressure measurement at capillary rheometer Cone-plate-rheometer
www.kunststofftechnik.at Thomas Lucyshyn 24
Transition temperature with DSC
oven chamber
DSC sample and reference
Source:
Mettler Toledo AG, CH
www.kunststofftechnik.at Thomas Lucyshyn 25
20 40 60 80 100 120 140 160 180 2000
10
20
30
40
50
60
70
80
H (
mW
)
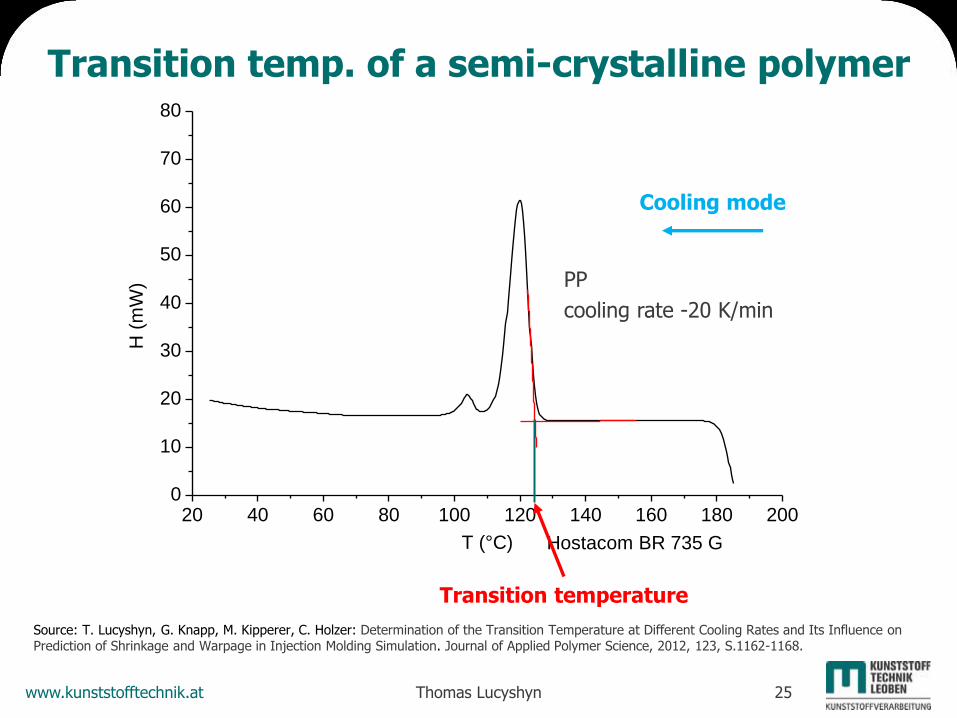
T (°C) Hostacom BR 735 G
Heat flow H as a function of temperature T
PP
cooling rate -20 K/min
Transition temperature
Cooling mode
Source: T. Lucyshyn, G. Knapp, M. Kipperer, C. Holzer: Determination of the Transition Temperature at Different Cooling Rates and Its Influence on Prediction of Shrinkage and Warpage in Injection Molding Simulation. Journal of Applied Polymer Science, 2012, 123, S.1162-1168.
Transition temp. of a semi-crystalline polymer
www.kunststofftechnik.at Thomas Lucyshyn 26
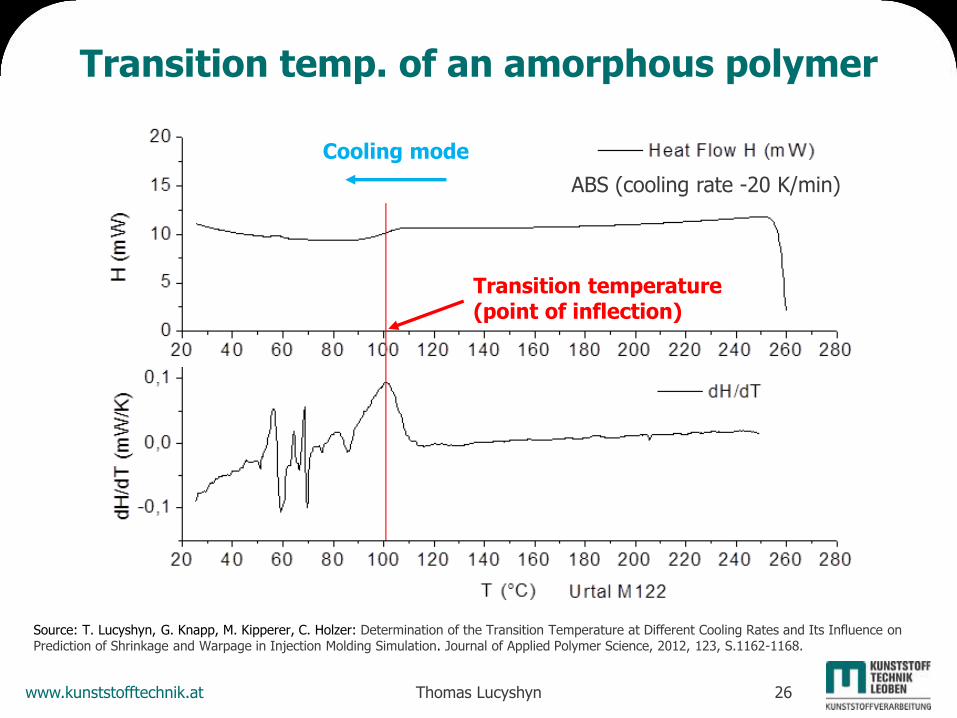
Transition temperature (point of inflection)
Cooling mode
Source: T. Lucyshyn, G. Knapp, M. Kipperer, C. Holzer: Determination of the Transition Temperature at Different Cooling Rates and Its Influence on Prediction of Shrinkage and Warpage in Injection Molding Simulation. Journal of Applied Polymer Science, 2012, 123, S.1162-1168.
Transition temp. of an amorphous polymer
ABS (cooling rate -20 K/min)
www.kunststofftechnik.at Thomas Lucyshyn 27
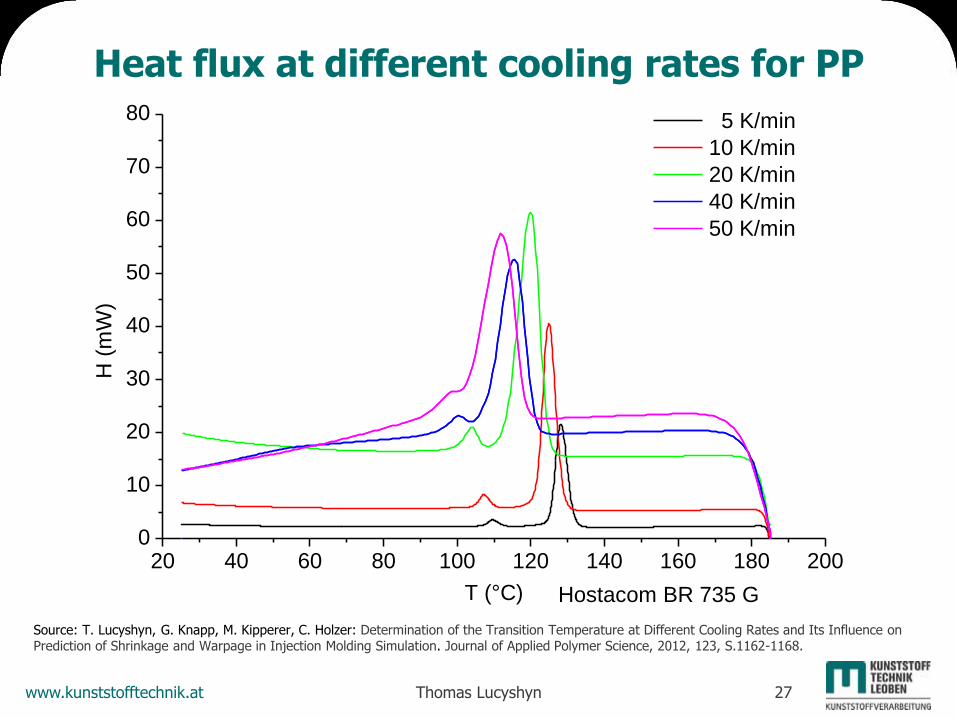
Heat flux at different cooling rates for PP
20 40 60 80 100 120 140 160 180 2000
10
20
30
40
50
60
70
80 5 K/min
10 K/min
20 K/min
40 K/min
50 K/min
H (
mW
)
T (°C) Hostacom BR 735 G
Source: T. Lucyshyn, G. Knapp, M. Kipperer, C. Holzer: Determination of the Transition Temperature at Different Cooling Rates and Its Influence on Prediction of Shrinkage and Warpage in Injection Molding Simulation. Journal of Applied Polymer Science, 2012, 123, S.1162-1168.
www.kunststofftechnik.at Thomas Lucyshyn 28
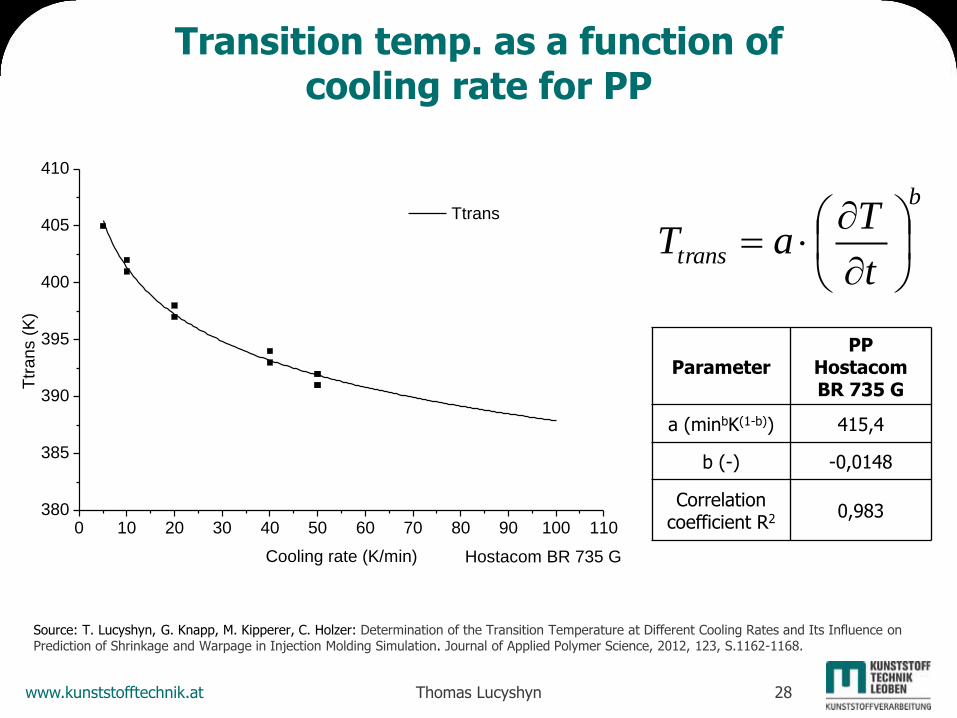
Transition temp. as a function of cooling rate for PP
b
transt
TaT
Parameter PP
Hostacom BR 735 G
a (minbK(1-b)) 415,4
b (-) -0,0148
Correlation coefficient R2
0,983 0 10 20 30 40 50 60 70 80 90 100 110
380
385
390
395
400
405
410
Ttr
ans (
K)
Hostacom BR 735 GCooling rate (K/min)
Ttrans
Source: T. Lucyshyn, G. Knapp, M. Kipperer, C. Holzer: Determination of the Transition Temperature at Different Cooling Rates and Its Influence on Prediction of Shrinkage and Warpage in Injection Molding Simulation. Journal of Applied Polymer Science, 2012, 123, S.1162-1168.
www.kunststofftechnik.at Thomas Lucyshyn 29
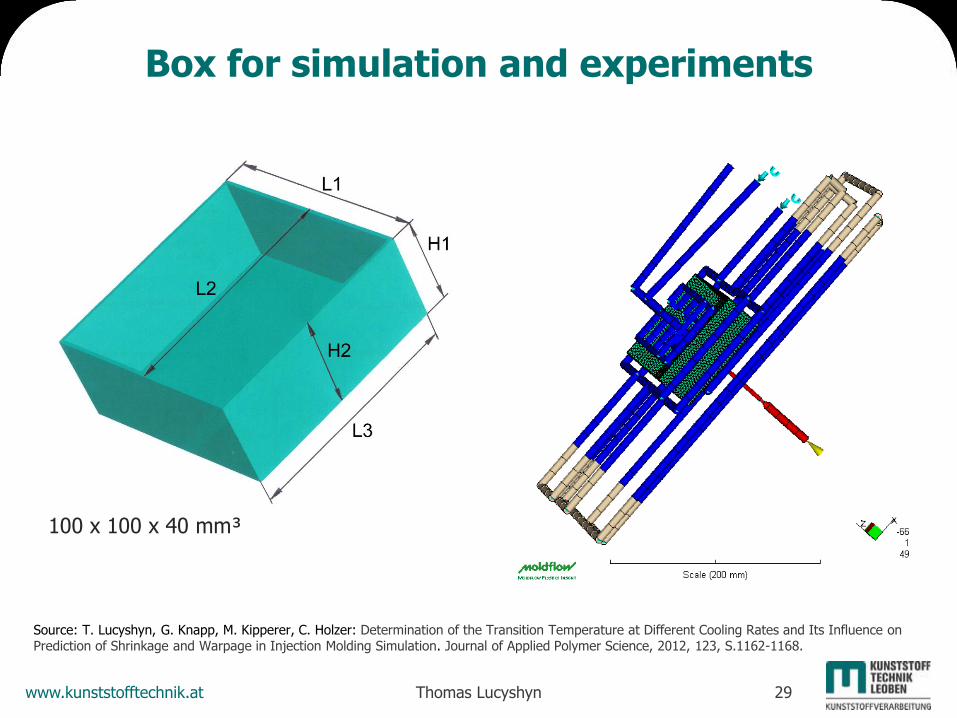
Box for simulation and experiments
100 x 100 x 40 mm³
Source: T. Lucyshyn, G. Knapp, M. Kipperer, C. Holzer: Determination of the Transition Temperature at Different Cooling Rates and Its Influence on Prediction of Shrinkage and Warpage in Injection Molding Simulation. Journal of Applied Polymer Science, 2012, 123, S.1162-1168.
www.kunststofftechnik.at Thomas Lucyshyn 30
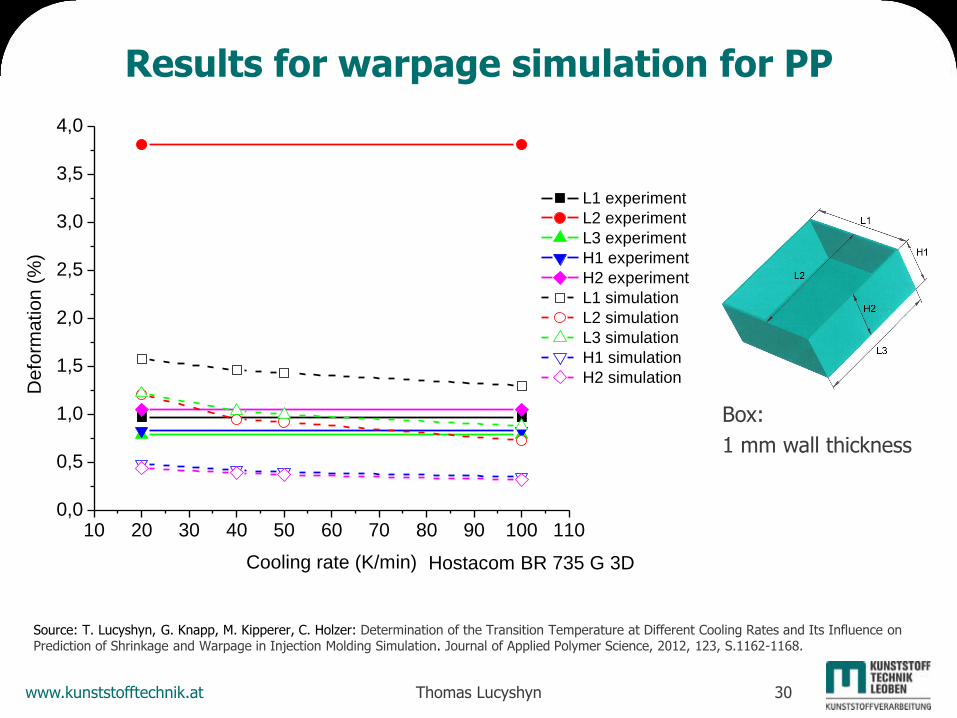
Results for warpage simulation for PP
10 20 30 40 50 60 70 80 90 100 1100,0
0,5
1,0
1,5
2,0
2,5
3,0
3,5
4,0
Defo
rmation (
%)
Cooling rate (K/min) Hostacom BR 735 G 3D
L1 experiment
L2 experiment
L3 experiment
H1 experiment
H2 experiment
L1 simulation
L2 simulation
L3 simulation
H1 simulation
H2 simulation
Box:
1 mm wall thickness
Source: T. Lucyshyn, G. Knapp, M. Kipperer, C. Holzer: Determination of the Transition Temperature at Different Cooling Rates and Its Influence on Prediction of Shrinkage and Warpage in Injection Molding Simulation. Journal of Applied Polymer Science, 2012, 123, S.1162-1168.
www.kunststofftechnik.at Thomas Lucyshyn 31
Content
Introduction
Melt Flow Rate (MFR) as reference value for viscosity
Pressure dependence of viscosity
Transition temperature
Thermal conductivity and specific heat capacity
pvT-data at different cooling rates
Summary
www.kunststofftechnik.at Thomas Lucyshyn 32
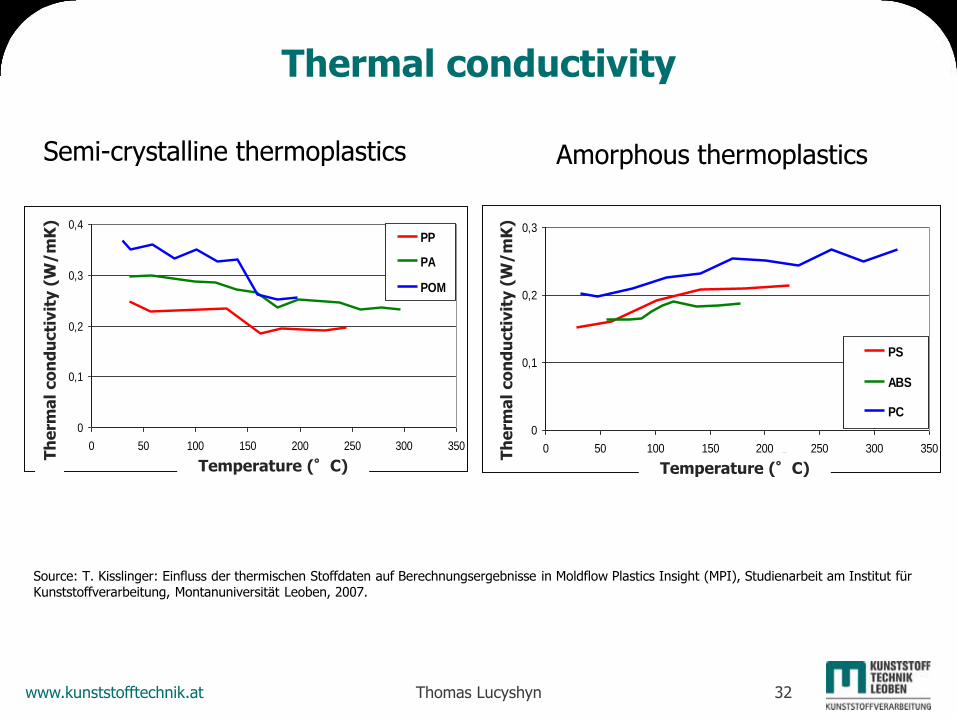
Semi-crystalline thermoplastics
0
0,1
0,2
0,3
0,4
0 50 100 150 200 250 300 350Temperatur [°C]
Wä
rme
leit
fäh
igk
eit
[W
/mK
] PP
PA
POM
Amorphous thermoplastics
0
0,1
0,2
0,3
0 50 100 150 200 250 300 350Temperatur [°C]
Wä
rme
leit
fäh
igk
eit
[W
/mK
]
PS
ABS
PC
Thermal conductivity
Source: T. Kisslinger: Einfluss der thermischen Stoffdaten auf Berechnungsergebnisse in Moldflow Plastics Insight (MPI), Studienarbeit am Institut für Kunststoffverarbeitung, Montanuniversität Leoben, 2007.
Th
erm
al
co
nd
ucti
vit
y (
W/m
K)
Temperature (°C)
Th
erm
al
co
nd
ucti
vit
y (
W/m
K)
Temperature (°C)
www.kunststofftechnik.at Thomas Lucyshyn 33
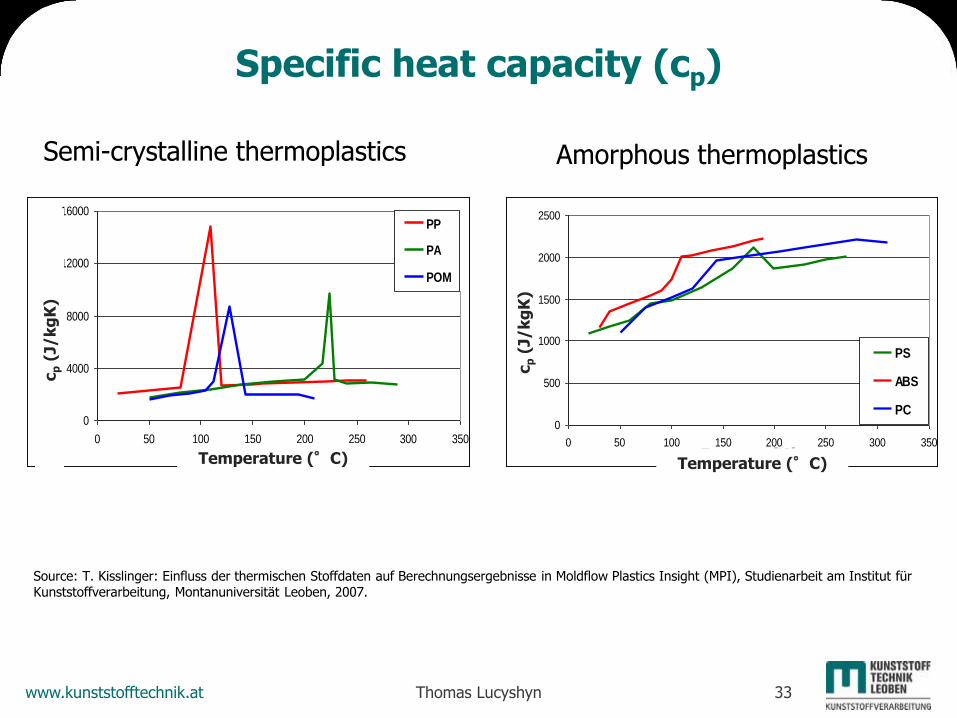
Specific heat capacity (cp)
Source: T. Kisslinger: Einfluss der thermischen Stoffdaten auf Berechnungsergebnisse in Moldflow Plastics Insight (MPI), Studienarbeit am Institut für Kunststoffverarbeitung, Montanuniversität Leoben, 2007.
0
4000
8000
12000
16000
0 50 100 150 200 250 300 350Temperatur [°C]
Cp
[J
/Kg
K]
PP
PA
POM
0
500
1000
1500
2000
2500
0 50 100 150 200 250 300 350Temperatur [°C]
Cp
[J
/Kg
K]
PS
ABS
PC
Semi-crystalline thermoplastics
Amorphous thermoplastics
cp (
J/k
gK
)
cp (
J/k
gK
)
Temperature (°C) Temperature (°C)
www.kunststofftechnik.at Thomas Lucyshyn 34
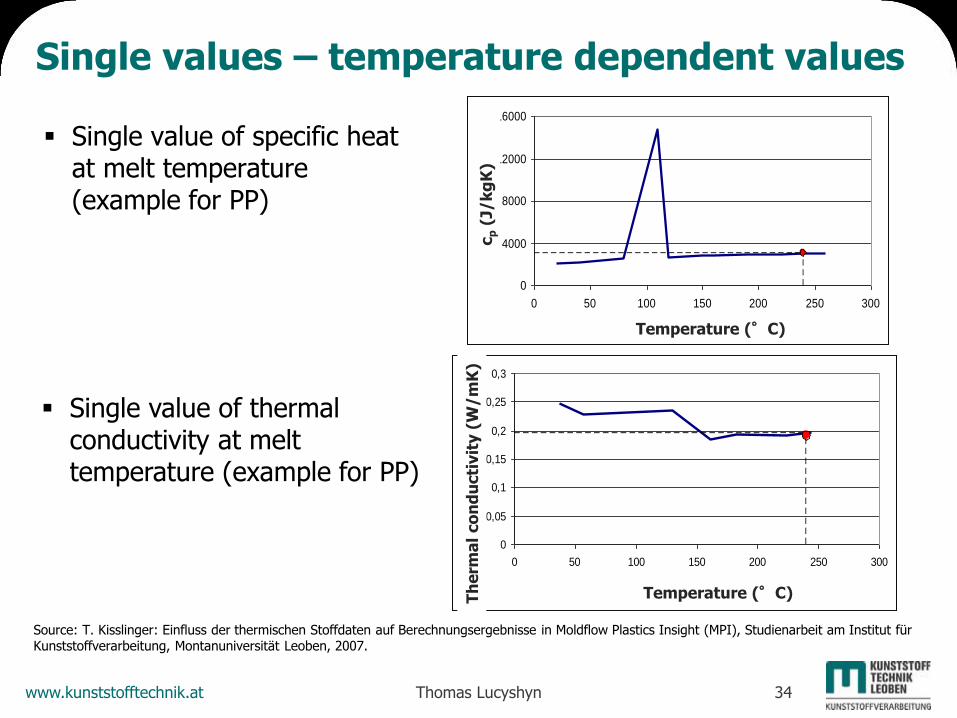
Single values – temperature dependent values
Single value of specific heat at melt temperature (example for PP)
Single value of thermal conductivity at melt temperature (example for PP)
0
0,05
0,1
0,15
0,2
0,25
0,3
0 50 100 150 200 250 300
Temperatur [°C]
Wä
rme
leit
fäh
igk
eit
[W
/mK
]
0
4000
8000
12000
16000
0 50 100 150 200 250 300
Temperatur [°C]
Cp
[J
/Kg
K]
Source: T. Kisslinger: Einfluss der thermischen Stoffdaten auf Berechnungsergebnisse in Moldflow Plastics Insight (MPI), Studienarbeit am Institut für Kunststoffverarbeitung, Montanuniversität Leoben, 2007.
cp (
J/k
gK
) T
he
rma
l co
nd
ucti
vit
y (
W/m
K)
Temperature (°C)
Temperature (°C)
www.kunststofftechnik.at Thomas Lucyshyn 35
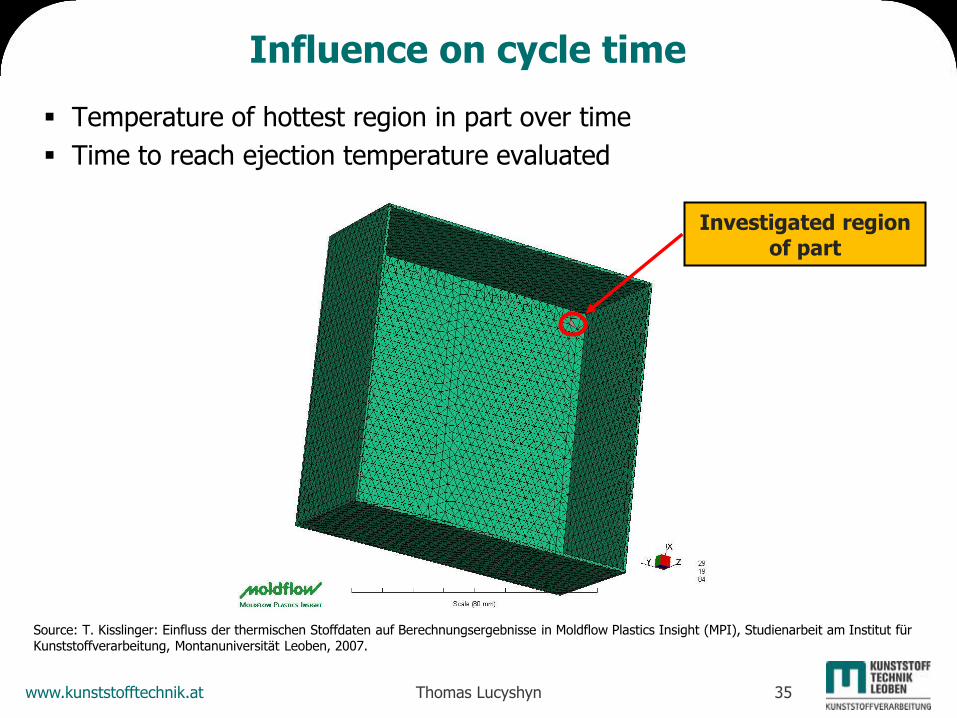
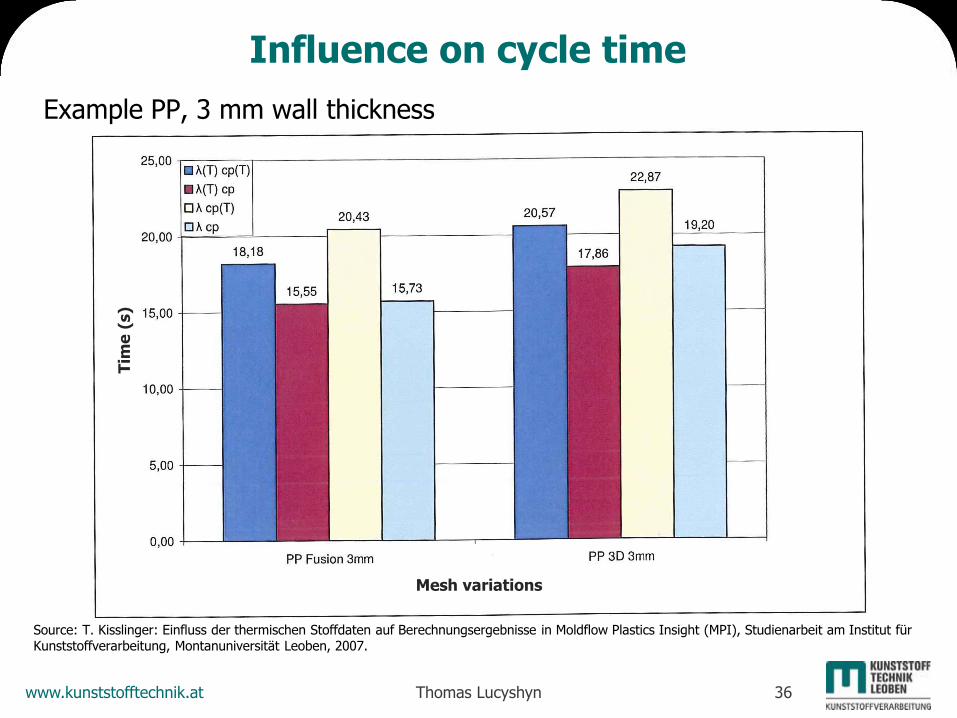
Influence on cycle time
Temperature of hottest region in part over time
Time to reach ejection temperature evaluated
Investigated region of part
Source: T. Kisslinger: Einfluss der thermischen Stoffdaten auf Berechnungsergebnisse in Moldflow Plastics Insight (MPI), Studienarbeit am Institut für Kunststoffverarbeitung, Montanuniversität Leoben, 2007.
www.kunststofftechnik.at Thomas Lucyshyn 36
Influence on cycle time
Example PP, 3 mm wall thickness
Source: T. Kisslinger: Einfluss der thermischen Stoffdaten auf Berechnungsergebnisse in Moldflow Plastics Insight (MPI), Studienarbeit am Institut für Kunststoffverarbeitung, Montanuniversität Leoben, 2007.
Tim
e (
s)
Mesh variations
www.kunststofftechnik.at Thomas Lucyshyn 37
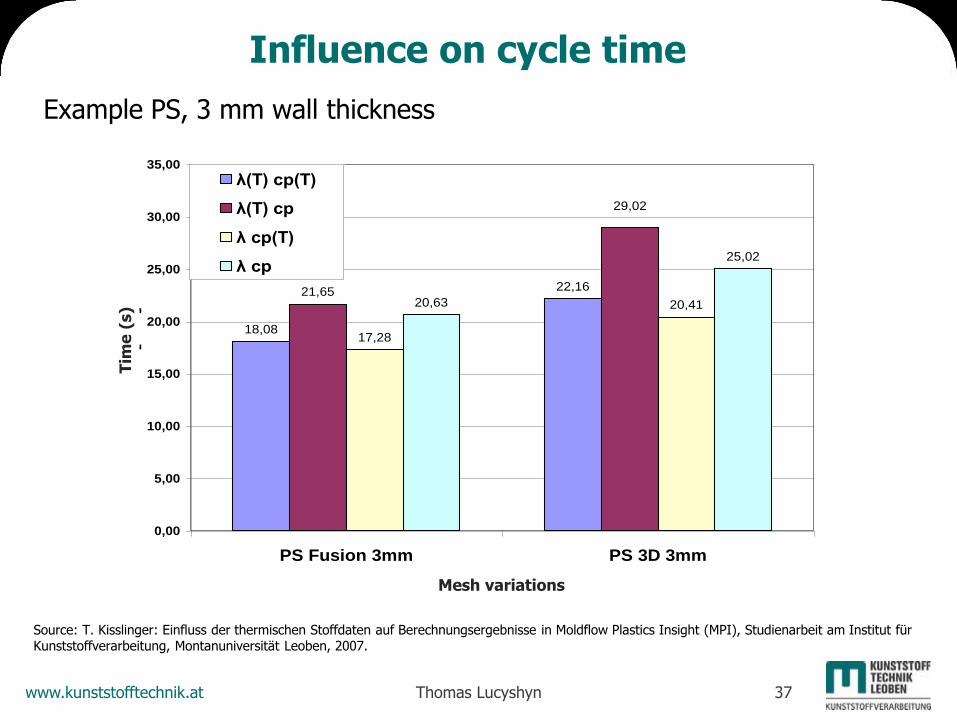
Influence on cycle time
Example PS, 3 mm wall thickness
18,08
22,1621,65
17,28
20,4120,63
25,02
29,02
0,00
5,00
10,00
15,00
20,00
25,00
30,00
35,00
PS Fusion 3mm PS 3D 3mm
Berechnungsvarianten
Ze
it [
se
c]
λ(T) cp(T)
λ(T) cp
λ cp(T)
λ cp
Source: T. Kisslinger: Einfluss der thermischen Stoffdaten auf Berechnungsergebnisse in Moldflow Plastics Insight (MPI), Studienarbeit am Institut für Kunststoffverarbeitung, Montanuniversität Leoben, 2007.
Tim
e (
s)
Mesh variations
www.kunststofftechnik.at Thomas Lucyshyn 38
Content
Introduction
Melt Flow Rate (MFR) as reference value for viscosity
Pressure dependence of viscosity
Transition temperature
Thermal conductivity and specific heat capacity
pvT-data at different cooling rates
Summary
www.kunststofftechnik.at Thomas Lucyshyn 39
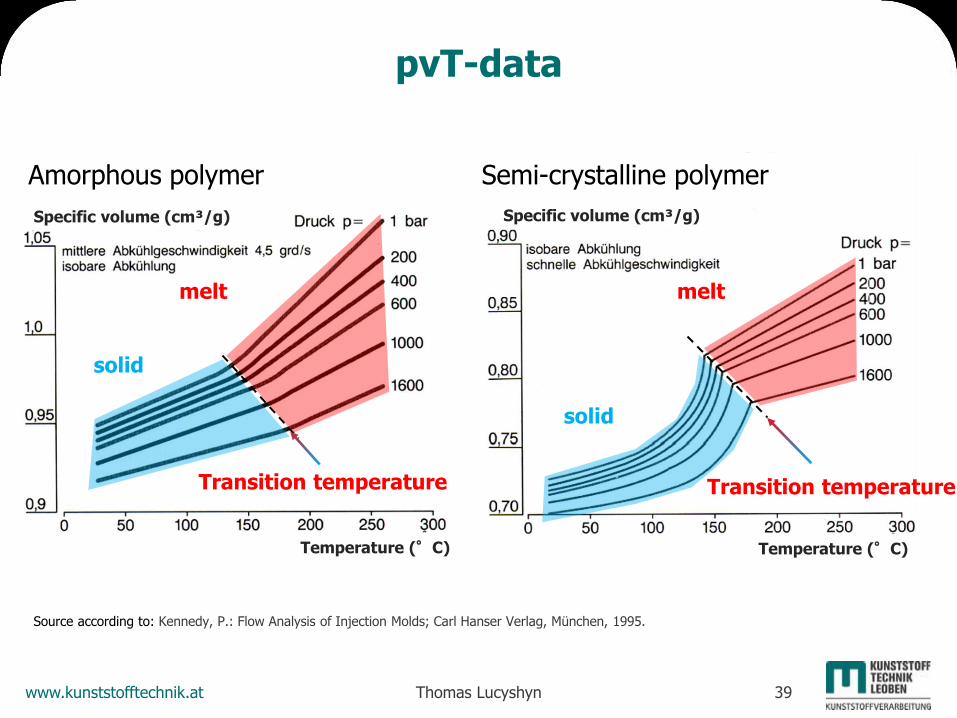
Semi-crystalline polymer
Temperature (°C)
Specific volume (cm³/g)
pvT-data
Amorphous polymer
Transition temperature
Source according to: Kennedy, P.: Flow Analysis of Injection Molds; Carl Hanser Verlag, München, 1995.
melt
solid
melt
solid
Temperature (°C)
Specific volume (cm³/g)
Transition temperature
www.kunststofftechnik.at Thomas Lucyshyn 40
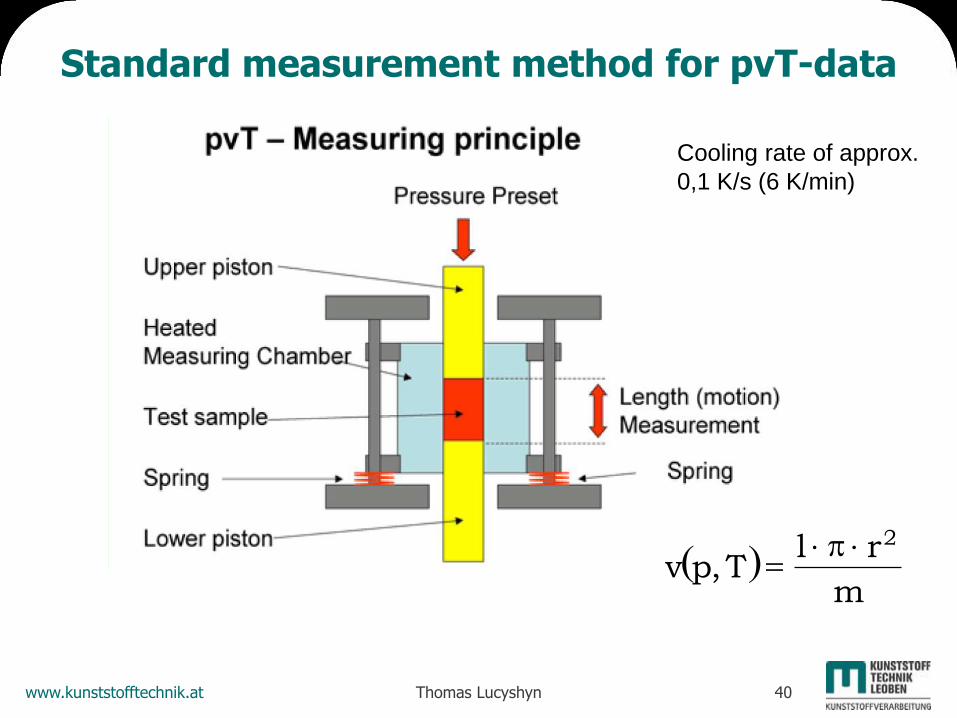
Standard measurement method for pvT-data
m
rlT,pv
2
Cooling rate of approx.
0,1 K/s (6 K/min)
www.kunststofftechnik.at Thomas Lucyshyn 41
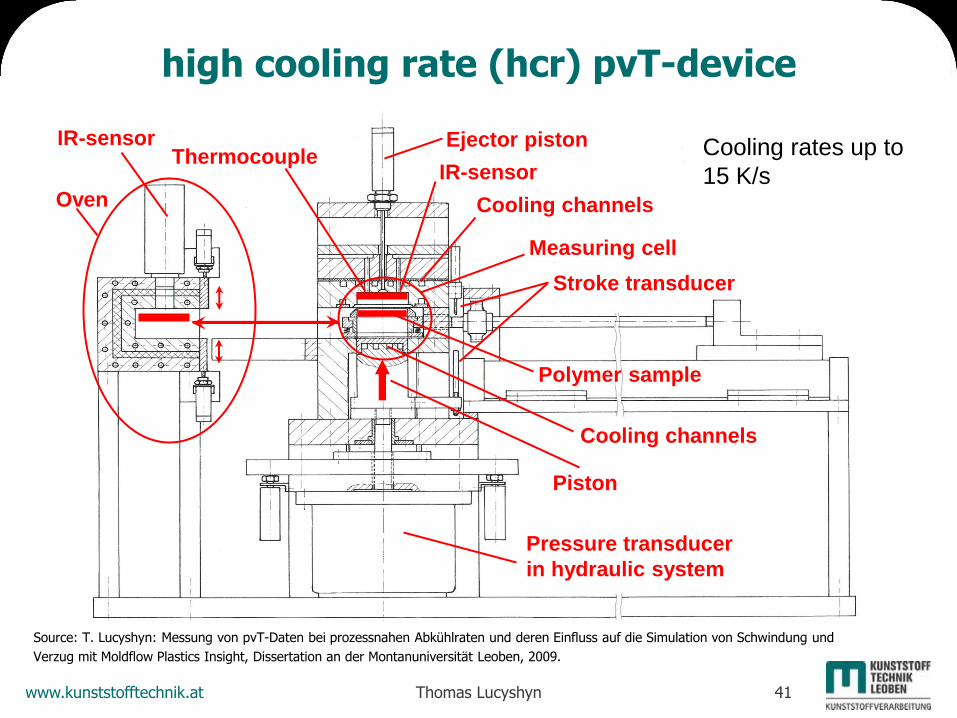
high cooling rate (hcr) pvT-device
Stroke transducer
Thermocouple Ejector piston
Measuring cell
Polymer sample
Cooling channels
Cooling channels
Piston
IR-sensor
Oven
IR-sensor
Pressure transducer
in hydraulic system
Cooling rates up to
15 K/s
Source: T. Lucyshyn: Messung von pvT-Daten bei prozessnahen Abkühlraten und deren Einfluss auf die Simulation von Schwindung und
Verzug mit Moldflow Plastics Insight, Dissertation an der Montanuniversität Leoben, 2009.
www.kunststofftechnik.at Thomas Lucyshyn 42
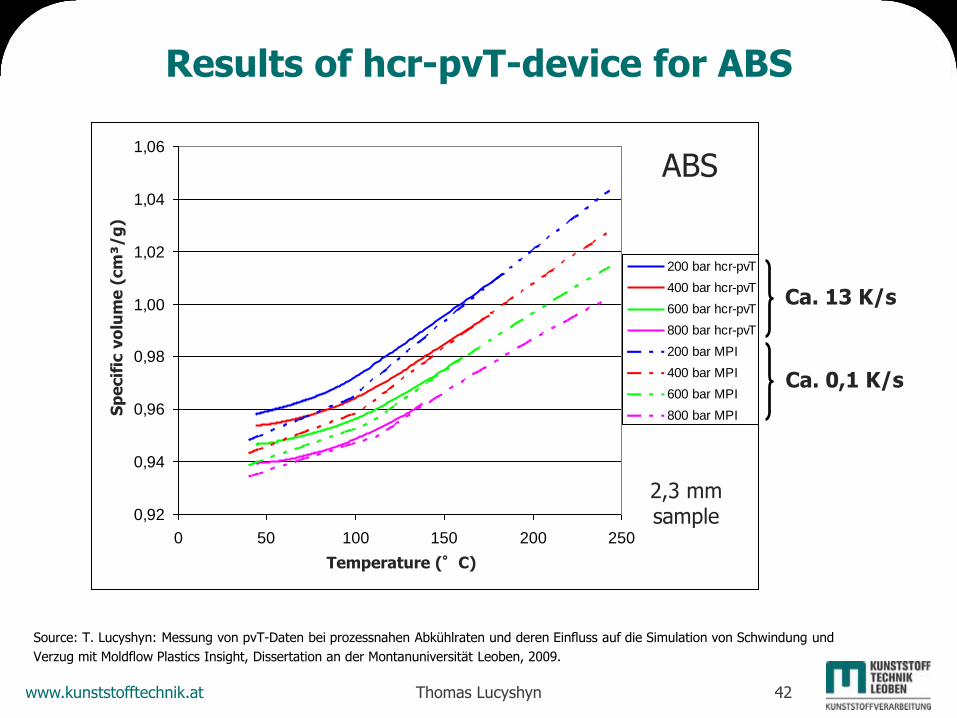
Results of hcr-pvT-device for ABS
0,92
0,94
0,96
0,98
1,00
1,02
1,04
1,06
0 50 100 150 200 250
Temperatur in °C
Sp
ezif
isc
he
s V
olu
me
n in
cm
³/g
200 bar hcr-pvT
400 bar hcr-pvT
600 bar hcr-pvT
800 bar hcr-pvT
200 bar MPI
400 bar MPI
600 bar MPI
800 bar MPI
ABS
Ca. 13 K/s
Ca. 0,1 K/s
2,3 mm sample
Source: T. Lucyshyn: Messung von pvT-Daten bei prozessnahen Abkühlraten und deren Einfluss auf die Simulation von Schwindung und
Verzug mit Moldflow Plastics Insight, Dissertation an der Montanuniversität Leoben, 2009.
Temperature (°C)
Sp
ecif
ic v
olu
me
(cm
³/g
)
www.kunststofftechnik.at Thomas Lucyshyn 43
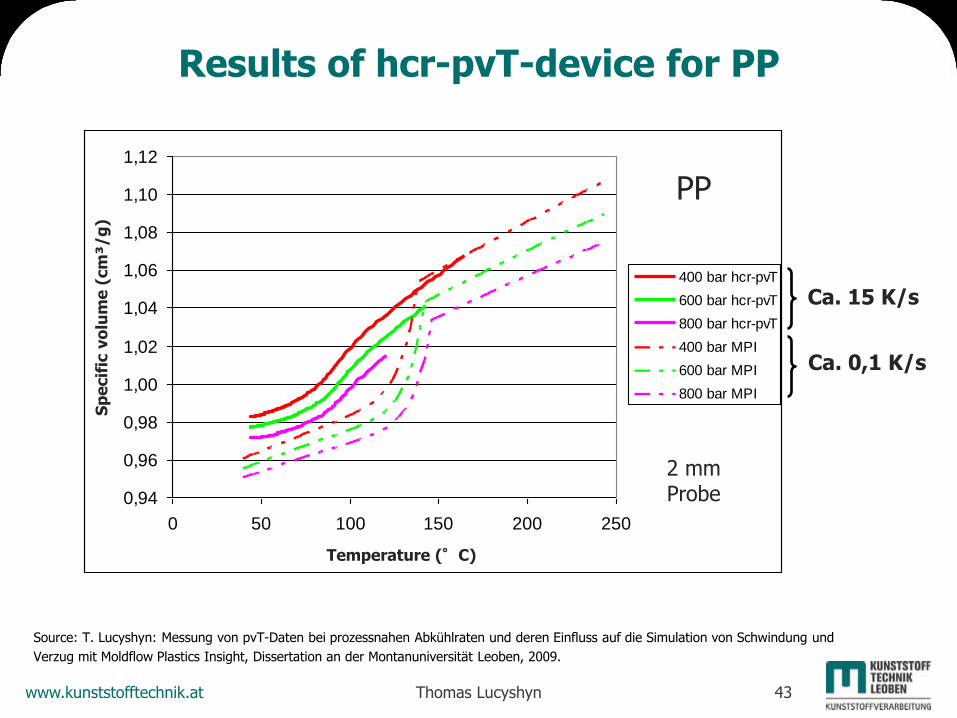
Results of hcr-pvT-device for PP
Ca. 15 K/s
Ca. 0,1 K/s
0,94
0,96
0,98
1,00
1,02
1,04
1,06
1,08
1,10
1,12
0 50 100 150 200 250
Temperatur in °C
Sp
ez. V
olu
me
n in
cm
³/g
400 bar hcr-pvT
600 bar hcr-pvT
800 bar hcr-pvT
400 bar MPI
600 bar MPI
800 bar MPI
PP
2 mm Probe
Source: T. Lucyshyn: Messung von pvT-Daten bei prozessnahen Abkühlraten und deren Einfluss auf die Simulation von Schwindung und
Verzug mit Moldflow Plastics Insight, Dissertation an der Montanuniversität Leoben, 2009.
Temperature (°C)
Sp
ecif
ic v
olu
me
(cm
³/g
)
www.kunststofftechnik.at Thomas Lucyshyn 44
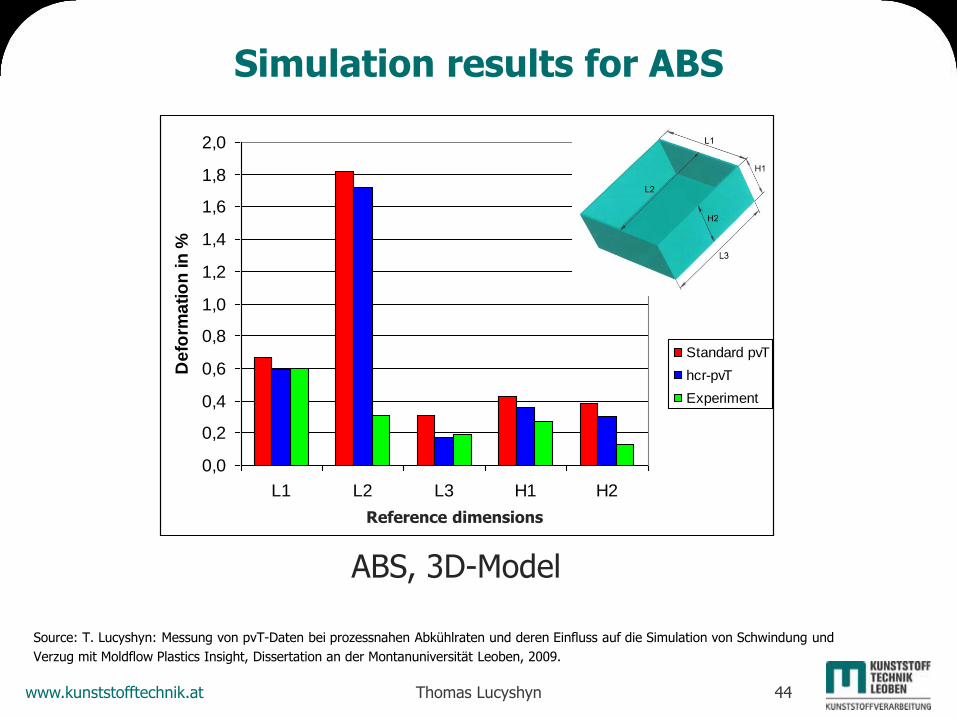
Simulation results for ABS
0,0
0,2
0,4
0,6
0,8
1,0
1,2
1,4
1,6
1,8
2,0
L1 L2 L3 H1 H2
Vergleichsmaße
De
form
ati
on
in
%
Standard pvT
hcr-pvT
Experiment
ABS, 3D-Model
Source: T. Lucyshyn: Messung von pvT-Daten bei prozessnahen Abkühlraten und deren Einfluss auf die Simulation von Schwindung und
Verzug mit Moldflow Plastics Insight, Dissertation an der Montanuniversität Leoben, 2009.
Reference dimensions
www.kunststofftechnik.at Thomas Lucyshyn 45
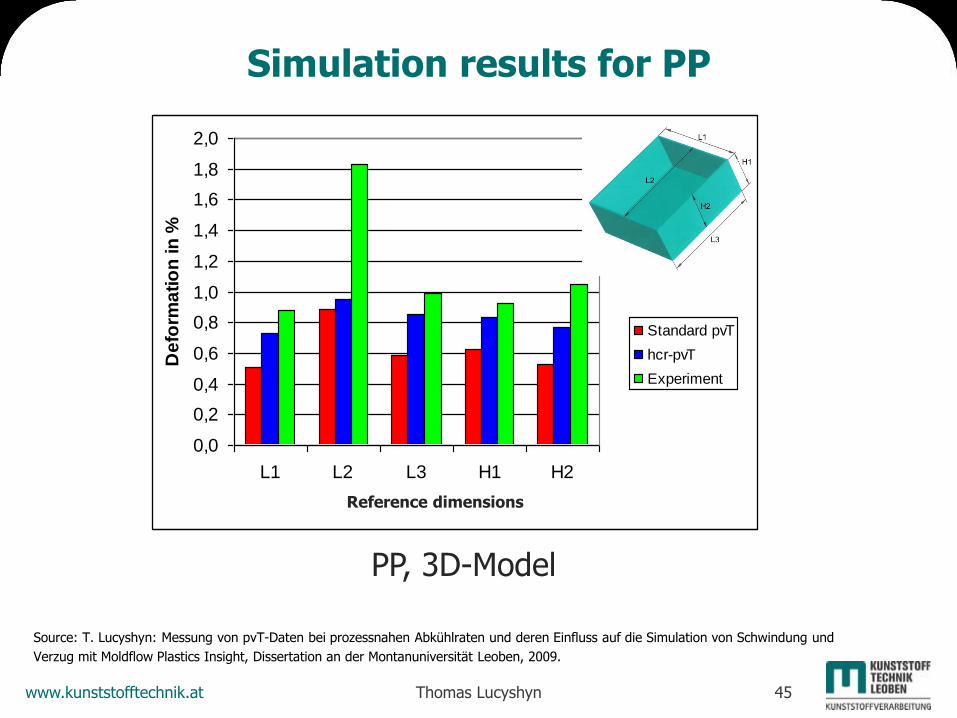
Simulation results for PP
PP, 3D-Model
0,0
0,2
0,4
0,6
0,8
1,0
1,2
1,4
1,6
1,8
2,0
L1 L2 L3 H1 H2
Vergleichsmaße
De
form
ati
on
in
%
Standard pvT
hcr-pvT
Experiment
Source: T. Lucyshyn: Messung von pvT-Daten bei prozessnahen Abkühlraten und deren Einfluss auf die Simulation von Schwindung und
Verzug mit Moldflow Plastics Insight, Dissertation an der Montanuniversität Leoben, 2009.
Reference dimensions
www.kunststofftechnik.at Thomas Lucyshyn 46
Content
Introduction
Melt Flow Rate (MFR) as reference value for viscosity
Pressure dependence of viscosity
Transition temperature
Thermal conductivity and specific heat capacity
pvT-data at different cooling rates
Summary
www.kunststofftechnik.at Thomas Lucyshyn 47
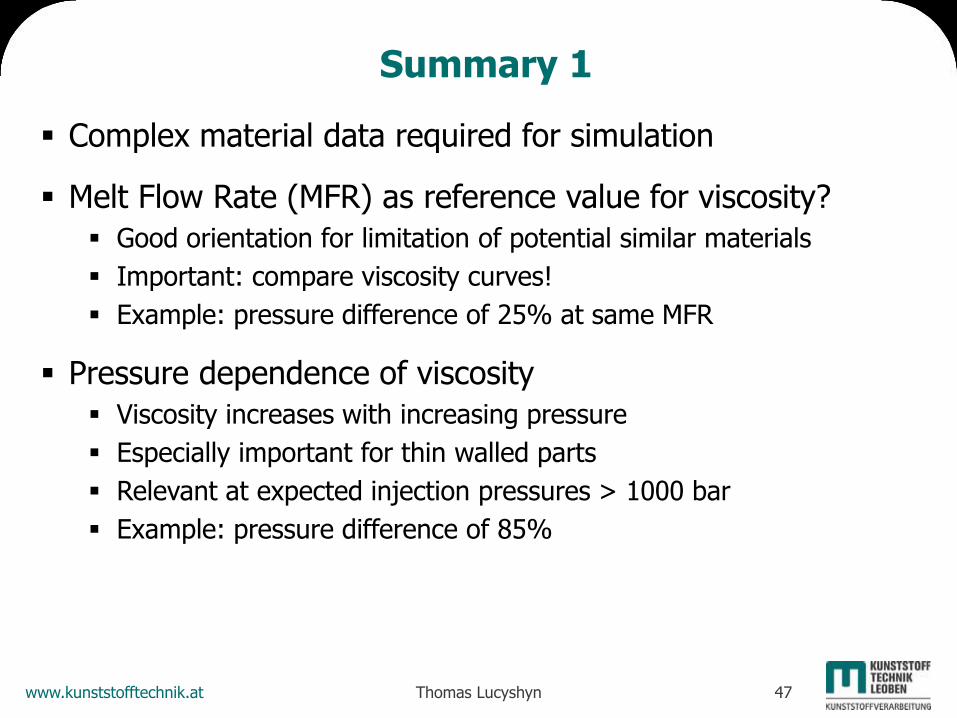
Summary 1
Complex material data required for simulation
Melt Flow Rate (MFR) as reference value for viscosity?
Good orientation for limitation of potential similar materials
Important: compare viscosity curves!
Example: pressure difference of 25% at same MFR
Pressure dependence of viscosity
Viscosity increases with increasing pressure
Especially important for thin walled parts
Relevant at expected injection pressures > 1000 bar
Example: pressure difference of 85%
www.kunststofftechnik.at Thomas Lucyshyn 48
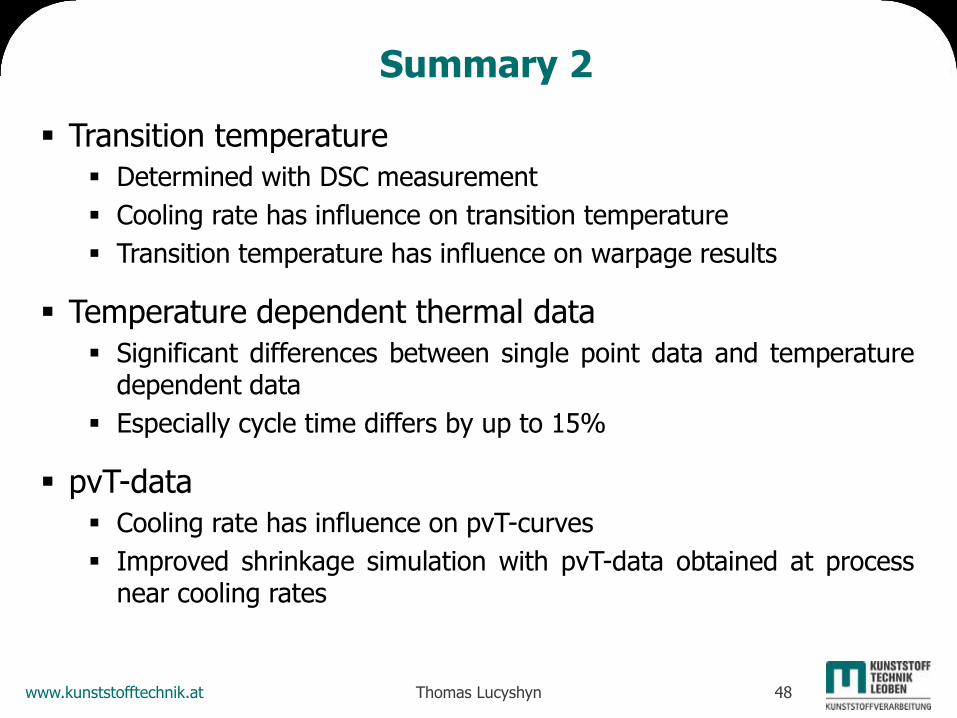
Summary 2
Transition temperature
Determined with DSC measurement
Cooling rate has influence on transition temperature
Transition temperature has influence on warpage results
Temperature dependent thermal data
Significant differences between single point data and temperature dependent data
Especially cycle time differs by up to 15%
pvT-data
Cooling rate has influence on pvT-curves
Improved shrinkage simulation with pvT-data obtained at process near cooling rates
www.kunststofftechnik.at Thomas Lucyshyn 49
Thank you for your attention!
Contact: Ass.Prof. Dr. Thomas Lucyshyn Chair of Polymer Processing Montanuniversitaet Leoben Otto Gloeckel-Str. 2 8700 Leoben 03842 / 402 – 3510 [email protected]
Recommended
![ms2: Ein Werkzeug zur Berechnung thermodynamischer ... · 29 dem Bottom-Up Prinzip. Es können mit dieser Methode alle thermodynamischen 30 Stoffdaten [5] ... Das Sampling kann durch](https://img.pdfslide.net/doc/110x75/5d617e7488c993d6258b4f87/ms2-ein-werkzeug-zur-berechnung-thermodynamischer-29-dem-bottom-up-prinzip.jpg)