Managed by UT-Battelle for the Department of Energy
Transitioning From Fuel Cells to Redox Flow Cells
T. Zawodzinski and Matt Mench University of Tennessee and ORNL

Managed by UT-Battelle for the Department of Energy
2
Acknowledgments
$$ DOE-OE
EPRI GCEP
NSF EPSCOR (TN SCORE) UTK Governor’s Chair Fund
Partner in Crime
Matt Mench
Managed by UT-Battelle for the Department of Energy
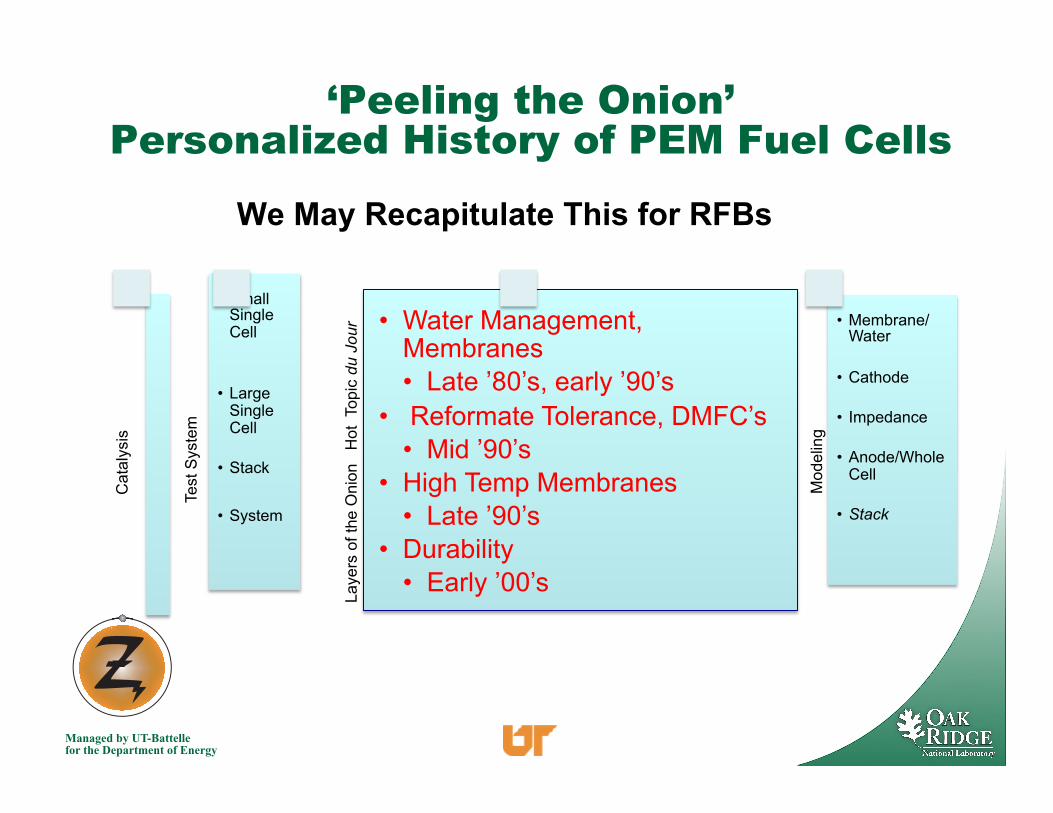
‘Peeling the Onion’ Personalized History of PEM Fuel Cells
We May Recapitulate This for RFBs
Cat
alys
is
Test
Sys
tem
• Small Single Cell
• Large Single Cell
• Stack
• System
Laye
rs o
f the
Oni
on
Hot
Top
ic d
u Jo
ur • Water Management,
Membranes • Late ’80’s, early ’90’s
• Reformate Tolerance, DMFC’s • Mid ’90’s
• High Temp Membranes • Late ’90’s
• Durability • Early ’00’s
Mod
elin
g
• Membrane/Water
• Cathode
• Impedance
• Anode/Whole Cell
• Stack
Managed by UT-Battelle for the Department of Energy
Transitioning to RFBs What Could Remain the Same
1. Materials – Membranes, diffusion media, electrodes, hardware
2. Diagnostics – Flow batteries are a lot like fuel cells – Polarization curves, ASR, segmented cells
• This is NOT the way battery people test!
Managed by UT-Battelle for the Department of Energy
Transitioning to RFBs What is Different
1. Battery Chemistry – Many different chemistries – Multiple components – Different reactivity challenges
2. Need to account for state of charge
3. Energy density, power density concerns different
4. Cost drivers different
Managed by UT-Battelle for the Department of Energy
Membranes from Fuel Cells to RFBs 1. The Good
– Many different membranes available • PFSAs, Hydrocarbons
2. The Not so Good – Starting over to understand durability; multiple
chemistries to take into account – Cross-over is more prevalent and a big issue; lots of
water pumping as well
3. The Ugly – Multiple components lead to complex transport
4. The Just Plain Different – Both membranes and porous separators used
Managed by UT-Battelle for the Department of Energy
Transitioning Electrodes to RFBs 1. The Good
– Many different porous carbon materials for electrodes – Don’t always have catalysis
2. The Not so Good – Transport issues are rather different – Need to sort out the loss mechanisms
3. The Ugly – Air electrodes are real issues
4. The Just Plain Different – All phases used; concentration polarization
Managed by UT-Battelle for the Department of Energy
Transitioning Cells and Stacks to RFBs 1. The Ugly
– Typical flow cell design has horrible performance characteristics
2. The Good – Flow-by cells (typical fuel cell architecture) works
• Bipolar plates?
3. The Not so Good – Need to deal with shunt currents – Multiple phases?
Managed by UT-Battelle for the Department of Energy
Diagnostics for RFBs 1. The Good
– Many standard approaches for battery testing
2. The Not so Good – This has fuel cell characteristics and these FC test
methods yield more information – Significant need to transfer from FCs
3. The Ugly – Simple descriptions often do not exist
4. The Just Plain Different – Complex electrolytes and transport issues
Managed by UT-Battelle for the Department of Energy
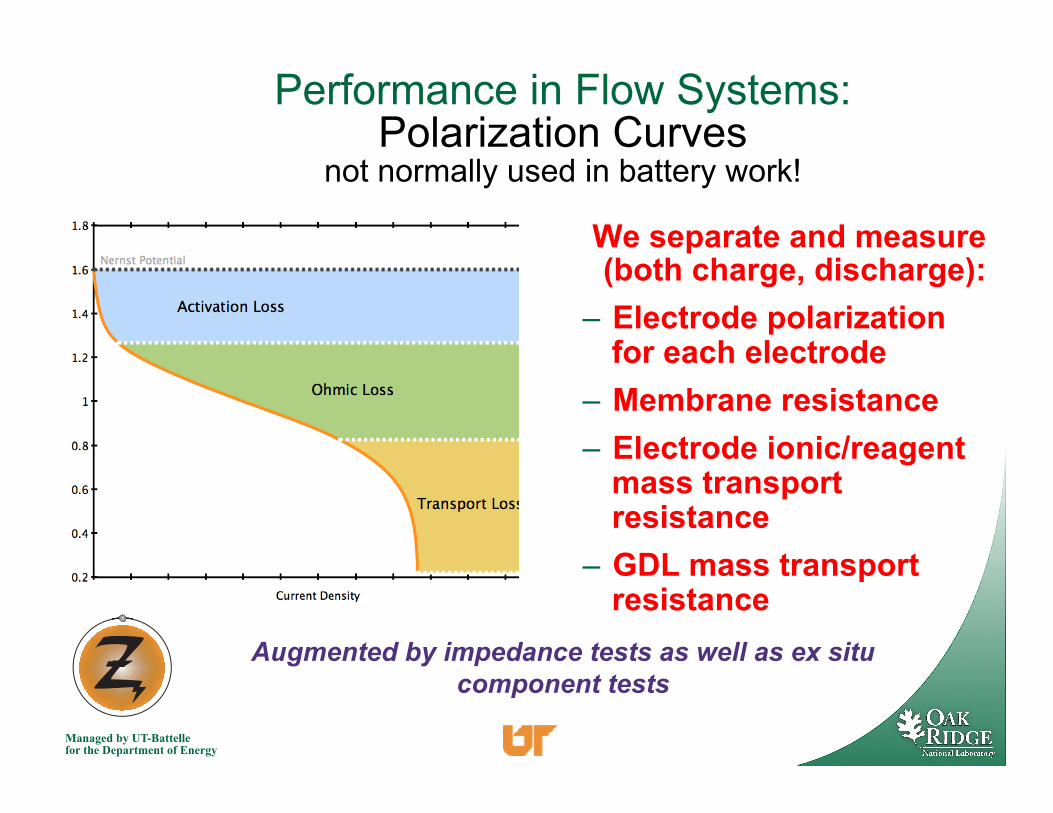
Performance in Flow Systems: Polarization Curves
not normally used in battery work! We separate and measure (both charge, discharge):
– Electrode polarization for each electrode
– Membrane resistance – Electrode ionic/reagent
mass transport resistance
– GDL mass transport resistance
Augmented by impedance tests as well as ex situ component tests
Managed by UT-Battelle for the Department of Energy
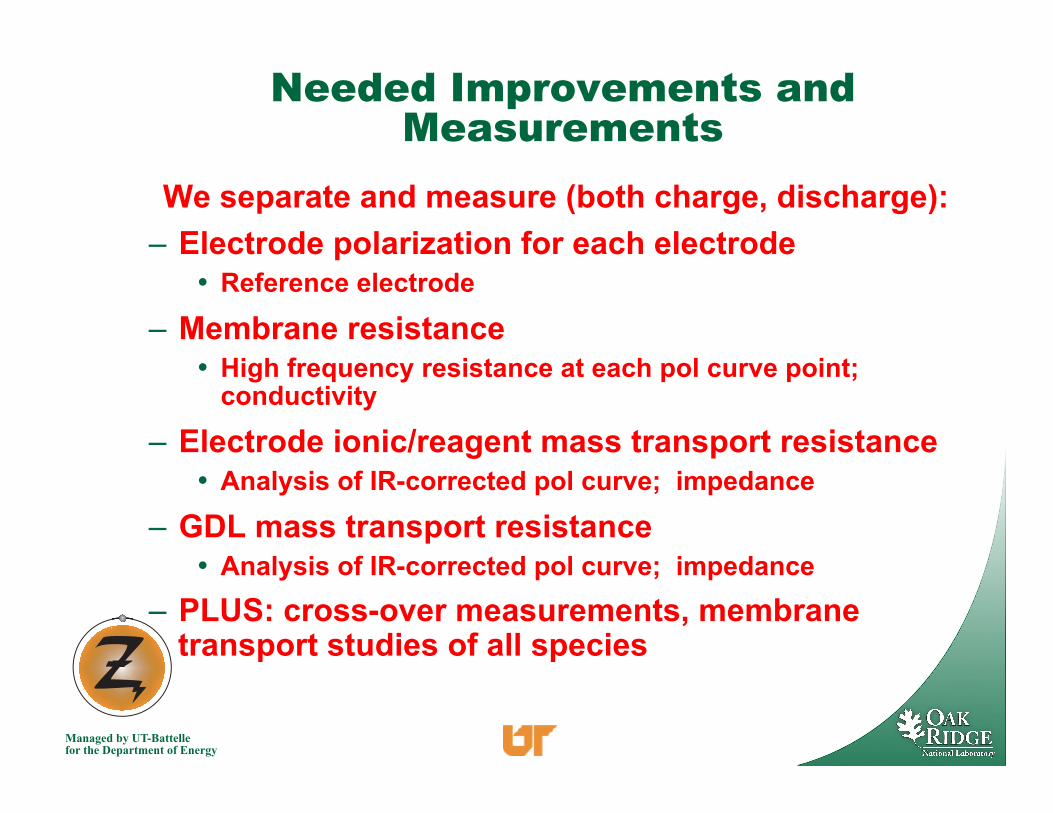
Needed Improvements and Measurements
We separate and measure (both charge, discharge): – Electrode polarization for each electrode
• Reference electrode
– Membrane resistance • High frequency resistance at each pol curve point;
conductivity
– Electrode ionic/reagent mass transport resistance • Analysis of IR-corrected pol curve; impedance
– GDL mass transport resistance • Analysis of IR-corrected pol curve; impedance
– PLUS: cross-over measurements, membrane transport studies of all species
Managed by UT-Battelle for the Department of Energy
Missing Diagnostics that we enjoy in fuel cells
– ESA measurements – Detailed understanding of flow and current
distribution – Detailed descriptions of what goes where and how
fast – Life testing/durability methods
– And one other thing: patience!
Managed by UT-Battelle for the Department of Energy
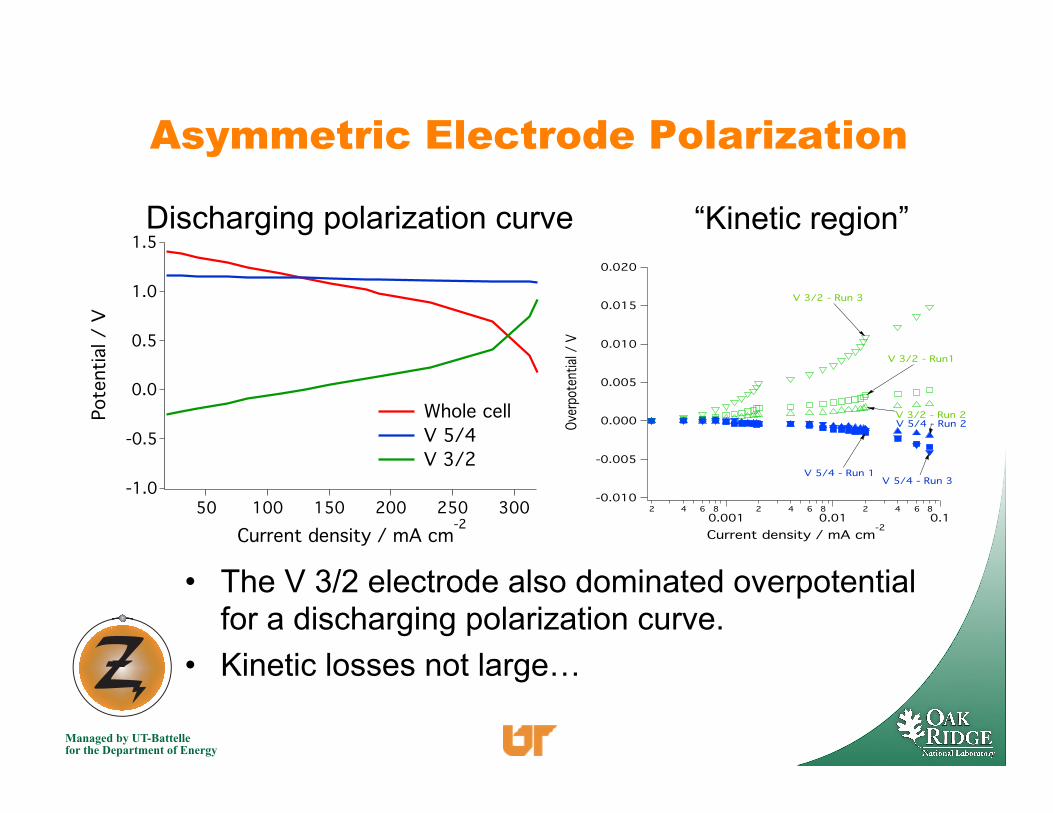
Asymmetric Electrode Polarization
• The V 3/2 electrode also dominated overpotential for a discharging polarization curve.
• Kinetic losses not large…
1.5
1.0
0.5
0.0
-0.5
-1.0
Pote
ntia
l / V
30025020015010050Current density / mA cm-2
Whole cell V 5/4 V 3/2
“Kinetic region” Discharging polarization curve 0.020
0.015
0.010
0.005
0.000
-0.005
-0.010
Over
pote
ntial
/ V
2 4 6 80.001
2 4 6 80.01
2 4 6 80.1
Current density / mA cm-2
V 3/2 - Run 3
V 3/2 - Run 2
V 3/2 - Run1
V 5/4 - Run 2
V 5/4 - Run 1V 5/4 - Run 3
Managed by UT-Battelle for the Department of Energy
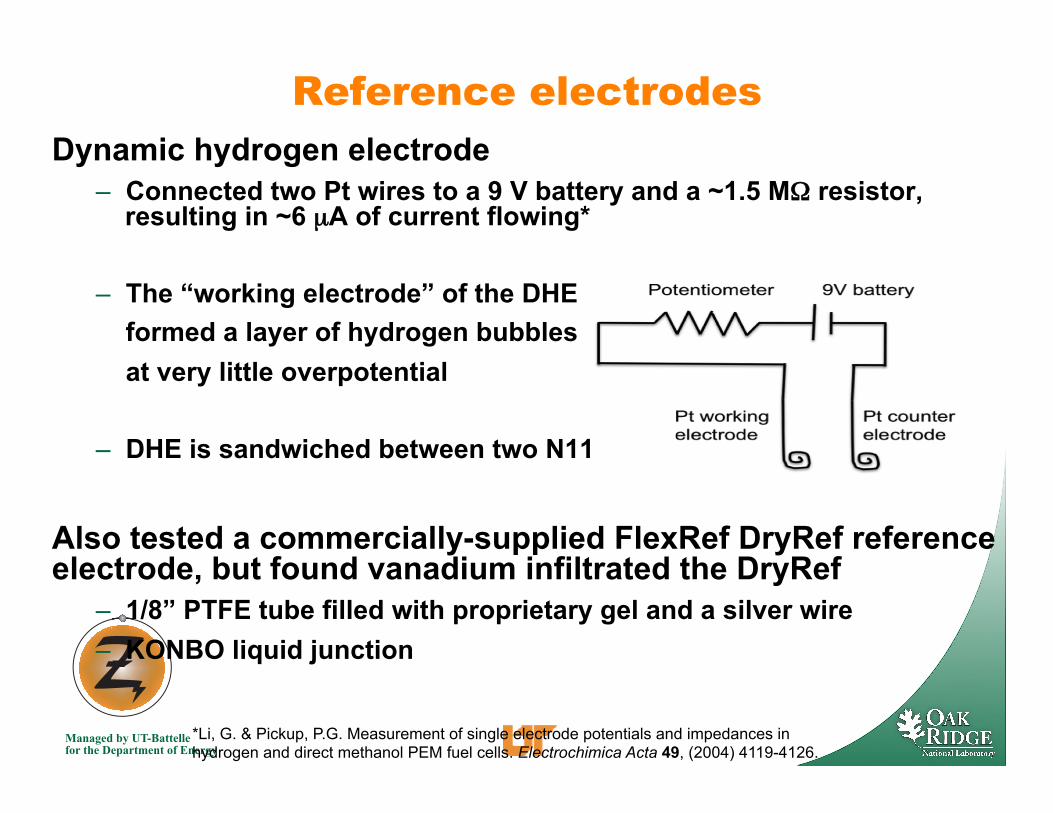
Reference electrodes Dynamic hydrogen electrode
– Connected two Pt wires to a 9 V battery and a ~1.5 MΩ resistor, resulting in ~6 µA of current flowing*
– The “working electrode” of the DHE formed a layer of hydrogen bubbles at very little overpotential
– DHE is sandwiched between two N117 membranes
Also tested a commercially-supplied FlexRef DryRef reference electrode, but found vanadium infiltrated the DryRef
– 1/8” PTFE tube filled with proprietary gel and a silver wire – KONBO liquid junction
*Li, G. & Pickup, P.G. Measurement of single electrode potentials and impedances in hydrogen and direct methanol PEM fuel cells. Electrochimica Acta 49, (2004) 4119-4126.
Managed by UT-Battelle for the Department of Energy
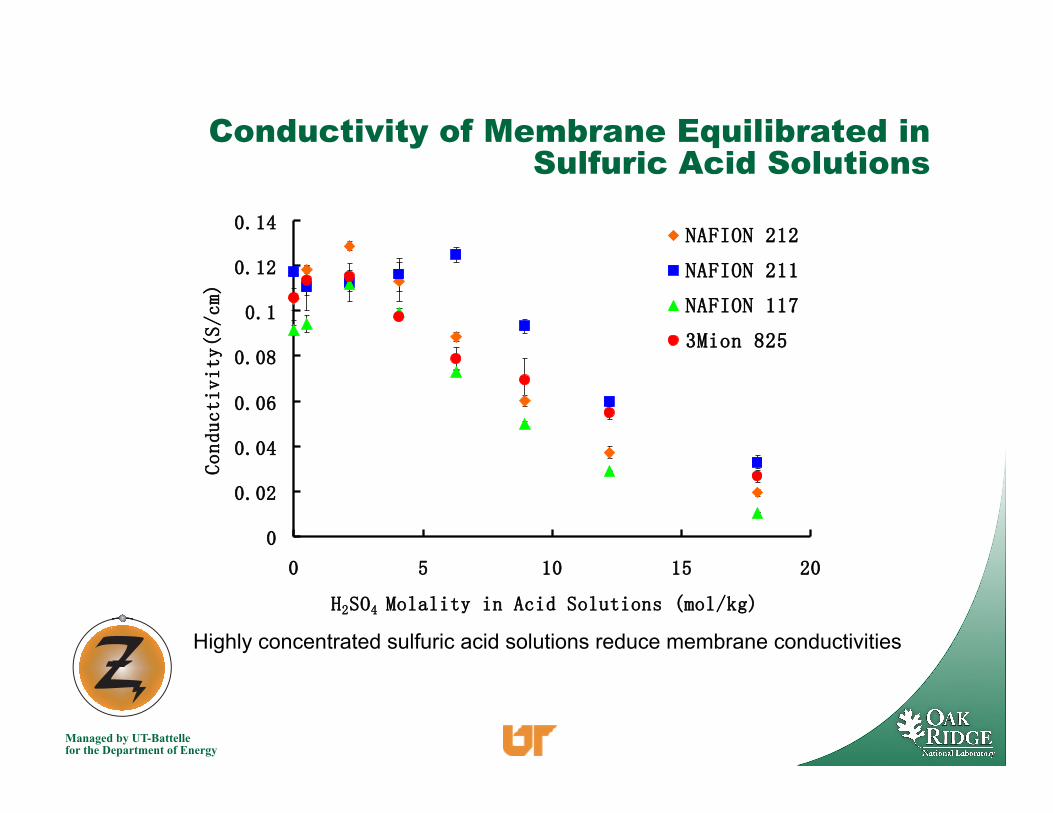
Conductivity of Membrane Equilibrated in Sulfuric Acid Solutions
0
0.02
0.04
0.06
0.08
0.1
0.12
0.14
0 5 10 15 20
H2SO4 Molality in Acid Solutions (mol/kg)
Conductivity(S/cm)
NAFION 212
NAFION 211
NAFION 117
3Mion 825
Highly concentrated sulfuric acid solutions reduce membrane conductivities
Managed by UT-Battelle for the Department of Energy
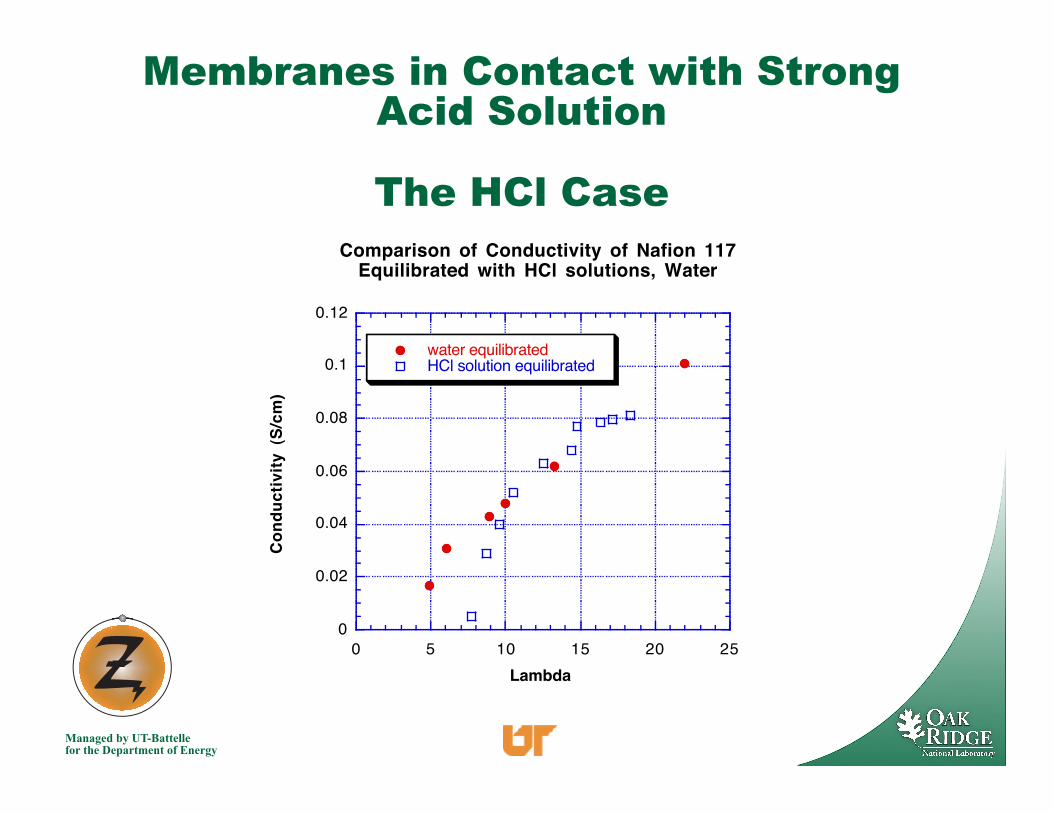
Membranes in Contact with Strong Acid Solution
The HCl Case
0
0.02
0.04
0.06
0.08
0.1
0.12
0 5 10 15 20 25
Comparison of Conductivity of Nafion 117Equilibrated with HCl solutions, Water
water equilibratedHCl solution equilibrated
Con
duct
ivity
(S/
cm)
Lambda !
Managed by UT-Battelle for the Department of Energy Field, G
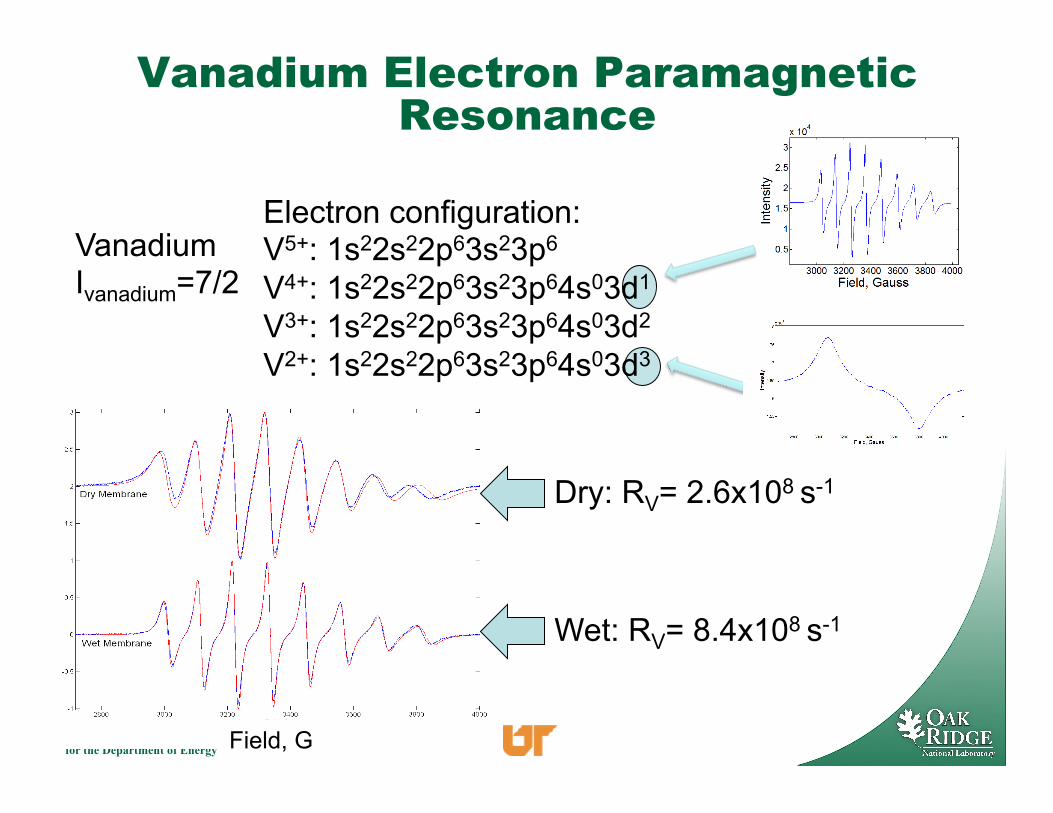
Vanadium Electron Paramagnetic Resonance
Electron configuration: V5+: 1s22s22p63s23p6
V4+: 1s22s22p63s23p64s03d1
V3+: 1s22s22p63s23p64s03d2
V2+: 1s22s22p63s23p64s03d3
Vanadium Ivanadium=7/2
Dry: RV= 2.6x10⁸ s-1
Wet: RV= 8.4x10⁸ s-1
Managed by UT-Battelle for the Department of Energy
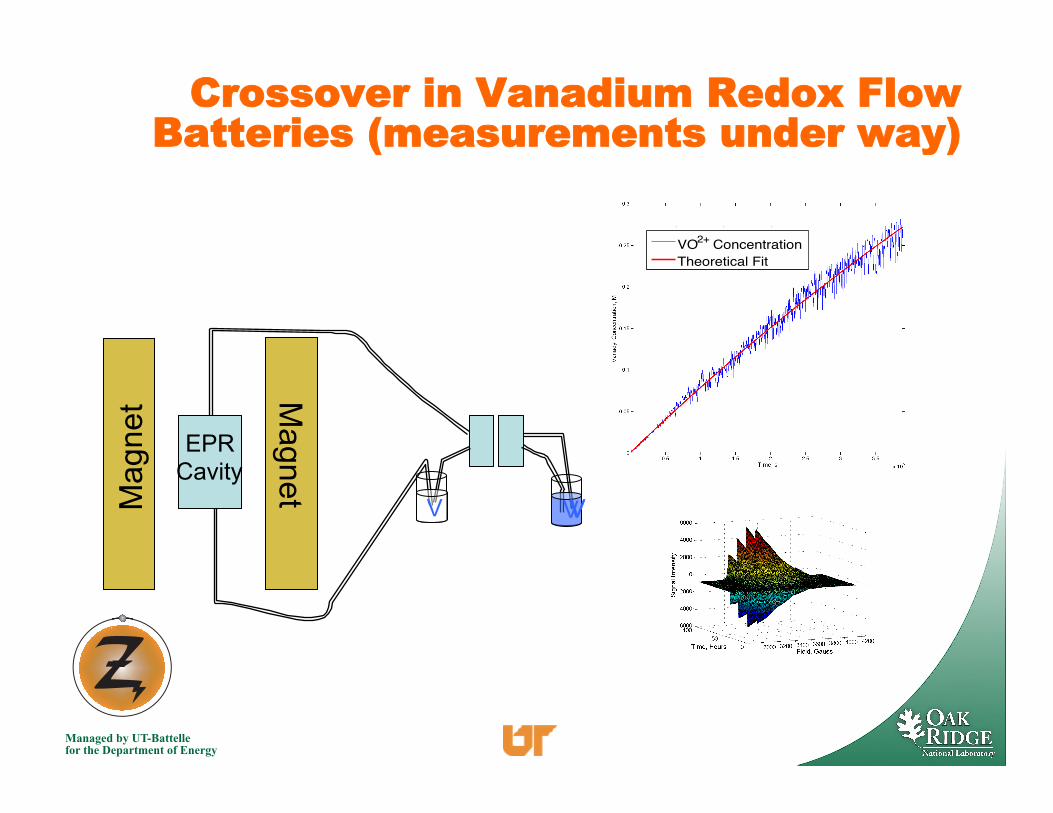
Crossover in Vanadium Redox Flow Batteries (measurements under way)
VV V V
EPR Cavity
Mag
net M
agnet 0 0.5 1 1.5 2 2.5 3 3.5 4x 10⁵
0.7
0.75
0.8
0.85
0.9
0.95
1
Time, s
Conc
entra
tion
VO2+
VO2+ ConcentrationTheoretical Fit
Managed by UT-Battelle for the Department of Energy
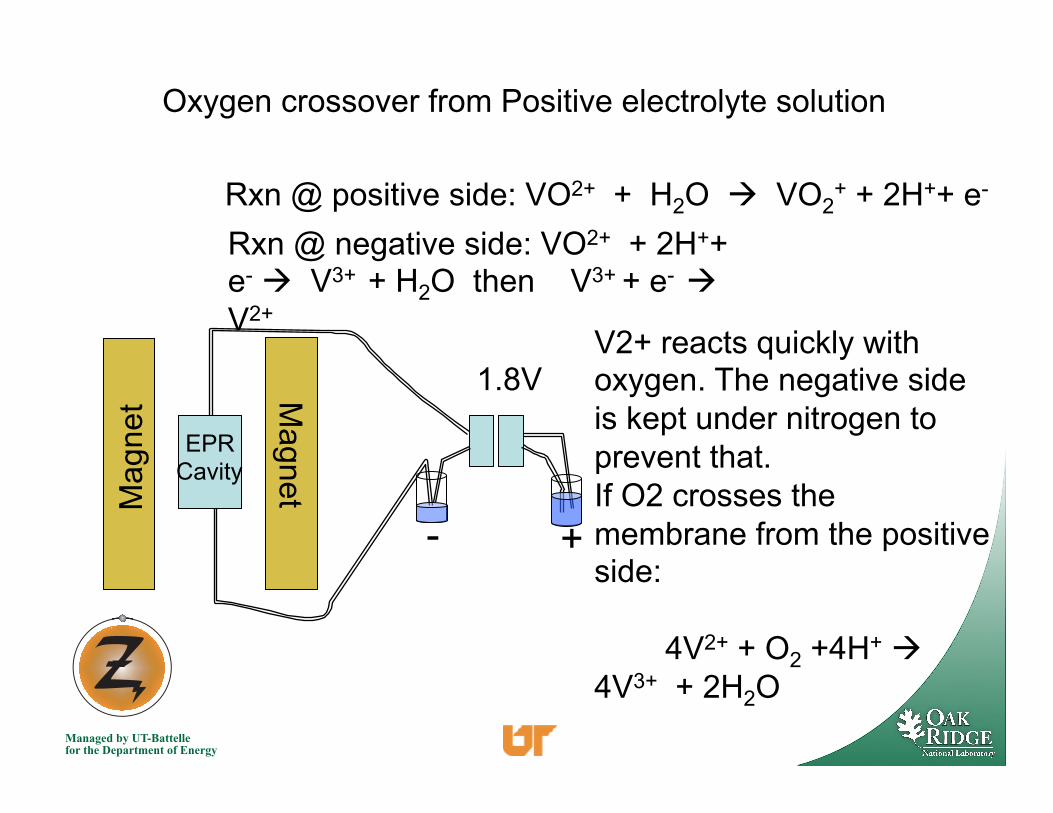
EPR Cavity
Magnet M
agne
t Oxygen crossover from Positive electrolyte solution
- +
1.8V
Rxn @ positive side: VO2+ + H2O à VO2+ + 2H++ e-
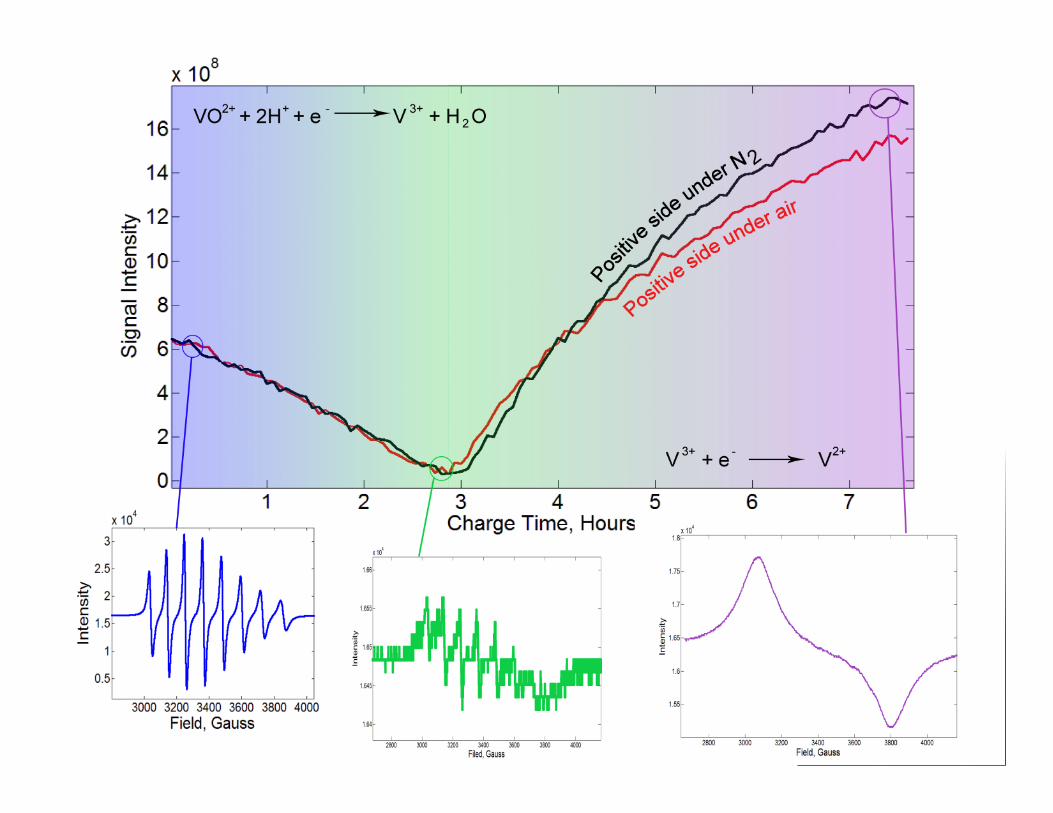
Rxn @ negative side: VO2+ + 2H++ e- à V3+ + H2O then V3+ + e- à V2+
V2+ reacts quickly with oxygen. The negative side is kept under nitrogen to prevent that. If O2 crosses the membrane from the positive side: 4V2+ + O2 +4H+ à 4V3+ + 2H2O
Managed by UT-Battelle for the Department of Energy
Managed by UT-Battelle for the Department of Energy
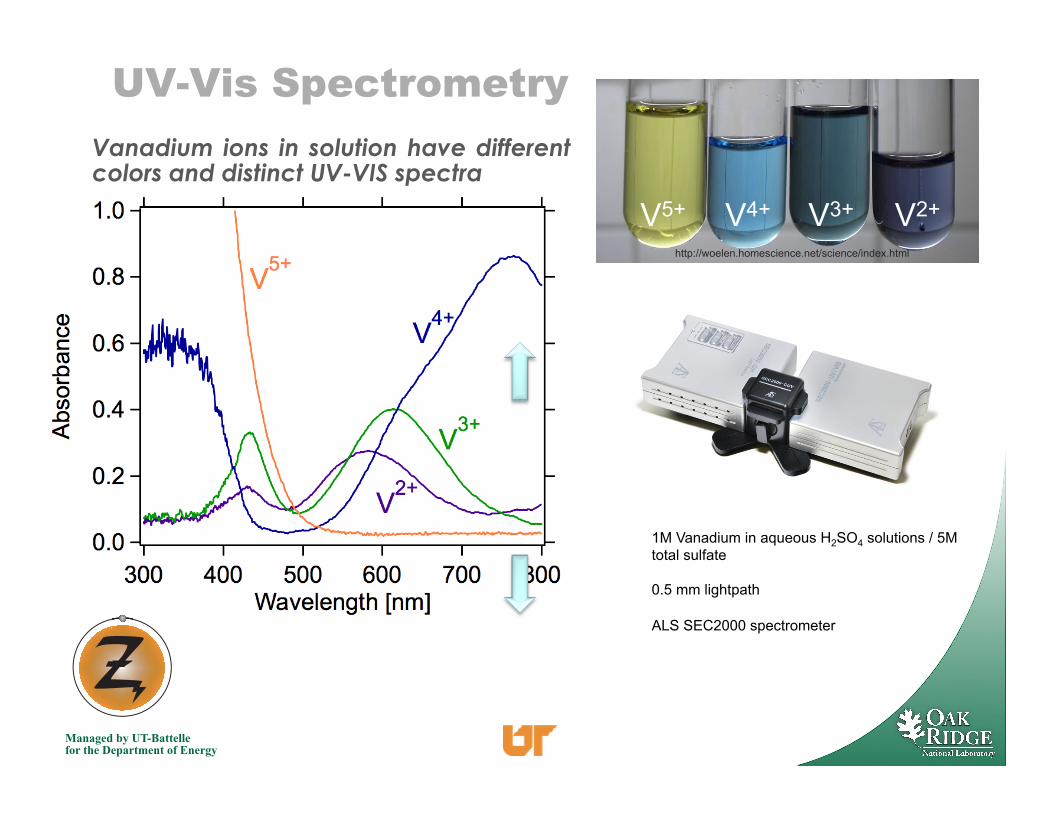
Vanadium ions in solution have different colors and distinct UV-VIS spectra
UV-Vis Spectrometry
http://woelen.homescience.net/science/index.html
V5+ V4+ V3+ V2+
1M Vanadium in aqueous H2SO4 solutions / 5M total sulfate 0.5 mm lightpath ALS SEC2000 spectrometer
Managed by UT-Battelle for the Department of Energy
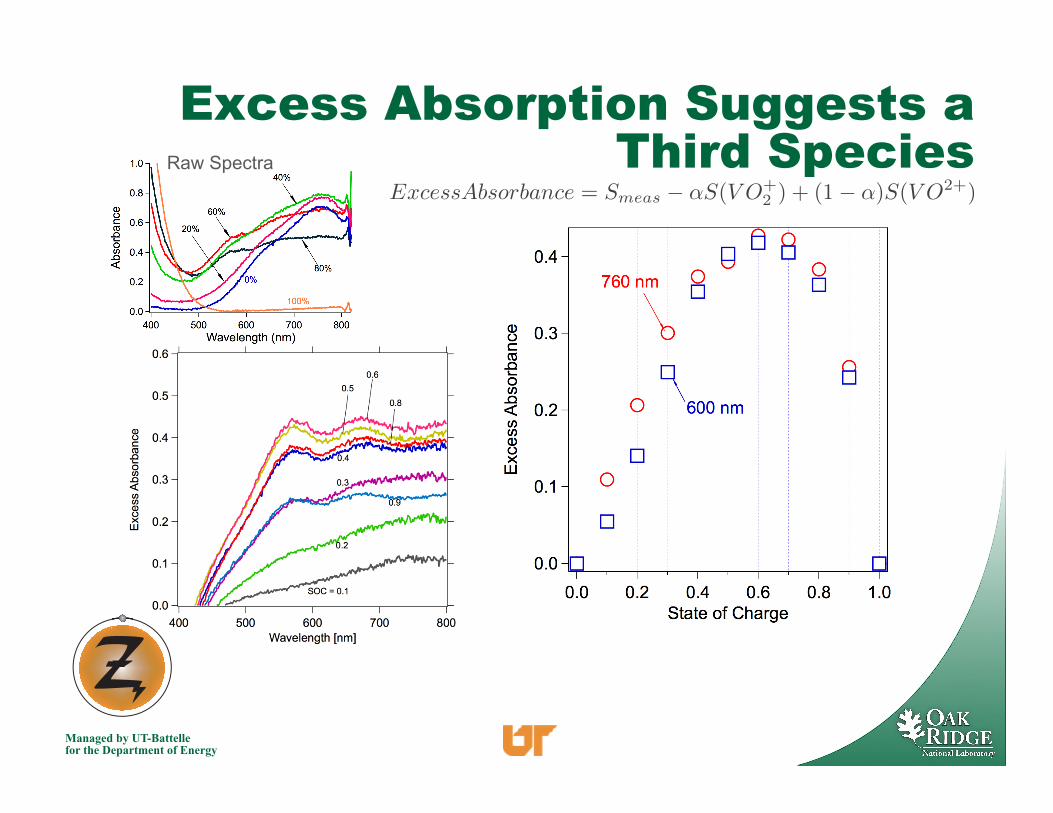
Excess Absorption Suggests a Third Species Raw Spectra
ExcessAbsorbance = Smeas − αS(V O+2 ) + (1− α)S(V O
2+)
Managed by UT-Battelle for the Department of Energy
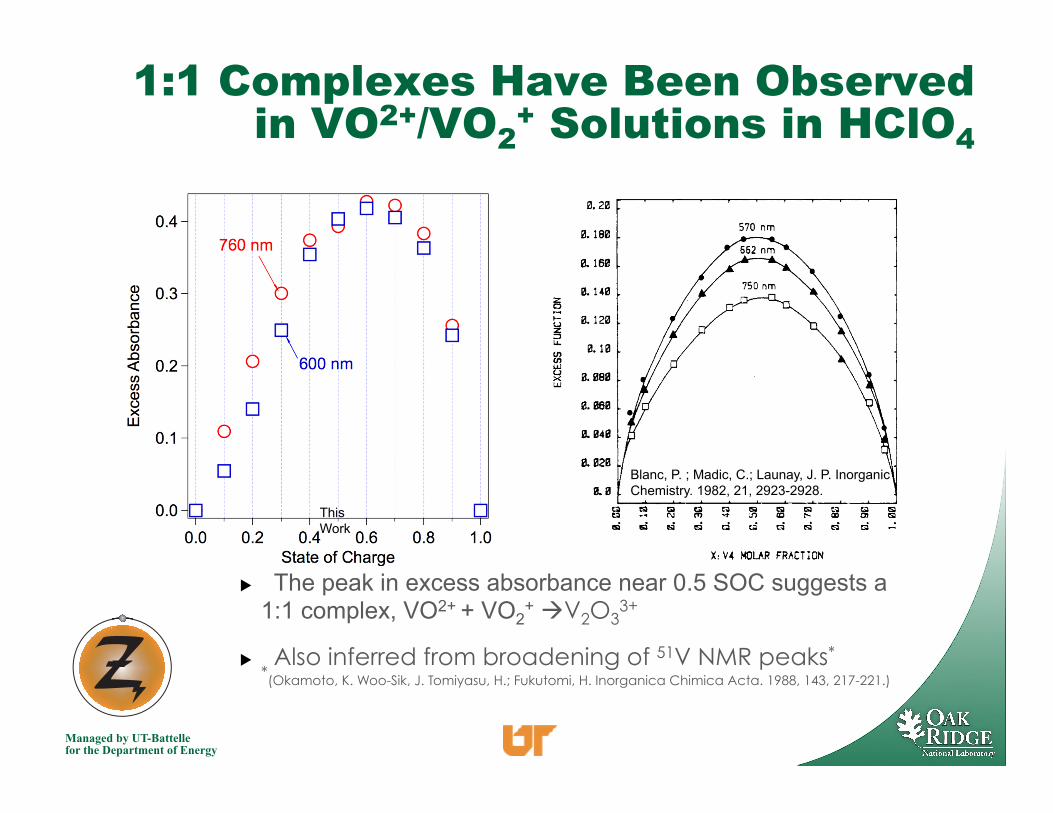
1:1 Complexes Have Been Observed in VO2+/VO2
+ Solutions in HClO4
Blanc, P. ; Madic, C.; Launay, J. P. Inorganic Chemistry. 1982, 21, 2923-2928.
This Work
u The peak in excess absorbance near 0.5 SOC suggests a 1:1 complex, VO2+ + VO2
+ àV2O33+
u Also inferred from broadening of 51V NMR peaks* *(Okamoto, K. Woo-Sik, J. Tomiyasu, H.; Fukutomi, H. Inorganica Chimica Acta. 1988, 143, 217-221.)
Managed by UT-Battelle for the Department of Energy
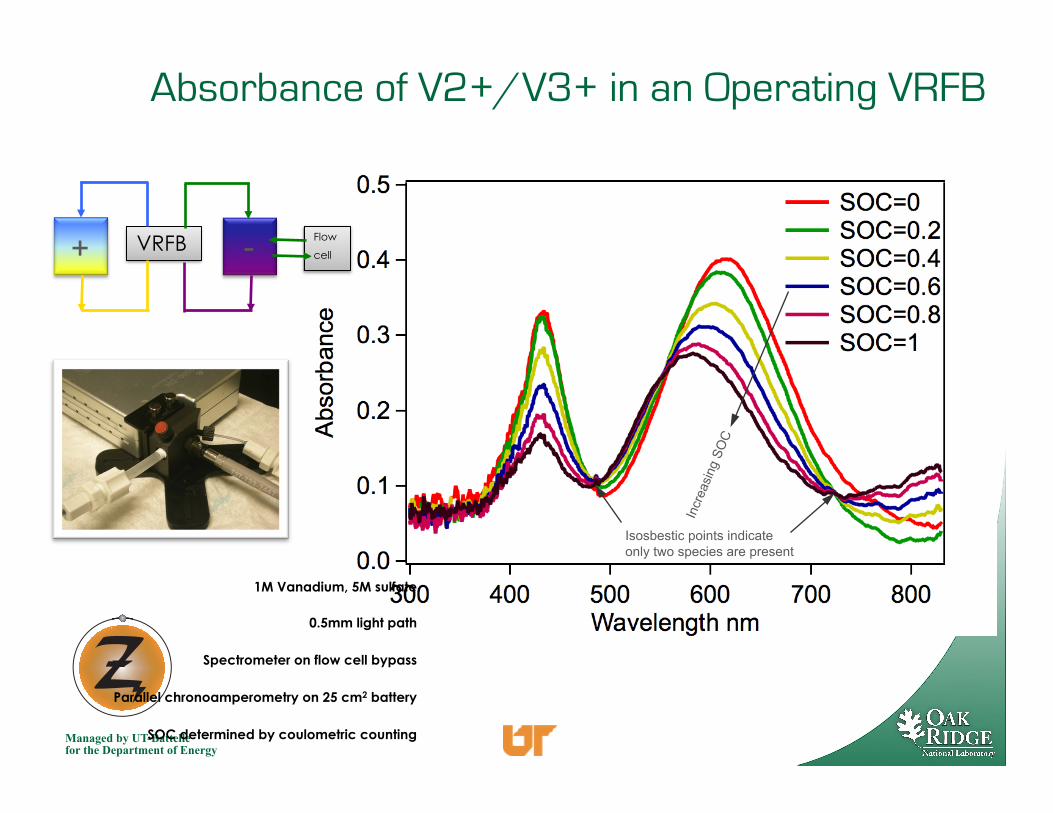
Absorbance of V2+/V3+ in an Operating VRFB
1M Vanadium, 5M sulfate
0.5mm light path
Spectrometer on flow cell bypass
Parallel chronoamperometry on 25 cm2 battery
SOC determined by coulometric counting
Isosbestic points indicate only two species are present
VRFB Flow
cell + -
Managed by UT-Battelle for the Department of Energy
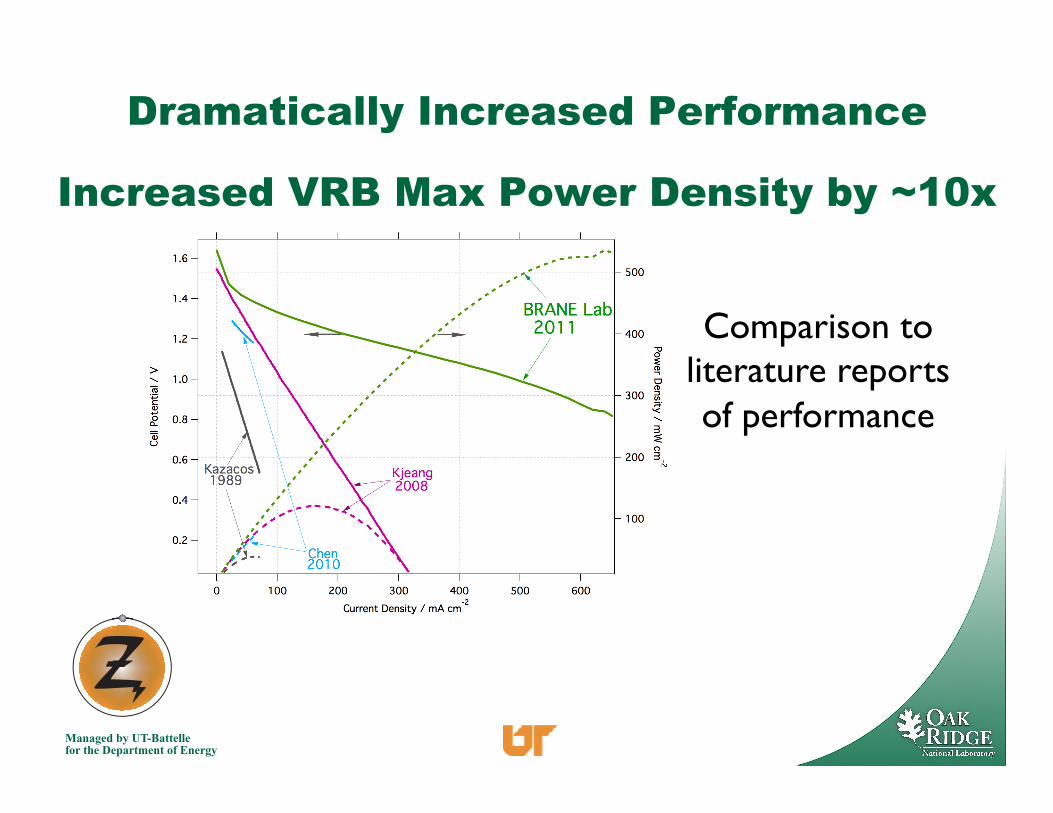
Dramatically Increased Performance
Increased VRB Max Power Density by ~10x
Comparison to literature reports of performance
Managed by UT-Battelle for the Department of Energy
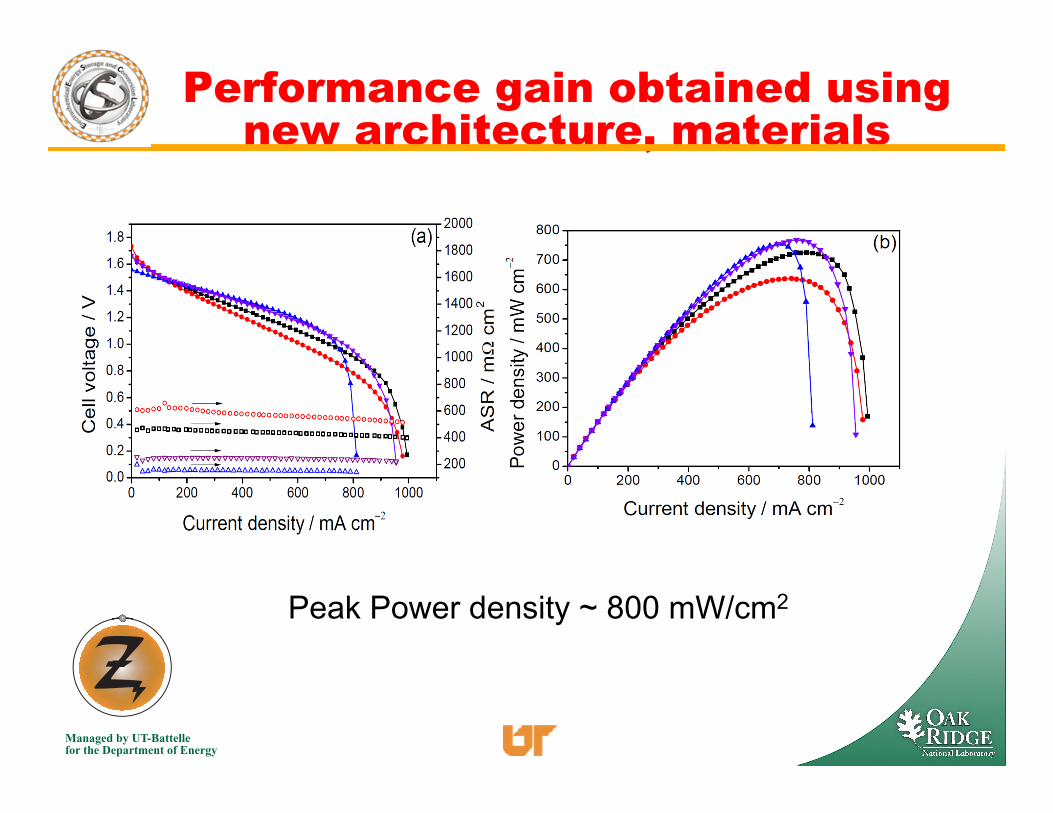
Performance gain obtained using new architecture, materials
Peak Power density ~ 800 mW/cm2
Managed by UT-Battelle for the Department of Energy
Core Issues
It will eventually come back to the membrane! Cost Modeling is tricky. As we increase power density/current density, membrane resistance will become limiting again
Recommended


![Amyloid-Beta Disrupts Calcium and Redox Homeostasis in ... · Amyloid-Beta Disrupts Calcium and Redox Homeostasis in Brain Endothelial Cells ... (SERCA) [39]. Although low ... Homeostasis](https://img.pdfslide.net/doc/110x75/5c76b20d09d3f2d3778bffa9/amyloid-beta-disrupts-calcium-and-redox-homeostasis-in-amyloid-beta-disrupts.jpg)