
Tuesday, Dec. 3rd: “A” DayWednesday, Dec. 4th: “B” Day (early out)
AgendaHomework Questions/collect (pg. 398: 1-3, 6-9)Sec. 11.3 quiz: “Energy of State Changes”Section 11.4: “Phase Equilibrium”
Phase, equilibrium, vapor pressure, phase diagram, triple point, critical point
Homework:Pg 405: #1-5Concept Review: “Phase Equilibrium”“What Would Life be Like?” paper
Homeworkpg. 398: #1-3, 6-9
Questions?
Problems?
Section 11.3 Quiz“Energy of State Changes”
You may use your notes, your book, and your lab partner to complete the quiz…
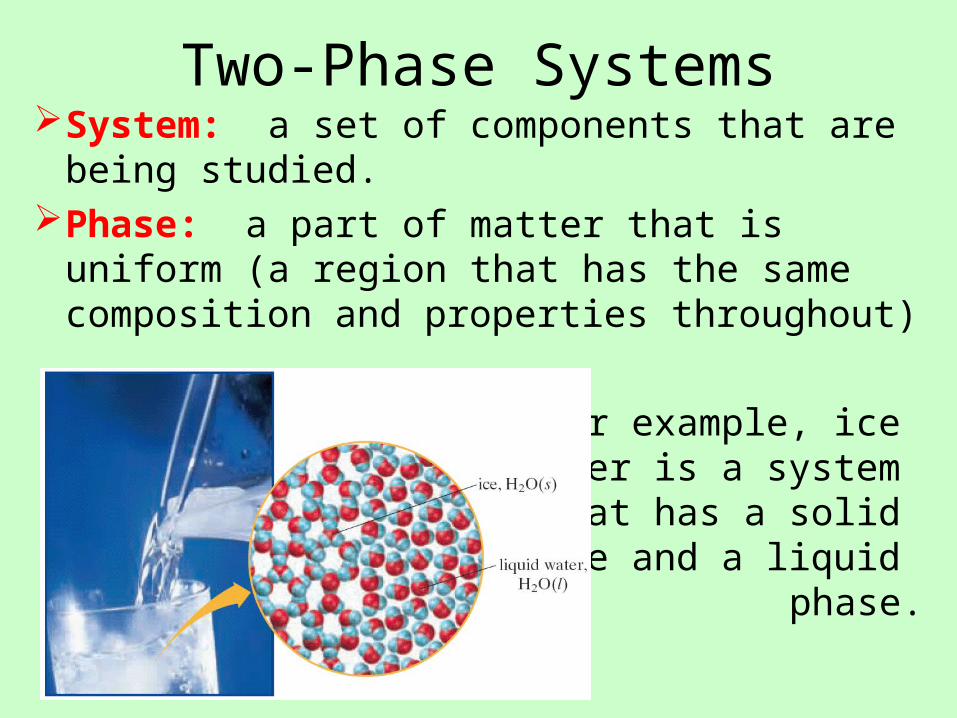
Two-Phase SystemsSystem: a set of components that are being studied.Phase: a part of matter that is uniform (a region that
has the same composition and properties throughout)
For example, ice water is a system
that has a solid phase and a liquid
phase.
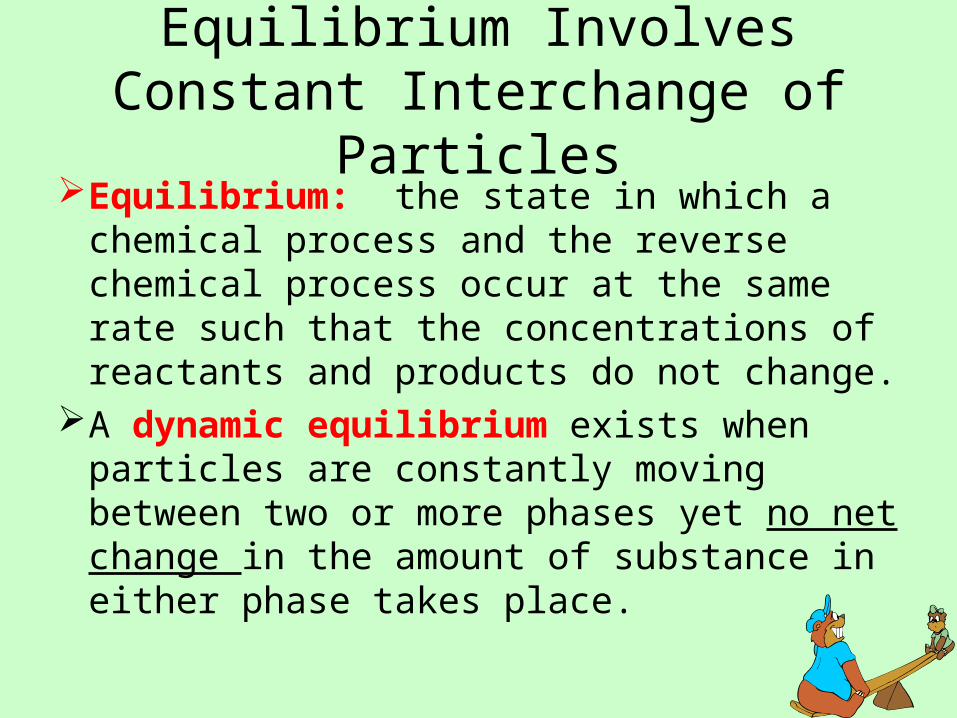
Equilibrium Involves Constant Interchange of Particles
Equilibrium: the state in which a chemical process and the reverse chemical process occur at the same rate such that the concentrations of reactants and products do not change.
A dynamic equilibrium exists when particles are constantly moving between two or more phases yet no net change in the amount of substance in either phase takes place.
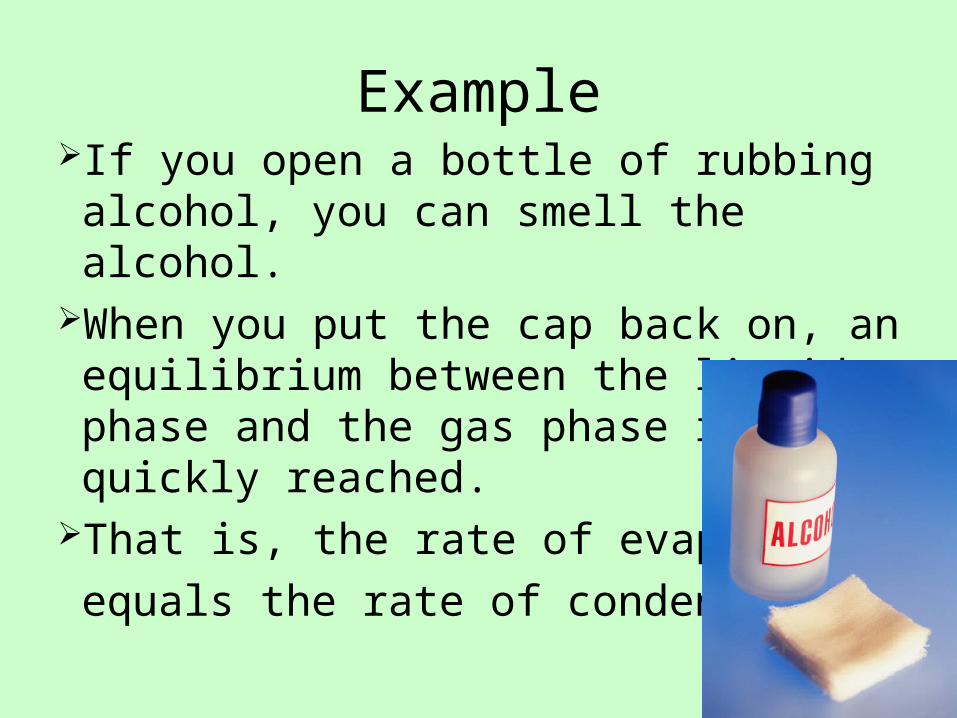
ExampleIf you open a bottle of rubbing alcohol, you can
smell the alcohol.When you put the cap back on, an equilibrium
between the liquid phase and the gas phase is quickly reached.
That is, the rate of evaporation equals the rate of condensation.
Vapor Pressure Increases with TemperatureFor an enclosed gas and liquid in equilibrium,like
the rubbing alcohol, the gas particles above the liquid exert pressure when they strike the walls of the container.
Vapor pressure: the partial pressure exerted by a vapor that is in equilibrium with its liquid state at a given temperature.
The boiling point is the temperature at which the vapor pressure equals the external pressure.
Vapor Pressure Increases with Temperature
As you increase the temperature of a closed system, more liquid particles escape into the gas phase.
Thus, as you increase temperature, the vapor pressure of the substance also increases.
When you increase the temperature of a system to the point at which the vapor pressure of a substance is equal to standard atmospheric pressure have reached the substance’s normal boiling point.
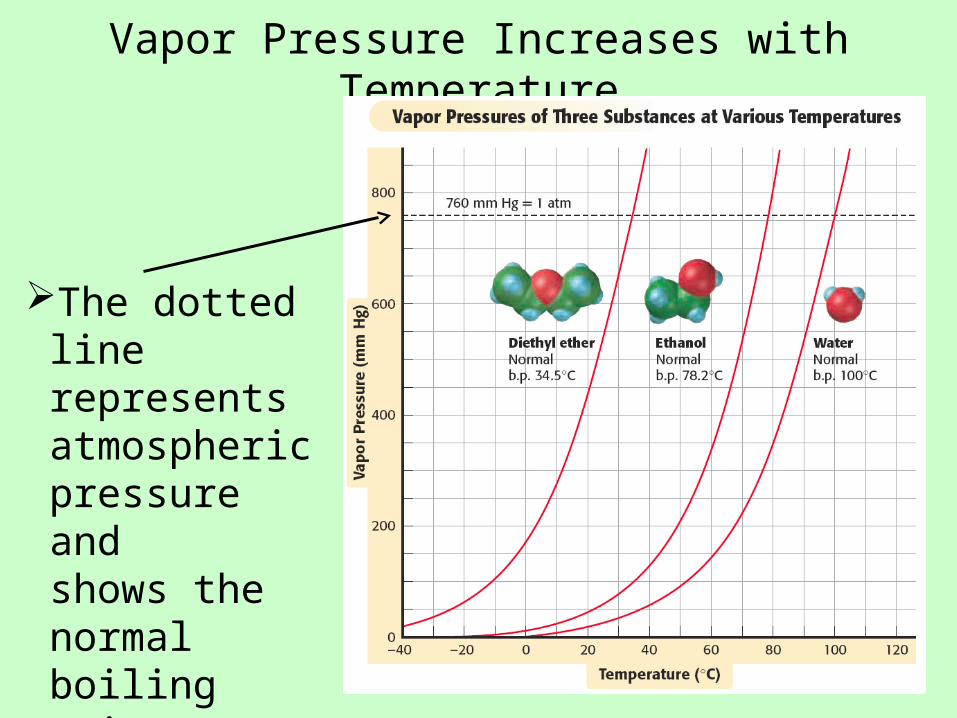
Vapor Pressure Increases with Temperature
The dotted line represents atmospheric pressure and shows the normal boiling point.
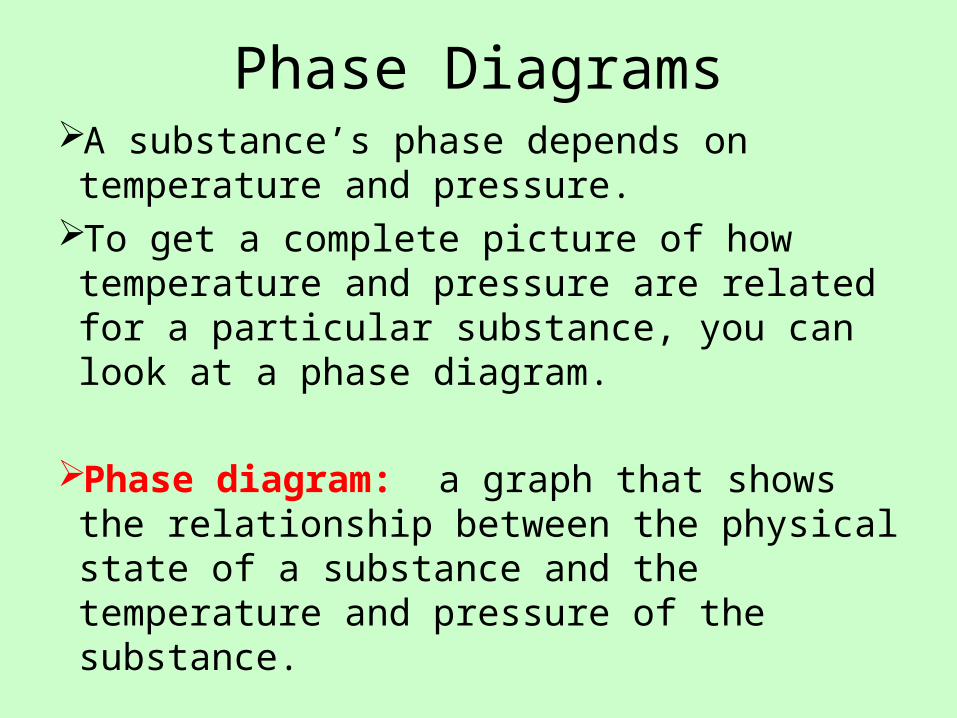
Phase DiagramsA substance’s phase depends on temperature
and pressure. To get a complete picture of how temperature
and pressure are related for a particular substance, you can look at a phase diagram.
Phase diagram: a graph that shows the relationship between the physical state of a substance and the temperature and pressure of the substance.
Phase DiagramsA phase diagram has three lines:
One line shows the liquid-gas equilibrium.Another line shows the liquid-solid equilibriumA third line shows the solid-gas equilibrium.
These three lines meet at the triple point.Triple point: the temperature and pressure
conditions at which the solid, liquid and gaseous phases of a substance coexist at equilibrium.
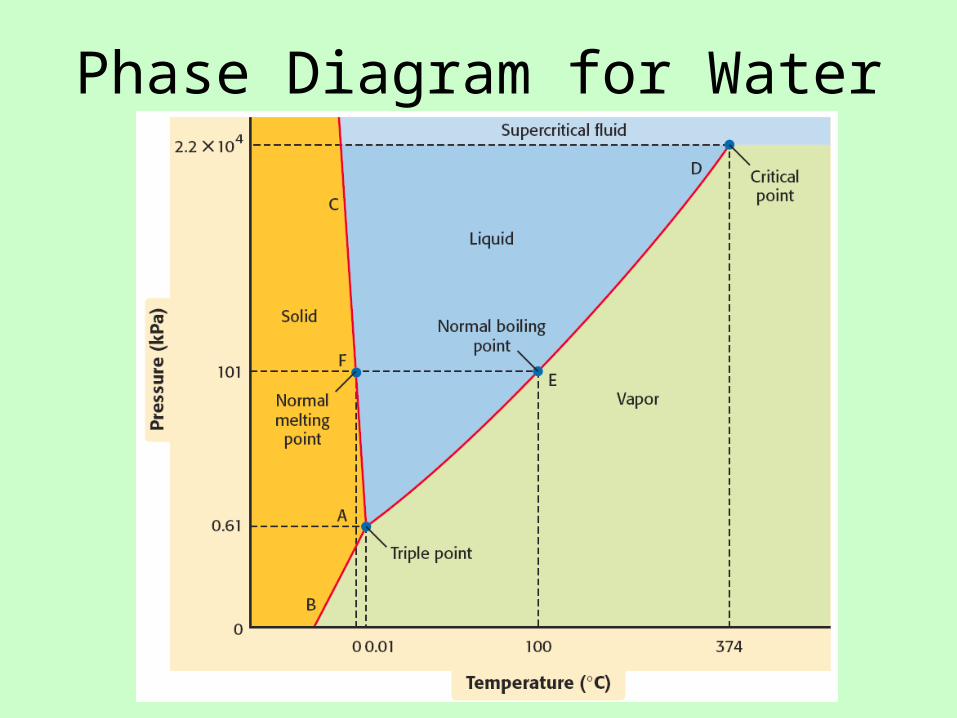
Phase Diagram for Water
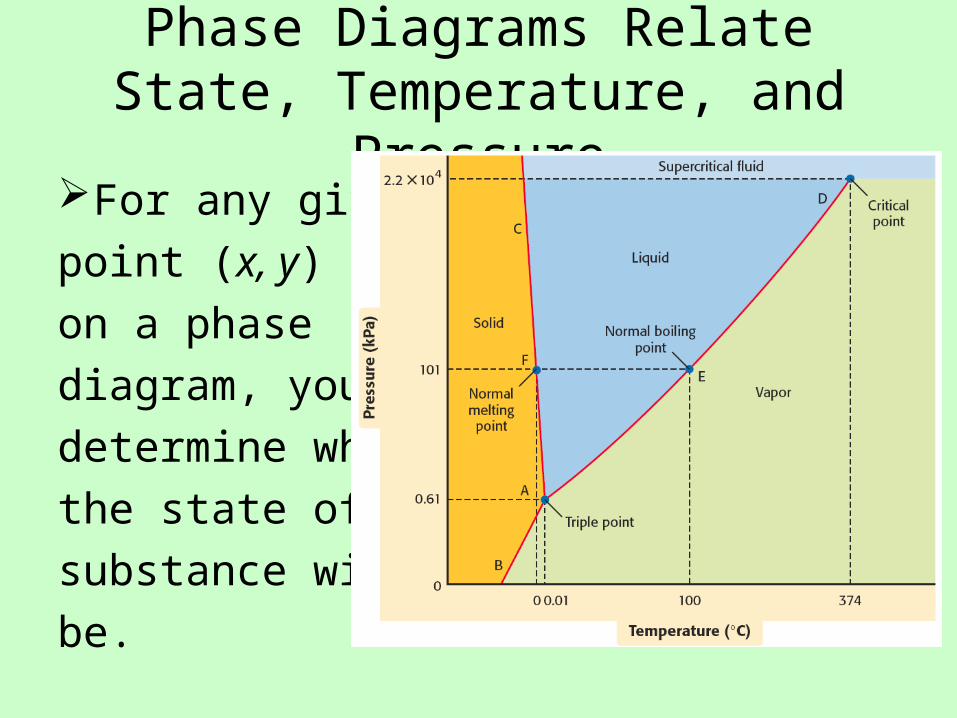
Phase Diagrams Relate State, Temperature, and Pressure
For any given point (x, y) on a phase diagram, you can determine whatthe state of a substance willbe.
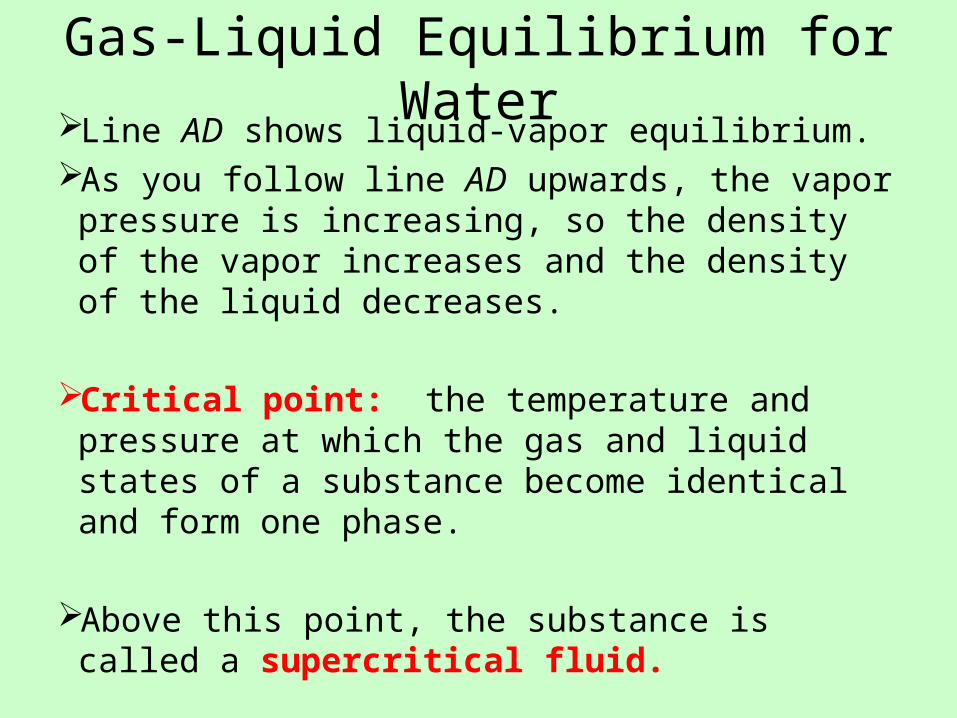
Gas-Liquid Equilibrium for WaterLine AD shows liquid-vapor equilibrium.As you follow line AD upwards, the vapor
pressure is increasing, so the density of the vapor increases and the density of the liquid decreases.
Critical point: the temperature and pressure at which the gas and liquid states of a substance become identical and form one phase.
Above this point, the substance is called a supercritical fluid.
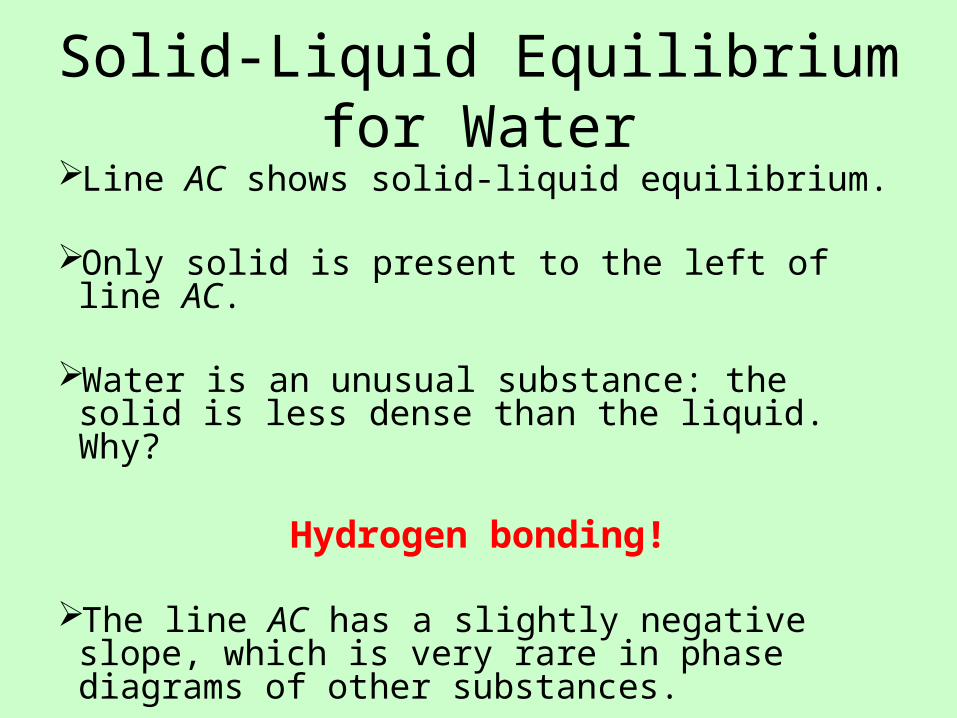
Solid-Liquid Equilibrium for WaterLine AC shows solid-liquid equilibrium.
Only solid is present to the left of line AC.
Water is an unusual substance: the solid is less dense than the liquid. Why?
Hydrogen bonding!
The line AC has a slightly negative slope, which is very rare in phase diagrams of other substances.
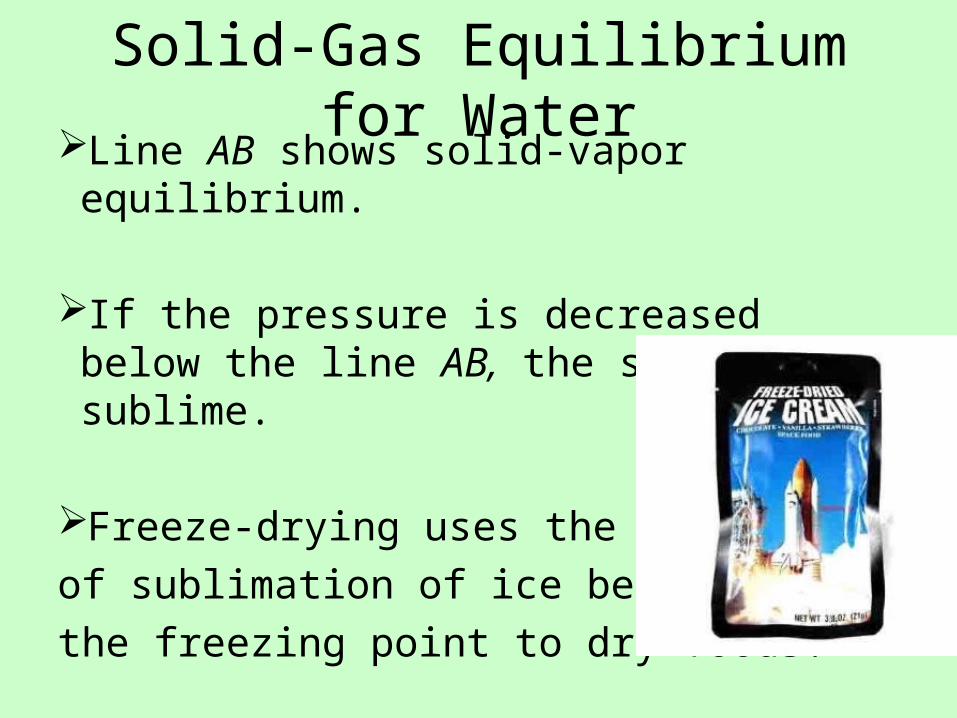
Solid-Gas Equilibrium for WaterLine AB shows solid-vapor equilibrium.
If the pressure is decreased below the line AB, the solid will sublime.
Freeze-drying uses the process of sublimation of ice below the freezing point to dry foods.
Phase Diagrams Are Unique to a Particular Substance
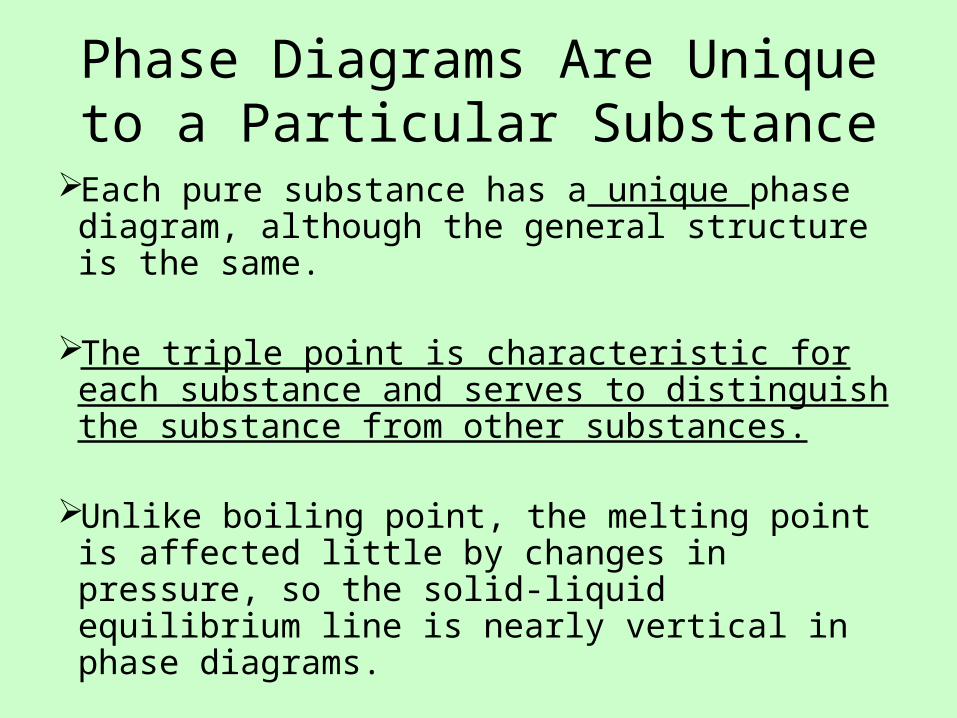
Each pure substance has a unique phase diagram, although the general structure is the same.
The triple point is characteristic for each substance and serves to distinguish the substance from other substances.
Unlike boiling point, the melting point is affected little by changes in pressure, so the solid-liquid equilibrium line is nearly vertical in phase diagrams.
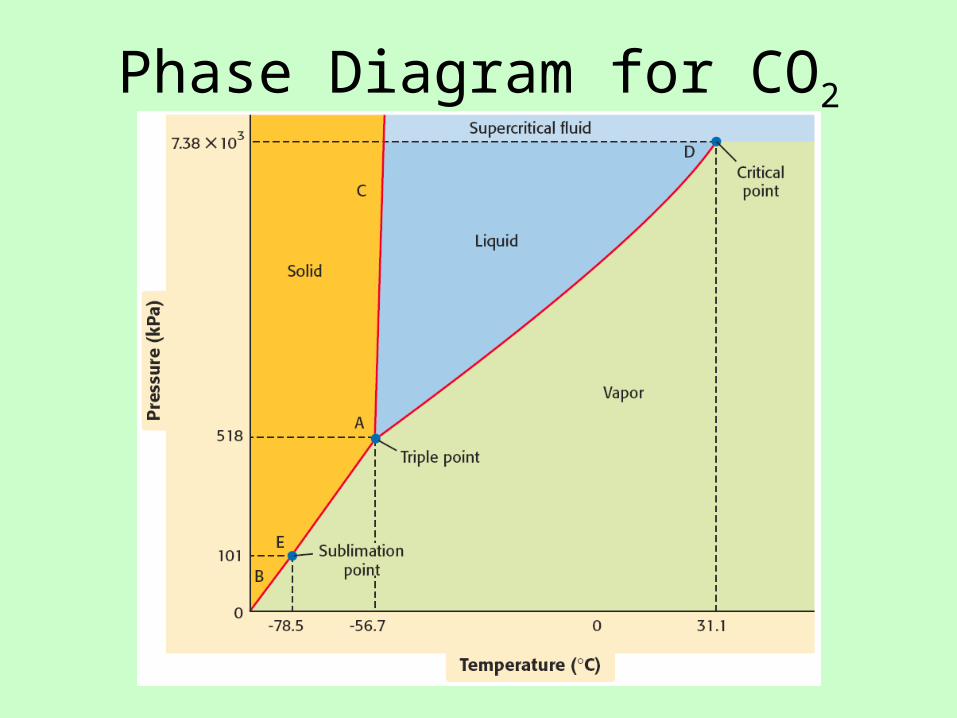
Phase Diagram for CO2
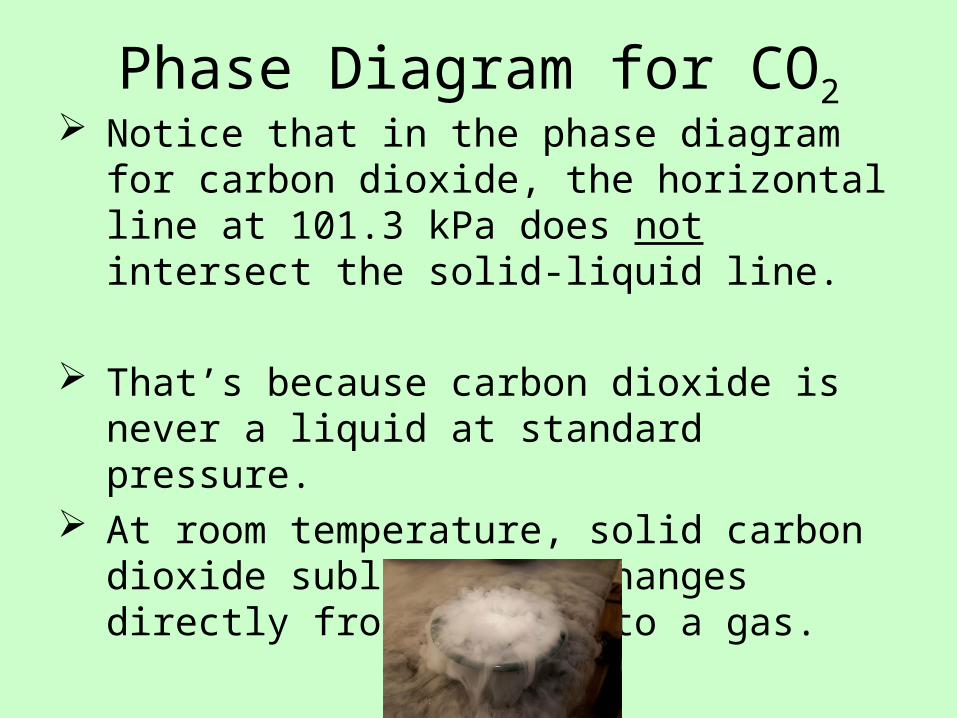
Phase Diagram for CO2 Notice that in the phase diagram for carbon
dioxide, the horizontal line at 101.3 kPa does not intersect the solid-liquid line.
That’s because carbon dioxide is never a liquid at standard pressure.
At room temperature, solid carbon dioxide sublimes, or changes directly from a solid to a gas.
HomeworkSection 11.4 Review, Pg. 405: #1-5Concept Review: “Phase Equilibrium”“What Would Life Be Like?” Paper Due Mon/Tues
*Lab next time*
Chapter 11 Test/Concept Review Due: Friday, 12-13: “A” Day
Monday, 12-16: “B” Day
Recommended