ULTRASONIC PHASED ARRAY SIMULATIONS OF WELDED COMPONENTS AT NASA
D. J. Roth1, R. P. Tokars1, R. E. Martin2, R. W. Rauser,3 J.C. Aldrin4 1NASA Glenn Research Center, Cleveland, OH 44135 2Cleveland State University, Cleveland, OH 44115 3University of Toledo, Toledo, OH 2368143606 4Computational Tools, Inc., Gurnee, IL 60031
ABSTRACT. Comprehensive and accurate inspections of welded components have become of increasing importance as NASA develops new hardware such as Ares rocket segments for future exploration missions. Simulation and modeling will play an increasing role in the future for nondestructive evaluation in order to better understand the physics of the inspection process, to prove or disprove the feasibility for an inspection method or inspection scenario, for inspection optimization, for better understanding of experimental results, and for assessment of probability of detection. This study presents simulation and experimental results for an ultrasonic phased array inspection of a critical welded structure important for NASA future exploration vehicles. Keywords: nondestructive evaluation, computational simulation, ultrasonics, weld, modeling, phased array PACS: 81.70.Ex
INTRODUCTION
As NASA’s Constellation Program proceeds to develop new crew and launch vehicles, many inspection and nondestructive evaluation challenges will be encountered. Ultrasonic testing will play a role in the inspections of space flight hardware such as beams, welds, lugs, and other critical structures. NASA Glenn Research Center is involved in building the upper stage simulator (USS) for the Ares 1-X test rocket scheduled to launch in 2009. The upper stage is composed of multiple USS segments that will be stacked and attached to each other. The USS segments have critical welds that attach the skin half-cylinders, flange portions, and the skin to the flange. In this study, the skin-to-flange weld is of concern.
The skin-to-flange weld is required to pass a hand-held ultrasonic A-scan inspection for certification. Here, the modeling and use of phased array ultrasonics to perform such an inspection is addressed as an alternative to A-scan inspection. Phased array inspection is gaining wide acceptance and has many advantages over conventional A-scan inspection including the ability to perform scanning with no mechanical movement, the ability to perform angular (sectorial) scans and dynamic focusing, greater ability to inspect complex shapes and difficult-to-inspect areas, and two-dimensional visualization of results. Simulation and modeling will play an increasing role in the future for nondestructive evaluation in order to better understand the physics of the inspection process, to prove or disprove the feasibility for an inspection method or inspection scenario, for inspection optimization, for better understanding of experimental results, and for assessment of probability of detection. [1].
https://ntrs.nasa.gov/search.jsp?R=20120012877 2018-04-23T09:17:13+00:00Z
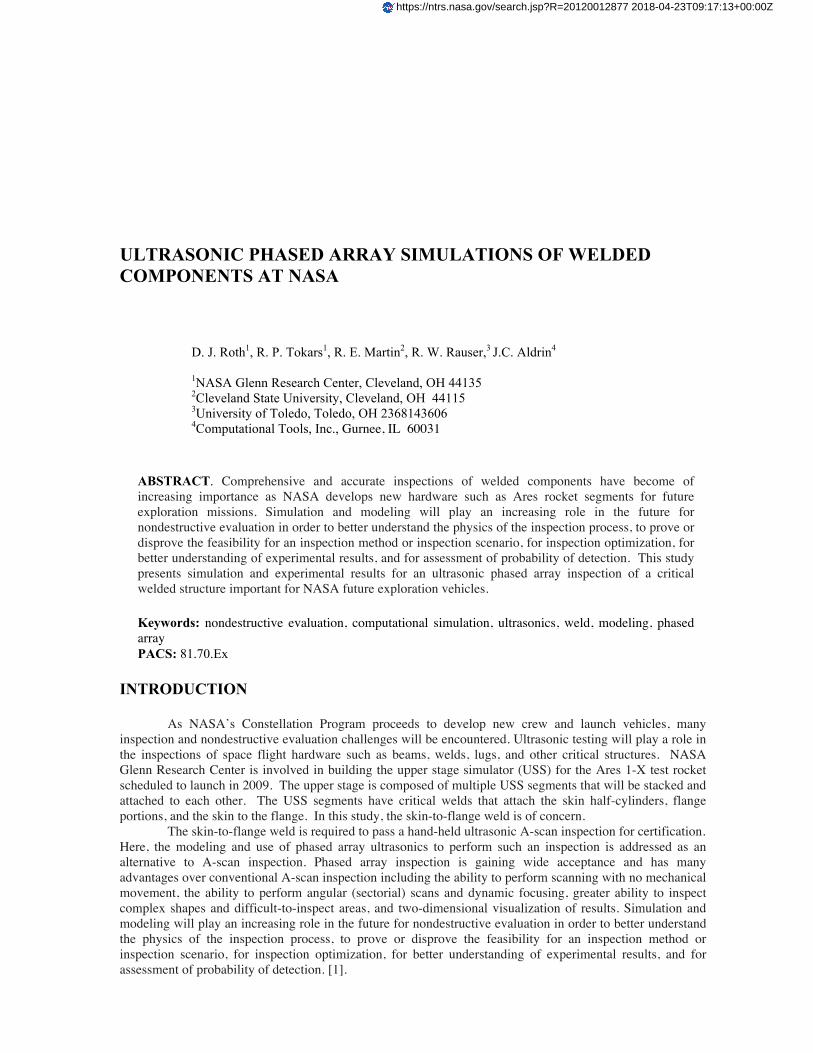
TEST SAMPLE A skin-to-flange test sample of pressure vessel steel variety was fabricated. The skin and flange portions were approximately 12 mm and 25 mm thick, respectively. The skin portion was double-beveled at one end, 45o each side, and butted to the thicker flange. Flux core arc welding (FCAW) was performed to attach the skin to the flange - the interior and exterior areas flanking the bevels of the skin were filled with weld metal of a similar composition to that of the base steel. The external weld was shaved to make the transition from skin to flange flat. Figure 1 shows a photograph of the interior of an Ares USS segment and a solid model of the test part. A side-drilled hole (SDH) approximately 40 mm in length and 1.61 mm in diameter was located at one end of the part, simulating lack of fusion in the weld.
___12 mm (a) (b)
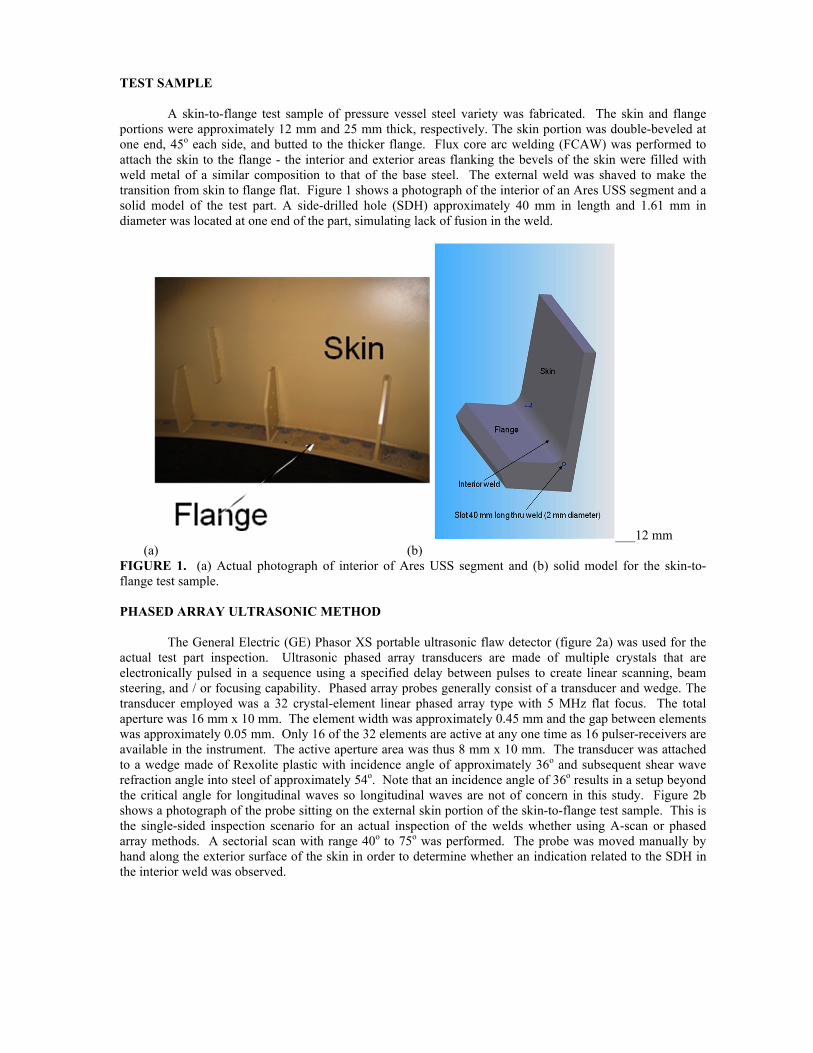
FIGURE 1. (a) Actual photograph of interior of Ares USS segment and (b) solid model for the skin-to-flange test sample. PHASED ARRAY ULTRASONIC METHOD The General Electric (GE) Phasor XS portable ultrasonic flaw detector (figure 2a) was used for the actual test part inspection. Ultrasonic phased array transducers are made of multiple crystals that are electronically pulsed in a sequence using a specified delay between pulses to create linear scanning, beam steering, and / or focusing capability. Phased array probes generally consist of a transducer and wedge. The transducer employed was a 32 crystal-element linear phased array type with 5 MHz flat focus. The total aperture was 16 mm x 10 mm. The element width was approximately 0.45 mm and the gap between elements was approximately 0.05 mm. Only 16 of the 32 elements are active at any one time as 16 pulser-receivers are available in the instrument. The active aperture area was thus 8 mm x 10 mm. The transducer was attached to a wedge made of Rexolite plastic with incidence angle of approximately 36o and subsequent shear wave refraction angle into steel of approximately 54o. Note that an incidence angle of 36o results in a setup beyond the critical angle for longitudinal waves so longitudinal waves are not of concern in this study. Figure 2b shows a photograph of the probe sitting on the external skin portion of the skin-to-flange test sample. This is the single-sided inspection scenario for an actual inspection of the welds whether using A-scan or phased array methods. A sectorial scan with range 40o to 75o was performed. The probe was moved manually by hand along the exterior surface of the skin in order to determine whether an indication related to the SDH in the interior weld was observed.
(a) (b) FIGURE 2. (a) The General Electric (GE) Phasor XS portable ultrasonic flaw detector and (b) Phased array probe positioned on the external side of the skin of the skin-to-flange test part. ADDITIONAL ULTRASONIC TESTING 5 MHz shear wave ultrasonic velocity and attenuation coefficient measurements were performed on the test sample skin (base steel) and also on a flat sample of the weld steel using a precision contact ultrasonic method [2]. The shear wave velocity values for the base steel and weld steel were measured to be 0.325 cm/µsec and 0.328 cm/µsec, respectively, the difference of which is close to the measurement uncertainty for the velocity measurement method. The velocity value for the base steel was used as a setup parameter in the Phasor, and the velocity values for both base and weld steels were used in the ultrasonic model as described below. ULTRASONIC MODELING
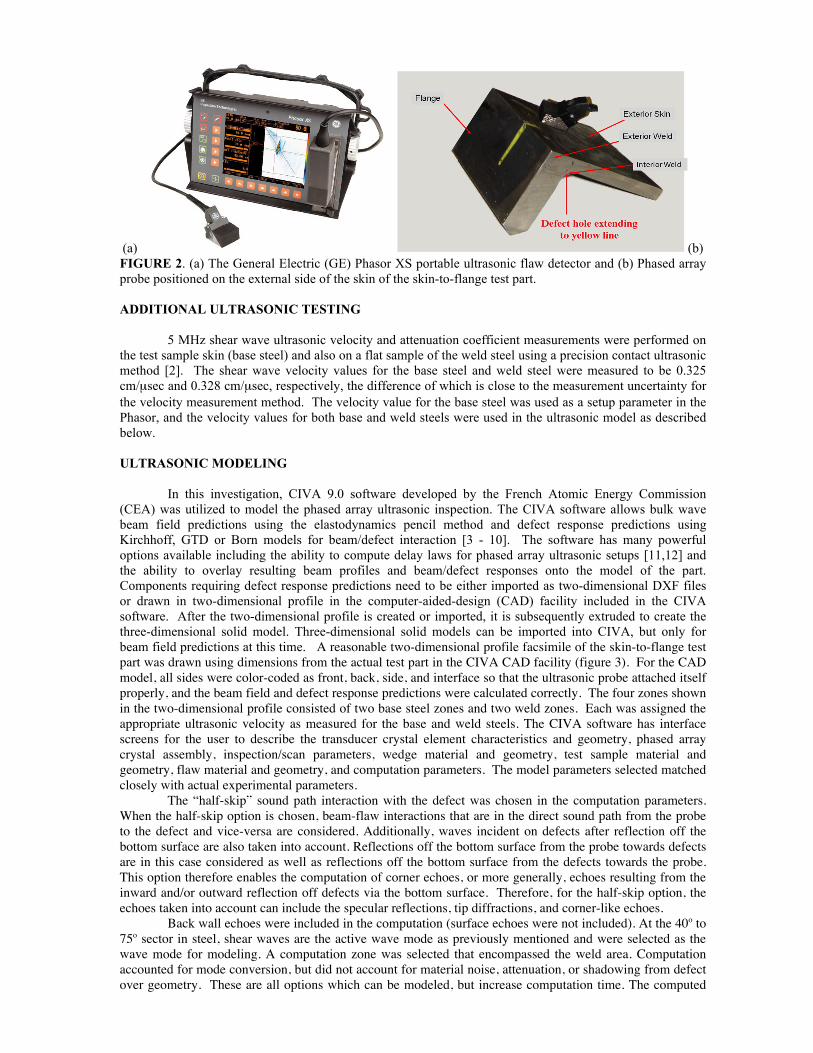
In this investigation, CIVA 9.0 software developed by the French Atomic Energy Commission (CEA) was utilized to model the phased array ultrasonic inspection. The CIVA software allows bulk wave beam field predictions using the elastodynamics pencil method and defect response predictions using Kirchhoff, GTD or Born models for beam/defect interaction [3 - 10]. The software has many powerful options available including the ability to compute delay laws for phased array ultrasonic setups [11,12] and the ability to overlay resulting beam profiles and beam/defect responses onto the model of the part. Components requiring defect response predictions need to be either imported as two-dimensional DXF files or drawn in two-dimensional profile in the computer-aided-design (CAD) facility included in the CIVA software. After the two-dimensional profile is created or imported, it is subsequently extruded to create the three-dimensional solid model. Three-dimensional solid models can be imported into CIVA, but only for beam field predictions at this time. A reasonable two-dimensional profile facsimile of the skin-to-flange test part was drawn using dimensions from the actual test part in the CIVA CAD facility (figure 3). For the CAD model, all sides were color-coded as front, back, side, and interface so that the ultrasonic probe attached itself properly, and the beam field and defect response predictions were calculated correctly. The four zones shown in the two-dimensional profile consisted of two base steel zones and two weld zones. Each was assigned the appropriate ultrasonic velocity as measured for the base and weld steels. The CIVA software has interface screens for the user to describe the transducer crystal element characteristics and geometry, phased array crystal assembly, inspection/scan parameters, wedge material and geometry, test sample material and geometry, flaw material and geometry, and computation parameters. The model parameters selected matched closely with actual experimental parameters.
The “half-skip” sound path interaction with the defect was chosen in the computation parameters. When the half-skip option is chosen, beam-flaw interactions that are in the direct sound path from the probe to the defect and vice-versa are considered. Additionally, waves incident on defects after reflection off the bottom surface are also taken into account. Reflections off the bottom surface from the probe towards defects are in this case considered as well as reflections off the bottom surface from the defects towards the probe. This option therefore enables the computation of corner echoes, or more generally, echoes resulting from the inward and/or outward reflection off defects via the bottom surface. Therefore, for the half-skip option, the echoes taken into account can include the specular reflections, tip diffractions, and corner-like echoes.
Back wall echoes were included in the computation (surface echoes were not included). At the 40o to 75o sector in steel, shear waves are the active wave mode as previously mentioned and were selected as the wave mode for modeling. A computation zone was selected that encompassed the weld area. Computation accounted for mode conversion, but did not account for material noise, attenuation, or shadowing from defect over geometry. These are all options which can be modeled, but increase computation time. The computed
delay laws controlling the sector scan were not compared with the actual delay laws for the instrument because they are not readily exportable from the instrument. The overall defect response calculation computes the signal received by the probe as the summation of individual contributions for the various resulting wave modes. The computation mode was two-dimensional – the SDH was meshed along its profile vertically-perpendicular to the sound beam projection. Figure 3 shows the two-dimensional profile of the skin-to-flange test sample drawn in the CIVA CAD facility, the subsequent three-dimensional solid model extrusion, and the addition of flaw, probe and ultrasonic setup parameters. The Kirchhoff approximation [13] was used in the flaw response calculations. The Kirchhoff approximation assumes that the elastic wave is entirely scattered by the flaw. The flaw is meshed and the wave scattered by the flaw is the product of amplitude and time-dependent functions of incident wave and complex scattering coefficient at each meshed location. The Kirchhoff approximation is a high frequency approximation, valid when the flaw is greater than the wavelength, and it relies on the assumption that each point at the flaw surface contributes as if it was part of an infinite plane (no interaction with neighboring points). In this case, the weld steel has a shear wave velocity around 0.328 cm/µsec and at a frequency of 5 MHz, the wavelength is approximately 0.65 mm (using wavelength = velocity/frequency) or about 1/3rd the size of the SDH diameter. The Kirchhoff approximation is assumed to give accurate results for flaws providing specular or near specular reflection over planar or volumetric defects. Quantitative error is expected to increase when the scattered direction moves away from the specular direction.
FIGURE 3. Two-dimensional profile of the skin-to-flange test sample drawn in the CIVA CAD facility, the subsequent three-dimensional solid model extrusion, and the addition of flaw and ultrasonic setup parameters.
EXPERIMENTAL RESULTS
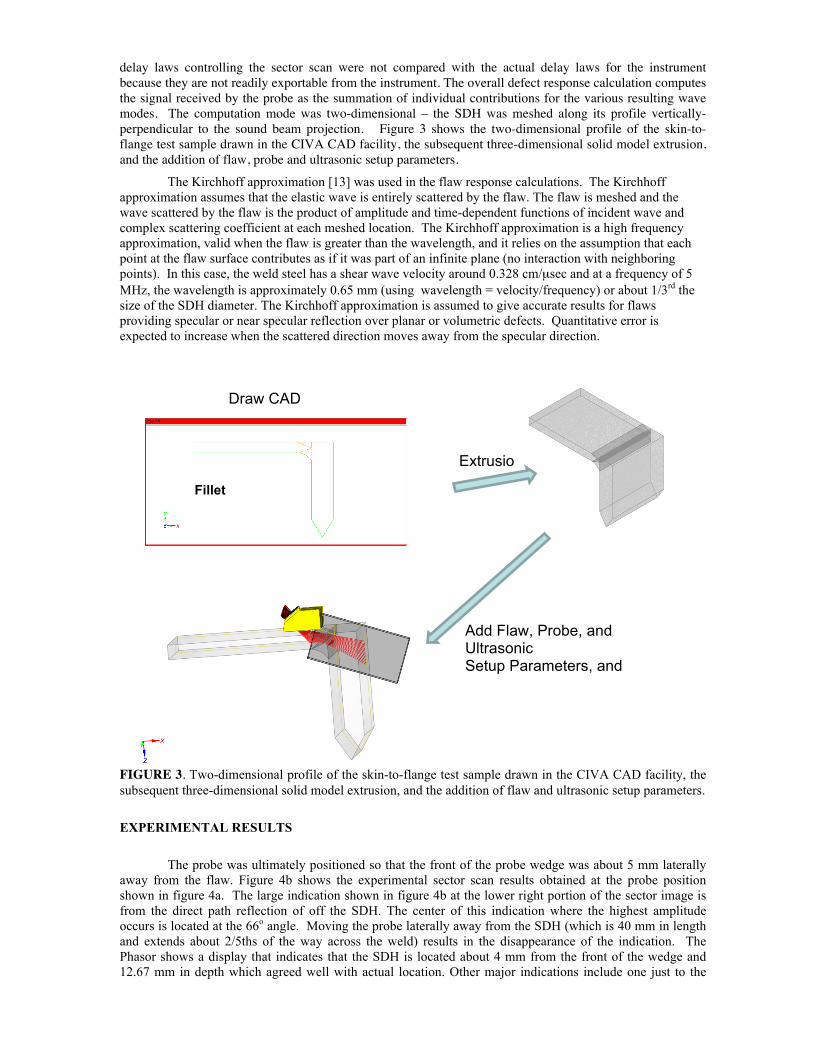
The probe was ultimately positioned so that the front of the probe wedge was about 5 mm laterally away from the flaw. Figure 4b shows the experimental sector scan results obtained at the probe position shown in figure 4a. The large indication shown in figure 4b at the lower right portion of the sector image is from the direct path reflection of off the SDH. The center of this indication where the highest amplitude occurs is located at the 66o angle. Moving the probe laterally away from the SDH (which is 40 mm in length and extends about 2/5ths of the way across the weld) results in the disappearance of the indication. The Phasor shows a display that indicates that the SDH is located about 4 mm from the front of the wedge and 12.67 mm in depth which agreed well with actual location. Other major indications include one just to the
Draw CAD model
Add Flaw, Probe, and Ultrasonic Setup Parameters, and Define Computation Zone
Extrusion
Fillet
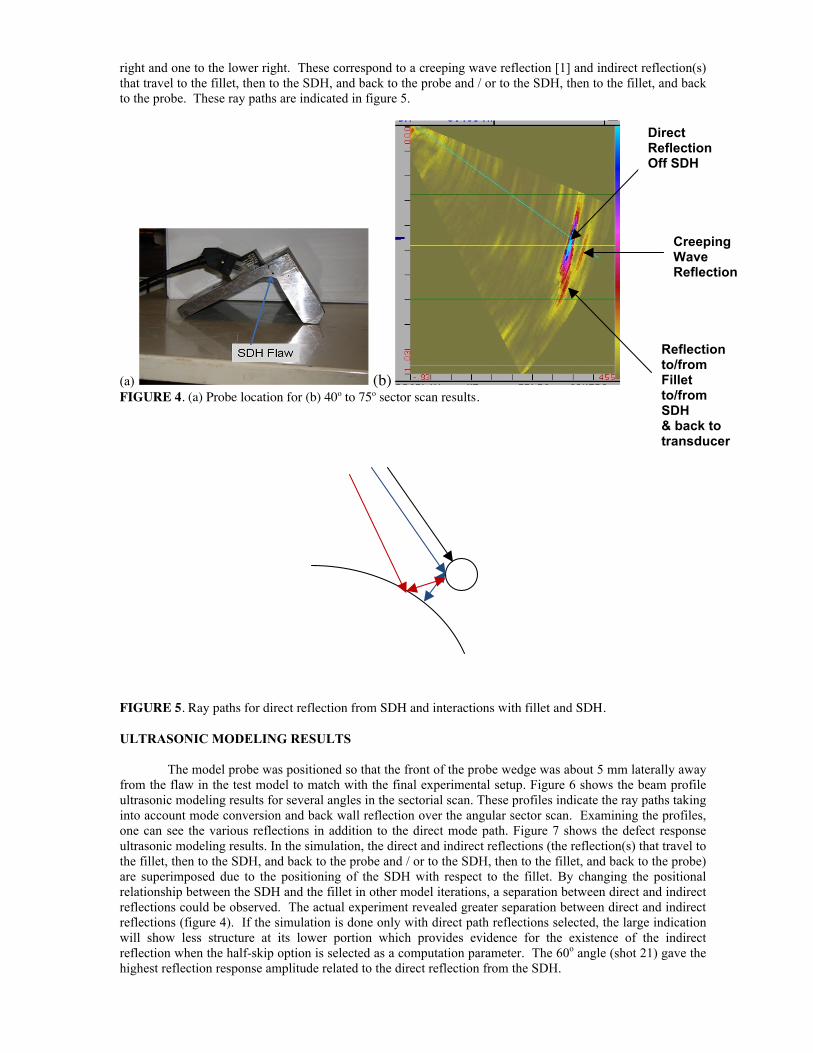
right and one to the lower right. These correspond to a creeping wave reflection [1] and indirect reflection(s) that travel to the fillet, then to the SDH, and back to the probe and / or to the SDH, then to the fillet, and back to the probe. These ray paths are indicated in figure 5.
(a) (b) FIGURE 4. (a) Probe location for (b) 40o to 75o sector scan results.
FIGURE 5. Ray paths for direct reflection from SDH and interactions with fillet and SDH. ULTRASONIC MODELING RESULTS
The model probe was positioned so that the front of the probe wedge was about 5 mm laterally away from the flaw in the test model to match with the final experimental setup. Figure 6 shows the beam profile ultrasonic modeling results for several angles in the sectorial scan. These profiles indicate the ray paths taking into account mode conversion and back wall reflection over the angular sector scan. Examining the profiles, one can see the various reflections in addition to the direct mode path. Figure 7 shows the defect response ultrasonic modeling results. In the simulation, the direct and indirect reflections (the reflection(s) that travel to the fillet, then to the SDH, and back to the probe and / or to the SDH, then to the fillet, and back to the probe) are superimposed due to the positioning of the SDH with respect to the fillet. By changing the positional relationship between the SDH and the fillet in other model iterations, a separation between direct and indirect reflections could be observed. The actual experiment revealed greater separation between direct and indirect reflections (figure 4). If the simulation is done only with direct path reflections selected, the large indication will show less structure at its lower portion which provides evidence for the existence of the indirect reflection when the half-skip option is selected as a computation parameter. The 60o angle (shot 21) gave the highest reflection response amplitude related to the direct reflection from the SDH.
Direct Reflection Off SDH
Reflection to/from Fillet to/from SDH & back to transducer
Creeping Wave Reflection
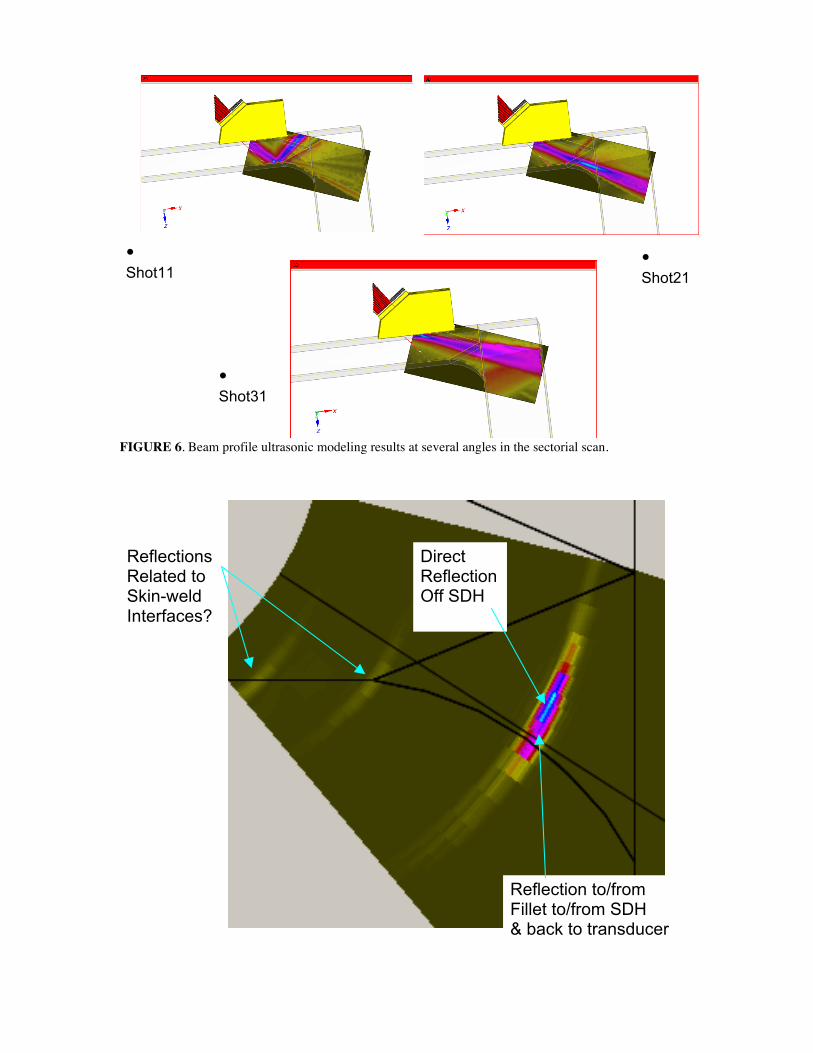
FIGURE 6. Beam profile ultrasonic modeling results at several angles in the sectorial scan.
Direct Reflection Off SDH
Reflection to/from Fillet to/from SDH & back to transducer
Reflections Related to Skin-weld Interfaces?
• Shot11 (50 deg)
• Shot31 (70 deg)
• Shot21 (60 deg)
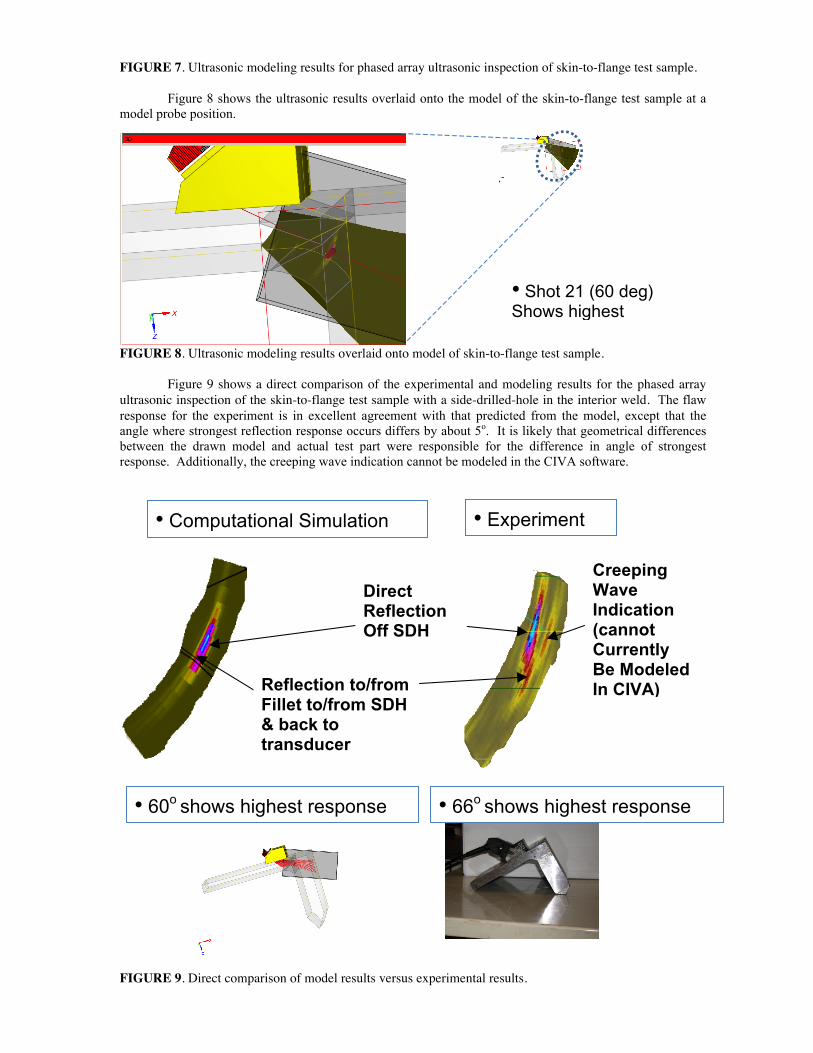
FIGURE 7. Ultrasonic modeling results for phased array ultrasonic inspection of skin-to-flange test sample.
Figure 8 shows the ultrasonic results overlaid onto the model of the skin-to-flange test sample at a model probe position.
FIGURE 8. Ultrasonic modeling results overlaid onto model of skin-to-flange test sample.
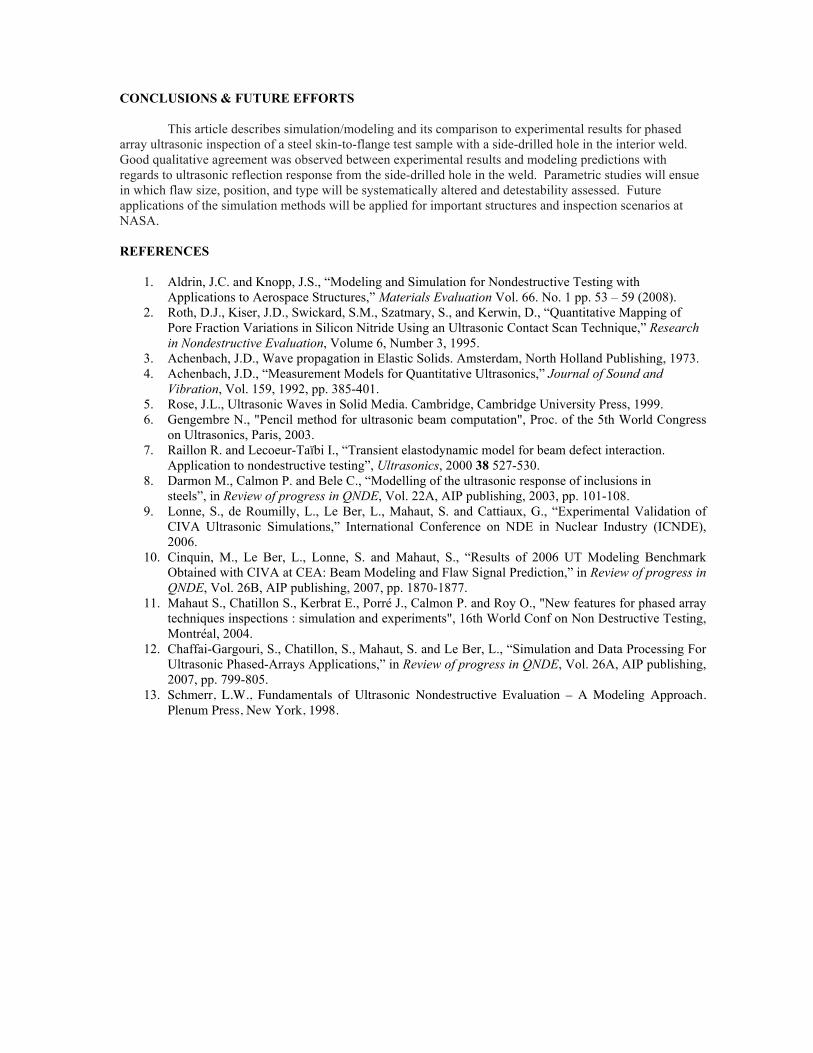
Figure 9 shows a direct comparison of the experimental and modeling results for the phased array ultrasonic inspection of the skin-to-flange test sample with a side-drilled-hole in the interior weld. The flaw response for the experiment is in excellent agreement with that predicted from the model, except that the angle where strongest reflection response occurs differs by about 5o. It is likely that geometrical differences between the drawn model and actual test part were responsible for the difference in angle of strongest response. Additionally, the creeping wave indication cannot be modeled in the CIVA software.
FIGURE 9. Direct comparison of model results versus experimental results.
• Shot 21 (60 deg) Shows highest response
• 60o shows highest response • 66o shows highest response
• Computational Simulation • Experiment
Direct Reflection Off SDH
Reflection to/from Fillet to/from SDH & back to transducer
Creeping Wave Indication (cannot Currently Be Modeled In CIVA)
CONCLUSIONS & FUTURE EFFORTS
This article describes simulation/modeling and its comparison to experimental results for phased array ultrasonic inspection of a steel skin-to-flange test sample with a side-drilled hole in the interior weld. Good qualitative agreement was observed between experimental results and modeling predictions with regards to ultrasonic reflection response from the side-drilled hole in the weld. Parametric studies will ensue in which flaw size, position, and type will be systematically altered and detestability assessed. Future applications of the simulation methods will be applied for important structures and inspection scenarios at NASA. REFERENCES
1. Aldrin, J.C. and Knopp, J.S., “Modeling and Simulation for Nondestructive Testing with Applications to Aerospace Structures,” Materials Evaluation Vol. 66. No. 1 pp. 53 – 59 (2008).
2. Roth, D.J., Kiser, J.D., Swickard, S.M., Szatmary, S., and Kerwin, D., “Quantitative Mapping of Pore Fraction Variations in Silicon Nitride Using an Ultrasonic Contact Scan Technique,” Research in Nondestructive Evaluation, Volume 6, Number 3, 1995.
3. Achenbach, J.D., Wave propagation in Elastic Solids. Amsterdam, North Holland Publishing, 1973. 4. Achenbach, J.D., “Measurement Models for Quantitative Ultrasonics,” Journal of Sound and
Vibration, Vol. 159, 1992, pp. 385-401. 5. Rose, J.L., Ultrasonic Waves in Solid Media. Cambridge, Cambridge University Press, 1999. 6. Gengembre N., "Pencil method for ultrasonic beam computation", Proc. of the 5th World Congress
on Ultrasonics, Paris, 2003. 7. Raillon R. and Lecoeur-Taïbi I., “Transient elastodynamic model for beam defect interaction.
Application to nondestructive testing”, Ultrasonics, 2000 38 527-530. 8. Darmon M., Calmon P. and Bele C., “Modelling of the ultrasonic response of inclusions in
steels”, in Review of progress in QNDE, Vol. 22A, AIP publishing, 2003, pp. 101-108. 9. Lonne, S., de Roumilly, L., Le Ber, L., Mahaut, S. and Cattiaux, G., “Experimental Validation of
CIVA Ultrasonic Simulations,” International Conference on NDE in Nuclear Industry (ICNDE), 2006.
10. Cinquin, M., Le Ber, L., Lonne, S. and Mahaut, S., “Results of 2006 UT Modeling Benchmark Obtained with CIVA at CEA: Beam Modeling and Flaw Signal Prediction,” in Review of progress in QNDE, Vol. 26B, AIP publishing, 2007, pp. 1870-1877.
11. Mahaut S., Chatillon S., Kerbrat E., Porré J., Calmon P. and Roy O., "New features for phased array techniques inspections : simulation and experiments", 16th World Conf on Non Destructive Testing, Montréal, 2004.
12. Chaffai-Gargouri, S., Chatillon, S., Mahaut, S. and Le Ber, L., “Simulation and Data Processing For Ultrasonic Phased-Arrays Applications,” in Review of progress in QNDE, Vol. 26A, AIP publishing, 2007, pp. 799-805.
13. Schmerr, L.W., Fundamentals of Ultrasonic Nondestructive Evaluation – A Modeling Approach. Plenum Press, New York, 1998.
Recommended