Investor Relations | page 1
Unibanco and Unibanco Holdings, S.A.
Consolidated Earnings
4th Quarter 2005
February 17th, 2006
Investor Relations
Investor Relations | page 2
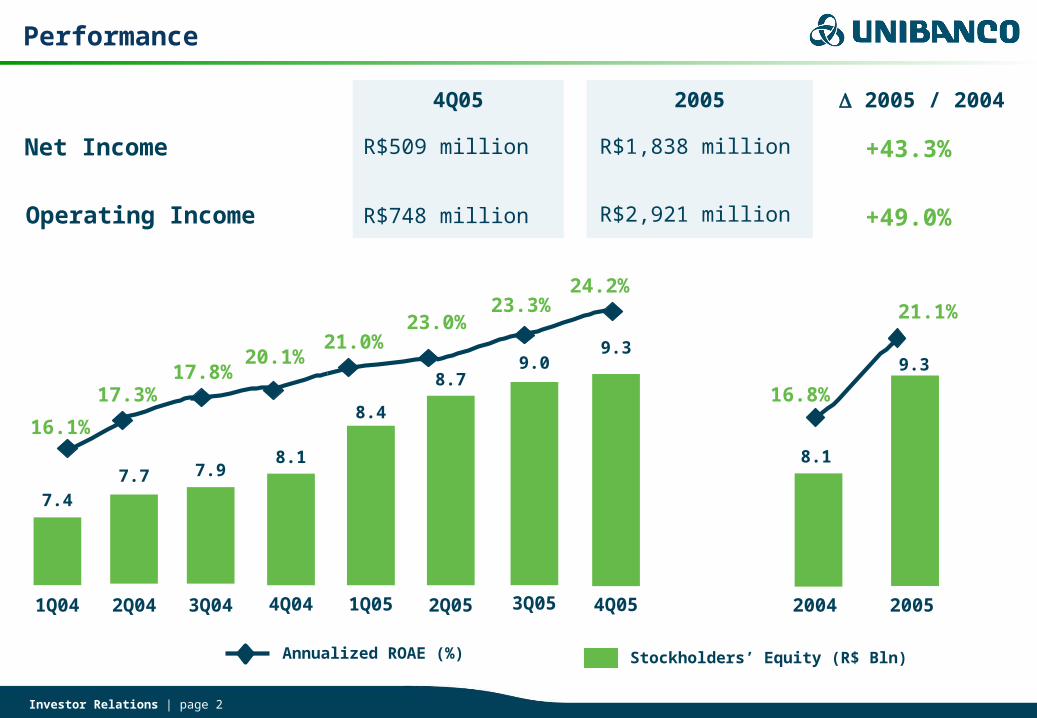
Performance
23.0%
20.1%21.0%
Annualized ROAE (%)
23.3%
Stockholders’ Equity (R$ Bln)
24.2%
Net Income +43.3%
+49.0%
2005 / 20044Q05 2005
R$1,838 million
R$2,921 million
R$509 million
R$748 millionOperating Income
2004 2005
8.1
9.3
16.8%
21.1%
8.1
8.4
4Q04 1Q05
8.7
2Q05 3Q05
9.0
4Q05
9.3
3Q042Q041Q04
7.9
17.8%17.3%
16.1%
7.47.7
Investor Relations | page 3
Highlights
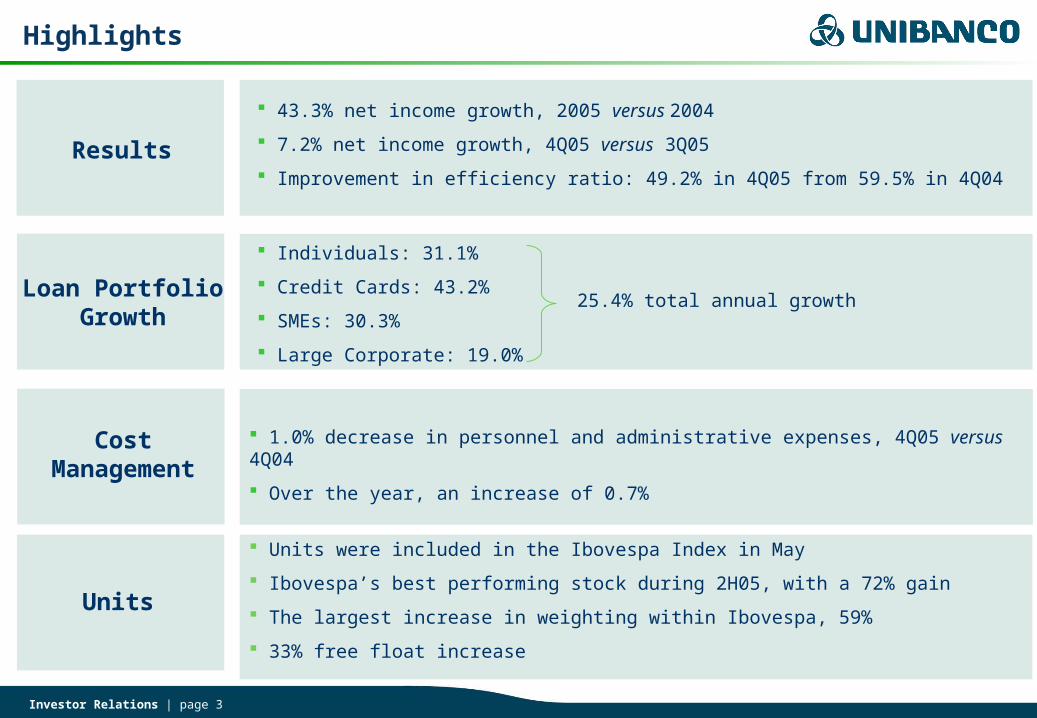
43.3% net income growth, 2005 versus 2004
7.2% net income growth, 4Q05 versus 3Q05
Improvement in efficiency ratio: 49.2% in 4Q05 from 59.5% in 4Q04
Individuals: 31.1%
Credit Cards: 43.2%
SMEs: 30.3%
Large Corporate: 19.0%
1.0% decrease in personnel and administrative expenses, 4Q05 versus 4Q04
Over the year, an increase of 0.7%
25.4% total annual growth
Results
Loan Portfolio Growth
Cost Management
Units
Units were included in the Ibovespa Index in May
Ibovespa’s best performing stock during 2H05, with a 72% gain
The largest increase in weighting within Ibovespa, 59%
33% free float increase
Investor Relations | page 4
2005 – A Retrospective
Investor Relations | page 5
Macroeconomic View
Real GDP growth
Source: Brazilian Central Bank
Public accounts under control (% of GDP)
4.9%
0.5%
1.6%1.5%
4.4%
2000 2001 2002 2003 2004
+Total Credit Expansion (R$ Bln)
Loan portfolio/ GDP ratio: 31.3%1
+ 21.5%
2.5%
2005(E)
0
10
20
30
40
50
60
70
1998 1999 2000 2001 2002 2003 2004 2005
0
1
2
3
4
5
6
Public debt Primary surplus
418500
607
2003 2004 2005
1 preliminary data
+ 19.6%
Investor Relations | page 6
Businesses Highlights
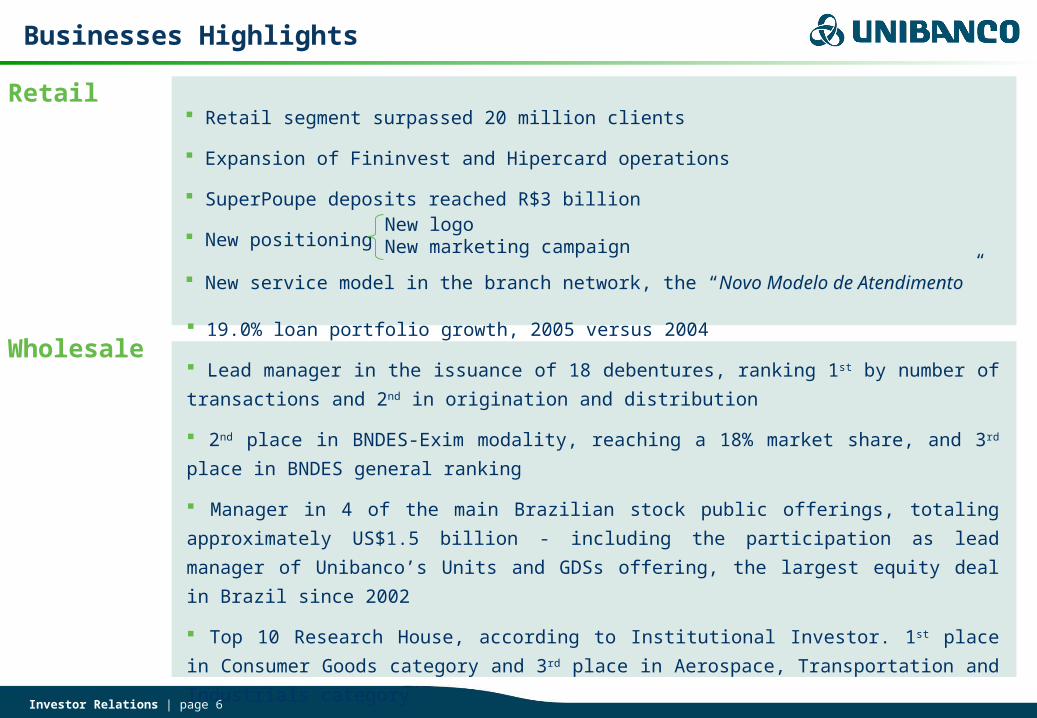
Retail
Wholesale 19.0% loan portfolio growth, 2005 versus 2004
Lead manager in the issuance of 18 debentures, ranking 1st by number of
transactions and 2nd in origination and distribution
2nd place in BNDES-Exim modality, reaching a 18% market share, and 3rd place in
BNDES general ranking
Manager in 4 of the main Brazilian stock public offerings, totaling approximately
US$1.5 billion - including the participation as lead manager of Unibanco’s Units and
GDSs offering, the largest equity deal in Brazil since 2002
Top 10 Research House, according to Institutional Investor. 1st place in Consumer
Goods category and 3rd place in Aerospace, Transportation and Industrials category
Retail segment surpassed 20 million clients
Expansion of Fininvest and Hipercard operations
SuperPoupe deposits reached R$3 billion
New positioning
New service model in the branch network, the “Novo Modelo de Atendimento”
New logoNew marketing campaign
Investor Relations | page 7
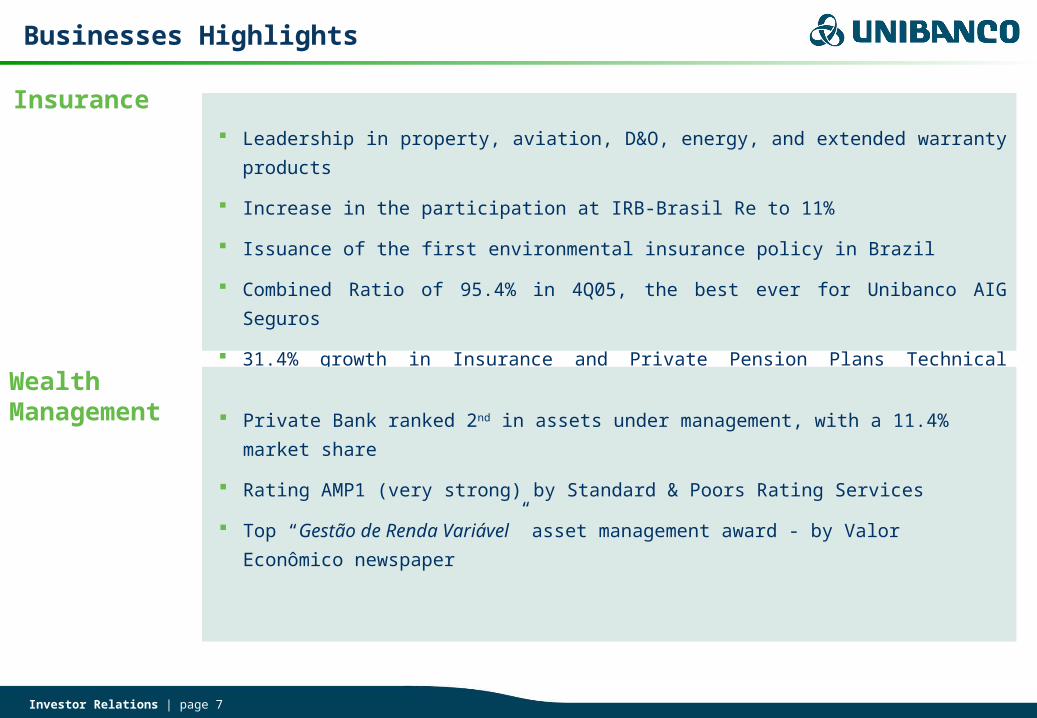
Insurance
Wealth Management
Leadership in property, aviation, D&O, energy, and extended warranty products
Increase in the participation at IRB-Brasil Re to 11%
Issuance of the first environmental insurance policy in Brazil
Combined Ratio of 95.4% in 4Q05, the best ever for Unibanco AIG Seguros
31.4% growth in Insurance and Private Pension Plans Technical Reserves in 2005
Private Bank ranked 2nd in assets under management, with a 11.4% market
share
Rating AMP1 (very strong) by Standard & Poors Rating Services
Top “Gestão de Renda Variável” asset management award - by Valor
Econômico newspaper
Businesses Highlights
Investor Relations | page 8
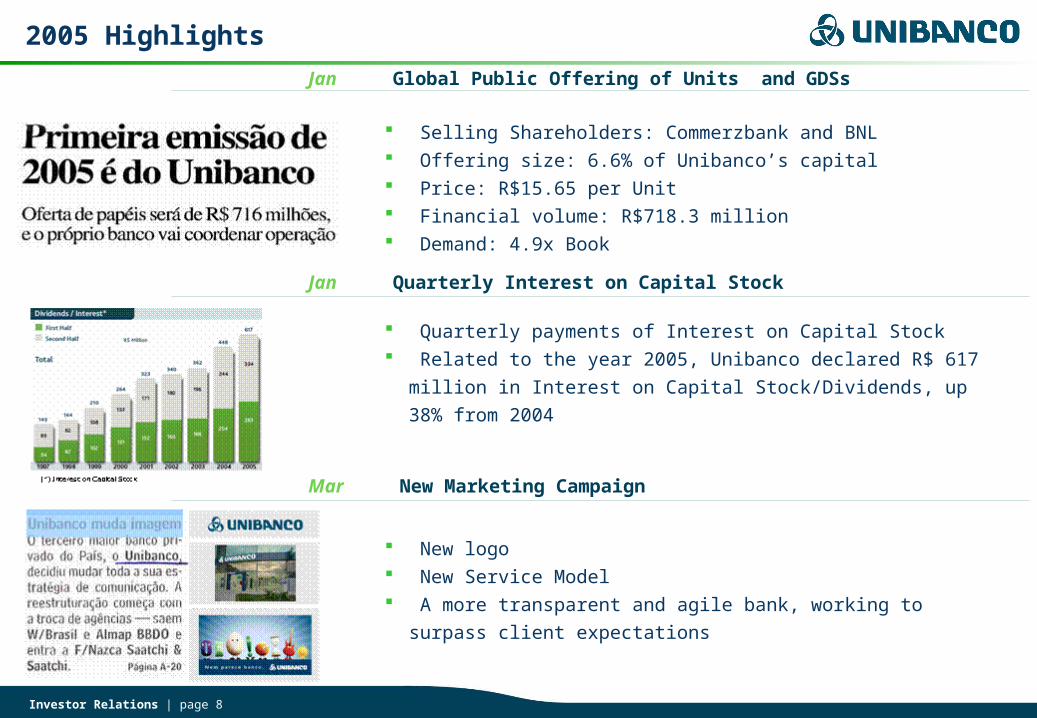
Jan Global Public Offering of Units and GDSs
Jan Quarterly Interest on Capital Stock
Mar New Marketing Campaign
2005 Highlights
New logo New Service Model A more transparent and agile bank, working to surpass client
expectations
Quarterly payments of Interest on Capital Stock Related to the year 2005, Unibanco declared R$ 617 million
in Interest on Capital Stock/Dividends, up 38% from 2004
Selling Shareholders: Commerzbank and BNL Offering size: 6.6% of Unibanco’s capital Price: R$15.65 per Unit Financial volume: R$718.3 million Demand: 4.9x Book
Investor Relations | page 9
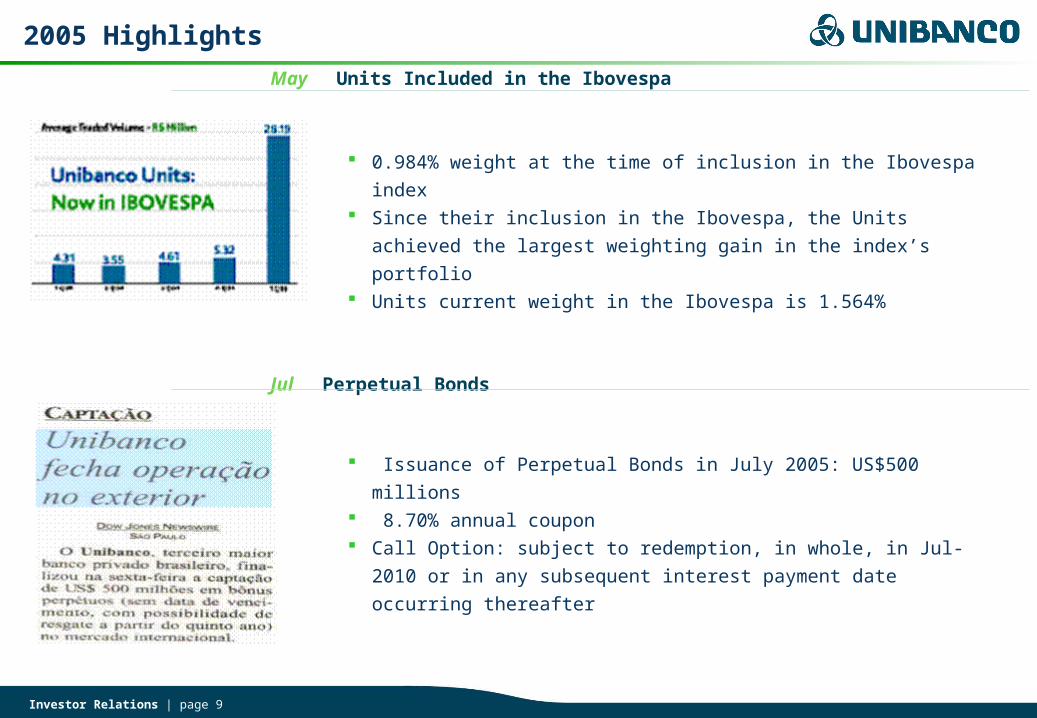
May Units Included in the Ibovespa
Jul Perpetual Bonds
0.984% weight at the time of inclusion in the Ibovespa index Since their inclusion in the Ibovespa, the Units achieved the largest
weighting gain in the index’s portfolio Units current weight in the Ibovespa is 1.564%
Issuance of Perpetual Bonds in July 2005: US$500 millions 8.70% annual coupon Call Option: subject to redemption, in whole, in Jul-2010 or in any
subsequent interest payment date occurring thereafter
2005 Highlights
Investor Relations | page 10
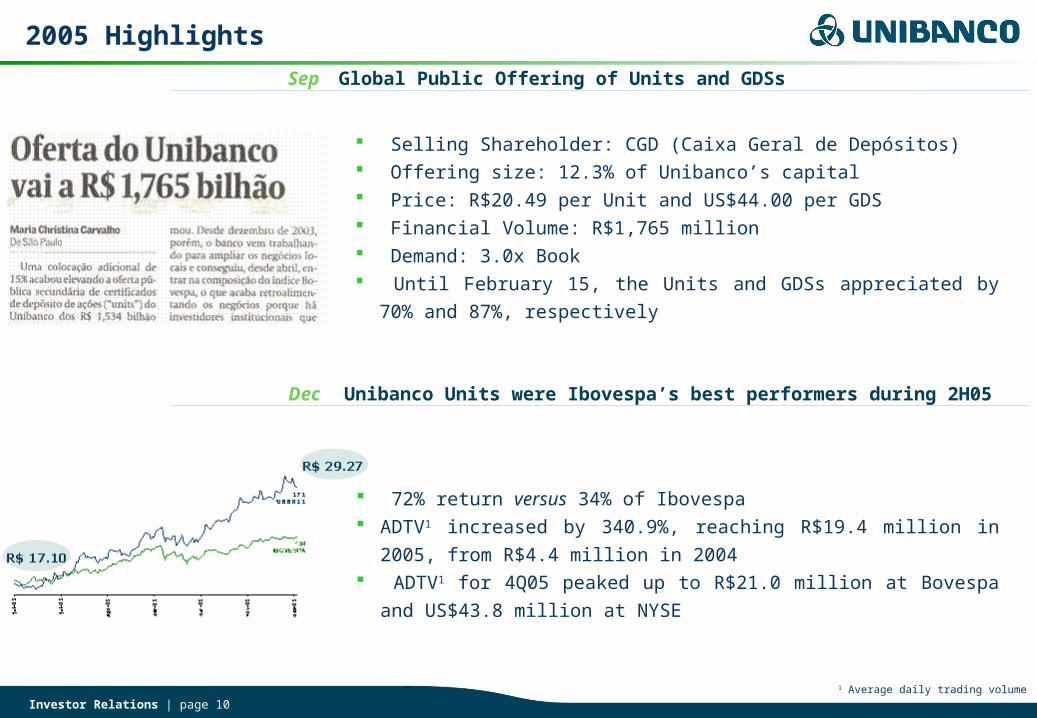
Sep Global Public Offering of Units and GDSs
Dec Unibanco Units were Ibovespa’s best performers during 2H05
Selling Shareholder: CGD (Caixa Geral de Depósitos) Offering size: 12.3% of Unibanco’s capital Price: R$20.49 per Unit and US$44.00 per GDS Financial Volume: R$1,765 million Demand: 3.0x Book Until February 15, the Units and GDSs appreciated by 70% and
87%, respectively
72% return versus 34% of Ibovespa ADTV1 increased by 340.9%, reaching R$19.4 million in 2005,
from R$4.4 million in 2004 ADTV1 for 4Q05 peaked up to R$21.0 million at Bovespa and
US$43.8 million at NYSE
2005 Highlights
1 Average daily trading volume
Investor Relations | page 11
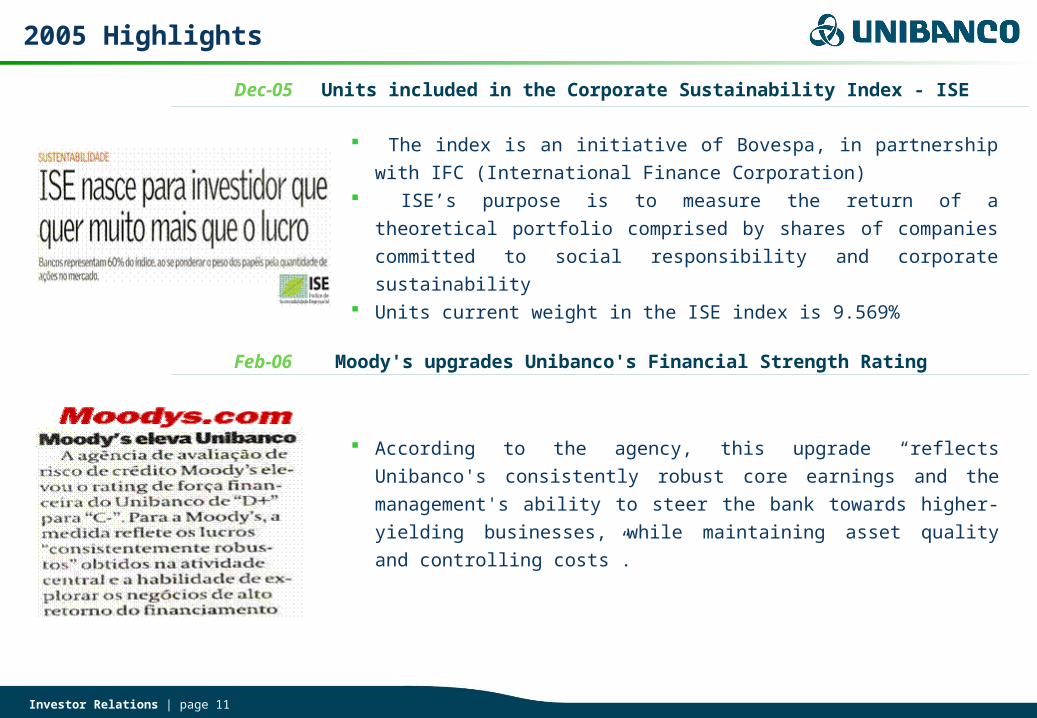
Dec-05 Units included in the Corporate Sustainability Index - ISE
Feb-06 Moody's upgrades Unibanco's Financial Strength Rating
The index is an initiative of Bovespa, in partnership with IFC
(International Finance Corporation) ISE’s purpose is to measure the return of a theoretical portfolio
comprised by shares of companies committed to social
responsibility and corporate sustainability Units current weight in the ISE index is 9.569%
According to the agency, this upgrade “reflects Unibanco's
consistently robust core earnings and the management's ability to
steer the bank towards higher-yielding businesses, while
maintaining asset quality and controlling costs”.
2005 Highlights
Investor Relations | page 12
Fundamentals
Investor Relations | page 13
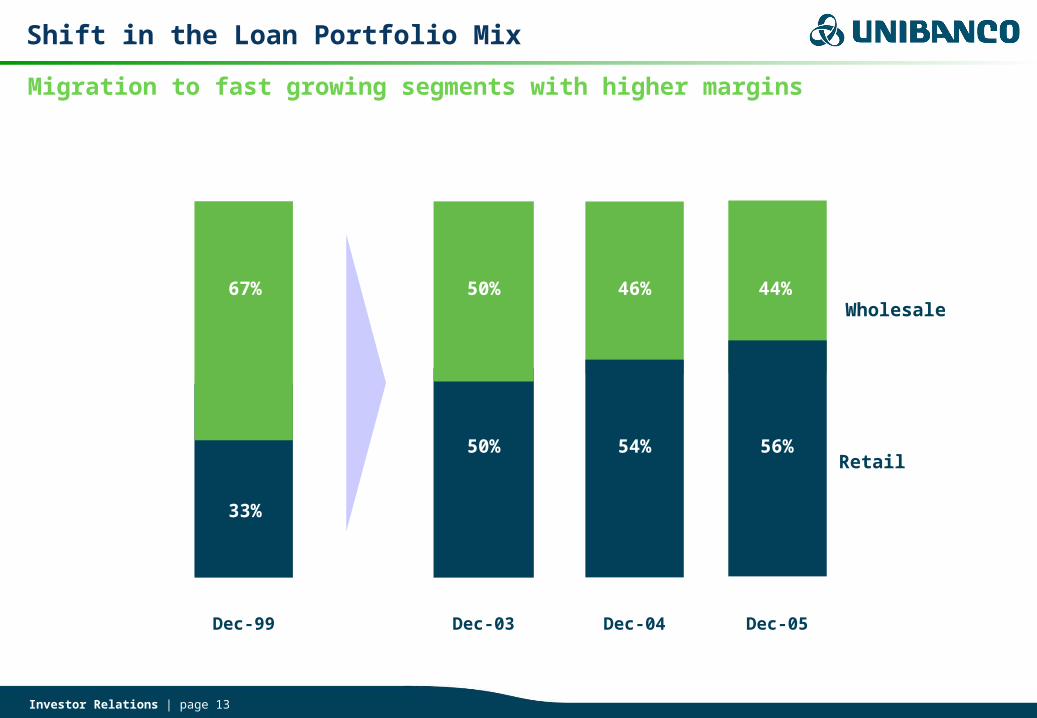
Dec-99
Wholesale
52%
48%
Dec-03 Dec-04
Shift in the Loan Portfolio Mix
Dec-05
50%
50% 46% 44%67%
33%
Retail54% 56%
Migration to fast growing segments with higher margins
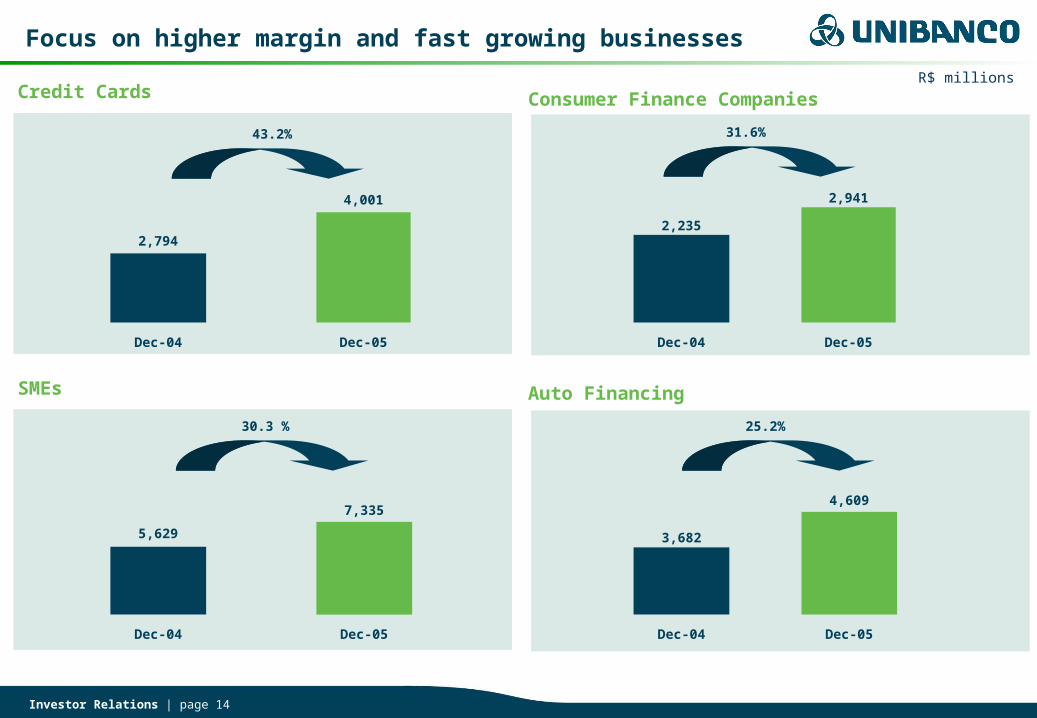
Investor Relations | page 14
Focus on higher margin and fast growing businesses
2,794
4,001
Dec-04 Dec-05
3,682
4,609
Dec-04 Dec-05
5,629
7,335
Dec-04 Dec-05
30.3 % 25.2%
43.2%
Credit Cards
SMEs Auto Financing
Consumer Finance Companies
2,235
2,941
Dec-04 Dec-05
31.6%
R$ millions
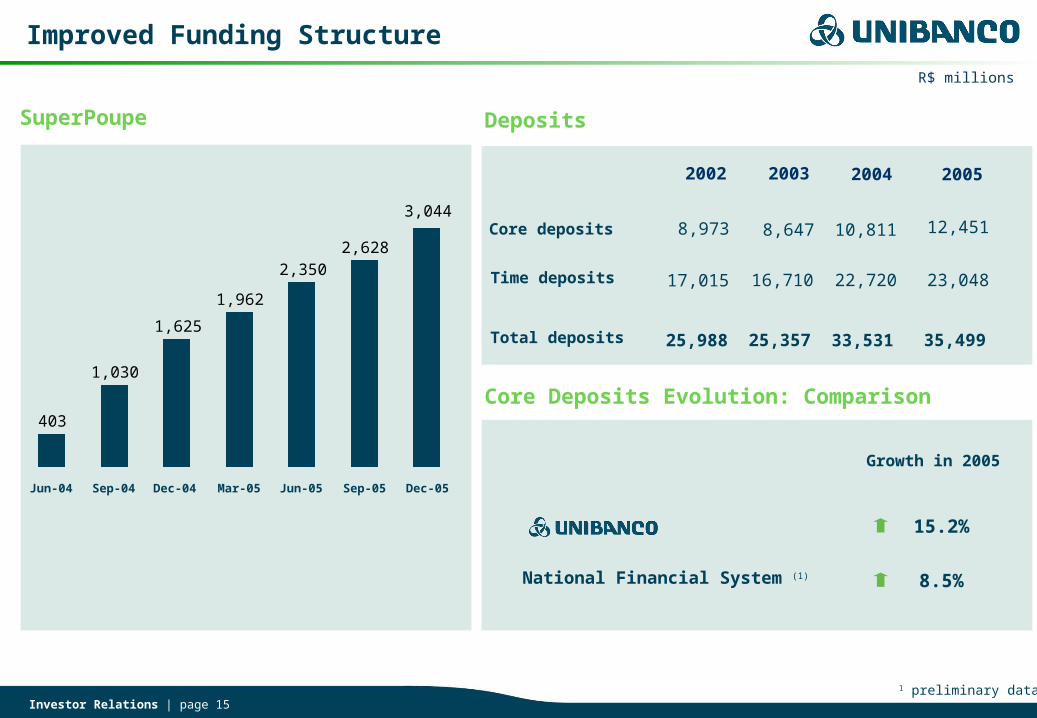
Investor Relations | page 15
Deposits
Core deposits
Time deposits
2003
8,647
16,710
25,357
22,720
2004
10,811
33,531
2002
8,973
17,015
25,988Total deposits
12,451
23,048
35,499
2005
Growth in 2005
15.2%
8.5%National Financial System (1)
Core Deposits Evolution: Comparison
Improved Funding Structure
SuperPoupe
403
1,030
1,625
1,962
2,3502,628
3,044
Jun-04 Sep-04 Dec-04 Mar-05 Jun-05 Sep-05 Dec-05
R$ millions
1 preliminary data
Investor Relations | page 16
Cost Management
4Q04 4Q05 2004 2005
2,293 8,310
5,058
60.9%
1,365
51.3%
5,092
9,878
51.5%
1,351
2,745
49.2%
18.9%
0.7%
%
R$ millions
3Q04 3Q052Q051Q05
59.5%63.4% 61.2% 59.5%
53.7% 52.8%
1Q04 2Q04
2,579
1,323
2,136
1,308
2,209
1,186
1,921
1,143
1,960
1,242
2,334
1,232
Efficiency Ratio Evolution
Expenses
Revenues
Efficiency Ratio
Investor Relations | page 17
Financial Performance
Investor Relations | page 18
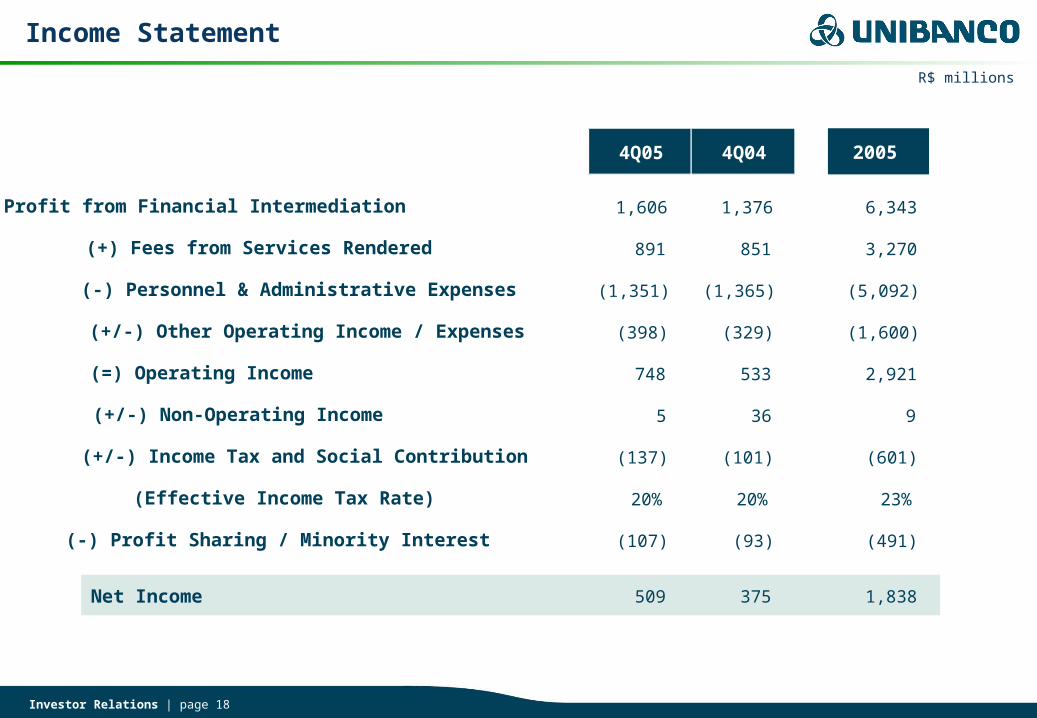
Income Statement
R$ millions
4Q05 4Q04
Profit from Financial Intermediation 1,606 1,376 6,343
(+) Fees from Services Rendered 891 851 3,270
(-) Personnel & Administrative Expenses (1,351) (1,365) (5,092)
(+/-) Other Operating Income / Expenses (398) (329) (1,600)
(=) Operating Income 748 533 2,921
(+/-) Non-Operating Income 5 36 9
(+/-) Income Tax and Social Contribution (137) (101) (601)
(Effective Income Tax Rate) 20% 20% 23%
(-) Profit Sharing / Minority Interest (107) (93) (491)
Net Income 509 375 1,838
2005
Investor Relations | page 19
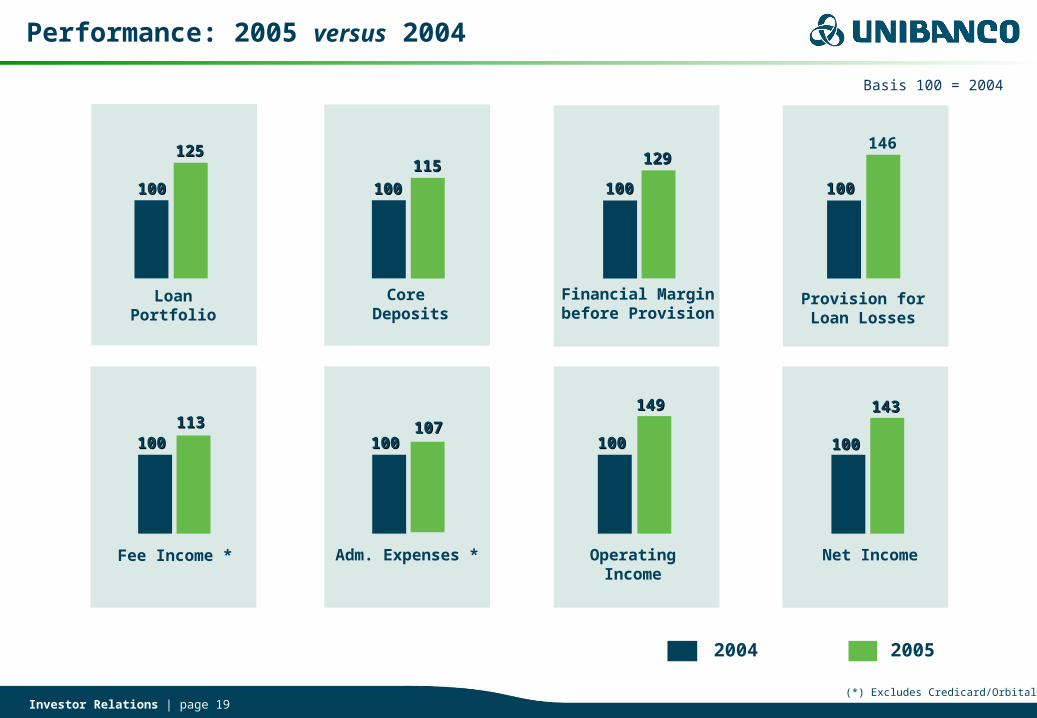
Performance: 2005 versus 2004
100100
Loan Portfolio
125125
100100
Fee Income *
113113
Core Deposits
115115
100100
Adm. Expenses *
107107
Financial Margin before Provision
129129
100100
Operating Income
149149
Provision for Loan Losses
146
100100
Net Income
143143
20052004
Basis 100 = 2004
(*) Excludes Credicard/Orbitall
100100 100100100100
Investor Relations | page 20
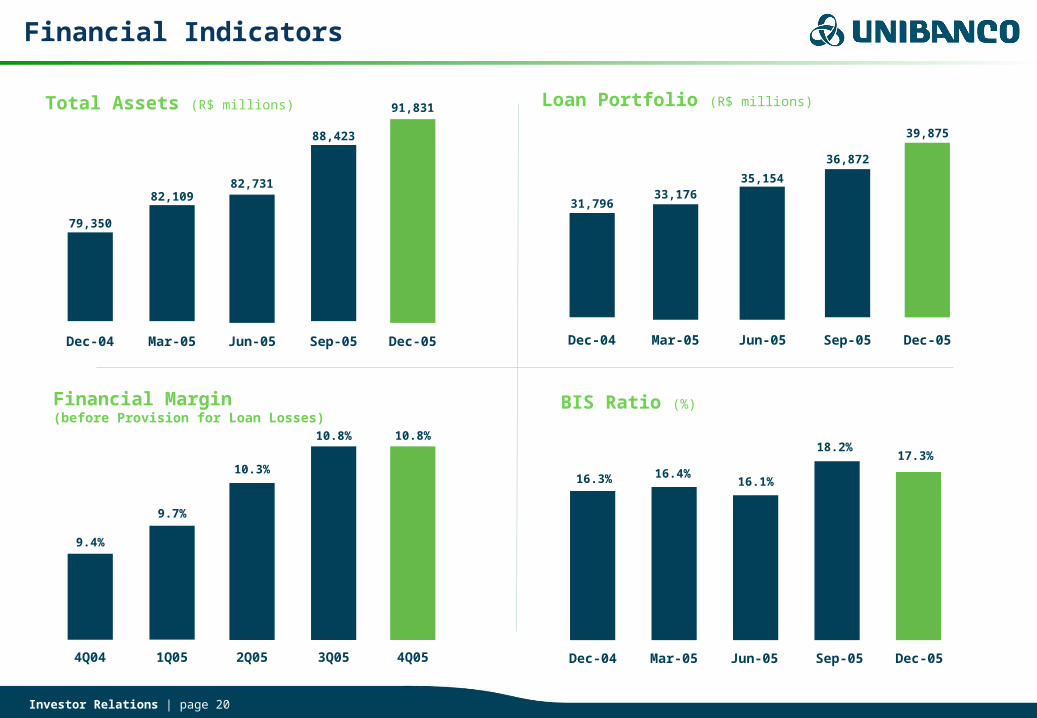
Financial Indicators
Total Assets (R$ millions)
79,350
82,10982,731
88,423
Dec-04 Mar-05 Jun-05 Sep-05 Dec-05
91,831 Loan Portfolio (R$ millions)
31,79633,176
35,154
36,872
Dec-04 Mar-05 Jun-05 Sep-05 Dec-05
39,875
Financial Margin(before Provision for Loan Losses)
9.4%
9.7%
10.3%
10.8%
4Q04 1Q05 2Q05 3Q05 4Q05
10.8%
BIS Ratio (%)
18.2%17.3%
16.3% 16.1%16.4%
Dec-04 Mar-05 Jun-05 Sep-05 Dec-05
Investor Relations | page 21
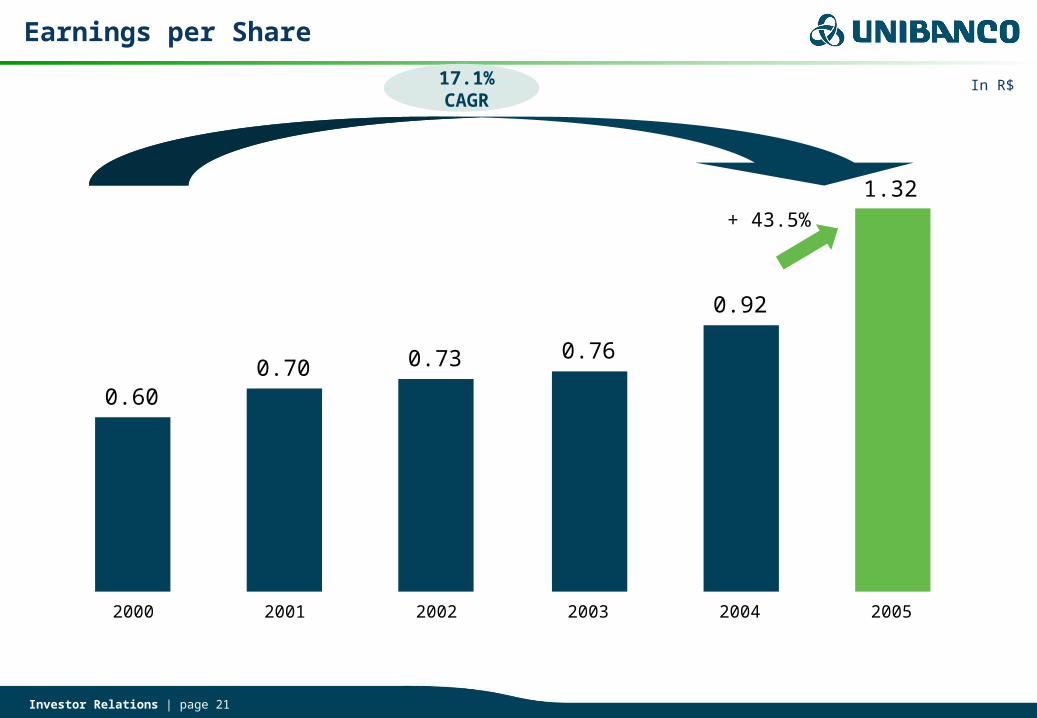
Earnings per Share
0.600.70 0.73 0.76
0.92
1.32
2000 2001 2002 2003 2004 2005
17.1%CAGR
+ 43.5%
In R$
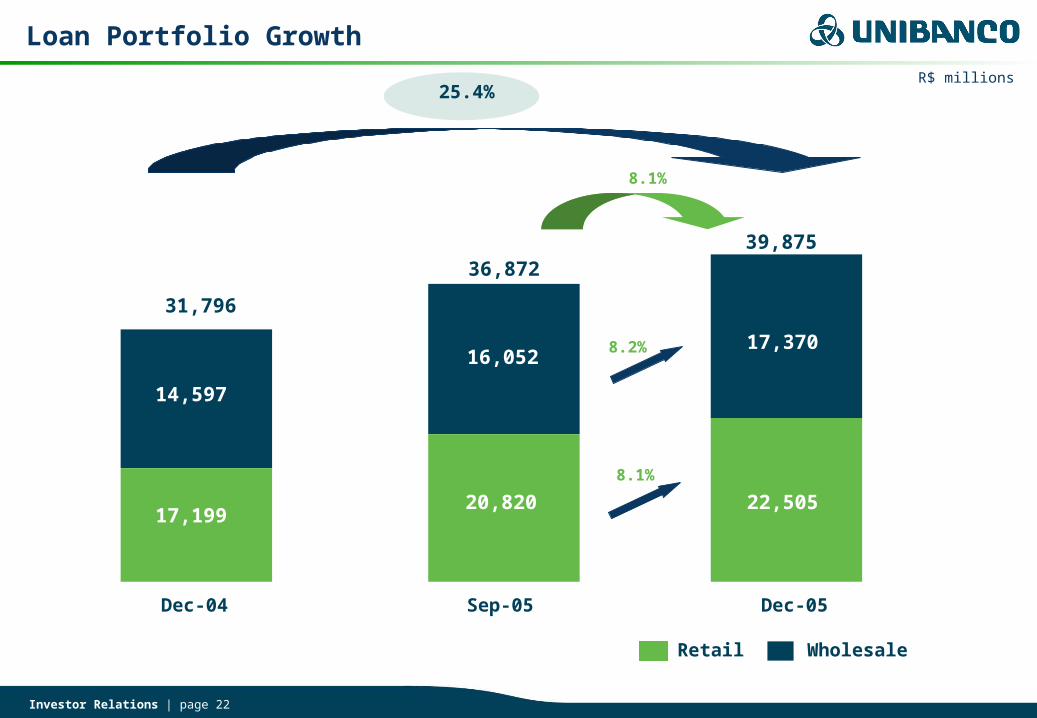
Investor Relations | page 22
Loan Portfolio Growth
25.4%
Sep-05
36,872
Dec-05
8.1%
8.2%
8.1%
Dec-04
39,875
14,597
17,19920,820
16,052
31,796
17,370
22,505
WholesaleRetail
R$ millions
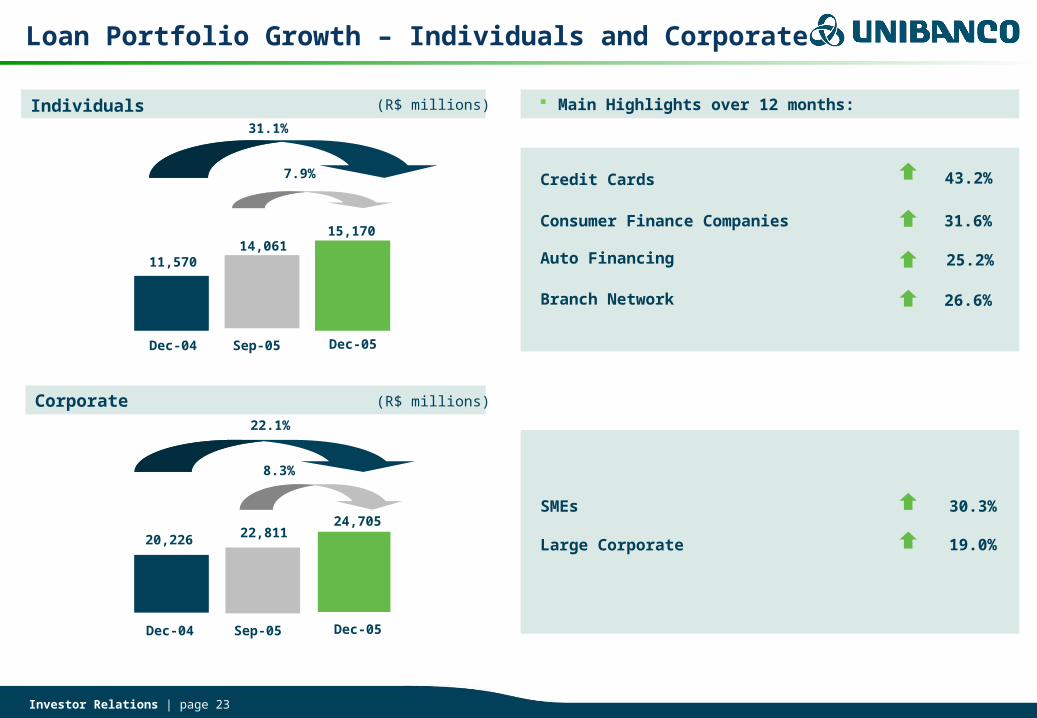
Investor Relations | page 23
Loan Portfolio Growth – Individuals and Corporate
Corporate
Individuals (R$ millions)
(R$ millions)
Dec-04 Sep-05
7.9%
11,57014,061
Dec-05
15,170
31.1%
24,705
22.1%
20,226
8.3%
22,811
Dec-04 Sep-05 Dec-05
Main Highlights over 12 months:
Consumer Finance Companies 31.6%
26.6%
43.2%
Branch Network
Credit Cards
SMEs 30.3%
19.0%Large Corporate
25.2%Auto Financing
Investor Relations | page 24
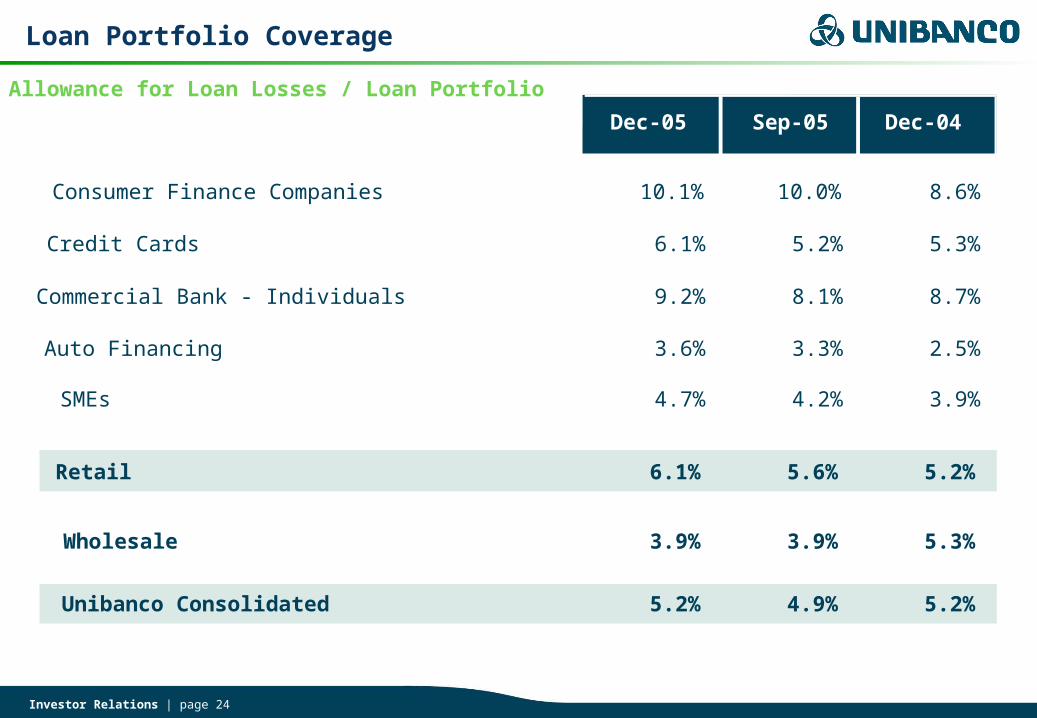
Loan Portfolio Coverage
Dec-05 Sep-05 Dec-04
Consumer Finance Companies 10.1% 10.0% 8.6%
Credit Cards 6.1% 5.2% 5.3%
Commercial Bank - Individuals 9.2% 8.1% 8.7%
Auto Financing 3.6% 3.3% 2.5%
SMEs 4.7% 4.2% 3.9%
Retail 6.1% 5.6% 5.2%
Wholesale 3.9% 3.9% 5.3%
Unibanco Consolidated 5.2% 4.9% 5.2%
Allowance for Loan Losses / Loan Portfolio
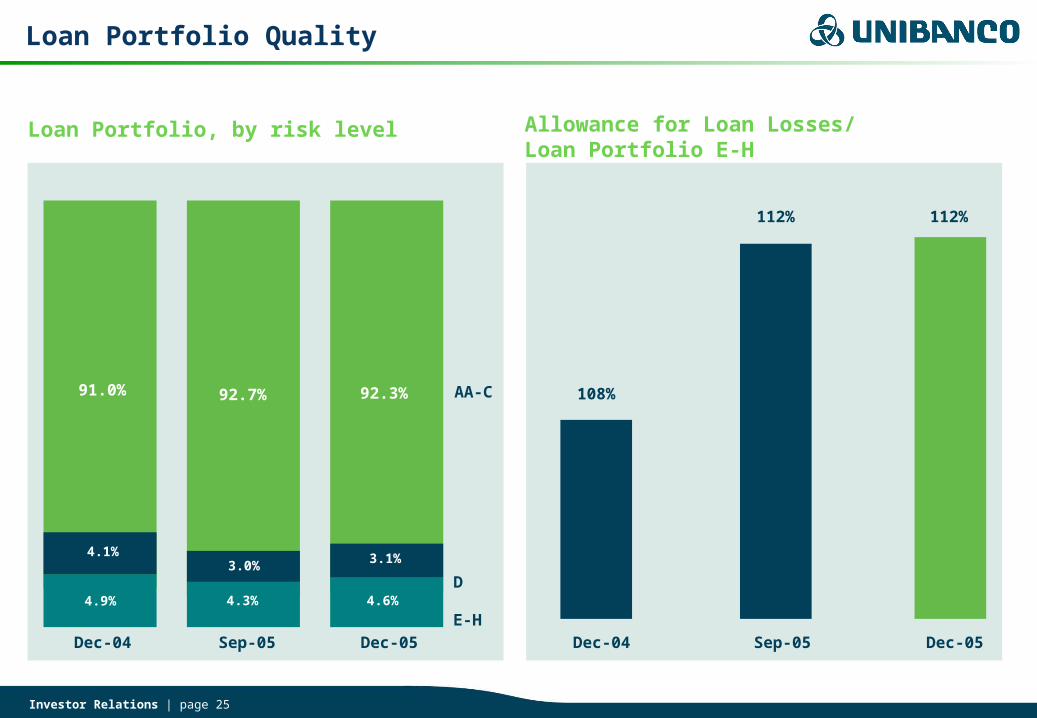
Investor Relations | page 25
108%
112% 112%
4.9% 4.3% 4.6%
4.1%3.0% 3.1%
91.0% 92.7% 92.3% AA-C
D
E-H
Loan Portfolio, by risk level Allowance for Loan Losses/Loan Portfolio E-H
Loan Portfolio Quality
Dec-04 Sep-05 Dec-05Dec-04 Sep-05 Dec-05
Investor Relations | page 26
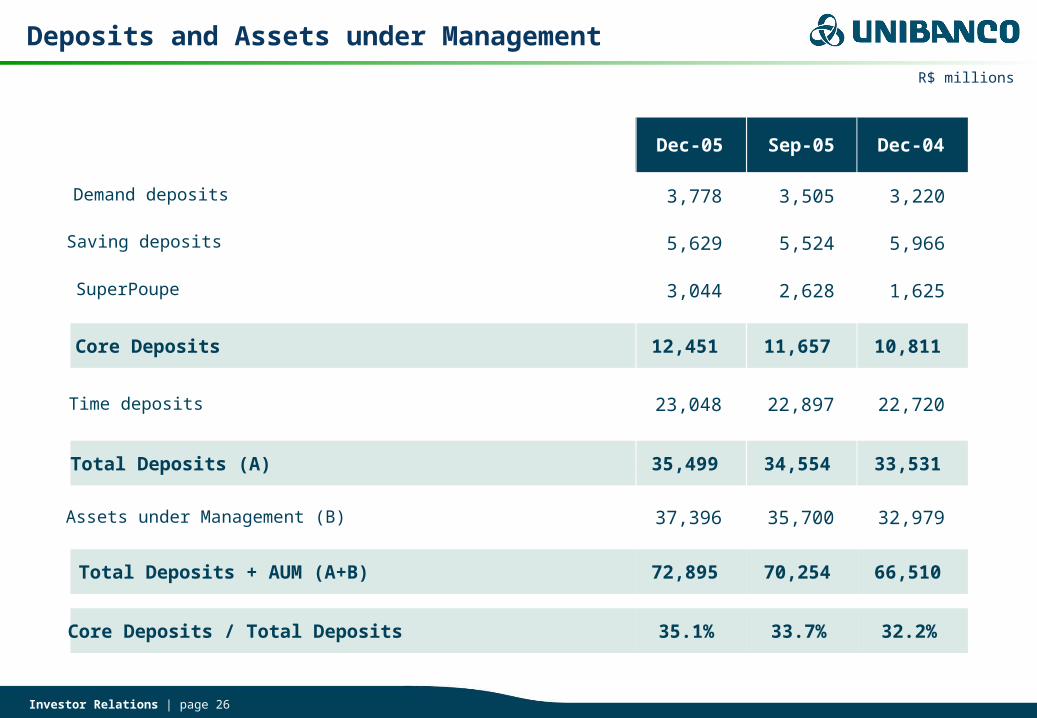
Deposits and Assets under ManagementR$ millions
Dec-05 Sep-05 Dec-04
Demand deposits 3,778 3,505 3,220
Saving deposits 5,629 5,524 5,966
SuperPoupe 3,044 2,628 1,625
Core Deposits 12,451 11,657 10,811
Time deposits 23,048 22,897 22,720
Total Deposits (A) 35,499 34,554 33,531
Assets under Management (B) 37,396 35,700 32,979
Total Deposits + AUM (A+B) 72,895 70,254 66,510
Core Deposits / Total Deposits 35.1% 33.7% 32.2%
Investor Relations | page 27
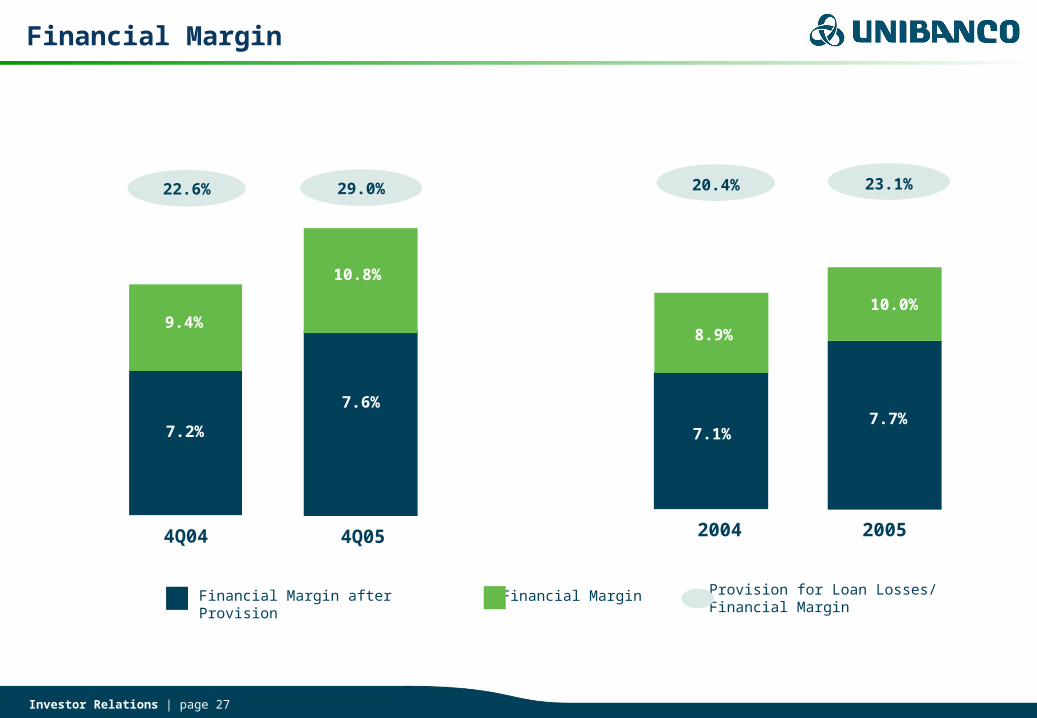
Financial Margin
Financial MarginFinancial Margin after Provision Provision for Loan Losses/Financial Margin
2004 2005
7.1%
8.9%
20.4%
7.7%
10.0%
23.1%
7.2%
4Q04
9.4%
22.6%
7.6%
4Q05
10.8%
29.0%
Investor Relations | page 28
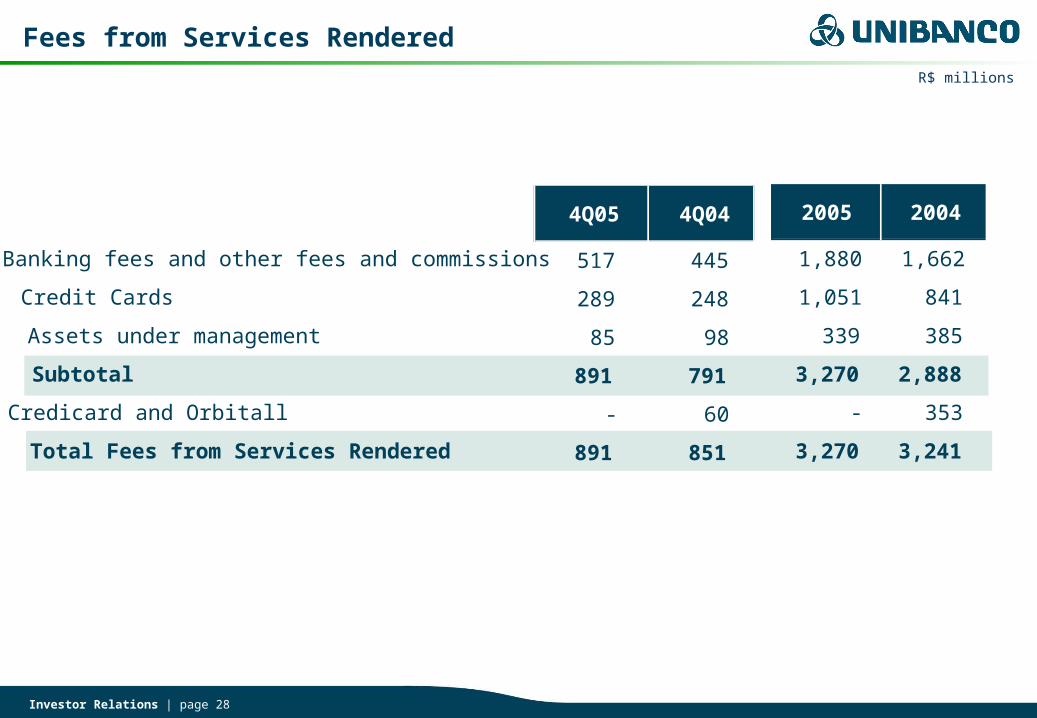
-
4Q05 4Q04
517 445
289 248
85 98
891 791
- 60
891 851
Fees from Services RenderedR$ millions
2005 2004
Banking fees and other fees and commissions 1,880 1,662
Credit Cards 1,051 841
Assets under management 339 385
Subtotal 3,270 2,888
Credicard and Orbitall - 353
Total Fees from Services Rendered 3,270 3,241891 851
Investor Relations | page 29
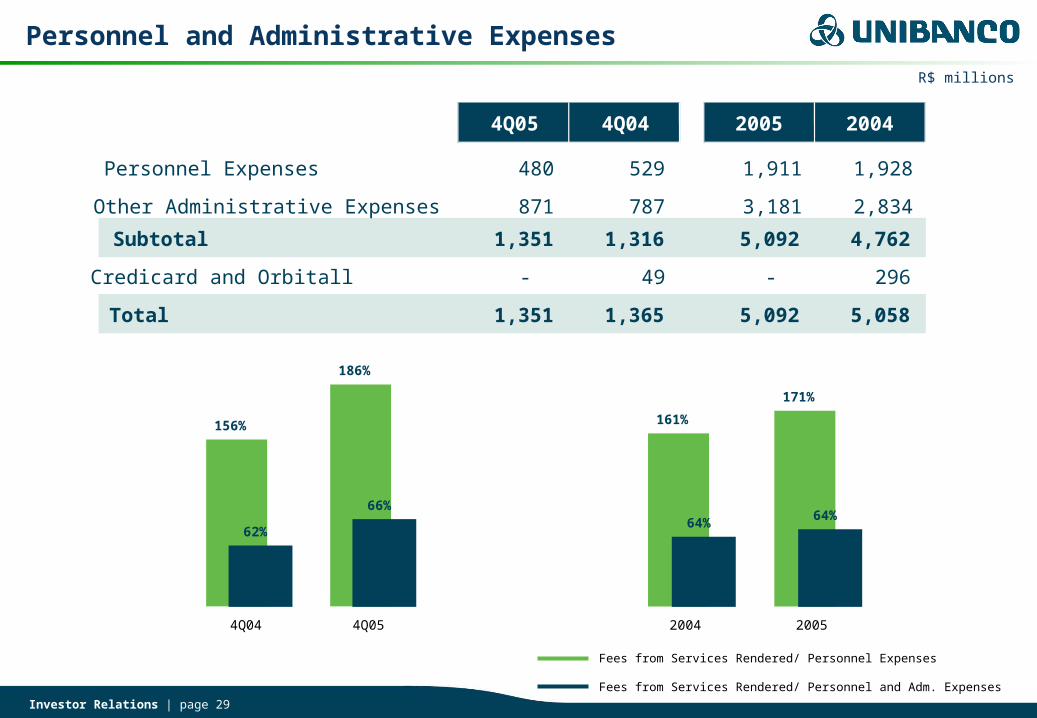
Personnel and Administrative Expenses
Fees from Services Rendered/ Personnel Expenses
Fees from Services Rendered/ Personnel and Adm. Expenses
62%
66%64% 64%
156%
186%
161%
171%
4Q04 4Q05 2004 2005
R$ millions
4Q05 4Q04 2005 2004
Personnel Expenses 480 529 1,911 1,928
Other Administrative Expenses 871 787 3,181 2,834
Subtotal 1,351 1,316 5,092 4,762
Credicard and Orbitall - 49 - 296
Total 1,351 1,365 5,092 5,058
Investor Relations | page 30
2006 Perspectives
Investor Relations | page 31
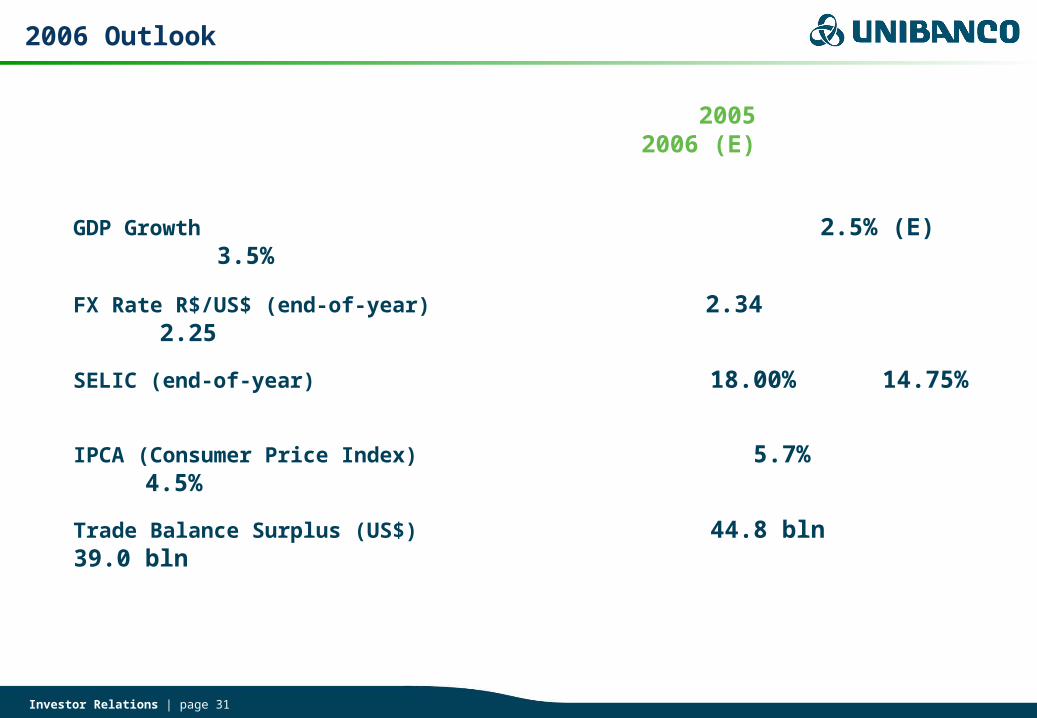
2006 Outlook
2005 2006 (E)
GDP Growth 2.5% (E) 3.5%
FX Rate R$/US$ (end-of-year) 2.34 2.25
SELIC (end-of-year) 18.00% 14.75%
IPCA (Consumer Price Index) 5.7% 4.5%
Trade Balance Surplus (US$) 44.8 bln 39.0 bln
Investor Relations | page 32
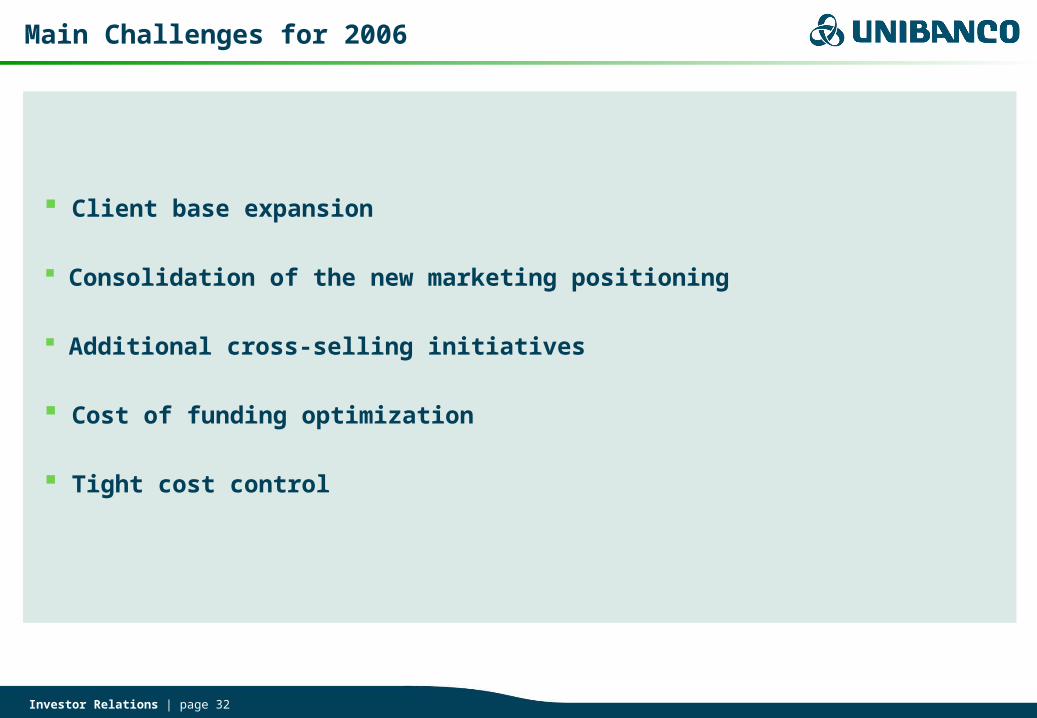
Main Challenges for 2006
Client base expansion
Consolidation of the new marketing positioning
Additional cross-selling initiatives
Cost of funding optimization
Tight cost control
Investor Relations | page 33
For further information contact our Investor Relations Area atphone: 5511-3097-1980
fax: 5511-3097-1585email: [email protected]
site: www.ir.unibanco.com
This presentation contains forward-looking statements regarding Unibanco. its subsidiaries and affiliates - anticipated synergies. growth plans. projected results and future strategies. Although these forward-looking statements reflect management’s good faith beliefs. they involve known and unknown risks and uncertainties that may cause the Company’s actual results or outcomes to be materially different from those anticipated and discussed herein. These risks and uncertainties include. but are not limited to. our ability to realize the amount of the projected synergies and the timetable projected. as well as economic. competitive. governmental and technological factors affecting Unibanco’s operations. markets. products and prices. and other factors detailed in Unibanco’s filings with the Securities and Exchange Commission which readers are urged to read carefully in assessing the forward-looking statements contained herein. Unibanco undertakes no duty to update any of the projections contained herein.
Recommended