
1 | P a g e
University of Rochester
User’s Guide to
URGEMS Ad‐ Hoc Reporting Guide Using IBM Cognos Workspace Advanced, Version 10.2.1
Version 1.0 April, 2016
2 | P a g e
Table of Contents Table of Contents ........................................................................................... Error! Bookmark not defined.
Introduction to the Interface ........................................................................................................................ 3
Choosing a Reporting Source .................................................................................................................... 4
Navigation within Workspace Advanced .................................................................................................. 5
Create an Award………………………………………………………………………………………………………………………………………5
Building the “My Awards” report .............................................................................................................. 8
Adding data fields ................................................................................................................................... 10
Building the “Sample budget to expenses/encumbrance” report ............................................................. 11
Selecting the fields and arranging the layout ......................................................................................... 12
Creating a calculated field ....................................................................................................................... 13
Grouping fields ........................................................................................... Error! Bookmark not defined.
.................................................................................................................................................................... 14
Setting up totaling for columns .............................................................................................................. 14
Setting up filters for restricting results ................................................................................................... 14
Conditional Filtering ................................................................................................................................ 16
3 | P a g e
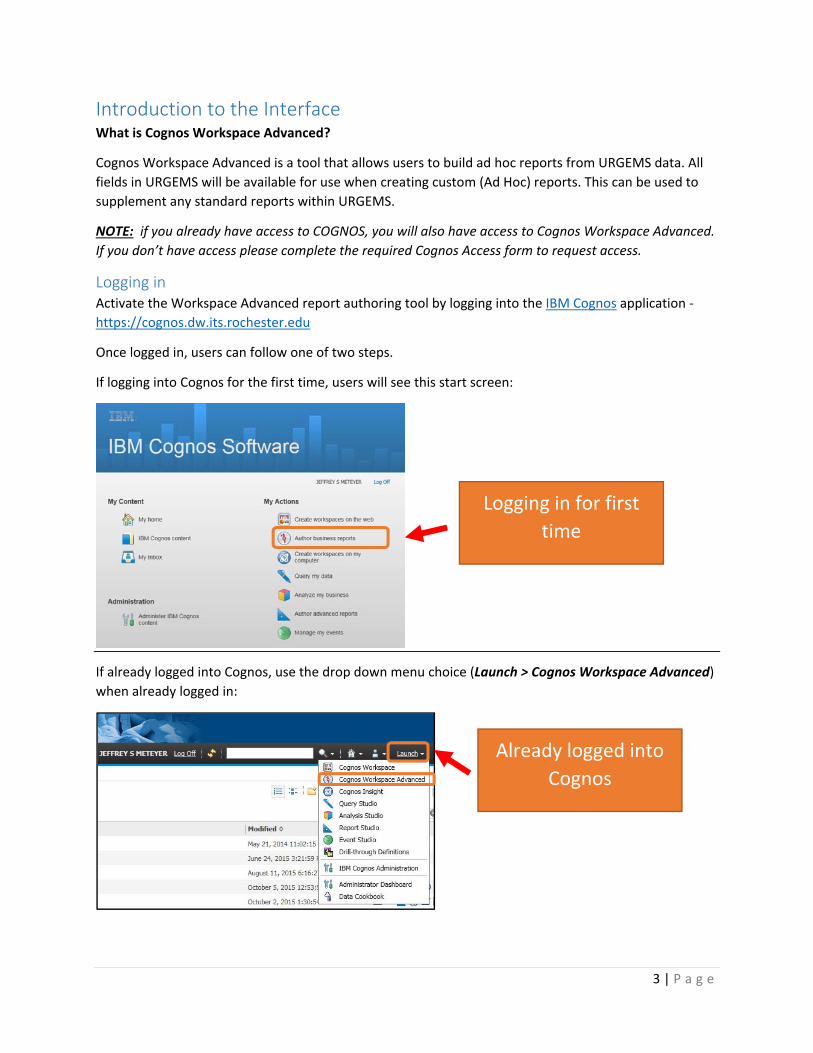
Introduction to the Interface What is Cognos Workspace Advanced?
Cognos Workspace Advanced is a tool that allows users to build ad hoc reports from URGEMS data. All
fields in URGEMS will be available for use when creating custom (Ad Hoc) reports. This can be used to
supplement any standard reports within URGEMS.
NOTE: if you already have access to COGNOS, you will also have access to Cognos Workspace Advanced.
If you don’t have access please complete the required Cognos Access form to request access.
Logging in Activate the Workspace Advanced report authoring tool by logging into the IBM Cognos application ‐
https://cognos.dw.its.rochester.edu
Once logged in, users can follow one of two steps.
If logging into Cognos for the first time, users will see this start screen:
If already logged into Cognos, use the drop down menu choice (Launch > Cognos Workspace Advanced)
when already logged in:
Logging in for first
time
Already logged into
Cognos
4 | P a g e
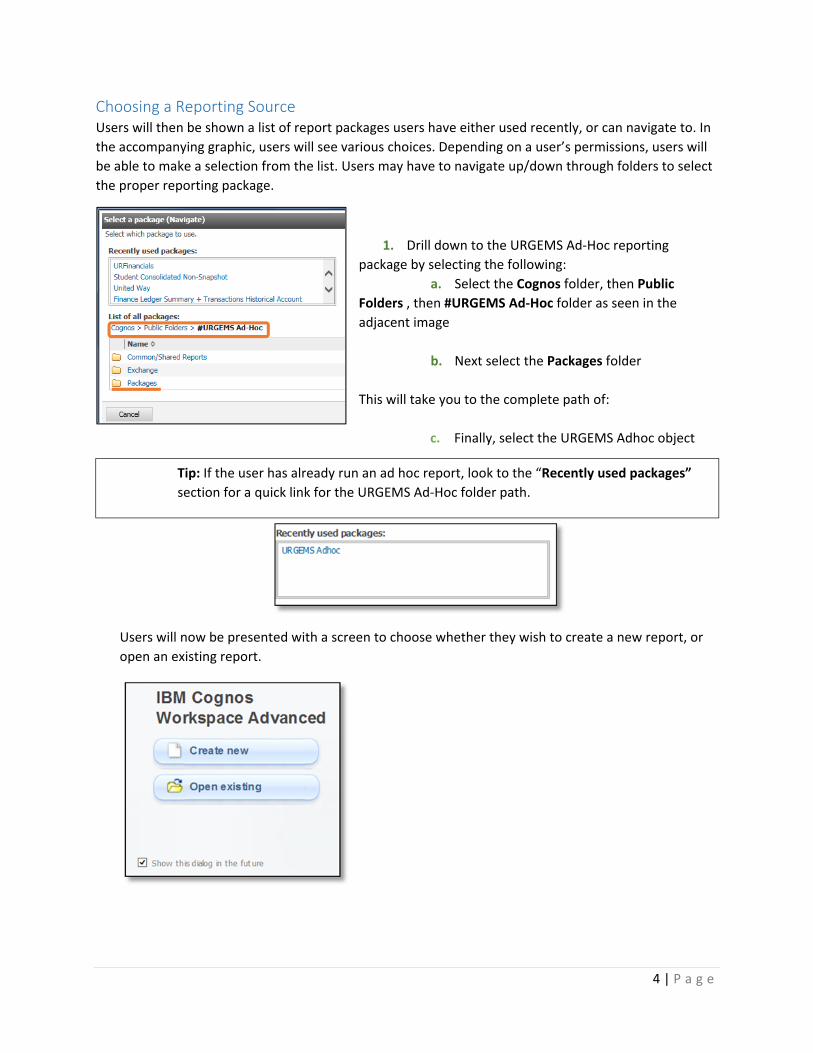
Choosing a Reporting Source Users will then be shown a list of report packages users have either used recently, or can navigate to. In
the accompanying graphic, users will see various choices. Depending on a user’s permissions, users will
be able to make a selection from the list. Users may have to navigate up/down through folders to select
the proper reporting package.
1. Drill down to the URGEMS Ad‐Hoc reporting
package by selecting the following:
a. Select the Cognos folder, then Public
Folders , then #URGEMS Ad‐Hoc folder as seen in the
adjacent image
b. Next select the Packages folder
This will take you to the complete path of:
c. Finally, select the URGEMS Adhoc object
Users will now be presented with a screen to choose whether they wish to create a new report, or
open an existing report.
Tip: If the user has already run an ad hoc report, look to the “Recently used packages”
section for a quick link for the URGEMS Ad‐Hoc folder path.
5 | P a g e
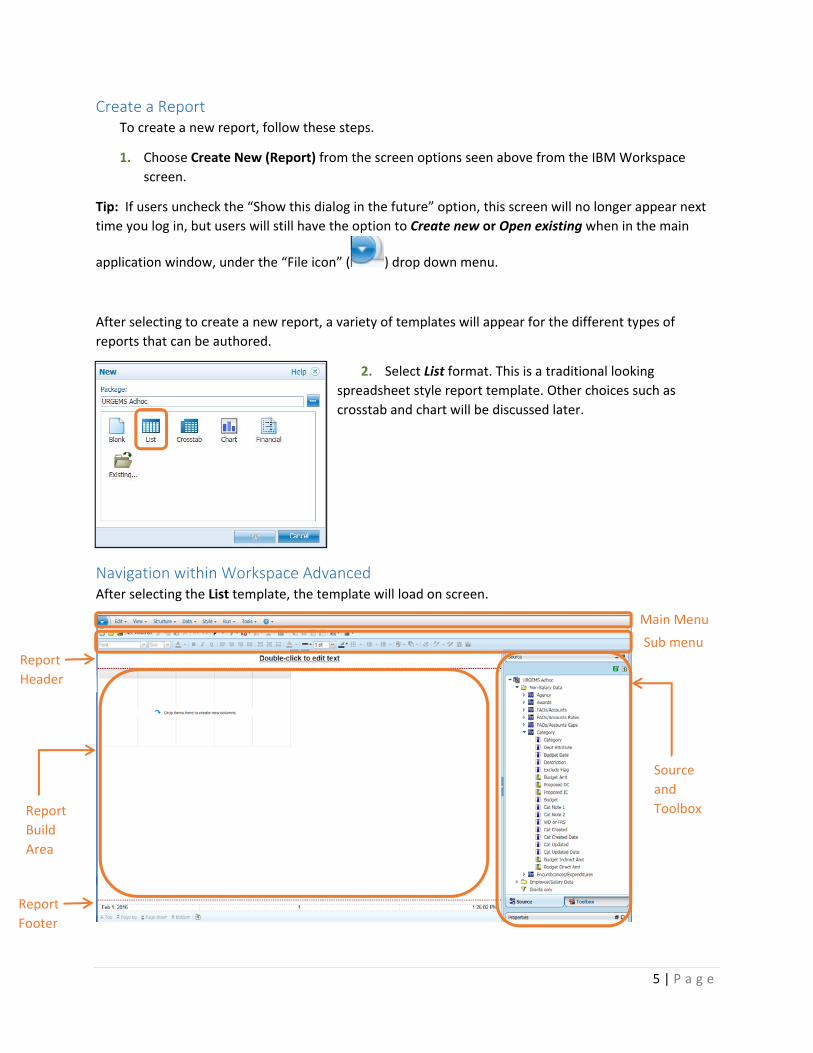
Create a Report To create a new report, follow these steps.
1. Choose Create New (Report) from the screen options seen above from the IBM Workspace
screen.
Tip: If users uncheck the “Show this dialog in the future” option, this screen will no longer appear next
time you log in, but users will still have the option to Create new or Open existing when in the main
application window, under the “File icon” ( ) drop down menu.
After selecting to create a new report, a variety of templates will appear for the different types of
reports that can be authored.
2. Select List format. This is a traditional looking
spreadsheet style report template. Other choices such as
crosstab and chart will be discussed later.
Navigation within Workspace Advanced After selecting the List template, the template will load on screen.
Source
and
Toolbox
Sub menu
Report
Build
Area
Report
Header
Report
Footer
Main Menu
6 | P a g e
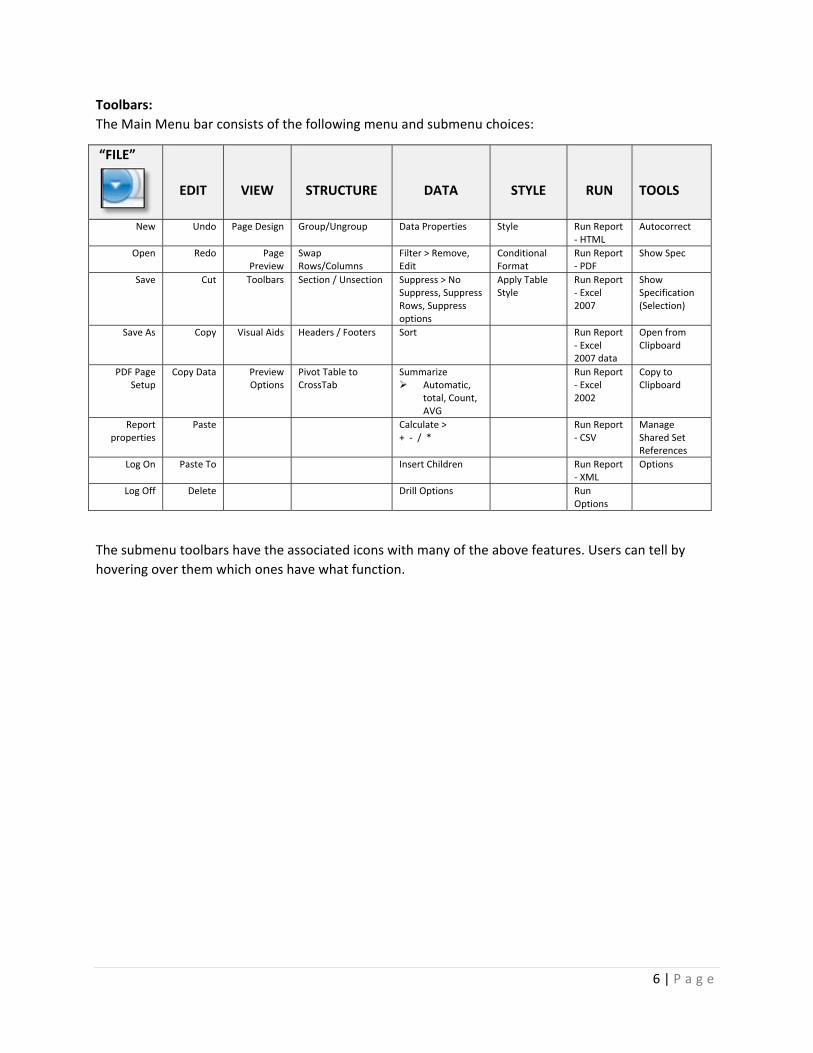
Toolbars:
The Main Menu bar consists of the following menu and submenu choices:
“FILE”
EDIT
VIEW
STRUCTURE
DATA
STYLE
RUN
TOOLS
New Undo Page Design Group/Ungroup Data Properties Style Run Report ‐ HTML
Autocorrect
Open Redo Page Preview
Swap Rows/Columns
Filter > Remove, Edit
Conditional Format
Run Report ‐ PDF
Show Spec
Save Cut Toolbars Section / Unsection Suppress > No Suppress, Suppress Rows, Suppress options
Apply Table Style
Run Report ‐ Excel 2007
Show Specification (Selection)
Save As Copy Visual Aids Headers / Footers Sort Run Report ‐ Excel 2007 data
Open from Clipboard
PDF Page Setup
Copy Data Preview Options
Pivot Table to CrossTab
Summarize Automatic,
total, Count, AVG
Run Report ‐ Excel 2002
Copy to Clipboard
Report properties
Paste Calculate >+ ‐ / *
Run Report ‐ CSV
Manage Shared Set References
Log On Paste To Insert Children Run Report ‐ XML
Options
Log Off Delete Drill Options Run Options
The submenu toolbars have the associated icons with many of the above features. Users can tell by
hovering over them which ones have what function.
7 | P a g e
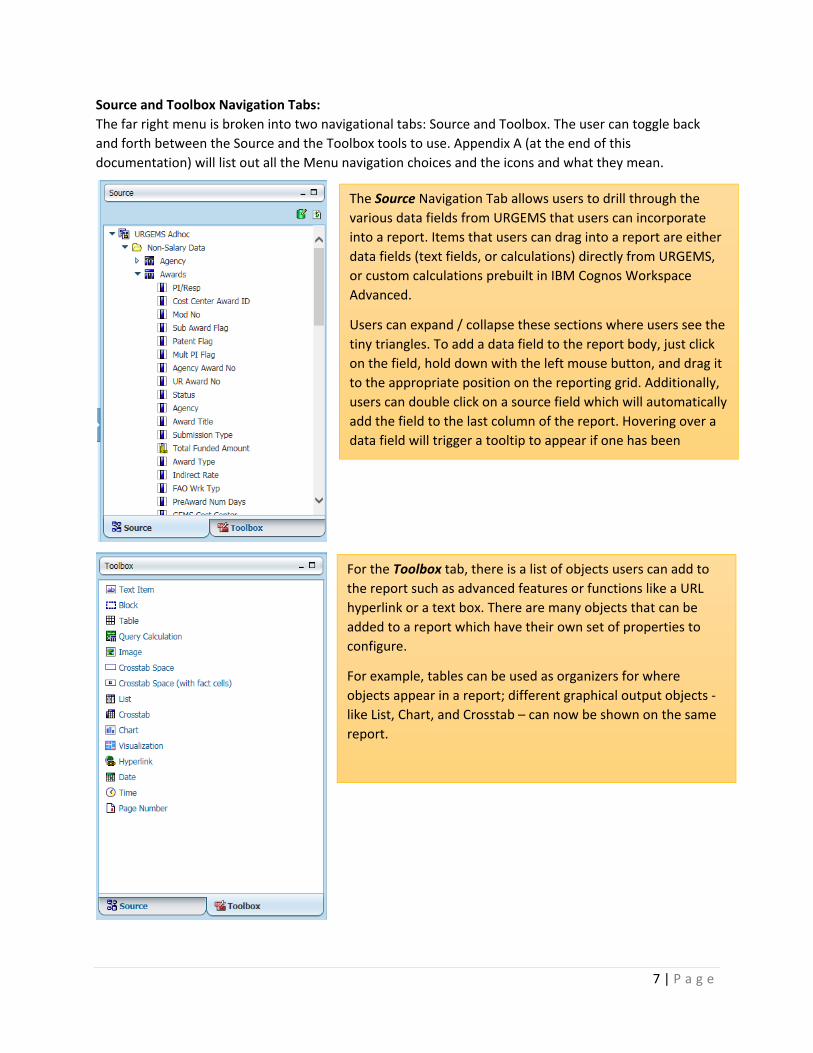
Source and Toolbox Navigation Tabs:
The far right menu is broken into two navigational tabs: Source and Toolbox. The user can toggle back
and forth between the Source and the Toolbox tools to use. Appendix A (at the end of this
documentation) will list out all the Menu navigation choices and the icons and what they mean.
The Source Navigation Tab allows users to drill through the
various data fields from URGEMS that users can incorporate
into a report. Items that users can drag into a report are either
data fields (text fields, or calculations) directly from URGEMS,
or custom calculations prebuilt in IBM Cognos Workspace
Advanced.
Users can expand / collapse these sections where users see the
tiny triangles. To add a data field to the report body, just click
on the field, hold down with the left mouse button, and drag it
to the appropriate position on the reporting grid. Additionally,
users can double click on a source field which will automatically
add the field to the last column of the report. Hovering over a
data field will trigger a tooltip to appear if one has been
For the Toolbox tab, there is a list of objects users can add to
the report such as advanced features or functions like a URL
hyperlink or a text box. There are many objects that can be
added to a report which have their own set of properties to
configure.
For example, tables can be used as organizers for where
objects appear in a report; different graphical output objects ‐
like List, Chart, and Crosstab – can now be shown on the same
report.
8 | P a g e
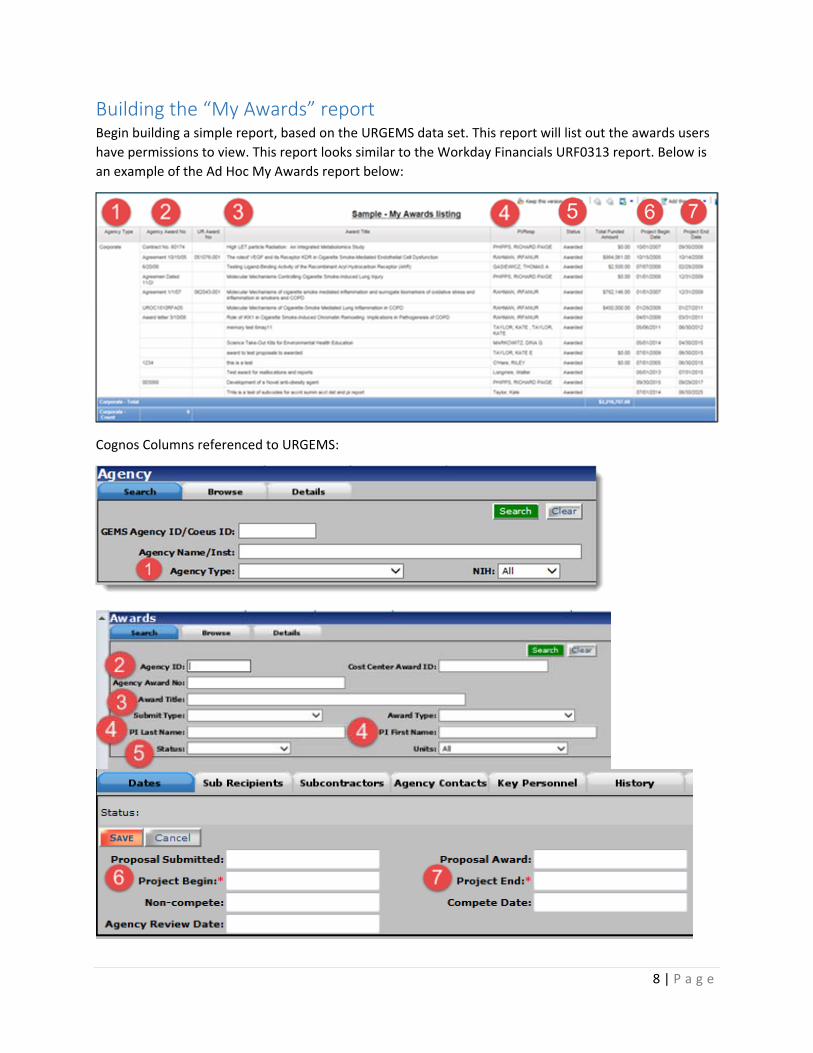
Building the “My Awards” report Begin building a simple report, based on the URGEMS data set. This report will list out the awards users
have permissions to view. This report looks similar to the Workday Financials URF0313 report. Below is
an example of the Ad Hoc My Awards report below:
Cognos Columns referenced to URGEMS:
9 | P a g e
Steps to create the My Awards report: This report will show you general Award information (Award number, title PI on the Award, status,
total funded and Project Begin date). This can be used as the basis for high level Award report.
Open Cognos Workspace Advanced
Select a List report layout
Add fields
Add totals and counts
Save and Print
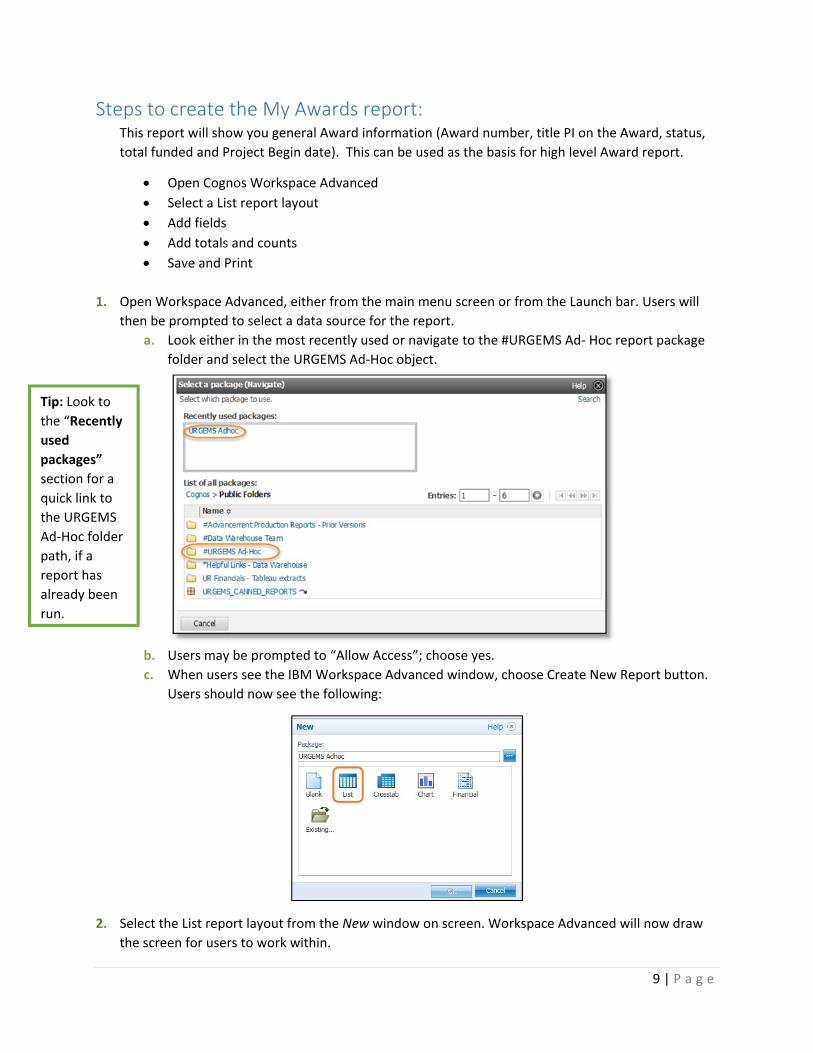
1. Open Workspace Advanced, either from the main menu screen or from the Launch bar. Users will
then be prompted to select a data source for the report.
a. Look either in the most recently used or navigate to the #URGEMS Ad‐ Hoc report package
folder and select the URGEMS Ad‐Hoc object.
b. Users may be prompted to “Allow Access”; choose yes.
c. When users see the IBM Workspace Advanced window, choose Create New Report button.
Users should now see the following:
2. Select the List report layout from the New window on screen. Workspace Advanced will now draw
the screen for users to work within.
Tip: Look to
the “Recently
used
packages”
section for a
quick link to
the URGEMS
Ad‐Hoc folder
path, if a
report has
already been
run.
10 | P a g e
Adding data fields Users can either drag & drop data from the Source navigation tab, or double‐click on fields and they
will append to the last column on the right. Users can drag columns around after for re‐alignment if
so desired.
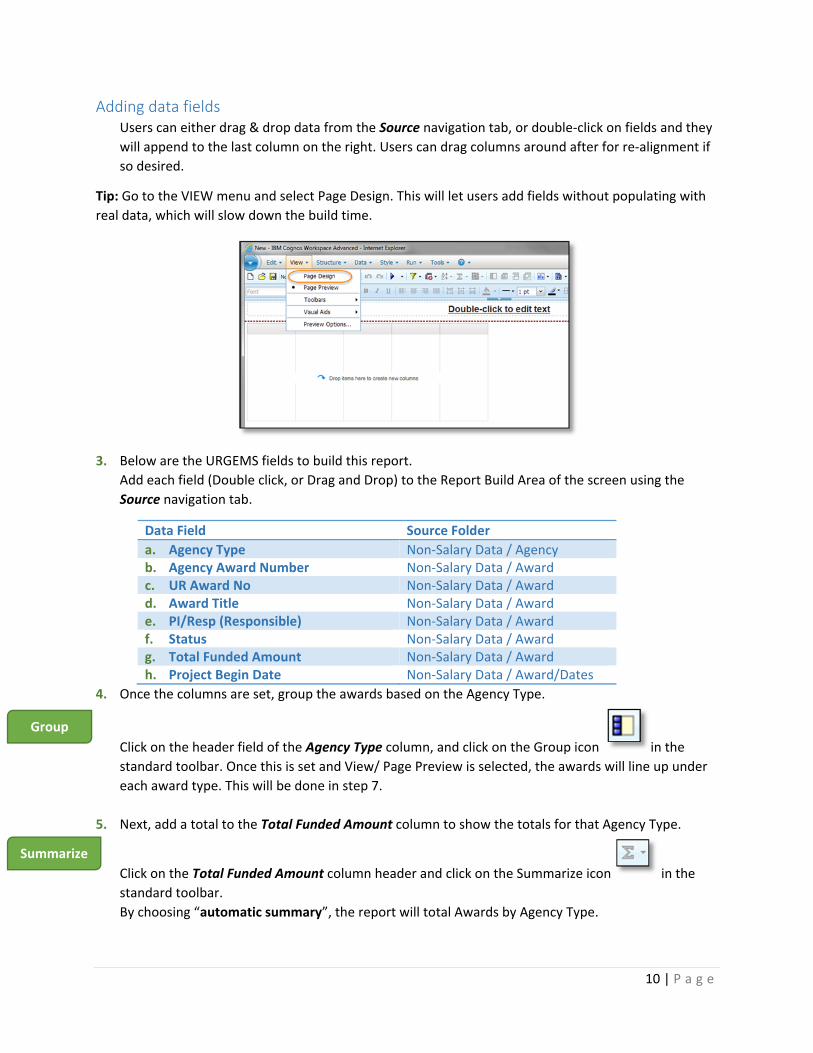
Tip: Go to the VIEW menu and select Page Design. This will let users add fields without populating with
real data, which will slow down the build time.
3. Below are the URGEMS fields to build this report.
Add each field (Double click, or Drag and Drop) to the Report Build Area of the screen using the
Source navigation tab.
Data Field Source Folder
a. Agency Type Non‐Salary Data / Agency b. Agency Award Number Non‐Salary Data / Award c. UR Award No Non‐Salary Data / Award d. Award Title Non‐Salary Data / Award e. PI/Resp (Responsible) Non‐Salary Data / Award f. Status Non‐Salary Data / Award g. Total Funded Amount Non‐Salary Data / Award h. Project Begin Date Non‐Salary Data / Award/Dates
4. Once the columns are set, group the awards based on the Agency Type.
Click on the header field of the Agency Type column, and click on the Group icon in the
standard toolbar. Once this is set and View/ Page Preview is selected, the awards will line up under
each award type. This will be done in step 7.
5. Next, add a total to the Total Funded Amount column to show the totals for that Agency Type.
Click on the Total Funded Amount column header and click on the Summarize icon in the
standard toolbar.
By choosing “automatic summary”, the report will total Awards by Agency Type.
Group
Summarize
11 | P a g e
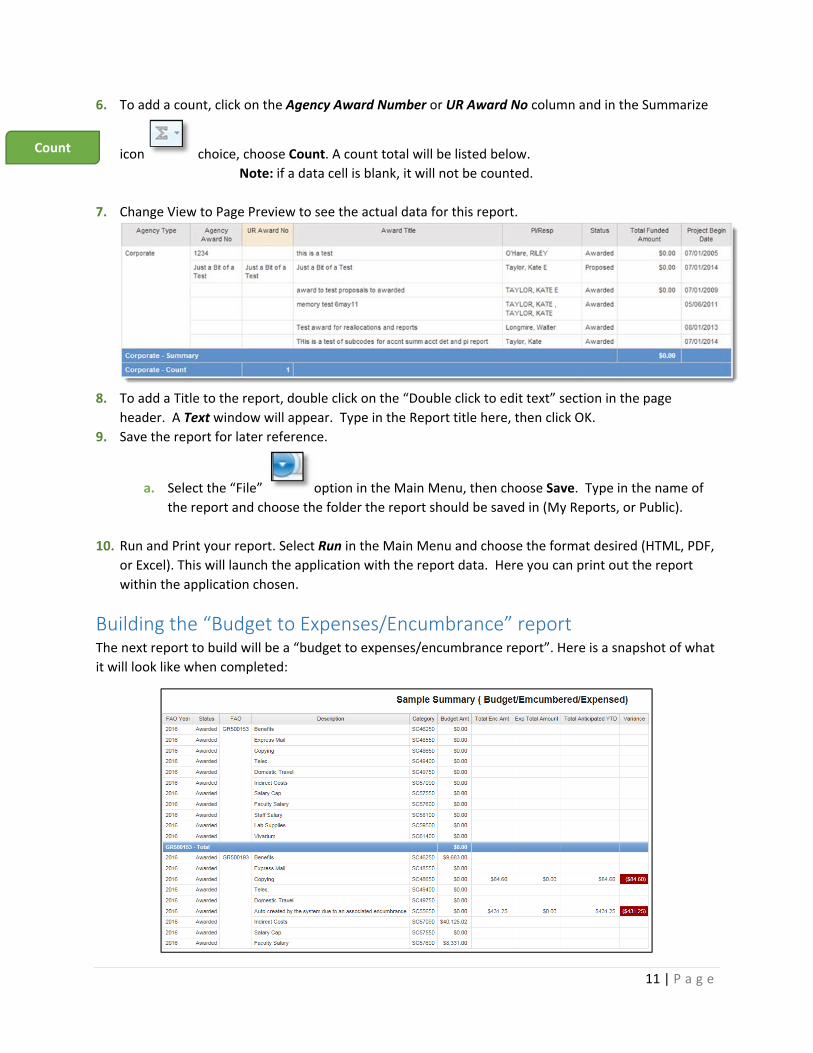
6. To add a count, click on the Agency Award Number or UR Award No column and in the Summarize
icon choice, choose Count. A count total will be listed below.
Note: if a data cell is blank, it will not be counted.
7. Change View to Page Preview to see the actual data for this report.
8. To add a Title to the report, double click on the “Double click to edit text” section in the page
header. A Text window will appear. Type in the Report title here, then click OK.
9. Save the report for later reference.
a. Select the “File” option in the Main Menu, then choose Save. Type in the name of
the report and choose the folder the report should be saved in (My Reports, or Public).
10. Run and Print your report. Select Run in the Main Menu and choose the format desired (HTML, PDF,
or Excel). This will launch the application with the report data. Here you can print out the report
within the application chosen.
Building the “Budget to Expenses/Encumbrance” report The next report to build will be a “budget to expenses/encumbrance report”. Here is a snapshot of what
it will look like when completed:
Count
12 | P a g e
The steps to build this report will be:
Selecting the fields and arranging the layout as above.
Create a calculated field (variance)
Grouping FAO’s and creating automatic summaries ( totals)
Set filters
Add conditional formatting to show where the actuals exceed the budgeted amounts
When users click and drag (or double‐click and append) the fields should be arranged in the order
shown in the sample.
Selecting the fields and arranging the layout 1. Go to the VIEW menu and select View /Page Design. This will let users add fields without
populating with real data, which will slow down user build time. Next, select the following
fields from the respective query subjects:
Data Field Source Folder
a. FAO year FAOs/Accounts b. Status FAOs/Accounts c. FAO FAOs/Accounts d. Description Category e. Category Category f. Budget Amt (Amount) Category g. Total Enc (Encumbered)
Amt (Amount) Encumbrances/Expenditures / Encumbrance
h. Exp (Expense) Total Amount
Encumbrances/Expenditures/ Expenses
i. Variance (to be built later) A calculated field: Budget Amount –Expense Total Amount
13 | P a g e
Creating a calculated field One of the fields to create is a calculated field, as it doesn’t exist as a drop down choice in the reporting
package. It will be named Variance, and the calculation will be the difference between the budgeted and
the expense incurred amount.
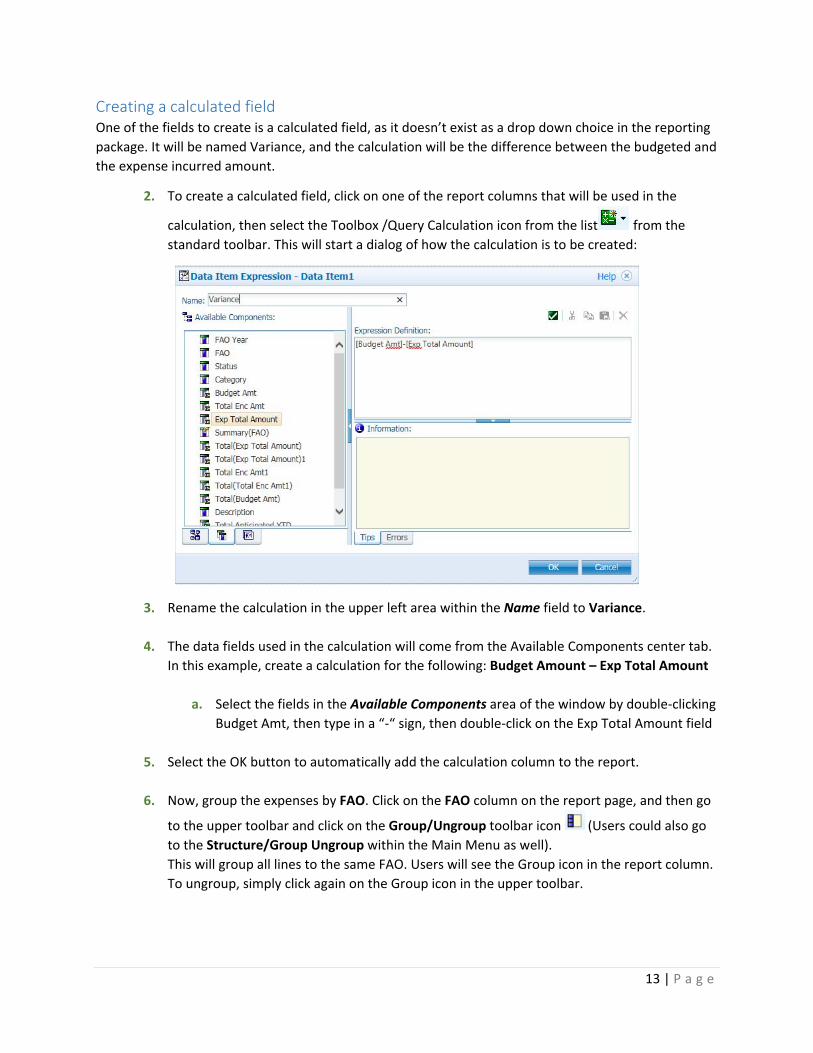
2. To create a calculated field, click on one of the report columns that will be used in the
calculation, then select the Toolbox /Query Calculation icon from the list from the
standard toolbar. This will start a dialog of how the calculation is to be created:
3. Rename the calculation in the upper left area within the Name field to Variance.
4. The data fields used in the calculation will come from the Available Components center tab.
In this example, create a calculation for the following: Budget Amount – Exp Total Amount
a. Select the fields in the Available Components area of the window by double‐clicking
Budget Amt, then type in a “‐“ sign, then double‐click on the Exp Total Amount field
5. Select the OK button to automatically add the calculation column to the report.
6. Now, group the expenses by FAO. Click on the FAO column on the report page, and then go
to the upper toolbar and click on the Group/Ungroup toolbar icon (Users could also go
to the Structure/Group Ungroup within the Main Menu as well).
This will group all lines to the same FAO. Users will see the Group icon in the report column.
To ungroup, simply click again on the Group icon in the upper toolbar.
14 | P a g e
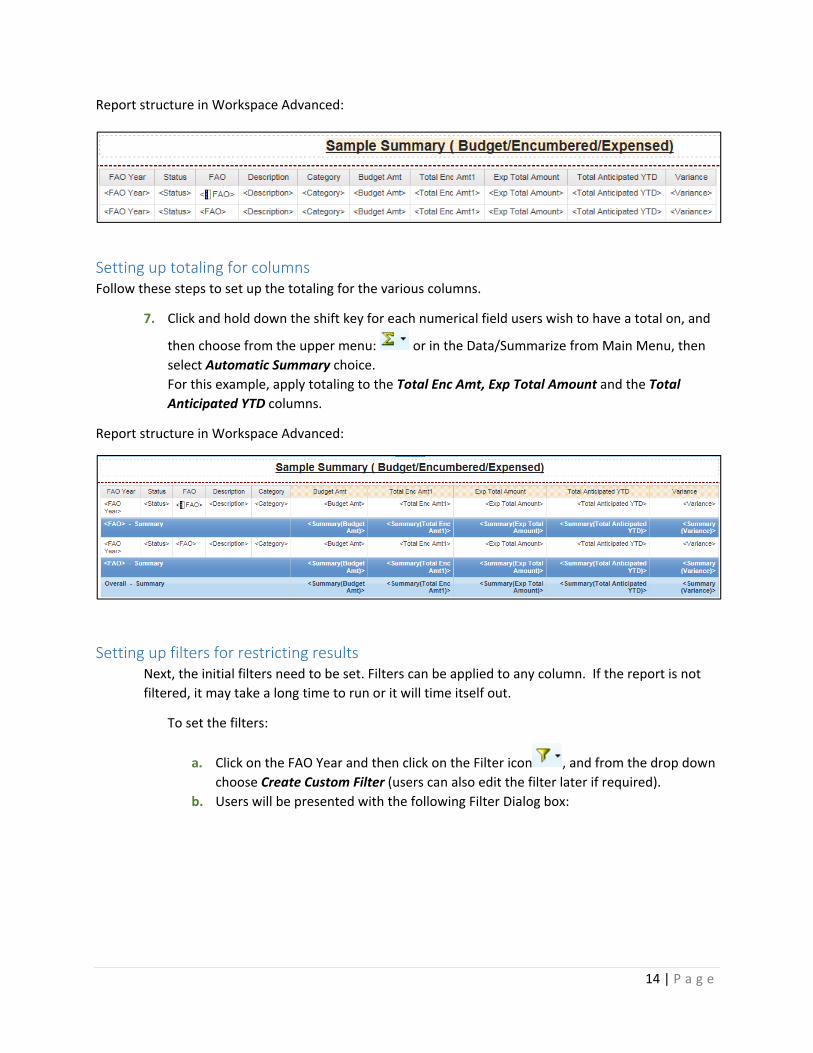
Report structure in Workspace Advanced:
Setting up totaling for columns Follow these steps to set up the totaling for the various columns.
7. Click and hold down the shift key for each numerical field users wish to have a total on, and
then choose from the upper menu: or in the Data/Summarize from Main Menu, then
select Automatic Summary choice.
For this example, apply totaling to the Total Enc Amt, Exp Total Amount and the Total
Anticipated YTD columns.
Report structure in Workspace Advanced:
Setting up filters for restricting results Next, the initial filters need to be set. Filters can be applied to any column. If the report is not
filtered, it may take a long time to run or it will time itself out.
To set the filters:
a. Click on the FAO Year and then click on the Filter icon , and from the drop down
choose Create Custom Filter (users can also edit the filter later if required).
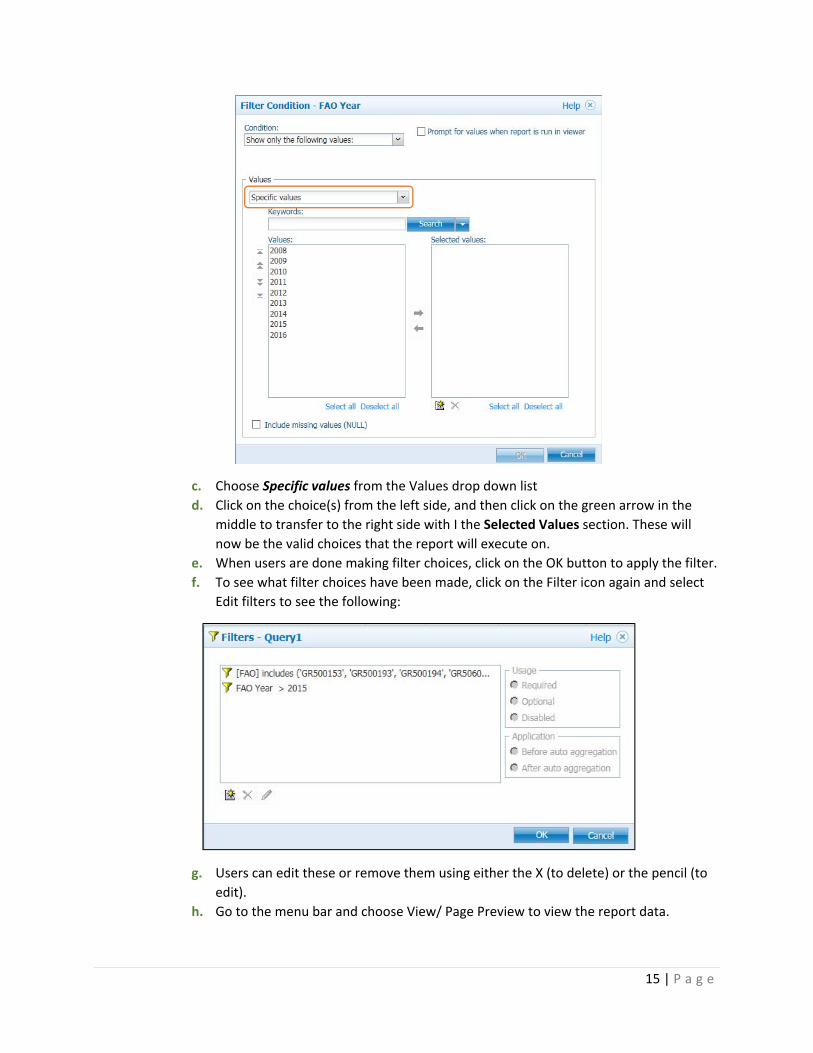
b. Users will be presented with the following Filter Dialog box:
15 | P a g e
c. Choose Specific values from the Values drop down list
d. Click on the choice(s) from the left side, and then click on the green arrow in the
middle to transfer to the right side with I the Selected Values section. These will
now be the valid choices that the report will execute on.
e. When users are done making filter choices, click on the OK button to apply the filter.
f. To see what filter choices have been made, click on the Filter icon again and select
Edit filters to see the following:
g. Users can edit these or remove them using either the X (to delete) or the pencil (to
edit).
h. Go to the menu bar and choose View/ Page Preview to view the report data.
16 | P a g e
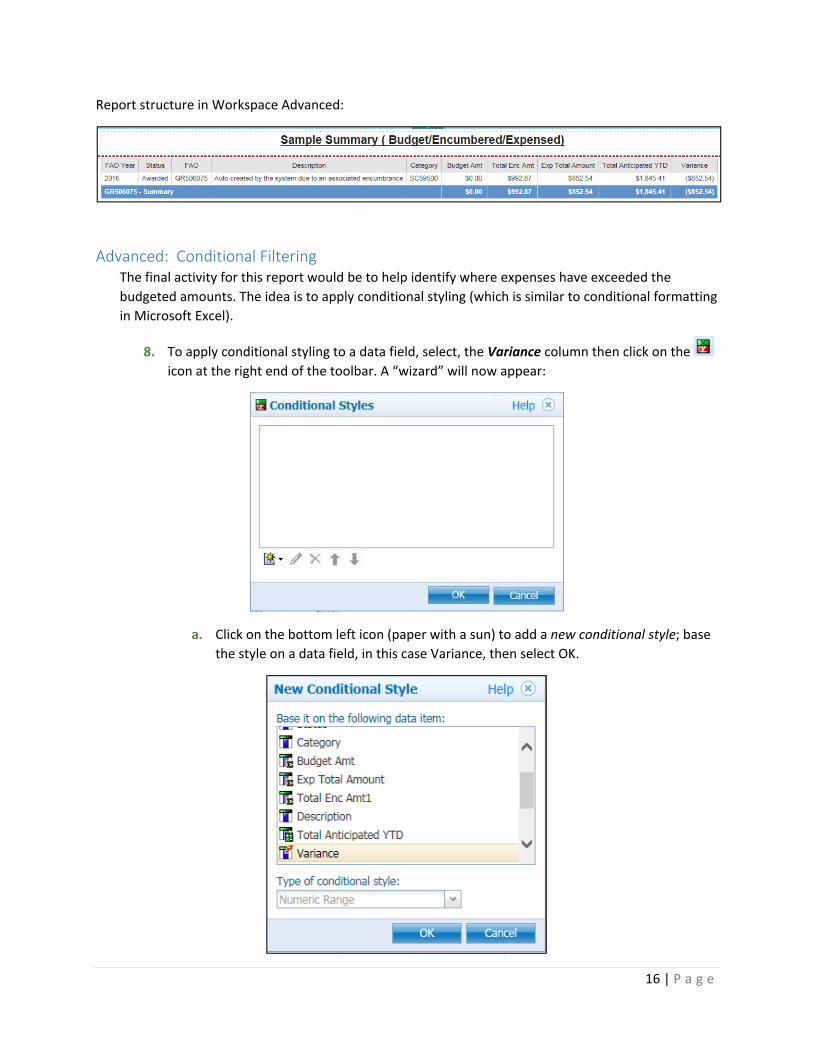
Report structure in Workspace Advanced:
Advanced: Conditional Filtering The final activity for this report would be to help identify where expenses have exceeded the
budgeted amounts. The idea is to apply conditional styling (which is similar to conditional formatting
in Microsoft Excel).
8. To apply conditional styling to a data field, select, the Variance column then click on the
icon at the right end of the toolbar. A “wizard” will now appear:
a. Click on the bottom left icon (paper with a sun) to add a new conditional style; base
the style on a data field, in this case Variance, then select OK.
17 | P a g e
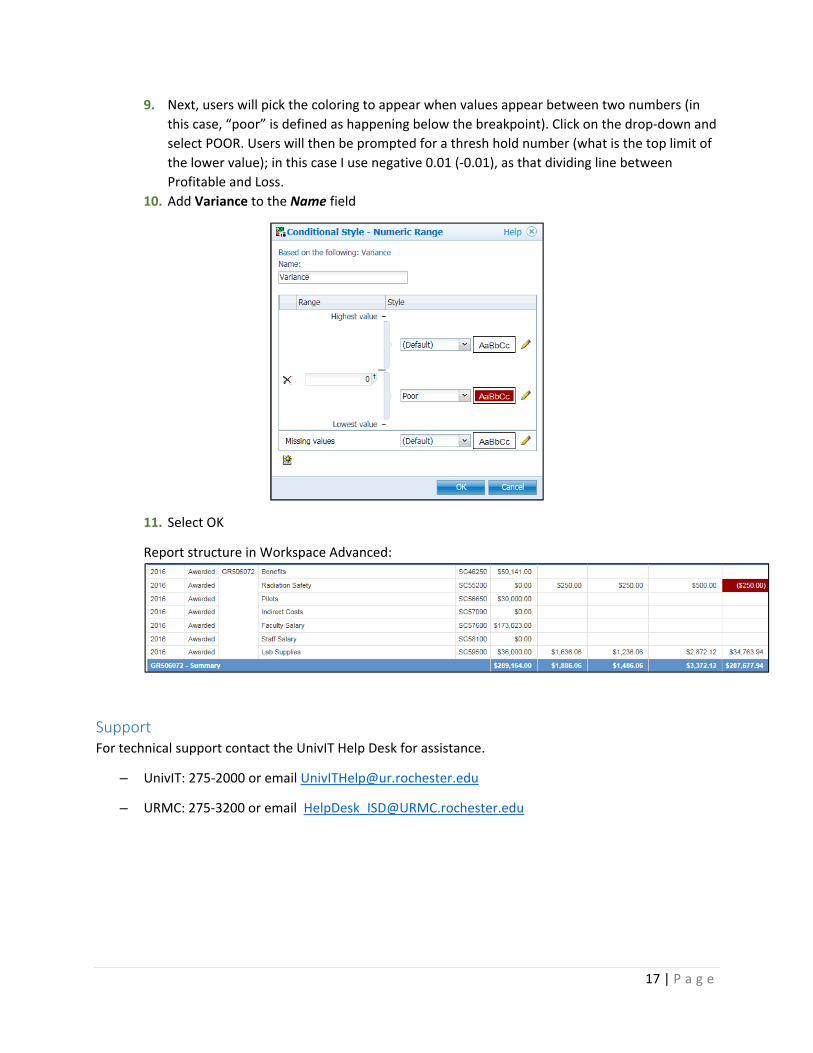
9. Next, users will pick the coloring to appear when values appear between two numbers (in
this case, “poor” is defined as happening below the breakpoint). Click on the drop‐down and
select POOR. Users will then be prompted for a thresh hold number (what is the top limit of
the lower value); in this case I use negative 0.01 (‐0.01), as that dividing line between
Profitable and Loss.
10. Add Variance to the Name field
11. Select OK
Report structure in Workspace Advanced:
Support For technical support contact the UnivIT Help Desk for assistance.
– UnivIT: 275‐2000 or email [email protected]
– URMC: 275‐3200 or email [email protected]
Recommended


![IBM Cognos Workspace Advanced V1022npublic.dhe.ibm.com/software/data/cognos/documentation/docs/zh-c… · Z 7 B Pm.....101 T}]xPVi.....101 Z 8 B /@X5}] .....103 9CX5Fc .....103](https://img.pdfslide.net/doc/110x75/5f7efe30c06b6f370a25c1ff/ibm-cognos-workspace-advanced-z-7-b-pm101-txpvi101-z-8-b-x5-103.jpg)