HEALTH ECONOMICSHealth Econ. 17: 535–543 (2008)Published online 7 November 2007 in Wiley InterScience (www.interscience.wiley.com). DOI: 10.1002/hec.1314
US HEALTH ECONOMISTS: WHO WE ARE AND WHAT WE DO
MICHAEL A. MORRISEYa and JOHN CAWLEYb,*aDepartment of Health Care Organization and Policy, and Lister Hill Center for Health Policy, University of Alabama at
Birmingham, Birmingham, AL, USAbDepartment of Policy Analysis and Management, and Sloan Program in Health Administration, Cornell University,
Ithaca, NY, USA
SUMMARY
This paper reports the results of a Fall 2005 survey of US health economists, the first in over 18 years. Whereappropriate, the results are compared with the earlier findings of Feldman and Morrisey (J. Health Politics PolicyLaw 1990; 15(3):627–646). The paper describes the demographics and training of health economists. It alsodescribes how employers view the substitutability between a Ph.D. in economics and a Ph.D. in health servicesresearch, which is a key question because self-identified health economists increasingly include health servicesresearchers trained in schools of public health or medicine. This study also reports the expectations of various,employers of health economists regarding external grant and contract support. It also reports health economists’perceptions of the processes that allocate resources and recognition: promotion review, journal refereeing, andgrant review. Copyright # 2007 John Wiley & Sons, Ltd.
Received 31 October 2006; Revised 12 August 2007; Accepted 28 September 2007
KEY WORDS: training of health economists; research productivity; labour issues-health economists
INTRODUCTION
Health economics is a relatively new and diverse field of economics. It is a testament to themarketability of health economists’ skills that its practitioners are spread across government, the privatesector, and the academy. Moreover, within the academy health economists can be found in colleges ofarts and sciences, business schools, and schools of public health and medicine. Because of this diversity,it is difficult to observe the demographic characteristics, training, publication strategies, and satisfactionacross the field as a whole.
This paper provides that information, which was collected in a unique survey of US healtheconomists, the first in over 18 years. Where appropriate, the results are compared with theearlier findings of Feldman and Morrisey (1990), which was based on a survey of members of the HealthEconomics Committee of the American Public Health Association and/or the Canadian HealthEconomics Research Organization. This paper describes the demographics and training ofhealth economists. It also describes how employers view the substitutability between a Ph.D. ineconomics and a Ph.D. in health services research, which is a key question because self-identified healtheconomists increasingly include health services researchers trained in schools of public health ormedicine. This study also reports the expectations of various employers of health economists regardingpublications and external grant and contract support. Finally, the paper reports health economists’perceptions of the processes that allocate resources and recognition: promotion review, journalrefereeing, and grant review.
*Correspondence to: Department of Policy Analysis and Management, and Sloan Program in Health Administration, CornellUniversity, 124 MVR Hall, Ithaca, NY 14853, USA. E-mail: [email protected]
Copyright # 2007 John Wiley & Sons, Ltd.
DATA AND METHODS
The survey was developed by the authors with the input and feedback of an advisory committeeconsisting of Roger Feldman (chair), Sharon Arnold, Dick Arnould, Kate Bundorf, Mike Hagan, DaveKnutson, and Kristine Metter. E-mail invitations and two follow-up reminders to take the survey weresent to 1439 unduplicated US members of the International Health Economics Association (IHEA)and/or the Health Economics Interest Group of AcademyHealth.1 While there is overlap inmembership, the survey process prevented dual members from responding more than once. The onlinesurvey was open between 24 October 2005 and 21 November 2005 and was completed by 460respondents, for a response rate of 32%. Out of 460 respondents, 101 considered themselves to beneither a health economist nor an economist who works in health; they were dropped from this analysisleaving 359 self-designated health economist respondents.
The relatively low response rate raises the issue of the generalizability of the findings. The direction ofnon-response bias, if any, is unclear. On the one hand, those with higher opportunity costs of time maybe less likely to respond. On the other hand, those with stronger interest in the survey topic may be morelikely to respond. Non-respondents may have disproportionately been members who considerthemselves to be neither a health economist nor an economist who works in health, and thereforewould have been dropped from the analysis.
Our response rate of 32% is lower than the response rate of 43% for a 2002 survey of health servicesresearchers conducted by AcademyHealth (Resneck and Luft, 2004) and 54% for a 1989 survey of USand Canadian health economists (Feldman and Morrisey, 1990). This decline in response rates by healtheconomists and health services researchers is consistent with the general downward trend in surveyresponse rates since the early 1990s (Biener et al., 2004). Studies have found no impact of the decline inresponse rates on non-response bias (Curtin et al., 2000; Keeter et al., 2000) or the representation ofpopulation subgroups (Biener et al., 2004). To a certain extent, the declining response rates could be aresult of the growth of the field; Feldman and Morrisey (1990) identified 441 likely health economists toinvite to take their survey; we identified more than three times as many: 1439. The growth of the field ofhealth economics may have led more people who work in multiple fields of economics or health to jointhe organizations whose members we invited to participate in the survey, and these people at the marginof the field may have been less likely to respond.
To investigate the extent to which the lower response rate affected the representativeness of oursample, we compare the respondents to our survey to those of Feldman and Morrisey (1990), which hada 54% response rate. It is not a perfect comparison, because the two surveyed different organizations atdifferent stages in the evolution of the field of health economics, but it remains the closest availablecomparison. Feldman and Morrisey (1990) do not report demographic characteristics of their sample,so comparisons are limited to education and employment, but on those dimensions the samples appearcomparable. The percentage with an economics (as opposed to some other) Ph.D. is 72% in the currentsample compared with 84% in the 1989 sample. This difference may be due to increased production ofdoctorates in health services research and health policy rather than to lower response. In both samples,the graduate programs in economics that produced the most respondents included: Wisconsin (#1 inboth surveys), Chicago, Michigan, Yale, Harvard, MIT, and the University of California at Berkeley.The percentage of the sample that works in an economics department is almost identical in the twosamples: 24% in the current sample and 25% in the 1989 sample. Likewise, the percentages working ingovernment are very similar: 12% in the current sample and 14% in the 1989 sample. These
1We acknowledge that certain self-identified health economists may not be members of these professional groups. For example,those in government or at teaching institutions may not have travel budgets that permit them to attend health economicsconferences and as such may be less likely to belong to IHEA or AcademyHealth. Such individuals may be underrepresented inthese data.
M. A. MORRISEY AND J. CAWLEY536
Copyright # 2007 John Wiley & Sons, Ltd. Health Econ. 17: 535–543 (2008)
DOI: 10.1002/hec
comparisons yield no evidence that the decline in response rate from 54% in 1989 to 32% in 2005fundamentally altered which health economists responded.
The survey consisted of 61 questions and was divided into eight parts. The first asked aboutdemographic characteristics. Subsequent sections asked about education and training, employment,how health economists spend their professional time, publications, and their professional experience.Other sections dealt with how much economists earn, their perceptions of policy issues, and researchproductivity; these findings are reported elsewhere (Cawley and Morrisey, 2007, Morrisey and Cawley,2006; Morrisey and Cawley, 2007).
FINDINGS
Demographics
Seventy-two percent of our final sample was self-identified as a health economist and the remaining 28%was self-identified as an economist who works in health. Hereafter, we refer to both groups as healtheconomists. Eighty-five percent of respondents were members of the IHEA and 61% were members ofAcademyHealth. In all, 46.5 percent of respondents were members of both IHEA and AcademyHealth,38.5% were members of IHEA but not AcademyHealth, and 14.4% were members of AcademyHealthbut not IHEA.
Sixty-two percent of respondents were members of the American Economic Association. Reflectingthe diverse nature of the field, 25% were members of the American Public Health Association, 13%were members of the International Society for Pharmacoeconomics and Outcomes Research, and nearly10% were members of the Society for Medical Decision Making and the Association for Public PolicyAnalysis and Management. Over 7% were members of a medical specialty society.
Over 90% of the sample was between the ages of 31 and 60 (37% aged 31–40, 29% aged 41–50, and27% aged 51–60). Nearly 38% of respondents were female. Eighty-eight percent of respondents werewhite and nearly 11% were Asian. African-Americans comprised only 1.3% of respondents. Regardingethnicity (distinct from race), 4.1% were Hispanic or Latino. Nearly 81% of respondents were marriedand 70% were members of dual career couples (which could be married or unmarried). Among the dualcareer couples, 27% were both academics and 10% were both economists. Nearly 59% of respondentsin a dual career couple said their partner’s career made it difficult to relocate.
Education and training
The vast majority of health economists are doctorally trained; 93% had a Ph.D. and another 3% hadanother academic doctorate (e.g. Sc.D.). Small percentages had, in addition to their doctorate, an MD(2.6%), an RN (1%) or a JD degree ð51%Þ: Two percent had a professional degree only and 3% hadonly a masters degree. The number of individuals in the sample with these degrees is very small so ourestimates should be interpreted with caution.
Among those with a Ph.D., nearly 72% have their doctorate in economics. In contrast, Feldman andMorrisey (1990) found that 84% of doctorates were in economics in 1989. The economics departmentsthat trained the most members of our sample are: Wisconsin (16 respondents), Chicago (11), Michiganand Yale (9 each), Harvard, MIT, and the University of Washington (8 each), Maryland and the CityUniversity of New York (7 each), Stanford and the University of California at Berkeley (6 each), andBoston University and Washington University of St Louis (5 each). Collectively, these economicsdepartments trained 48% of the respondents with an economics Ph.D.
Eighteen percent of our sample with a doctorate received it in health services research, health policy,or health systems. Health economists with such training represent an increasing share of the field. Ofhealth economists who received their doctorate before 1995, 81.8% earned it in economics and only
US HEALTH ECONOMISTS: WHO WE ARE AND WHAT WE DO 537
Copyright # 2007 John Wiley & Sons, Ltd. Health Econ. 17: 535–543 (2008)
DOI: 10.1002/hec
8.4% earned it in health services research. Among those who received their doctorates in 1995 or after,60.1% earned it in economics and 27.3% earned it in health services research. When health servicesdoctorates are included with those in economics Harvard is tied for first withWisconsin and the Universityof North Carolina – Chapel Hill joins the list of universities training the most health economists.
Regardless of their type of doctoral degree, 76% of health economists wrote a health-relateddissertation but two-thirds of respondents said their graduate program lacked a formal field in healtheconomics when they were studying for their doctorate.
We asked what types of training are acceptable for new health economist hires in the respondent’sorganization. Specifically, the survey asked: ‘Suppose your department-agency-firm had advertised foran assistant professor or similar professional position in health economics. How likely is your group toconsider the following candidates acceptable?’ Ten different degrees or areas of specialization werelisted and respondents were asked to rate each on a seven-point scale from definitely acceptable todefinitely unacceptable. Table I presents the responses for five of the key degrees/specializations byemployment setting of the respondent.
It is clear that a Ph.D. in economics with a specialization in health economics continues to be themost acceptable training for health economists across all types of employers; 88–100% of respondentssaid that such training would be considered acceptable at their place of employment. However, theacceptability of a health services research degree varies dramatically across employer types. In a schoolof arts and sciences (A&S) only one-third of respondents would find someone with such a degree to belikely acceptable. This was a lower acceptability rating than even a Ph.D. in economics with noexperience in health.
In contrast, respondents in schools of public health and in the private sector reported that a healthservices research degree was more acceptable than any degree except a Ph.D. in economics with a healthspecialization. Moreover, a candidate with a Ph.D. in health services research was more acceptable thana candidate with a Ph.D. in economics, but with no past experience in health in every employmentsetting except a college of A&S.
Employment
Nearly two-thirds (64%) of health economists worked in academia in 2005. Government (the federalgovernment almost exclusively) employed 12%. Nonprofit organizations employed 15% and the for-profit sector employed 9%.
Table I. Acceptable training for a newly hired health economist
Type of employer
Type of candidateArts andsciences
Businessschools
Schoolsof publichealth
Schoolsof medicine Government
Privatesector
Ph.D. in economics, specialization in health economics 88% 97% 96% 94% 100% 94%Ph.D. in economics, interest in health economics 88 86 63 74 91 77Ph.D. in economics, no past experience in health 46 14 8 14 31 28Ph.D. in public policy, health policy,health services research
33 52 82 69 66 85
MD, no other doctoral degree 0 10 10 24 10 43Number responding 33 30 50 35 35 67
Notes: (1) This table presents answers to the question: ‘Suppose your department–agency–firm had advertised for an assistantprofessor or similar professional position in health economics. How likely is your group to consider the following candidatesacceptable?’. (2) Responses are organized in columns by the type of department–agency–firm that employs the respondent. (3) Thevalue in each cell equals the percent responding ‘definitely acceptable,’ ‘very likely acceptable,’ and ‘likely acceptable.’ One minusthis value reflects the percent responding ‘unsure,’ ‘unlikely,’ ‘very unlikely’, and ‘definitely unacceptable’.
M. A. MORRISEY AND J. CAWLEY538
Copyright # 2007 John Wiley & Sons, Ltd. Health Econ. 17: 535–543 (2008)
DOI: 10.1002/hec
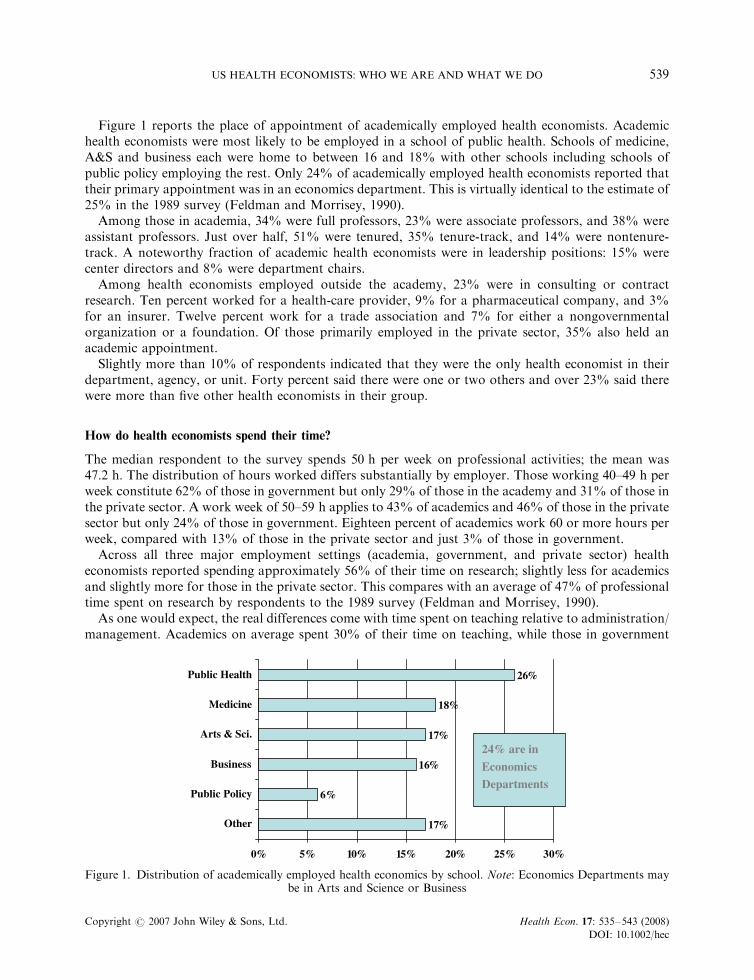
Figure 1 reports the place of appointment of academically employed health economists. Academichealth economists were most likely to be employed in a school of public health. Schools of medicine,A&S and business each were home to between 16 and 18% with other schools including schools ofpublic policy employing the rest. Only 24% of academically employed health economists reported thattheir primary appointment was in an economics department. This is virtually identical to the estimate of25% in the 1989 survey (Feldman and Morrisey, 1990).
Among those in academia, 34% were full professors, 23% were associate professors, and 38% wereassistant professors. Just over half, 51% were tenured, 35% tenure-track, and 14% were nontenure-track. A noteworthy fraction of academic health economists were in leadership positions: 15% werecenter directors and 8% were department chairs.
Among health economists employed outside the academy, 23% were in consulting or contractresearch. Ten percent worked for a health-care provider, 9% for a pharmaceutical company, and 3%for an insurer. Twelve percent work for a trade association and 7% for either a nongovernmentalorganization or a foundation. Of those primarily employed in the private sector, 35% also held anacademic appointment.
Slightly more than 10% of respondents indicated that they were the only health economist in theirdepartment, agency, or unit. Forty percent said there were one or two others and over 23% said therewere more than five other health economists in their group.
How do health economists spend their time?
The median respondent to the survey spends 50 h per week on professional activities; the mean was47:2 h: The distribution of hours worked differs substantially by employer. Those working 40–49 h perweek constitute 62% of those in government but only 29% of those in the academy and 31% of those inthe private sector. A work week of 50–59 h applies to 43% of academics and 46% of those in the privatesector but only 24% of those in government. Eighteen percent of academics work 60 or more hours perweek, compared with 13% of those in the private sector and just 3% of those in government.
Across all three major employment settings (academia, government, and private sector) healtheconomists reported spending approximately 56% of their time on research; slightly less for academicsand slightly more for those in the private sector. This compares with an average of 47% of professionaltime spent on research by respondents to the 1989 survey (Feldman and Morrisey, 1990).
As one would expect, the real differences come with time spent on teaching relative to administration/management. Academics on average spent 30% of their time on teaching, while those in government
17%
6%
16%
17%
18%
26%
0% 5% 10% 15% 20% 25% 30%
Other
Public Policy
Business
Arts & Sci.
Medicine
Public Health
24% are in
Economics
Departments
Figure 1. Distribution of academically employed health economics by school. Note: Economics Departments maybe in Arts and Science or Business
US HEALTH ECONOMISTS: WHO WE ARE AND WHAT WE DO 539
Copyright # 2007 John Wiley & Sons, Ltd. Health Econ. 17: 535–543 (2008)
DOI: 10.1002/hec
and the private sector spent similar percentages on administration/management. However, academichealth economists do little classroom teaching. In the two years prior to the survey (not annual averagebut total teaching in the past two years), the median academic health economist taught oneundergraduate course and two graduate courses. Over 45% taught no undergraduate courses and 22%taught no graduate courses in the past two years. Moreover, 41% served on no doctoral committees; themedian academic served on a single doctoral committee in the preceding two years.
One of the key distinctions between health economists in schools of public health and medicinecompared with those employed elsewhere in academia is the expectation of extramural grant andcontract support. Those in public health and medicine report that they are expected to raise, on average,48.5 and 48.4% of their salaries from external sources; the average across those elsewhere in academiawas 13.8%. Expectations were more than fulfilled. Based upon the last three years experience, thoseemployed in public health and medicine reported covering 62.2 and 61.2% of their salaries, respectively,from grants or contracts. The median in both types of schools was 70%. Among health economists inacademic positions outside of schools of public health and medicine, the average percentage of salarycovered was 23.8% and the median was 10.5%. Roughly 38% of academic health economists outside ofschools of public health and medicine cover 0% of their salary through external grants.
More than 40% of all health economists reported being the principal investigator (PI) on a fundedgrant or contract at the time of the survey. Just over half of these (53%) had private foundationsupport. Thirty-four percent had funding from the National Institutes of Health (NIH) and 18%reported being the PI on grants/contracts from the Agency for Healthcare Research and Quality(AHRQ) and 18% from private industry. Only 5% reported being the PI on a grant from the NationalScience Foundation (NSF). The percentages total more than 100 because individuals may be the PI ongrants or contracts from more than one funding source.
Research interests
Respondents indicated that, on average, over 79% of their research effort was spent on healtheconomics; 45% indicated that all of their efforts were in the field (recall that our sample is conditionalon self-identifying as either a health economist or an economist who works in health).
Health economics has its roots in the fields of labor economics, industrial organization, publicfinance, insurance, and cost–benefit analysis. We asked respondents to identify their subspecialties inhealth economics, defined as: behavior of individuals (e.g. health economics based on labor economics),behavior of firms (e.g. health economics based on industrial organization), government policies (e.g.health economics based on public finance), health insurance, or outcomes research (including costeffectiveness analysis, cost–benefit analysis, and burden of illness). As Table II indicates, all of thesesubfields are well represented. Half of all respondents do research in each of the following areas:behavior of individuals, government policies, and outcomes research, and nearly half work in the area
Table II. Subspecialization among health economists
Subspecialty Percent
Your subspecialty in health economics is (check all that apply)Behavior of individuals (e.g. health economics based on labor economics) 50Behavior of firms (e.g. health economics based on industrial organization) 34Government policies (e.g. health economics based on public finance) 50Health insurance 48Outcomes research (including CEA, CBA, burden of illness)n 50Other 31
nCEA and CBA stand for cost-effectiveness analysis and cost–benefit analysis, respectively.
M. A. MORRISEY AND J. CAWLEY540
Copyright # 2007 John Wiley & Sons, Ltd. Health Econ. 17: 535–543 (2008)
DOI: 10.1002/hec
of health insurance. Closer to one-third study the behavior of firms or some other topic. Specializationin one of these subfields is the exception rather than the rule; three-quarters of respondents say theywork in more than one of these areas. Specialization is most common in outcomes research; 9.9% ofrespondents say they do research only in that area but less than 5% of the sample work exclusively inany other area. Given the breadth of these subfields, it is not surprising that only 3.1% state that they doresearch in all of these areas.
Perceptions of professional life
Finally, the survey asked a series of questions regarding satisfaction with the peer-review processes thatallocate resources and recognition. These results are summarized in Table III.
In general, two-thirds of health economists were satisfied with the review process used to select papersfor inclusion in health economics conferences, half were satisfied with the review processes at healtheconomics journals, and less than half were satisfied with the review process for grants by foundationsand government. Large percentages (22–38%) report that they do not know or are unsure about theirsatisfaction with these peer-review processes. It is unclear whether the levels of dissatisfaction (11–27%)reflect flaws in the systems or simply reflect the probabilities of success in seeking to present, publish,and be funded.
The Health Insurance Portability and Accountability Act (HIPAA) was enacted in 1996 and providedgreater protections to patients with respect to the use of their health-care data. Over the same perioduniversities and other research organizations have arguably broadened the application of the humansubjects review processes they employ. Approximately half of health economists responding agreed thatHIPAA (50%) and human subjects requirements (46%) had made it more difficult to do their research.
The work environment in universities and research organizations is sometimes described as a set of‘silos’ – individuals working in relative isolation. Because health economists can be found in a variety ofunits we asked health economists whether they found it easy to collaborate across units. Over 60%agreed that across-unit collaboration was easy, but one-quarter indicated that it was difficult at theirinstitution.
Given that health economists are found in a variety of multidisciplinary settings with differingexpectations, we asked respondents whether promotion was harder for health economists than for thosein other disciplines or economists in other fields. Forty-five percent disagreed with this statement, 26%agreed and nearly one-third said they did not know or were unsure.
Given that more than three quarters of academic health economists are employed outside ofeconomics departments, and are therefore in interdisciplinary environments (as are those in the privatesector and government), promotion processes may not be able to judge quality of publications and mayinstead rely on quantity. A corollary to this is that multiple authorship (with the assumption of greaternumbers of total papers) may enhance the likelihood of promotion. However, a majority (54%) ofhealth economists reported that quality of publications and fewer coauthors were preferred in theirpromotion processes. However, a substantial minority (26–29%) indicated that quantity and multipleauthorship might be a better strategy for promotion.
All grants and contracts are not created equal. Many federal awards pay both direct costs andindirect costs. Direct costs are the marginal costs of the funded research. Indirect costs coverinstitutional overhead costs and are negotiated with the sponsor. Federal agencies typically pay indirectcosts equal to 40–80% of direct costs. In contrast, private foundations and state government agenciesusually pay a much smaller indirect cost rate, perhaps 10%. It has been argued that universities andresearch organizations encourage their researchers to seek funding from sources that pay full (i.e.federal government) indirect cost rates. Thirty-nine percent of respondents indicated that they werepressured to bring in grants/contracts that paid full indirects, while 46% said they were not.
US HEALTH ECONOMISTS: WHO WE ARE AND WHAT WE DO 541
Copyright # 2007 John Wiley & Sons, Ltd. Health Econ. 17: 535–543 (2008)
DOI: 10.1002/hec

TableIII.
Perceptionsofprofessionallife
Agreeorstrongly
agree
Donotknow
or
unsure
Disagreeor
strongly
disagree
Number
responding
Peer-review
processes
Overall,Iam
satisfied
withthereview
process
forpapersconsidered
forinclusionathealth
economicsconferences
67%
22%
11%
287
Overall,Iam
satisfied
withthereview
process
athealtheconomicsjournals
50
27
23
287
Overall,Iam
satisfied
withthereview
process
forfoundationgrants
andcontracts
48
38
15
285
Overall,Iam
satisfied
withthereview
process
forfederalgrants
andcontracts
43
30
27
287
Researchconstraints
HIPAA
privacy
regulationshavemadeitmore
difficultto
domyresearch
50
20
29
281
Humansubjectsrequirem
ents
havemadeitmore
difficultto
domyresearch
46
21
33
284
Employmentenvironment
Itiseasy
tocollaborate
across
departments
andunitsatthisinstitution
61
15
25
282
Itismore
difficultforhealtheconomiststo
bepromotedortenuredatmyinstitutionthanit
isforthose
inother
disciplines/specialties
26
30
45
284
Thequality
ofpublicationscounts
more
forpromotionandtenure
atmyinstitutionthan
does
thequantity
ofpublications
54
17
29
284
Being
oneoftw
oauthors
on
apaper
counts
more
forpromotion
and
tenure
atmy
institutionthandoes
beingoneoffiveauthors
55
19
26
282
Iam
pressuredto
bringin
grants/contractsthatcover
thefullindirectrate
atmyinstitution
39
14
46
283
Overall,Iam
satisfied
withmycurrentem
ployment
86
77
284
M. A. MORRISEY AND J. CAWLEY542
Copyright # 2007 John Wiley & Sons, Ltd. Health Econ. 17: 535–543 (2008)
DOI: 10.1002/hec
We conclude on a happy note. Over 85% of respondents indicated that they were satisfied with theircurrent employment, and only 21% thought there was a greater than 50% chance that they would beemployed by another organization within three years.
These results should be interpreted in light of the 32% response rate to the survey, which suggestssome caution when generalizing to the universe of US health economists. That said, we believe thatthere is important and interesting information in the data from this survey, the first of US healtheconomists since 1989.
An important extension of this research would be to conduct a similar survey of health economistsoutside of the US. Results from such a survey would yield a better appreciation of the diversity andvariety of health economists, their employment conditions, and their research efforts.
ACKNOWLEDGEMENTS
An earlier version of this paper was presented at the first meeting of the American Society of HealthEconomists, Madison, WI, 6 June 2006. We thank the advisory committee that helped formulate thesurvey of US Health Economists: Roger Feldman (chair), Sharon Arnold, Dick Arnould, KateBundorf, Mike Hagan, Dave Knutson, and Kristine Metter. We also thank AcademyHealth and theInternational Health Economics Association for contacting their members and providing logisticalsupport. Finally, we thank all those who responded to the survey.
REFERENCES
Biener L, Garrett CA, Gilpin EA, Roman AM, Currivan DB. 2004. Consequences of declining survey responserates for smoking prevalence estimates. American Journal of Preventive Medicine 27(3): 254–257.
Cawley J, Morrisey MA. 2007. The earnings of U.S. health economists. Journal of Health Economics 26(2): 358–372.
Curtin R, Presser S, Singer E. 2000. The effects of response rate changes on the index of consumer sentiment. PublicOpinion Quarterly 64: 413–428.
Feldman R, Morrisey MA. 1990. Health economics: a report on the field. Journal of Health Politics, Policy and Law15(3): 627–646.
Keeter S, Miller C, Kohut A, Groves RM, Presser S. 2000. Consequences of reducing nonresponse in a NationalTelephone Survey. Public Opinion Quarterly 64: 125–148.
Morrisey MA, Cawley J. 2006. Health economists’ views of health policy. Working Paper, Lister Hill Center forHealth Policy, University of Alabama at Birmingham.
Morrisey MA, Cawley J. 2007. The production of published research by U.S. health economists. Paper Presented atthe International Health Economics 6th World Congress, Copenhagen, Denmark.
Resneck J, Luft H. 2004. How health policy and health services researchers are compensated: analysis of aNationwide Salary Survey. Medical Care Research and Review 61(3): 392–408.
US HEALTH ECONOMISTS: WHO WE ARE AND WHAT WE DO 543
Copyright # 2007 John Wiley & Sons, Ltd. Health Econ. 17: 535–543 (2008)
DOI: 10.1002/hec
Recommended