Vehicle Faulty Lamp and Flasher Identifier
Senior Design Dec05-13
End-Product Design Report
Client Iowa State University
Faculty Advisor
Professor Gary Tuttle
Team Members
Joshua Halbur, CPR E Ramy Henin, CPR E
Deepak Mishra, CPR E Dhaval Patel, EE Faisal Tamin, EE
REPORT DISCLAIMER NOTICE DISCLAIMER: This document was developed as a part of the requirements of an electrical and computer engineering
course at Iowa State University, Ames, Iowa. This document does not constitute a professional engineering design or a professional land surveying document. Although the information is intended to be accurate, the associated students,
faculty, and Iowa State University make no claims, promises, or guarantees about the accuracy, completeness, quality, or adequacy of the information. The user of this document shall ensure that any such use does not violate any laws with regard to professional licensing and certification requirements. This use includes any work resulting from this student-
prepared document that is required to be under the responsible charge of a licensed engineer or surveyor. This document is copyrighted by the students who produced this document and the associated faculty advisors. No part may
be reproduced without the written permission of the senior design course coordinator.
April 8, 2005
Table of Contents LIST OF FIGURES ........................................................................................................................... III LIST OF TABLES ............................................................................................................................IV LIST OF DEFINITIONS ......................................................................................................................V
SECTION 1: INTRODUCTORY MATERIAL................................................................................... 1 1.1 EXECUTIVE SUMMARY ...................................................................................................... 1 1.2 ACKNOWLEDGMENT ......................................................................................................... 1 1.3 PROBLEM STATEMENT...................................................................................................... 1
1.3.1 General Problem Statement ...................................................................................... 1 1.3.2 General Problem Solution.......................................................................................... 2
1.4 OPERATING ENVIRONMENT ............................................................................................... 2 1.5 INTENDED USERS AND USES ............................................................................................. 3
1.5.1 Intended Users........................................................................................................... 3 1.5.2 Intended Uses............................................................................................................ 3
1.6 ASSUMPTIONS AND LIMITATIONS ....................................................................................... 3 1.6.1 Assumptions .............................................................................................................. 3 1.6.2 Limitations.................................................................................................................. 4
1.7 EXPECTED END PRODUCT AND OTHER DELIVERABLES ...................................................... 4 1.7.1 Sensor System........................................................................................................... 4 1.7.2 Control Unit ................................................................................................................ 5 1.7.3 Displaying Device ...................................................................................................... 5 1.7.4 Documentation........................................................................................................... 5
SECTION 2: END PRODUCT DESIGN .......................................................................................... 6 2.1 APPROACH USED ............................................................................................................. 6
2.1.1 Design Objectives ...................................................................................................... 6 2.1.2 Functional Requirements.......................................................................................... 6 2.1.3 Design Constraints..................................................................................................... 7 2.1.4 Technical Approach Considerations and Results...................................................... 7 2.1.5 Testing Approach Considerations............................................................................ 10
2.1.5.1 Individual Systems Testing .......................................................................................10 2.1.5.2 Full System Testing....................................................................................................10 2.1.5.3 Environmental Testing ...............................................................................................11
2.1.6 Recommendations Regarding Project Continuation or Modification ....................... 11 2.2 DETAILED DESIGN .......................................................................................................... 11
2.2.1 Display System ........................................................................................................ 11 2.2.2 Processing System .................................................................................................. 12 2.2.3 Sensor System......................................................................................................... 12
2.2.3.1 Comparator and Resistor Circuit ..............................................................................12 2.2.3.2 Allegro Micro Current Sensor....................................................................................12
2.2.4 Full System .............................................................................................................. 13 2.2.4.1 Self Test Procedure ....................................................................................................13 2.2.4.2 Filament Test Procedure............................................................................................13 2.2.4.3 Flasher Unit Test Procedure ......................................................................................14
SECTION 3: RESOURCES AND SCHEDULES .......................................................................... 16 3.1 RESOURCES REQUIREMENTS .......................................................................................... 16
3.1.1 Personnel Effort Requirements................................................................................ 16 3.1.2 Other Resource Requirements ................................................................................ 17 3.1.3 Financial Requirements ........................................................................................... 17
3.2 SCHEDULES ................................................................................................................... 19 SECTION 4: CLOSURE MATERIAL ............................................................................................ 25
4.1 PROJECT TEAM INFORMATION ........................................................................................ 25 4.2 CLOSING SUMMARY........................................................................................................ 26
i

4.3 APPENDIX A................................................................................................................... 27
ii
List of Figures Figure 1: Top-Level components diagram of the end product .................................. 2 Figure 2: Full system diagram ...................................................................................... 15 Figure 3: Detailed project Gantt chart excluding deliverables ................................ 20 Figure 4: Project Gantt chart for deliverables only.................................................... 21 Figure 5: Comparison Gantt chart for the first half of the project tasks................. 22 Figure 6: Comparison Gantt chart for the second half of the project tasks. ......... 23 Figure 7: Completion percentages for each task. ..................................................... 24 Figure 8: Block Diagram of the LCD ........................................................................... 27 Figure 9: Block diagram for the ACS704 .................................................................... 29
iii
List of Tables Table 1: Original personnel effort requirements........................................................ 16 Table 2: Revised personnel effort requirements ....................................................... 17 Table 3: Original additional resource requirements.................................................. 17 Table 4: Revised additional resource requirements ................................................. 17 Table 5: Original Financial Requirements .................................................................. 18 Table 6: Revised financial requirements .................................................................... 18 Table 7: The 16 I/0 pins of the LCD ............................................................................ 27 Table 8: Tolerances for the LCD and controller ........................................................ 28 Table 9: Electrical characteristics for the LCD and controller ................................. 28 Table 10: ACS704 specifications................................................................................. 30
iv
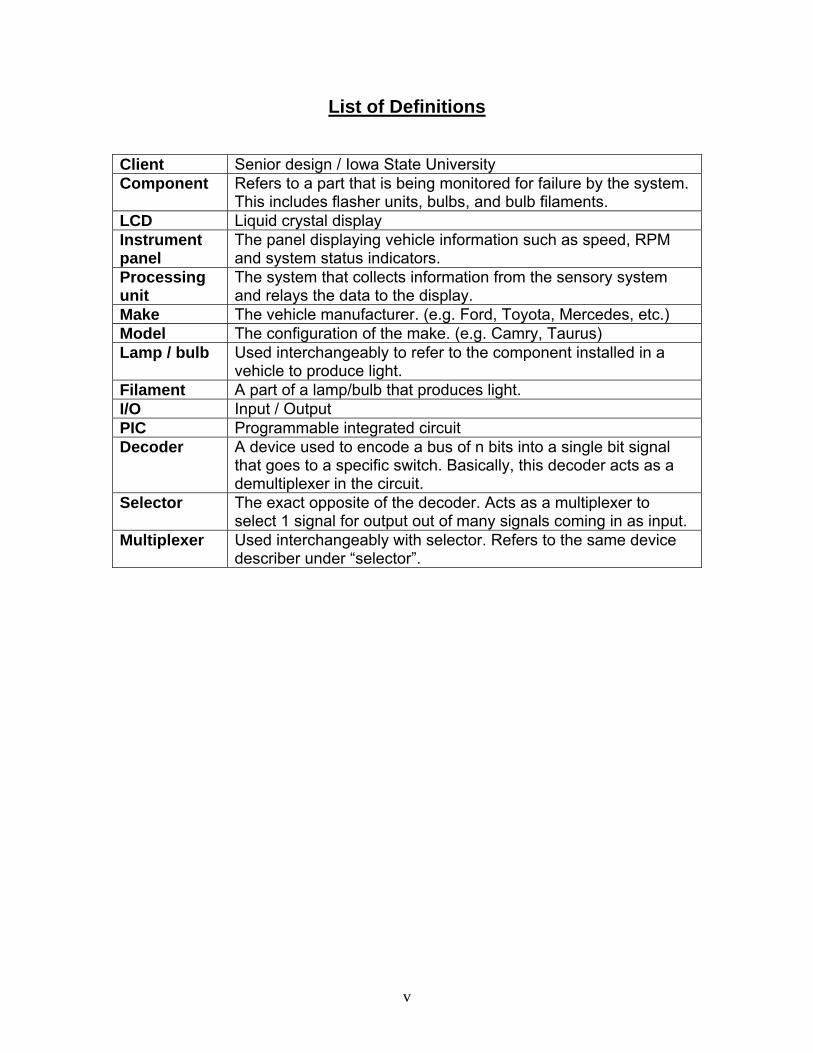
List of Definitions Client Senior design / Iowa State University Component Refers to a part that is being monitored for failure by the system.
This includes flasher units, bulbs, and bulb filaments. LCD Liquid crystal display Instrument panel
The panel displaying vehicle information such as speed, RPM and system status indicators.
Processing unit
The system that collects information from the sensory system and relays the data to the display.
Make The vehicle manufacturer. (e.g. Ford, Toyota, Mercedes, etc.) Model The configuration of the make. (e.g. Camry, Taurus) Lamp / bulb Used interchangeably to refer to the component installed in a
vehicle to produce light. Filament A part of a lamp/bulb that produces light. I/O Input / Output PIC Programmable integrated circuit Decoder A device used to encode a bus of n bits into a single bit signal
that goes to a specific switch. Basically, this decoder acts as a demultiplexer in the circuit.
Selector The exact opposite of the decoder. Acts as a multiplexer to select 1 signal for output out of many signals coming in as input.
Multiplexer Used interchangeably with selector. Refers to the same device describer under “selector”.
v
Section 1: Introductory Material This section will include an introduction to the project including the general problem statement and solution approach, operating environment, intended users and uses as well as the initial assumptions and limitations. 1.1 Executive Summary
The general problem in a vehicle’s faulty lamp detection system is that it is not precise enough to inform the user with the exact details of the failure. The vehicle faulty lamp detection system does not specify which bulb has failed and if there are multiple filaments which have burned out. The best way to solve this problem is to design a system which monitors each individual bulb. The system shall have features such as being able to report if there is a failure in a multiple filament lamp, report if there is a failure in the instrument panel, report multiple failures and clearly delineate each failure and perform self tests. The project shall consist of a design stage, a testing stage and a mock implementation stage to show the functionality of the device. The mock implementation stage shall show if the system works and if it is a feasible system for auto manufacturers.
1.2 Acknowledgment
Professor Tuttle has been an excellent advisor for the team in choosing components and options during this project. He has also provided guidance during the design phase.
1.3 Problem Statement This section discusses the general problem statement and the general problem solution.
1.3.1 General Problem Statement
The general problem for motorists is knowing when an exterior light is faulty. These individuals can be hazardous to themselves and others if other drivers are unable to see a brake light or turn signal due to a burnt-out bulb. Most individuals would be unaware of failed lights because they do not see the exterior lights when they are in use. Many vehicles have a system which lets the user know when a lamp is out, however these systems do not alert the user of multiple lamp failures or flasher failure or where the failure is located. The systems also do not alert the motorist when an instrument panel indicator has failed.
1
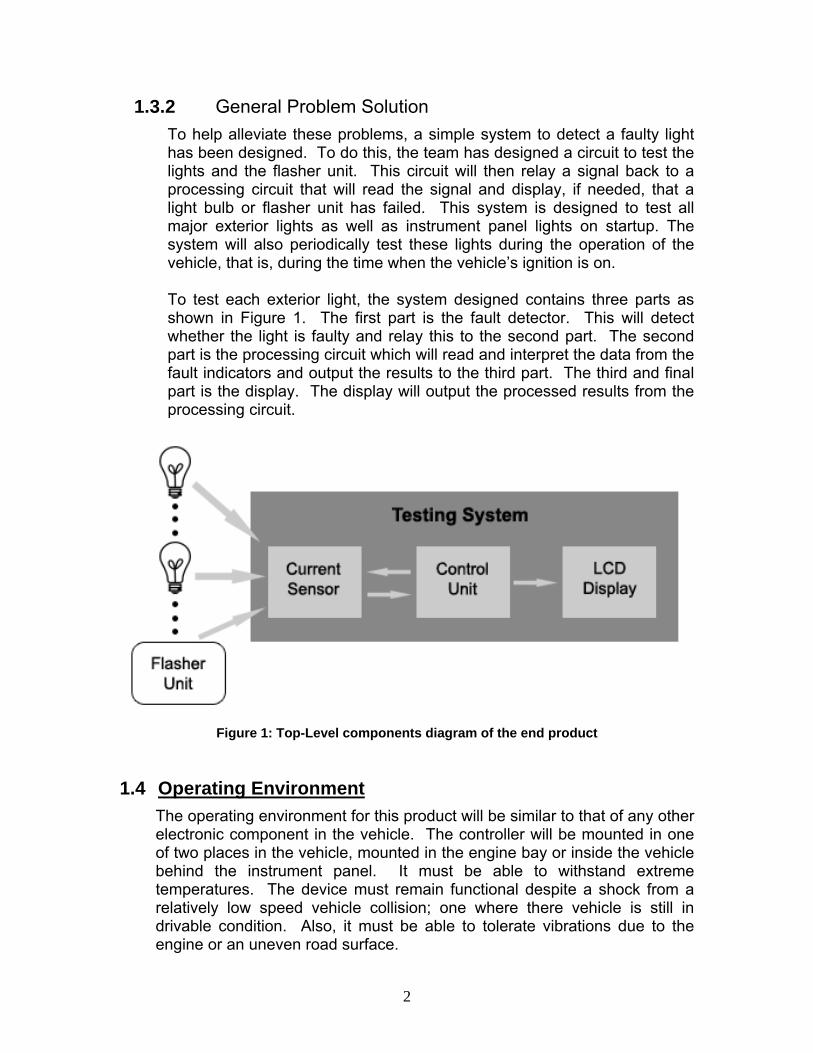
1.3.2 General Problem Solution To help alleviate these problems, a simple system to detect a faulty light has been designed. To do this, the team has designed a circuit to test the lights and the flasher unit. This circuit will then relay a signal back to a processing circuit that will read the signal and display, if needed, that a light bulb or flasher unit has failed. This system is designed to test all major exterior lights as well as instrument panel lights on startup. The system will also periodically test these lights during the operation of the vehicle, that is, during the time when the vehicle’s ignition is on. To test each exterior light, the system designed contains three parts as shown in Figure 1. The first part is the fault detector. This will detect whether the light is faulty and relay this to the second part. The second part is the processing circuit which will read and interpret the data from the fault indicators and output the results to the third part. The third and final part is the display. The display will output the processed results from the processing circuit.
Figure 1: Top-Level components diagram of the end product
1.4 Operating Environment The operating environment for this product will be similar to that of any other electronic component in the vehicle. The controller will be mounted in one of two places in the vehicle, mounted in the engine bay or inside the vehicle behind the instrument panel. It must be able to withstand extreme temperatures. The device must remain functional despite a shock from a relatively low speed vehicle collision; one where there vehicle is still in drivable condition. Also, it must be able to tolerate vibrations due to the engine or an uneven road surface.
2
In the event that it is mounted in the engine bay, it must be able to operate in a polluted environment. In addition to a shock from a vehicle collision, the product must also withstand shocks from any road debris that may get swept up from the road. While it is not intended to operate if immersed in water, the unit must remain operational in harsh weather conditions.
1.5 Intended Users and Uses
This section describes who this product is intended for use by and what those uses are.
1.5.1 Intended Users
The product is intended for use by anyone that is licensed to operate a motor vehicle. There will be an easy to read LCD. This display will show either an alpha-numeric code that the operator can look up in the vehicle’s owners manual or a description of the faulty filament (i.e. “Right front headlamp”). The display will be placed in such a way that the driver can read it with out averting his attention for too long. The illumination for the display will be unobtrusive so as not to distract the driver while operating the vehicle, but should be able get the attention of the driver when a faulty filament is detected.
1.5.2 Intended Uses
The product is designed to detect faulty lamps on the exterior of the vehicle or a faulty indicator in the instrumental panel. The exterior lights are monitored because the driver may be unaware of the functionality of these lights while operating the vehicle. Also, these exterior lights and the indicators in the instrument panel are crucial to the safe operation of the vehicle. Therefore the product should be able to detect and report a faulty filament as quickly as possible.
1.6 Assumptions and Limitations
The two following sections are lists of the assumptions and limitations that are to be planned around.
1.6.1 Assumptions
The following is a listing of the current assumptions.
1. The reporting will be within the vehicle on the instrument panel using an LCD.
3
2. If necessary, the user can cross reference the user manual for complete instructions on how to locate the faulty lamp and ensure the system self-test is fully functional.
3. The system will be designed to be an autonomous system. 4. The system shall be able to monitor up to a maximum of 30 lights 5. The dashboard lights shall be tested on startup. 6. The system self test shall be implemented upon start up only and
shall only test the sensory equipment and controller. 7. The flasher units will only be tested upon turn signal / flash hazard
activation.
1.6.2 Limitations The following are the current limitations provided by the client:
1. The system shall be for a new vehicle, installed during manufacture of the vehicle.
2. The system shall monitor all exterior and instrument panel lamps within the vehicle.
3. The system will report any faulty bulbs. 4. The system shall be able to distinguish a failed flasher unit. 5. The system shall be able to detect and report specific faulty
filaments within multi-filament bulbs. 6. The system shall be able to delineate multiple lamp failures and
report them to the user. 7. The system shall be able to withstand the operating environment
within a vehicle. 8. The system shall have a self test to ensure that it is working
properly. 9. The results shall be displayed to the user until the failures have
been remedied. 10. The system shall be light weight and small enough to fit inside a
motor vehicle. 1.7 Expected End Product and Other Deliverables
There are two expected components to the end product, an indicating device and displaying device.
1.7.1 Sensor System
This is a device that will be installed inside the vehicle. The purpose of this device is to sense when one or more vehicle light bulbs or flasher units have failed. This sensory system will be activated by the controller.
4
1.7.2 Control Unit This device will activate the sensory system, perform a system check, and analyze the received signals to determine if there is a failure. The system shall be able too delineate multiple failures based on input from the sensory system. The system then will output appropriate information to the display.
1.7.3 Displaying Device
This device is an LCD that will be installed in the instrument panel of the vehicle. The purpose of this device is to display messages from the control unit. The screen will be able to display a message to indicate the exact light bulbs or flasher units that have failed. Also, the display should be safe and not disturb the driver.
1.7.4 Documentation The device shall have a user’s manual included with the device. The manual will contain compete instructions on using and maintenance of the system.
5
Section 2: End Product Design The following sections contain detailed descriptions of the product design. 2.1 Approach Used
This section discusses used approach, objectives, and requirements of the project.
2.1.1 Design Objectives
The following is a list of the design objectives for the end product:
• Develop a system that tests for faulty bulbs including multi-filament bulbs in a vehicle.
• Integrate the capability of detecting dysfunctional flasher units. • Design this system such that it can be easily integrated into a
vehicle during manufacturing. The system will use the vehicle’s electrical power system.
• Add an LCD unit to the system to report to the user the exact problem and its location. That is, inform the user of the exact bulb that is burnt out or a problem with a flasher unit. The LCD will also act as a means to report the system status to the user, including self-test and detection process results.
• Integrate a PIC to control the functionality of the testing and current sensing circuits as well as handle the interface with the LCD.
• Implement a self-test protocol by which the system can ensure its own functionality prior to testing of bulbs and flasher units.
• Design this system such that the minimum numbers of components are needed. This will allow the end product cost to be low.
2.1.2 Functional Requirements The following is a list of functions that will be performed by the end product as specified by the client:
• The system will be able to detect faulty bulbs as well as the exact
faulty filament in a multi-filament bulb. The detection process is a sequential process, that is, each bulb or flasher unit is tested separately in a specified order. Fault messages will be displayed only after the completion of the detection process.
• The detection process will be performed periodically only when the vehicle’s ignition is on. During the operation of the vehicle, the system will test all the bulbs and flasher units and display the appropriate messages. This ensures that the user gets informed of a failure within a reasonable amount of time.
6
• This detection system will not interfere with any other system in the vehicle, and will only function autonomously with all other systems to guarantee that no obstruction can exist.
2.1.3 Design Constraints
This following list covers the design constraints for the system.
1. Size - The system will be compact enough to be installed within the vehicle.
2. Durability - The system will be able to withstand the environment within the vehicle.
3. Testing - The system will test all exterior and instrument panel lamps once upon vehicle start up and the exterior lamps every 5 minutes thereafter while the vehicle’s ignition is on. The turn signal and hazard flasher units will only be tested when their corresponding switches are activated for more than 2 seconds. The system will measure the flasher units’ period and compare it with a range of acceptable values. If a flasher unit’s period is out of that range, the system will report a failure. The system will perform a self-test upon vehicle startup to ensure proper operation of the testing circuits and controller.
4. Reporting - The system shall be able to determine the specific component failure and report this malfunction to the driver via an LCD located in the instrument panel. The system shall be able to detect and report multiple failures.
5. Operation - At no point should the testing system interfere with the proper operation of any lamp or flasher unit.
6. Design - The system will have to be calibrated to the vehicle that it is installed in. The system will be designed to test up to 64 components, but will be scaleable with slight software and possibly hardware modifications.
7. User assistance - The vehicle’s users manual will have a section that the user may cross-reference for assistance in locating/remedying the detected failure.
2.1.4 Technical Approach Considerations and Results
This section covers the technology considerations for the three main components (sensors, controller and display) as well as the housing and the results of these considerations.
2.1.4.1 Sensing Technology
Two technologies were considered for testing: light sensing and current sensing.
7
2.1.4.1.1 Light Sensing Light sensing would be fairly easy to implement without any modification to the vehicle’s current wiring. Therefore the system would not affect proper operation of the vehicle’s lights when the testing system is idle or testing the lamps. This type of sensor would render it difficult to detect the specific filament in a multifilament bulb. The flasher units would not be able to be directly tested with this method. A light sensor would be required for each bulb, which would increase costs and potential for a malfunction in the testing system. Also, a light sensor would be subject to external interference (i.e. external light sources) thereby, potentially, skewing test results (i.e. faulty bulb reporting as functioning properly).
2.1.4.1.2 Current Sensing
Current sensing would require the system to be connected in series with the vehicle’s existing wiring for the lights. It must be ensured that the system does not affect proper operation of the vehicle’s lights. This method would easily allow for testing of multiple filaments within a single bulb as well as the flasher units. The design of the testing system can be optimized to use only a single current sensor. This would greatly reduce on cost and excessive components. The current sensor is subject to negligible external interference.
Two options are being considered. The first option is a comparator circuit which measures a voltage across a resistance, as shown in Figure 2. The other option is to use a current sensor which is an Allegro Micro product.
2.1.4.1.3 Result
The current sensor was chosen over the light sensor because it allows for testing of individual filaments of multi-filament lamps, is subject to negligible interference and the design is optimized to require only one current sensor. The current sensor has not been decided upon because of lack of knowledge of the Allegro Micro current sensor chip. Further lab testing will have to be conducted prior to selection of the final design component.
2.1.4.2 Controller Technology A PIC was the only technology considered for the control unit.
2.1.4.2.1 PIC
A PIC would require that code be written to allow the PIC to perform the desired functions. This would be easily scaleable to
8
accommodate more or fewer lights that originally planned with minimal modification to the software. A PIC is compact and will be easily installed within the vehicle. The number of components that can be monitored is contingent upon the number of I/O pins available on the PIC.
2.1.4.2.2 Results
Since it was the only technology considered, a PIC will be used for controlling the system. The use of multiple PICs (e.g. one for collecting test results, one for controlling the display and one for controlling the overall operation) was considered, but was deemed unnecessary and overly complex. Instead a single PIC will be used in conjunction with a decoder and multiplexer to control the test circuits. The decoder and multiplexer will reduce the number of I/O pins for the lamp/flasher unit testing circuits from to n2 ⎡ ⎤ 2log2 +n where is the number of filaments plus the 2 flasher units. These will also allow a single current sensor to be used to test the components.
n
2.1.4.3 Display Technology
The use of LCDs and LEDs were considered for the display.
2.1.4.3.1 LCD An LCD would be very versatile and would allow for a complete text-readout, providing the user with the exact location of the failure. Depending on the number of lines and characters per line, an LCD may take up a large portion of instrument panel space. It is more affected by temperature extremes compared to some alternative technologies. Without proper lighting, an LCD can be difficult to read. An LCD would require 12 I/O pins from the PIC.
2.1.4.3.2 LED
A two digit 7 segment LED display would provide a 2 digit hex code that the user would have to look up in the vehicle’s users manual to determine the failure. The display would take a relatively small amount of space on the instrument panel. LEDs are not greatly affected by temperature extremes. LEDs are easily readable in low light situations. 14 I/O pins would be required from the PIC. A 7-segment display would not have the capability of displaying multiple simultaneous error codes
2.1.4.3.3 Result
Due to the ease of use on the user’s part, the LCD was chosen. Also, an LCD would be able to provide other information about the system without requiring the user to cross-reference the user’s manual.
9
2.1.5 Testing Approach Considerations This section shall consist of the testing approach considerations.
2.1.5.1 Individual Systems Testing
This section shall describe how each individual system in the design shall be tested.
2.1.5.1.1 Schematic Testing of Sensory System
The system shall be constructed and then tested within a Spice or Pspice design environment. Mock inputs from the vehicle and PIC shall be used to drive the system to test for possible failures. Every component will be tested to ensure proper output based on the inputs selected. The system shall be able to detect and report a failure in a single filament, multiple filament, and flasher unit prior to passing testing.
2.1.5.1.2 Software Testing of the PIC The system shall be tested with a test bench created by the team. Mock inputs from the vehicle and the sensory system shall be supplied by the test bench and pending proper output the PIC shall pass testing. The system shall be tested for proper self test implementation; proper light detection; proper detection and reporting of single filament, multiple filament, and flasher unit failures.
2.1.5.2 Full System Testing
The entire system shall be constructed using the sensory system model and a PIC. A test bench shall be created and the system shall be implemented using hardware. The parts ordered are assumed to work correctly as specified by the vendor. A minimal check shall be performed to ensure that they are properly working upon receiving them. The system shall undergo the testing where several scenarios are played, such as, ignition, testing during operation of the lamps, testing single lamp failures, testing flasher unit failures, and testing for multiple lamp failures. If all tested aspects pass successfully for all selected scenarios, the system shall pass the test. If any aspect fails, then the system shall fail and updates to the system shall take place to ensure the system is working.
10
2.1.5.3 Environmental Testing Upon completion of system testing, the system shall undergo environmental testing. The system shall undergo thermal cycling, and vibration testing to ensure it is qualified for use in a vehicle. This option may not be feasible to the team due to lack of time, experience and funding for the task.
2.1.6 Recommendations Regarding Project Continuation or
Modification The group recommends that the project be continued according to the project plan. The system environmental testing is a major part of the systems over functionality. If the system cannot survive an automotive atmosphere, then it is not a feasible design because the parts are not robust enough to handle the environment. The system should be environmentally tested to ensure all parts are robust enough to withstand a vehicle’s environment.
2.2 Detailed Design
The design for the faulty vehicle light system contains three main subsystems. The three subsystems are: sensor system, processing system, and display system.
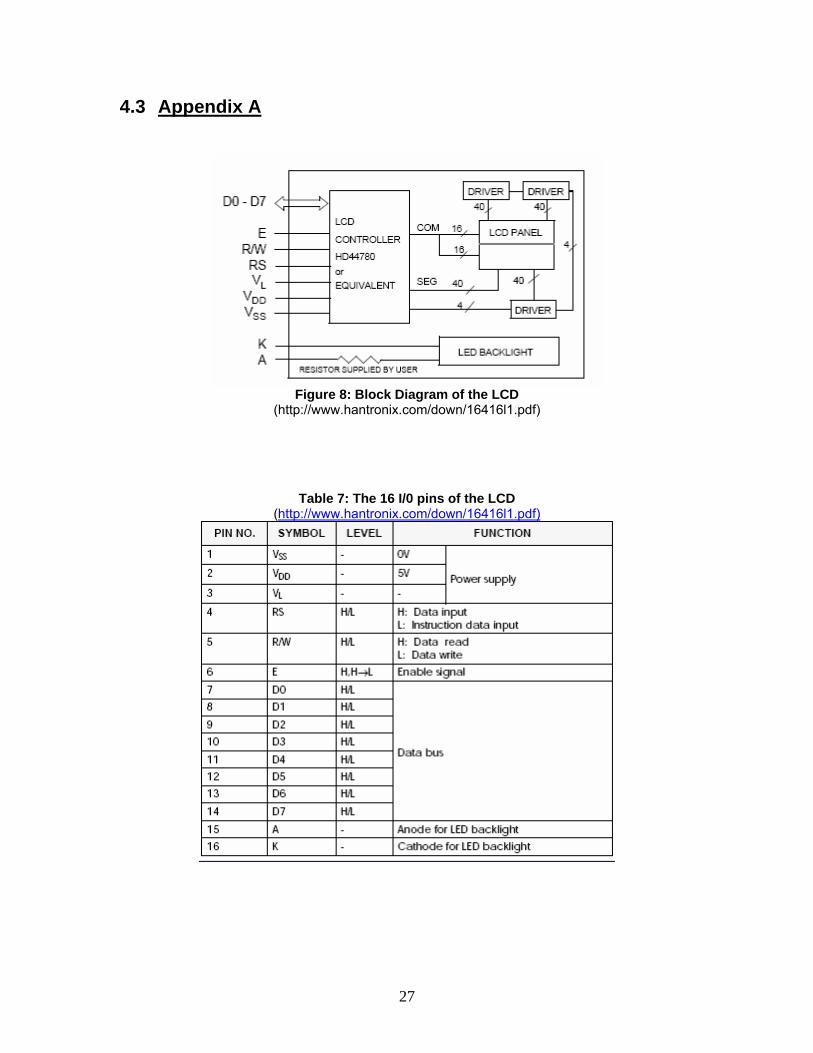
2.2.1 Display System The display system will consist of an LCD. The LCD that will be used is the HDM16416L-1-L30S LCD from www.mouser.com. The LCD has a display area of 16x4 characters, has a built on HD44780 or equivalent LCD controller board and costs $29.19. The LCD unit has a total of 16 I/O pins. The pin usage is as follows:
• 3 pins for power supply • 1 pin for data/instruction input • 1 pin for read/write data • 1 pin for enable • 8 pins for data bus • 1 pin for backlight anode • 1 pin for backlight cathode
This is also shown in Figure 8 and Table 7 of Appendix A. Tolerances for the LCD and controller are shown in Figure 10 of Appendix A. VDD for the LCD is set to 5 +/- .025V at 25 degrees Celsius. Figure 11 of Appendix A shows the electrical characteristics of the LCD.
11
2.2.2 Processing System The processing system is comprised of a PIC, a decoder, solid state switches, 2 state multiplexers, and an
nn 2+n state multiplexer (where
is the number of filaments). This PIC will be obtained from Professor Patterson and thus specifics on the PIC are unknown at this time. The PIC will be responsible for controlling testing and interpreting the testing data and displaying appropriate output to the LCD. The PIC being used is Microchip PIC, part number 16F877A.
n
The decoder will accept an m bit wide bus (where ). The decoder will decode the signal to turn on the proper filament test switches and toggles.
22 += nm
The solid state switches will be used as an on/off switch for testing. This switch will make sure there is a voltage applied to the bulb for testing purposes. This switch is controlled by the PIC through the decoder. The 2 state multiplexer is used to connect a filament to either ground, if not being tested, or to the selector, for testing. This multiplexer is controlled by the PIC through the decoder. The state multiplexer will be used to select the filament to connect to the current sensor system. It will take as input an bit wide control bus (where ) and
2+nm
22 += nm 2+n input lines and one output to the current sensor system. The multiplexer will connect the appropriate input line to the current sensor system based on the m bit wide bus value.
2.2.3 Sensor System The sensors for this system have not been decided upon because of lack testing. Two designs are being considered; a comparator and resistor circuit and a current sensor. The following sections describe the sensor systems in consideration.
2.2.3.1 Comparator and Resistor Circuit The comparator and resistor circuit consist of a 324 op amp and a very low impedance resistor (Value will be determined after lab testing is conducted and will be included in the bound design report). View Figure 2 for the comparator and resistor circuit.
2.2.3.2 Allegro Micro Current Sensor
The Allegro ACS704 current sensor from www.allegromicro.com is an analog device which measures current. The ACS704 is very small in size, has 1.5 mΩ internal resistance and can handle a continuous 15 A of current, with a peak handling of 60 A. The cost of a single ACS705
12
kit is $19.95. Figure 9 shows the block diagram for the ACS704 and Table 10 shows the ACS704 specifications.
2.2.4 Full System
The full system will consist of one PIC, one LCD, one decoder, one to one selector (selector), one current sensor component, two resistors (testing resistor, current test resistor), one comparator, n on/off switches (testing switch), and n one to two selectors (testing select); where n is the number of lights. In Figure 2, red lines indicate electrical systems, yellow lines indicate single bit information lines, and blue lines represent multi-bit bus lines.
n
2.2.4.1 Self Test Procedure
There are two parts to a self test. The first part is the high test. This test is performed by having the 2+n multiplexer select the input containing the current test resistor. This will allow for a check of the comparator detecting current. The resistor was added to this line to act as the filament to prevent too much current flow through the system. The second part of the self test is the low test. This test is performed by having the 2+n multiplexer select the input connected to ground. This will allow for a check of the comparator detecting no current. Both of these tests are performed encase the comparator is bad and stuck at high or low output.
2.2.4.2 Filament Test Procedure
To test a filament, the PIC outputs the code for the filament to be tested on the bus to the decoder and 2+n multiplexer. The decoder will decode this signal and turn the proper filament switch to ON (this is to ensure that there is a voltage applied to the filament), connecting the battery to the filament through the testing resistor (used to prevent lights from turning on during testing if lights are not supposed to be on) and have the proper 2 state multiplexer output to the multiplexer. The multiplexer will also receive the code outputted by the PIC and select the proper input to pass to the current sensor. The current sensor then outputs a high or low signal, depending if the filament is working or not, which is read by the PIC. The PIC then decides is the filament is working or not and output the proper filament code to the LCD if it is not working.
2+n2+n
13
14
2.2.4.3 Flasher Unit Test Procedure To test a flasher unit, the flasher must be turned on by the user. The comparator across the flasher will detect the voltage difference across the flasher unit and alternate between high and low, depending upon the state of the flasher unit. The PIC will count the number of high/low changes from the comparator within a given amount of time and checks to make sure it falls within acceptable limits. If not, then the proper flasher code will be displayed on the LCD. Testing is done only when the flasher is turned on by the user to prevent the flasher unit from operating when not needed. This way, the user will not hear the clicking of the flasher unit unexpectedly.
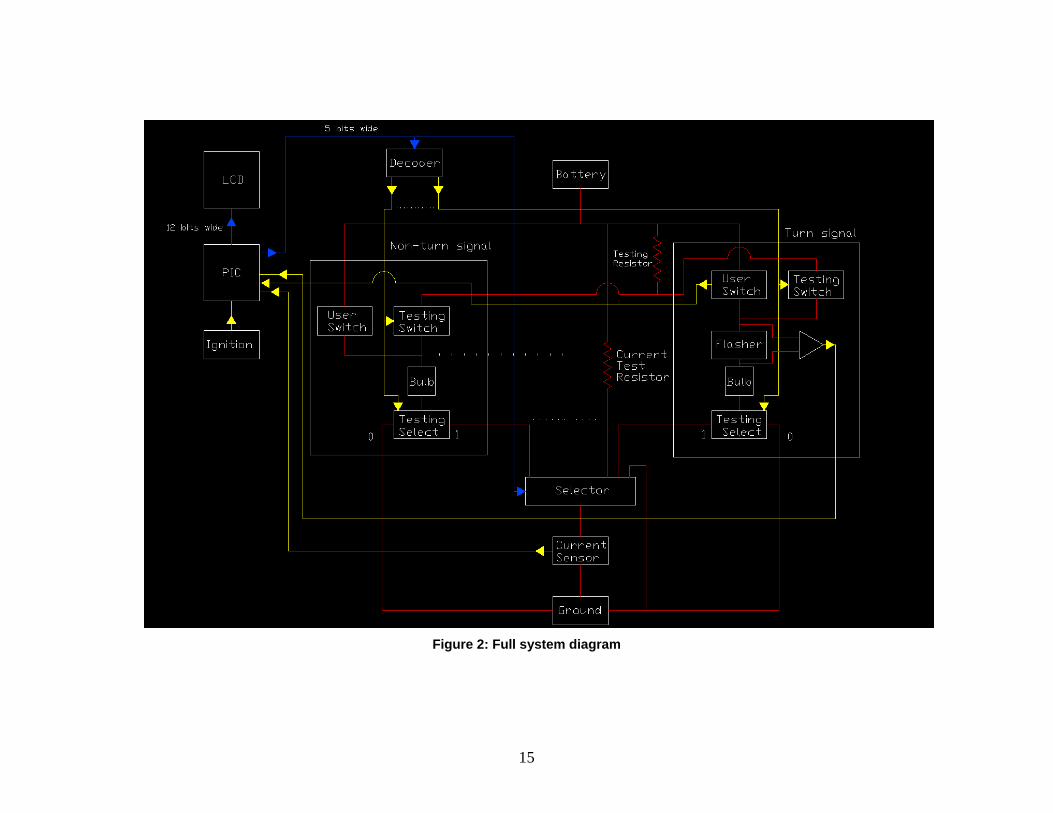
Figure 2: Full system diagram
15
Section 3: Resources and Schedules The following section contains detailed information about the resources that were originally stated in the original project plan as well as the resources used up to date and a revision of these resources. The original and updated project schedule and Gantt chart are also discussed, as well as a Gantt chart indicating the completion percentage of each project task. 3.1 Resources Requirements
This section describes in detail the various resources that will be used throughout all project phases. These resources include man hours and labor, cost estimates, as well as other resources.
3.1.1 Personnel Effort Requirements
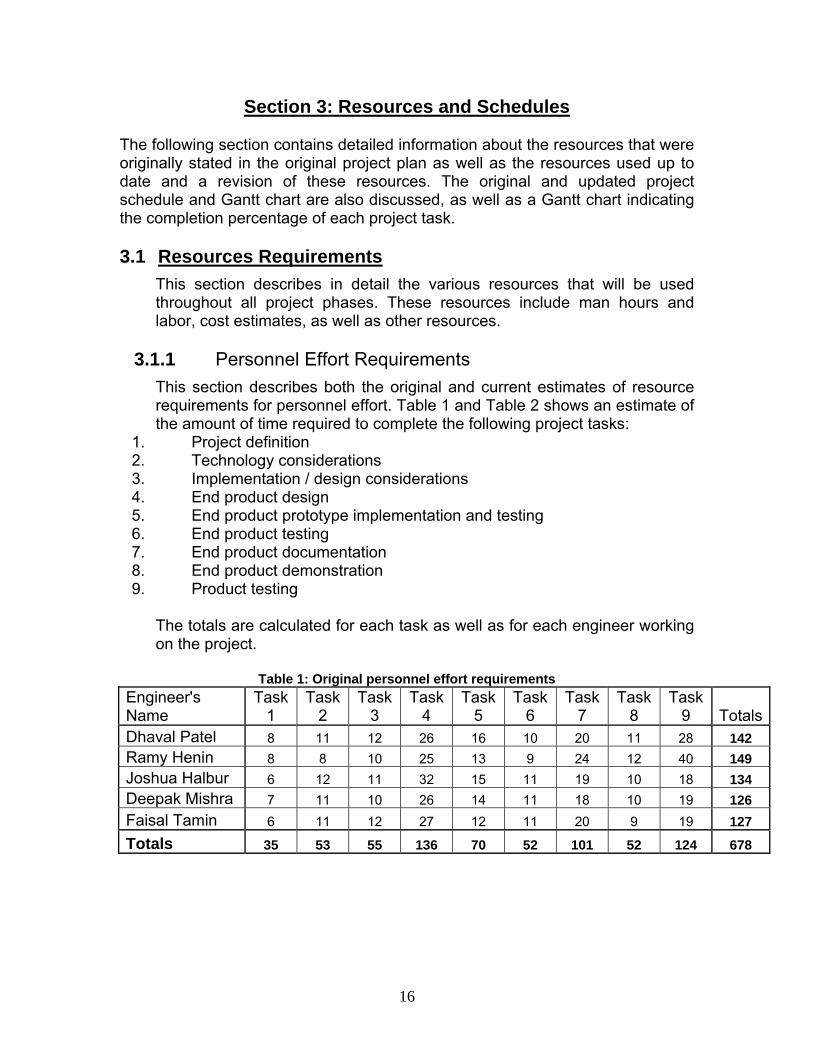
This section describes both the original and current estimates of resource requirements for personnel effort. Table 1 and Table 2 shows an estimate of the amount of time required to complete the following project tasks:
1. Project definition 2. Technology considerations 3. Implementation / design considerations 4. End product design 5. End product prototype implementation and testing 6. End product testing 7. End product documentation 8. End product demonstration 9. Product testing
The totals are calculated for each task as well as for each engineer working on the project.
Table 1: Original personnel effort requirements Engineer's Name
Task 1
Task 2
Task 3
Task 4
Task 5
Task 6
Task 7
Task 8
Task 9 Totals
Dhaval Patel 8 11 12 26 16 10 20 11 28 142 Ramy Henin 8 8 10 25 13 9 24 12 40 149 Joshua Halbur 6 12 11 32 15 11 19 10 18 134 Deepak Mishra 7 11 10 26 14 11 18 10 19 126 Faisal Tamin 6 11 12 27 12 11 20 9 19 127 Totals 35 53 55 136 70 52 101 52 124 678
16
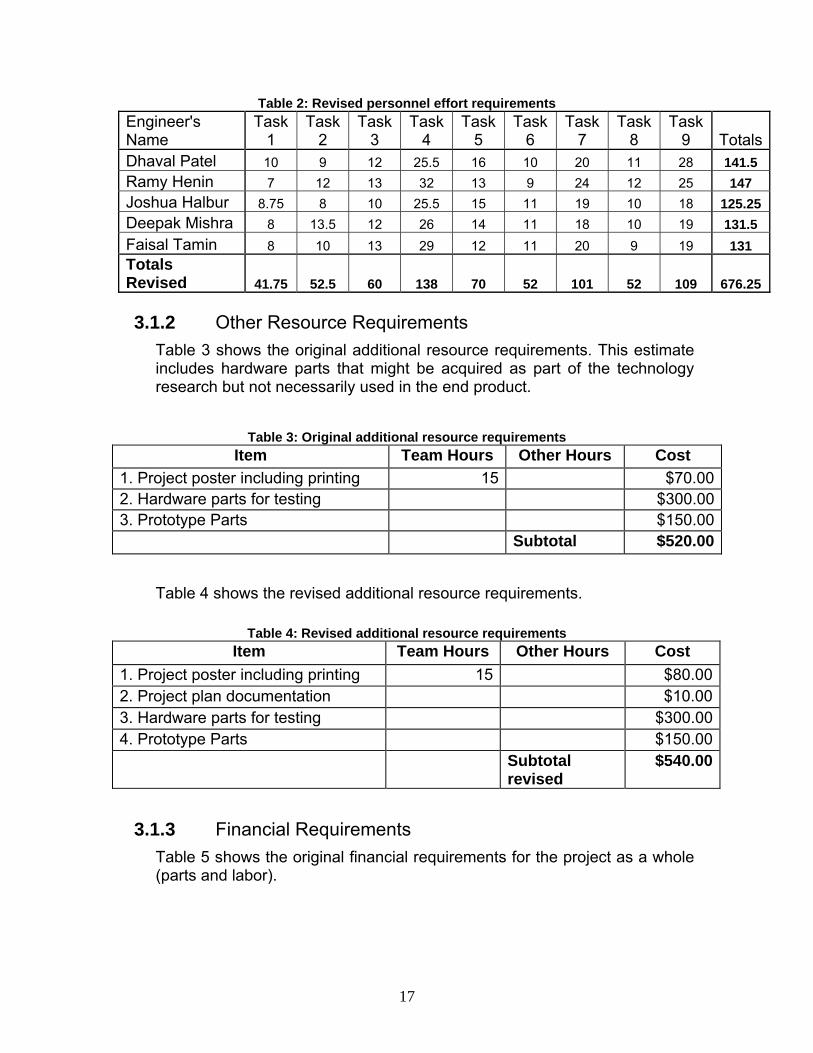
Table 2: Revised personnel effort requirements Engineer's Name
Task 1
Task 2
Task 3
Task 4
Task 5
Task 6
Task 7
Task 8
Task 9 Totals
Dhaval Patel 10 9 12 25.5 16 10 20 11 28 141.5 Ramy Henin 7 12 13 32 13 9 24 12 25 147 Joshua Halbur 8.75 8 10 25.5 15 11 19 10 18 125.25 Deepak Mishra 8 13.5 12 26 14 11 18 10 19 131.5 Faisal Tamin 8 10 13 29 12 11 20 9 19 131 Totals Revised 41.75 52.5 60 138 70 52 101 52 109 676.25
3.1.2 Other Resource Requirements
Table 3 shows the original additional resource requirements. This estimate includes hardware parts that might be acquired as part of the technology research but not necessarily used in the end product.
Table 3: Original additional resource requirements Item Team Hours Other Hours Cost
1. Project poster including printing 15 $70.002. Hardware parts for testing $300.003. Prototype Parts $150.00 Subtotal $520.00
Table 4 shows the revised additional resource requirements.
Table 4: Revised additional resource requirements Item Team Hours Other Hours Cost
1. Project poster including printing 15 $80.002. Project plan documentation $10.003. Hardware parts for testing $300.004. Prototype Parts $150.00 Subtotal
revised $540.00
3.1.3 Financial Requirements
Table 5 shows the original financial requirements for the project as a whole (parts and labor).
17
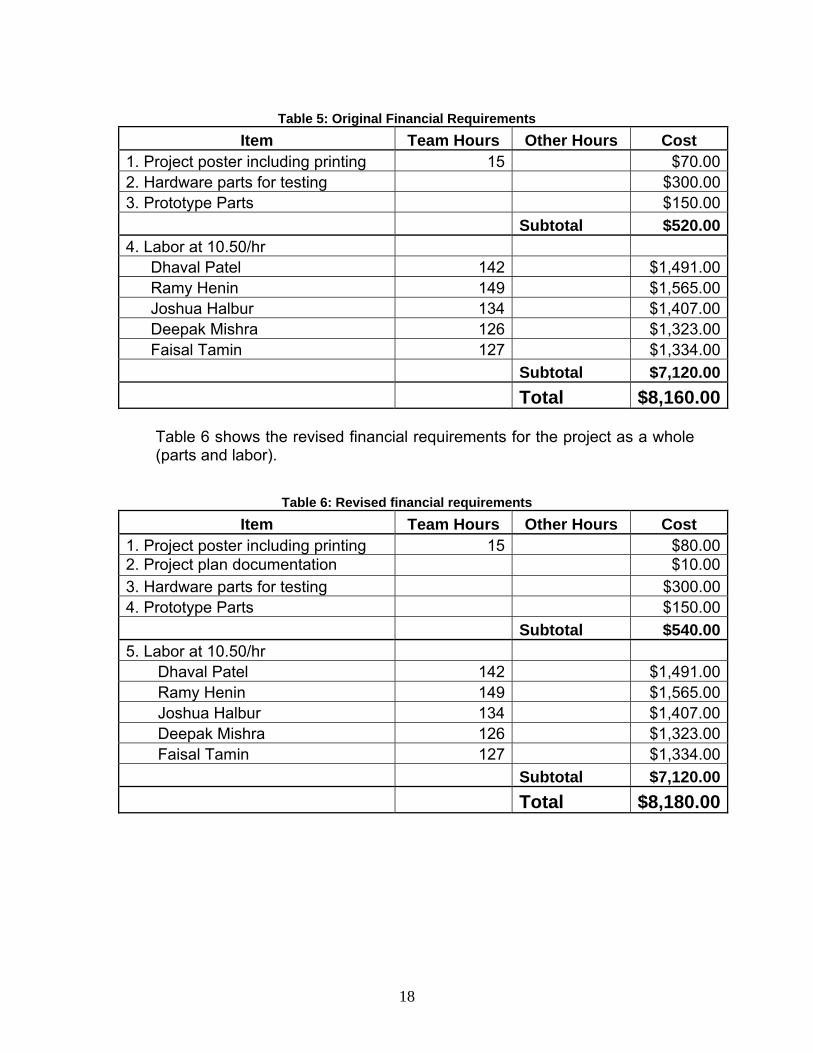
Table 5: Original Financial Requirements
Item Team Hours Other Hours Cost 1. Project poster including printing 15 $70.002. Hardware parts for testing $300.003. Prototype Parts $150.00 Subtotal $520.004. Labor at 10.50/hr
Dhaval Patel 142 $1,491.00Ramy Henin 149 $1,565.00Joshua Halbur 134 $1,407.00Deepak Mishra 126 $1,323.00Faisal Tamin 127 $1,334.00
Subtotal $7,120.00 Total $8,160.00
Table 6 shows the revised financial requirements for the project as a whole (parts and labor).
Table 6: Revised financial requirements Item Team Hours Other Hours Cost
1. Project poster including printing 15 $80.002. Project plan documentation $10.003. Hardware parts for testing $300.004. Prototype Parts $150.00 Subtotal $540.005. Labor at 10.50/hr
Dhaval Patel 142 $1,491.00Ramy Henin 149 $1,565.00Joshua Halbur 134 $1,407.00Deepak Mishra 126 $1,323.00Faisal Tamin 127 $1,334.00
Subtotal $7,120.00 Total $8,180.00
18

19
3.2 Schedules Figure 3 is the original Gantt chart detailing the start date and duration of each task to be done in the project. All subtasks are listed as well. The chart details both semesters of the project. It is worth noting that the project will be on hold over the summer of 2005 because of the summer vacation, but will continue as normal in late August of 2005 with the beginning of the fall semester.
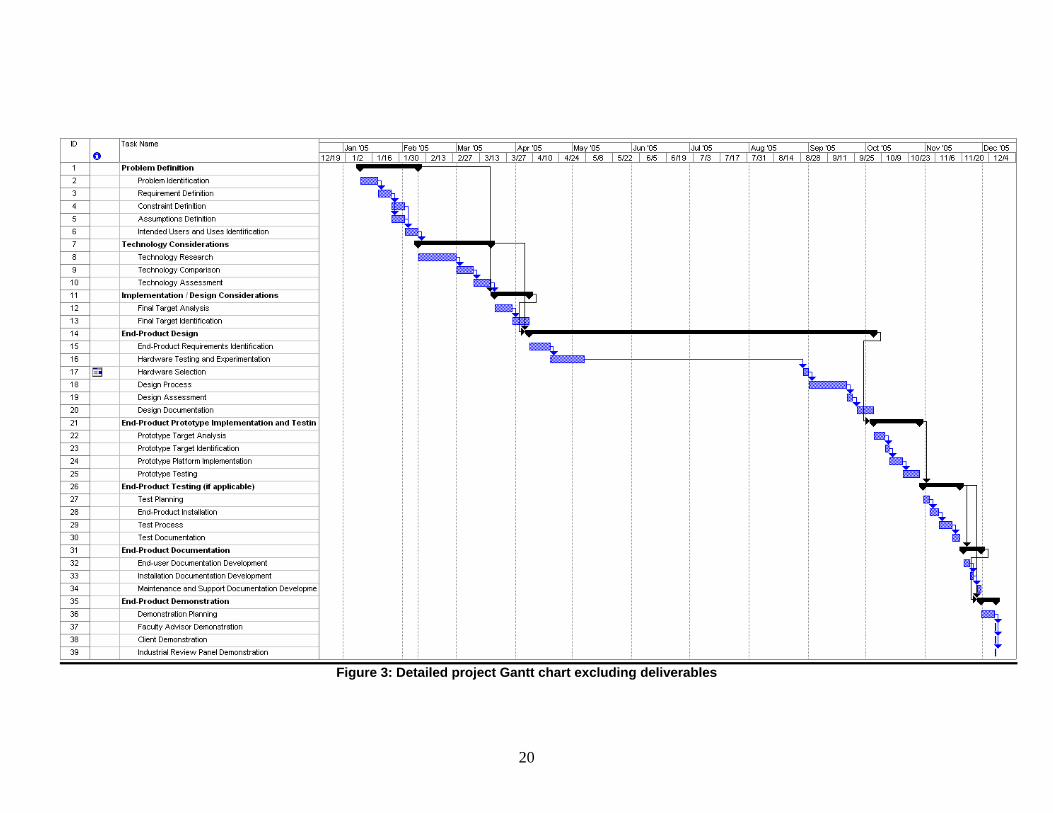
Figure 3: Detailed project Gantt chart excluding deliverables
20
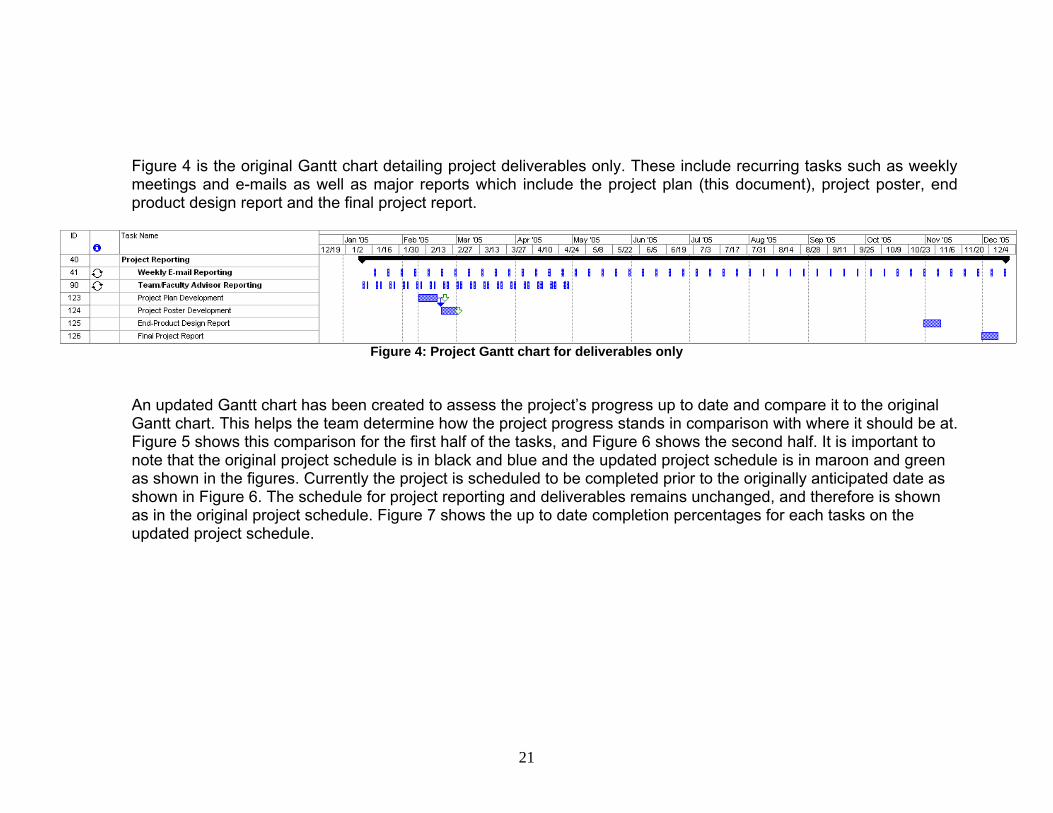
Figure 4 is the original Gantt chart detailing project deliverables only. These include recurring tasks such as weekly meetings and e-mails as well as major reports which include the project plan (this document), project poster, end product design report and the final project report.
Figure 4: Project Gantt chart for deliverables only
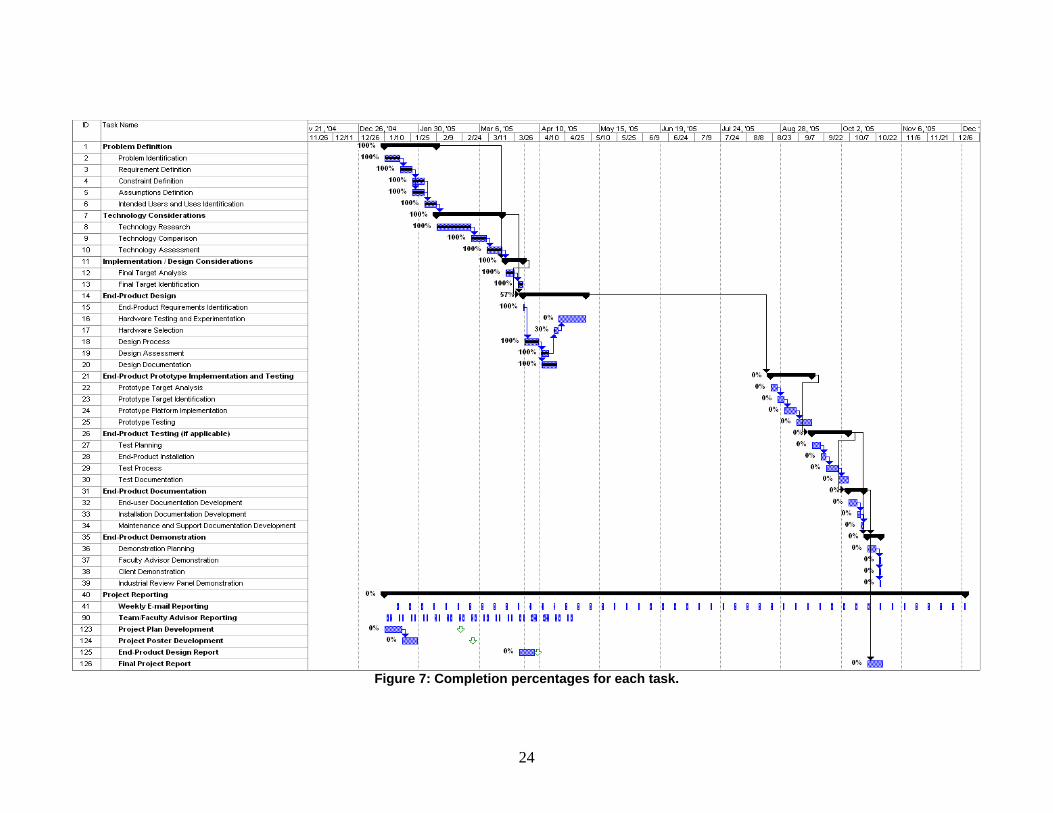
An updated Gantt chart has been created to assess the project’s progress up to date and compare it to the original Gantt chart. This helps the team determine how the project progress stands in comparison with where it should be at. Figure 5 shows this comparison for the first half of the tasks, and Figure 6 shows the second half. It is important to note that the original project schedule is in black and blue and the updated project schedule is in maroon and green as shown in the figures. Currently the project is scheduled to be completed prior to the originally anticipated date as shown in Figure 6. The schedule for project reporting and deliverables remains unchanged, and therefore is shown as in the original project schedule. Figure 7 shows the up to date completion percentages for each tasks on the updated project schedule.
21
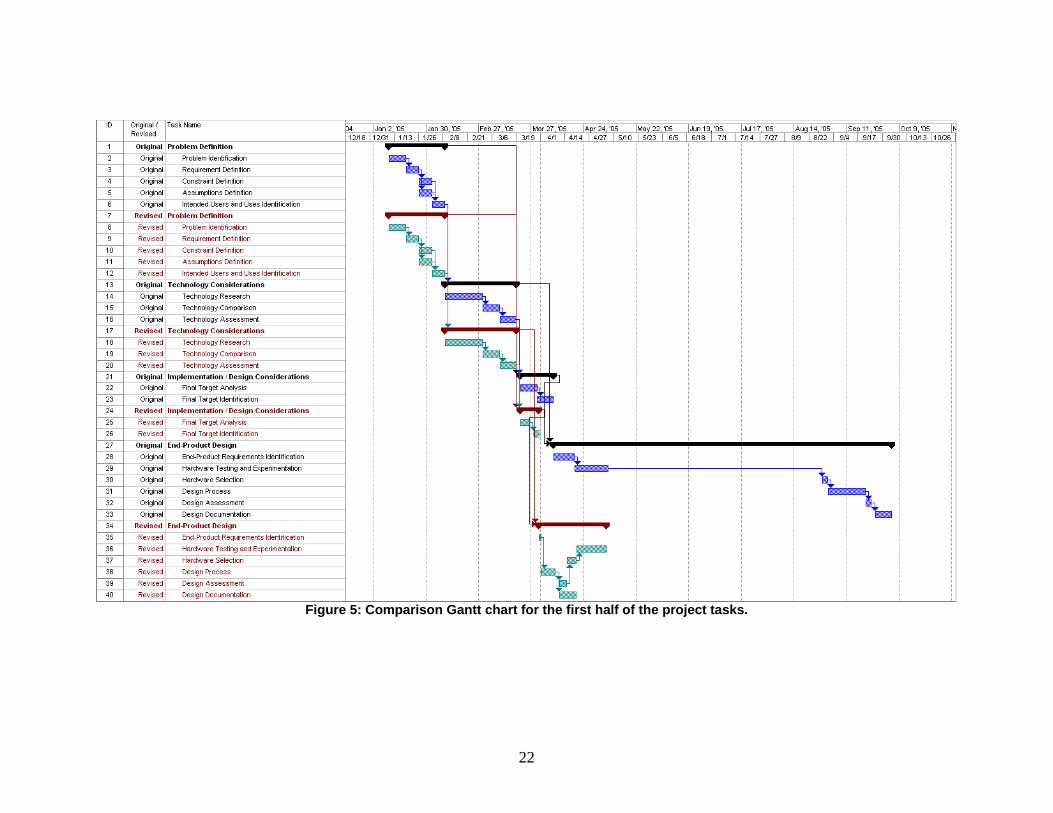
Figure 5: Comparison Gantt chart for the first half of the project tasks.
22
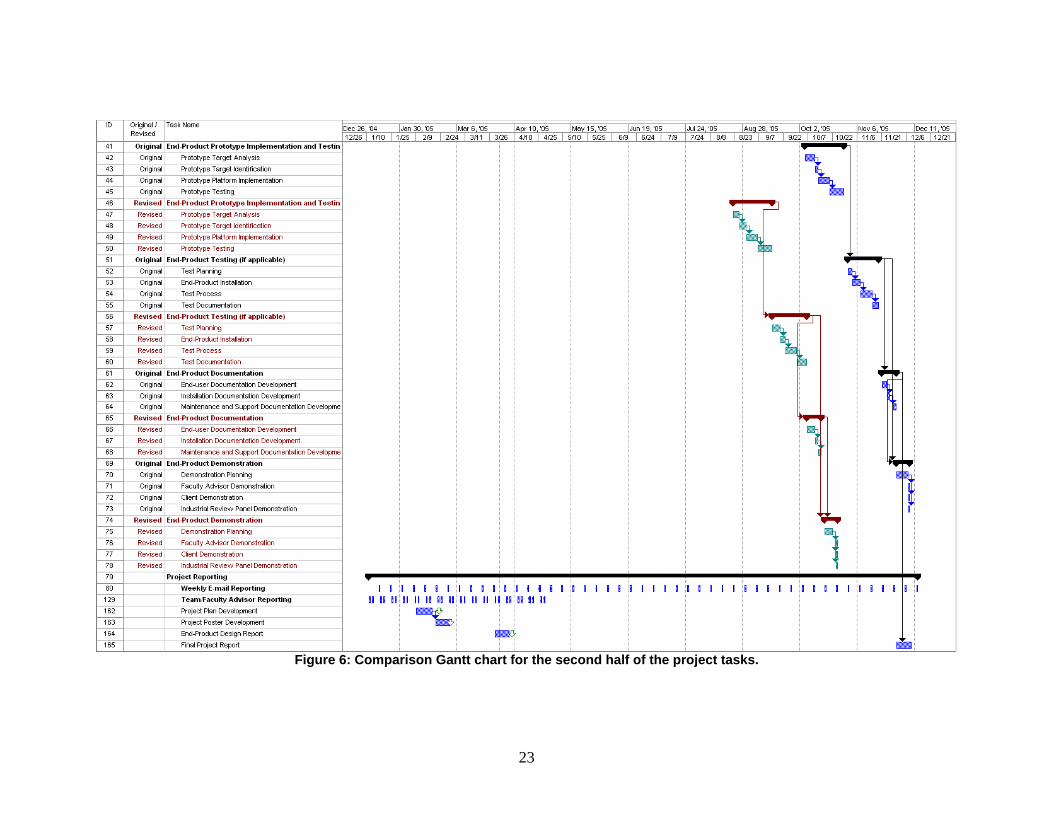
Figure 6: Comparison Gantt chart for the second half of the project tasks.
23
24
Figure 7: Completion percentages for each task.

Section 4: Closure Material This section contains detailed contact information about all those involved in the project as well as a summary of the project. 4.1 Project Team Information
The following is a list of all parties involved in the project and their contact information, including the faculty advisor and the client.
A. Client information: Client’s name : Senior Design (Iowa State University)
B. Faculty advisor information: Faculty advisor : Associate Professor Gary Tuttle Office address : i. 2126 Coover Hall Ames, IA 50011-3060 ii. 247 ASC I Ames, IA 50011-3025 Mailing address : RR 4 BOX 176 Ames, IA 50014-9380 Office phone number : 515-294-1814 Home phone number : 515-296-2110 Fax telephone number : 515-294-9584 Email address : [email protected]
C. Student team information: 1. Name : Josh Halbur Major : Computer Engineering Mailing address : 632 Squaw Creek Dr. # 7 Home phone number : 515-292-3939 (primary) Cell phone : 515-669-3822 Email address : [email protected] / [email protected]
2. Name : Ramy Henin (Team Leader) Major : Computer Engineering Mailing address : 4701 Steinbeck # 4 Home phone number : 515-231-5440 (primary) Cell phone : 515-292-1599 Email address : [email protected] 3. Name : Deepak Mishra Major : Computer Engineering Mailing address : 3714 Tripp St # 304 Cell phone number : 507-398-3059
Email address : [email protected]
25
4. Name : Dhaval Patel (Communications Coordinator)
Major : Electrical Engineering Mailing address : 1121 Delaware Ave #5
Cell Phone number : 815-978-5869 Email address : [email protected] / [email protected]
5. Name : Faisal Tamin Major : Electrical Engineering Mailing address : 246 North Hyland #111 Home phone number : 515-292-5071 Cell phone : 515-441-1299 (primary) Email address : [email protected] / [email protected]
4.2 Closing Summary
The faulty lamp detection system for vehicles is an important issue. The current systems available for detecting faulty lamps in vehicles have limited functionality. Driving with a failed lamp or flasher could cause accidents due to confusion during turning or limited visibility. The system will be able to periodically test for multiple faulty lamps and failed flashers and display an indication of failure. In addition to the detection of faulty lamps and flashers, the system will also be able to detect failed instrument panel bulbs. If the instrument panel lights have failed, the motorists will not be informed of any problems or failures that occur in their vehicles. This is a feature not found in many vehicles, and will help the motorists identify problems. When this system is completed, it will serve motorists mainly by informing them about the vehicle’s lighting system, thus limiting possible hazards that may be caused.
26
4.3 Appendix A
Figure 8: Block Diagram of the LCD
(http://www.hantronix.com/down/16416l1.pdf)
Table 7: The 16 I/0 pins of the LCD (http://www.hantronix.com/down/16416l1.pdf)
27
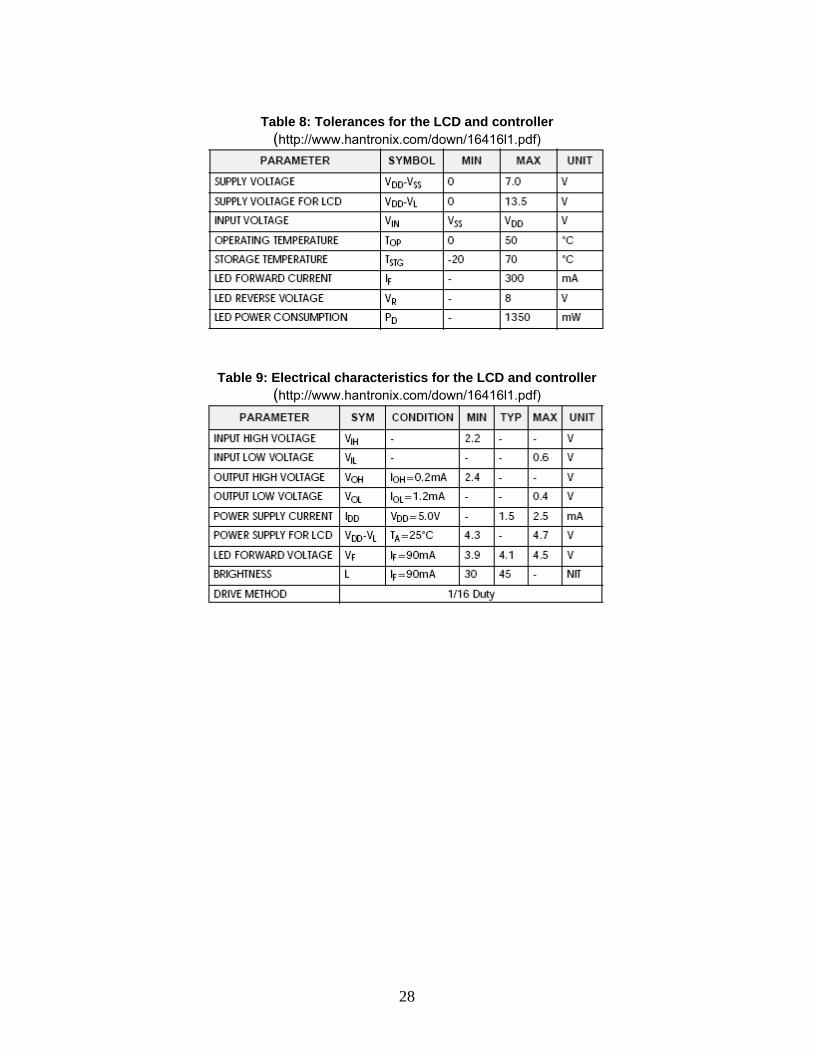
Table 8: Tolerances for the LCD and controller
(http://www.hantronix.com/down/16416l1.pdf)
Table 9: Electrical characteristics for the LCD and controller (http://www.hantronix.com/down/16416l1.pdf)
28
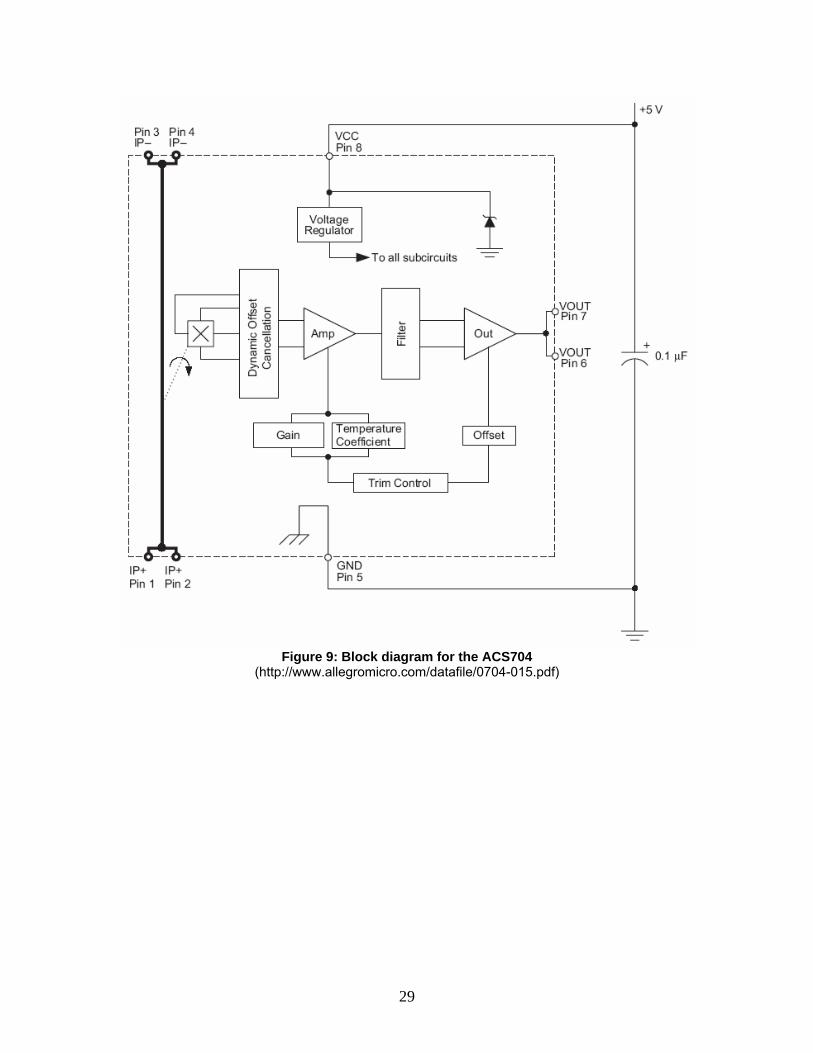
Figure 9: Block diagram for the ACS704
(http://www.allegromicro.com/datafile/0704-015.pdf)
29
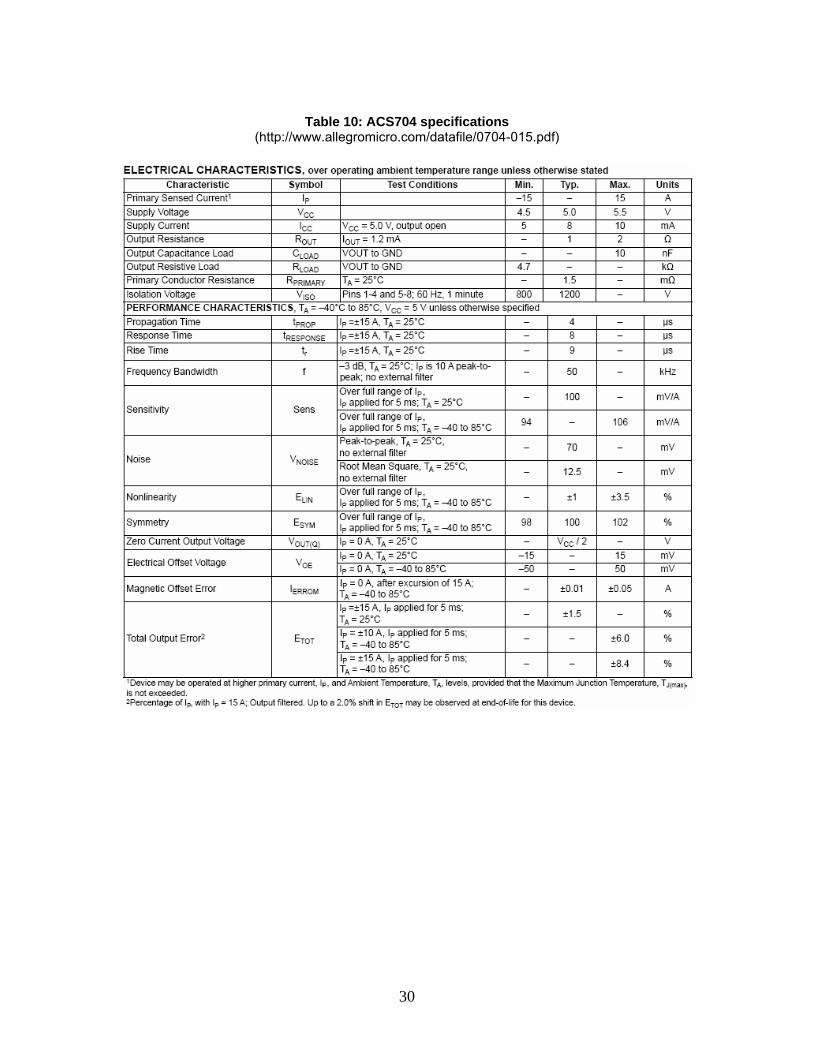
Table 10: ACS704 specifications
(http://www.allegromicro.com/datafile/0704-015.pdf)
30
Recommended