Vermont Solar Market Pathways
Volume 1
Summary Report
December 2016

Vermont Solar Market Pathways Becoming an Advanced Solar Economy by 2025
David Hill, Damon Lane, Kate Desrochers, Frances Huessy, and Rabi Vandergon
The Vermont Solar Market Pathways project began in late 2014 and will continue through the
end of 2017. It is funded through an award from the U.S. Department of Energy, Office of Energy
Efficiency and Renewable Energy (Award No. DE-EE-0006911), to the Vermont Energy
Investment Corporation, David G. Hill, Ph.D., Principal Investigator. Subrecipients are the
Regulatory Assistance Project and the Vermont Department of Public Service—both of
Montpelier, Vermont.
Preface
This Summary Report for the Vermont Solar Market Pathways project is the product of two years
of stakeholder engagement, data gathering, and analysis, the specific aims of which are to
answer the question: What does it take to advance a state’s solar economy sufficiently to meet
one of the nation’s most ambitious energy goals?
Vermont has such a goal: meeting 90 percent of the state’s total energy needs with renewable
energy resources by 2050, with several milestones at 2025 and 2035. In particular, this project
sought to determine the policy actions necessary to meet 20 percent of that 90 percent goal with
solar resources only.
The project’s data gathering, research, and analysis depended on comprehensive stakeholder
engagement, described throughout this report. With funding from the U.S. Department of Energy
(DOE), this work supports the objectives of the Solar Market Pathways program of DOE's
SunShot Initiative. In particular, it informs current and future efforts in demonstrating the
increasing affordability and advisability of solar energy from the perspective of policy makers.
Acknowledgements
We wish to thank the stakeholders, who supplied a wide range of perspectives, drawn from their
own fields and from their willingness to consider other stakeholder interests. Appendix A,
Stakeholder List, provides the full list of participants in the work.
The team has worked extensively with the Long Range Energy Alternatives Planning System
(LEAP), developed and supported by the Stockholm Environment Institute. We would like to
thank Charlie Heaps and Taylor Binnington for their expert support and guidance on the use of
the LEAP system.
Carl Linvill of the Regulatory Assistance Project led the study’s investigation of net metering and
alternative rate structures, presented in Volume 2. Critical assistance and guidance on Vermont’s
Statewide Energy Goals and the Comprehensive Energy Plan were received from Asa Hopkins,
Andrew Perchlik, John Woodward, and Anne Margolis. Kim Jones of Green Mountain Power and
Steve LeTendre of Green Mountain College provided helpful peer review comments.
We greatly appreciate the support and guidance from the staff of the Department of Energy’s
SunShot Initiative, including Angela Crooks, Elaine Ulrich, and Michele Boyd. Nicole Enright, Deb
Perry and their colleagues at The Institute for Sustainable Communities provided overall
coordination for the national Solar Market Pathway awardees. We would also like to thank our
peers on the other Solar Market Pathway study teams for their feedback and insights.
Other staff at VEIC who contributed to the project and writing of the report include: Stephanie
Baer, Christine Donovan, Suzanne Elowson, Allison Fode, Ethan Goldman, Nick Lange, Ingrid
Malmgren, Dave Roberts, and Peter Schneider.
We look forward to continuing work with these and other stakeholders going forward. Any errors
or omissions in the report are the responsibility of the primary authors.
Foreword: A Message from Senator Sanders
To my mind, climate change is the single greatest threat facing our planet. Virtually the entire
scientific community agrees that human activity is a significant driver of global warming. The
United Nation's Intergovernmental Panel on Climate Change warns that if we don't drastically
reduce greenhouse gas emissions, the already serious effects of global warming will get much
worse by mid-century — including more extreme weather, crop failures, increasing hunger and
illness, and mass migrations of people.
While this prognosis is dire, most scientists also agree that we can avoid the worst
consequences of climate change if we act boldly. That means radically transforming our energy
system away from fossil fuels and toward renewable and sustainable sources of energy like solar.
And that is why efforts like Vermont’s Solar Market Pathways project are so important.
Funded through the U.S. Department of Energy’s innovative SunShot Initiative and organized by
the Vermont Energy Investment Corporation, the Solar Market Pathways project identifies
various opportunities and challenges for the widespread adoption of affordable solar energy in
Vermont.
I am proud that the state of Vermont has set ambitious sustainable energy goals, including
getting 90% of its energy from renewables by 2050. With this report, VEIC and its partners are
showing us how to get to that goal. What is more, Vermont’s Solar Market Pathways shows that
going solar will not only have enormous environmental benefits, but also will provide affordable
energy for Vermonters, create new energy sector jobs, and ensure that more energy dollars stay
in our state.
Vermont has already seen significant growth in solar. Our installed capacity has increased nearly
tenfold over the past five years, and we now rank third in the nation in terms of solar jobs per
capita. However, we must do more, and now that we have a roadmap, we must redouble our
efforts to make it happen. After all, we have a moral responsibility to do everything possible to
ensure our children and grandchildren inherit a planet every bit as habitable as the one we now
enjoy.
Sincerely,
Bernie Sanders
United States Senator

Table of Contents
Executive Summary ...................................................................................................................... 1
Solar Is Part of the Total Energy Economy .......................................................................... 1
Challenges and Opportunities ............................................................................................. 1
Vermont Solar Market Pathways: Key Findings ................................................................... 2
A Prudent Investment .......................................................................................................... 3
Accommodating Solar Generation This High Is Feasible .................................................... 3
Vermont Solar Market Pathways: Consumer Perspectives from 2025 ................................ 4
High Performance and Affordable New Homes .......................................................... 4
Enhancing Energy Performance for Vermont’s Older Homes ..................................... 5
Pathways to the Solar Future ............................................................................................... 7
Becoming an Advanced Solar Economy by 2025 Helps Meet Vermont’s 2050 Goals
.................................................................................................................................... 7
High Solar Penetration in Vermont Is Achievable ..................................................... 10
Economic Outcomes ................................................................................................. 11
Environmental Outcomes .......................................................................................... 12
Questions Answered by This Report ................................................................................. 13
1. Introduction ............................................................................................................................ 15
1.1 SunShot Objectives. ................................................................................................... 15
1.2 Vermont Solar Market Pathways Objectives .............................................................. 15
1.3 Vermont Background .................................................................................................. 15
Strong Policy Supports an Advanced Solar Economy.............................................. 15
Vermont’s Demographics.......................................................................................... 16
A Recent History of Energy Supply and Use in Vermont .......................................... 16
1.4 Implications for Broader Applicability ......................................................................... 20
1.5 Structure of This Report ............................................................................................. 20
2. Investigation Methods and Approach .................................................................................... 23
2.1 Stakeholder Engagement ........................................................................................... 23
Page ii
2.2 Scenario Modeling ...................................................................................................... 24
Demand Drivers ........................................................................................................ 27
2.3 Scenarios .................................................................................................................... 27
2.4 Costs .......................................................................................................................... 31
3. Results .................................................................................................................................... 33
3.1 Changes in Energy Use and Supply ........................................................................... 33
Efficiency Is a Key Resource in All Scenarios ........................................................... 33
Strategic Electrification – Heat Pumps ..................................................................... 35
Strategic Electrification – Electric Vehicles ............................................................... 37
Renewable Generation in the Decarbonized Grid ..................................................... 40
3.2 Grid Impacts ............................................................................................................... 41
3.3 Economic Outcomes .................................................................................................. 42
3.4 Environmental Outcomes ........................................................................................... 45
4. Strategies for Becoming an Advanced Solar Economy ......................................................... 47
4.1 How the Results Can Be Attained .............................................................................. 47
Siting and System Integration ................................................................................... 47
Space Requirement................................................................................................... 47
Distribution System ................................................................................................... 50
Bulk Power System Integration ................................................................................. 53
Smart Grid, Demand Management, and Storage ..................................................... 57
Business Models ....................................................................................................... 58
Addressing Low-Income People: A Societal Imperative ........................................... 60
Utility Business Model ............................................................................................... 62
4.2 Regulatory Considerations ......................................................................................... 63
Looking Forward ......................................................................................................................... 67
Abbreviations and Acronyms ...................................................................................................... 69
Stakeholders ............................................................................................................................... 73
List of Figures
Figure 1. Vermont site energy demand, by 5-year increments, and by market sectors, showing
the effect of more aggressive efficiency and fuel switching in the SDP scenario. The white
indicates the net gains in the amount of energy not needed (“avoided” energy supply) under the
efficiency and fuel-switching SDP scenario, relative to the Reference scenario (business as
usual). ............................................................................................................................................ 8
Figure 2. Progress in Vermont toward meeting the 90 x 2050 renewable energy target, by fuel. 9
Figure 3. Actual and projected Vermont electricity supply in the SDP scenario, in 5-year
increments, and by energy source. ............................................................................................ 10
Figure 4. Emissions of the SDP scenario, compared to the Reference scenario. ...................... 12
Figure 5. Cumulative permitted solar capacity in Vermont has grown quickly in the last five years,
reaching 251 MW by the end of 2015......................................................................................... 18
Figure 6. Second stakeholder meeting, April 2015 in Rutland, VT. ............................................ 24
Figure 7. Sample demand tree structure in the LEAP system. ................................................... 25
Figure 8. A Sankey diagram representation of how LEAP uses energy resources to meet total
energy demand. .......................................................................................................................... 26
Figure 9. Difference in solar capacity by sector over time in the Low Net Metering scenario,
compared to the SDP scenario................................................................................................... 30
Figure 10. Difference in solar capacity added by year in the Delayed Solar Deployment scenario,
compared to the SDP scenario................................................................................................... 31
Figure 11. Projected future after-tax installed cost of solar PV in Vermont. Assumes the
Investment Tax Credit fully expires in 2025. ............................................................................... 32
Figure 12. Vermont site energy demand, by 5-year increments, and by market sectors, showing
the effect of more aggressive efficiency and fuel switching in the SDP scenario, compared to the
Reference scenario. .................................................................................................................... 34
Figure 13. Cumulative discounted investments under the SDP scenario, compared to the
Reference scenario. .................................................................................................................... 34
Figure 14. Share of heating energy in single family homes, by five-year increments, and fuel, with
electricity and biofuels growing to displace fossil fuels. ............................................................. 37
Figure 15. Vermont ZEV Action Plan compliance scenario. ....................................................... 38
Figure 16. Share of light-duty vehicle energy provided by fuel, with electricity growing later in the
period. ......................................................................................................................................... 39
Figure 17. Electricity generation by year and source in the SDP. .............................................. 40
Page iv
Figure 18. Difference in annual generation between the SDP and the Reference scenarios,
showing a diverse mix of renewables displace natural gas-fired power from the New England
grid. ............................................................................................................................................. 41
Figure 19. Vermont Champ Curve, showing the net load on an average July day. .................... 42
Figure 20. A comparison of cumulative discounted costs for electricity generation, between the
SDP and References scenarios. ................................................................................................. 44
Figure 21. Annual discounted costs for electricity generation in the SDP scenario, compared to
the Reference scenario. .............................................................................................................. 45
Figure 22. Emissions of the SDP scenario compared to the Reference scenario. ..................... 46
Figure 23. A section of a map showing "prime solar" land......................................................... 48
Figure 24. A Bennington County Regional Commission graphic showing more than enough prime
solar land to site the targeted capacity of solar. ........................................................................ 49
Figure 25. Solar capacity as a percentage of feeder rated capacity versus distribution system
upgrade cost, the base case before optimizing for PV. Data from Pepco analysis is presented as
part of "Preparing for a Distributed Energy Future: What Can Be Done Today to Integrate DERs
Cost Effectively.” ........................................................................................................................ 51
Figure 26. GMP's Solar Map shows areas of the grid that have capacity, are approaching the
limit, or have little to no capacity available. ................................................................................ 53
Figure 27. Projected supply and demand in 2025 show sample days with under-supply and over-
generation. The January day suffers from a lack of wind and solar generation. The April day has
lower load, some wind, and a lot of solar, creating 600 MW of excess capacity. The situation
would be even worse if hydro was at a typical spring high. On the July day, supply matches
demand in the afternoon. ............................................................................................................ 55
Figure 28. The demand/supply imbalance for each of the sample days above and two days
before and after, show that the daily imbalance can be the prevailing condition for several days
during the most challenging times of year. ................................................................................. 56
Figure 29. Imbalance Duration Curve by Daylight and Dark. ...................................................... 56
Figure 30. A. Imbalance by Duration (hours). B. Imbalance by Peak Demand (MW). C. Imbalance
by MWH. ..................................................................................................................................... 57
Figure 31. Comparison of total carrying costs for a typical manufactured home and a zero energy
modular home. ............................................................................................................................ 62
Figure 32. The array of options for consumer support services, under different regulatory levels,
in a total service system. ............................................................................................................ 64
Figure 33. The relationship of various services and service providers in a new utility framework.
.................................................................................................................................................... 64
List of Tables Table 1. Total energy and electricity consumption in Vermont’s advanced solar economy .... 7
Table 2. Cumulative costs and benefits of the SDP scenario, relative to the Reference
scenario, 2010-2025, discounted at 3 percent to 2015 ............................................ 11
Table 3. Questions answered by the Vermont Solar Market Pathways research ................... 13
Table 4. Scenarios for the Vermont Solar Market Pathways, with major data sources, and
showing the progression from current accounts to the SDP scenario ..................... 28
Table 5. Annual savings from heat pumps, for a typical home (75 MMBtu / year), assuming 80
percent fuel offset, and fuel prices in Table 6 ........................................................... 35
Table 6. Relative cost-effectiveness of electric heat pumps, compared to other fuel types .. 36
Table 7. Cumulative costs and benefits: 2010 – 2025, relative to the Reference scenario
(discounted at 3.0% to 2015, in millions of 2015 U.S. dollars) ................................. 43
Table 8. Land requirements for achieving the targeted 2050 solar capacity .......................... 48

Executive Summary
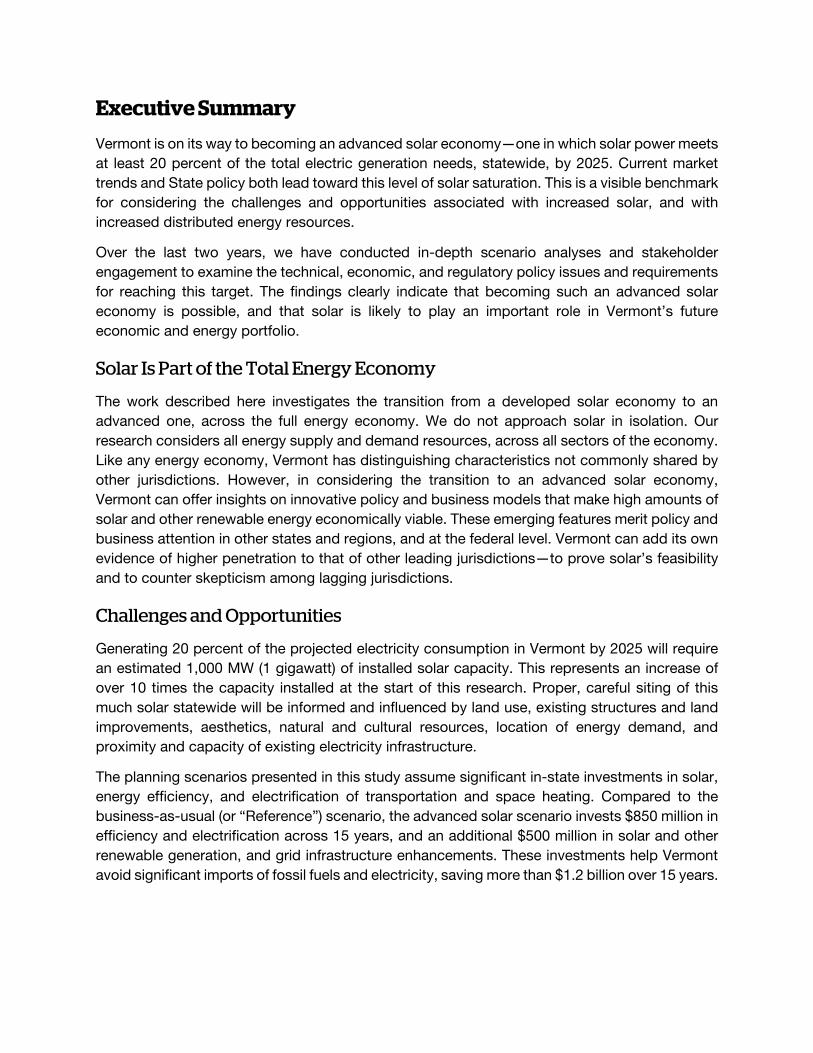
Vermont is on its way to becoming an advanced solar economy—one in which solar power meets
at least 20 percent of the total electric generation needs, statewide, by 2025. Current market
trends and State policy both lead toward this level of solar saturation. This is a visible benchmark
for considering the challenges and opportunities associated with increased solar, and with
increased distributed energy resources.
Over the last two years, we have conducted in-depth scenario analyses and stakeholder
engagement to examine the technical, economic, and regulatory policy issues and requirements
for reaching this target. The findings clearly indicate that becoming such an advanced solar
economy is possible, and that solar is likely to play an important role in Vermont’s future
economic and energy portfolio.
Solar Is Part of the Total Energy Economy
The work described here investigates the transition from a developed solar economy to an
advanced one, across the full energy economy. We do not approach solar in isolation. Our
research considers all energy supply and demand resources, across all sectors of the economy.
Like any energy economy, Vermont has distinguishing characteristics not commonly shared by
other jurisdictions. However, in considering the transition to an advanced solar economy,
Vermont can offer insights on innovative policy and business models that make high amounts of
solar and other renewable energy economically viable. These emerging features merit policy and
business attention in other states and regions, and at the federal level. Vermont can add its own
evidence of higher penetration to that of other leading jurisdictions—to prove solar’s feasibility
and to counter skepticism among lagging jurisdictions.
Challenges and Opportunities
Generating 20 percent of the projected electricity consumption in Vermont by 2025 will require
an estimated 1,000 MW (1 gigawatt) of installed solar capacity. This represents an increase of
over 10 times the capacity installed at the start of this research. Proper, careful siting of this
much solar statewide will be informed and influenced by land use, existing structures and land
improvements, aesthetics, natural and cultural resources, location of energy demand, and
proximity and capacity of existing electricity infrastructure.
The planning scenarios presented in this study assume significant in-state investments in solar,
energy efficiency, and electrification of transportation and space heating. Compared to the
business-as-usual (or “Reference”) scenario, the advanced solar scenario invests $850 million in
efficiency and electrification across 15 years, and an additional $500 million in solar and other
renewable generation, and grid infrastructure enhancements. These investments help Vermont
avoid significant imports of fossil fuels and electricity, saving more than $1.2 billion over 15 years.
Vermont Solar Market Pathways / Volume 1: Summary Report Page 2
Vermont Solar Market Pathways: Key Findings
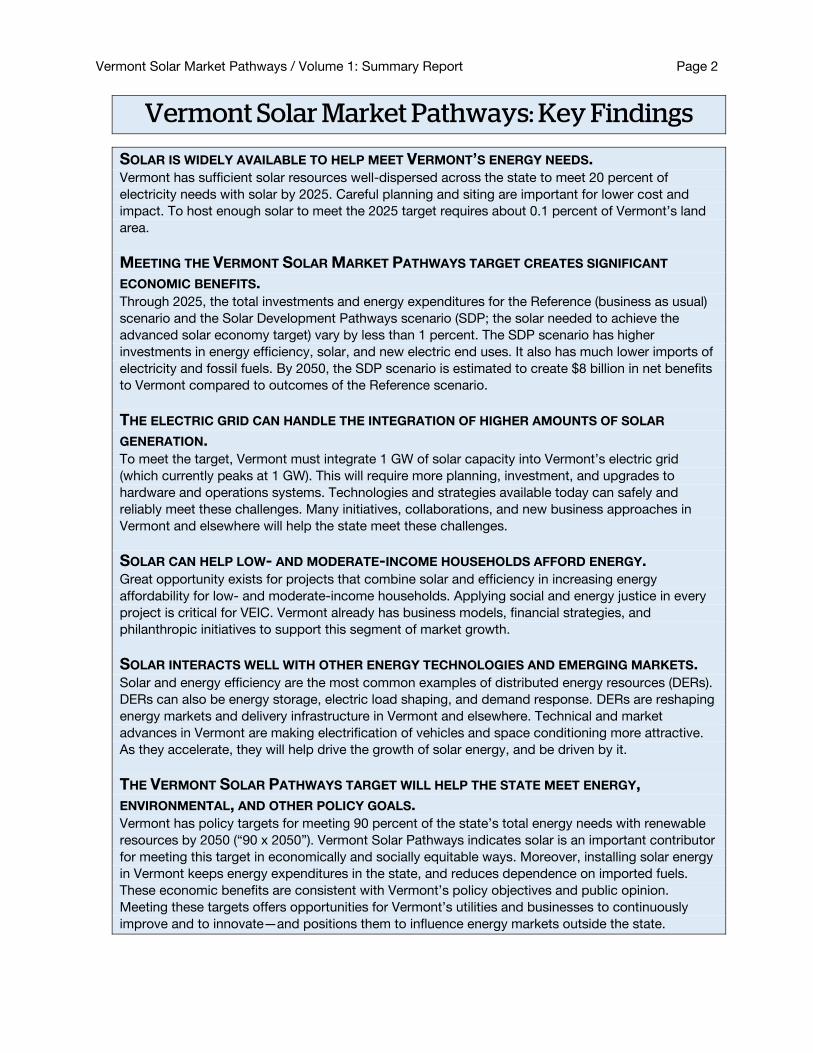
SOLAR IS WIDELY AVAILABLE TO HELP MEET VERMONT’S ENERGY NEEDS. Vermont has sufficient solar resources well-dispersed across the state to meet 20 percent of
electricity needs with solar by 2025. Careful planning and siting are important for lower cost and
impact. To host enough solar to meet the 2025 target requires about 0.1 percent of Vermont’s land
area.
MEETING THE VERMONT SOLAR MARKET PATHWAYS TARGET CREATES SIGNIFICANT
ECONOMIC BENEFITS. Through 2025, the total investments and energy expenditures for the Reference (business as usual)
scenario and the Solar Development Pathways scenario (SDP; the solar needed to achieve the
advanced solar economy target) vary by less than 1 percent. The SDP scenario has higher
investments in energy efficiency, solar, and new electric end uses. It also has much lower imports of
electricity and fossil fuels. By 2050, the SDP scenario is estimated to create $8 billion in net benefits
to Vermont compared to outcomes of the Reference scenario.
THE ELECTRIC GRID CAN HANDLE THE INTEGRATION OF HIGHER AMOUNTS OF SOLAR
GENERATION. To meet the target, Vermont must integrate 1 GW of solar capacity into Vermont’s electric grid
(which currently peaks at 1 GW). This will require more planning, investment, and upgrades to
hardware and operations systems. Technologies and strategies available today can safely and
reliably meet these challenges. Many initiatives, collaborations, and new business approaches in
Vermont and elsewhere will help the state meet these challenges.
SOLAR CAN HELP LOW- AND MODERATE-INCOME HOUSEHOLDS AFFORD ENERGY. Great opportunity exists for projects that combine solar and efficiency in increasing energy
affordability for low- and moderate-income households. Applying social and energy justice in every
project is critical for VEIC. Vermont already has business models, financial strategies, and
philanthropic initiatives to support this segment of market growth.
SOLAR INTERACTS WELL WITH OTHER ENERGY TECHNOLOGIES AND EMERGING MARKETS. Solar and energy efficiency are the most common examples of distributed energy resources (DERs).
DERs can also be energy storage, electric load shaping, and demand response. DERs are reshaping
energy markets and delivery infrastructure in Vermont and elsewhere. Technical and market
advances in Vermont are making electrification of vehicles and space conditioning more attractive.
As they accelerate, they will help drive the growth of solar energy, and be driven by it.
THE VERMONT SOLAR PATHWAYS TARGET WILL HELP THE STATE MEET ENERGY,
ENVIRONMENTAL, AND OTHER POLICY GOALS. Vermont has policy targets for meeting 90 percent of the state’s total energy needs with renewable
resources by 2050 (“90 x 2050”). Vermont Solar Pathways indicates solar is an important contributor
for meeting this target in economically and socially equitable ways. Moreover, installing solar energy
in Vermont keeps energy expenditures in the state, and reduces dependence on imported fuels.
These economic benefits are consistent with Vermont’s policy objectives and public opinion.
Meeting these targets offers opportunities for Vermont’s utilities and businesses to continuously
improve and to innovate—and positions them to influence energy markets outside the state.
Executive Summary Page 3
A Prudent Investment
The net costs for the advanced solar scenarios are only a small fraction of the state’s annual
energy expenditures and investments. In fact, through 2025, total expenditures in the Reference
scenario and in the SDP scenario are within 1 percent of each other. Given variability in energy
prices, and the minimal cost difference between the two scenarios, the results indicate that it is
economically viable, and prudent for Vermont to invest in a cleaner and a more diverse energy
portfolio, based on renewable resources, highly efficient end uses, and a de-carbonized electric
supply.
The research results indicate that investments that support high amounts of solar energy
generation in Vermont promise significant future economic return. Extending the analysis
through 2050, the investments in solar and efficiency result in almost $8 billion of net savings to
Vermont consumers. The SDP scenario also reduces greenhouse gas and other emissions, while
securing energy resources with less volatile prices, resulting in a more robust and reliable energy
system.
Accommodating Solar Generation This High Is Feasible
Solar is an intermittent and variable resource for an electricity grid that must meet the demand
for power 24 hours a day, under all conditions. Issues arise from the distribution system, which
delivers electricity to the customer, and at the bulk power system level, which interconnects
Vermont to the larger regional power markets. Integrating 1 GW of solar capacity into Vermont’s
electric grid (peaks at 1 GW) will require ongoing research, investment, and upgrades to
operations and planning systems. Today’s technologies and strategies can safely and reliably
meet these challenges, with the help of many initiatives, collaborations, and new business
approaches.
Buildings that combine improved energy performance from efficiency with appropriately sited
solar installations can lower and stabilize monthly costs for limited-income households.
Traditional electricity markets see homes and businesses as energy loads. DERs, on the other
hand, can shape and shift consumer energy demand to provide energy generation and storage.
The markets, business models, and regulatory policies to expand DERs are still developing.
Nevertheless, DERs are clearly reshaping energy markets and energy delivery infrastructure.
Vermont’s technical and market advances are making electrification of vehicles and space
conditioning more attractive, trends that are likely to accelerate.
As the economics of solar continue to improve—through reductions in hardware and installation
costs, and with evolving improvements in controls and storage—technical solutions for effective
grid integration increase. With increased durability of business models for solar and related
technology, more states will likely consider a high-saturation solar future. In addition, with more
public attention paid to the social and environmental impacts of energy use, more states might
adopt climate goals similar to Vermont’s 90 x 2050 target. Helping to meet these targets will
reduce serious environmental challenges and provide economic opportunity.
Vermont Solar Market Pathways / Volume 1: Summary Report Page 4
Vermont Solar Market Pathways: Consumer Perspectives from 2025
This Summary Report envisions the possible pathways to get to Vermont’s advanced solar
economy, with 20 percent of electric generation supplied from solar by 2025. Before presenting
analysis and research results, we start with a visit to the future, looking at two types of Vermont
household. These are imaginary examples, but they are grounded in market trends and
possibilities that are emerging today.
The consumer perspective highlights how the value, benefits, and demand for solar and other
energy services will drive many of the changes to come. Supported by strong policy and
regulatory structures discussed in this report, solar and other energy services can respond to
consumer demand and provide lasting value to Vermont in new and original ways.
We look first at the kinds of spaces Vermont households are occupying in this imagined future.
One household resides in a relatively new home; the other occupies a classic Vermont
farmhouse. What they have in common is that they are looking at energy in a different way from
how households in 2016 Vermont look at energy. They are both paying less than their 2016
counterparts are, and they are engaged in new ways with the communities in which they reside.
High Performance and Affordable New Homes
It is a clear day, in summer 2025. You are sitting on the porch of your house, enjoying a cold
lemonade. The porch is located at the back of the high-performance modular home you had a
local company build and install in 2020. Back then, it was still an unusual concept: a house so
efficient, its rooftop solar panels could supply all of the energy the household would need. It is
called a zero energy modular (ZEM) home. Design and building practices in 2025 are increasingly
bringing zero energy performance to modular homes and to other segments of the market.
Today, almost all new homebuyers have the ability to compare design options and specify the
benefits they want to receive from zero energy homes. The number of modular homebuilders
and other builders of efficient housing has risen to meet demand.
Executive Summary Page 5
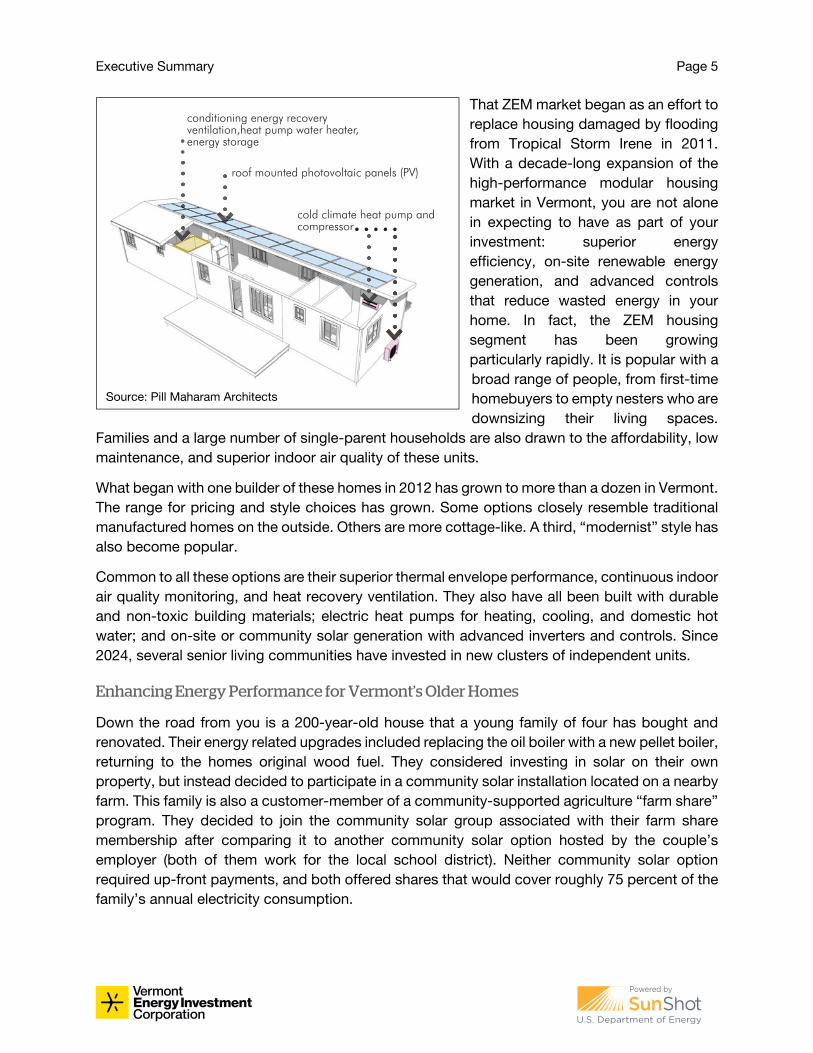
That ZEM market began as an effort to
replace housing damaged by flooding
from Tropical Storm Irene in 2011.
With a decade-long expansion of the
high-performance modular housing
market in Vermont, you are not alone
in expecting to have as part of your
investment: superior energy
efficiency, on-site renewable energy
generation, and advanced controls
that reduce wasted energy in your
home. In fact, the ZEM housing
segment has been growing
particularly rapidly. It is popular with a
broad range of people, from first-time
homebuyers to empty nesters who are
downsizing their living spaces.
Families and a large number of single-parent households are also drawn to the affordability, low
maintenance, and superior indoor air quality of these units.
What began with one builder of these homes in 2012 has grown to more than a dozen in Vermont.
The range for pricing and style choices has grown. Some options closely resemble traditional
manufactured homes on the outside. Others are more cottage-like. A third, “modernist” style has
also become popular.
Common to all these options are their superior thermal envelope performance, continuous indoor
air quality monitoring, and heat recovery ventilation. They also have all been built with durable
and non-toxic building materials; electric heat pumps for heating, cooling, and domestic hot
water; and on-site or community solar generation with advanced inverters and controls. Since
2024, several senior living communities have invested in new clusters of independent units.
Enhancing Energy Performance for Vermont’s Older Homes
Down the road from you is a 200-year-old house that a young family of four has bought and
renovated. Their energy related upgrades included replacing the oil boiler with a new pellet boiler,
returning to the homes original wood fuel. They considered investing in solar on their own
property, but instead decided to participate in a community solar installation located on a nearby
farm. This family is also a customer-member of a community-supported agriculture “farm share”
program. They decided to join the community solar group associated with their farm share
membership after comparing it to another community solar option hosted by the couple’s
employer (both of them work for the local school district). Neither community solar option
required up-front payments, and both offered shares that would cover roughly 75 percent of the
family’s annual electricity consumption.
roof mounted photovoltaic panels (PV)
conditioning energy recovery ventilation,heat pump water heater, energy storage
cold climate heat pump and compressor
Source: Pill Maharam Architects
Vermont Solar Market Pathways / Volume 1: Summary Report Page 6
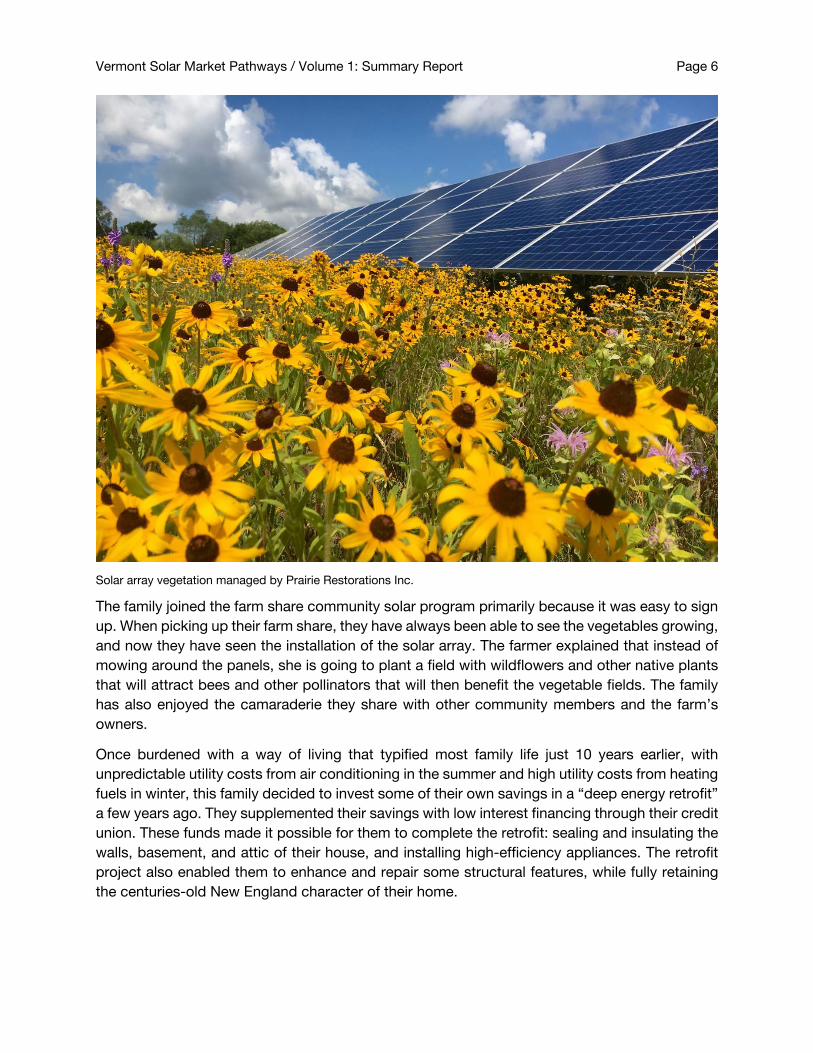
Solar array vegetation managed by Prairie Restorations Inc.
The family joined the farm share community solar program primarily because it was easy to sign
up. When picking up their farm share, they have always been able to see the vegetables growing,
and now they have seen the installation of the solar array. The farmer explained that instead of
mowing around the panels, she is going to plant a field with wildflowers and other native plants
that will attract bees and other pollinators that will then benefit the vegetable fields. The family
has also enjoyed the camaraderie they share with other community members and the farm’s
owners.
Once burdened with a way of living that typified most family life just 10 years earlier, with
unpredictable utility costs from air conditioning in the summer and high utility costs from heating
fuels in winter, this family decided to invest some of their own savings in a “deep energy retrofit”
a few years ago. They supplemented their savings with low interest financing through their credit
union. These funds made it possible for them to complete the retrofit: sealing and insulating the
walls, basement, and attic of their house, and installing high-efficiency appliances. The retrofit
project also enabled them to enhance and repair some structural features, while fully retaining
the centuries-old New England character of their home.
Executive Summary Page 7
Pathways to the Solar Future
The transition to becoming an advanced solar economy is already under way and is contributing
to Vermont meeting the broader target of obtaining 90 percent of the state’s total energy from
renewable resources by 2050.1 In this study, we investigate requirements for reaching 20 percent
of the total electric generation by 2025, and we present these results and analysis in the context
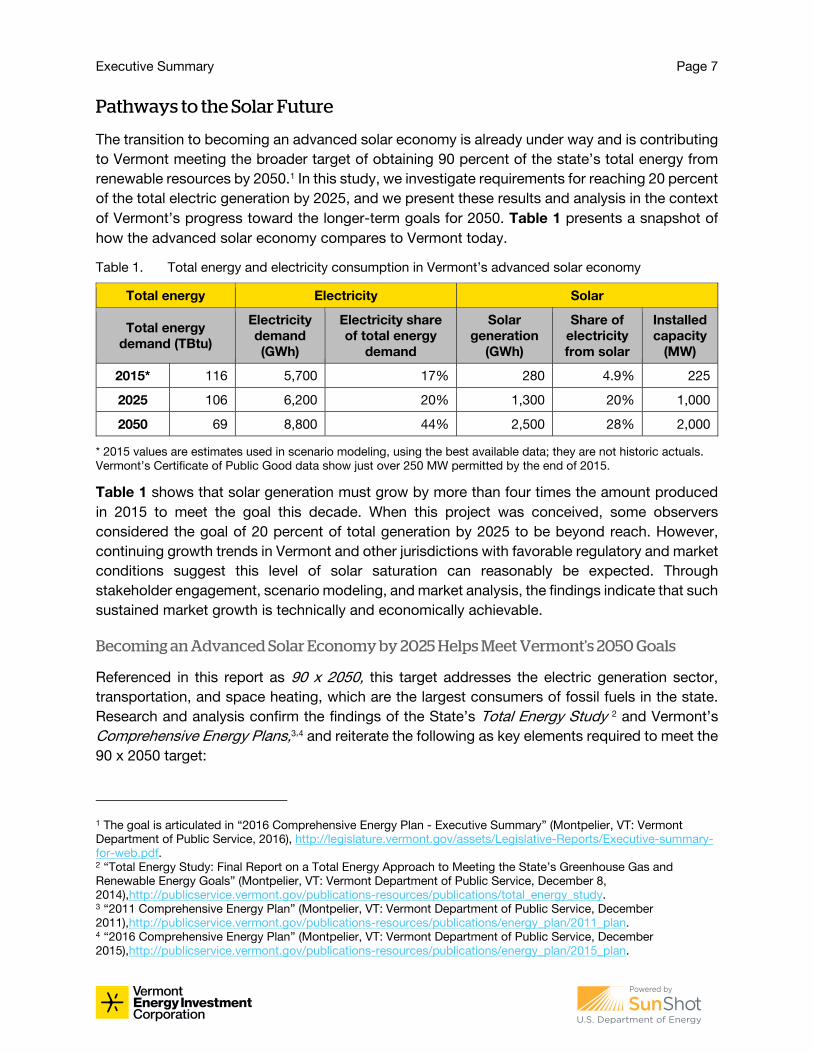
of Vermont’s progress toward the longer-term goals for 2050. Table 1 presents a snapshot of
how the advanced solar economy compares to Vermont today.
Table 1. Total energy and electricity consumption in Vermont’s advanced solar economy
Total energy Electricity Solar
Total energy
demand (TBtu)
Electricity
demand
(GWh)
Electricity share
of total energy
demand
Solar
generation
(GWh)
Share of
electricity
from solar
Installed
capacity
(MW)
2015* 116 5,700 17% 280 4.9% 225
2025 106 6,200 20% 1,300 20% 1,000
2050 69 8,800 44% 2,500 28% 2,000
* 2015 values are estimates used in scenario modeling, using the best available data; they are not historic actuals.
Vermont’s Certificate of Public Good data show just over 250 MW permitted by the end of 2015.
Table 1 shows that solar generation must grow by more than four times the amount produced
in 2015 to meet the goal this decade. When this project was conceived, some observers
considered the goal of 20 percent of total generation by 2025 to be beyond reach. However,
continuing growth trends in Vermont and other jurisdictions with favorable regulatory and market
conditions suggest this level of solar saturation can reasonably be expected. Through
stakeholder engagement, scenario modeling, and market analysis, the findings indicate that such
sustained market growth is technically and economically achievable.
Becoming an Advanced Solar Economy by 2025 Helps Meet Vermont’s 2050 Goals
Referenced in this report as 90 x 2050, this target addresses the electric generation sector,
transportation, and space heating, which are the largest consumers of fossil fuels in the state.
Research and analysis confirm the findings of the State’s Total Energy Study 2 and Vermont’s
Comprehensive Energy Plans,3,4 and reiterate the following as key elements required to meet the
90 x 2050 target:
1 The goal is articulated in “2016 Comprehensive Energy Plan - Executive Summary” (Montpelier, VT: Vermont
Department of Public Service, 2016), http://legislature.vermont.gov/assets/Legislative-Reports/Executive-summary-
for-web.pdf. 2 “Total Energy Study: Final Report on a Total Energy Approach to Meeting the State’s Greenhouse Gas and
Renewable Energy Goals” (Montpelier, VT: Vermont Department of Public Service, December 8,
2014),http://publicservice.vermont.gov/publications-resources/publications/total_energy_study. 3 “2011 Comprehensive Energy Plan” (Montpelier, VT: Vermont Department of Public Service, December
2011),http://publicservice.vermont.gov/publications-resources/publications/energy_plan/2011_plan. 4 “2016 Comprehensive Energy Plan” (Montpelier, VT: Vermont Department of Public Service, December
2015),http://publicservice.vermont.gov/publications-resources/publications/energy_plan/2015_plan.
Vermont Solar Market Pathways / Volume 1: Summary Report Page 8
• Energy efficiency across all sectors and end uses;
• Fuel switching from fossil fuels (particularly for space heating and transportation) to
electricity and biomass; and
• Decarbonization of the electric grid through increased solar and other renewables.
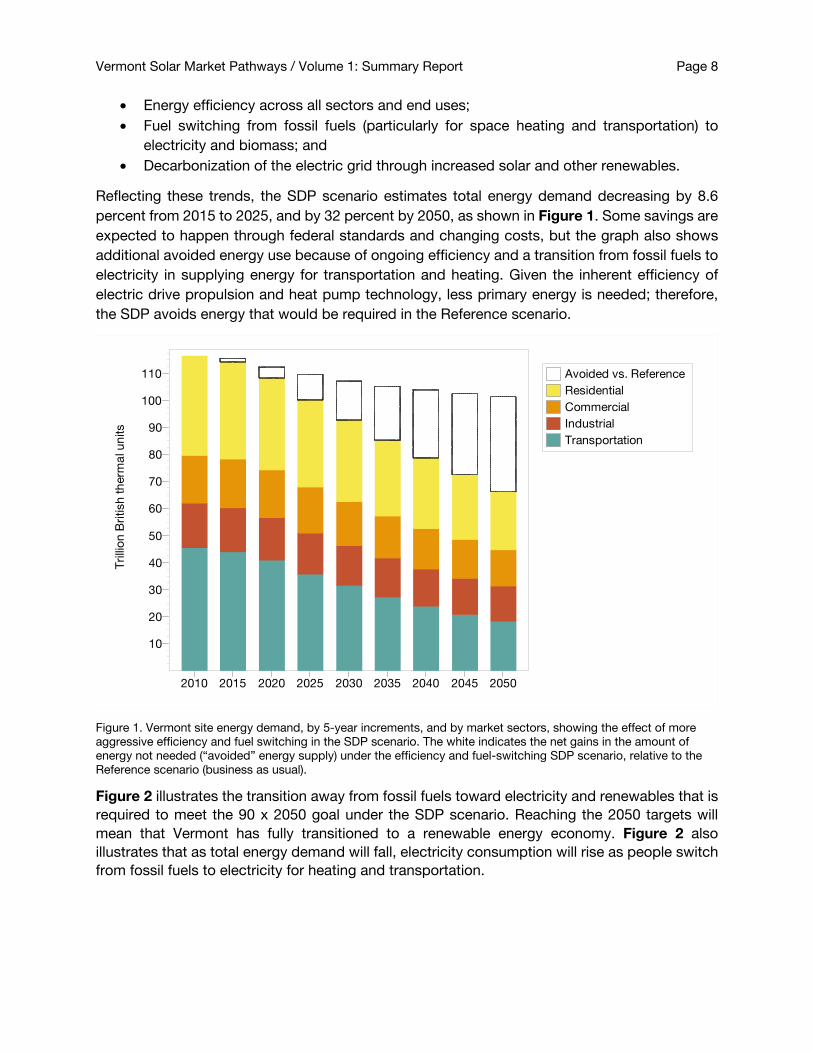
Reflecting these trends, the SDP scenario estimates total energy demand decreasing by 8.6
percent from 2015 to 2025, and by 32 percent by 2050, as shown in Figure 1. Some savings are
expected to happen through federal standards and changing costs, but the graph also shows
additional avoided energy use because of ongoing efficiency and a transition from fossil fuels to
electricity in supplying energy for transportation and heating. Given the inherent efficiency of
electric drive propulsion and heat pump technology, less primary energy is needed; therefore,
the SDP avoids energy that would be required in the Reference scenario.
Figure 1. Vermont site energy demand, by 5-year increments, and by market sectors, showing the effect of more
aggressive efficiency and fuel switching in the SDP scenario. The white indicates the net gains in the amount of
energy not needed (“avoided” energy supply) under the efficiency and fuel-switching SDP scenario, relative to the
Reference scenario (business as usual).
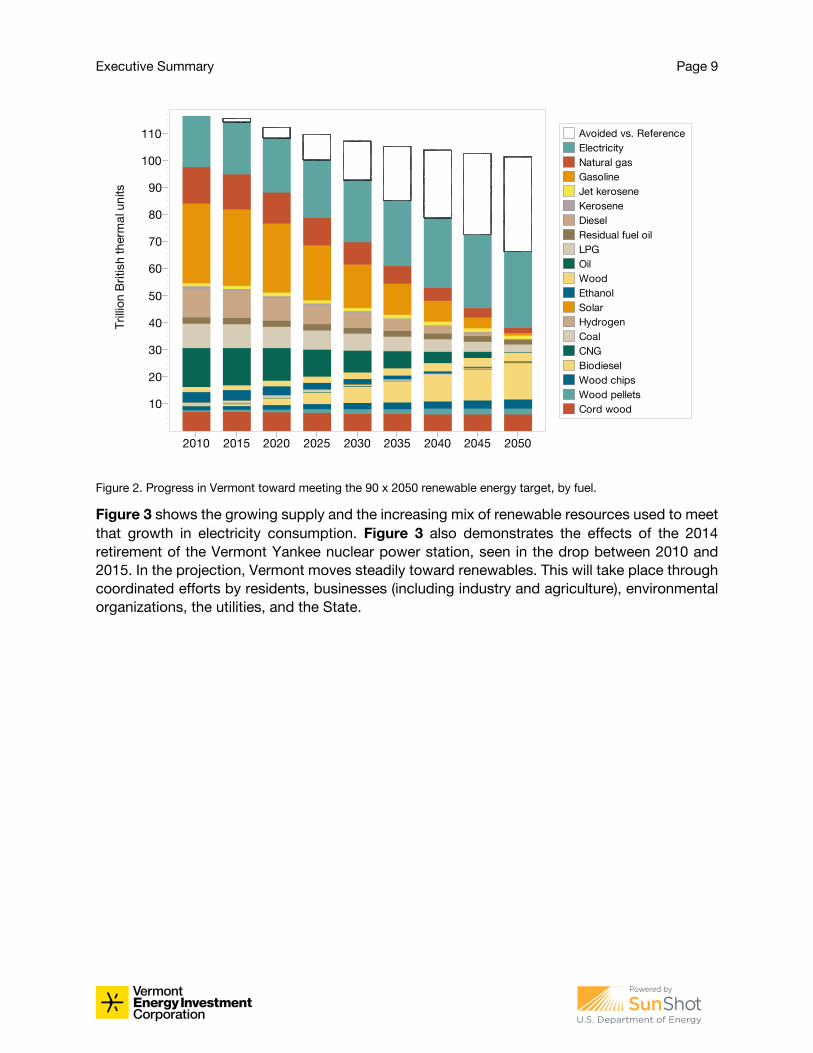
Figure 2 illustrates the transition away from fossil fuels toward electricity and renewables that is
required to meet the 90 x 2050 goal under the SDP scenario. Reaching the 2050 targets will
mean that Vermont has fully transitioned to a renewable energy economy. Figure 2 also
illustrates that as total energy demand will fall, electricity consumption will rise as people switch
from fossil fuels to electricity for heating and transportation.
2010 2015 2020 2025 2030 2035 2040 2045 2050
Tri
llio
n B
ritish
th
erm
al u
nits
110
100
90
80
70
60
50
40
30
20
10
Avoided vs. Reference
Residential
Commercial
Industrial
Transportation
Executive Summary Page 9
Figure 2. Progress in Vermont toward meeting the 90 x 2050 renewable energy target, by fuel.
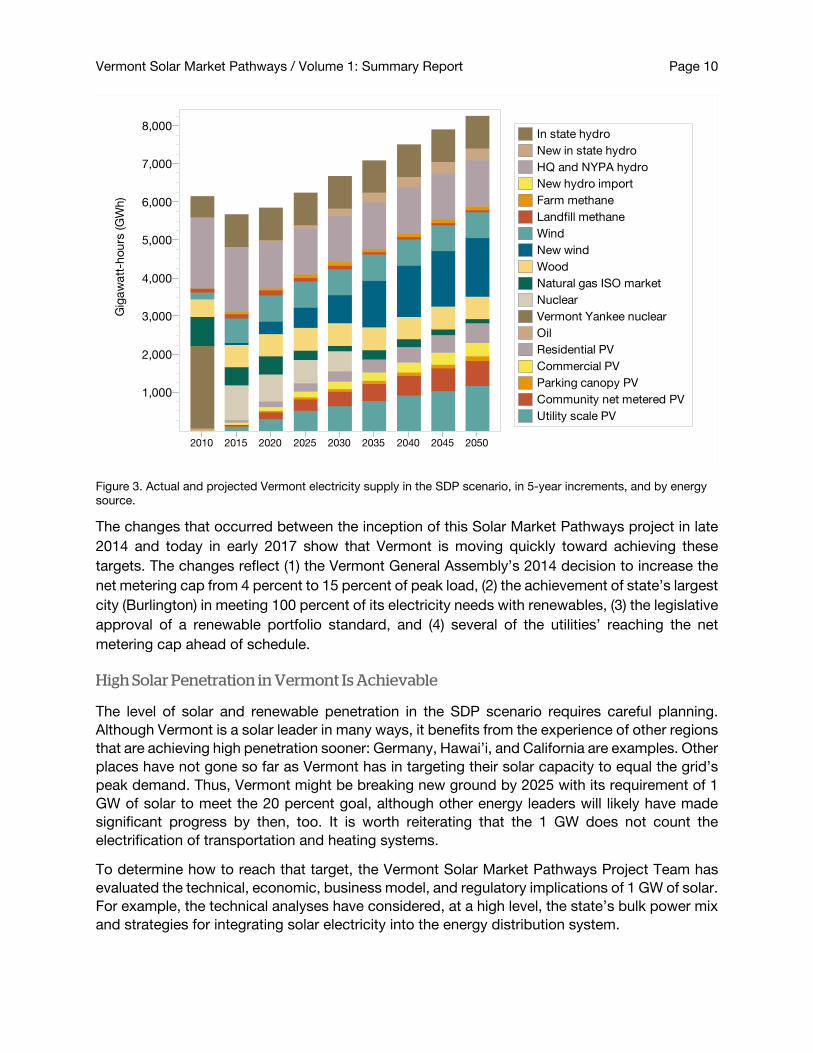
Figure 3 shows the growing supply and the increasing mix of renewable resources used to meet
that growth in electricity consumption. Figure 3 also demonstrates the effects of the 2014
retirement of the Vermont Yankee nuclear power station, seen in the drop between 2010 and
2015. In the projection, Vermont moves steadily toward renewables. This will take place through
coordinated efforts by residents, businesses (including industry and agriculture), environmental
organizations, the utilities, and the State.
2010 2015 2020 2025 2030 2035 2040 2045 2050
Tri
llio
n B
ritish
th
erm
al u
nits
110
100
90
80
70
60
50
40
30
20
10
Avoided vs. Reference
Electricity
Natural gas
Gasoline
Jet kerosene
Kerosene
Diesel
Residual fuel oil
LPG
Oil
Wood
Ethanol
Solar
Hydrogen
Coal
CNG
Biodiesel
Wood chips
Wood pellets
Cord wood
Vermont Solar Market Pathways / Volume 1: Summary Report Page 10
Figure 3. Actual and projected Vermont electricity supply in the SDP scenario, in 5-year increments, and by energy
source.
The changes that occurred between the inception of this Solar Market Pathways project in late
2014 and today in early 2017 show that Vermont is moving quickly toward achieving these
targets. The changes reflect (1) the Vermont General Assembly’s 2014 decision to increase the
net metering cap from 4 percent to 15 percent of peak load, (2) the achievement of state’s largest
city (Burlington) in meeting 100 percent of its electricity needs with renewables, (3) the legislative
approval of a renewable portfolio standard, and (4) several of the utilities’ reaching the net
metering cap ahead of schedule.
High Solar Penetration in Vermont Is Achievable
The level of solar and renewable penetration in the SDP scenario requires careful planning.
Although Vermont is a solar leader in many ways, it benefits from the experience of other regions
that are achieving high penetration sooner: Germany, Hawai’i, and California are examples. Other
places have not gone so far as Vermont has in targeting their solar capacity to equal the grid’s
peak demand. Thus, Vermont might be breaking new ground by 2025 with its requirement of 1
GW of solar to meet the 20 percent goal, although other energy leaders will likely have made
significant progress by then, too. It is worth reiterating that the 1 GW does not count the
electrification of transportation and heating systems.
To determine how to reach that target, the Vermont Solar Market Pathways Project Team has
evaluated the technical, economic, business model, and regulatory implications of 1 GW of solar.
For example, the technical analyses have considered, at a high level, the state’s bulk power mix
and strategies for integrating solar electricity into the energy distribution system.
2010 2015 2020 2025 2030 2035 2040 2045 2050
Gig
aw
att
-ho
urs
(G
Wh
)8,000
7,000
6,000
5,000
4,000
3,000
2,000
1,000
In state hydro
New in state hydro
HQ and NYPA hydro
New hydro import
Farm methane
Landfill methane
Wind
New wind
Wood
Natural gas ISO market
Nuclear
Vermont Yankee nuclear
Oil
Residential PV
Commercial PV
Parking canopy PV
Community net metered PV
Utility scale PV
Executive Summary Page 11
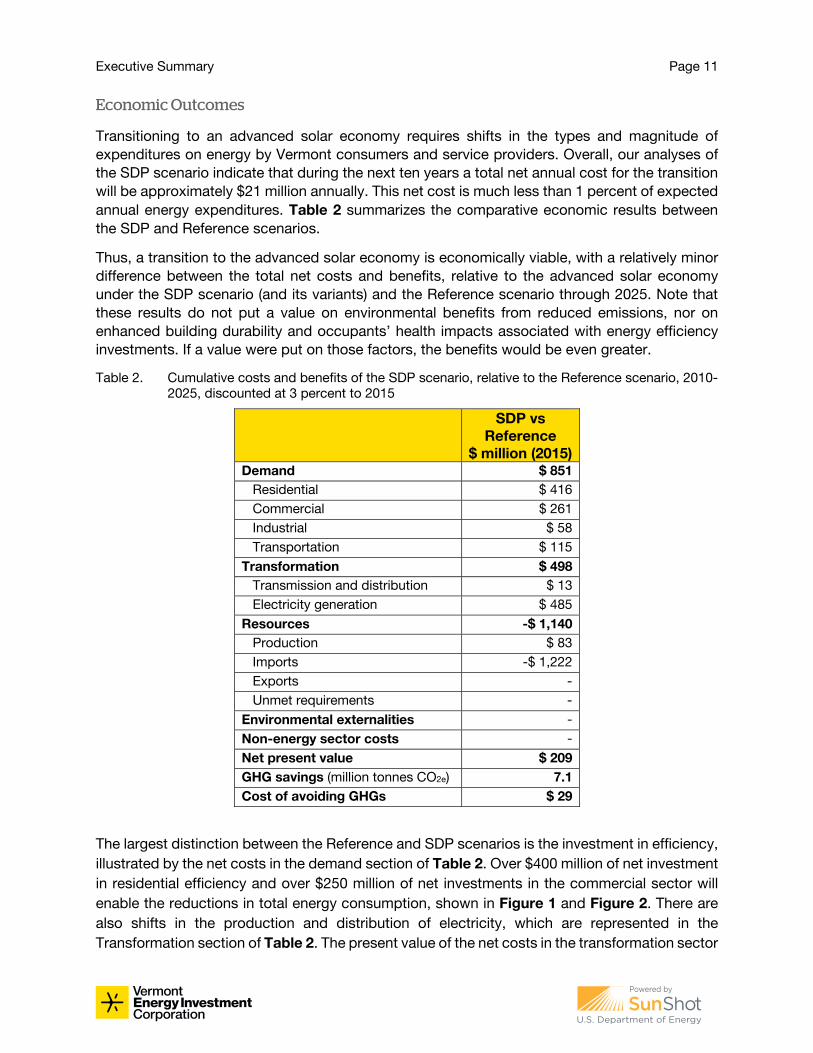
Economic Outcomes
Transitioning to an advanced solar economy requires shifts in the types and magnitude of
expenditures on energy by Vermont consumers and service providers. Overall, our analyses of
the SDP scenario indicate that during the next ten years a total net annual cost for the transition
will be approximately $21 million annually. This net cost is much less than 1 percent of expected
annual energy expenditures. Table 2 summarizes the comparative economic results between
the SDP and Reference scenarios.
Thus, a transition to the advanced solar economy is economically viable, with a relatively minor
difference between the total net costs and benefits, relative to the advanced solar economy
under the SDP scenario (and its variants) and the Reference scenario through 2025. Note that
these results do not put a value on environmental benefits from reduced emissions, nor on
enhanced building durability and occupants’ health impacts associated with energy efficiency
investments. If a value were put on those factors, the benefits would be even greater.
Table 2. Cumulative costs and benefits of the SDP scenario, relative to the Reference scenario, 2010-
2025, discounted at 3 percent to 2015
SDP vs
Reference
$ million (2015)
Demand $ 851
Residential $ 416
Commercial $ 261
Industrial $ 58
Transportation $ 115
Transformation $ 498
Transmission and distribution $ 13
Electricity generation $ 485
Resources -$ 1,140
Production $ 83
Imports -$ 1,222
Exports -
Unmet requirements -
Environmental externalities -
Non-energy sector costs -
Net present value $ 209
GHG savings (million tonnes CO2e) 7.1
Cost of avoiding GHGs $ 29
The largest distinction between the Reference and SDP scenarios is the investment in efficiency,
illustrated by the net costs in the demand section of Table 2. Over $400 million of net investment
in residential efficiency and over $250 million of net investments in the commercial sector will
enable the reductions in total energy consumption, shown in Figure 1 and Figure 2. There are
also shifts in the production and distribution of electricity, which are represented in the
Transformation section of Table 2. The present value of the net costs in the transformation sector
Vermont Solar Market Pathways / Volume 1: Summary Report Page 12
for the SDP scenario is $498 million. The benefits from these shifts in expenditures and
investments are reflected in a significant reduction in net resource imports, more than $1.2
billion.
By extending the analysis through 2050, the net benefits of the transition to an advanced solar
economy far outweigh the costs, providing close to $8 billion of economic benefits to the state.
In the advanced solar economy, significantly less of Vermont’s energy expenditure will go to
energy providers outside the state. The SDP reduces money spent on fuel imports (money sent
out of state) by approximately $1.2 billion from 2015-2025, compared to the Reference scenario.
Additional economic results are presented in Section 3.3 of this volume and in Volume 4.
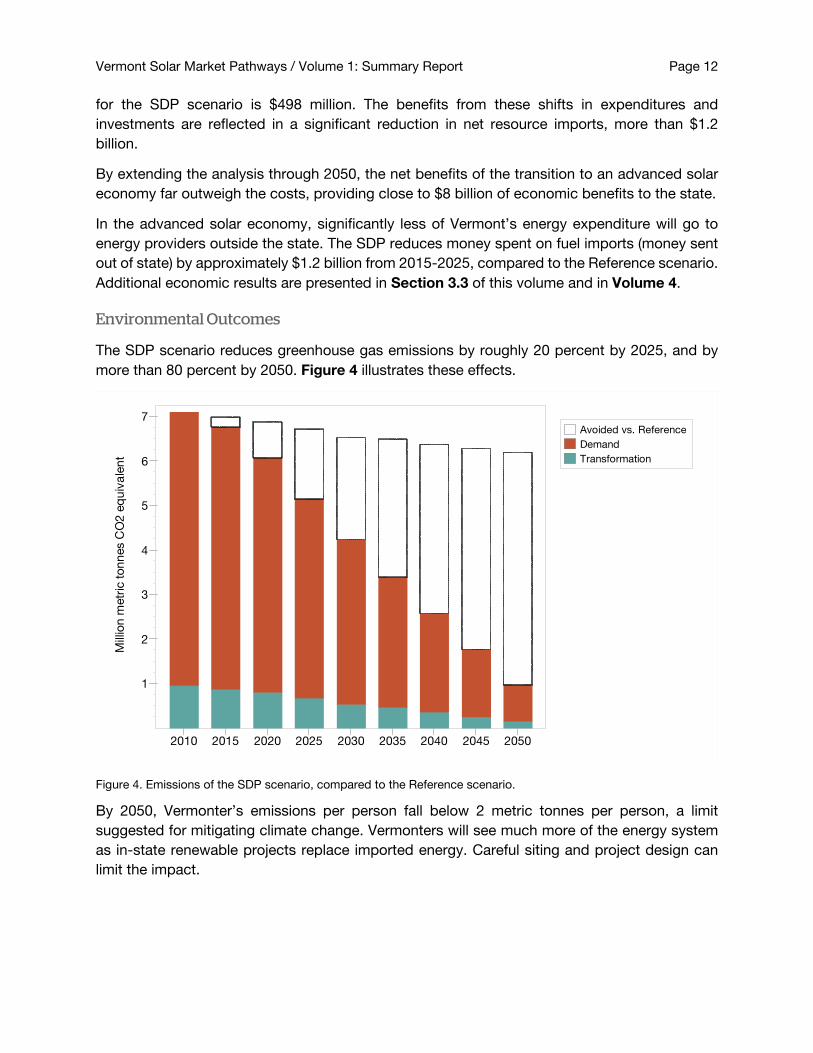
Environmental Outcomes
The SDP scenario reduces greenhouse gas emissions by roughly 20 percent by 2025, and by
more than 80 percent by 2050. Figure 4 illustrates these effects.
Figure 4. Emissions of the SDP scenario, compared to the Reference scenario.
By 2050, Vermonter’s emissions per person fall below 2 metric tonnes per person, a limit
suggested for mitigating climate change. Vermonters will see much more of the energy system
as in-state renewable projects replace imported energy. Careful siting and project design can
limit the impact.
2010 2015 2020 2025 2030 2035 2040 2045 2050
Mill
ion
metr
ic t
on
nes C
O2
eq
uiv
ale
nt
7
6
5
4
3
2
1
Avoided vs. Reference
Demand
Transformation
Executive Summary Page 13
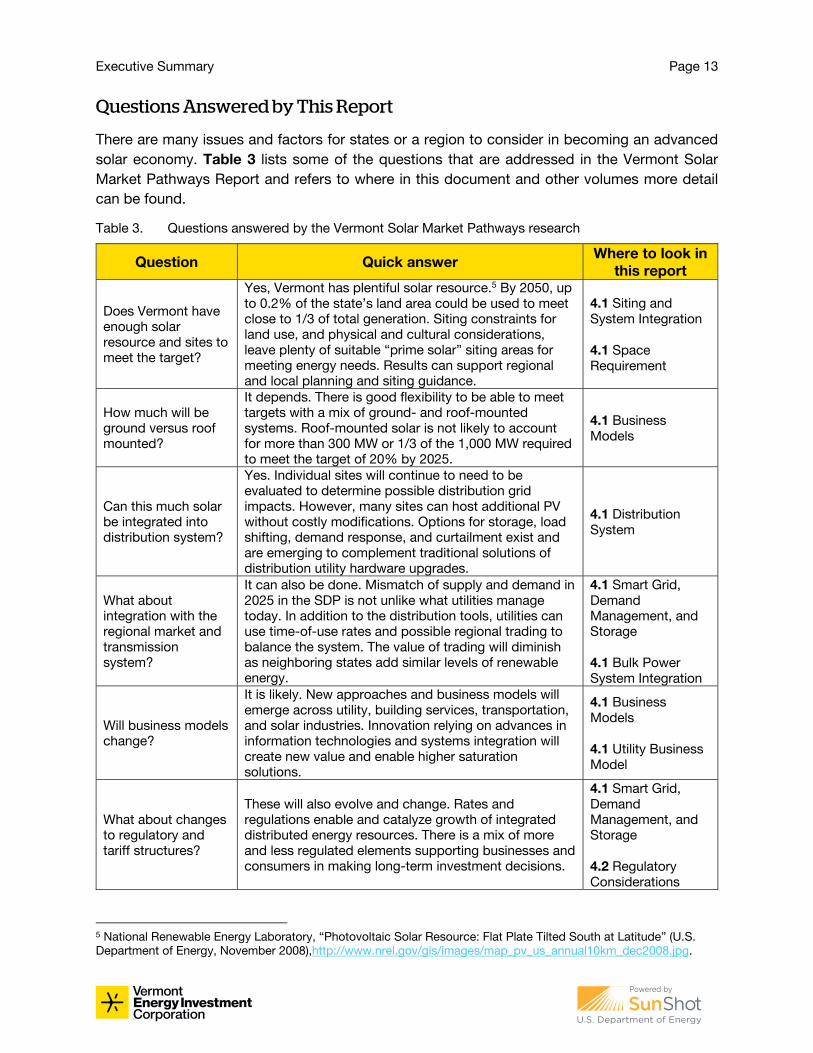
Questions Answered by This Report
There are many issues and factors for states or a region to consider in becoming an advanced
solar economy. Table 3 lists some of the questions that are addressed in the Vermont Solar
Market Pathways Report and refers to where in this document and other volumes more detail
can be found.
Table 3. Questions answered by the Vermont Solar Market Pathways research
Question Quick answer Where to look in
this report
Does Vermont have
enough solar
resource and sites to
meet the target?
Yes, Vermont has plentiful solar resource.5 By 2050, up
to 0.2% of the state’s land area could be used to meet
close to 1/3 of total generation. Siting constraints for
land use, and physical and cultural considerations,
leave plenty of suitable “prime solar” siting areas for
meeting energy needs. Results can support regional
and local planning and siting guidance.
4.1 Siting and
System Integration
4.1 Space
Requirement
How much will be
ground versus roof
mounted?
It depends. There is good flexibility to be able to meet
targets with a mix of ground- and roof-mounted
systems. Roof-mounted solar is not likely to account
for more than 300 MW or 1/3 of the 1,000 MW required
to meet the target of 20% by 2025.
4.1 Business
Models
Can this much solar
be integrated into
distribution system?
Yes. Individual sites will continue to need to be
evaluated to determine possible distribution grid
impacts. However, many sites can host additional PV
without costly modifications. Options for storage, load
shifting, demand response, and curtailment exist and
are emerging to complement traditional solutions of
distribution utility hardware upgrades.
4.1 Distribution
System
What about
integration with the
regional market and
transmission
system?
It can also be done. Mismatch of supply and demand in
2025 in the SDP is not unlike what utilities manage
today. In addition to the distribution tools, utilities can
use time-of-use rates and possible regional trading to
balance the system. The value of trading will diminish
as neighboring states add similar levels of renewable
energy.
4.1 Smart Grid,
Demand
Management, and
Storage
4.1 Bulk Power
System Integration
Will business models
change?
It is likely. New approaches and business models will
emerge across utility, building services, transportation,
and solar industries. Innovation relying on advances in
information technologies and systems integration will
create new value and enable higher saturation
solutions.
4.1 Business
Models
4.1 Utility Business
Model
What about changes
to regulatory and
tariff structures?
These will also evolve and change. Rates and
regulations enable and catalyze growth of integrated
distributed energy resources. There is a mix of more
and less regulated elements supporting businesses and
consumers in making long-term investment decisions.
4.1 Smart Grid,
Demand
Management, and
Storage
4.2 Regulatory
Considerations
5 National Renewable Energy Laboratory, “Photovoltaic Solar Resource: Flat Plate Tilted South at Latitude” (U.S.
Department of Energy, November 2008),http://www.nrel.gov/gis/images/map_pv_us_annual10km_dec2008.jpg.
Vermont Solar Market Pathways / Volume 1: Summary Report Page 14
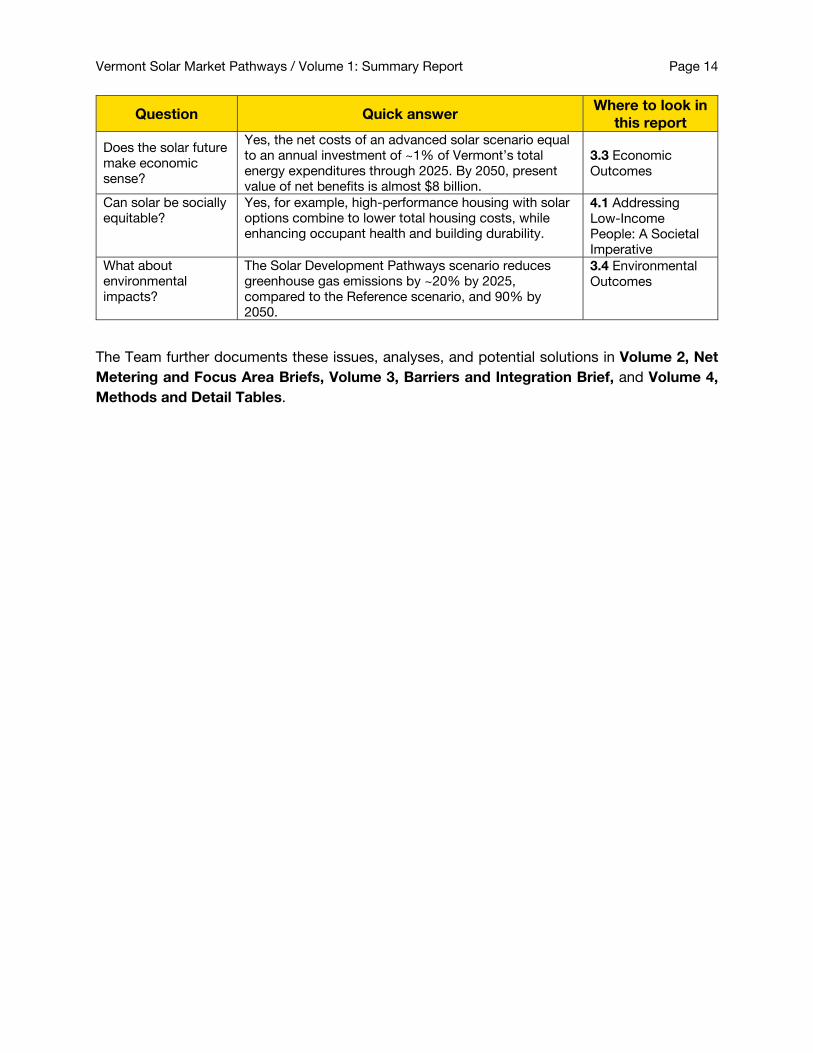
Question Quick answer Where to look in
this report
Does the solar future
make economic
sense?
Yes, the net costs of an advanced solar scenario equal
to an annual investment of ~1% of Vermont’s total
energy expenditures through 2025. By 2050, present
value of net benefits is almost $8 billion.
3.3 Economic
Outcomes
Can solar be socially
equitable?
Yes, for example, high-performance housing with solar
options combine to lower total housing costs, while
enhancing occupant health and building durability.
4.1 Addressing
Low-Income
People: A Societal
Imperative
What about
environmental
impacts?
The Solar Development Pathways scenario reduces
greenhouse gas emissions by ~20% by 2025,
compared to the Reference scenario, and 90% by
2050.
3.4 Environmental
Outcomes
The Team further documents these issues, analyses, and potential solutions in Volume 2, Net
Metering and Focus Area Briefs, Volume 3, Barriers and Integration Brief, and Volume 4,
Methods and Detail Tables.
1. Introduction
1.1 SunShot Objectives.
This project is one of 15 receiving U.S. Department of Energy (DOE) Solar Market Pathways
Program support, within DOE’s SunShot Initiative. The specific aim of the SunShot Initiative is to
reduce the levelized cost of solar energy systems to $.06 per kWh by 2020. As of the halfway
point in the timeline for achieving this goal, SunShot officials estimate that approximately 70
percent of this goal has been met. Since SunShot's launch in 2011, the average price per kWh
of energy from a utility-scale photovoltaic (PV) project has dropped from about $0.21 to $0.11.
A major goal of the Solar Market Pathways Program is to make solar deployment faster, easier,
and less expensive than it was in 2011, across the United States. The case studies and lessons
learned from the 15 awarded Solar Market Pathways projects will provide examples that can be
replicated in other jurisdictions—in support of this goal.
1.2 Vermont Solar Market Pathways Objectives
The essential objective of this Vermont Solar Market Pathways project is to examine what is
required to attain 20 percent solar generation by 2025, and what the effects of a transition to
such an advanced solar economy would be.
Comprehensive solar planning can contribute to lower solar costs through specific mechanisms.
By taking a long-term planning perspective and integrating the growth of the solar market into
the state’s overall energy economy, Vermont Solar Market Pathways will help policy makers,
local planning commissions, and the market understand both the potential and the potential
barriers to an advanced solar market. This understanding will improve the chances for sustained
market growth and investment.
Comprehensive solar strategies and plans can provide greater certainty to businesses,
institutions, and utilities investing in solar. This certainty is expected to help lower the soft costs
associated with solar energy. By sharing experience and approaches to identifying and
addressing barriers to achieving high levels of solar, plans such as this one will also help lower
the costs of addressing these barriers.
Moreover, Vermont Solar Market Pathways supports general objectives of regional planning,
public discourse, and decision making on increasing the use of solar energy by individuals and
businesses.
1.3 Vermont Background
Strong Policy Supports an Advanced Solar Economy
The Vermont Department of Public Service undertook its Total Energy Study (TES) in 2014,
publishing the results in December of that year. Its primary conclusion was that “Vermont can
Vermont Solar Market Pathways / Volume 1: Summary Report Page 16
achieve its greenhouse gas emission reduction goals and its renewable energy goals to do so
will require significant changes in energy policy, fuel supply, infrastructure, and technology.” 6
In 2015, the Vermont General Assembly passed the state’s first renewable portfolio standard,
known as the Renewable Energy Standard (Act 56), which encourages increases in renewable
energy supply as a way to reduce total energy use and costs.7 The Renewable Energy Standard
does not contain a carve-out for solar credit. Because of this, the Standard did not create solar
renewable energy certificates (SRECs), a common mechanism for advancing accompanying
renewable portfolio standards. Nevertheless, the Standard requires 10 percent of electricity to
come from distributed generation; we expect solar to provide most of that requirement.
Vermont’s Renewable Energy Standard is unique in compelling distribution utilities to support
the reduction of fossil fuel consumption through actions like weatherization, thermal efficiency
measures, and electrification of energy uses traditionally powered by fossil fuels such as heat
pumps and electric vehicles.
Vermont’s Demographics
Vermont has a small population (626,000 inhabitants), occupying 326,000 housing units, most
of which (71 percent) are owner-occupied housing units—primarily single-family houses.8
Excepting Burlington area, the U.S. Department of Agriculture considers the state’s population
to be rural. Winters are relatively long, and energy burden is a challenge for many Vermont
households. The median Vermont household income is $54,000, only slightly higher than the
national average of $53,000.9 Nevertheless, with a state goal of meeting 90 percent of total
energy needs from renewable sources by 2050 (90 x 2050), Vermont policy makers have an
advanced vision for achieving energy security and environmental benefits for its inhabitants.
Over 130 MW of net metered solar supplies energy to homes, farms, businesses, and
communities.10 Further, the presence of renewable energy in the supply mix has kept electricity
costs at or below the rate of inflation.11
The Vermont Department of Public Service estimates that nearly 5 percent of Vermont’s
workforce (16,000 jobs) is in the clean energy sector.12
A Recent History of Energy Supply and Use in Vermont
Vermont has a single transmission system operated by the Vermont Electric Power Company
(VELCO). Seventeen local distribution utilities (municipalities, rural electric cooperatives, and an
investor-owned utility) provide retail service.
6 “Total Energy Study: Final Report on a Total Energy Approach to Meeting the State’s Greenhouse Gas and
Renewable Energy Goals.” 7 General Assembly of the State of Vermont, An Act Relating to Establishing a Renewable Energy Standard,
2015,http://legislature.vermont.gov/assets/Documents/2016/Docs/ACTS/ACT056/ACT056%20As%20Enacted.pdf. 8 “Quick Facts: Vermont,” U.S. Census Bureau, 2015, www.census.gov/quickfacts/table/PST045215/50. 9 Ibid. 10 Department of Public Service, Certificate of Public Good data: VT Generator Data 7-25-16 HC.xlsx 11 “2016 Comprehensive Energy Plan.” 12 Ibid.
Introduction Page 17
Prior to 2000, all of Vermont's electric utilities (at the time, there were 22) delivered energy
efficiency programs to their customers. This well-intended policy had consequences, because
investor-owned utilities were caught in a conundrum: To ensure good returns for their
shareholders, they needed to sell more electricity; but to ensure compliance with regulators, they
needed to promote investments that would reduce electricity sales. Further, energy efficiency
program administration was difficult to accomplish effectively for the customers of each of the
22 utilities. Accurate accounting for each utility’s contribution to saving energy via retail sales of
energy-efficient products in their service territories was also elusive. That is, a store in one utility’s
location could easily have customers from other utilities buying and installing products—giving
the other utilities no information to support a claim to regulators for energy savings.
The Vermont General Assembly created a new entity in 2000, a statewide energy efficiency utility
(EEU) for all territory outside the City of Burlington (which maintains its own EEU through the
Burlington Electric Department (BED)). The Vermont Energy Investment Corporation (VEIC) has
operated the statewide entity, known as Efficiency Vermont, ever since. A 12-year Order of
Appointment began in 2010, replacing the earlier 3-year contract cycles, and allows for better
planning, greater stability in program offerings, and more strategies for achieving more clean-
energy potential than was possible under the shorter cycles.
Throughout Efficiency Vermont’s tenure as the statewide EEU, avoided costs of energy supply
have been an essential metric in demonstrating the efficacy of energy efficiency. Helping
customers use less electricity—through efficient products and appliances, air-sealing and
insulation of houses and other buildings, improvements in commercial building energy
performance, and many other measures—has a lower average levelized cost than all other new
power supply options.13
Sustainable energy advisors frequently refer to “efficiency first, then renewables” as a smart path
for customers who want to lower their energy costs and carbon footprints. With such a strong
and lengthy background in statewide electrical energy efficiency, Vermont has been well
positioned to advance its renewable energy economy.
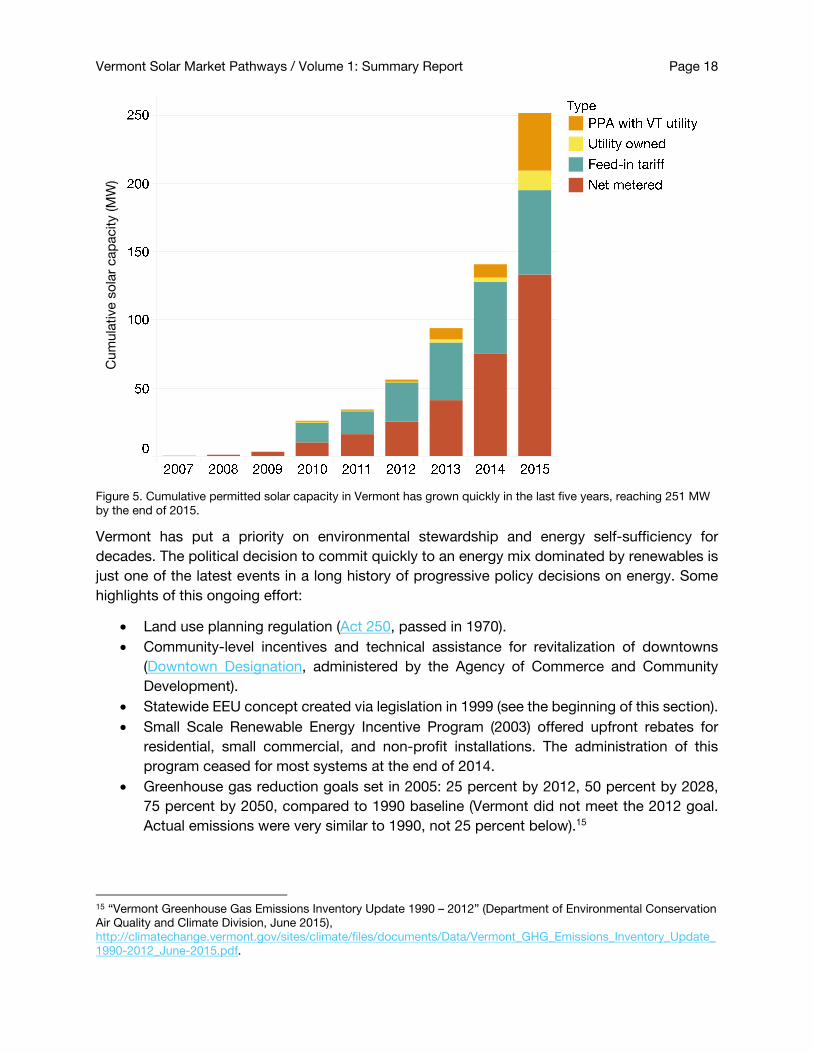
The growth of renewable energy is accelerating: As of late July 2016, 412 MW of wind and solar
capacity were online or permitted—of which 70 percent is from solar. Net metering of solar
energy to local utilities and the grid has seen a 25 percent increase. It now accounts for 167 MW
of solar, compared to 134 MW at the end of 2015.14 These data signal not only a net increase in
renewably supplied energy, but also a disproportionately large jump in energy supply from solar
sources.
Figure 5 illustrates the rapid growth of solar and particularly net metering. This market expansion
has been propelled by liberal policy toward group net metering; simple permitting; and strong
financial performance from a regulated, solar credit adder on utility bills for net metered
generation; and the feed-in tariff.
13 “How Much Does Energy Efficiency Cost?” (American Council for an Energy-Efficient Economy, March 17, 2016),
http://aceee.org/how-much-does-energy-efficiency-cost. 14 Department of Public Service, Certificate of Public Good data: VT Generator Data 7-25-16 HC.xlsx
Vermont Solar Market Pathways / Volume 1: Summary Report Page 18
Figure 5. Cumulative permitted solar capacity in Vermont has grown quickly in the last five years, reaching 251 MW
by the end of 2015.
Vermont has put a priority on environmental stewardship and energy self-sufficiency for
decades. The political decision to commit quickly to an energy mix dominated by renewables is
just one of the latest events in a long history of progressive policy decisions on energy. Some
highlights of this ongoing effort:
• Land use planning regulation (Act 250, passed in 1970).
• Community-level incentives and technical assistance for revitalization of downtowns
(Downtown Designation, administered by the Agency of Commerce and Community
Development).
• Statewide EEU concept created via legislation in 1999 (see the beginning of this section).
• Small Scale Renewable Energy Incentive Program (2003) offered upfront rebates for
residential, small commercial, and non-profit installations. The administration of this
program ceased for most systems at the end of 2014.
• Greenhouse gas reduction goals set in 2005: 25 percent by 2012, 50 percent by 2028,
75 percent by 2050, compared to 1990 baseline (Vermont did not meet the 2012 goal.
Actual emissions were very similar to 1990, not 25 percent below).15
15 “Vermont Greenhouse Gas Emissions Inventory Update 1990 – 2012” (Department of Environmental Conservation
Air Quality and Climate Division, June 2015),
http://climatechange.vermont.gov/sites/climate/files/documents/Data/Vermont_GHG_Emissions_Inventory_Update_
1990-2012_June-2015.pdf.
Cum
ula
tive s
ola
r cap
acity (M
W)
Introduction Page 19
• Sustainably Priced Energy Enterprise Development (SPEED, 2005) feed-in tariff for new
utility scale renewable energy projects.
• Streamlined solar registration provided a permit in 10 days for small systems.
• A solar adder, a credit on electric bills for each kWh a solar installation produces, began
to pay 19 to 20 cents per kWh for net-metered solar generation.
• In 2011, the Vermont Department of Public Service set a 90 percent renewable total
energy target by 2050.
• Standard Offer annual auctions replaced SPEED for new utility scale renewable energy
projects (2012).
• Total Energy Study (Department of Public Service, 2014) considered paths and viability
of 90 x 2050 target.
• Act 56 (2015) established a renewable portfolio standard: energy supply from renewables
must be at least 55 percent by 2017, 75 percent by 2032.
Vermont is capitalizing on this foundation to transition away from the use of imported fossil fuels
to locally owned renewable energy for electricity, transportation, and thermal needs. The state’s
consumption and generation is small compared to its neighbors, consuming 4 percent of the
electricity on the New England grid, and using less than 1 percent of Hydro Québec capacity.
Vermont could rely on imported electricity, or use these resources to balance in-state
renewables. However, many Vermonters are unwilling to export the impact of their energy use
and want to model local sustainability, with a high penetration of renewables, balanced and
managed with the state’s own resources.
Fast growth of wind and solar power drew opposition in the early 2010s. The General Assembly
responded with a Siting Task Force. The State also funded the Regional Planning Commissions
to account for energy in their regional plans. This can help site renewable energy projects where
locals want them, because it gives towns a voice in Vermont’s permitting process if they create
town energy plans that help support the state’s renewable energy goals.
The changes that have occurred between the inception of this Solar Market Pathways project in
late 2014 and today in late 2016 show how quickly Vermont is moving toward achieving these
targets:
• The General Assembly raised the cap for net-metered renewable capacity from 4 percent
to 15 percent of the connected utility’s peak load, in 2014.
• Later in 2014, Burlington Electric Department, the state’s third-largest utility and
operating its own EEU, acquired a 7.4 MW hydropower station to complete its efforts to
supply 100 percent of its energy from renewable sources.
• In June 2015, the General Assembly passed a renewable portfolio standard that allows
credit for reducing fossil fuel use in building and transportation sectors, and is among the
Vermont Solar Market Pathways / Volume 1: Summary Report Page 20
most aggressive policies in the United States.16 It requires 75 percent of electricity to
come from renewable sources by 2032.
• In November 2015, Green Mountain Power (GMP), an investor-owned utility (IOU) serving
71 percent of the state’s utility accounts, reached the net metering cap, 15 percent of
peak. It decided to continue to allow small systems to interconnect, as well as 7.5 MW
of strategic larger systems. The utility created a map to guide new solar to areas of the
grid that have ample capacity to accept it.17
• By the close of 2015, Vermont Electric Cooperative (VEC; the second-largest utility),
Washington Electric Cooperative (WEC; the fourth-largest utility), and three smaller
municipal utilities reached, or were approaching the 15 percent net metering cap.
• In August 2016, The Public Service Board issued new net metering rules that removed
the program cap, added incentives for preferred siting and REC treatment, and slightly
lowered the total incentive most systems would get.18
1.4 Implications for Broader Applicability
Vermont is ahead of the curve in becoming an advanced solar economy. Because it is a small
state and operates—even at the policy level—on a community scale, issues that arise as solar
saturation increases are frequently addressed quickly and with well-informed deliberations. The
State and its stakeholders typically seek options for mitigating issues relating to net metering or
siting, for example. The state also enjoys good working relationships among the utilities, and has
explored many different approaches for modifying rate structures and incentives. For example,
regulators, the statewide energy efficiency utility, and distribution utilities, are discussing
concepts around distributed energy resources (DERs) and fuel switching under Tier III of the new
Renewable Energy Standard.19
The approach in this report is to use scenario analyses to help provide a framework for
stakeholders to examine options and implications for alternative pathways towards becoming
an advanced solar economy. This approach, the structure of the analyses, and the process of
stakeholder engagement are all exportable to support solar market growth in other markets and
jurisdictions.
1.5 Structure of This Report
This report is the outcome of the first 24 months of the project work. A “peer review” draft of this
volume and volumes 2 and 3 were circulated to stakeholders and external experts for comments
16 Cara Marcy, “Hawaii and Vermont Set High Renewable Portfolio Standard Targets,” U.S. Energy Information Administration, June 29, 2015, http://www.eia.gov/todayinenergy/detail.cfm?id=21852. 17 “Solar Map,” Green Mountain Power, accessed September 21, 2016,
http://www.greenmountainpower.com/innovative/solar/solar-map/. 18 Vermont Public Service Board, Revised Rule 5.100 Pursuant to Act 99, 2016,
http://psb.vermont.gov/statutesrulesandguidelines/proposedrules/rule5100. 19 Vermont Public Service Board, Order Implementing the Renewable Energy Standard, IV, pp. 20 – 80.
http://psb.vermont.gov/sites/psb/files/8550%20Final%20Order.pdf.
Introduction Page 21
and review in June 2016. This is the final Vermont Solar Market Pathways document (with a
fourth volume and a condensed version for the public).
The Vermont Solar Market Pathways Report results comprise four volumes:
Volume 1: Summary Report. Objectives, background, approach, high-level findings, and
strategies for becoming an advanced solar economy
Volume 2: Net Metering Brief and Focus Area Briefs. Narrative and analysis on key market
segments and strategies related to solar market growth: net metering and alternatives;
electric vehicles; heat pumps; storage, load shifting, and demand response; high-
performance manufactured housing; and incentives. This volume also contains a broad
analysis of pathways to an advanced solar economy, submitted as a Phase II Roadmap for
the Smart Electric Power Alliance (SEPA) 51st State initiative.20
Volume 3: Barriers and Integration Brief. Investigation and analysis of technical, market,
and policy barriers and strategies. Analysis of distribution and bulk power system
implications for high-saturation solar.
Volume 4: Methods and Detail Tables. Methodology, assumptions, and results from
scenario modeling, using the Long Range Energy Alternatives Planning System and other
tools.
20 “The 51st State,” Smart Electric Power Alliance, accessed September 26, 2016, http://sepa51.org/phaseII.php.

2. Investigation Methods and Approach
The general approach for this study is the investigation of the implications of becoming an
advanced solar economy within the context of the total energy economy. We start by defining,
and then refining, various scenarios where solar can provide 20 percent of total electric
consumption. With stakeholder review and feedback, we then use those scenarios to investigate
the implications across technical, economic, regulatory, and business models. Undoubtedly,
transitioning to an advanced solar economy will require shifts for consumers, utilities, solar
companies, and other businesses. Transitioning will create those shifts, too. The transition will
also require and create shifts for regulators and policy makers. The point of this Summary Report
and the analyses is not to predict or define each of these, but to use the scenario modeling and
the ensuing discussions to encourage dialogue and innovation.
2.1 Stakeholder Engagement
The project was defined by, and has benefited greatly from, an active, non-binding stakeholder
engagement process. This process informed the creation of the Reference scenario, the initial
SDP scenario analyses, revisions to those scenarios, and alternative advanced solar scenarios
discussed in 2.2 Scenario Modeling. As of this report, the Team has conducted nine stakeholder
meetings, with participants from Vermont distribution utilities, the transmission operator, public
service regulators, state agencies (economic development, transportation, agriculture, and
natural resources), the statewide energy efficiency utility, solar vendors, environmental activists,
the Vermont Law School, and universities and colleges with active environment and energy
programs. (See a list of Stakeholders at the end of this document).
Vermont Solar Market Pathways / Volume 1: Summary Report Page 24
Figure 6. Second stakeholder meeting, April 2015 in Rutland, VT.
The original list of invited participants contained more than 100 names, and grew to over 150
through referrals and forwarded invitations. Meeting attendance varied; on average, 18
stakeholders attended each meeting. The Team also invited stakeholders to comment on
documents and modeling results as they became available. Over 100 individuals have attended
a meeting, provided written comments, or have otherwise participated in the project.
2.2 Scenario Modeling
LEAP, the Long-range Energy Alternatives Planning System, is energy policy analysis software
developed at the Stockholm Environment Institute. LEAP offers a framework for energy supply
and demand accounting, enabling users to work with existing data sets to construct and
compare future energy scenarios. Its flexible energy accounting capabilities help create models
of different energy systems and scenarios. It is demand driven: The user models energy
consumption within the system before adding supply, which is matched to the demand. Users
can examine graphic and tabular results on energy flows, costs, and environmental impacts and
modify them at multiple levels from end use devices, up to the limits of a total energy economy.
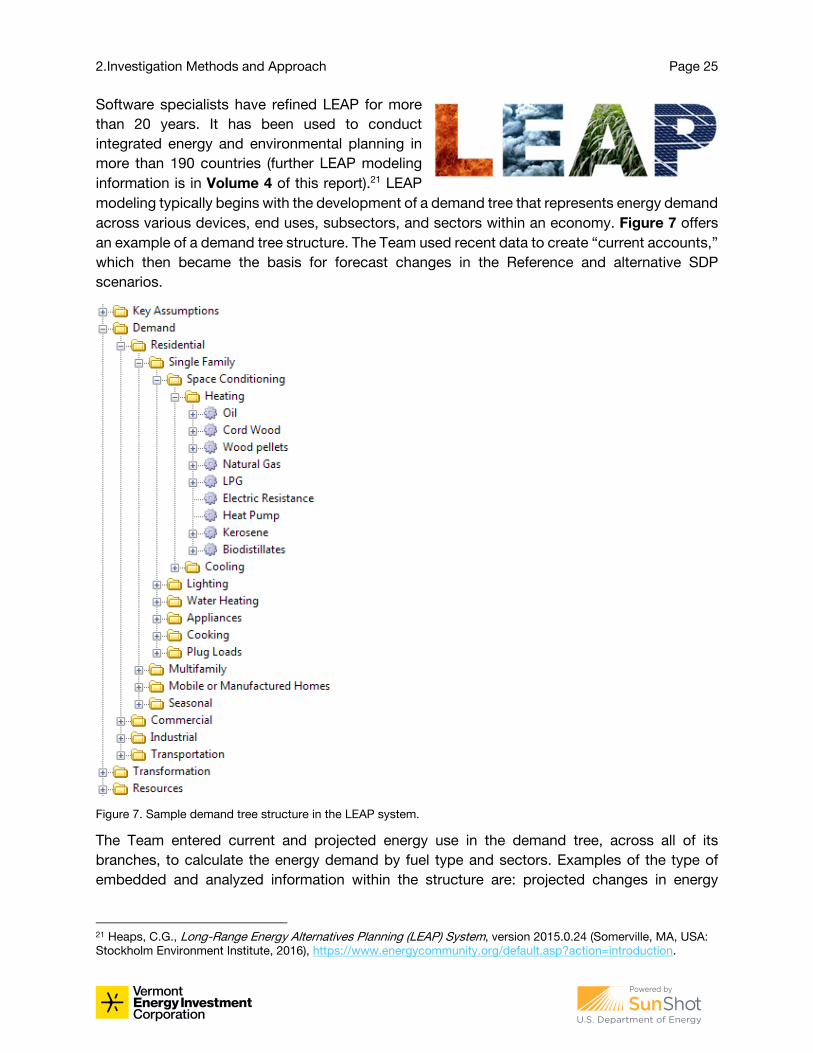
2.Investigation Methods and Approach Page 25
Software specialists have refined LEAP for more
than 20 years. It has been used to conduct
integrated energy and environmental planning in
more than 190 countries (further LEAP modeling
information is in Volume 4 of this report).21 LEAP
modeling typically begins with the development of a demand tree that represents energy demand
across various devices, end uses, subsectors, and sectors within an economy. Figure 7 offers
an example of a demand tree structure. The Team used recent data to create “current accounts,”
which then became the basis for forecast changes in the Reference and alternative SDP
scenarios.
Figure 7. Sample demand tree structure in the LEAP system.
The Team entered current and projected energy use in the demand tree, across all of its
branches, to calculate the energy demand by fuel type and sectors. Examples of the type of
embedded and analyzed information within the structure are: projected changes in energy
21 Heaps, C.G., Long-Range Energy Alternatives Planning (LEAP) System, version 2015.0.24 (Somerville, MA, USA:
Stockholm Environment Institute, 2016), https://www.energycommunity.org/default.asp?action=introduction.
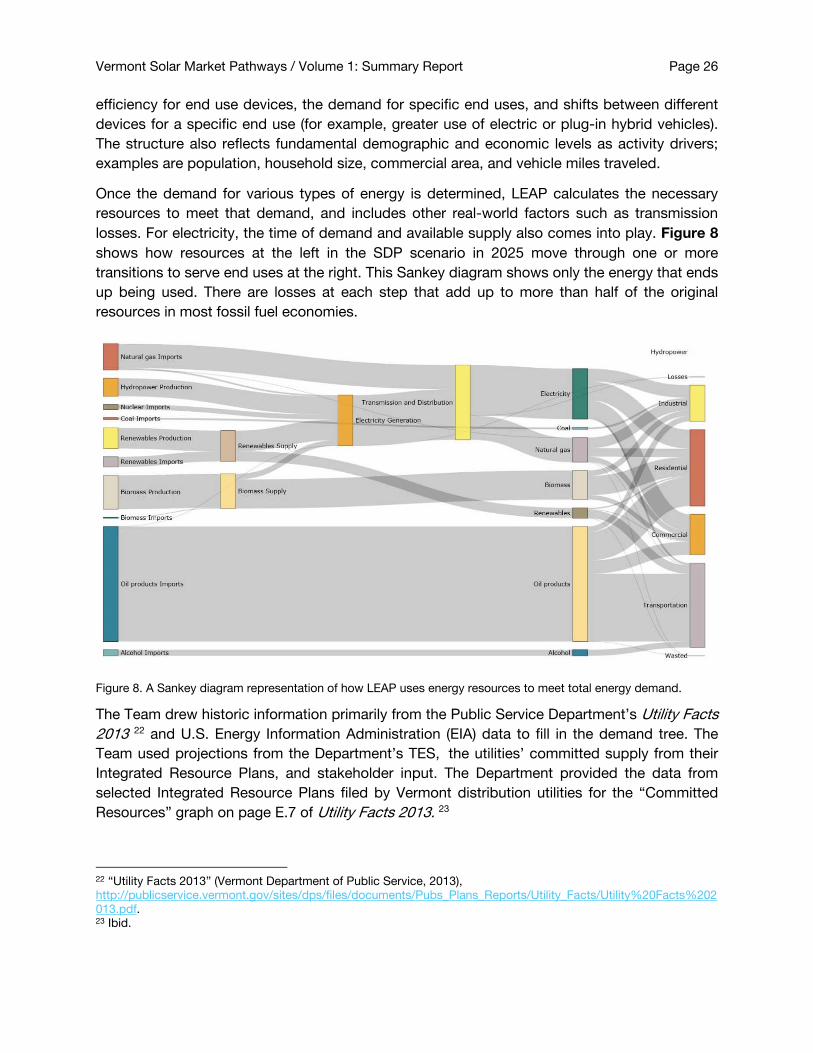
Vermont Solar Market Pathways / Volume 1: Summary Report Page 26
efficiency for end use devices, the demand for specific end uses, and shifts between different
devices for a specific end use (for example, greater use of electric or plug-in hybrid vehicles).
The structure also reflects fundamental demographic and economic levels as activity drivers;
examples are population, household size, commercial area, and vehicle miles traveled.
Once the demand for various types of energy is determined, LEAP calculates the necessary
resources to meet that demand, and includes other real-world factors such as transmission
losses. For electricity, the time of demand and available supply also comes into play. Figure 8
shows how resources at the left in the SDP scenario in 2025 move through one or more
transitions to serve end uses at the right. This Sankey diagram shows only the energy that ends
up being used. There are losses at each step that add up to more than half of the original
resources in most fossil fuel economies.
Figure 8. A Sankey diagram representation of how LEAP uses energy resources to meet total energy demand.
The Team drew historic information primarily from the Public Service Department’s Utility Facts
2013 22 and U.S. Energy Information Administration (EIA) data to fill in the demand tree. The
Team used projections from the Department’s TES, the utilities’ committed supply from their
Integrated Resource Plans, and stakeholder input. The Department provided the data from
selected Integrated Resource Plans filed by Vermont distribution utilities for the “Committed
Resources” graph on page E.7 of Utility Facts 2013. 23
22 “Utility Facts 2013” (Vermont Department of Public Service, 2013),
http://publicservice.vermont.gov/sites/dps/files/documents/Pubs_Plans_Reports/Utility_Facts/Utility%20Facts%202
013.pdf. 23 Ibid.
2.Investigation Methods and Approach Page 27
Demand Drivers
Each sector has a unit that measures activity in the sector. That unit is the “demand driver.”
LEAP multiplies it by the energy intensity of the activity to calculate energy demand.
The population is assumed to grow at 0.35 percent per year.24 The number of people per
household is assumed to decrease from 2.4 in 2010 to 2.17 in 2050.25 These assumptions
combine to give the number of households, the model’s basic unit for residential energy
consumption.
The Team based the projected change in the energy demand from the commercial sector on
data in the TES. The demand driver for the commercial sector is commercial building square
feet.
The Team entered total industrial consumption by fuel estimates directly from the TES into the
model.
Transportation energy use is based on vehicle miles traveled (VMT). This metric has risen
throughout most of American history.26 In Vermont however, VMT peaked in 2006 and has since
declined slightly.27 Given this trend, and Vermont’s efforts to concentrate land development and
to support alternatives to single-occupancy vehicles, VMT is assumed in the model to remain
flat, while population and economic activity grow slightly.
The Team based electricity supply on the TES,28 the utilities’ Committed Supply, and other
necessary sources to meet the demand projected in the model and the 90 x 2050 goal, and to
supply 20 percent of annual electricity from solar. The Department provided the data from
selected Integrated Resource Plans filed by Vermont distribution utilities for the “Committed
Resources” graph on page E.7 of Utility Facts 2013.29
2.3 Scenarios
Once the Team entered historic data into the demand, transformation, and resources modules,
it could build scenarios on Reference projections, and on alternative scenarios. For example, the
Team examined the implications and requirements for meeting 20 percent of all electricity
generation from solar by 2025, and the broader 90 x 2050 total energy targets. Table 4
summarizes the scenarios derived from the research and informed by stakeholder feedback,
review, and further analysis. The SDP is further refined into Low Net Metering and Delayed
Deployment versions.
24 Ken Jones, Ph.D. and Lilly Schwarz, “Vermont Population Projections – 2010 - 2030” (State of Vermont, August
2013), http://dail.vermont.gov/dail-publications/publications-general-reports/vt-population-projections-2010-2030. 25 Dr. Ken Noble, “Vermont Data_DSM.xlsx” (Vermont Department of Public Service, 2012). 26 “Annual Vehicle Miles Traveled in the U.S.,” Alternative Fuels Data Center, August 2016,
http://www.afdc.energy.gov/data/10315. 27 “Vermont Annual Vehicle Miles of Travel (AVMT) and Highway Fatalities” (Vermont Agency of Transportation),
accessed November 16, 2016, http://vtrans.vermont.gov/docs/highway-research. 28 “Total Energy Study: Final Report on a Total Energy Approach to Meeting the State’s Greenhouse Gas and
Renewable Energy Goals.” 29 “Utility Facts 2013.”
Vermont Solar Market Pathways / Volume 1: Summary Report Page 28
Table 4. Scenarios for the Vermont Solar Market Pathways, with major data sources, and showing
the progression from current accounts to the SDP scenario
Scenario Represents Data sources
Current
accounts
Description of current energy supply and
demand balance. Historic information is from
2010-2015 depending on available data. Basis
for all other scenarios.
Utility Facts 2013, EIA, Vermont Residential Fuel Study, device-
specific data from various sources
Reference
Business as usual. Involves expected baseline
levels of energy efficiency such as continued
Efficiency Vermont operations and
improvements in vehicle efficiency through
Federal Standards. Renewable generation and
natural gas growth continues.
Total Energy Study
BAU scenario
90 x 2050VEIC Meeting the 90 x 2050 target. Based on the
economic modeling done for the TES.
Adapted from Total Energy StudyTREES Local scenarios
SDP30
Solar Development Pathways scenario. Reaches
the 20%-of-generation target by 2025 and also
the 90 x 2050 goals for 2050
Based on 90 x 2050: Demand is
the same, supply is shifted toward
solar
The Reference scenario contains energy use values and assumptions as they are today, but it
assumes increases in vehicle efficiency, because of updated Corporate Average Fuel Economy
(CAFE) standards,31 and some increased use of natural gas—which, although a cleaner fuel to
burn, is still a fossil fuel. The Reference scenario is based on the business-as-usual (BAU)
scenario of the Vermont TES. The Vermont Solar Market Pathways Team revised the model to
reflect less growth in natural gas use, after the cancelation of the planned second phase of a
pipeline project.
The 90 x 2050VEIC scenario has stronger efficiency, quicker fuel switching, and accelerated
renewable energy adoption to achieve the State’s goal of meeting 90 percent of total energy
needs with renewable sources by 2050. This scenario is based on the TES Total Renewable
Energy and Efficiency Standard (TREES; local energy) scenario.32 The TREES Local scenarios
consist of two pricing outcomes, one that assumes a high cost of biomass and biofuels, and one
that assumes a low cost. These scenarios test policies requiring all Vermont energy distributors
to source an escalating percentage of their supply from in state, Vermont renewables or energy
efficiency resources. The 90 x 2050VEIC scenario combines the high and low biomass cost
versions of TREES Local.
The Team created SDP scenarios for this project to meet the SDP goal to supply 20 percent of
annual electric generation from solar by 2025. The demand side is exactly the same as that of
30 The SDP scenario is further refined into Low Net Metering and Delayed Deployment versions. 31 “CAFE - Fuel Economy,” National Highway Traffic Safety Administration (NHTSA), accessed September 22, 2016,
http://www.nhtsa.gov/fuel-economy. 32 “Total Energy Study: Final Report on a Total Energy Approach to Meeting the State’s Greenhouse Gas and
Renewable Energy Goals.”
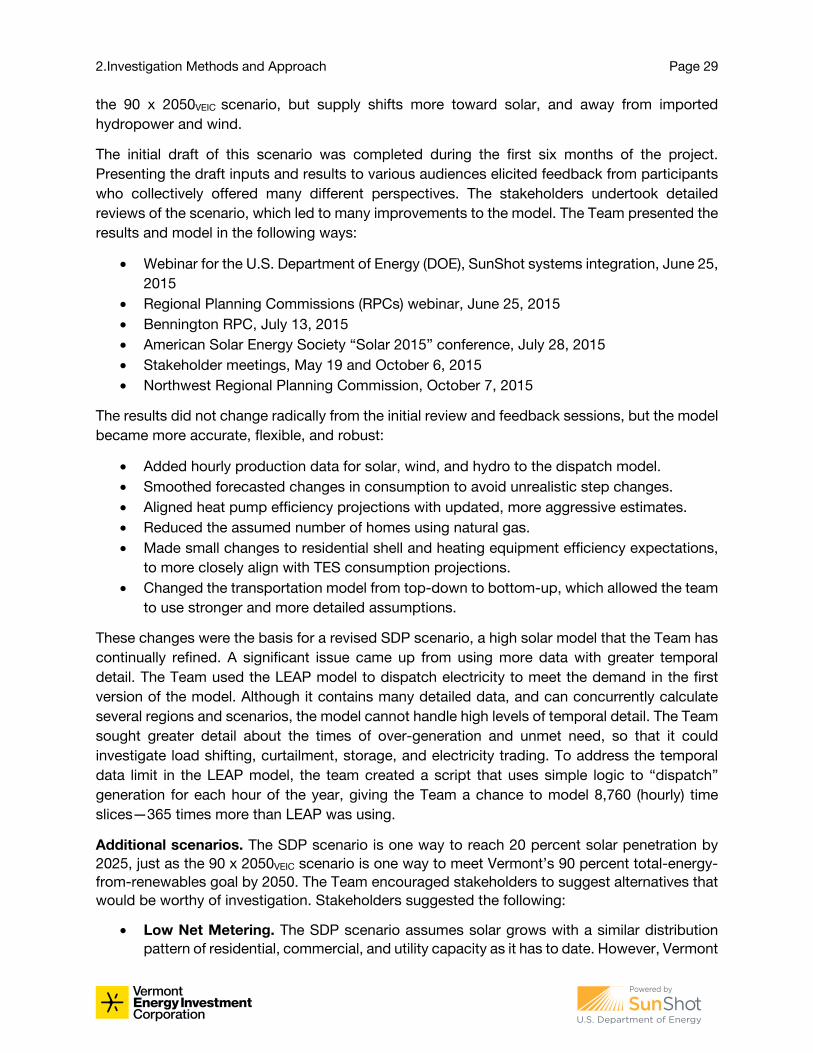
2.Investigation Methods and Approach Page 29
the 90 x 2050VEIC scenario, but supply shifts more toward solar, and away from imported
hydropower and wind.
The initial draft of this scenario was completed during the first six months of the project.
Presenting the draft inputs and results to various audiences elicited feedback from participants
who collectively offered many different perspectives. The stakeholders undertook detailed
reviews of the scenario, which led to many improvements to the model. The Team presented the
results and model in the following ways:
• Webinar for the U.S. Department of Energy (DOE), SunShot systems integration, June 25,
2015
• Regional Planning Commissions (RPCs) webinar, June 25, 2015
• Bennington RPC, July 13, 2015
• American Solar Energy Society “Solar 2015” conference, July 28, 2015
• Stakeholder meetings, May 19 and October 6, 2015
• Northwest Regional Planning Commission, October 7, 2015
The results did not change radically from the initial review and feedback sessions, but the model
became more accurate, flexible, and robust:
• Added hourly production data for solar, wind, and hydro to the dispatch model.
• Smoothed forecasted changes in consumption to avoid unrealistic step changes.
• Aligned heat pump efficiency projections with updated, more aggressive estimates.
• Reduced the assumed number of homes using natural gas.
• Made small changes to residential shell and heating equipment efficiency expectations,
to more closely align with TES consumption projections.
• Changed the transportation model from top-down to bottom-up, which allowed the team
to use stronger and more detailed assumptions.
These changes were the basis for a revised SDP scenario, a high solar model that the Team has
continually refined. A significant issue came up from using more data with greater temporal
detail. The Team used the LEAP model to dispatch electricity to meet the demand in the first
version of the model. Although it contains many detailed data, and can concurrently calculate
several regions and scenarios, the model cannot handle high levels of temporal detail. The Team
sought greater detail about the times of over-generation and unmet need, so that it could
investigate load shifting, curtailment, storage, and electricity trading. To address the temporal
data limit in the LEAP model, the team created a script that uses simple logic to “dispatch”
generation for each hour of the year, giving the Team a chance to model 8,760 (hourly) time
slices—365 times more than LEAP was using.
Additional scenarios. The SDP scenario is one way to reach 20 percent solar penetration by
2025, just as the 90 x 2050VEIC scenario is one way to meet Vermont’s 90 percent total-energy-
from-renewables goal by 2050. The Team encouraged stakeholders to suggest alternatives that
would be worthy of investigation. Stakeholders suggested the following:
• Low Net Metering. The SDP scenario assumes solar grows with a similar distribution
pattern of residential, commercial, and utility capacity as it has to date. However, Vermont
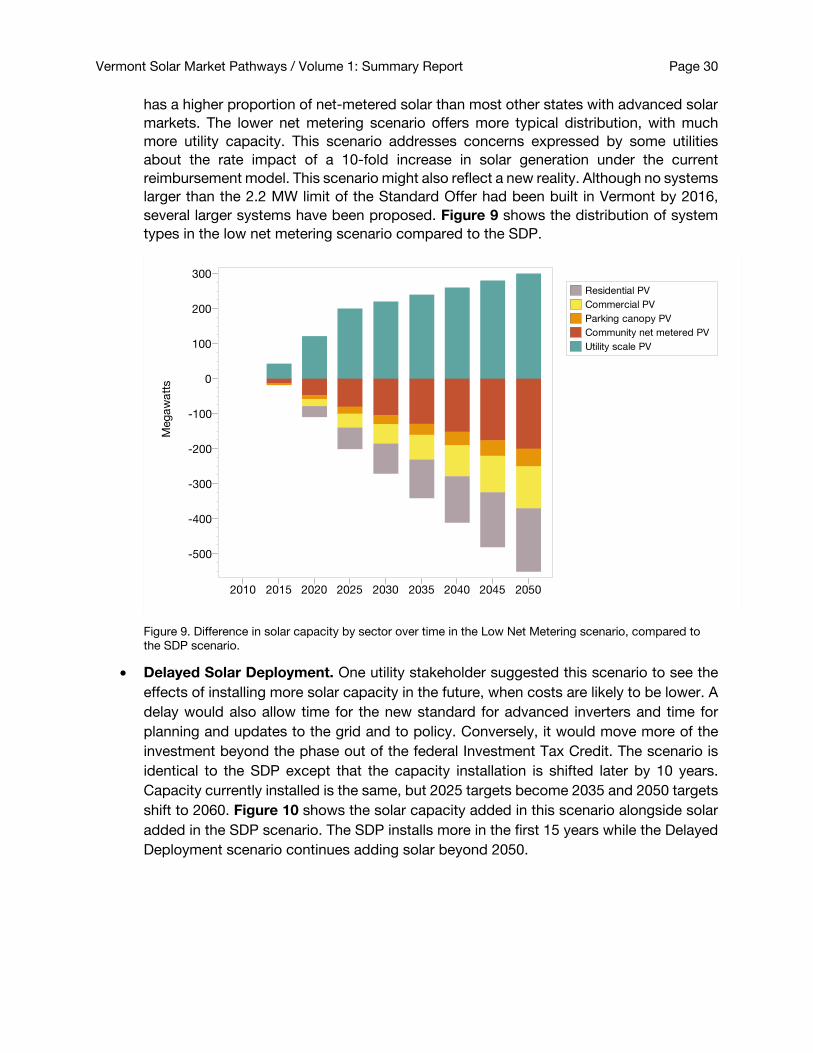
Vermont Solar Market Pathways / Volume 1: Summary Report Page 30
has a higher proportion of net-metered solar than most other states with advanced solar
markets. The lower net metering scenario offers more typical distribution, with much
more utility capacity. This scenario addresses concerns expressed by some utilities
about the rate impact of a 10-fold increase in solar generation under the current
reimbursement model. This scenario might also reflect a new reality. Although no systems
larger than the 2.2 MW limit of the Standard Offer had been built in Vermont by 2016,
several larger systems have been proposed. Figure 9 shows the distribution of system
types in the low net metering scenario compared to the SDP.
Figure 9. Difference in solar capacity by sector over time in the Low Net Metering scenario, compared to
the SDP scenario.
• Delayed Solar Deployment. One utility stakeholder suggested this scenario to see the
effects of installing more solar capacity in the future, when costs are likely to be lower. A
delay would also allow time for the new standard for advanced inverters and time for
planning and updates to the grid and to policy. Conversely, it would move more of the
investment beyond the phase out of the federal Investment Tax Credit. The scenario is
identical to the SDP except that the capacity installation is shifted later by 10 years.
Capacity currently installed is the same, but 2025 targets become 2035 and 2050 targets
shift to 2060. Figure 10 shows the solar capacity added in this scenario alongside solar
added in the SDP scenario. The SDP installs more in the first 15 years while the Delayed
Deployment scenario continues adding solar beyond 2050.
2010 2015 2020 2025 2030 2035 2040 2045 2050
Meg
aw
att
s
300
200
100
0
-100
-200
-300
-400
-500
Residential PV
Commercial PV
Parking canopy PV
Community net metered PV
Utility scale PV
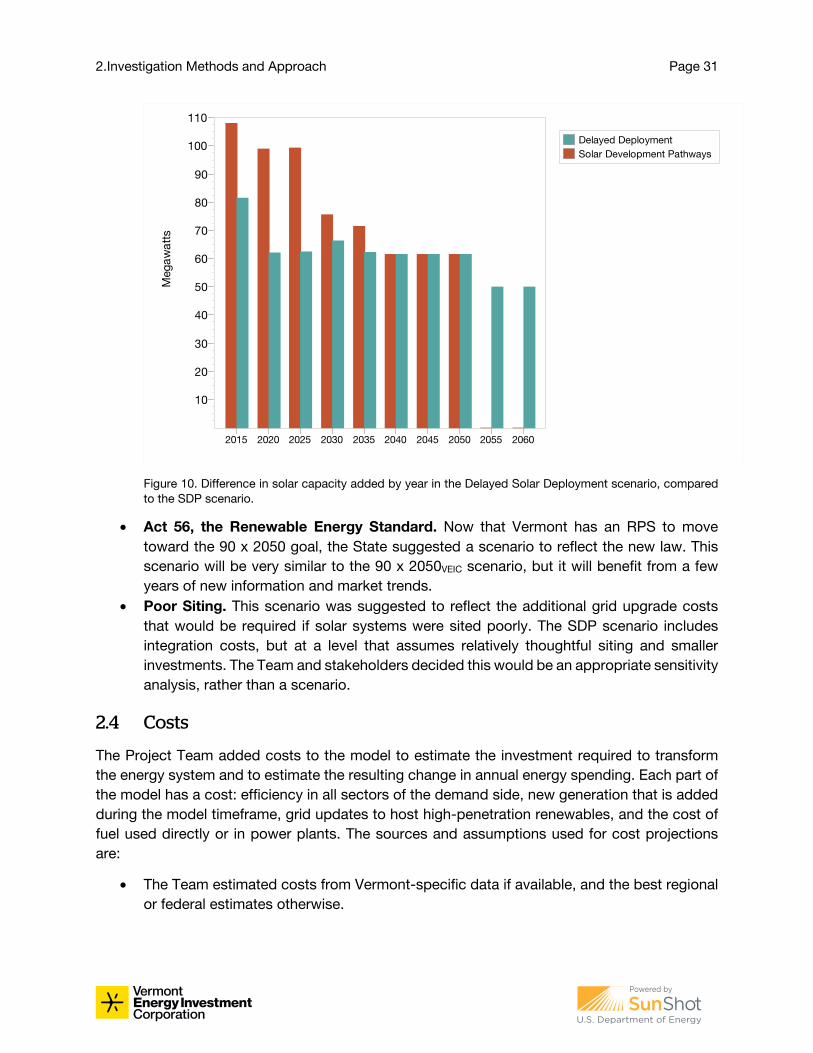
2.Investigation Methods and Approach Page 31
Figure 10. Difference in solar capacity added by year in the Delayed Solar Deployment scenario, compared
to the SDP scenario.
• Act 56, the Renewable Energy Standard. Now that Vermont has an RPS to move
toward the 90 x 2050 goal, the State suggested a scenario to reflect the new law. This
scenario will be very similar to the 90 x 2050VEIC scenario, but it will benefit from a few
years of new information and market trends.
• Poor Siting. This scenario was suggested to reflect the additional grid upgrade costs
that would be required if solar systems were sited poorly. The SDP scenario includes
integration costs, but at a level that assumes relatively thoughtful siting and smaller
investments. The Team and stakeholders decided this would be an appropriate sensitivity
analysis, rather than a scenario.
2.4 Costs
The Project Team added costs to the model to estimate the investment required to transform
the energy system and to estimate the resulting change in annual energy spending. Each part of
the model has a cost: efficiency in all sectors of the demand side, new generation that is added
during the model timeframe, grid updates to host high-penetration renewables, and the cost of
fuel used directly or in power plants. The sources and assumptions used for cost projections
are:
• The Team estimated costs from Vermont-specific data if available, and the best regional
or federal estimates otherwise.
2015 2020 2025 2030 2035 2040 2045 2050 2055 2060
Meg
aw
att
s
110
100
90
80
70
60
50
40
30
20
10
Delayed Deployment
Solar Development Pathways
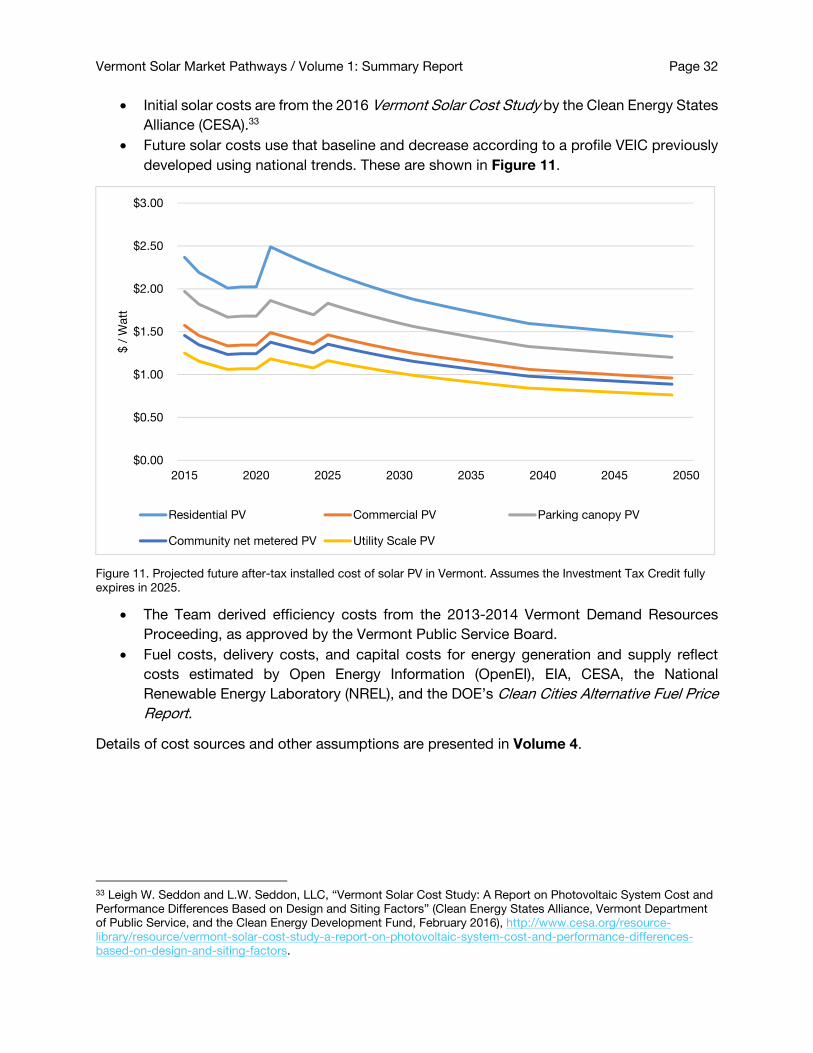
Vermont Solar Market Pathways / Volume 1: Summary Report Page 32
• Initial solar costs are from the 2016 Vermont Solar Cost Study by the Clean Energy States
Alliance (CESA).33
• Future solar costs use that baseline and decrease according to a profile VEIC previously
developed using national trends. These are shown in Figure 11.
Figure 11. Projected future after-tax installed cost of solar PV in Vermont. Assumes the Investment Tax Credit fully
expires in 2025.
• The Team derived efficiency costs from the 2013-2014 Vermont Demand Resources
Proceeding, as approved by the Vermont Public Service Board.
• Fuel costs, delivery costs, and capital costs for energy generation and supply reflect
costs estimated by Open Energy Information (OpenEI), EIA, CESA, the National
Renewable Energy Laboratory (NREL), and the DOE’s Clean Cities Alternative Fuel Price
Report.
Details of cost sources and other assumptions are presented in Volume 4.
33 Leigh W. Seddon and L.W. Seddon, LLC, “Vermont Solar Cost Study: A Report on Photovoltaic System Cost and
Performance Differences Based on Design and Siting Factors” (Clean Energy States Alliance, Vermont Department
of Public Service, and the Clean Energy Development Fund, February 2016), http://www.cesa.org/resource-
library/resource/vermont-solar-cost-study-a-report-on-photovoltaic-system-cost-and-performance-differences-
based-on-design-and-siting-factors.
$0.00
$0.50
$1.00
$1.50
$2.00
$2.50
$3.00
2015 2020 2025 2030 2035 2040 2045 2050
$ /
Watt
Residential PV Commercial PV Parking canopy PV
Community net metered PV Utility Scale PV
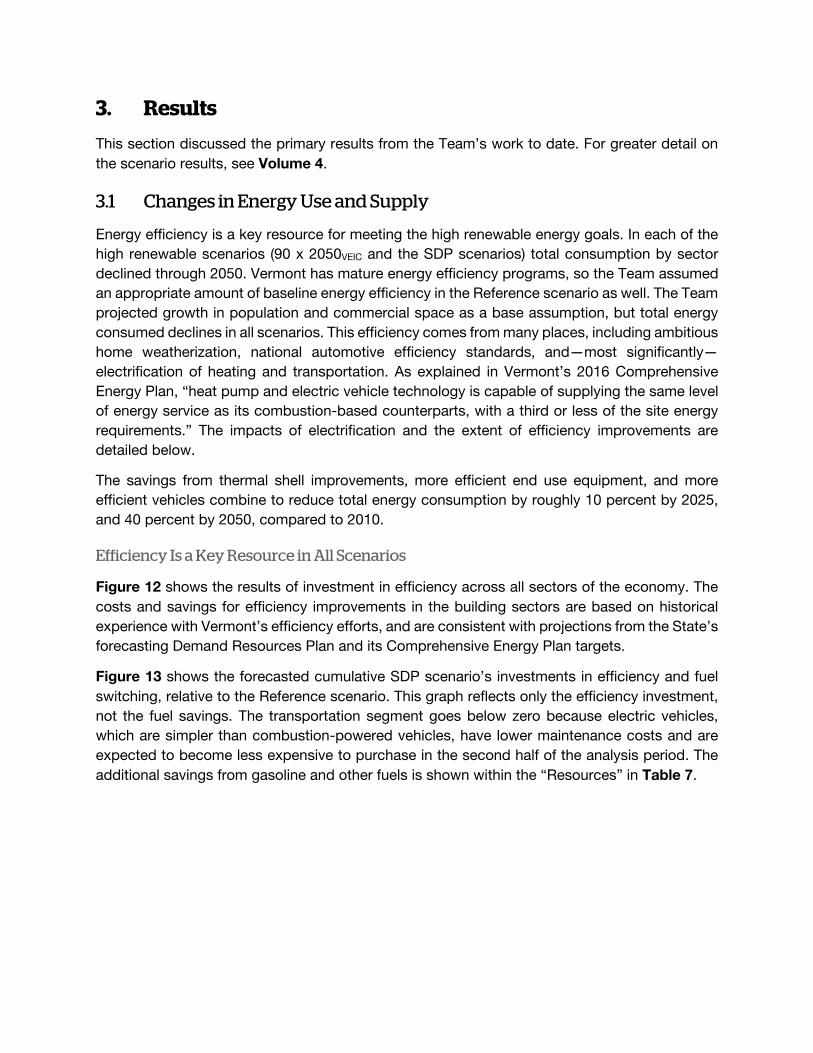
3. Results
This section discussed the primary results from the Team’s work to date. For greater detail on
the scenario results, see Volume 4.
3.1 Changes in Energy Use and Supply
Energy efficiency is a key resource for meeting the high renewable energy goals. In each of the
high renewable scenarios (90 x 2050VEIC and the SDP scenarios) total consumption by sector
declined through 2050. Vermont has mature energy efficiency programs, so the Team assumed
an appropriate amount of baseline energy efficiency in the Reference scenario as well. The Team
projected growth in population and commercial space as a base assumption, but total energy
consumed declines in all scenarios. This efficiency comes from many places, including ambitious
home weatherization, national automotive efficiency standards, and—most significantly—
electrification of heating and transportation. As explained in Vermont’s 2016 Comprehensive
Energy Plan, “heat pump and electric vehicle technology is capable of supplying the same level
of energy service as its combustion-based counterparts, with a third or less of the site energy
requirements.” The impacts of electrification and the extent of efficiency improvements are
detailed below.
The savings from thermal shell improvements, more efficient end use equipment, and more
efficient vehicles combine to reduce total energy consumption by roughly 10 percent by 2025,
and 40 percent by 2050, compared to 2010.
Efficiency Is a Key Resource in All Scenarios
Figure 12 shows the results of investment in efficiency across all sectors of the economy. The
costs and savings for efficiency improvements in the building sectors are based on historical
experience with Vermont’s efficiency efforts, and are consistent with projections from the State’s
forecasting Demand Resources Plan and its Comprehensive Energy Plan targets.
Figure 13 shows the forecasted cumulative SDP scenario’s investments in efficiency and fuel
switching, relative to the Reference scenario. This graph reflects only the efficiency investment,
not the fuel savings. The transportation segment goes below zero because electric vehicles,
which are simpler than combustion-powered vehicles, have lower maintenance costs and are
expected to become less expensive to purchase in the second half of the analysis period. The
additional savings from gasoline and other fuels is shown within the “Resources” in Table 7.
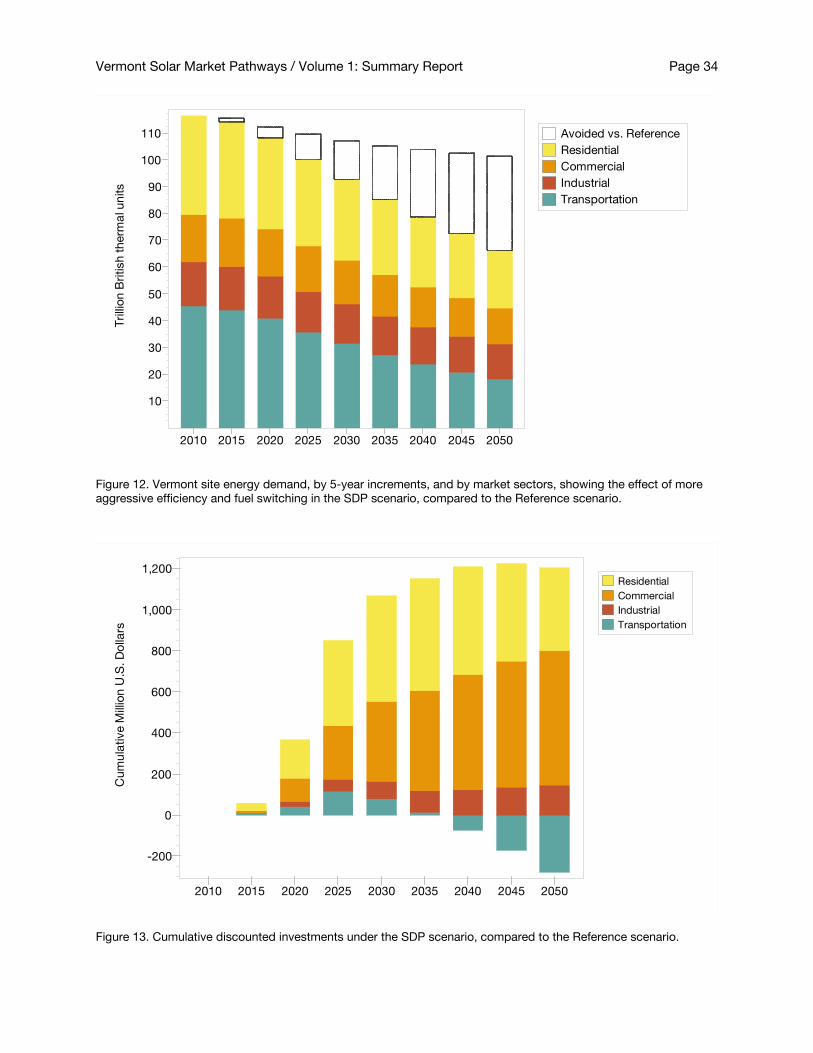
Vermont Solar Market Pathways / Volume 1: Summary Report Page 34
Figure 12. Vermont site energy demand, by 5-year increments, and by market sectors, showing the effect of more
aggressive efficiency and fuel switching in the SDP scenario, compared to the Reference scenario.
Figure 13. Cumulative discounted investments under the SDP scenario, compared to the Reference scenario.
2010 2015 2020 2025 2030 2035 2040 2045 2050
Tri
llio
n B
ritish
th
erm
al u
nits
110
100
90
80
70
60
50
40
30
20
10
Avoided vs. Reference
Residential
Commercial
Industrial
Transportation
2010 2015 2020 2025 2030 2035 2040 2045 2050
Cu
mu
lative M
illio
n U
.S. D
olla
rs
1,200
1,000
800
600
400
200
0
-200
Residential
Commercial
Industrial
Transportation
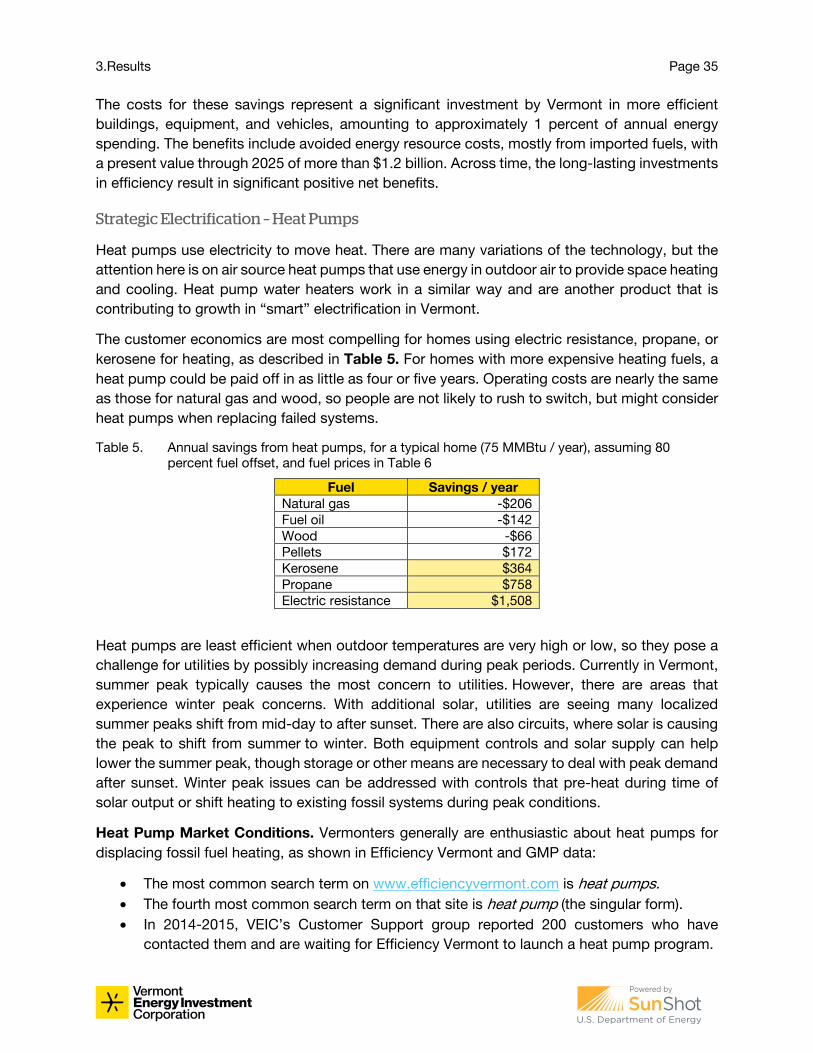
3.Results Page 35
The costs for these savings represent a significant investment by Vermont in more efficient
buildings, equipment, and vehicles, amounting to approximately 1 percent of annual energy
spending. The benefits include avoided energy resource costs, mostly from imported fuels, with
a present value through 2025 of more than $1.2 billion. Across time, the long-lasting investments
in efficiency result in significant positive net benefits.
Strategic Electrification – Heat Pumps
Heat pumps use electricity to move heat. There are many variations of the technology, but the
attention here is on air source heat pumps that use energy in outdoor air to provide space heating
and cooling. Heat pump water heaters work in a similar way and are another product that is
contributing to growth in “smart” electrification in Vermont.
The customer economics are most compelling for homes using electric resistance, propane, or
kerosene for heating, as described in Table 5. For homes with more expensive heating fuels, a
heat pump could be paid off in as little as four or five years. Operating costs are nearly the same
as those for natural gas and wood, so people are not likely to rush to switch, but might consider
heat pumps when replacing failed systems.
Table 5. Annual savings from heat pumps, for a typical home (75 MMBtu / year), assuming 80
percent fuel offset, and fuel prices in Table 6
Fuel Savings / year
Natural gas -$206
Fuel oil -$142
Wood -$66
Pellets $172
Kerosene $364
Propane $758
Electric resistance $1,508
Heat pumps are least efficient when outdoor temperatures are very high or low, so they pose a
challenge for utilities by possibly increasing demand during peak periods. Currently in Vermont,
summer peak typically causes the most concern to utilities. However, there are areas that
experience winter peak concerns. With additional solar, utilities are seeing many localized
summer peaks shift from mid-day to after sunset. There are also circuits, where solar is causing
the peak to shift from summer to winter. Both equipment controls and solar supply can help
lower the summer peak, though storage or other means are necessary to deal with peak demand
after sunset. Winter peak issues can be addressed with controls that pre-heat during time of
solar output or shift heating to existing fossil systems during peak conditions.
Heat Pump Market Conditions. Vermonters generally are enthusiastic about heat pumps for
displacing fossil fuel heating, as shown in Efficiency Vermont and GMP data:
• The most common search term on www.efficiencyvermont.com is heat pumps.
• The fourth most common search term on that site is heat pump (the singular form).
• In 2014-2015, VEIC’s Customer Support group reported 200 customers who have
contacted them and are waiting for Efficiency Vermont to launch a heat pump program.
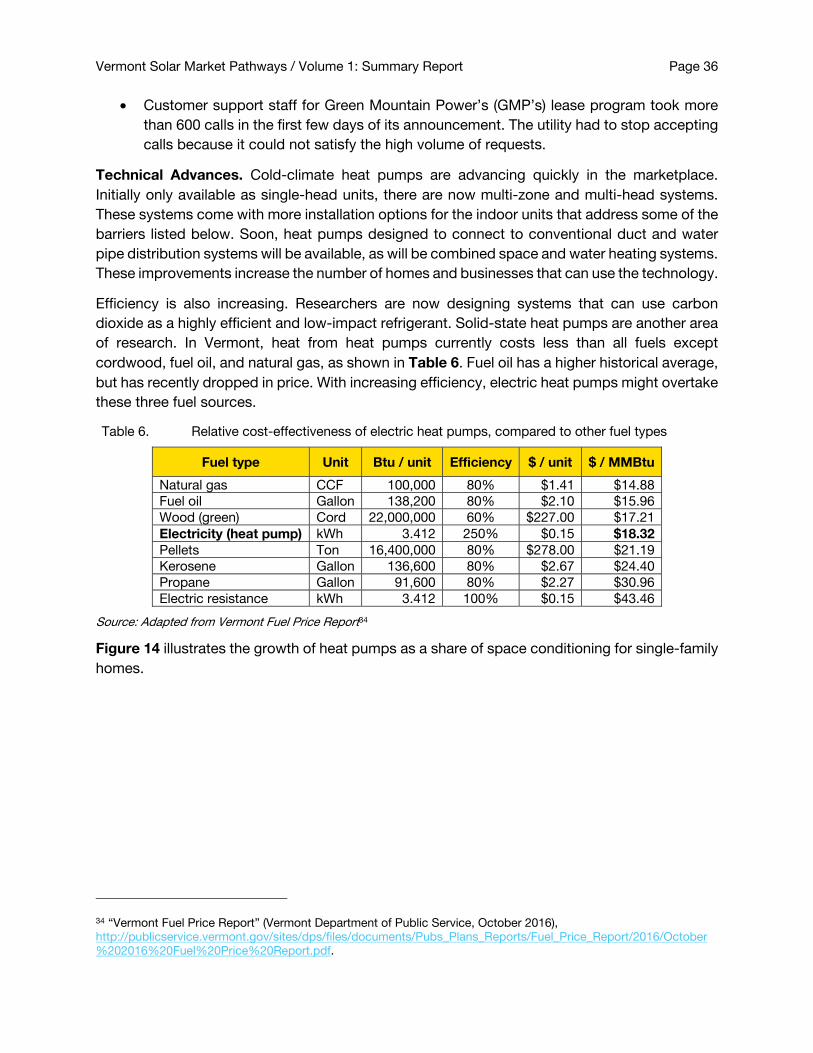
Vermont Solar Market Pathways / Volume 1: Summary Report Page 36
• Customer support staff for Green Mountain Power’s (GMP’s) lease program took more
than 600 calls in the first few days of its announcement. The utility had to stop accepting
calls because it could not satisfy the high volume of requests.
Technical Advances. Cold-climate heat pumps are advancing quickly in the marketplace.
Initially only available as single-head units, there are now multi-zone and multi-head systems.
These systems come with more installation options for the indoor units that address some of the
barriers listed below. Soon, heat pumps designed to connect to conventional duct and water
pipe distribution systems will be available, as will be combined space and water heating systems.
These improvements increase the number of homes and businesses that can use the technology.
Efficiency is also increasing. Researchers are now designing systems that can use carbon
dioxide as a highly efficient and low-impact refrigerant. Solid-state heat pumps are another area
of research. In Vermont, heat from heat pumps currently costs less than all fuels except
cordwood, fuel oil, and natural gas, as shown in Table 6. Fuel oil has a higher historical average,
but has recently dropped in price. With increasing efficiency, electric heat pumps might overtake
these three fuel sources.
Table 6. Relative cost-effectiveness of electric heat pumps, compared to other fuel types
Fuel type Unit Btu / unit Efficiency $ / unit $ / MMBtu
Natural gas CCF 100,000 80% $1.41 $14.88
Fuel oil Gallon 138,200 80% $2.10 $15.96
Wood (green) Cord 22,000,000 60% $227.00 $17.21
Electricity (heat pump) kWh 3.412 250% $0.15 $18.32
Pellets Ton 16,400,000 80% $278.00 $21.19
Kerosene Gallon 136,600 80% $2.67 $24.40
Propane Gallon 91,600 80% $2.27 $30.96
Electric resistance kWh 3.412 100% $0.15 $43.46
Source: Adapted from Vermont Fuel Price Report34
Figure 14 illustrates the growth of heat pumps as a share of space conditioning for single-family
homes.
34 “Vermont Fuel Price Report” (Vermont Department of Public Service, October 2016),
http://publicservice.vermont.gov/sites/dps/files/documents/Pubs_Plans_Reports/Fuel_Price_Report/2016/October
%202016%20Fuel%20Price%20Report.pdf.
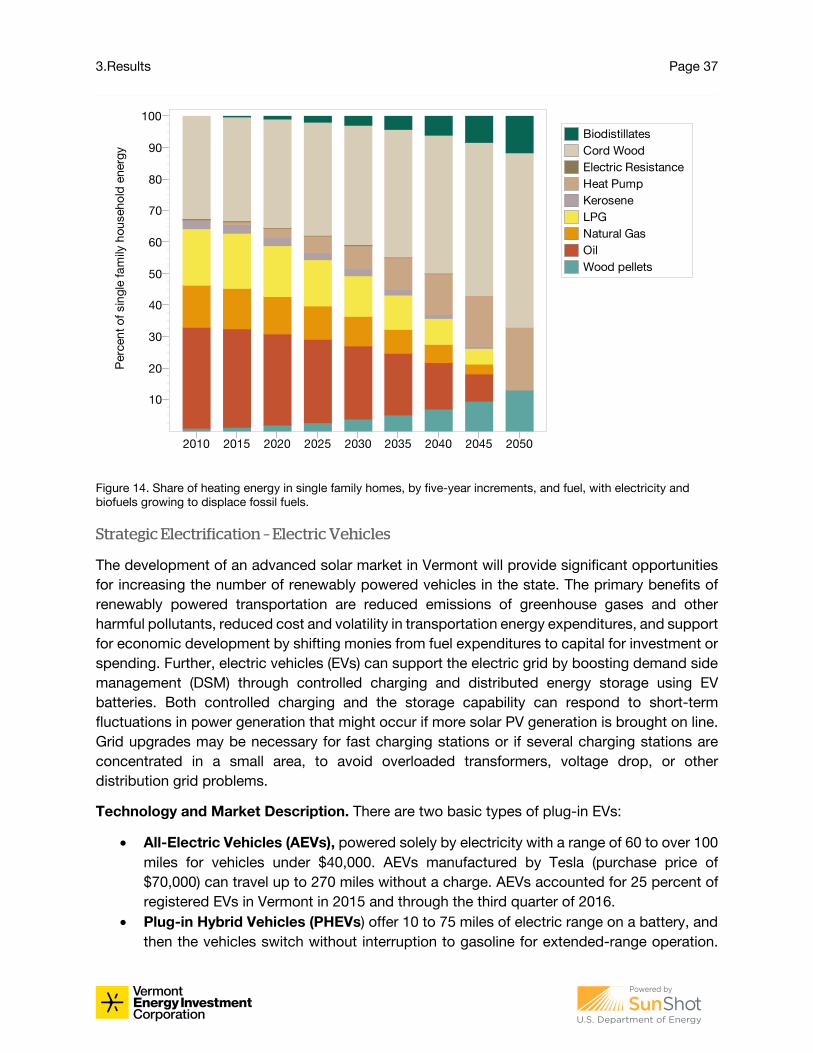
3.Results Page 37
Figure 14. Share of heating energy in single family homes, by five-year increments, and fuel, with electricity and
biofuels growing to displace fossil fuels.
Strategic Electrification – Electric Vehicles
The development of an advanced solar market in Vermont will provide significant opportunities
for increasing the number of renewably powered vehicles in the state. The primary benefits of
renewably powered transportation are reduced emissions of greenhouse gases and other
harmful pollutants, reduced cost and volatility in transportation energy expenditures, and support
for economic development by shifting monies from fuel expenditures to capital for investment or
spending. Further, electric vehicles (EVs) can support the electric grid by boosting demand side
management (DSM) through controlled charging and distributed energy storage using EV
batteries. Both controlled charging and the storage capability can respond to short-term
fluctuations in power generation that might occur if more solar PV generation is brought on line.
Grid upgrades may be necessary for fast charging stations or if several charging stations are
concentrated in a small area, to avoid overloaded transformers, voltage drop, or other
distribution grid problems.
Technology and Market Description. There are two basic types of plug-in EVs:
• All-Electric Vehicles (AEVs), powered solely by electricity with a range of 60 to over 100
miles for vehicles under $40,000. AEVs manufactured by Tesla (purchase price of
$70,000) can travel up to 270 miles without a charge. AEVs accounted for 25 percent of
registered EVs in Vermont in 2015 and through the third quarter of 2016.
• Plug-in Hybrid Vehicles (PHEVs) offer 10 to 75 miles of electric range on a battery, and
then the vehicles switch without interruption to gasoline for extended-range operation.
2010 2015 2020 2025 2030 2035 2040 2045 2050
Perc
en
t o
f sin
gle
fa
mily
ho
useh
old
en
erg
y100
90
80
70
60
50
40
30
20
10
Biodistillates
Cord Wood
Electric Resistance
Heat Pump
Kerosene
LPG
Natural Gas
Oil
Wood pellets
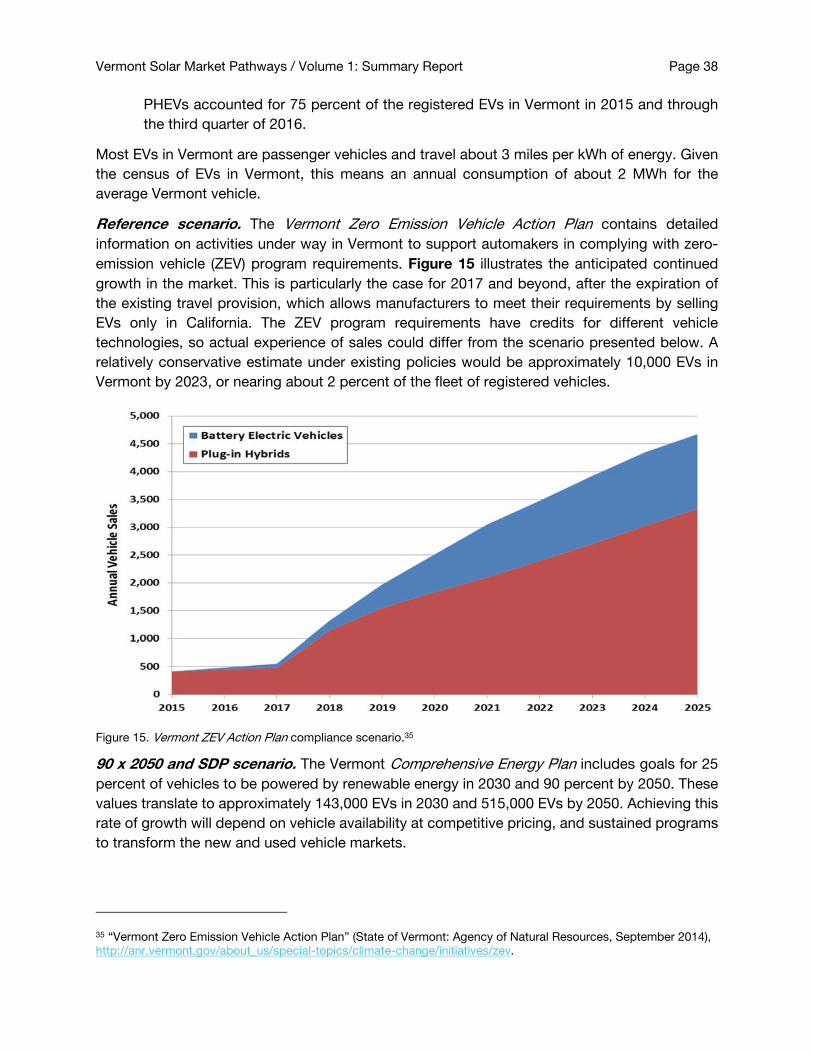
Vermont Solar Market Pathways / Volume 1: Summary Report Page 38
PHEVs accounted for 75 percent of the registered EVs in Vermont in 2015 and through
the third quarter of 2016.
Most EVs in Vermont are passenger vehicles and travel about 3 miles per kWh of energy. Given
the census of EVs in Vermont, this means an annual consumption of about 2 MWh for the
average Vermont vehicle.
Reference scenario. The Vermont Zero Emission Vehicle Action Plan contains detailed
information on activities under way in Vermont to support automakers in complying with zero-
emission vehicle (ZEV) program requirements. Figure 15 illustrates the anticipated continued
growth in the market. This is particularly the case for 2017 and beyond, after the expiration of
the existing travel provision, which allows manufacturers to meet their requirements by selling
EVs only in California. The ZEV program requirements have credits for different vehicle
technologies, so actual experience of sales could differ from the scenario presented below. A
relatively conservative estimate under existing policies would be approximately 10,000 EVs in
Vermont by 2023, or nearing about 2 percent of the fleet of registered vehicles.
Figure 15. Vermont ZEV Action Plan compliance scenario.35
90 x 2050 and SDP scenario. The Vermont Comprehensive Energy Plan includes goals for 25
percent of vehicles to be powered by renewable energy in 2030 and 90 percent by 2050. These
values translate to approximately 143,000 EVs in 2030 and 515,000 EVs by 2050. Achieving this
rate of growth will depend on vehicle availability at competitive pricing, and sustained programs
to transform the new and used vehicle markets.
35 “Vermont Zero Emission Vehicle Action Plan” (State of Vermont: Agency of Natural Resources, September 2014),
http://anr.vermont.gov/about_us/special-topics/climate-change/initiatives/zev.
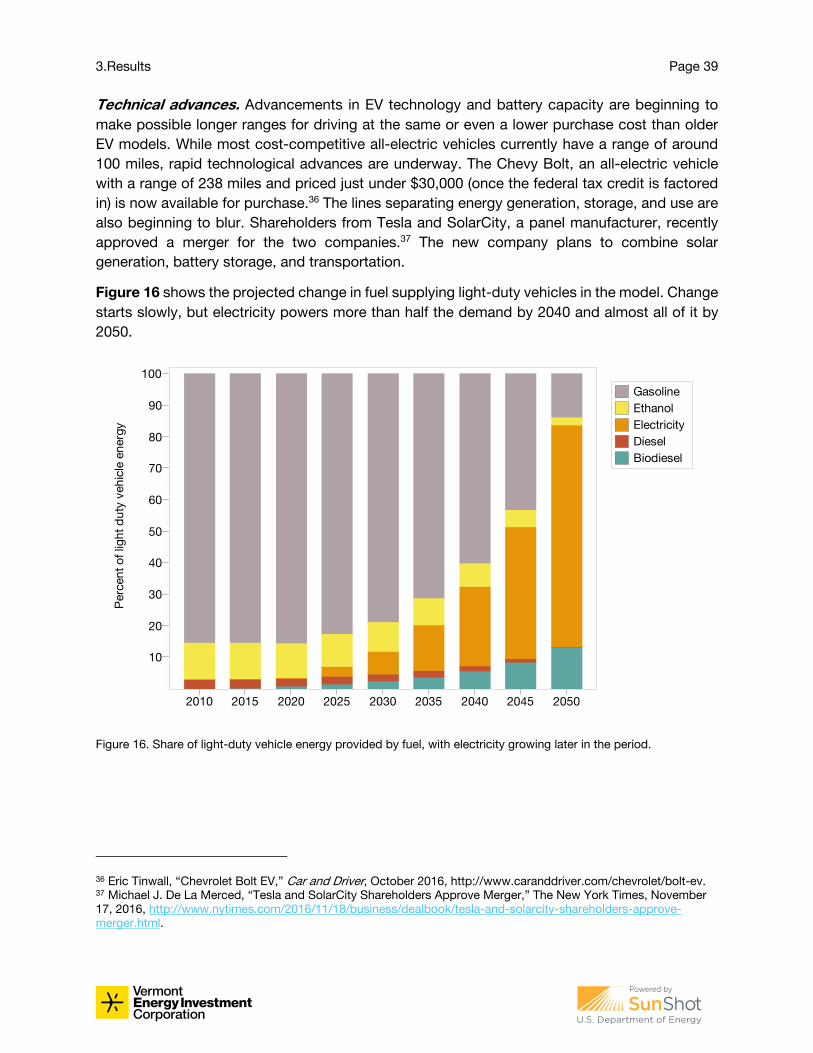
3.Results Page 39
Technical advances. Advancements in EV technology and battery capacity are beginning to
make possible longer ranges for driving at the same or even a lower purchase cost than older
EV models. While most cost-competitive all-electric vehicles currently have a range of around
100 miles, rapid technological advances are underway. The Chevy Bolt, an all-electric vehicle
with a range of 238 miles and priced just under $30,000 (once the federal tax credit is factored
in) is now available for purchase.36 The lines separating energy generation, storage, and use are
also beginning to blur. Shareholders from Tesla and SolarCity, a panel manufacturer, recently
approved a merger for the two companies.37 The new company plans to combine solar
generation, battery storage, and transportation.
Figure 16 shows the projected change in fuel supplying light-duty vehicles in the model. Change
starts slowly, but electricity powers more than half the demand by 2040 and almost all of it by
2050.
Figure 16. Share of light-duty vehicle energy provided by fuel, with electricity growing later in the period.
36 Eric Tinwall, “Chevrolet Bolt EV,” Car and Driver, October 2016, http://www.caranddriver.com/chevrolet/bolt-ev. 37 Michael J. De La Merced, “Tesla and SolarCity Shareholders Approve Merger,” The New York Times, November
17, 2016, http://www.nytimes.com/2016/11/18/business/dealbook/tesla-and-solarcity-shareholders-approve-
merger.html.
2010 2015 2020 2025 2030 2035 2040 2045 2050
Perc
en
t o
f lig
ht
du
ty v
eh
icle
en
erg
y
100
90
80
70
60
50
40
30
20
10
Gasoline
Ethanol
Electricity
Diesel
Biodiesel
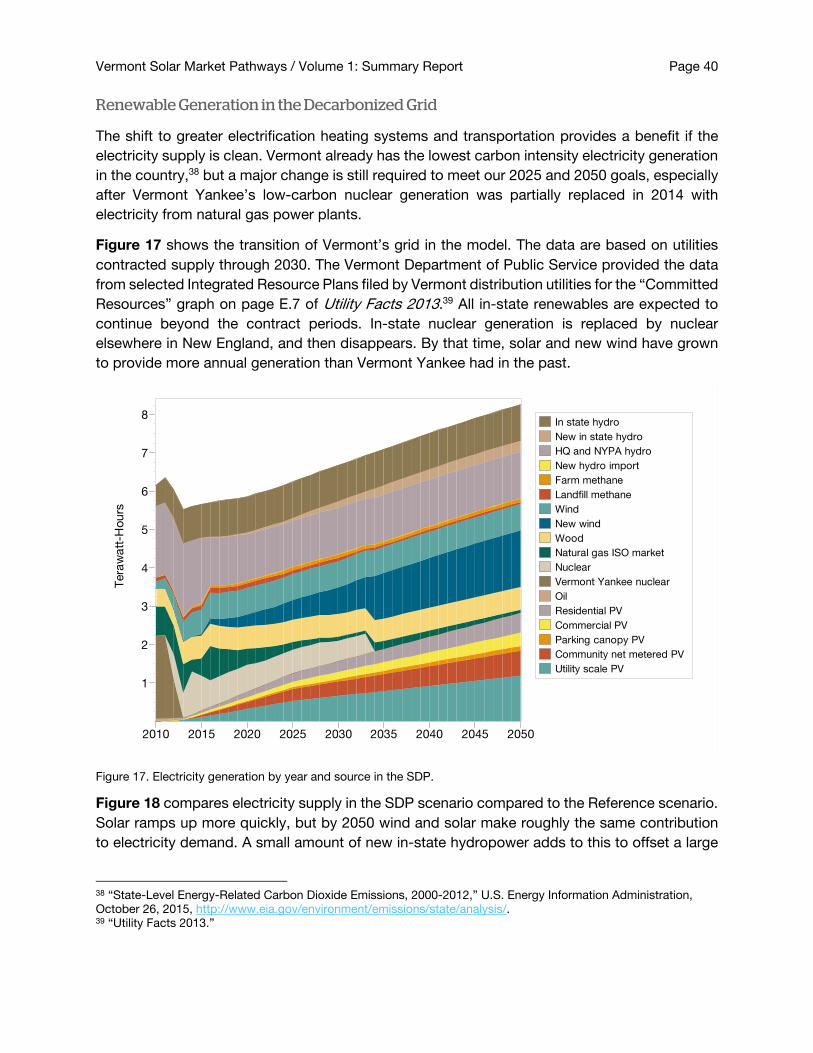
Vermont Solar Market Pathways / Volume 1: Summary Report Page 40
Renewable Generation in the Decarbonized Grid
The shift to greater electrification heating systems and transportation provides a benefit if the
electricity supply is clean. Vermont already has the lowest carbon intensity electricity generation
in the country,38 but a major change is still required to meet our 2025 and 2050 goals, especially
after Vermont Yankee’s low-carbon nuclear generation was partially replaced in 2014 with
electricity from natural gas power plants.
Figure 17 shows the transition of Vermont’s grid in the model. The data are based on utilities
contracted supply through 2030. The Vermont Department of Public Service provided the data
from selected Integrated Resource Plans filed by Vermont distribution utilities for the “Committed
Resources” graph on page E.7 of Utility Facts 2013.39 All in-state renewables are expected to
continue beyond the contract periods. In-state nuclear generation is replaced by nuclear
elsewhere in New England, and then disappears. By that time, solar and new wind have grown
to provide more annual generation than Vermont Yankee had in the past.
Figure 17. Electricity generation by year and source in the SDP.
Figure 18 compares electricity supply in the SDP scenario compared to the Reference scenario.
Solar ramps up more quickly, but by 2050 wind and solar make roughly the same contribution
to electricity demand. A small amount of new in-state hydropower adds to this to offset a large
38 “State-Level Energy-Related Carbon Dioxide Emissions, 2000-2012,” U.S. Energy Information Administration,
October 26, 2015, http://www.eia.gov/environment/emissions/state/analysis/. 39 “Utility Facts 2013.”
2010 2015 2020 2025 2030 2035 2040 2045 2050
Tera
wa
tt-H
ou
rs
8
7
6
5
4
3
2
1
In state hydro
New in state hydro
HQ and NYPA hydro
New hydro import
Farm methane
Landfill methane
Wind
New wind
Wood
Natural gas ISO market
Nuclear
Vermont Yankee nuclear
Oil
Residential PV
Commercial PV
Parking canopy PV
Community net metered PV
Utility scale PV
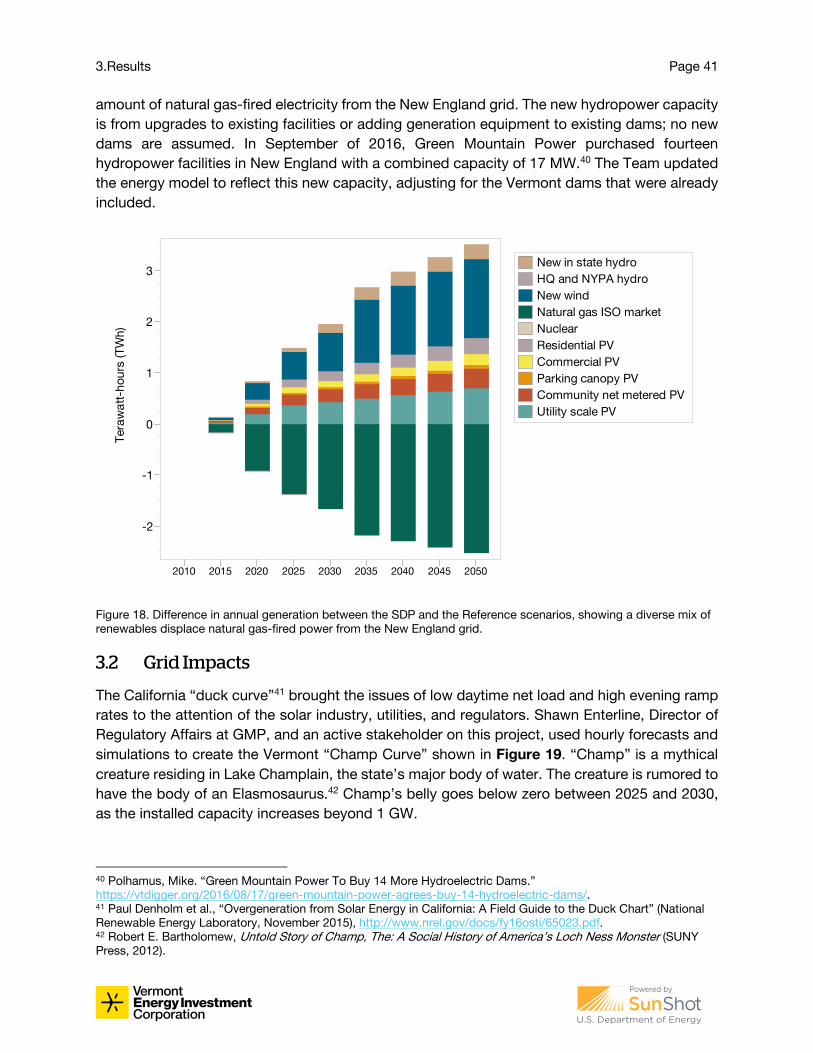
3.Results Page 41
amount of natural gas-fired electricity from the New England grid. The new hydropower capacity
is from upgrades to existing facilities or adding generation equipment to existing dams; no new
dams are assumed. In September of 2016, Green Mountain Power purchased fourteen
hydropower facilities in New England with a combined capacity of 17 MW.40 The Team updated
the energy model to reflect this new capacity, adjusting for the Vermont dams that were already
included.
Figure 18. Difference in annual generation between the SDP and the Reference scenarios, showing a diverse mix of
renewables displace natural gas-fired power from the New England grid.
3.2 Grid Impacts
The California “duck curve”41 brought the issues of low daytime net load and high evening ramp
rates to the attention of the solar industry, utilities, and regulators. Shawn Enterline, Director of
Regulatory Affairs at GMP, and an active stakeholder on this project, used hourly forecasts and
simulations to create the Vermont “Champ Curve” shown in Figure 19. “Champ” is a mythical
creature residing in Lake Champlain, the state’s major body of water. The creature is rumored to
have the body of an Elasmosaurus.42 Champ’s belly goes below zero between 2025 and 2030,
as the installed capacity increases beyond 1 GW.
40 Polhamus, Mike. “Green Mountain Power To Buy 14 More Hydroelectric Dams.”
https://vtdigger.org/2016/08/17/green-mountain-power-agrees-buy-14-hydroelectric-dams/. 41 Paul Denholm et al., “Overgeneration from Solar Energy in California: A Field Guide to the Duck Chart” (National
Renewable Energy Laboratory, November 2015), http://www.nrel.gov/docs/fy16osti/65023.pdf. 42 Robert E. Bartholomew, Untold Story of Champ, The: A Social History of America’s Loch Ness Monster (SUNY
Press, 2012).
2010 2015 2020 2025 2030 2035 2040 2045 2050
Tera
wa
tt-h
ou
rs (T
Wh
)
3
2
1
0
-1
-2
New in state hydro
HQ and NYPA hydro
New wind
Natural gas ISO market
Nuclear
Residential PV
Commercial PV
Parking canopy PV
Community net metered PV
Utility scale PV
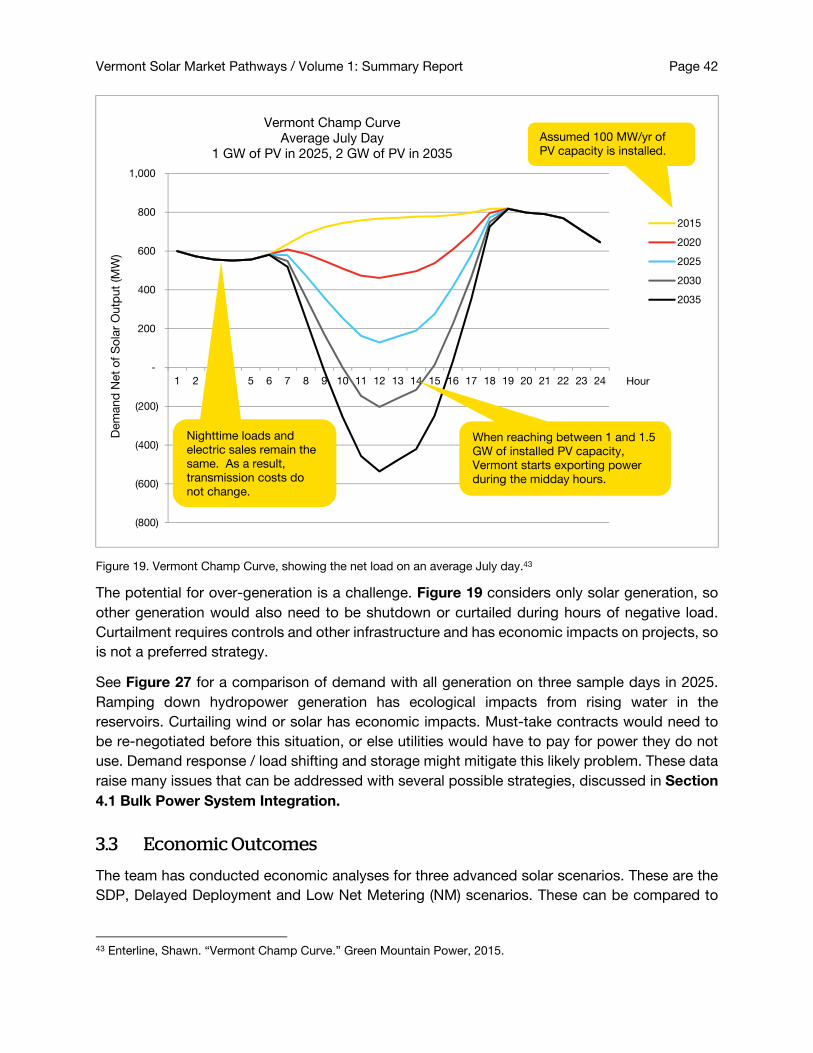
Vermont Solar Market Pathways / Volume 1: Summary Report Page 42
Figure 19. Vermont Champ Curve, showing the net load on an average July day.43
The potential for over-generation is a challenge. Figure 19 considers only solar generation, so
other generation would also need to be shutdown or curtailed during hours of negative load.
Curtailment requires controls and other infrastructure and has economic impacts on projects, so
is not a preferred strategy.
See Figure 27 for a comparison of demand with all generation on three sample days in 2025.
Ramping down hydropower generation has ecological impacts from rising water in the
reservoirs. Curtailing wind or solar has economic impacts. Must-take contracts would need to
be re-negotiated before this situation, or else utilities would have to pay for power they do not
use. Demand response / load shifting and storage might mitigate this likely problem. These data
raise many issues that can be addressed with several possible strategies, discussed in Section
4.1 Bulk Power System Integration.
3.3 Economic Outcomes
The team has conducted economic analyses for three advanced solar scenarios. These are the
SDP, Delayed Deployment and Low Net Metering (NM) scenarios. These can be compared to
43 Enterline, Shawn. “Vermont Champ Curve.” Green Mountain Power, 2015.
(800)
(600)
(400)
(200)
-
200
400
600
800
1,000
1 2 3 4 5 6 7 8 9 10 11 12 13 14 15 16 17 18 19 20 21 22 23 24
Dem
and
Net
of
So
lar
Ou
tpu
t (M
W)
Hour
Vermont Champ Curve
Average July Day
1 GW of PV in 2025, 2 GW of PV in 2035
2015
2020
2025
2030
2035
When reaching between 1 and 1.5
GW of installed PV capacity,
Vermont starts exporting power
during the midday hours.
Assumed 100 MW/yr of
PV capacity is installed.
Nighttime loads and
electric sales remain the
same. As a result,
transmission costs do
not change.
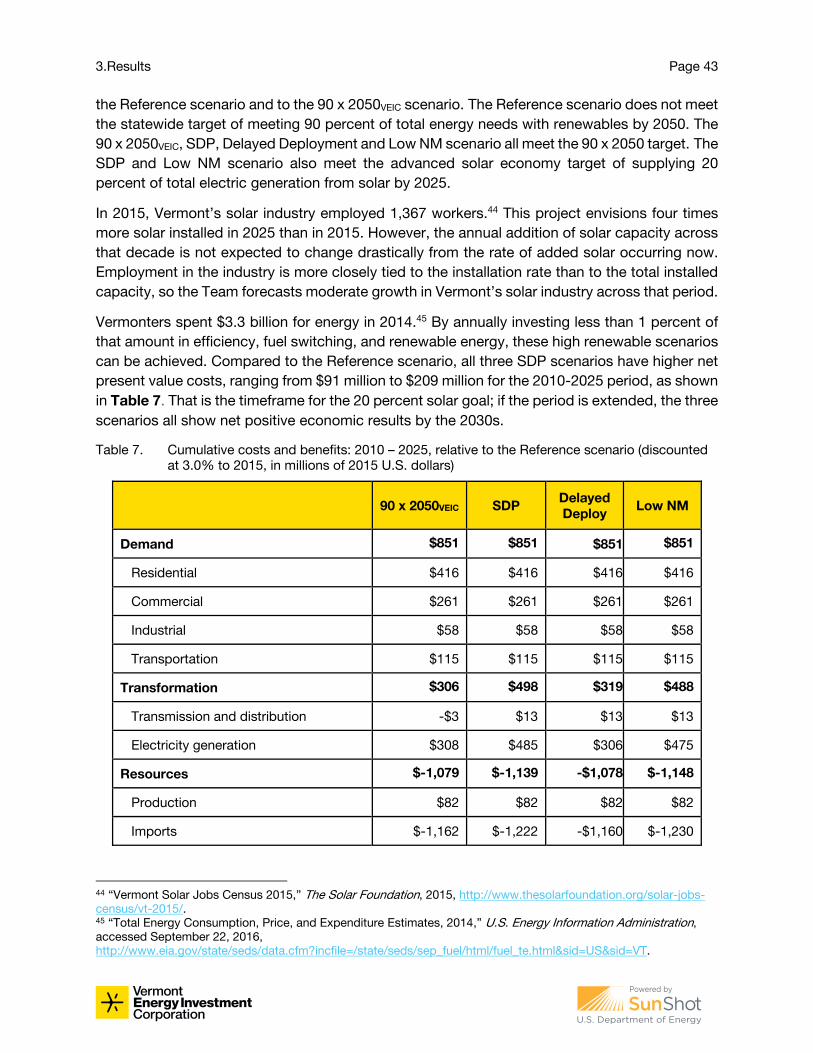
3.Results Page 43
the Reference scenario and to the 90 x 2050VEIC scenario. The Reference scenario does not meet
the statewide target of meeting 90 percent of total energy needs with renewables by 2050. The
90 x 2050VEIC, SDP, Delayed Deployment and Low NM scenario all meet the 90 x 2050 target. The
SDP and Low NM scenario also meet the advanced solar economy target of supplying 20
percent of total electric generation from solar by 2025.
In 2015, Vermont’s solar industry employed 1,367 workers.44 This project envisions four times
more solar installed in 2025 than in 2015. However, the annual addition of solar capacity across
that decade is not expected to change drastically from the rate of added solar occurring now.
Employment in the industry is more closely tied to the installation rate than to the total installed
capacity, so the Team forecasts moderate growth in Vermont’s solar industry across that period.
Vermonters spent $3.3 billion for energy in 2014.45 By annually investing less than 1 percent of
that amount in efficiency, fuel switching, and renewable energy, these high renewable scenarios
can be achieved. Compared to the Reference scenario, all three SDP scenarios have higher net
present value costs, ranging from $91 million to $209 million for the 2010-2025 period, as shown
in Table 7. That is the timeframe for the 20 percent solar goal; if the period is extended, the three
scenarios all show net positive economic results by the 2030s.
Table 7. Cumulative costs and benefits: 2010 – 2025, relative to the Reference scenario (discounted
at 3.0% to 2015, in millions of 2015 U.S. dollars)
90 x 2050VEIC SDP Delayed
Deploy Low NM
Demand $851 $851 $851 $851
Residential $416 $416 $416 $416
Commercial $261 $261 $261 $261
Industrial $58 $58 $58 $58
Transportation $115 $115 $115 $115
Transformation $306 $498 $319 $488
Transmission and distribution -$3 $13 $13 $13
Electricity generation $308 $485 $306 $475
Resources $-1,079 $-1,139 -$1,078 $-1,148
Production $82 $82 $82 $82
Imports $-1,162 $-1,222 -$1,160 $-1,230
44 “Vermont Solar Jobs Census 2015,” The Solar Foundation, 2015, http://www.thesolarfoundation.org/solar-jobs-
census/vt-2015/. 45 “Total Energy Consumption, Price, and Expenditure Estimates, 2014,” U.S. Energy Information Administration,
accessed September 22, 2016,
http://www.eia.gov/state/seds/data.cfm?incfile=/state/seds/sep_fuel/html/fuel_te.html&sid=US&sid=VT.
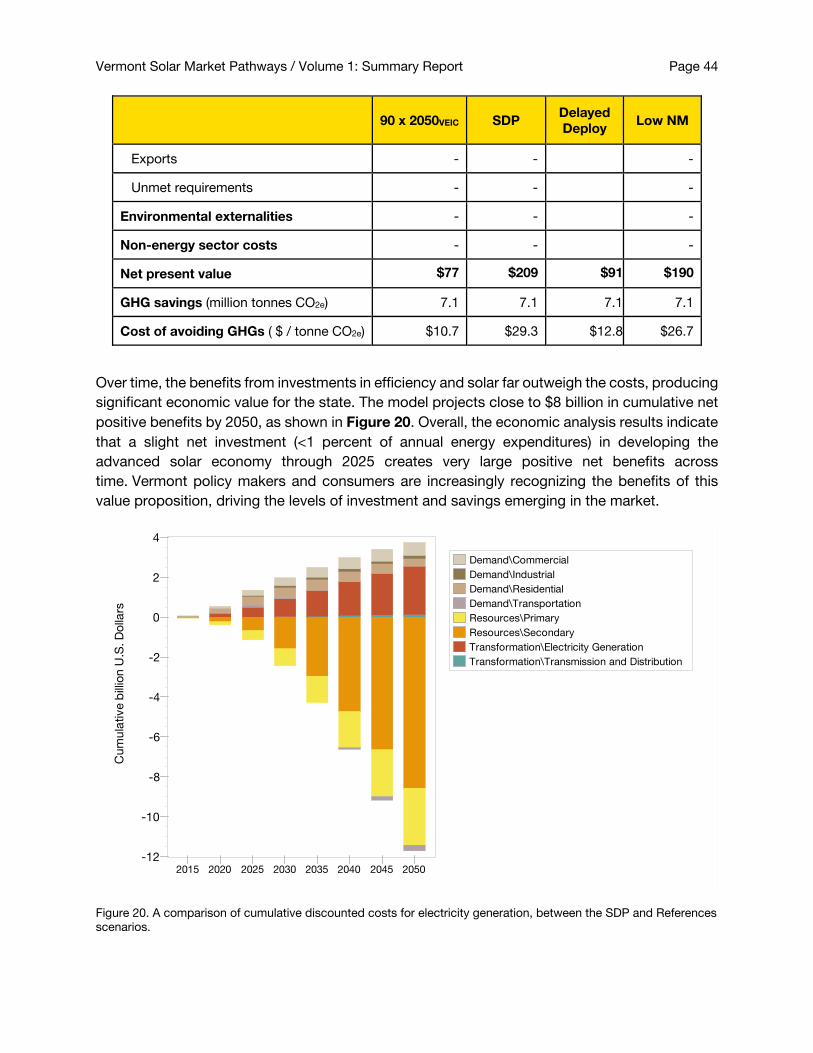
Vermont Solar Market Pathways / Volume 1: Summary Report Page 44
90 x 2050VEIC SDP Delayed
Deploy Low NM
Exports - - -
Unmet requirements - - -
Environmental externalities - - -
Non-energy sector costs - - -
Net present value $77 $209 $91 $190
GHG savings (million tonnes CO2e) 7.1 7.1 7.1 7.1
Cost of avoiding GHGs ( $ / tonne CO2e) $10.7 $29.3 $12.8 $26.7
Over time, the benefits from investments in efficiency and solar far outweigh the costs, producing
significant economic value for the state. The model projects close to $8 billion in cumulative net
positive benefits by 2050, as shown in Figure 20. Overall, the economic analysis results indicate
that a slight net investment (<1 percent of annual energy expenditures) in developing the
advanced solar economy through 2025 creates very large positive net benefits across
time. Vermont policy makers and consumers are increasingly recognizing the benefits of this
value proposition, driving the levels of investment and savings emerging in the market.
Figure 20. A comparison of cumulative discounted costs for electricity generation, between the SDP and References
scenarios.
2015 2020 2025 2030 2035 2040 2045 2050
Cu
mu
lative b
illio
n U
.S. D
olla
rs
4
2
0
-2
-4
-6
-8
-10
-12
Demand\Commercial
Demand\Industrial
Demand\Residential
Demand\Transportation
Resources\Primary
Resources\Secondary
Transformation\Electricity Generation
Transformation\Transmission and Distribution
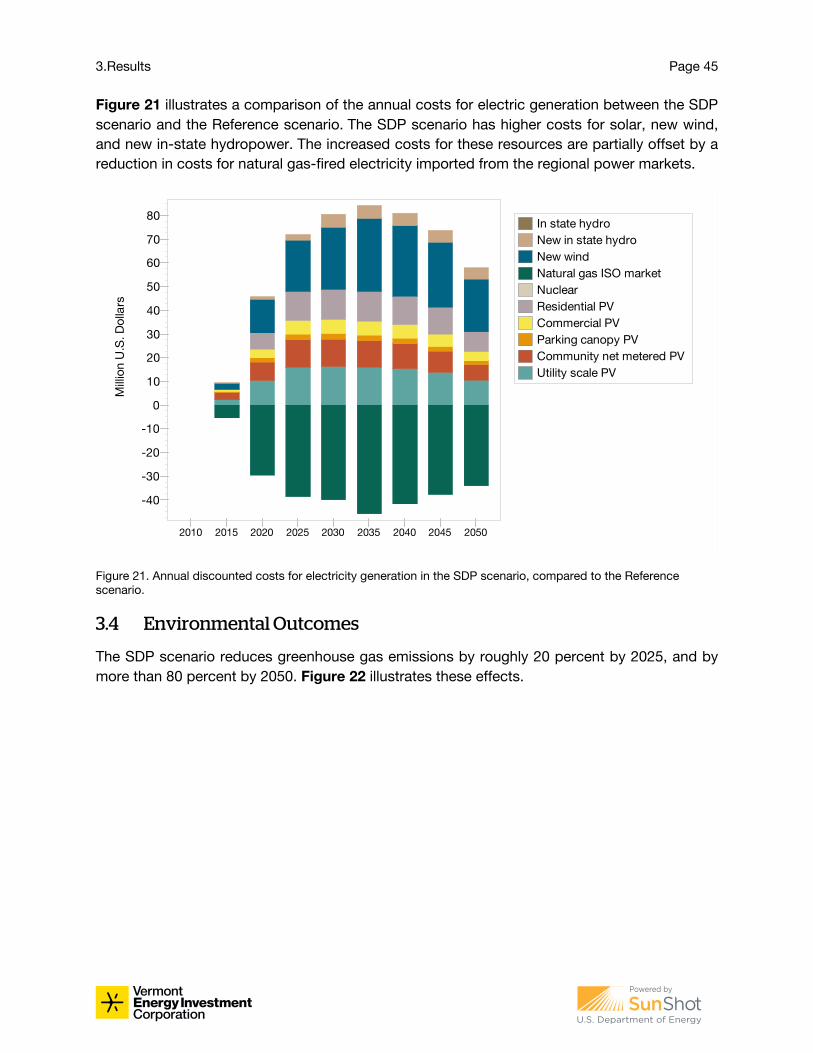
3.Results Page 45
Figure 21 illustrates a comparison of the annual costs for electric generation between the SDP
scenario and the Reference scenario. The SDP scenario has higher costs for solar, new wind,
and new in-state hydropower. The increased costs for these resources are partially offset by a
reduction in costs for natural gas-fired electricity imported from the regional power markets.
Figure 21. Annual discounted costs for electricity generation in the SDP scenario, compared to the Reference
scenario.
3.4 Environmental Outcomes
The SDP scenario reduces greenhouse gas emissions by roughly 20 percent by 2025, and by
more than 80 percent by 2050. Figure 22 illustrates these effects.
2010 2015 2020 2025 2030 2035 2040 2045 2050
Mill
ion
U.S
. D
olla
rs
80
70
60
50
40
30
20
10
0
-10
-20
-30
-40
In state hydro
New in state hydro
New wind
Natural gas ISO market
Nuclear
Residential PV
Commercial PV
Parking canopy PV
Community net metered PV
Utility scale PV
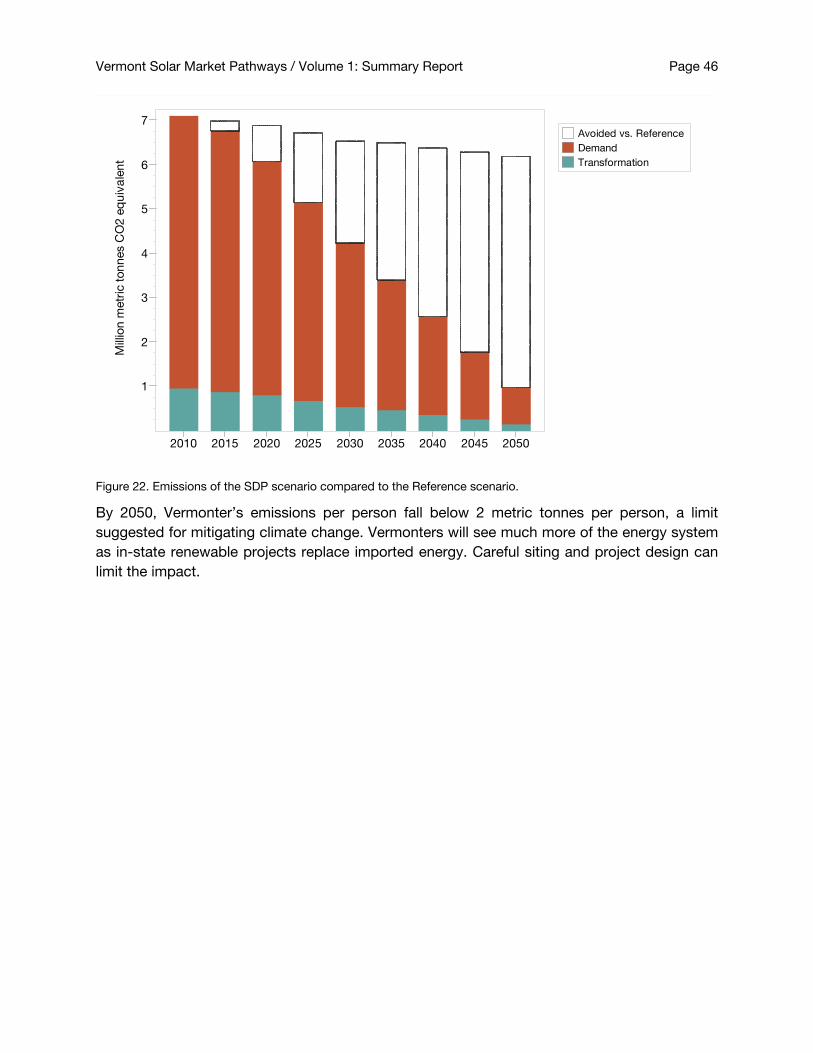
Vermont Solar Market Pathways / Volume 1: Summary Report Page 46
Figure 22. Emissions of the SDP scenario compared to the Reference scenario.
By 2050, Vermonter’s emissions per person fall below 2 metric tonnes per person, a limit
suggested for mitigating climate change. Vermonters will see much more of the energy system
as in-state renewable projects replace imported energy. Careful siting and project design can
limit the impact.
2010 2015 2020 2025 2030 2035 2040 2045 2050
Mill
ion
metr
ic t
on
nes C
O2
eq
uiv
ale
nt
7
6
5
4
3
2
1
Avoided vs. Reference
Demand
Transformation
4. Strategies for Becoming an Advanced Solar Economy
4.1 How the Results Can Be Attained
Siting and System Integration
The Team identified the target of 20 percent of total electric needs met by solar power by 2025
as an ambitious but achievable solar energy goal. To achieve 20 percent of annual electricity
supplied by solar in Vermont requires approximately 1 GW of solar, which is equal to Vermont’s
peak electric demand—before the electrification of transportation and heat.
To determine how to reach that target, the Team evaluated the impact of 1 GW of solar within
the state’s bulk power mix, and how that much solar would affect the distribution circuits where
it would be connected.
This approach, identifying a goal and illustrating and exploring multiple ways of reaching it,
allowed the Team to test several different scenarios. No predictive analysis will be 100 percent
accurate, particularly one with a time span as long as 35 years. The end-oriented approach has
provided a structure through which to test hypotheses and to elicit stakeholder feedback on
likely issues. Other analyses screen for cost effectiveness or use economic optimizations.
However, people do not always make consistent, rational economic decisions, nor do they
immediately switch when a new, more cost-effective product or service becomes available.
This project describes a future that people want, even though they are not certain that it is
achievable. The team built support for the 20 percent goal and then worked through issues to
build confidence in the feasibility. Volume 3, Barriers and Integration Brief documented several
possible problems from a future that offers high solar penetration. This section identifies potential
solutions to each.
Space Requirement
Some observers cite the space requirements of solar as a reason for it not to play a major energy
supply role. Although sunshine is one of the least dense forms of energy, and siting space might
be a limiting factor in cities attempting to become energy self-sufficient, Vermont has more than
enough space for solar. For an approximation of the space required for the SDP scenario, the
Team examined land requirements based on the 2050 solar capacity, shown in Table 8.
At that point, solar produces close to one-third of annual generation, and the space requirements
are just 2/10 of 1 percent. This finding helps to inform the public discussion of land requirements
for solar, indicating that solar resource and land are not limiting factors.
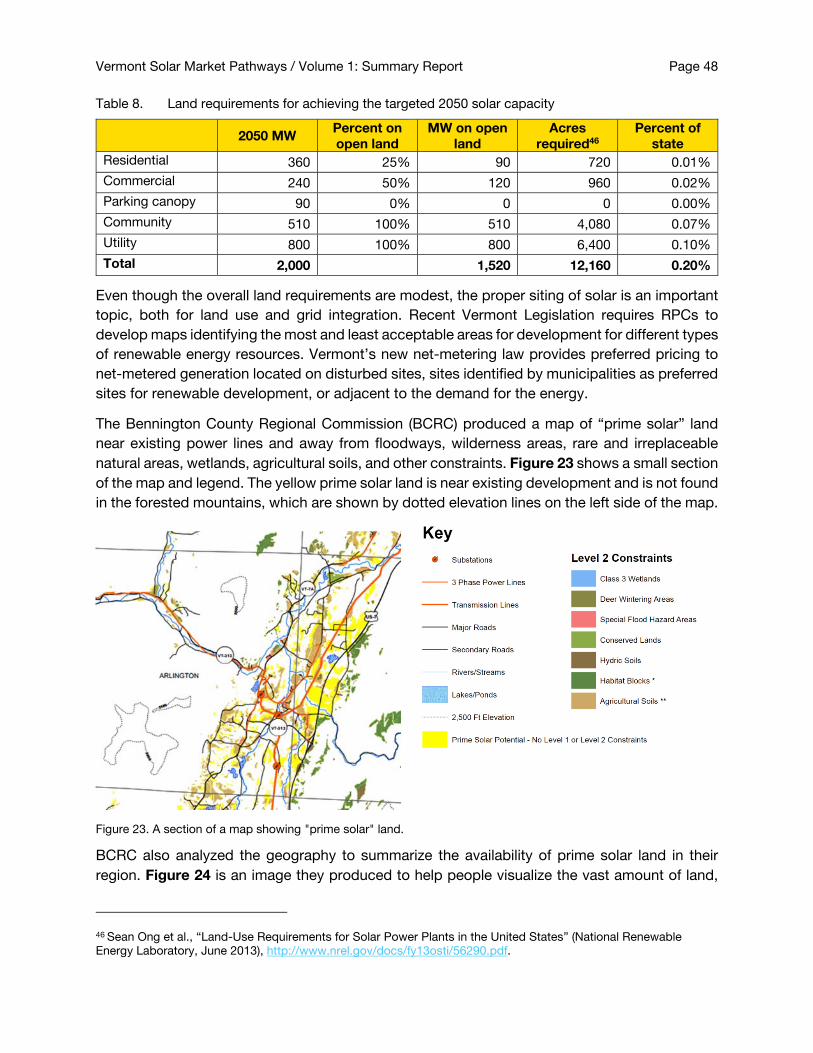
Vermont Solar Market Pathways / Volume 1: Summary Report Page 48
Table 8. Land requirements for achieving the targeted 2050 solar capacity
2050 MW Percent on
open land
MW on open
land
Acres
required46
Percent of
state
Residential 360 25% 90 720 0.01%
Commercial 240 50% 120 960 0.02%
Parking canopy 90 0% 0 0 0.00%
Community 510 100% 510 4,080 0.07%
Utility 800 100% 800 6,400 0.10%
Total 2,000 1,520 12,160 0.20%
Even though the overall land requirements are modest, the proper siting of solar is an important
topic, both for land use and grid integration. Recent Vermont Legislation requires RPCs to
develop maps identifying the most and least acceptable areas for development for different types
of renewable energy resources. Vermont’s new net-metering law provides preferred pricing to
net-metered generation located on disturbed sites, sites identified by municipalities as preferred
sites for renewable development, or adjacent to the demand for the energy.
The Bennington County Regional Commission (BCRC) produced a map of “prime solar” land
near existing power lines and away from floodways, wilderness areas, rare and irreplaceable
natural areas, wetlands, agricultural soils, and other constraints. Figure 23 shows a small section
of the map and legend. The yellow prime solar land is near existing development and is not found
in the forested mountains, which are shown by dotted elevation lines on the left side of the map.
Figure 23. A section of a map showing "prime solar" land.
BCRC also analyzed the geography to summarize the availability of prime solar land in their
region. Figure 24 is an image they produced to help people visualize the vast amount of land,
46 Sean Ong et al., “Land-Use Requirements for Solar Power Plants in the United States” (National Renewable
Energy Laboratory, June 2013), http://www.nrel.gov/docs/fy13osti/56290.pdf.
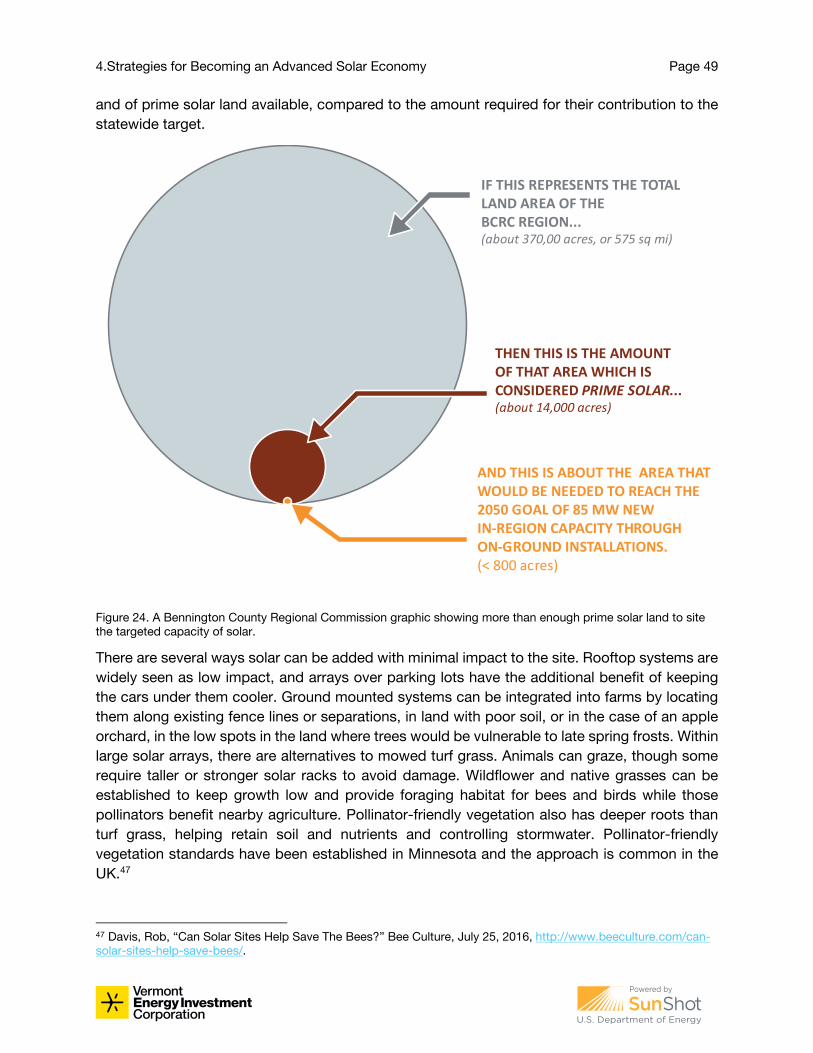
4.Strategies for Becoming an Advanced Solar Economy Page 49
and of prime solar land available, compared to the amount required for their contribution to the
statewide target.
Figure 24. A Bennington County Regional Commission graphic showing more than enough prime solar land to site
the targeted capacity of solar.
There are several ways solar can be added with minimal impact to the site. Rooftop systems are
widely seen as low impact, and arrays over parking lots have the additional benefit of keeping
the cars under them cooler. Ground mounted systems can be integrated into farms by locating
them along existing fence lines or separations, in land with poor soil, or in the case of an apple
orchard, in the low spots in the land where trees would be vulnerable to late spring frosts. Within
large solar arrays, there are alternatives to mowed turf grass. Animals can graze, though some
require taller or stronger solar racks to avoid damage. Wildflower and native grasses can be
established to keep growth low and provide foraging habitat for bees and birds while those
pollinators benefit nearby agriculture. Pollinator-friendly vegetation also has deeper roots than
turf grass, helping retain soil and nutrients and controlling stormwater. Pollinator-friendly
vegetation standards have been established in Minnesota and the approach is common in the
UK.47
47 Davis, Rob, “Can Solar Sites Help Save The Bees?” Bee Culture, July 25, 2016, http://www.beeculture.com/can-
solar-sites-help-save-bees/.
IF THIS REPRESENTS THE TOTALLAND AREA OF THEBCRC REGION...(about 370,00 acres, or 575 sq mi)
THEN THIS IS THE AMOUNTOF THAT AREAWHICH ISCONSIDERED PRIME SOLAR...(about 14,000 acres)
AND THIS IS ABOUT THE AREA THATWOULD BE NEEDED TO REACH THE2050 GOAL OF 85 MW NEWIN-REGION CAPACITY THROUGHON-GROUND INSTALLATIONS.(< 800 acres)
Vermont Solar Market Pathways / Volume 1: Summary Report Page 50
Distribution System
A high percentage of solar and other renewables can cause problems on the distribution grid
and in bulk power supply. Although this study did not conduct detailed distribution engineering
analyses, the Team reviewed related work in other jurisdictions and is following the progress of
the Vermont utilities’ work with Sandia National Laboratory, funded through DOE’s Grid
Modernization Initiative.
Relevant outcomes of secondary research are summarized below. Well-designed and executed
distribution study analyses provide the following results for substations and individual feeders.
These findings are detailed on page 5-14 of Electric Power Research Institute’s (EPRI) benefit-
cost analysis of an integrated grid framework:48
• Feeder-specific hosting capacity. Individual feeders, and locations along an individual
feeder, vary in their ability to host DERs without violating voltage and protection
scheme thresholds. Generally, locations that are closer to the substation on a radial
feeder will have a higher hosting capacity than locations at the end of the feeder line.
The presence of DERs does not always result in negative impacts. For example, if the
end of a radial feeder line is challenged to maintain adequate voltage, the development
of DERs with appropriate controls may be able to alleviate the situation.
• Substation-level hosting capacity. The hosting capacity at a substation serving
several feeders may or may not be the sum of the feeders’ capacities. Determining
substation hosting capacity helps to inform analysis of the bulk power system and
analysis of overall supply adequacy and system reliability.
• Energy consumption and loss impacts. The levels of DER on a feeder affect the
loading of the feeder which influences distribution system losses. For example, the high
end of voltage operating windows results in higher line losses. If distributed generation
causes higher current flowing back to the substation than the original load, line losses
will increase in that condition. The operations of equipment along a feeder, such as the
frequency of changes in voltage tap regulators, can also be affected by additional DER.
Sometimes relatively simple solutions are available, whereas in other cases more
expensive changes in the system are required.
• Asset deferral. The development of well-integrated DER can help to alleviate the need
for distribution and substation capacity upgrades.
This type of analysis is already taking place at many leading utilities. An example of asset deferral
is Consolidated Edison’s Neighborhood program, which aims to defer the need for a $1.2 billion
substation upgrade with investments in demand response and distributed resources.49
48 K. Forsten, “The Integrated Grid: A Benefit-Cost Framework” (Electric Power Research Institute, February 2015),
http://www.epri.com/abstracts/Pages/ProductAbstract.aspx?ProductId=000000003002004878. 49 G. Bade, “ConEd Awards 22 MW of Demand Response Contracts in Brooklyn-Queens Project,” Utility Dive, August 8, 2016, http://www.utilitydive.com/news/coned-awards-22-mw-of-demand-response-contracts-in-
brooklyn-queens-project/424034/.
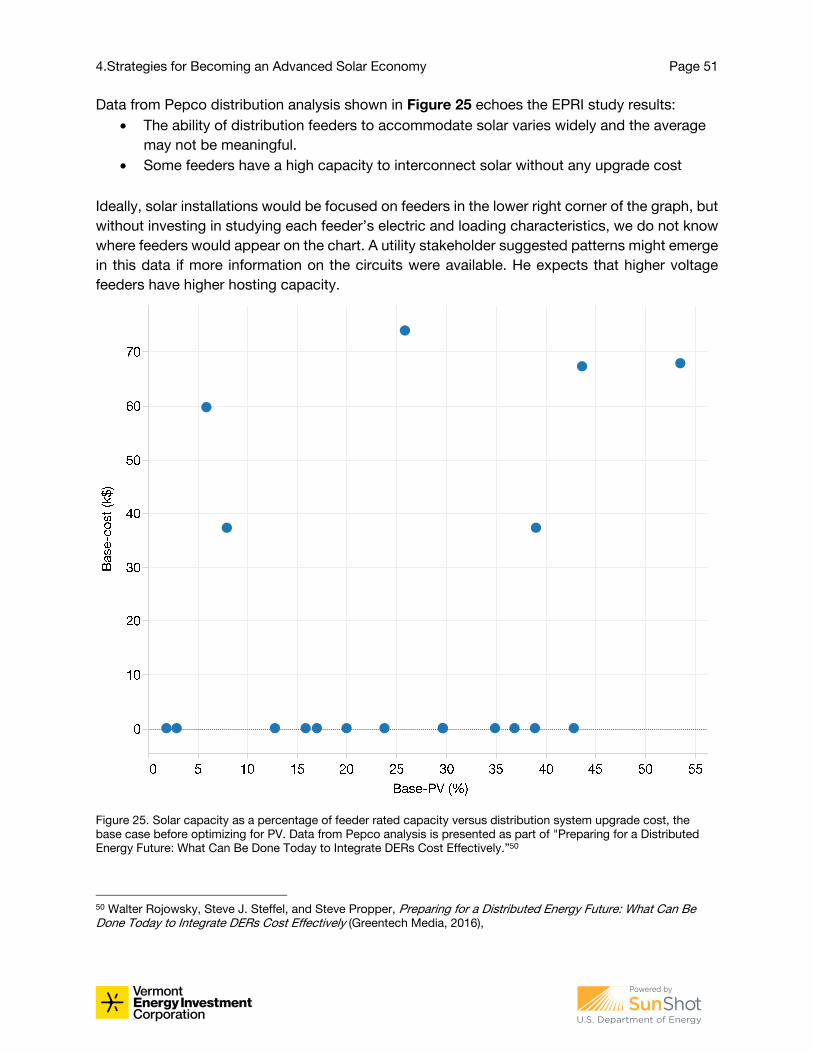
4.Strategies for Becoming an Advanced Solar Economy Page 51
Data from Pepco distribution analysis shown in Figure 25 echoes the EPRI study results:
• The ability of distribution feeders to accommodate solar varies widely and the average
may not be meaningful.
• Some feeders have a high capacity to interconnect solar without any upgrade cost
Ideally, solar installations would be focused on feeders in the lower right corner of the graph, but
without investing in studying each feeder’s electric and loading characteristics, we do not know
where feeders would appear on the chart. A utility stakeholder suggested patterns might emerge
in this data if more information on the circuits were available. He expects that higher voltage
feeders have higher hosting capacity.
Figure 25. Solar capacity as a percentage of feeder rated capacity versus distribution system upgrade cost, the
base case before optimizing for PV. Data from Pepco analysis is presented as part of "Preparing for a Distributed
Energy Future: What Can Be Done Today to Integrate DERs Cost Effectively.”50
50 Walter Rojowsky, Steve J. Steffel, and Steve Propper, Preparing for a Distributed Energy Future: What Can Be Done Today to Integrate DERs Cost Effectively (Greentech Media, 2016),
Vermont Solar Market Pathways / Volume 1: Summary Report Page 52
Navigant performed similar analysis for the Virginia Solar Market Pathways project.51 This
analysis had similar results and showed that many feeders can host relatively high solar
penetration without any upgrades. Very high solar penetration that generates power beyond the
local needs and pushes power back onto the transmission or sub-transmission grid is likely to
require utility upgrades.
Both of the Pepco and Navigant analyses also show that some feeders can host zero or small
amounts of solar before requiring upgrades.52 This highlights the needs for strategic siting.
Vermont has many opportunities to apply these analyses in its siting practices.
In the typical process, a homeowner, business, or solar developer designs a solar system,
applies for a permit (in Vermont it is a Certificate of Public Good) and applies for interconnection
with the utility. If the project requires the utility to upgrade their equipment, the project is charged
for the cost of that upgrade.
Stakeholders discussed two problems with this approach: First, it is inefficient and wastes
system design time when cost-effective interconnection is not possible. Second, it may fully
burden one project with upgrade costs that were partially caused by the systems that came
before it, and systems that come later may get free use of the newly added hosting capacity.
Green Mountain Power provides potential developers with a Solar Map,53 a section of which is
shown in Figure 26 that gives an initial indication of where projects are more or less likely to
have high interconnection costs. This initial hosting capacity analysis has been helpful to guide
development away from areas already constrained, but it is fairly simplistic. In 2017, GMP will
implement circuit-level modeling to create a proactive distribution plan for every GMP circuit.
https://www.greentechmedia.com/events/webinar/preparing-for-a-distributed-energy-future-what-can-be-done-
today-to-integra. 51 Navigant Consulting, “Virginia Solar Pathways Project, Study 1: Distributed Solar Generation Integration and Best
Practices Review,” April 30, 2016. http://solarmarketpathways.org/wp-content/uploads/2016/09/DVP_DG-
Transmission-and-Distribution-Grid-Integration-Study.pdf. 52 Vermont’s long and lightly loaded rural feeders may be different from those studied. Results from the Grid
Modernization study by Sandia will help the Team and stakeholders understand more about Vermont’s feeders. 53 “Solar Map,” Green Mountain Power, accessed September 21, 2016,
http://www.greenmountainpower.com/innovative/solar/solar-map/.
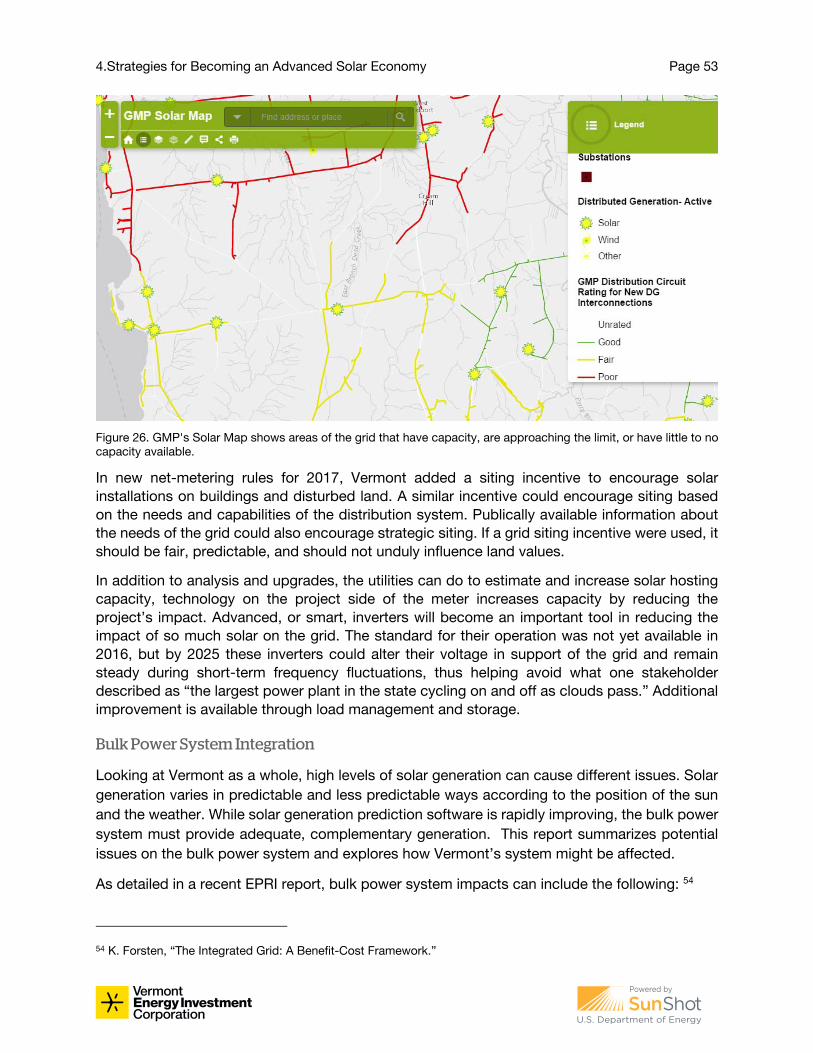
4.Strategies for Becoming an Advanced Solar Economy Page 53
Figure 26. GMP's Solar Map shows areas of the grid that have capacity, are approaching the limit, or have little to no
capacity available.
In new net-metering rules for 2017, Vermont added a siting incentive to encourage solar
installations on buildings and disturbed land. A similar incentive could encourage siting based
on the needs and capabilities of the distribution system. Publically available information about
the needs of the grid could also encourage strategic siting. If a grid siting incentive were used, it
should be fair, predictable, and should not unduly influence land values.
In addition to analysis and upgrades, the utilities can do to estimate and increase solar hosting
capacity, technology on the project side of the meter increases capacity by reducing the
project’s impact. Advanced, or smart, inverters will become an important tool in reducing the
impact of so much solar on the grid. The standard for their operation was not yet available in
2016, but by 2025 these inverters could alter their voltage in support of the grid and remain
steady during short-term frequency fluctuations, thus helping avoid what one stakeholder
described as “the largest power plant in the state cycling on and off as clouds pass.” Additional
improvement is available through load management and storage.
Bulk Power System Integration
Looking at Vermont as a whole, high levels of solar generation can cause different issues. Solar
generation varies in predictable and less predictable ways according to the position of the sun
and the weather. While solar generation prediction software is rapidly improving, the bulk power
system must provide adequate, complementary generation. This report summarizes potential
issues on the bulk power system and explores how Vermont’s system might be affected.
As detailed in a recent EPRI report, bulk power system impacts can include the following: 54
54 K. Forsten, “The Integrated Grid: A Benefit-Cost Framework.”
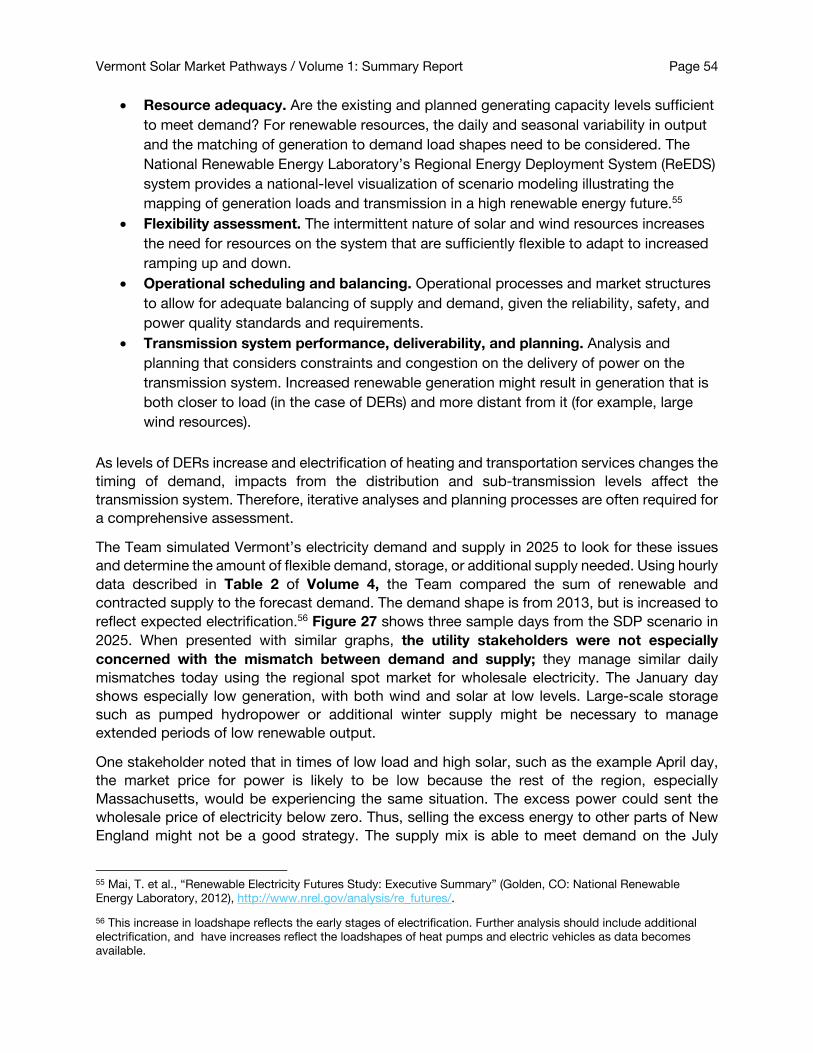
Vermont Solar Market Pathways / Volume 1: Summary Report Page 54
• Resource adequacy. Are the existing and planned generating capacity levels sufficient
to meet demand? For renewable resources, the daily and seasonal variability in output
and the matching of generation to demand load shapes need to be considered. The
National Renewable Energy Laboratory’s Regional Energy Deployment System (ReEDS)
system provides a national-level visualization of scenario modeling illustrating the
mapping of generation loads and transmission in a high renewable energy future.55
• Flexibility assessment. The intermittent nature of solar and wind resources increases
the need for resources on the system that are sufficiently flexible to adapt to increased
ramping up and down.
• Operational scheduling and balancing. Operational processes and market structures
to allow for adequate balancing of supply and demand, given the reliability, safety, and
power quality standards and requirements.
• Transmission system performance, deliverability, and planning. Analysis and
planning that considers constraints and congestion on the delivery of power on the
transmission system. Increased renewable generation might result in generation that is
both closer to load (in the case of DERs) and more distant from it (for example, large
wind resources).
As levels of DERs increase and electrification of heating and transportation services changes the
timing of demand, impacts from the distribution and sub-transmission levels affect the
transmission system. Therefore, iterative analyses and planning processes are often required for
a comprehensive assessment.
The Team simulated Vermont’s electricity demand and supply in 2025 to look for these issues
and determine the amount of flexible demand, storage, or additional supply needed. Using hourly
data described in Table 2 of Volume 4, the Team compared the sum of renewable and
contracted supply to the forecast demand. The demand shape is from 2013, but is increased to
reflect expected electrification.56 Figure 27 shows three sample days from the SDP scenario in
2025. When presented with similar graphs, the utility stakeholders were not especially
concerned with the mismatch between demand and supply; they manage similar daily
mismatches today using the regional spot market for wholesale electricity. The January day
shows especially low generation, with both wind and solar at low levels. Large-scale storage
such as pumped hydropower or additional winter supply might be necessary to manage
extended periods of low renewable output.
One stakeholder noted that in times of low load and high solar, such as the example April day,
the market price for power is likely to be low because the rest of the region, especially
Massachusetts, would be experiencing the same situation. The excess power could sent the
wholesale price of electricity below zero. Thus, selling the excess energy to other parts of New
England might not be a good strategy. The supply mix is able to meet demand on the July
55 Mai, T. et al., “Renewable Electricity Futures Study: Executive Summary” (Golden, CO: National Renewable
Energy Laboratory, 2012), http://www.nrel.gov/analysis/re_futures/.
56 This increase in loadshape reflects the early stages of electrification. Further analysis should include additional
electrification, and have increases reflect the loadshapes of heat pumps and electric vehicles as data becomes
available.
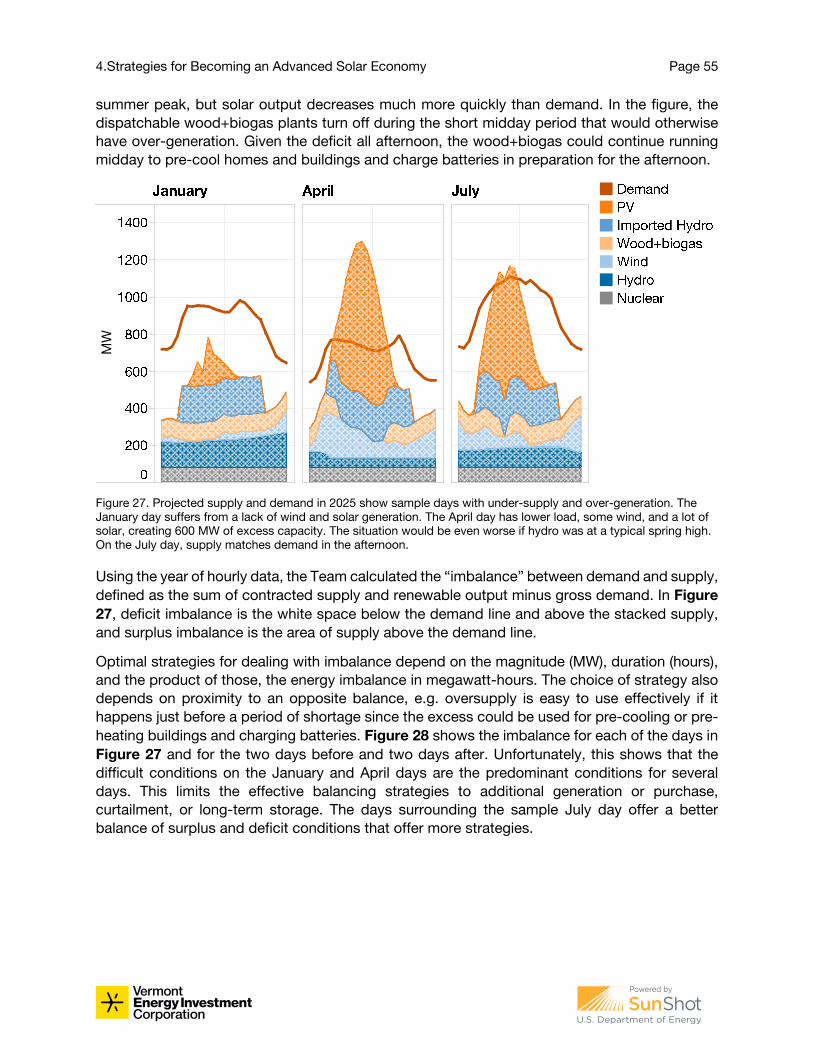
4.Strategies for Becoming an Advanced Solar Economy Page 55
summer peak, but solar output decreases much more quickly than demand. In the figure, the
dispatchable wood+biogas plants turn off during the short midday period that would otherwise
have over-generation. Given the deficit all afternoon, the wood+biogas could continue running
midday to pre-cool homes and buildings and charge batteries in preparation for the afternoon.
Figure 27. Projected supply and demand in 2025 show sample days with under-supply and over-generation. The
January day suffers from a lack of wind and solar generation. The April day has lower load, some wind, and a lot of
solar, creating 600 MW of excess capacity. The situation would be even worse if hydro was at a typical spring high.
On the July day, supply matches demand in the afternoon.
Using the year of hourly data, the Team calculated the “imbalance” between demand and supply,
defined as the sum of contracted supply and renewable output minus gross demand. In Figure
27, deficit imbalance is the white space below the demand line and above the stacked supply,
and surplus imbalance is the area of supply above the demand line.
Optimal strategies for dealing with imbalance depend on the magnitude (MW), duration (hours),
and the product of those, the energy imbalance in megawatt-hours. The choice of strategy also
depends on proximity to an opposite balance, e.g. oversupply is easy to use effectively if it
happens just before a period of shortage since the excess could be used for pre-cooling or pre-
heating buildings and charging batteries. Figure 28 shows the imbalance for each of the days in
Figure 27 and for the two days before and two days after. Unfortunately, this shows that the
difficult conditions on the January and April days are the predominant conditions for several
days. This limits the effective balancing strategies to additional generation or purchase,
curtailment, or long-term storage. The days surrounding the sample July day offer a better
balance of surplus and deficit conditions that offer more strategies.
MW
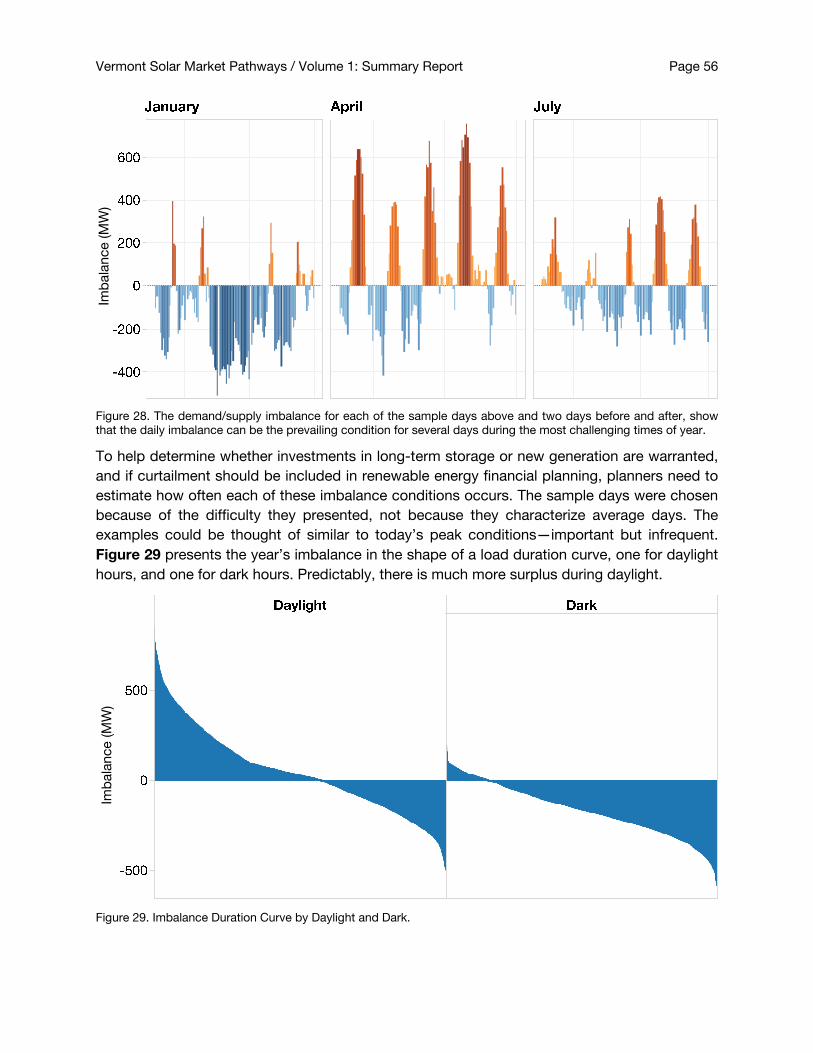
Vermont Solar Market Pathways / Volume 1: Summary Report Page 56
Figure 28. The demand/supply imbalance for each of the sample days above and two days before and after, show
that the daily imbalance can be the prevailing condition for several days during the most challenging times of year.
To help determine whether investments in long-term storage or new generation are warranted,
and if curtailment should be included in renewable energy financial planning, planners need to
estimate how often each of these imbalance conditions occurs. The sample days were chosen
because of the difficulty they presented, not because they characterize average days. The
examples could be thought of similar to today’s peak conditions—important but infrequent.
Figure 29 presents the year’s imbalance in the shape of a load duration curve, one for daylight
hours, and one for dark hours. Predictably, there is much more surplus during daylight.
Figure 29. Imbalance Duration Curve by Daylight and Dark.
Im
bala
nce (M
W)
Imb
ala
nce (M
W)
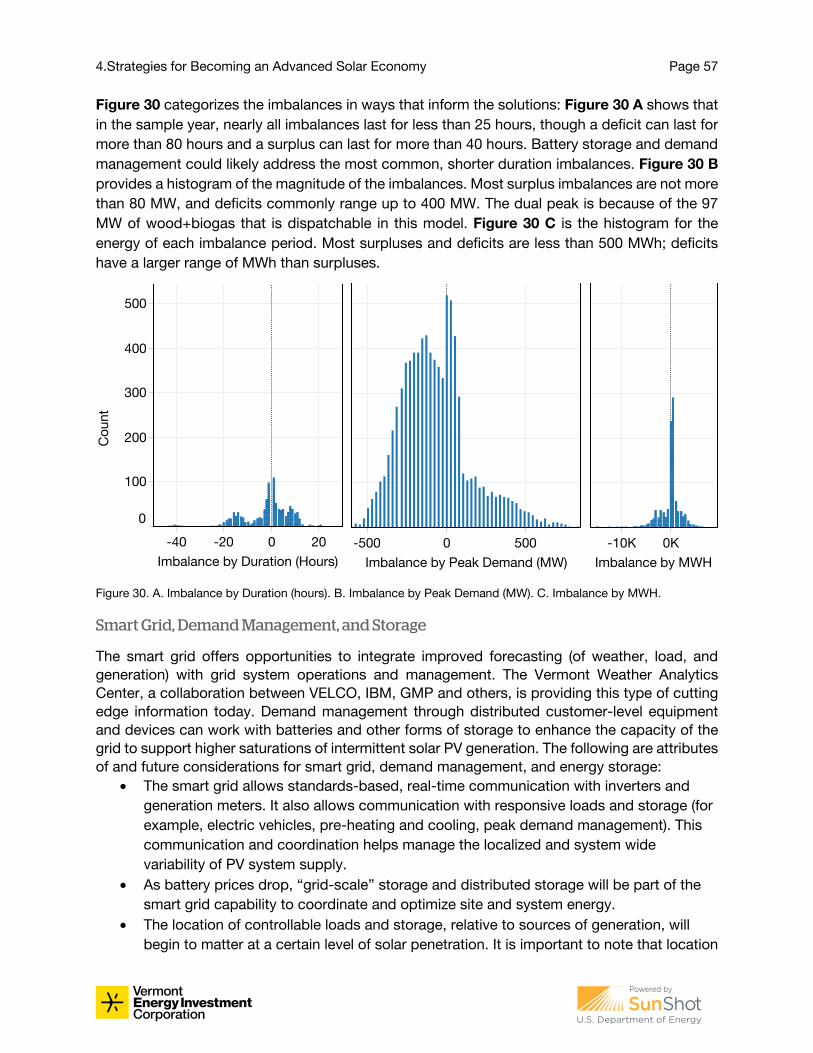
4.Strategies for Becoming an Advanced Solar Economy Page 57
Figure 30 categorizes the imbalances in ways that inform the solutions: Figure 30 A shows that
in the sample year, nearly all imbalances last for less than 25 hours, though a deficit can last for
more than 80 hours and a surplus can last for more than 40 hours. Battery storage and demand
management could likely address the most common, shorter duration imbalances. Figure 30 B
provides a histogram of the magnitude of the imbalances. Most surplus imbalances are not more
than 80 MW, and deficits commonly range up to 400 MW. The dual peak is because of the 97
MW of wood+biogas that is dispatchable in this model. Figure 30 C is the histogram for the
energy of each imbalance period. Most surpluses and deficits are less than 500 MWh; deficits
have a larger range of MWh than surpluses.
Figure 30. A. Imbalance by Duration (hours). B. Imbalance by Peak Demand (MW). C. Imbalance by MWH.
Smart Grid, Demand Management, and Storage
The smart grid offers opportunities to integrate improved forecasting (of weather, load, and
generation) with grid system operations and management. The Vermont Weather Analytics
Center, a collaboration between VELCO, IBM, GMP and others, is providing this type of cutting
edge information today. Demand management through distributed customer-level equipment
and devices can work with batteries and other forms of storage to enhance the capacity of the
grid to support higher saturations of intermittent solar PV generation. The following are attributes
of and future considerations for smart grid, demand management, and energy storage:
• The smart grid allows standards-based, real-time communication with inverters and
generation meters. It also allows communication with responsive loads and storage (for
example, electric vehicles, pre-heating and cooling, peak demand management). This
communication and coordination helps manage the localized and system wide
variability of PV system supply.
• As battery prices drop, “grid-scale” storage and distributed storage will be part of the
smart grid capability to coordinate and optimize site and system energy.
• The location of controllable loads and storage, relative to sources of generation, will
begin to matter at a certain level of solar penetration. It is important to note that location
-40 -20 0 20
Imbalance by Duration (Hours)
0
100
200
300
400
500
-500 0 500
Imbalance by Peak Demand (MW)
-10K 0K
Imbalance by MWH
Co
unt
Vermont Solar Market Pathways / Volume 1: Summary Report Page 58
will not be a primary concern for grid balancing, at first. However, the value of storage
and demand response will vary by location, even in the relatively early stages. It is likely
the variation in locational value will increase as saturations increase, overall.
• Providing sufficient system status, control, and forecast networks to distributed
generation, controllable load, and storage will be challenging and must address
concerns with cybersecurity and privacy protection.
• New rates models and interconnection rules and processes will likely be needed to fully
realize the public and private cost savings potential of smart grid and energy storage.
New utility regulatory paradigms which incentivize on-peak renewable generation and
investments in non-traditional resources needed to decarbonize the grid may further
bolster cost savings. Ensuing that utilities can recover the related investments in IT is
also important.
• Smart grid, demand management, and storage can collectively provide insight into
costs by location and time of use, to reflect the true cost and value of solar generation.
Business Models
The following two sections present several options for how business models and regulatory
oversight can evolve in ways that are consistent with and supportive of an advanced solar
economy. These are examples and are not meant to be prescriptive, or as predictions of the
business and regulatory models that will necessarily emerge. The business models and
regulatory structures associated with the actual development of Vermont’s advanced solar
economy will by necessity be informed and influenced by new market conditions and the process
of public and stakeholder engagement, negotiation, and review.
Solar business models. The scenario analyses indicate that a mix of business approaches to
solar projects will be required to accomplish the Solar Development Pathways target.
Individually and third-party-owned rooftop and ground-mounted systems will provide
consumers with the opportunity to host or own solar generation on their properties. In the SDPα
scenario, the share of solar expected to be located on site, in ground, and / or as rooftop systems
is roughly 300 MW, by 2025.
Vermont’s virtual net metering regulations enable community solar, one of the more rapidly
evolving markets. Community solar allows a single system to provide credits for solar generation
to virtually net-metered groups of customers who reside in the same utility service territory.
Innovation, research, and market testing for community solar business models, including those
offered by third parties and those offered directly by utilities, are under way in Vermont. This is
also true of other parts of the country. Several of the other national Solar Market Pathways
projects have community solar as integral components to their awards (the Solar Market
Pathways projects addressing community solar are the Solar Electric Power Association, Cook
County, the Center for Sustainable Energy, and Extensible Energy). Further, a community solar
4.Strategies for Becoming an Advanced Solar Economy Page 59
affinity group has been established to share information.57 The U.S. Department of Energy has
also launched a national community solar partnership with a specific emphasis on serving
moderate- and low-income households. The White House announced this initiative on July 7,
2015.58 In the SDPα scenario, the share of solar expected to be allocated to community solar is
roughly 300 MW by 2025, with the majority of this being ground mounted.
The rooftop and community solar installations are based on principles of both direct and virtual
net metering, and therefore offset consumption at retail electric rates. Projects that have direct
power purchase agreements with utilities are also expected to play an important role in the
growing market. Under Vermont’s Standard Offer Program, projects of up to 2.2 MW are eligible
for long-term contracts. Once online, these projects are made publicly available on the Vermont
Standard Offer website.59 Another option for larger projects is to apply for long-term contracts
under Rule 4.100, Vermont’s Small Power Production and Cogeneration structure for
implementing the federal Public Utility Regulatory Policies Act (PURPA). Recently, the Vermont
Public Service Board and VELCO received applications for several projects that are much larger
(20 MW each) than what has currently been built in Vermont.60 The process for review and
interconnection of projects at this scale is not yet clear, but it indicates how evolving market
strategies and business models will likely influence the technical and regulatory issues, and vice
versa.
Complementary DER business models. Several distributed energy resources will enable, help
to drive, and be driven by increasing solar saturation. The primary resources are storage
(customer on-site, and storage located on the utility distribution system); electric vehicles with
smart charging and vehicle-to-grid enabled capacities; controllable customer loads such as heat
pumps, hot water heaters; and high-performance zero energy buildings, including high-
performance modular housing. This project explicitly recognizes the importance of these markets
and technologies through its Focus Area working groups. The project scenarios are examining
the potential scale of development and potential barriers to progress in each.
Research conducted in Europe for the Power Perspective 2030 study illustrates the importance
of integrating other DERs as part of the advanced solar scenarios.61 These findings indicate that
a shift of 10 percent of aggregate demand in a day results in a 20 percent reduction of investment
required in the supply side infrastructure over a 15- to 20-year horizon.62
57 “Solar Market Pathways,” Department of Energy: Office of Energy Efficiency & Renewable Energy, accessed
September 22, 2016, http://energy.gov/eere/sunshot/solar-market-pathways. 58 “National Community Solar Partnership,” Department of Energy, accessed September 22, 2016,
http://energy.gov/eere/solarpoweringamerica/national-community-solar-partnership. 59 Vermont Electric Power Producers, Inc., “SPEED Solar Online Projects - Comparison DC/AC” (Vermont Standard
Offer, April 24, 2015), http://static1.1.sqspcdn.com/static/f/424754/26167074/1429817055967/SOLAR+AC-
DC+ON+LINE+PROJECTS+4-24-15.pdf?token=1Yt%2FAygme2kIyXP2dW2SjliFs2M%3D. 60 Erin Mansfield, “State Concerned about Proposal for Giant Solar Project,” VTDigger, September 8, 2015,
http://vtdigger.org/2015/09/08/state-concerned-about-proposal-for-giant-solar-project/. 61 Christian Hewicker, Michael Hogan, and Arne Mogren, “Power Perspectives 2030: On the Road to a
Decarbonised Power Sector,” accessed September 22, 2016, http://www.roadmap2050.eu/reports. 62 Ibid.
Vermont Solar Market Pathways / Volume 1: Summary Report Page 60
The distributed and networked attributes of the technologies contributing to an advanced solar
economy increase the need and opportunities for aggregation of energy services. Community
solar is one example. Another is aggregation of electric vehicles for coordinating charging or
vehicle-to-grid services. The scale of service and value from an individual vehicle or other DER,
such as an electric water heater, is not large enough to justify individuals’ participating in a
market. However, through aggregation, the coordination and value from a larger number of
devices can be captured. Innovative approaches to aggregation can be combined. For example,
through the coordination and aggregation of electric water heaters, a community solar power
project in West Virginia was able to generate revenues sufficient to fund the investment required
for installation of a community solar array on roof of the local church.63
Addressing Low-Income People: A Societal Imperative
A 2014 analysis by the Vermont Law School has sharpened statewide awareness of high-energy
burdens on low-income households in Vermont.64 The study found that those who spend more
than 10 percent of their monthly income on energy services are considered “fuel poor.” Further:
• One in five Vermonters lives in fuel poverty.
• People who lack sufficient energy to keep warm in winter face a higher-than-average risk
of stroke, heart attack, influenza, pneumonia, asthma, arthritis, depression, anxiety, and
accidents in the home.
• Between 1999 and 2011, Vermont averaged 172 excess winter mortalities per year.
• Annual excess winter deaths caused largely by fuel poverty account for more Vermont
deaths than do car crashes.
It is a tenet of energy efficiency and renewable energy advocates that reducing the energy
burden for people at risk strengthens economies. This message has relevance for the Vermont
Solar Market Pathways stakeholders.
Of particular importance will be explicit goals for reducing the energy burden (the total costs for
energy services as a percent of household incomes) for low- and moderate-income households.
63 “Shepherdstown Presbyterian Church,” Solar Holler, Inc., accessed September 22, 2016,
http://www.solarholler.com/shepherdstown-presbyterian-church/. 64 Teller-Elsberg, Jonathan et al., “Energy Costs and Burdens in Vermont: Burdensome for Whom? A Report for the
Vermont Low Income Trust for Electricity, Inc.” (South Royalton, VT: Institute for Energy and the Environment at
Vermont Law School, December 2014), http://www-
assets.vermontlaw.edu/Assets/iee/VLS%20IEE%20Energy%20Burden%20Report.pdf.
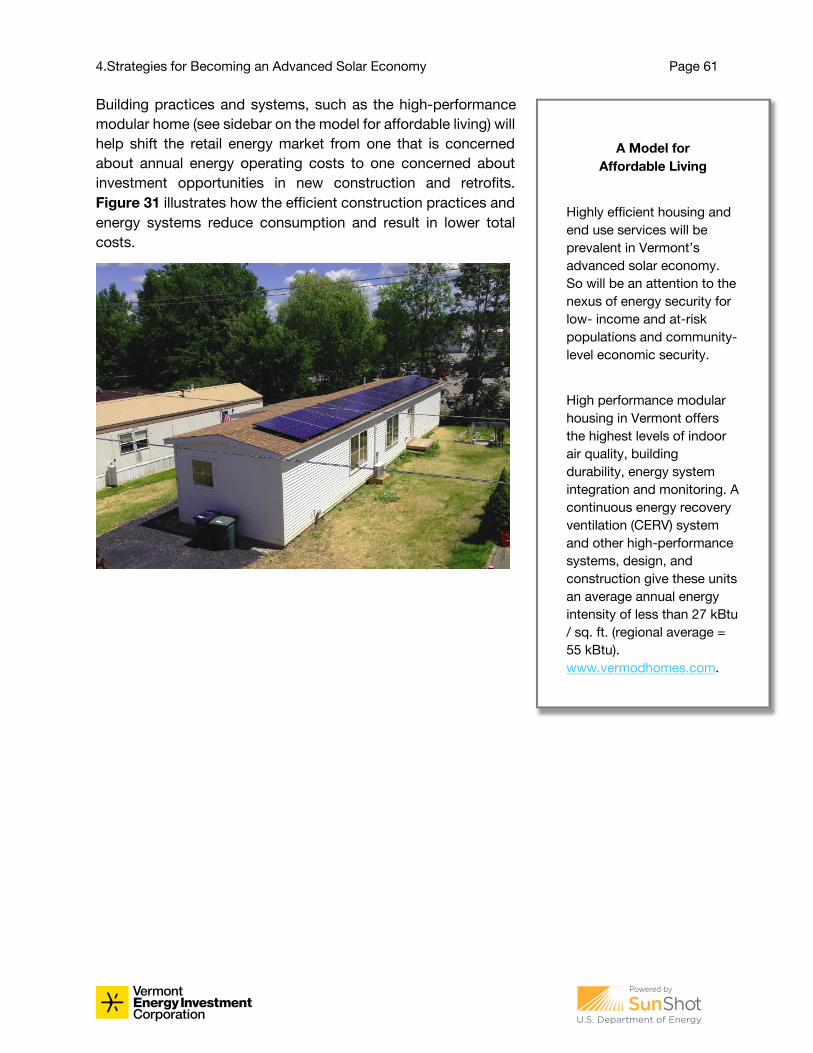
4.Strategies for Becoming an Advanced Solar Economy Page 61
Building practices and systems, such as the high-performance
modular home (see sidebar on the model for affordable living) will
help shift the retail energy market from one that is concerned
about annual energy operating costs to one concerned about
investment opportunities in new construction and retrofits.
Figure 31 illustrates how the efficient construction practices and
energy systems reduce consumption and result in lower total
costs.
A Model for
Affordable Living
Highly efficient housing and
end use services will be
prevalent in Vermont’s
advanced solar economy.
So will be an attention to the
nexus of energy security for
low- income and at-risk
populations and community-
level economic security.
High performance modular
housing in Vermont offers
the highest levels of indoor
air quality, building
durability, energy system
integration and monitoring. A
continuous energy recovery
ventilation (CERV) system
and other high-performance
systems, design, and
construction give these units
an average annual energy
intensity of less than 27 kBtu
/ sq. ft. (regional average =
55 kBtu).
www.vermodhomes.com.
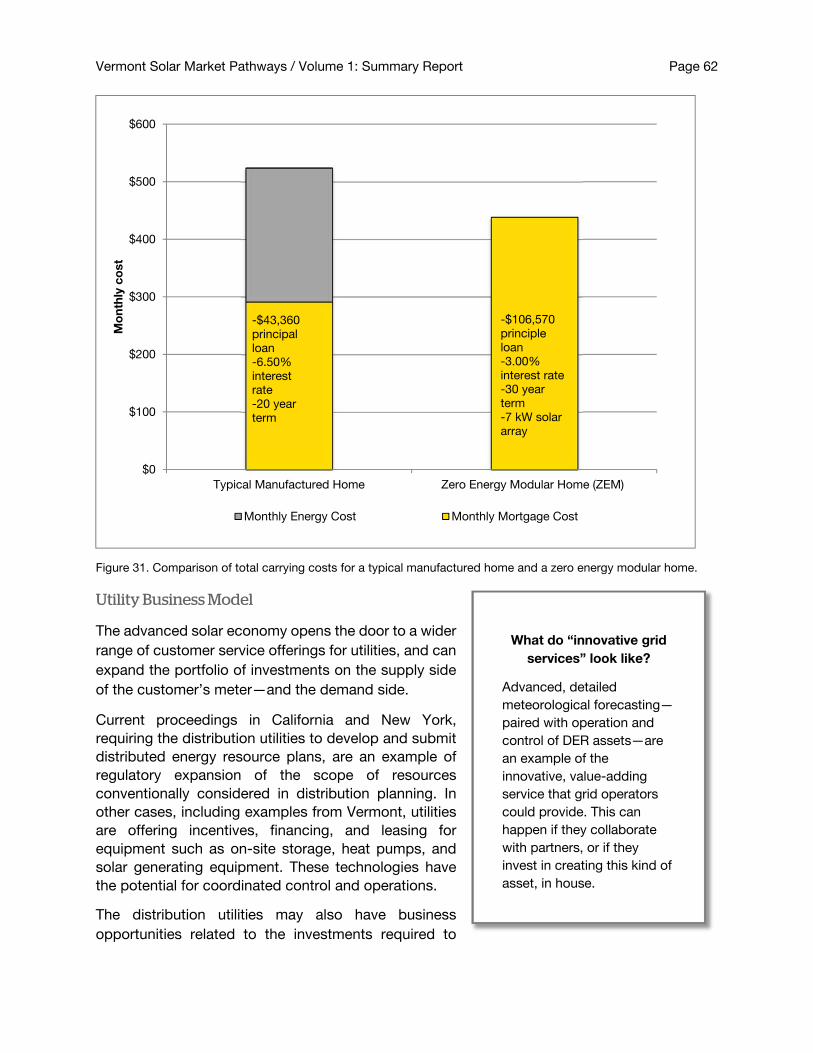
Vermont Solar Market Pathways / Volume 1: Summary Report Page 62
Figure 31. Comparison of total carrying costs for a typical manufactured home and a zero energy modular home.
Utility Business Model
The advanced solar economy opens the door to a wider
range of customer service offerings for utilities, and can
expand the portfolio of investments on the supply side
of the customer’s meter—and the demand side.
Current proceedings in California and New York,
requiring the distribution utilities to develop and submit
distributed energy resource plans, are an example of
regulatory expansion of the scope of resources
conventionally considered in distribution planning. In
other cases, including examples from Vermont, utilities
are offering incentives, financing, and leasing for
equipment such as on-site storage, heat pumps, and
solar generating equipment. These technologies have
the potential for coordinated control and operations.
The distribution utilities may also have business
opportunities related to the investments required to
$0
$100
$200
$300
$400
$500
$600
Typical Manufactured Home Zero Energy Modular Home (ZEM)
Mo
nth
ly c
ost
Monthly Energy Cost Monthly Mortgage Cost
-$106,570
principle
loan
-3.00%
interest rate
-30 year
term
-7 kW solar
array
-$43,360
principal
loan
-6.50%
interest
rate
-20 year
term
What do “innovative grid
services” look like?
Advanced, detailed
meteorological forecasting—
paired with operation and
control of DER assets—are
an example of the
innovative, value-adding
service that grid operators
could provide. This can
happen if they collaborate
with partners, or if they
invest in creating this kind of
asset, in house.
4.Strategies for Becoming an Advanced Solar Economy Page 63
support higher levels of saturation on the distribution system, whether these entail upgrades to
distribution operation, communication, and control schemes—or direct investment in solar
generation that is strategically sited on the distribution network.
The procurement of solar and other DERs and their inclusion in a utility’s portfolio will affect the
requirements for the balance of the portfolio. For example, they might require other power supply
contracts to provide a higher level of flexibility.
Integrating and controlling a large number of DERs and solar will require greater visibility,
communications, and control of resources. The required services might be provided by third
parties, or directly by distribution and transmission system operators. A study conducted for the
California grid operator, CAISO, estimated that the benefits from enhanced visibility and control
of DERs far exceed the costs associated with the required costs for the communications and
other required infrastructure.65 Though dated and for a different market, this study might provide
a first estimate of what Vermont may see with higher renewable saturation.
4.2 Regulatory Considerations
In some ways, Vermont’s advanced solar economy will have a retail market structure that is
similar to what we know today. Consumers will still receive basic electric service from a regulated
utility under tariffs reviewed and approved by regulators. The tariffs will cover the costs of
providing reliable grid service and commodity electricity. The service provided to the retail
consumer will progressively reflect economic and environmental policy objectives by increasing
the share of renewable resources in the electricity mix.
The mix of ownership of DER assets will vary across time and will be likely to vary from territory
to territory, since the assets are tied to local conditions, priorities, and entrepreneurial assets.
This progression from more to less regulated DER ownership is seen in Figure 32.
65 KEMA, Inc., National Renewable Energy Laboratory, and Energy Exemplar, LLC, “Final Report for Assessment of
Visibility and Control Options for Distributed Energy Resources” (California Independent Systems Operator
Corporation, June 21, 2012), https://www.caiso.com/Documents/FinalReport-Assessment-Visibility-ControlOptions-
DistributedEnergyResources.pdf.
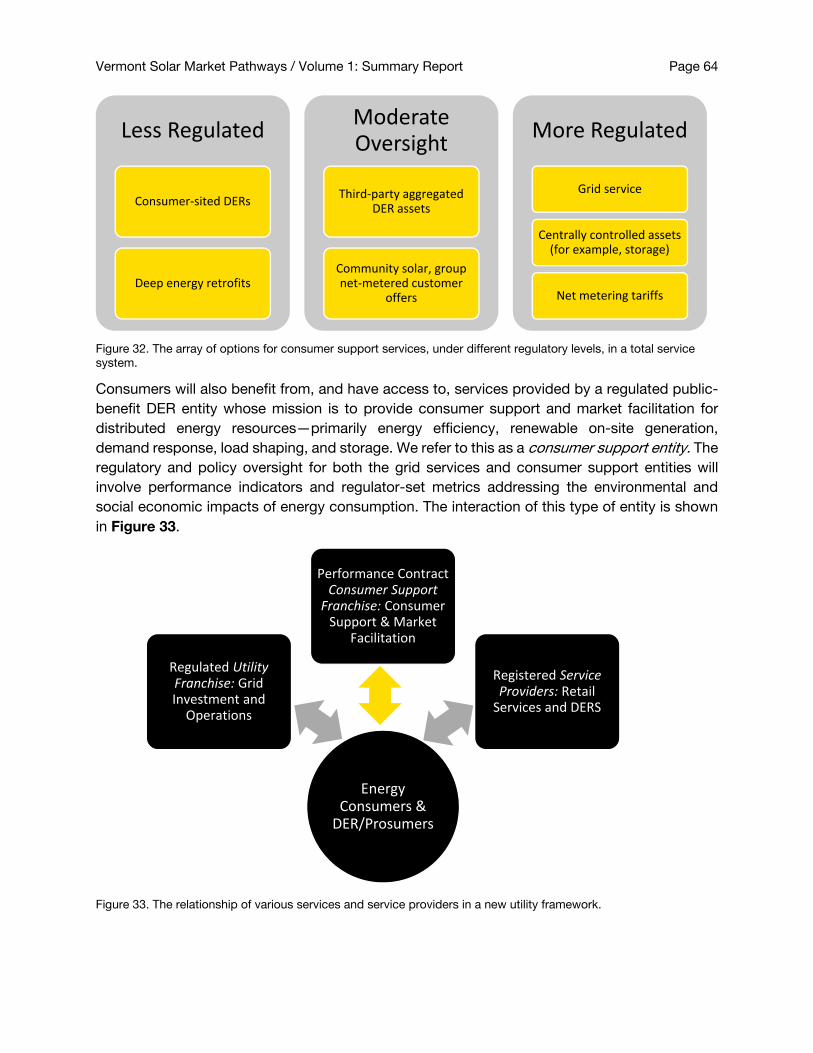
Vermont Solar Market Pathways / Volume 1: Summary Report Page 64
Figure 32. The array of options for consumer support services, under different regulatory levels, in a total service
system.
Consumers will also benefit from, and have access to, services provided by a regulated public-
benefit DER entity whose mission is to provide consumer support and market facilitation for
distributed energy resources—primarily energy efficiency, renewable on-site generation,
demand response, load shaping, and storage. We refer to this as a consumer support entity. The
regulatory and policy oversight for both the grid services and consumer support entities will
involve performance indicators and regulator-set metrics addressing the environmental and
social economic impacts of energy consumption. The interaction of this type of entity is shown
in Figure 33.
Figure 33. The relationship of various services and service providers in a new utility framework.
Less Regulated
Consumer-sited DERs
Deep energy retrofits
Moderate Oversight
Third-party aggregated DER assets
Community solar, group net-metered customer
offers
More Regulated
Grid service
Centrally controlled assets (for example, storage)
Net metering tariffs
Energy Consumers &
DER/Prosumers
Regulated Utility Franchise: Grid Investment and
Operations
Performance Contract Consumer Support
Franchise: Consumer Support & Market
Facilitation
Registered Service Providers: Retail
Services and DERS
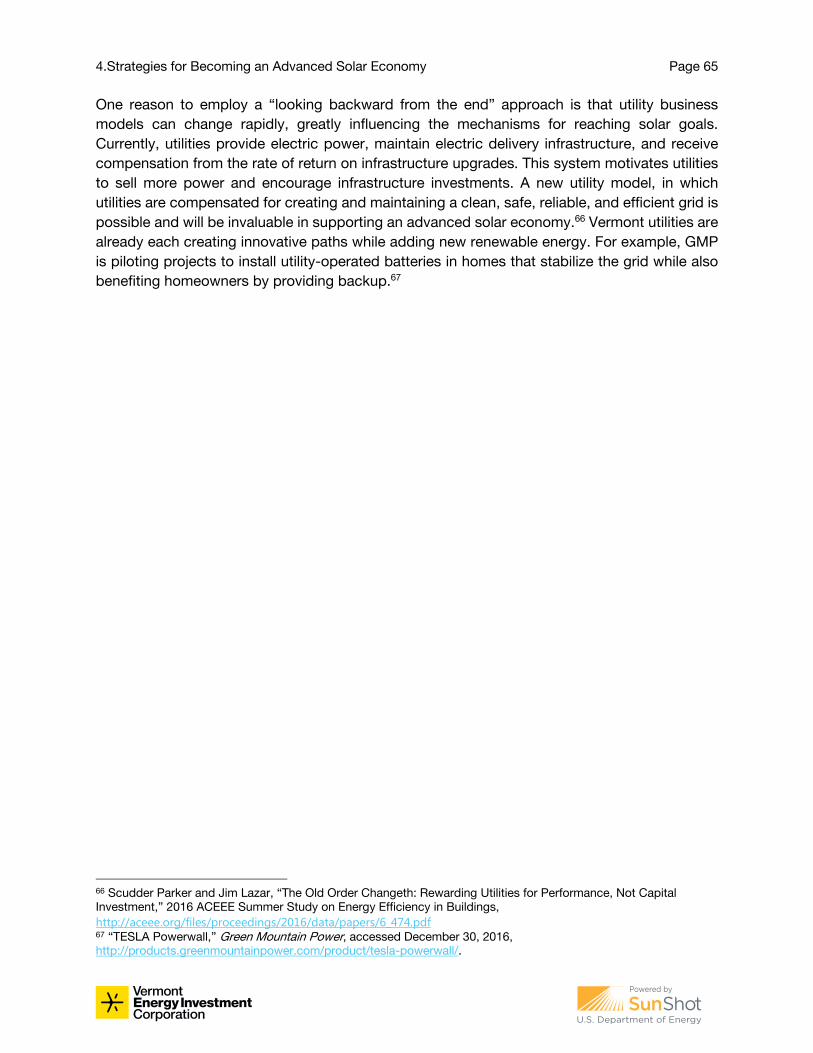
4.Strategies for Becoming an Advanced Solar Economy Page 65
One reason to employ a “looking backward from the end” approach is that utility business
models can change rapidly, greatly influencing the mechanisms for reaching solar goals.
Currently, utilities provide electric power, maintain electric delivery infrastructure, and receive
compensation from the rate of return on infrastructure upgrades. This system motivates utilities
to sell more power and encourage infrastructure investments. A new utility model, in which
utilities are compensated for creating and maintaining a clean, safe, reliable, and efficient grid is
possible and will be invaluable in supporting an advanced solar economy.66 Vermont utilities are
already each creating innovative paths while adding new renewable energy. For example, GMP
is piloting projects to install utility-operated batteries in homes that stabilize the grid while also
benefiting homeowners by providing backup.67
66 Scudder Parker and Jim Lazar, “The Old Order Changeth: Rewarding Utilities for Performance, Not Capital
Investment,” 2016 ACEEE Summer Study on Energy Efficiency in Buildings,
http://aceee.org/files/proceedings/2016/data/papers/6_474.pdf 67 “TESLA Powerwall,” Green Mountain Power, accessed December 30, 2016,
http://products.greenmountainpower.com/product/tesla-powerwall/.

Looking Forward
The most important conclusion of this study is that solar can provide 20 percent of Vermont’s
electricity by 2025, and can do so with costs that are less than 1 percent of total annual energy
expenditures. Over the longer term, through 2050, the study analyses suggest net economic
benefits from investing in Vermont’s advanced solar economy are in the billions of dollars.
The Team and stakeholders have considered the most commonly cited limitations of solar—
primarily cost, space requirements, and intermittency. They concluded it is possible and
profitable to overcome those limits and move toward a future in which more of Vermont’s energy
comes from its own renewable sources, owned by Vermonters. In addition to cleaner air and
billions of dollars a year stopped from leaving the state, there are co-benefits from enhanced
affordability, occupant health, and building durability and resilience.
The study also highlights that more than one way to reach the end state exists and that further
political, regulatory, and business planning work are all necessary. In places throughout this
Summary Report, we have offered possible visions of business models and / or regulatory
structures to help catalyze and advance the conversation.
Some elements are not in place, and some that are in place will evolve or disappear.
There will be changes not included in any of the analyses that will have important implications.
Nevertheless, there is a strong likelihood of economic and environmental benefits from a
consumer-oriented, modernized system that reaches or surpasses the elements of Vermont’s
becoming an advanced solar economy.
Although there are many possible paths to a sustainable energy future, a continued reliance on
imported fossil fuels supports destructive climate change, social inequality, and a continuous
drain on the Vermont economy. Vermont has the opportunity to continue its longstanding
environmental leadership and to demonstrate success in high-penetration solar and a transition
to renewable total energy. The state can do this, while strengthening its economy.
The foundation is set; the work and the opportunity are just beginning.

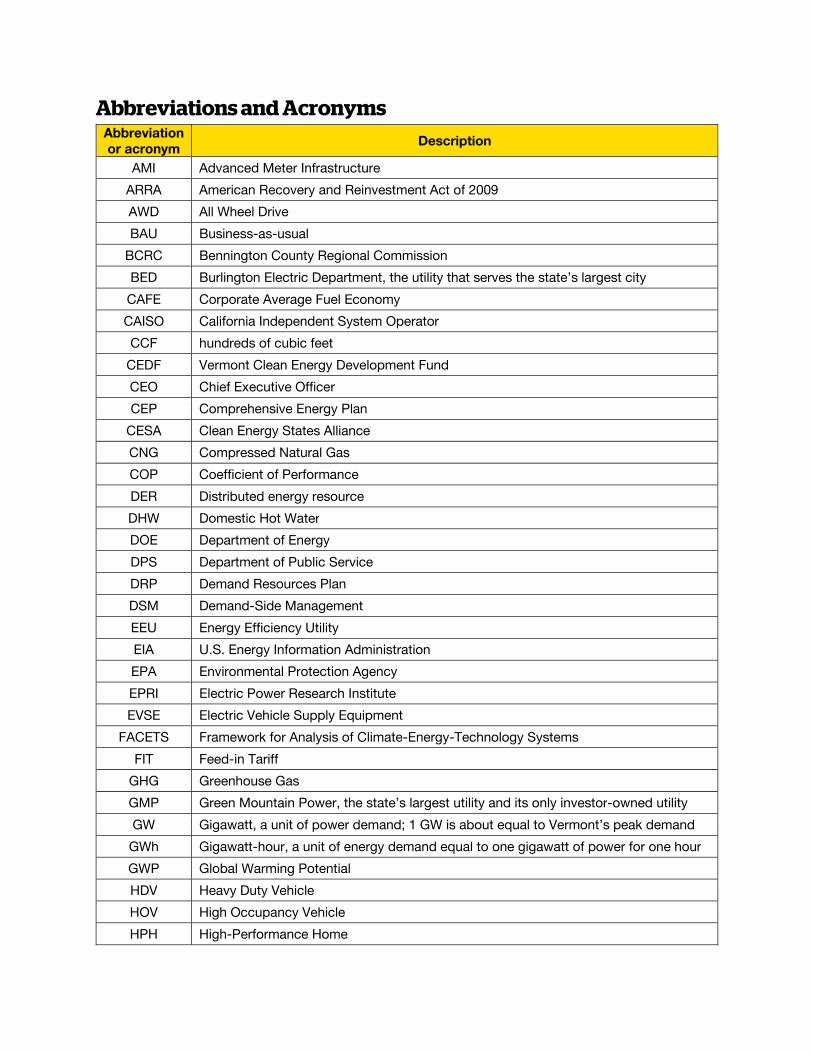
Abbreviations and Acronyms Abbreviation
or acronym Description
AMI Advanced Meter Infrastructure
ARRA American Recovery and Reinvestment Act of 2009
AWD All Wheel Drive
BAU Business-as-usual
BCRC Bennington County Regional Commission
BED Burlington Electric Department, the utility that serves the state’s largest city
CAFE Corporate Average Fuel Economy
CAISO California Independent System Operator
CCF hundreds of cubic feet
CEDF Vermont Clean Energy Development Fund
CEO Chief Executive Officer
CEP Comprehensive Energy Plan
CESA Clean Energy States Alliance
CNG Compressed Natural Gas
COP Coefficient of Performance
DER Distributed energy resource
DHW Domestic Hot Water
DOE Department of Energy
DPS Department of Public Service
DRP Demand Resources Plan
DSM Demand-Side Management
EEU Energy Efficiency Utility
EIA U.S. Energy Information Administration
EPA Environmental Protection Agency
EPRI Electric Power Research Institute
EVSE Electric Vehicle Supply Equipment
FACETS Framework for Analysis of Climate-Energy-Technology Systems
FIT Feed-in Tariff
GHG Greenhouse Gas
GMP Green Mountain Power, the state’s largest utility and its only investor-owned utility
GW Gigawatt, a unit of power demand; 1 GW is about equal to Vermont’s peak demand
GWh Gigawatt-hour, a unit of energy demand equal to one gigawatt of power for one hour
GWP Global Warming Potential
HDV Heavy Duty Vehicle
HOV High Occupancy Vehicle
HPH High-Performance Home
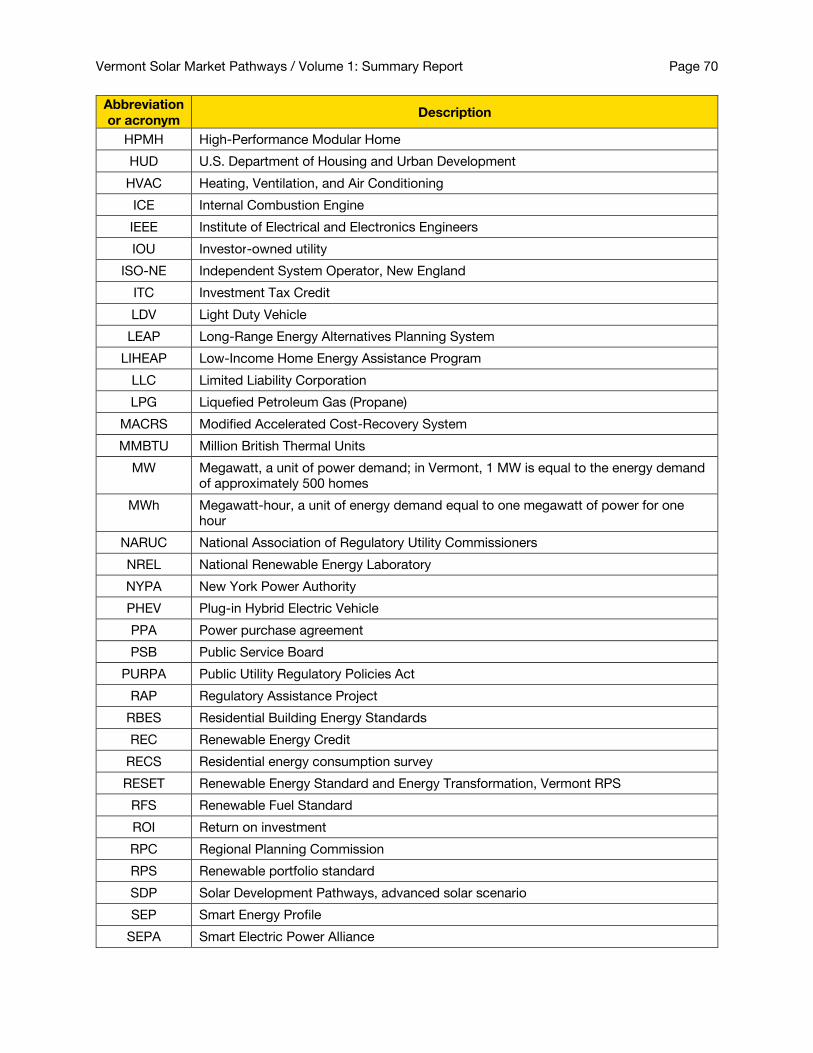
Vermont Solar Market Pathways / Volume 1: Summary Report Page 70
Abbreviation
or acronym Description
HPMH High-Performance Modular Home
HUD U.S. Department of Housing and Urban Development
HVAC Heating, Ventilation, and Air Conditioning
ICE Internal Combustion Engine
IEEE Institute of Electrical and Electronics Engineers
IOU Investor-owned utility
ISO-NE Independent System Operator, New England
ITC Investment Tax Credit
LDV Light Duty Vehicle
LEAP Long-Range Energy Alternatives Planning System
LIHEAP Low-Income Home Energy Assistance Program
LLC Limited Liability Corporation
LPG Liquefied Petroleum Gas (Propane)
MACRS Modified Accelerated Cost-Recovery System
MMBTU Million British Thermal Units
MW Megawatt, a unit of power demand; in Vermont, 1 MW is equal to the energy demand
of approximately 500 homes
MWh Megawatt-hour, a unit of energy demand equal to one megawatt of power for one
hour
NARUC National Association of Regulatory Utility Commissioners
NREL National Renewable Energy Laboratory
NYPA New York Power Authority
PHEV Plug-in Hybrid Electric Vehicle
PPA Power purchase agreement
PSB Public Service Board
PURPA Public Utility Regulatory Policies Act
RAP Regulatory Assistance Project
RBES Residential Building Energy Standards
REC Renewable Energy Credit
RECS Residential energy consumption survey
RESET Renewable Energy Standard and Energy Transformation, Vermont RPS
RFS Renewable Fuel Standard
ROI Return on investment
RPC Regional Planning Commission
RPS Renewable portfolio standard
SDP Solar Development Pathways, advanced solar scenario
SEP Smart Energy Profile
SEPA Smart Electric Power Alliance
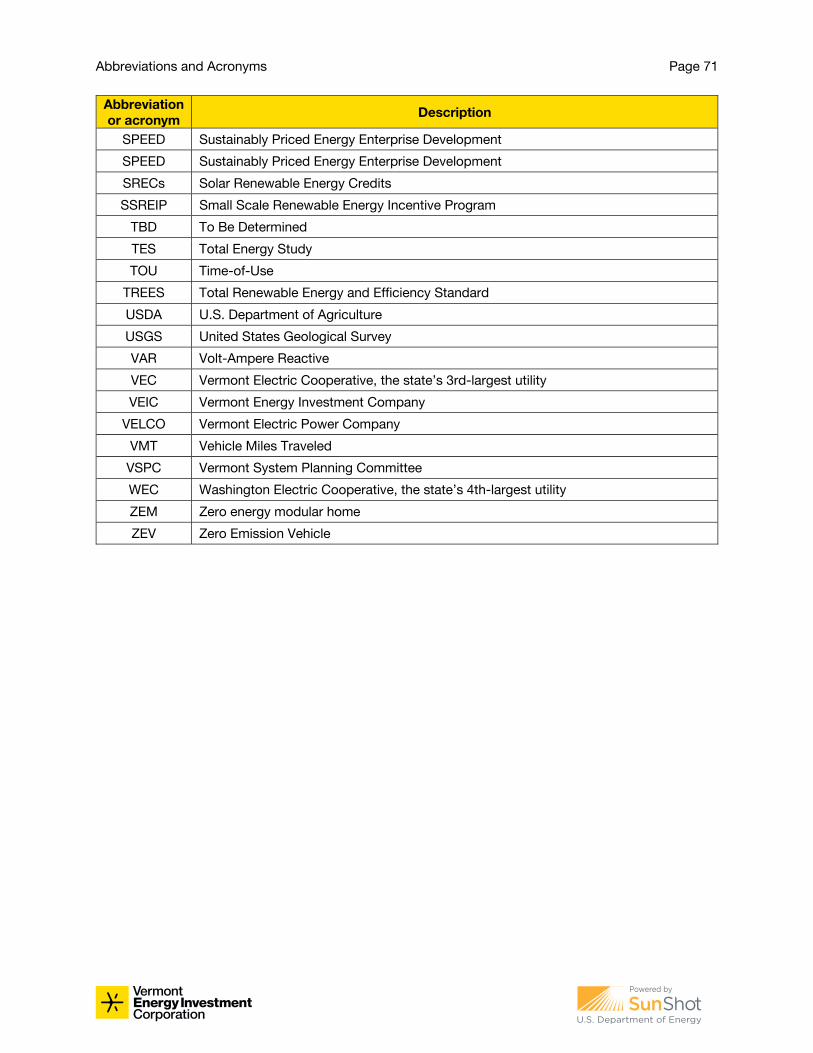
Abbreviations and Acronyms Page 71
Abbreviation
or acronym Description
SPEED Sustainably Priced Energy Enterprise Development
SPEED Sustainably Priced Energy Enterprise Development
SRECs Solar Renewable Energy Credits
SSREIP Small Scale Renewable Energy Incentive Program
TBD To Be Determined
TES Total Energy Study
TOU Time-of-Use
TREES Total Renewable Energy and Efficiency Standard
USDA U.S. Department of Agriculture
USGS United States Geological Survey
VAR Volt-Ampere Reactive
VEC Vermont Electric Cooperative, the state’s 3rd-largest utility
VEIC Vermont Energy Investment Company
VELCO Vermont Electric Power Company
VMT Vehicle Miles Traveled
VSPC Vermont System Planning Committee
WEC Washington Electric Cooperative, the state’s 4th-largest utility
ZEM Zero energy modular home
ZEV Zero Emission Vehicle

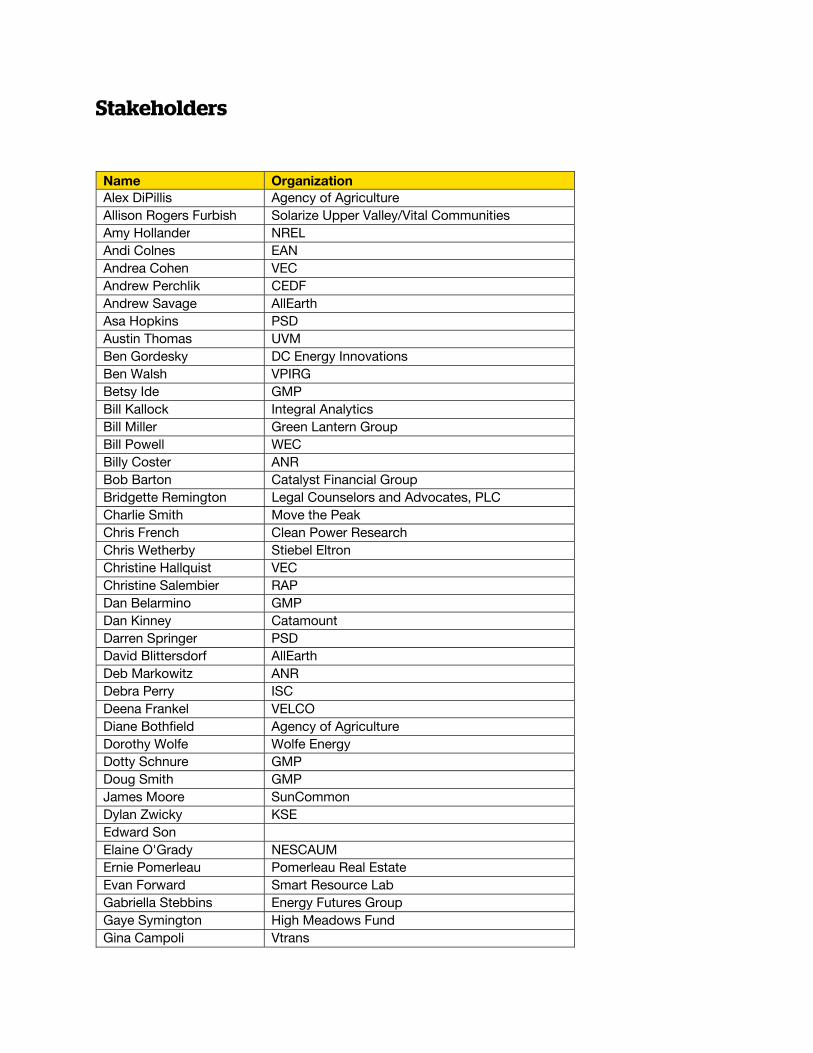
Stakeholders
Name Organization
Alex DiPillis Agency of Agriculture
Allison Rogers Furbish Solarize Upper Valley/Vital Communities
Amy Hollander NREL
Andi Colnes EAN
Andrea Cohen VEC
Andrew Perchlik CEDF
Andrew Savage AllEarth
Asa Hopkins PSD
Austin Thomas UVM
Ben Gordesky DC Energy Innovations
Ben Walsh VPIRG
Betsy Ide GMP
Bill Kallock Integral Analytics
Bill Miller Green Lantern Group
Bill Powell WEC
Billy Coster ANR
Bob Barton Catalyst Financial Group
Bridgette Remington Legal Counselors and Advocates, PLC
Charlie Smith Move the Peak
Chris French Clean Power Research
Chris Wetherby Stiebel Eltron
Christine Hallquist VEC
Christine Salembier RAP
Dan Belarmino GMP
Dan Kinney Catamount
Darren Springer PSD
David Blittersdorf AllEarth
Deb Markowitz ANR
Debra Perry ISC
Deena Frankel VELCO
Diane Bothfield Agency of Agriculture
Dorothy Wolfe Wolfe Energy
Dotty Schnure GMP
Doug Smith GMP
James Moore SunCommon
Dylan Zwicky KSE
Edward Son
Elaine O'Grady NESCAUM
Ernie Pomerleau Pomerleau Real Estate
Evan Forward Smart Resource Lab
Gabriella Stebbins Energy Futures Group
Gaye Symington High Meadows Fund
Gina Campoli Vtrans
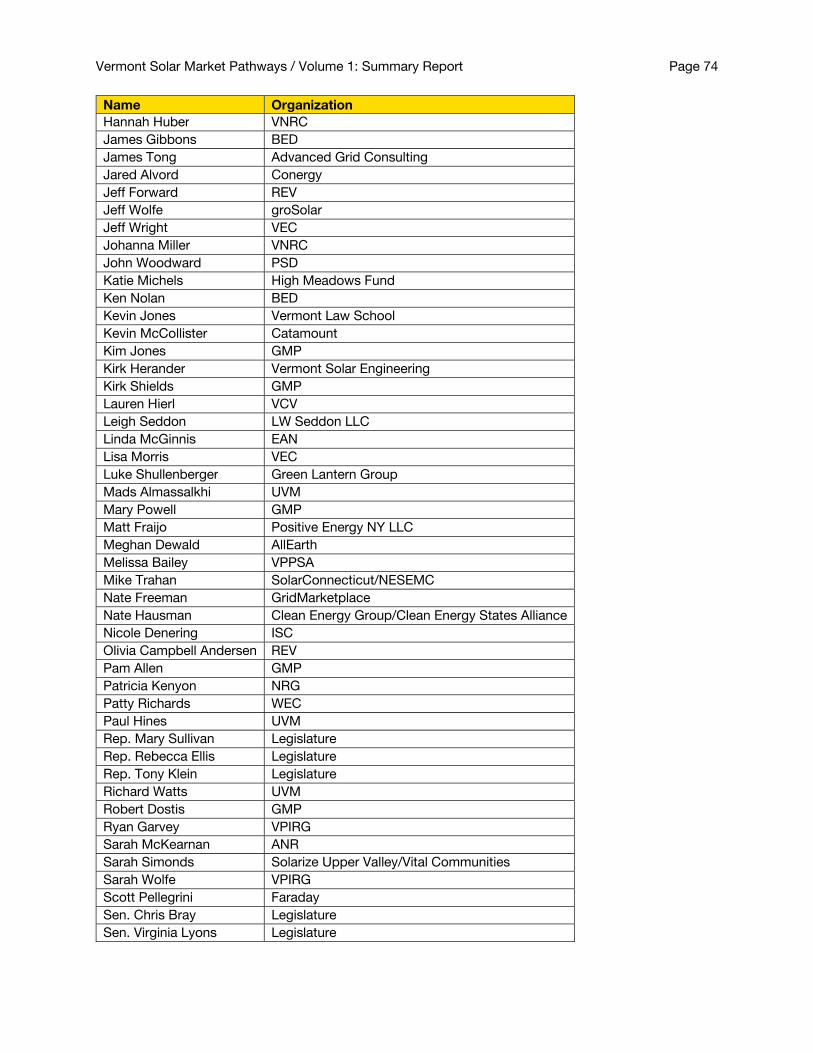
Vermont Solar Market Pathways / Volume 1: Summary Report Page 74
Name Organization
Hannah Huber VNRC
James Gibbons BED
James Tong Advanced Grid Consulting
Jared Alvord Conergy
Jeff Forward REV
Jeff Wolfe groSolar
Jeff Wright VEC
Johanna Miller VNRC
John Woodward PSD
Katie Michels High Meadows Fund
Ken Nolan BED
Kevin Jones Vermont Law School
Kevin McCollister Catamount
Kim Jones GMP
Kirk Herander Vermont Solar Engineering
Kirk Shields GMP
Lauren Hierl VCV
Leigh Seddon LW Seddon LLC
Linda McGinnis EAN
Lisa Morris VEC
Luke Shullenberger Green Lantern Group
Mads Almassalkhi UVM
Mary Powell GMP
Matt Fraijo Positive Energy NY LLC
Meghan Dewald AllEarth
Melissa Bailey VPPSA
Mike Trahan SolarConnecticut/NESEMC
Nate Freeman GridMarketplace
Nate Hausman Clean Energy Group/Clean Energy States Alliance
Nicole Denering ISC
Olivia Campbell Andersen REV
Pam Allen GMP
Patricia Kenyon NRG
Patty Richards WEC
Paul Hines UVM
Rep. Mary Sullivan Legislature
Rep. Rebecca Ellis Legislature
Rep. Tony Klein Legislature
Richard Watts UVM
Robert Dostis GMP
Ryan Garvey VPIRG
Sarah McKearnan ANR
Sarah Simonds Solarize Upper Valley/Vital Communities
Sarah Wolfe VPIRG
Scott Pellegrini Faraday
Sen. Chris Bray Legislature
Sen. Virginia Lyons Legislature
Stakeholders Page 75
Name Organization
Senowa Mize-Fox
Shawn Enterline GMP
Stephanie Smith Agency of Agriculture
Steve LeTendre Green Mountain College
Stu Fram High Meadows Fund
Theo Fetter
Kerrick Johnson VELCO
TJ Poor VPPSA
Tom Buckley BED
Tom Lyle BED
Will King AEDG
Will Smith REV
Recommended