Water Sector in Small Urban Centres
UN-HABITAT RepoRT oN THe WATeR ANd SANITATIoN IN SmAll URBAN CeNTReS: pApeR 3
Water Supply and Sanitation options for Small Urban
Centres in developing Countries
duncan mara
U N I T E D N A T I O N S H U M A N S E T T L E M E N T S P R O G R A M M E
ii
Background paper prepared for UN-HABITAT publication, Meeting Development Goals in Small Urban Centres: Water and Sanitation in the World’s Cities 2006.
Copyright © United Nations Human Settlements Programme (UN-HABITAT), December 2006
All rights reserved
United Nations Human Settlements Programme (UN-HABITAT)
P.O. Box 30030, GPO Nairobi 00100, Kenya
Tel: 254 20 7623 120
Fax: 254 20 7624 266/7 (Central Office)
E-mail: info @ unhabitat.org
Website: http://www.unhabitat.org
Disclaimer
The designations employed and the presentation of the material in this publication do not imply the expression of any opinion whatsoever on the part of the Secretariat of the United Nations concerning the legal status of any country, territory, city or area, or of its authorities, or concerning delimitation of its frontiers or boundaries, or regarding its economic system or degree of development. The analysis, conclusions and recommendations of this publication do not necessarily reflect the views of the United Nations Human Settlements Programme, the Governing Council of the United Nations Human Settle-ments Programme or its Member States.
UN-HABITAT RepoRT oN THe WATeR
SeCToR IN SmAll URBAN CeNTReS
iii
Table of Contents
1 Introduction 1 The size of the problem 1
Increasing global water stress and scarcity 1
2 Domestic Water Supply 3 Design water consumption 3
Water supply service levels 3
Condominial water supplies 4
Lessons for STLV 5
Water supply tariff structures 6
Aggregation 6
3 Sanitation 9 Available sanitation technologies 9
Comparative costs 9
Simplifiedsewerage 11
Costs 14
Adoptionofsimplifiedsewerageinvariouscountries 14
Application to STLV 15
National sewerage design codes 15
Settled sewerage 15
On-site systems 17
Communal sanitation facilities 18
Sanitation selection algirithm 18
4 Constraints 21
5. Recommendations 23
References 25

iv

1
1 Introduction
The size of the problem
To meet the water and sanitation Millennium Development Goals some 300,000 people have to be provided with improved water supplies and 440,000 with improved sanitation every day during the period 2001−2015. This daily target for water supply was exceeded during the International Drinking Water and Sanitation Decade (1981−1990) (~370,000 people served per day), but the target for sanita-tion is more than twice the number of people served during the 1980s and the 1990s (~200,000 and ~210,000 people per day, respectively). Achieving the sanitation MDG is thus much more of a problem than achieving the water supply MDG, although water supply nears to be geared up again to the level of the 1980s as significantly fewer people were supplied in the 1990s (~220,000 people per day). These figures are for ‘improved’ water supplies and sanitation (WHO and UNICEF, 2000, 2004); however, figures for ‘adequate’ water supplies and sanitation are much higher (UN-Habitat, 2003): in urban areas in 2000, 680−970 million were without adequate water supplies (vs 171 million without improved water supplies) and 850−1,130 million were without adequate sanitation (vs 394 million without improved sanitation). Whichever of these descriptors, ‘improved’ or ‘adequate’, is used, the numbers are very large for both water supplies and sanitation.
Unfortunately there are no published figures for the number of people in small towns and large villages (STLV) who require improved water supplies and improved sanitation. There are only overall figures for ‘urban’ and ‘rural’ areas. However, the numbers are likely to be large and most people in STLV can be assumed to be poor or very poor. They therefore require low-cost affordable solutions.
Increasing global water stress and scarcity
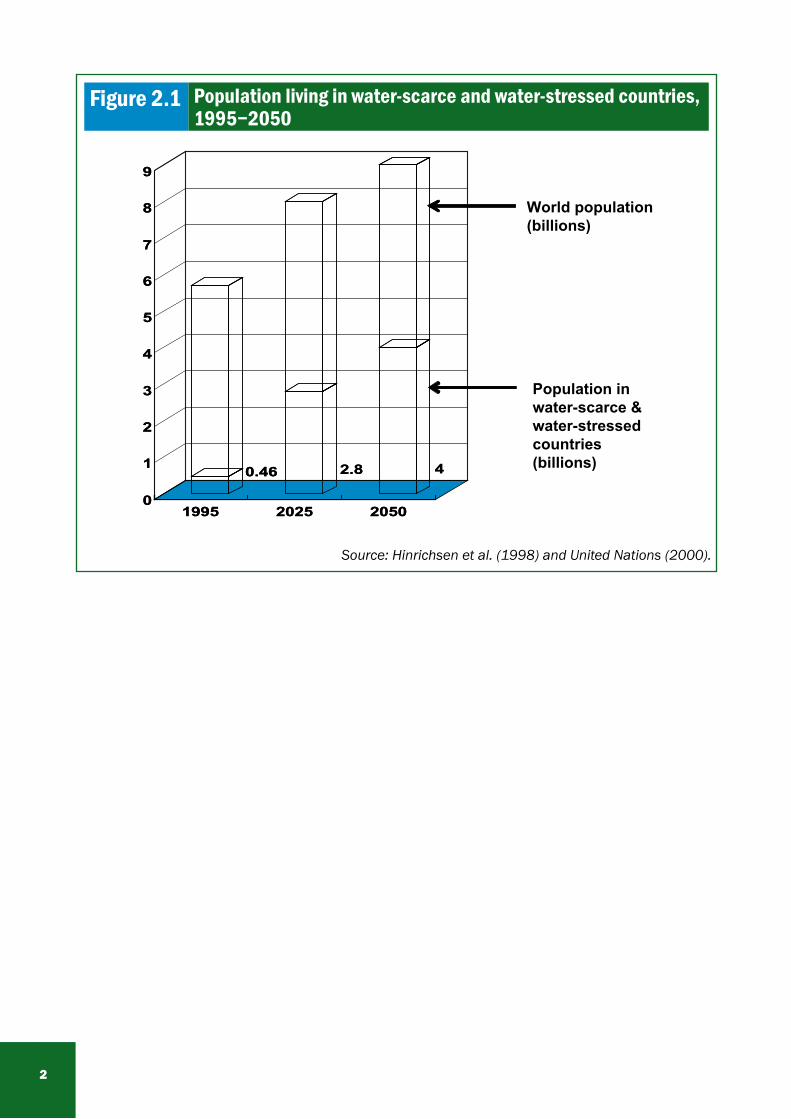
Not only are the numbers of those requiring better water supplies very large, water itself is becoming scarcer. The number of people living in water-stressed and water-scarce parts of the world is estimated to increase approximately six-fold from 1995 to 2025 to reach ~2.8 billions (or nearly a third of the world’s population) (Figure 2.1). This situation must be taken into account when planning and designing water supply improvements for STLV now, otherwise their long-term sustainability is likely to be low.
2
Figure 2.1 population living in water-scarce and water-stressed countries, 1995−2050
0.46 2.8 4
0
1
2
3
4
5
6
7
8
9
1995 2025 2050
0.46 2.8 4
0
1
2
3
4
5
6
7
8
9
1995 2025 2050
Population in water-scarce &water-stressedcountries (billions)
World population(billions)
Source: Hinrichsen et al. (1998) and United Nations (2000).
3
2 domestic Water Supplies
design water consumption
In order to minimize the transmission of waster-related diseases, in particular water-washed diseases, a water use (consumption) of around 25−30 litres per person per day (lpd) is generally thought to be nec-essary (Cairncross and Feachem, 1993; see also Novaic, 2002). Gleick (1996) recommends a design value of 50 lpd, provided flush toilets with a high volume per flush are not used (as may be expected in STLV). This value of 50 lpd seems perfectly reasonable, but hygiene education will be generally required so that the users can maximize the health benefits from the non-wasteful use of this quantity of water.
Water supply service levels
In general there are four levels of domestic water supply:
Unimproved water sources (for example, unprotected shallow wells, faecally contaminated surface waters),
Public standpipes (i.e., taps connected to the town/village piped supply),
Yard taps (i.e., one tap per household), and
Multiple-tap in-house supplies.
Level 1 does not provide access to an improved water supply and in most households in STLV Level 4 will never, at least in the foreseeable future, be a feasible solution. The realistic options in STLV are therefore Levels 2 and 3, although in some large villages it may be possible (and the cheapest option) to improve existing unimproved supplies as a short-term measure.
Level 2 can be subdivided into two ‘sublevels’, as follows:
2.i. Public standpipes, and
2.ii Standpipe cooperatives.
4
Level 2.i represents a usually free supply for very poor households, and Level 2.ii is a supply for a defined group of households (the ‘cooperative’) who share a single standpipe and pay for its use. Standpipe co-operatives have been used in the Philippines since the 1970s (Middleton, 2000) and they are recommended in India’s Tenth Five Year Plan 2002−2007 (Planning Commission, Government of India, 2002):
“…the number of stand-posts [i.e., standpipes] should be adequate for the population being served. There are successful examples of community supervision of the stand-posts. Community groups should be made responsible for maintenance and hygiene around stand-posts, for maintenance including prevention of wastage, and for collection of user charges from each household attached to the stand-post” [§6.2.50].
“Community-managed standpipes” are different from standpipe cooperatives as they are community-op-erated water kiosks where community members come to buy water by the bucket. Often there are too few kiosks in the community and the water is expensive when the cost is expressed per m3 (however, good practice does exist: two case studies, in Port-au-Prince, Haiti and Dakar, Senegal, are described by Colin and Lockwood, 2002). Standpipes serving standpipes cooperatives, on the other hand, essen-tially belong to the cooperative members. The main planning task is to determine with the communities what is locally considered the maximum number of households in a cooperative; this may be 5−25, for example, but the precise number may be influenced by the water tariff structure (see below).
Condominial water supplies
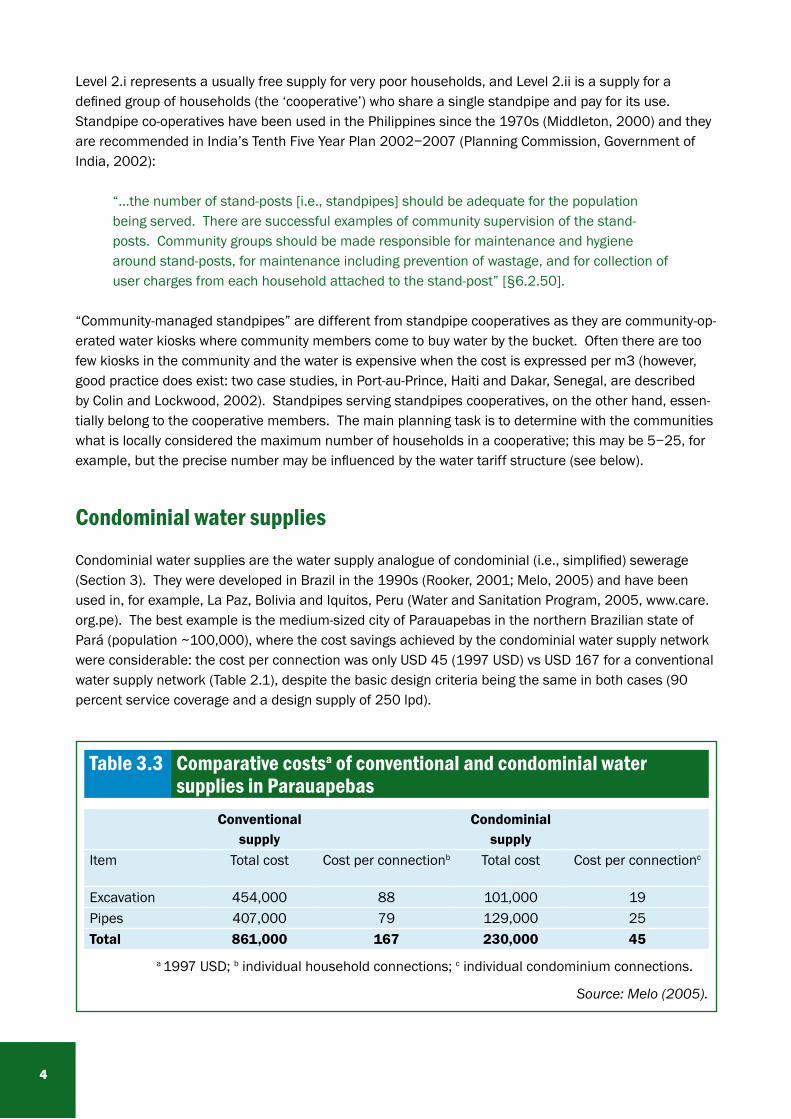
Condominial water supplies are the water supply analogue of condominial (i.e., simplified) sewerage (Section 3). They were developed in Brazil in the 1990s (Rooker, 2001; Melo, 2005) and have been used in, for example, La Paz, Bolivia and Iquitos, Peru (Water and Sanitation Program, 2005, www.care.org.pe). The best example is the medium-sized city of Parauapebas in the northern Brazilian state of Pará (population ~100,000), where the cost savings achieved by the condominial water supply network were considerable: the cost per connection was only USD 45 (1997 USD) vs USD 167 for a conventional water supply network (Table 2.1), despite the basic design criteria being the same in both cases (90 percent service coverage and a design supply of 250 lpd).
a 1997 USD; b individual household connections; c individual condominium connections.
Source: Melo (2005).
Table 3.3 Comparative costsa of conventional and condominial water supplies in parauapebas
Conventional supply
Condominial supply
Item Total cost Cost per connectionb Total cost Cost per connectionc
Excavation 454,000 88 101,000 19Pipes 407,000 79 129,000 25Total 861,000 167 230,000 45
5
These cost savings were achieved because there was a much lower total pipe length for the public distribution network (287 km of streets served with only 43 km of pipes) which meant that substantially less ‘public’ excavation was required. The condominial branches were routed along the pavements (sidewalks) at a depth of ~400 mm and an entry point for each housing block (condominium) provided. The block residents (i.e., the members of the condominium) purchased all the materials to complete the in-block distribution system and household connections (in this case for a Level 4 supply), as well as contribute their own labour for trench excavation. Initially each household connection was metered and the households paid a monthly water bill made up as follows: (1) a standing charge equivalent to USD 2.78, (2) a charge of USD 0.25 per m3 for the first 10 m3, and (3) a higher charge of USD 0.99 per m3 above the first 10 m3. Later new connections were not metered and the monthly bill was USD 5.28 (i.e., the standing charge plus USD 2.50 for an assumed consumption of 10 m3 per month).
lessons for STlV
The condominial water supply system described above for Parauapebas is not replicable in detail in most STLV especially those in Africa and Asia, − for example, the design water consumption of 250 lpd would be far too high in most STLV. However, the basic concept remains valid: the cost of the public dis-tribution network can be substantially reduced if the supply is to condominiums (or co-operatives) rather than to individual households and if the in-condominium pipework is installed by the condominium members. In any one ST or LV the following questions need to be addressed at the pre-feasibility stage:
Is the supply to be based on standpipes, standpipe cooperatives or a condominial supply?
If on standpipes, how many standpipes are required? Will they be managed by the community?
If on standpipe cooperatives, how many households should there be in each cooperative? (The answer need not be one figure; a range is preferable to allow for variations due to topography and housing density.)
If on a condominial supply, is the supply to each member household to be a yard tap or a multiple-tap in-house supply? (Presumably in most STLV the supply will be individual yard taps, except in non-poor areas of ST.)
What should be the design water consumption? Is 50 lpd locally sufficient?
How are households to be charged for water consumption?
Will the community contribute labour and/or money to reduce the costs of implementation? If not, will the scheme be viable?
Condominial water supplies based on individual yard taps and standpipe cooperatives clearly have huge potential in STLV, yet they are not well known options.
�
Water treatment
Water treatment in STLV has to be simple, effective and reliable. If surface water is to be treated, then often the best option is multiple-stage filtration (Galvis et al., 1998; this reference should be consulted for design details; see also Water and Sanitation Program, 2005). If groundwater, then the ideal solu-tion is to abstract the groundwater from an uncontaminated and protected aquifer, so that treatment is not required. Initial chemical analyses must, however, be undertaken to ensure there are no problems with, for example, arsenic, or to detect high concentrations of iron and manganese (which are easily removed by aeration, even at small-village level; Sarmento, 2001). Disinfection, although very desirable, may not be practical, especially in LV. For a good review of water quality requirements, including bacte-riological quality requirements, see Nozaic (2002).
Water supply tariff structures
Water supply tariff structures are important as they determine what consumers pay for their water and how the amount they pay changes with the amount of water they consume. Mara (2005) examined urban and periurban water supply tariffs and considered that an urban water supply authority could charge three groups of consumers having different levels of service:
Non-poor households with metered multiple-tap in-house supplies,
Poor households with unmetered yard taps, and,
Poor households in unmetered standpipe cooperatives.
Households in Group 2 would pay a ‘minimum tariff’ based on a fixed percentage of the local monthly minimum wage (e.g., 5 percent, as in Brazil) and very households in Group 3 would pay a ‘nominal tariff’ based on a lower percentage of the minimum wage (e.g., 1−2 percent). ‘Social supplies’ to very poor households served by public standpipes would be free. The authority would know its income from Groups 2 and 3 and, knowing its total costs, could calculate how much it would need to collect each month from Group 1 (and on what basis − i.e., on an increasing or linear block tariff). Connection fees would not be levied as these deter the poor and very poor from connecting; the fees would be included in the total costs and so effectively paid for by Group 1.
However, in STLV the proportion of households in Group 1 would be usually much lower than in cities and large towns, and therefore the authority’s main customer base would be Groups 2 and 3. It is therefore extremely important in planning new or extending existing water supplies in STLV that the condominial option is discussed with households in Group 2 − i.e., to determine the local feasibility of Group 2 households forming condominiums which agree to pay for the installation of the condominial network, so that the authority’s costs for the public network are reduced (cf. Table 3.3); operational costs could be reduced if the condominium agreed to be charged as a single entity, rather than the authority having to bill individual condominium members − thus the condominium would be responsible for collecting payments from its members; it could do this weekly, fortnightly or monthly, at it wished; arrangements should then be made by the authority to receive payments at the chosen interval even though it would only formally bill the condominium monthly.
�
Once the authority knows its costs (e.g., monthly loan repayment, monthly O&M costs, less any subsi-dies received), it can then determine how to recoup these costs equitably from its customers − i.e., how much households in Groups 2 and 3 (and in Group 1 if these exist) should be charged (and this charge should then be expressed as a percentage of the local minimum wage). The authority would also have to agree with its customers how it should treat those who do not pay their bills (e.g., cut off the supply immediately or after 2 or 3 payment defaults). It may be sensible for the authority to collect payments only 10 times per year, rather than 12 (each payment then being 20 percent more than the actual monthly charge) in recognition of local needs (such as expenditures for the principal local holiday or festival and at the start of the school year).
Aggregation
Aggregation means the grouping of neighbouring STLV, possibly including neighbouring small villages, into one water supply ‘zone’ under one water supply organization, so that some economy of scale may be realised (ERM et al., 2005). There are various levels of aggregation with different functions and responsibility (e.g., bulk water supply only, or including local distribution, operation and maintenance). Aggregation may be voluntary (local STLV choosing to aggregate) or mandatory (local STLV being told to aggregate by a higher authority − for example, state/provincial or central government). The options are discussed in detail in ERM et al. (2005), and by the Water and Sanitation Program (www.wsp.org/05_In-itiatives_smalltowns.asp). If aggregation is not mandatory, then its local advantages and disadvantages should always be considered in detail at the pre-feasibility stage.

�

9
3 Sanitation
Available sanitation options
There are only a few available sanitation technology options:
On-site systems:
SanPlat’ latrines;
ventilated improved pit (VIP) latrines,
pour-flush (PF) toilets, and
ecological sanitation (‘EcoSan’) toilets;
Off-site systems:
communal sanitation facilities,
conventional sewerage,
settled sewerage, and
simplified sewerage.
These technologies are fully described in several documents (e.g., Mara, 1996; Metcalf & Eddy, Inc., 1986; Winblad and Simpson-Hébert, 2004); only a brief description is given here. Conventional sewer-age can be immediately eliminated from further consideration for STLV simply on the grounds of its very high cost (Kalbermatten et al., 1982).
Cost is really the most important criterion for sanitation technology selection for poor and very poor households in STLV as, given good design, implementation and operation and maintenance, all of the above sanitation technologies achieve approximately the same level of health benefits (Feachem et al., 1983).
Comparative costs
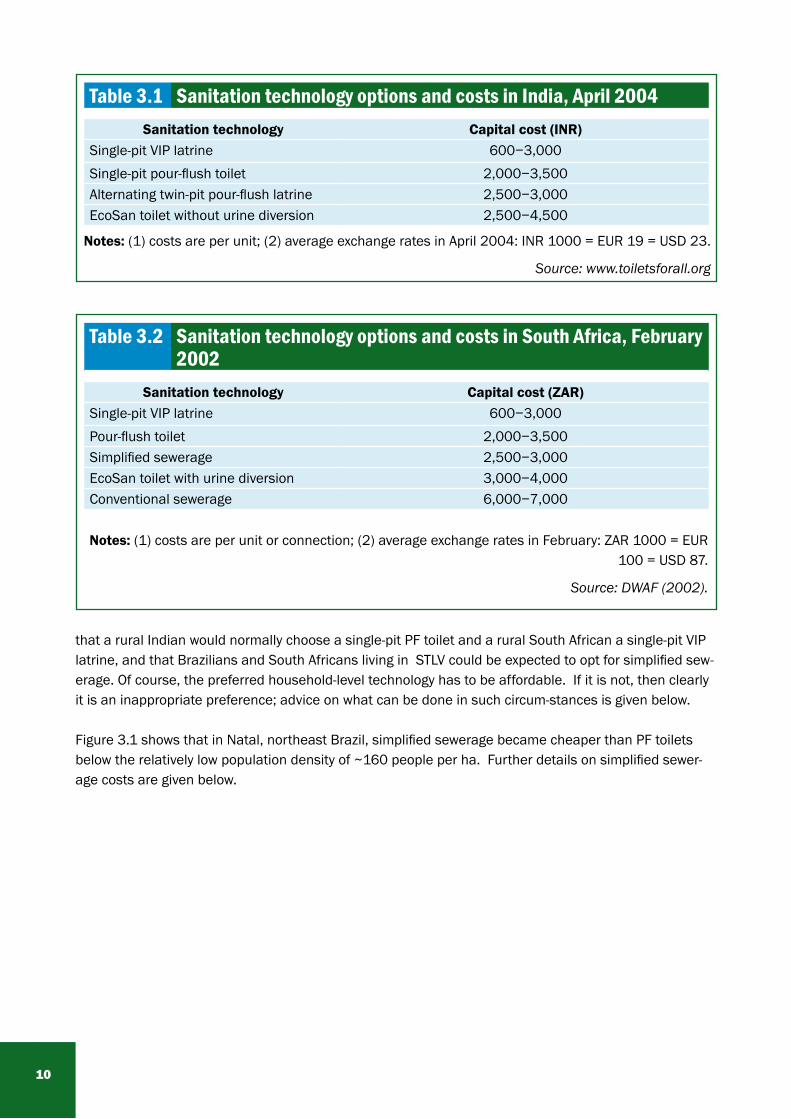
There are few relatively recent sets of comparative sanitation costs. Tables 3.1 and 3.2 show costs in India in 2004 and in South Africa in 2002, and Figure 3.1 shows costs in northeast Brazil in 1983. These cost data are very pertinent (although, of course, they need to be verified locally). They suggest
10
Notes: (1) costs are per unit; (2) average exchange rates in April 2004: INR 1000 = EUR 19 = USD 23.
Source: www.toiletsforall.org
Table 3.1 Sanitation technology options and costs in India, April 2004Sanitation technology Capital cost (INR)
Single-pit VIP latrine 600−3,000Single-pit pour-flush toilet 2,000−3,500Alternating twin-pit pour-flush latrine 2,500−3,000EcoSan toilet without urine diversion 2,500−4,500
Notes: (1) costs are per unit or connection; (2) average exchange rates in February: ZAR 1000 = EUR 100 = USD 87.
Source: DWAF (2002).
Table 3.2 Sanitation technology options and costs in South Africa, February 2002
Sanitation technology Capital cost (ZAR)Single-pit VIP latrine 600−3,000Pour-flush toilet 2,000−3,500Simplified sewerage 2,500−3,000EcoSan toilet with urine diversion 3,000−4,000Conventional sewerage 6,000−7,000
that a rural Indian would normally choose a single-pit PF toilet and a rural South African a single-pit VIP latrine, and that Brazilians and South Africans living in STLV could be expected to opt for simplified sew-erage. Of course, the preferred household-level technology has to be affordable. If it is not, then clearly it is an inappropriate preference; advice on what can be done in such circum-stances is given below.
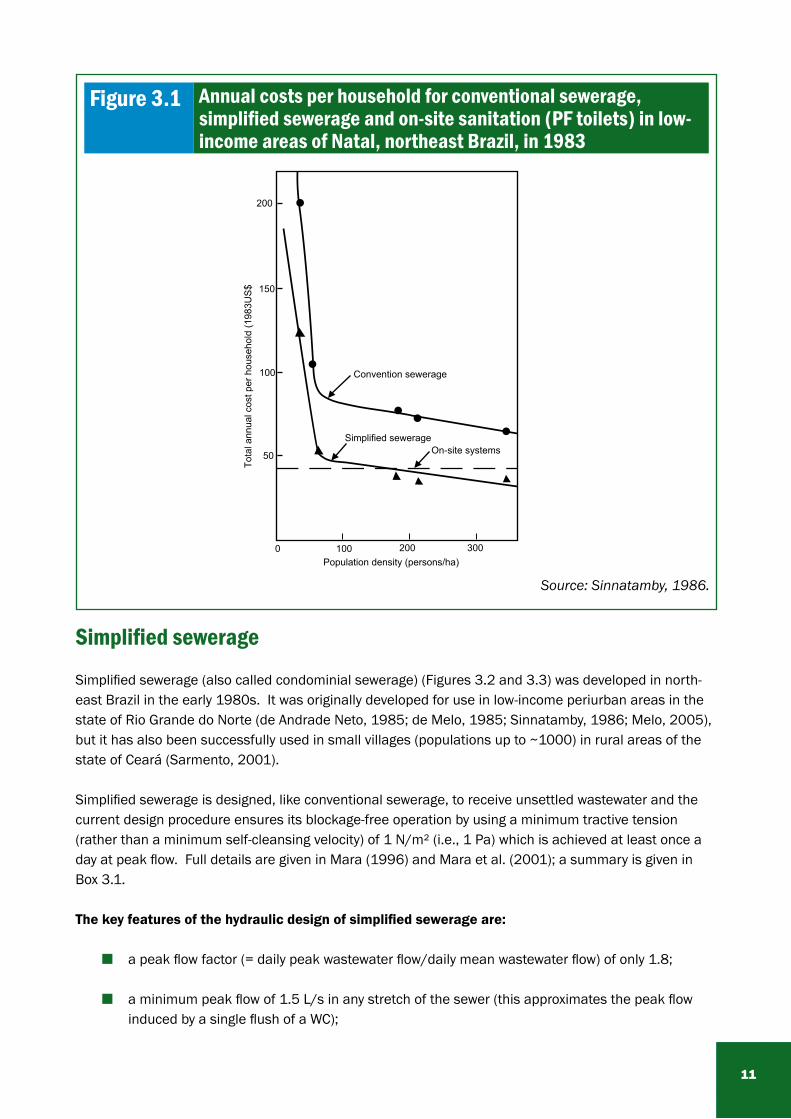
Figure 3.1 shows that in Natal, northeast Brazil, simplified sewerage became cheaper than PF toilets below the relatively low population density of ~160 people per ha. Further details on simplified sewer-age costs are given below.
11
Simplified sewerage
Simplified sewerage (also called condominial sewerage) (Figures 3.2 and 3.3) was developed in north-east Brazil in the early 1980s. It was originally developed for use in low-income periurban areas in the state of Rio Grande do Norte (de Andrade Neto, 1985; de Melo, 1985; Sinnatamby, 1986; Melo, 2005), but it has also been successfully used in small villages (populations up to ~1000) in rural areas of the state of Ceará (Sarmento, 2001).
Simplified sewerage is designed, like conventional sewerage, to receive unsettled wastewater and the current design procedure ensures its blockage-free operation by using a minimum tractive tension (rather than a minimum self-cleansing velocity) of 1 N/m² (i.e., 1 Pa) which is achieved at least once a day at peak flow. Full details are given in Mara (1996) and Mara et al. (2001); a summary is given in Box 3.1.
The key features of the hydraulic design of simplified sewerage are:
a peak flow factor (= daily peak wastewater flow/daily mean wastewater flow) of only 1.8;
a minimum peak flow of 1.5 L/s in any stretch of the sewer (this approximates the peak flow induced by a single flush of a WC);
Figure 3.1 Annual costs per household for conventional sewerage, simplified sewerage and on-site sanitation (PF toilets) in low-income areas of Natal, northeast Brazil, in 1983
Population density (persons/ha)
Tota
l ann
ual c
ost p
er h
ouse
hold
(198
3US
$
50
100
150
200
On-site systemsSimplified sewerage
Convention sewerage
1000 300200
Source: Sinnatamby, 1986.
12
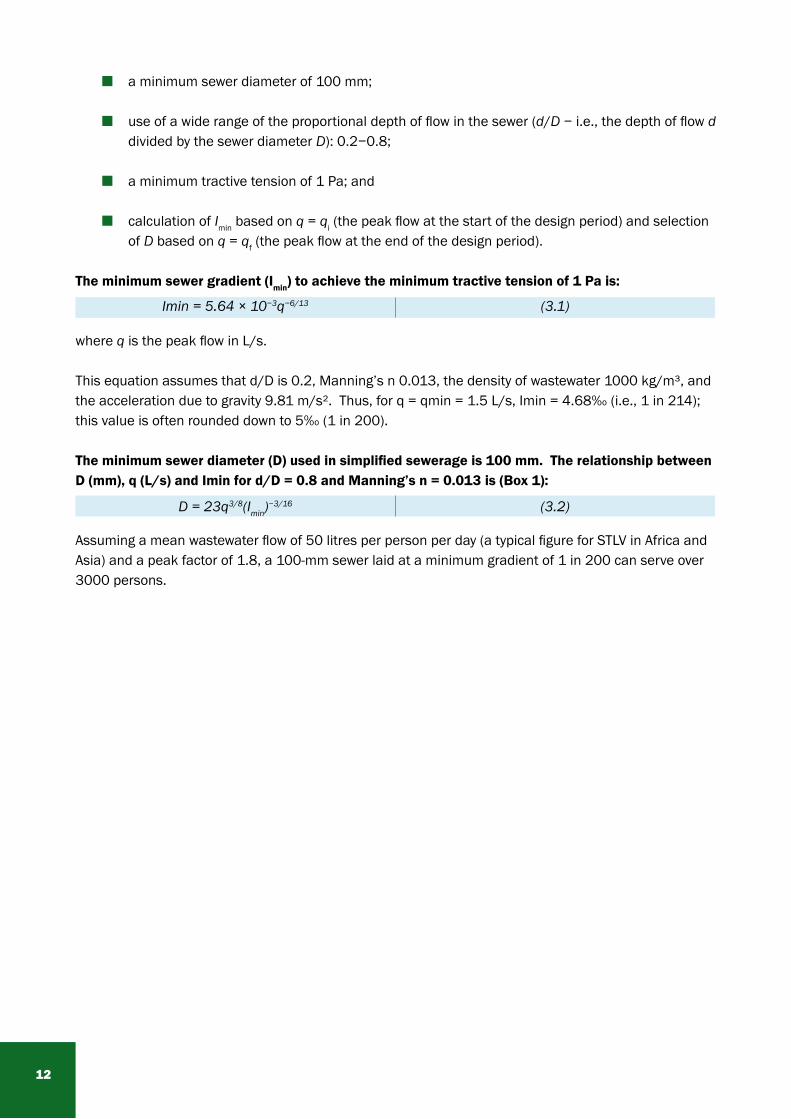
a minimum sewer diameter of 100 mm;
use of a wide range of the proportional depth of flow in the sewer (d/D − i.e., the depth of flow d divided by the sewer diameter D): 0.2−0.8;
a minimum tractive tension of 1 Pa; and
calculation of Imin based on q = qi (the peak flow at the start of the design period) and selection of D based on q = qf (the peak flow at the end of the design period).
The minimum sewer gradient (Imin) to achieve the minimum tractive tension of 1 Pa is:
Imin = 5.64 × 10⁻³q−6/13 (3.1)
where q is the peak flow in L/s.
This equation assumes that d/D is 0.2, Manning’s n 0.013, the density of wastewater 1000 kg/m³, and the acceleration due to gravity 9.81 m/s². Thus, for q = qmin = 1.5 L/s, Imin = 4.68‰ (i.e., 1 in 214); this value is often rounded down to 5‰ (1 in 200).
The minimum sewer diameter (D) used in simplified sewerage is 100 mm. The relationship between D (mm), q (L/s) and Imin for d/D = 0.8 and Manning’s n = 0.013 is (Box 1):
D = 23q3/8(Imin)−3/16 (3.2)
Assuming a mean wastewater flow of 50 litres per person per day (a typical figure for STLV in Africa and Asia) and a peak factor of 1.8, a 100-mm sewer laid at a minimum gradient of 1 in 200 can serve over 3000 persons.
13
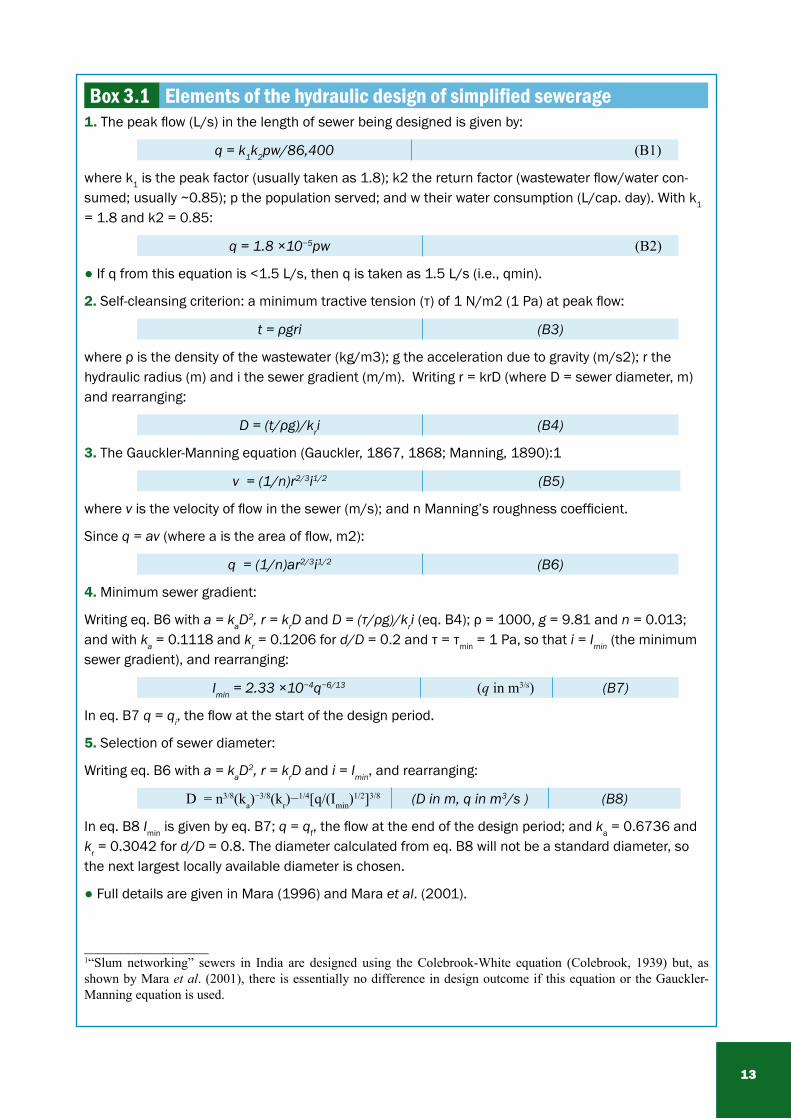
Box 3.1 Elements of the hydraulic design of simplified sewerage1. The peak flow (L/s) in the length of sewer being designed is given by:
q = k1k2pw/86,400 (B1)
where k1 is the peak factor (usually taken as 1.8); k2 the return factor (wastewater flow/water con-sumed; usually ~0.85); p the population served; and w their water consumption (L/cap. day). With k1 = 1.8 and k2 = 0.85:
q = 1.8 ×10⁻⁵pw (B2)
● If q from this equation is <1.5 L/s, then q is taken as 1.5 L/s (i.e., qmin).
2. Self-cleansing criterion: a minimum tractive tension (τ) of 1 N/m2 (1 Pa) at peak flow:
t = ρgri (B3)
where ρ is the density of the wastewater (kg/m3); g the acceleration due to gravity (m/s2); r the hydraulic radius (m) and i the sewer gradient (m/m). Writing r = krD (where D = sewer diameter, m) and rearranging:
D = (t/ρg)/kri (B4)
3. The Gauckler-Manning equation (Gauckler, 1867, 1868; Manning, 1890):1
v = (1/n)r2/3i1/2 (B5)
where v is the velocity of flow in the sewer (m/s); and n Manning’s roughness coefficient.
Since q = av (where a is the area of flow, m2):
q = (1/n)ar2/3i1/2 (B6)
4. Minimum sewer gradient:
Writing eq. B6 with a = kaD2, r = krD and D = (τ/ρg)/kri (eq. B4); ρ = 1000, g = 9.81 and n = 0.013;
and with ka = 0.1118 and kr = 0.1206 for d/D = 0.2 and τ = τmin = 1 Pa, so that i = Imin (the minimum sewer gradient), and rearranging:
Imin = 2.33 ×10⁻⁴q−6/13 (q in m3/s) (B7)
In eq. B7 q = qi, the flow at the start of the design period.
5. Selection of sewer diameter:
Writing eq. B6 with a = kaD2, r = krD and i = Imin, and rearranging:
D = n3/8(ka)−3/8(kr)−
1/4[q/(Imin)1/2]3/8 (D in m, q in m3/s ) (B8)
In eq. B8 Imin is given by eq. B7; q = qf, the flow at the end of the design period; and ka = 0.6736 and kr = 0.3042 for d/D = 0.8. The diameter calculated from eq. B8 will not be a standard diameter, so the next largest locally available diameter is chosen.
● Full details are given in Mara (1996) and Mara et al. (2001).
_________________1“Slum networking” sewers in India are designed using the Colebrook-White equation (Colebrook, 1939) but, as shown by Mara et al. (2001), there is essentially no difference in design outcome if this equation or the Gauckler-Manning equation is used.
14
Costs
Simplified sewerage is low-cost: when it was first installed in 1981 in northeast Brazil the cost was USD 325 per household (compared with around USD 1500 per household for conventional sewerage), with a monthly payment by each household of only USD 1.50 (Sinnatamby, 1986). Costs have since fallen slightly − for example, current costs in Brasília are USD 200−300 per household (Maurício Luducice, Water and Sewerage Company of Brasília and the Federal District − CAESB, quoted in McCann, 2005); and in South Africa they were USD 220−260 per household in 2002 (DWAF, 2002). Costs in India, where simplified sewerage is known as “slum networking”, are around USD 150 per household (Parikh et al., 2002).
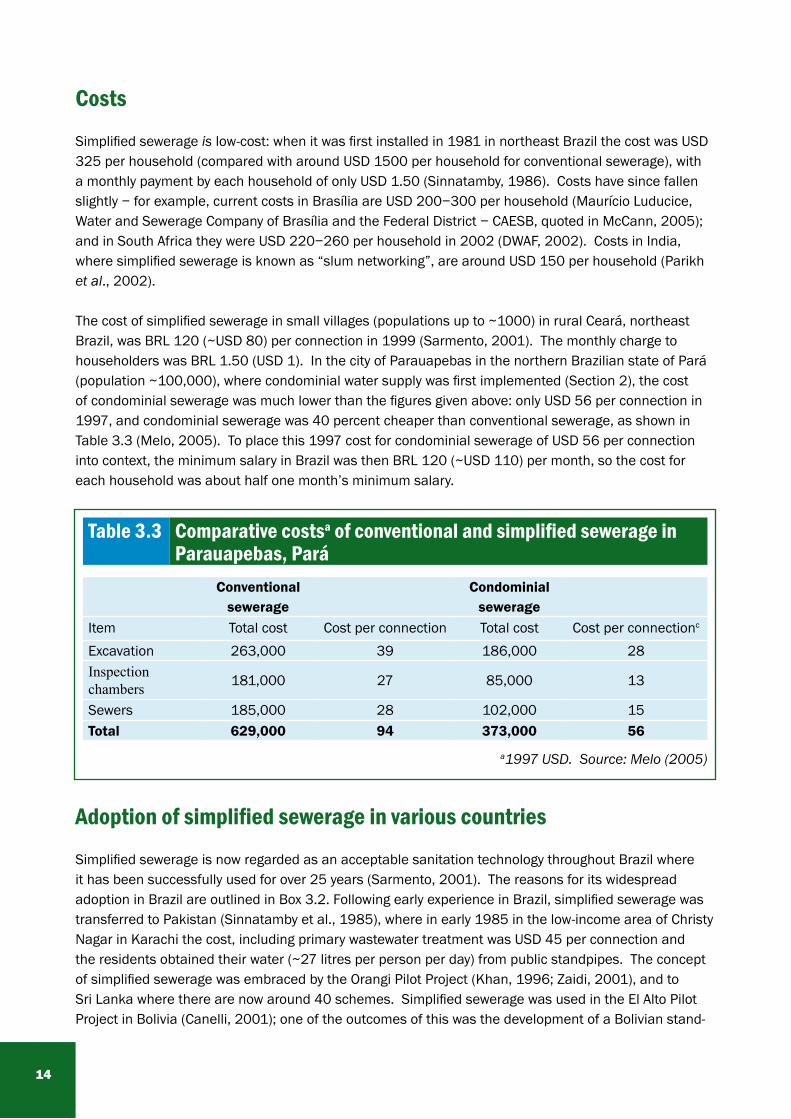
The cost of simplified sewerage in small villages (populations up to ~1000) in rural Ceará, northeast Brazil, was BRL 120 (~USD 80) per connection in 1999 (Sarmento, 2001). The monthly charge to householders was BRL 1.50 (USD 1). In the city of Parauapebas in the northern Brazilian state of Pará (population ~100,000), where condominial water supply was first implemented (Section 2), the cost of condominial sewerage was much lower than the figures given above: only USD 56 per connection in 1997, and condominial sewerage was 40 percent cheaper than conventional sewerage, as shown in Table 3.3 (Melo, 2005). To place this 1997 cost for condominial sewerage of USD 56 per connection into context, the minimum salary in Brazil was then BRL 120 (~USD 110) per month, so the cost for each household was about half one month’s minimum salary.
Adoption of simplified sewerage in various countries
Simplified sewerage is now regarded as an acceptable sanitation technology throughout Brazil where it has been successfully used for over 25 years (Sarmento, 2001). The reasons for its widespread adoption in Brazil are outlined in Box 3.2. Following early experience in Brazil, simplified sewerage was transferred to Pakistan (Sinnatamby et al., 1985), where in early 1985 in the low-income area of Christy Nagar in Karachi the cost, including primary wastewater treatment was USD 45 per connection and the residents obtained their water (~27 litres per person per day) from public standpipes. The concept of simplified sewerage was embraced by the Orangi Pilot Project (Khan, 1996; Zaidi, 2001), and to Sri Lanka where there are now around 40 schemes. Simplified sewerage was used in the El Alto Pilot Project in Bolivia (Canelli, 2001); one of the outcomes of this was the development of a Bolivian stand-
Table 3.3 Comparative costsa of conventional and simplified sewerage in parauapebas, pará
Conventional sewerage
Condominial sewerage
Item Total cost Cost per connection Total cost Cost per connectionc
Excavation 263,000 39 186,000 28Inspection chambers 181,000 27 85,000 13
Sewers 185,000 28 102,000 15Total 629,000 94 373,000 56
a1997 USD. Source: Melo (2005)
15
ard for simplified sewerage (DGSB, 2001). Simplified sewerage has recently been developed in South Africa (Brocklehurst, 2001; Anon., 2004; WRC, 2005).
Community-based sewerage schemes have been developed in Indonesia (Foley et al., 2000) and “slum networking” schemes in India (Parikh et al., 2002; Kakumbi, 2005). While not designed precisely ac-cording to the principles of Brazilian simplified sewerage, these have been nonetheless very successful.
Application to STlV
Simplified sewerage has been implemented in a variety of locations in Brazil, from small villages, through medium-sized cities, to low-income periurban areas in major cities. This, together with its replication in other countries, including low-income areas with low water consumption, show that it is clearly applicable to STLV, provided of course that it is locally affordable and cheaper than other house-hold-level options.
National sewerage design codes
Hydraulic theory and visual observation both indicate that small wastewater flows flow better in small diameter sewers. Yet many national sewerage design codes specify a minimum sewer diameter greater than 100 mm in the mistaken belief that larger is ipso facto better, whereas in fact small flows flow better in small sewers. Such codes need to be altered to take into account present practice in simplified sewerage; otherwise local design engineers will be forced to continue to develop very conservative, and hence expensive, ‘solutions’ for the poor in STLV.
Wastewater treatment
The wastewater collected by simplified sewerage should be treated prior to surface-water discharge or reuse in horticulture, agriculture and/or aquaculture. In STLV the best option for wastewater treatment is generally waste stabilization ponds as these are especially effective in removing or destroying faecal pathogens. Full details are given in Mara (1997, 2004).
Settled sewerage
Settled sewerage (also called ‘solids-free sewerage’; in the United States ‘small-diameter gravity sewer-age’, and in Australia ‘septic tank effluent drainage’) is a sewer system that conveys only septic tank effluents. As these effluents are solids-free the sewer is designed differently from conventional and simplified sewers (which convey all the wastewater solids). Each house or a small group of neighbouring houses has a septic tank which discharges into the settled sewer. The minimum sewer diameter is 75 mm and the sewer gradient closely follows the ground slope, with the flow in the sewer alternating as necessary between open channel flow and pressure flow. Full details are given in Otis and Mara (1985), Mara (1996) and US EPA (2000).
Settled sewerage is best applied in areas already served by septic tanks. Thus it is unlikely to be ap-plicable to poor and very poor households in STLV, for which simplified sewerage is generally a better and cheaper alternative.
1�
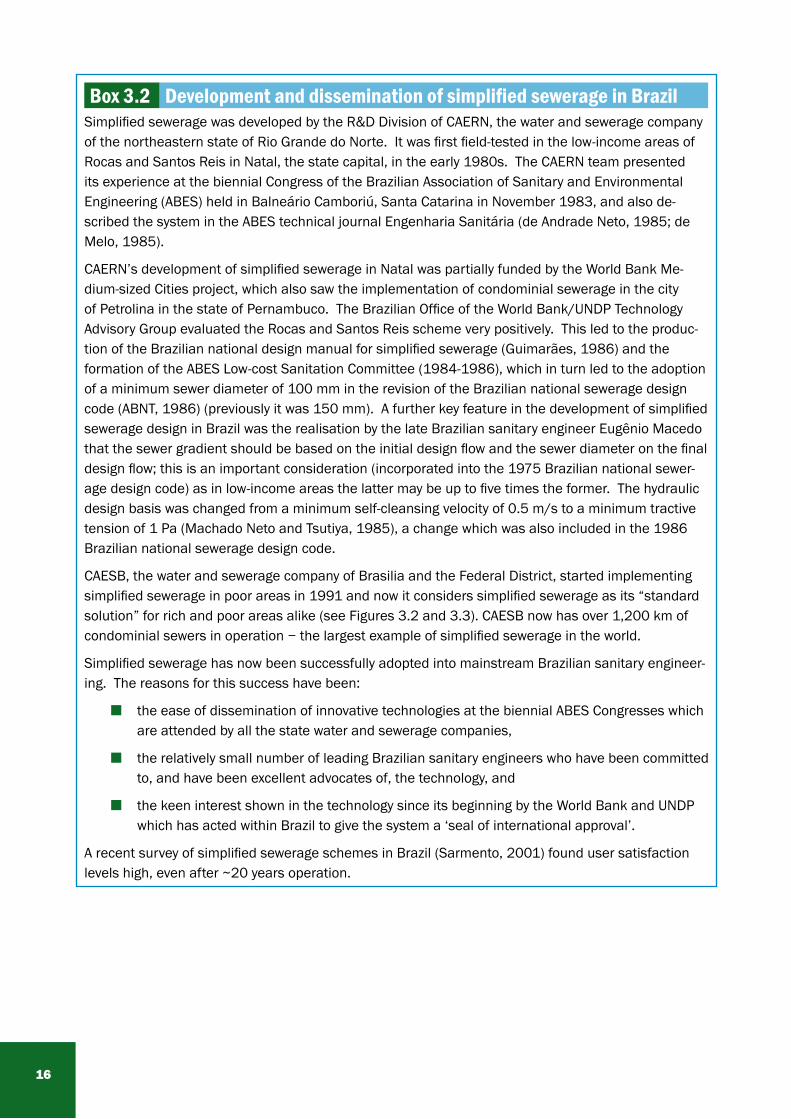
Box 3.2 Development and dissemination of simplified sewerage in BrazilSimplified sewerage was developed by the R&D Division of CAERN, the water and sewerage company of the northeastern state of Rio Grande do Norte. It was first field-tested in the low-income areas of Rocas and Santos Reis in Natal, the state capital, in the early 1980s. The CAERN team presented its experience at the biennial Congress of the Brazilian Association of Sanitary and Environmental Engineering (ABES) held in Balneário Camboriú, Santa Catarina in November 1983, and also de-scribed the system in the ABES technical journal Engenharia Sanitária (de Andrade Neto, 1985; de Melo, 1985).
CAERN’s development of simplified sewerage in Natal was partially funded by the World Bank Me-dium-sized Cities project, which also saw the implementation of condominial sewerage in the city of Petrolina in the state of Pernambuco. The Brazilian Office of the World Bank/UNDP Technology Advisory Group evaluated the Rocas and Santos Reis scheme very positively. This led to the produc-tion of the Brazilian national design manual for simplified sewerage (Guimarães, 1986) and the formation of the ABES Low-cost Sanitation Committee (1984-1986), which in turn led to the adoption of a minimum sewer diameter of 100 mm in the revision of the Brazilian national sewerage design code (ABNT, 1986) (previously it was 150 mm). A further key feature in the development of simplified sewerage design in Brazil was the realisation by the late Brazilian sanitary engineer Eugênio Macedo that the sewer gradient should be based on the initial design flow and the sewer diameter on the final design flow; this is an important consideration (incorporated into the 1975 Brazilian national sewer-age design code) as in low-income areas the latter may be up to five times the former. The hydraulic design basis was changed from a minimum self-cleansing velocity of 0.5 m/s to a minimum tractive tension of 1 Pa (Machado Neto and Tsutiya, 1985), a change which was also included in the 1986 Brazilian national sewerage design code.
CAESB, the water and sewerage company of Brasilia and the Federal District, started implementing simplified sewerage in poor areas in 1991 and now it considers simplified sewerage as its “standard solution” for rich and poor areas alike (see Figures 3.2 and 3.3). CAESB now has over 1,200 km of condominial sewers in operation − the largest example of simplified sewerage in the world.
Simplified sewerage has now been successfully adopted into mainstream Brazilian sanitary engineer-ing. The reasons for this success have been:
the ease of dissemination of innovative technologies at the biennial ABES Congresses which are attended by all the state water and sewerage companies,
the relatively small number of leading Brazilian sanitary engineers who have been committed to, and have been excellent advocates of, the technology, and
the keen interest shown in the technology since its beginning by the World Bank and UNDP which has acted within Brazil to give the system a ‘seal of international approval’.
A recent survey of simplified sewerage schemes in Brazil (Sarmento, 2001) found user satisfaction levels high, even after ~20 years operation.
1�
on-site systems
On-site sanitation systems are ‘SanPlat’ latrines, VIP latrines, pour-flush toilets and ecological sanitation toilets. Septic tanks are not appropriate in STLV (except in non-poor households)
SanPlat latrines
‘SanPlat’ (Sanitation Platform) latrines are simply traditional (i.e., unventilated) latrines provided with a concrete cover slab (the ‘sanplat’). Details are given in Brandberg (1996) and at www.sanplat.com.
VIP latrines
Ventilated improved pit latrines were developed in rural Zimbabwe (Morgan and Mara, 1982). They have also been used in low-density low-income urban areas in Botswana (van Nostrand and Wilson, 1983). The vent pipe effectively controls odours and flies. There are single-pit and alternating twin-pit versions; design details are given in Mara (1985a, 1996). They are applicable in low-density STLV, provided that they are cheaper than simplified sewerage (emptying costs must be included in this cost comparison).
Pour-flush toilets
On-site pour-flush toilet systems comprise the toilet itself, with its integral water-seal, a discharge pipe and either a single leach pit or alternating twin leach pits (the toilet bowl or squat pan can be and is used in other situations − for example, simplified and settled sewerage). The volume of flush-water is ~2−4 litres per flush and the leach pits are designed both for solids digestion and storage and infiltra-tion of urine and the flush-water (details are given in Roy et al., 1984 and Mara, 1985b, 1996). As with VIP latrines, PF toilets are only applicable in low-density STLV if they are cheaper than simplified sewer-age.
Pit emptying
The pits of SanPlat and VIP latrines anf PF toilets require emptying when they are full; the faecal sludge is removed manually (alternating twin-pit version only), or mechanically by high-powered vacuum tank-ers (both versions) (Carroll, 1989). However, in practice pit emptying is not well planned: the vacuum tankers are not properly maintained and poor households are often disadvantaged as they are the last to be serviced (Jones, 2005). This alone should militate against on-site sanitation systems in STLV.
Ecological sanitation toilets
The basic philosophy of ‘ecological sanitation’ (‘EcoSan’) is to recycle all the nutrients in human excreta as each person excretes almost enough NPK to produce all the cereals he or she needs (Drangert, 1998). A consequence of this is that the various ‘streams’ of excreta and wastewater should not be mixed as they differ greatly in their volumes and nutrient loads. Thus “yellow water” (urine), “brown water” (faeces and toilet flush waters) and “grey water” (wastewater from sinks and showers or baths) should be kept separate to facilitate nutrient and water treatment and reuse (Otterpohl, 2001), although in some EcoSan systems yellow water and brown water are combined to form “black water”.
1�
Full details on EcoSan are given in Winblad and Simpson-Hébert (2004) and at www.ecosanres.org and www.gtz.de/en/themen/umwelt-infrastruktur/wasser/8524.htm.
EcoSan can be either on-site or off-site, and it can even be partially on-site and partially off-site. There are many EcoSan variants: some are ‘high-tech’ and high-cost; others are ‘low-tech’ and low-cost, and may or may not include urine diversion; on-site treatment options for brown waters include double-vault dehydrating and composting toilets, and anaerobic digestion (possibly supplemented by domestic animal excreta) and use of the resulting biogas for cooking (as in some STLV in northern Vietnam).
There is currently much discussion on whether ‘ecological sanitation’ refers only to those systems in which yellow, brown and grey waters are source-separated and reused separately, or whether it can also refer to any sanitation system in which all (or almost all) the nutrients are reused (and so would include, for example, simplified sewerage + wastewater treatment in waste stabilization ponds + reuse of the treated wastewater in horticulture, agriculture and/or aquaculture).
However, the cost data in Tables 3.1 and 3.2 suggest that EcoSan toilets, either with or without urine separation, are too expensive for use in STLV.
Communal sanitation facilities
In almost all STLV there are many very poor households which are unable to afford any kind of individual household-level sanitation, whether it be an on-site or off-site system. In such areas, the only option is the construction of communal sanitation blocks of the type implemented in India by Sulabh Interna-tional (Pathak, 1991, 1999; Singh, 2000; www.sulabhinternational.org). There are now ~6,400 such sanitation blocks throughout India, used by over a million people every day.
The blocks provide toilet and washing facilities; soap is provided to all users. There is a charge of INR 1 (~USD 0.02) per use (other than use of urinals), but children, disabled people and those unable to pay are not charged. The blocks are maintained 24 hours per day by caretakers who are employed by Su-labh and live on the premises. The caretakers also collect the user charges and the blocks are regularly inspected both by Sulabh and the local council (United Nations, 2004; www.sulabhinternational.org).
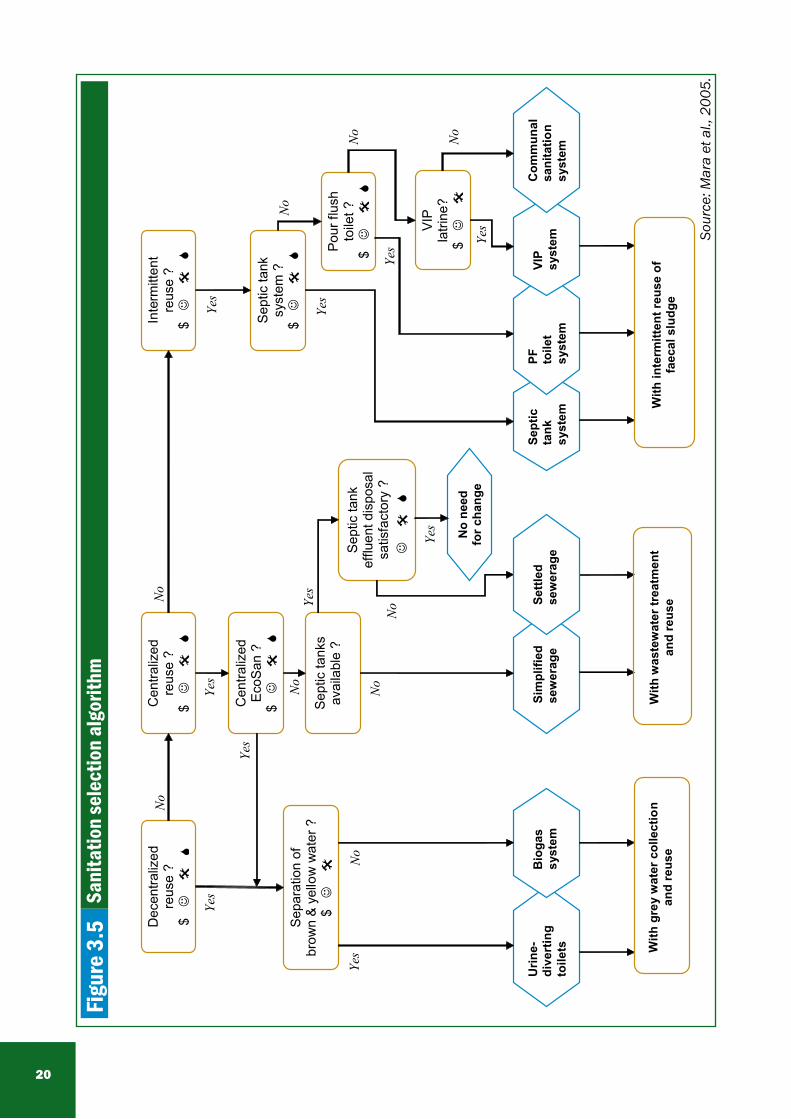
Sanitation selection algorithm
Figure 3.5 shows the sanitation selection algorithm developed by Mara et al. (2005). It is based on the premise that human wastes and household wastewaters should be treated and reused in horticulture, agriculture and/or aquaculture. Such reuse may be decentralized, centralized or intermittent, depend-ing on user preference, local feasibility and the type of sanitation technologies used. Decentralized reuse is reuse at household or local community level (a housing estate, for example). Centralized reuse is reuse at the level of either natural drainage basins within an urban area or the whole urban area (town, city, metropolitan area); it will normally require wastewater collection in a sewer system followed by wastewater treatment, possibly with biogas production and collection, and then aquacultural and/or agricultural reuse of the treated effluent. It may also refer to grey water collection within a natural drain-age basin followed by treatment and reuse. Intermittent reuse refers to on-site systems, including pit latrines, pour-flush toilets and septic tanks, which provide biosolids for agricultural or horticultural reuse only when they are desludged every few years.
19
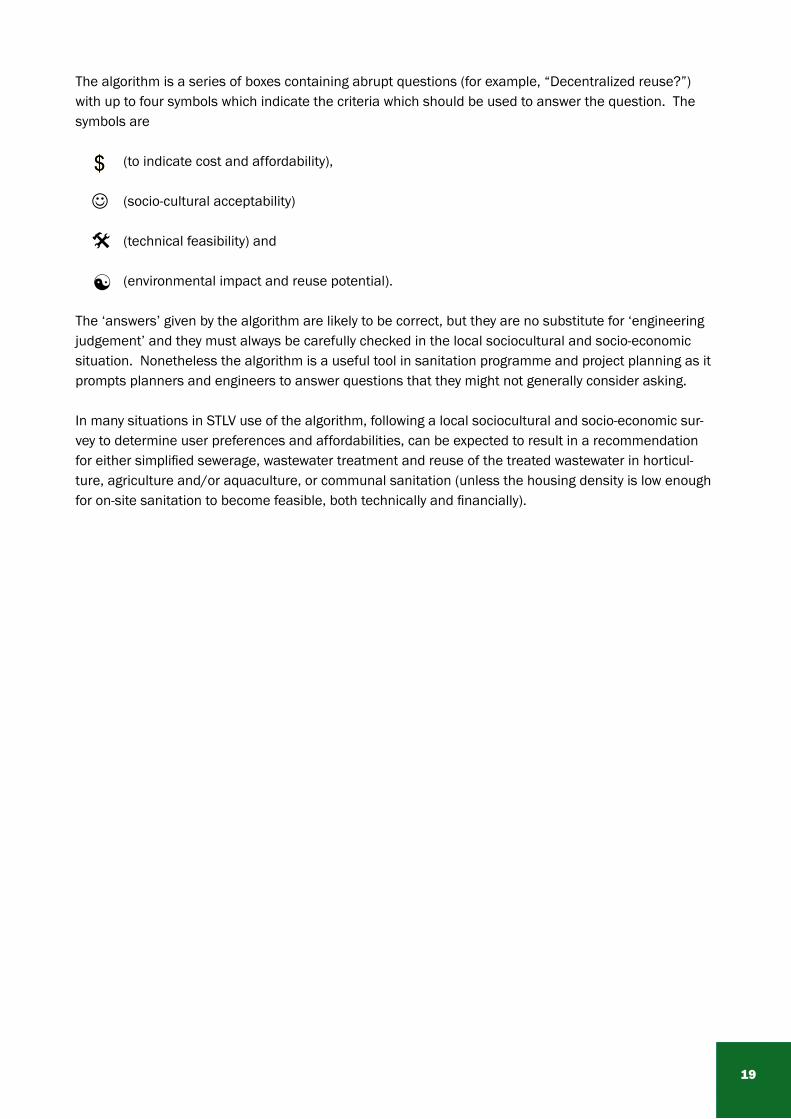
The algorithm is a series of boxes containing abrupt questions (for example, “Decentralized reuse?”) with up to four symbols which indicate the criteria which should be used to answer the question. The symbols are
(to indicate cost and affordability),
(socio-cultural acceptability)
(technical feasibility) and
(environmental impact and reuse potential).
The ‘answers’ given by the algorithm are likely to be correct, but they are no substitute for ‘engineering judgement’ and they must always be carefully checked in the local sociocultural and socio-economic situation. Nonetheless the algorithm is a useful tool in sanitation programme and project planning as it prompts planners and engineers to answer questions that they might not generally consider asking.
In many situations in STLV use of the algorithm, following a local sociocultural and socio-economic sur-vey to determine user preferences and affordabilities, can be expected to result in a recommendation for either simplified sewerage, wastewater treatment and reuse of the treated wastewater in horticul-ture, agriculture and/or aquaculture, or communal sanitation (unless the housing density is low enough for on-site sanitation to become feasible, both technically and financially).
$ $
20
Figu
re 3
.5Sa
nita
tion
sele
ctio
n al
gorit
hm
D
ecen
traliz
ed
reus
e ?
$
Sepa
ratio
n of
br
own
& ye
llow
wat
er ?
$
Urin
e-di
vert
ing
toile
ts
Pour
flus
h to
ilet ?
$
VIP
la
trine
? $
Sept
ic ta
nks
avai
labl
e ?
Sept
ic ta
nk
efflu
ent d
ispo
sal
satis
fact
ory
?
Sim
plifi
ed
sew
erag
e B
ioga
s sy
stem
Cen
traliz
ed
reus
e ?
$
Cen
traliz
ed
EcoS
an ?
$
Inte
rmitt
ent
reus
e ?
$
Sept
ic
tank
sy
stem
Sept
ic ta
nk
syst
em ?
$
Yes
No
Yes
PF
toile
t sy
stem
VIP
syst
em
Com
mun
al
sani
tatio
nsy
stem
No
need
fo
r cha
nge
Yes
No
Yes
Yes
Yes
No
Yes
Yes
No
Yes
No
No
No
No
Yes
No
Settl
ed
sew
erag
e
With
was
tew
ater
trea
tmen
t an
d re
use
With
gre
y w
ater
col
lect
ion
and
reus
e W
ith in
term
itten
t reu
se o
f
faec
al s
ludg
e
Sour
ce: M
ara
et a
l., 2
005.
21
4 Constraints
There are a number of constraints currently adversely affecting the achievement of the Water and Sanitation MDGs in STLV. These include:
A. Technical
There is currently a general lack of knowledge amongst sector professionals, especially in Africa and Asia, of condominial water supplies and condominial (i.e., simplified) sewerage (and, indeed, of many other pro-poor interventions). Simplified sewerage has not been promoted as vigorously and as effectively as, for example, ecological sanitation, yet it has to be known much more widely if the poor in STLV are to receive improved water supplies and sanitation. (Condominial water supplies and sewerage are both very close in theory and design to conventional piped water supplies and conventional sewerage, so that, once they are understood, they should be readily embraced by design engineers.)
Many, if not most, national water supply and sewerage design codes do not currently permit the adoption of condominial water supplies and sewerage. Even in the case of India, where the national sewerage code at least mentions both simplified and settled sewerage (as ‘shallow’ and ‘small bore’ sewerage, respectively), so little detail is given that these options are in practice ignored (both these technologies are covered in just 7 pages, whereas over 100 pages are devoted to conventional sewerage) (Ministry of Urban Development, 1993).
B. Financial
Too little money is budgeted for water supply and sanitation improvements in STLV by national, provincial/state and local governments. (Yet there is plenty of money in the world − see Feachem, 2004).
National financial systems are not geared to support the poor (see Basu, 2005, for a review of the situation in India). A notable exception is the Grameen Bank in Bangladesh and its replicates in other countries (www.grameen-info.org). Varley (1995) discusses household credit for water supplies ans sanitation.
Current water supply and sanitation/sewerage tariffs are often structured in a way that disadvantages the poor.
C. Institutional
STLV are, essentially by definition, too small to be able to employ design engineers of their own and they are unable to judge whether any consultants they might engage are sufficiently
22
knowledgeable about water supply and sanitation improvements in STLV; nor are they able to be critical of, or even understand in detail, any consultant’s recommendations.
Poor governance, combined with an absence of explicitly pro-poor policies, often excludes poor and very poor households from water supply and sanitation improvement projects.
The lack of planning at local level often means that one year’s budget allocation remains largely untouched until just before the end of the financial year, with the consequence that it is seldom spent wisely, and often not on pro-poor projects as these are commonly felt to be too ‘difficult’ to design and implement in a short time period.
23
5 Recommendations
Condominial water supply and sewerage schemes need to be disseminated widely at “grass roots” level, so that local design engineers understand, and have the confidence to implement, them. National design codes need to be altered to permit their use (however, code change is a lengthy business, even in industrialized countries; an initial first step would be to permit their use for demonstrational purposes).
Local research needs to be undertaken to develop condominial models best suited to local conditions − for example, condominial yard-tap supplies or condominial standpipes, and operation and maintenance responsibilities for the in-condominium networks. Socially and financially appropriate water and sewerage tariff structures need to be developed locally. (Alternatively, several regional models could be developed, from which local design engineers and communities could select the one most suited to their needs.)
In all STLV sanitation programmes it should be ascertained whether condominial sewerage is cheaper than on-site systems (i.e., to determine a local version of Figure 3.1). If it is not, then on-site systems should be used.
Microcredit facilities need to be developed locally (ideally under the aegis of the local water and sewerage/sanitation authority) so that credit can be provided to householders to permit them to install their in-condominium networks for water and sewerage, or construct their on-site sanitation systems.
Aggregation of neighbouring STLV into a single operating water and sanitation/sewerage authority should always be investigated as it has the advantage of economy of scale, especially for design engineers and the operational staff of the authority.

24
25
References
ABNT (1986). Projeto de Redes Coletoras de Esgoto Sanitário. Rio de Janeiro: Associação Brasileira de Normas Técnicas.
Anon. (2004). Lessons and Experiences from the Ethekwini Pilot Shallow Sewer Study: Executive Sum-mary. Medmenham: Foundation for Water Research.
Basu, P. (2005). A financial system for India’s poor. Economic and Political Weekly 40 (37), 4008−4012.
Brandberg, B. (1996). New Strategies for Community-based Sustainable Sanitation Programmes Using SanPlats and the New SanPlat Moulds, revised edition. Mbabane, Swaziland: SBI Consulting and Sup-plies.
Brocklehurst, C. (2001). Durban Metro Water: Private Sector Partnerships to Serve the Poor. Washing-ton, DC: Water and Sanitation Program.
Cairncross, S. and Feachem, R. (1993). Environmental Health Engineering in the Tropics: An Introduc-tory Text, 2nd ed. Chichester: John Wiley & Sons.
Canelli, N. (2001). El Alto Condominial Pilot Project Impact Assessment: A Summary. Washington, DC: Water and Sanitation Program.
Carroll, R. F. (1989). Mechanised Emptying of Pit Latrines (Overseas Building Note No. 193). Watford: Building Research Establishment.
Colebrook, C. F. (1939). Turbulent flow in pipes, with particular reference to the transition between the smooth and rough pipe laws. Journal of the Institution of Civil Engineers 11, 133−156.
Colin, J. and Lockwood, H. (2002). Making Innovation Work through Partnerships in Water and Sanita-tion Projects. London: Water and Sanitation Cluster, Business Partners for Development.
de Andrade Neto, C. O. (1985). Uma solução eficaz e de baixo custo para o esgotamento sanitário urbano. Engenharia Sanitária 24 (2), 239−241.
de Melo, J. C. (1985). Sistemas condominiais de esgotos. Engenharia Sanitária 24 (2), 237−238.
DGSB (2001). Instalaciones Sanitarias: Alcantarillado Sanitario, Pluvial y Tratamiento de Aguas Residu-ales (Norma Boliviana NB 688). La Paz: Dirección General de Saneamiento Básico.
Drangert, J-O. (1998). Fighting the urine blindness to provide more sanitation options. Water SA 24 (2), 157−164.
2�
DWAF (2002). Sanitation for a Healthy Nation: Sanitation Technology Options. Pretoria: Department of Water Affairs and Forestry.
ERM, Stephen Meyers Associates, Hydroconseil and Kingdom, W. D. (2005). Models of Aggregation for Water and Sanitation Provision (Water Supply & Sanitation Working Note No. 1). Washington, DC: World Bank.
Feachem, R. G. A. (2004). Financing global public health: innovation and investment. Public Health 118 (7), 477−479.
Feachem, R., Bradley, D., Garelick, H. and Mara, D. (1983). Sanitation and Disease: Health Aspects of Excreta and Wastewater Management. Chichester: John Wiley & Sons.
Foley, S., Soedjarwo, A. and Pollard, R. (2000). Of the People, by the People, for the People: Commu-nity-based Sewer Systems in Malang, Indonesia. Washington, DC: Water and Sanitation Program.
Galvis, G., Latorre, J. and Visscher, J. T. (1998). Multi-Stage Filtration: An Innovative Water Treatment Technology (Technical Paper No. 34). Delft: IRC International Water and Sanitation Centre.
Gauckler, P. (1867). Etudes théoriques et pratiques sur l’écoulement et le mouvement des eaux. Comptes Rendus Hebdomadaires des Séances de l’Académie des Sciences 64, 818−822.
Gauckler, P. (1868). Du mouvement de l’eau dans les conduites. Comptes Rendus Hebdomadaires des Séances de l’Académie des Sciences 65, 229−281.
Gleick, P. H. (1996). Basic water requirements for human activities: meeting basic needs. Water International 20 (2), 83−92.
Guimarães, A. S. P. (1986). Redes de Esgotos Simplificadas. Brasília: Ministério do Desenvolvimento Urbano e do Meio Ambiente.
Hinrichsen, D., Robey, B. and Upadhyay, U. D. (1998). Solutions for a Water-Short World (Population Reports, Series M, No. 14). Baltimore, MD: School of Public Health, Johns Hopkins University.
Jones, D. (2005). Why traditional approaches to on-site sanitation provision are failing poor house-holds. Paper presented at the 31st WEDC International Conference “Maximizing the Benefits from Water and Environmental Sanitation”, Munyonyo, Uganda, 31 October − 4 November.
Kalbermatten, J. M., Julius, D. S. and Gunnerson, C. G. (1982). Appropriate Sanitation. Alternatives: A Technical and Economic Appraisal. Baltimore, MD: Johns Hopkins University Press.
Kakumbi, G. M. (2005). Community-based and Simplified Sewerage: A Critical Com-parison of Design Procedures (MSc(Eng) dissertation). Leeds: School of Civil Engineering, University of Leeds.
Khan, A. H. (1996). Orangi Pilot Project: Reminiscences and Reflections. Karachi: Oxford University Press.
2�
Machado Neto, J. C. O. and Tsutiya, M. T. (1985). Tensão trativa: um critério econômico de esgoto. Revista DAE 45 (140), 73−87.
Manning, R. (1890). On the flow of water in open channels and pipes. Transactions of the Institution of Civil Engineers of Ireland 20, 161−207.
Mara, D. D. (1985a). The Design of Ventilated Improved Pit Latrines (TAG Technical Note No. 13). Washington, DC: World Bank.
Mara, D. D. (1985b). The Design of Pour-Flush Latrines (TAG Technical Note No. 15). Washington, DC: World Bank.
Mara, D. D. (1996). Low-cost Urban Sanitation. Chichester: John Wiley & Sons.
Mara, D. D. (1997). Design Manual for Waste Stabilization Ponds in India. Leeds: Lagoon Technology International.
Mara, D. D. (2004). Domestic Wastewater Treatment in Developing Countries. London: Earthscan Publications.
Mara, D. D. (2005). Rational water tariffs for poor and non-poor consumers in developing countries. Paper presented at the IWA International Conference on Water Economics, Statistics and Finance, Rethymno, Crete, 8−10 July.
Mara, D., Sleigh, A. and Tayler, K. (2001). PC-based Simplified Sewer Design. Leeds: School of Civil Engineering, University of Leeds.
Mara, D. D., Drangert, J-O, Nguyen, V. A., Tonderski, A., Gulyas, H. and Tonderski, K. (2005). Selection of sustainable sanitation arrangements. Water Policy (submitted).
McCann, B. (2005). The sanity of ecosan. Water21, April, pp. 28−30.
Melo, J. C. (2005). The Experience of Condominial Water and Sewerage Systems in Brazil: Case Stud-ies from Brasilia, Salvador and Parauapebas. Lima: Water and Sanitation Program Latin America.
Metcalf and Eddy, Inc. (1986). Wastewater Engineering: Collection and Pumping of Wastewater. New York, NY: McGraw-Hill.
Middleton, R. N. (2000). Personal communication (Kalbermatten Associates Inc., Washington, DC).
Ministry of Urban Development (1993). Manual on Sewerage and Sewage Treatment, 2nd ed. New Delhi: Government of India Press.
Morgan, P. R. and Mara, D. D. (1982). Ventilated Improved Pit Latrines: Recent Developments in Zimbabwe (World Bank Technical Paper No. 3). Washington, DC: The World Bank.
2�
Nosaic, D. (2002). Water quantity and quality. In Small Community Water Supplies: Technology, People and Partnership (Technical Paper No. 40) (ed. Smet, J. and van Wijk, C), pp. 62−77. Delft: IRC Interna-tional Water and Sanitation Centre.
Otis, R. J. and Mara, D. D. (1985). The Design of Small Bore Sewer Systems (TAG Technical Note No. 14). Washington, DC: World Bank.
Otterpohl, R. (2001). Black, brown, yellow, grey − the new colours of sanitation. Water21, October, 37−41.
Pathak, B. (1991). Road to Freedom: A Sociological Study on the Abolition of Scavenging in India. Delhi: Motilal Banarsidass Publishers Pvt Ltd.
Pathak, B. (1999). Sanitation is the key to healthy cities − A profile of Sulabh International. Environ-ment and Urbanization 11 (1), 221−229.
Parikh, H., Surkar, D. and Zanders, M. O. (2002). Sustainable infrastructure development for slums and villages. In Proceedings of the 28th WEDC Conference “Sustainable Environmental Sanitation and Water Services” (ed. B. Reed). Loughborough: WEDC, University of Loughborough.
Planning Commission, Government of India (2002). Civic amenities in urban areas. In Tenth Five Year Plan 2002−2007, vol. 2, section 6.2, pp. 633−659. New Delhi: Government of India Press.
Rooker, T. M. (2001). The Application of the Condominial System to Water Supply in Parauapebas, Brazil (MSc(Eng) dissertation). Leeds: School of Civil Engineering, University of Leeds.
Roy, A. K., Chatterjee, P. K., Gupta, K. N., Khare, S. T., Rau, B. B. & Singh, R. S. (1984). Manual on the Design, Construction and Maintenance of Low-cost Pour-flush Waterseal Latrines (TAG Technical Note No. 10). Washington, DC: World Bank.
Singh, S. P. (2000). Sulabh Sanitation Movement: Vision 2000 Plus, 2nd ed. New Delhi, India: Sulabh International Social Service Organisation.
Sinnatamby, G. S. (1986). The Design of Shallow Sewer Systems. Nairobi: United Nations Centre for Human Settlements.
Sinnatamby G. S., McGarry M. G. and Mara D. D. (1985). Sewerage: shallow systems offer hope to slums. World Water 9 (1), 39−41.
Sarmento, V. (2001). Low-cost Sanitation Improvements in Poor Communities: Conditions for Physical Sustainability (PhD thesis). Leeds: University of Leeds.
UN-Habitat (2003). Water and Sanitation in the World’s Cities: Local Action for Global Goals. London: Earthscan Publications.
United Nations (2000). World Population Nearing 6 Billion Projected Close to 9 Billion by 2050. New York, NY: Population Division, Department of Economic and Social Affairs, United Nations.
29
United Nations (2004). Local Government Action on Water, Sanitation, and Human Settlements: Case Summaries (Background Paper No. 5 presented at the 12th Session of the Commission on Sustain-able Development, New York, 14−30 April). New York, NY: Department of Economic and Social Affairs, United Nations.
US EPA (2000). Small Diameter Gravity Sewers (Decentralized Technologies Fact Sheet No. EPA 832-F-00-0368). Washington, DC: US Environmental Protection Agency.
Water and Sanitation Program (2005). Alternative Technologies for Water Supply and Sanitation in Small Towns. Lima: Latin America and Caribbean Regional Office, Water and Sanitation Program.
WRC (2005). Shallow Sewer Project: Ethekwini Pilot Project (Media release, 15 April). Pretoria: Water Research Commission.
WHO and UNICEF (2000). Global Water Supply and Sanitation Assessment Report 2000. Geneva: World Health Organization.
WHO and UNICEF (2004). Meeting the MDG Drinking Water and Sanitation Target: A Mid-term Assess-ment of Progress. Geneva: World Health Organization.
Winblad, U. and Simpson-Hébert, M. (2004). Ecological Sanitation, 2nd ed. Stockholm: Stockholm Environment Institute.
Varley, R. C. G. (1995). Financial Services and Environmental Health: Household Credit for Water and Sanitation (Applied Study No. 2). Arlington, VA: Environmental Health Project.
van Nostrand, J. and Wilson, J. G. (1983). The Ventilated Improved Double Pit Latrine: A Construction Manual for Botswana (TAG technical Note No. 3). Washington, DC: World Bank.
Zaidi A. (2001). From the Lane to the City: The Impact of the Orangi Pilot Project’s Low Cost Sanitation Model. London: WaterAid.
Note: historical foreign exchange rates were obtained from: www.oanda.com/convert/fxhistory

30

United Nations Human Settlements Programme (UN-HABITAT)P.O. Box 30030, GPO Nairobi 00100, Kenya
Tel: 254 20 7623 120Fax: 254 20 7624 266/7 (Central Office)
E-mail: [email protected]: http://www.unhabitat.org
Recommended