Water Supply and Sanitation in Lao PDRTurning Finance into Services for the Future
November 2014Service Delivery Assessment
This report is the product of extensive collaboration and information sharing between many government agencies at national and provincial level as well as development partners. A core team drawn from the Ministry of Health (Department of Hygiene and Health Promotion, Department of Planning and Finance, National Center for Environmental Health and Water Supply) and Ministry of Public Works and Transport (Department of Housing and Urban Planning, Department of Finance, Water Supply Regulatory Office) have been key partners with the Water and Sanitation Program (WSP) in analyzing the sector. The authors acknowledge the valuable contributions made by Department of Planning and Investment, Ministry of Planning and Investment, WHO, UNICEF, Plan International, JICA, UN-Habitat, SNV, AFD, Lao Red Cross, Care International in Lao PDR, Health Poverty Action, Helvetas, Nam Theun 2, CAWST, Child Fund and World Bank.
The Task Team Leader for the Service Delivery Assessment in East Asia and Pacific is Susanna Smets. The following World Bank staff and consultants have provided valuable contributions to the service delivery assessment process and report: Jeremy Colin, Sandra Giltner, Viengsamay Vongkhamsao, Bounthavong Sourisak, Viengsompasong Inthavong, Almud Weitz and WSP support staff.
The following World Bank staff and sector colleagues peer reviewed the report: William Rex, Lead Water Resources Spe-cialist, Ingo Wiederhofer, Senior Operations Officer, Thea Bongertman, WASH Sector Leader, SNV Lao PDR, and John Mc-Gown, Sr. WASH Advisor Plan International, Lao PDR.
WSP’s Scaling Up Rural Sanitation is working with governments and the local private sector to develop the knowledge needed to scale up rural sanitation for the poor. The programmatic approach combines Community-Led Total Sanitation (CLTS), be-havior change communication, and sanitation marketing to generate sanitation demand and build up the supply of sanitation products and services at scale. In addition, WSP works with local and national governments and the local private sector to strengthen the enabling environment—including institutional, regulatory, financial, service-delivery, and monitoring capacities—to achieve change that is sustainable. Starting in India, Indonesia, and Tanzania in 2006, Scaling Up Rural Sanitation is currently being implemented in more than a dozen countries. For more information, please visit www.wsp.org/scalingupsanitation.
This Working Paper is one in a series of knowledge products designed to showcase project findings, assessments, and les-sons learned in the Global Scaling Up Sanitation Project. This paper is conceived as a work in progress to encourage the exchange of ideas about development issues. For more information please email [email protected] or visit www.wsp.org.
The Water and Sanitation Program is a multi-donor partnership, part of the World Bank Group’s Water Global Practice, sup-porting poor people in obtaining affordable, safe, and sustainable access to water and sanitation services. WSP’s donors include Australia, Austria, Denmark, Finland, France, the Bill & Melinda Gates Foundation, Luxembourg, Netherlands, Nor-way, Sweden, Switzerland, United Kingdom, United States, and the World Bank.
WSP reports are published to communicate the results of WSP’s work to the development community. Some sources cited may be informal documents that are not readily available.
The findings, interpretations, and conclusions expressed herein are entirely those of the author and should not be attributed to the World Bank or its affiliated organizations, or to members of the Board of Executive Directors of the World Bank or the governments they represent. The World Bank does not guarantee the accuracy of the data included in this work. The bound-aries, colors, denominations, and other information shown on any map in this work do not imply any judgment on the part of the World Bank Group concerning the legal status of any territory or the endorsement or acceptance of such boundaries.The material in this publication is copyrighted. Requests for permission to reproduce portions of it should be sent to [email protected]. WSP encourages the dissemination of its work and will normally grant permission promptly. For more information, please visit www.wsp.org.
© 2015 International Bank for Reconstruction and Development / The World Bank
Water Supply and Sanitation in Lao PDR
Turning Finance into Services for the Future
Water Supply and Sanitation in Lao PDRiv
Lao PDR has met the Millennium Development Goal (MDG) targets for both water supply and sanitation according to UNICEF/WHO Joint Monitoring Programme (JMP). How-ever, national access remains low compared to other coun-tries in the region and today there are still 1.9 million people without access to improved water supply and 2.4 million without access to improved sanitation.1 The problem is es-pecially acute in rural areas, with large inequalities in access between areas that are close to good roads and remote, inaccessible locations.
The Government of Lao PDR has adopted targets more am-bitious than the MDGs as part of its commitment that the country will graduate from Least Developed Country status by 2020. The sector targets will not be achieved, however, without a concerted and coordinated multi-stakeholder ef-fort and increased funding for the sector – particularly for rural water supply and sanitation. For this to happen, water, sanitation and hygiene (WASH) needs a higher profile within the national development strategy.
Inadequate water and sanitation services have negative im-pacts not only on public health but also on the economy. A 2009 study2 by WSP estimated that poor sanitation and hygiene alone imposed a cost on the country equivalent to 5.6% of Gross Domestic Product. Universal access to improved water supplies and sanitation, together with the adoption of key hygiene behaviors, could deliver significant benefits to the country both in terms of health (including a reduction in diarrhea, malnutrition and stunting and in as-sociated health care costs) and increased productivity (re-duced collection time for water, less school and working days lost through ill health).
Strategic Overview
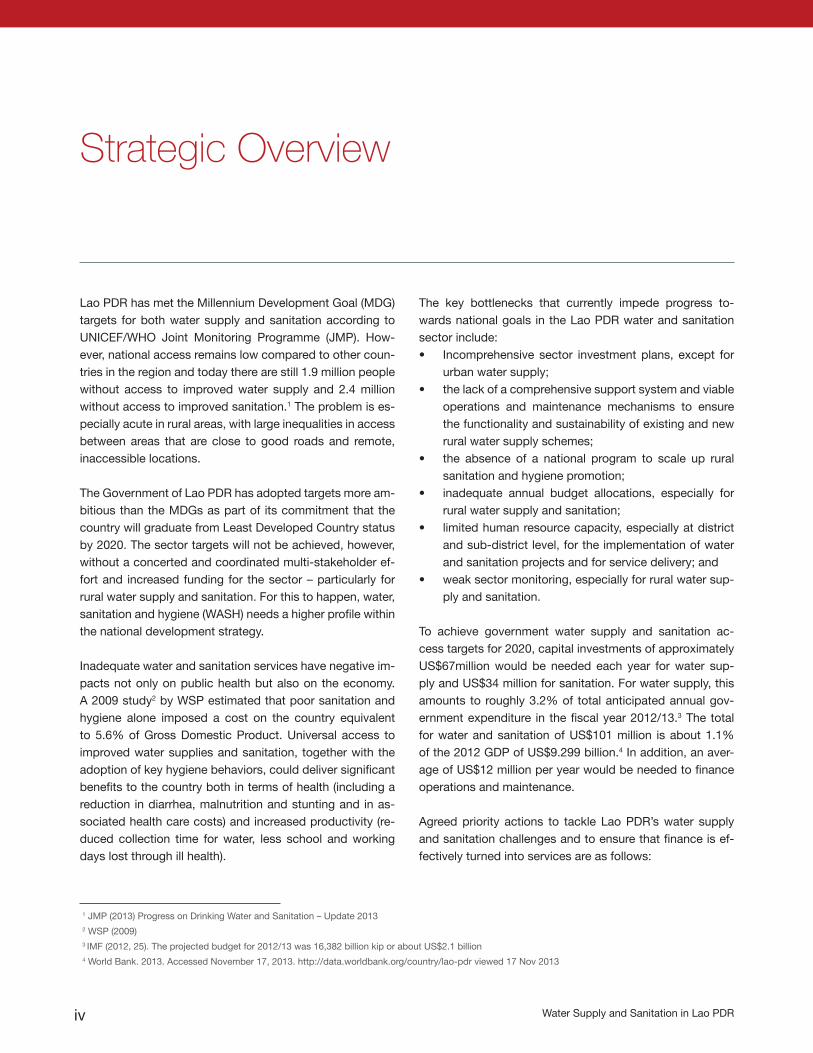
The key bottlenecks that currently impede progress to-wards national goals in the Lao PDR water and sanitation sector include:• Incomprehensive sector investment plans, except for
urban water supply; • the lack of a comprehensive support system and viable
operations and maintenance mechanisms to ensure the functionality and sustainability of existing and new rural water supply schemes;
• the absence of a national program to scale up rural sanitation and hygiene promotion;
• inadequate annual budget allocations, especially for rural water supply and sanitation;
• limited human resource capacity, especially at district and sub-district level, for the implementation of water and sanitation projects and for service delivery; and
• weak sector monitoring, especially for rural water sup-ply and sanitation.
To achieve government water supply and sanitation ac-cess targets for 2020, capital investments of approximately US$67million would be needed each year for water sup-ply and US$34 million for sanitation. For water supply, this amounts to roughly 3.2% of total anticipated annual gov-ernment expenditure in the fiscal year 2012/13.3 The total for water and sanitation of US$101 million is about 1.1% of the 2012 GDP of US$9.299 billion.4 In addition, an aver-age of US$12 million per year would be needed to finance operations and maintenance.
Agreed priority actions to tackle Lao PDR’s water supply and sanitation challenges and to ensure that finance is ef-fectively turned into services are as follows:
1 JMP (2013) Progress on Drinking Water and Sanitation – Update 2013
2 WSP (2009)
3 IMF (2012, 25). The projected budget for 2012/13 was 16,382 billion kip or about US$2.1 billion
4 World Bank. 2013. Accessed November 17, 2013. http://data.worldbank.org/country/lao-pdr viewed 17 Nov 2013
Service Delivery Assessment v
Sector-wide
• Identify funding sources for implementation of the Water Supply Sector Investment Plan 2012-2020 (for the urban sub-sector) and the National Plan of Action for Rural Water Supply, Sanitation and Hygiene.
• Strengthen sector monitoring and government-donor coordination through Joint Annual Sector Reviews (for urban and rural). These would focus on key indicators relating to sector goals; equity in the allocation of sector funding; the effective-ness of implementation processes; outcomes achieved including the quality and functionality of facilities and services.
• Establish a formally recognized sub-Technical Working Group on WASH, to allow for high level coordination between government and development partners, under the Health TWG.
• As part of sector investment plans, introduce consolidated monitoring of sub-sector funding from multiple sources, both government and external, including creating a dedicated budget line for WASH in the national budget.
• Develop an overarching WASH policy for both urban and rural areas and include a budget line for WASH in national budget.
Rural Water Supply
• Develop National Centre for Environmental Health and Water Supply (Nam Saat) capacity to implement the National Ac-tion Plan for Rural Water Supply, Sanitation and Hygiene by increasing staffing at district level and providing customized technical and capacity building support.
• Develop and test strategies to improve the sustainability of existing rural water supply schemes (for example, by profes-sionalizing management and providing technical support to operators).
• Address inequalities by prioritizing investments and service delivery to underserved poor and remote communities.
Urban Water Supply
• Create incentives and obligations for water utilities to improve services by increasing their operational and financial au-tonomy; strengthening regulation and monitoring (including the use of performance contracts); and allowing tariffs to reach commercially viable levels.
• Create a more enabling environment for utilities to access private sector finance (for example, by providing government guarantees).
• Invest in capacity building of utility staff including support to the formulation and implementation of business plans.
Rural Sanitation and Hygiene
• Develop a national rural sanitation and hygiene program based on tested operational approaches, with clear implementa-tion guidelines, a financing strategy, human resource and monitoring frameworks to scale up rural sanitation.
• Urgently increase Nam Saat operational funding and district-level staffing to enable their active engagement in sanitation and hygiene promotion at scale.
• Improve access to affordable and desirable latrines by encouraging private sector involvement in developing the sanita-tion market.
• Develop and test incentives and delivery mechanisms to better reach poor and remote under-served communities.
Urban Sanitation and Hygiene
• Clarify institutional roles and responsibilities relating to the management of urban wastewater and on-site sanitation facili-ties.
• Identify funding for a Wastewater Management Strategy and Investment plan to complement the Urban Water Supply Strategy, under the 2013-2020 Strategic Framework for the Water and Sanitation Sector.
• Develop and test operational approaches for improved fecal sludge management (including collection, transport, treat-ment and disposal).
• Build capacity for implementation of the wastewater management strategy.
Water Supply and Sanitation in Lao PDRvi
Contents
Acknowledgment ..................................................................................................................................................................iiStrategic Overview .............................................................................................................................................................ivContents .............................................................................................................................................................................viAcronyms and Abbreviations ............................................................................................................................................. vii
1. Introduction .................................................................................................................................................................. 12. Sector Overview: Coverage and Finance Trends ......................................................................................................... 33. Reform Context .......................................................................................................................................................... 104. Institutional Framework .............................................................................................................................................. 135. Financing and Its Implementation .............................................................................................................................. 176. Sector Monitoring and Evaluation .............................................................................................................................. 217. Subsector: Rural Water Supply .................................................................................................................................. 238. Subsector: Urban Water Supply ................................................................................................................................ 269. Subsector: Rural Sanitation and Hygiene .................................................................................................................. 2910. Subsector: Urban Sanitation and Hygiene ................................................................................................................. 3211. Conclusion ................................................................................................................................................................. 35
Annex 1: Scorecard and Evidence for Scoring ................................................................................................................. 41Annex 2: Assumptions and Inputs for Costing Model ....................................................................................................... 61
Service Delivery Assessment vii
ADB Asian Development BankDFAT Department for Aid and Trade of the Australian GovernmentBORDA Bremen Overseas Research and Development AssociationCLTS Community-Led Total Sanitation DEWATS Decentralized Wastewater Treatment SystemDHUP Department of Housing and Urban Planning GDP Gross Domestic ProductJICA Japan International Cooperation AgencyJMP UNICEF/WHO Joint Monitoring ProgrammeLSB Lao Statistics BureauLSIS Lao Social Indicators SurveyMDG Millennium Development GoalMICS Multiple Indicator Cluster SurveyMIREP Mini Reseaux d’Eau Potable (Small Piped Water Systems)MOF Ministry of FinanceMOH Ministry of HealthMOH-DHHP Ministry of Health – Department of Hygiene and Health PromotionMPI Ministry of Planning and Investment MPWT Ministry of Public Works and Transport MPWT-DHUP Ministry of Public Works and Transport – Department of Housing and Urban PlanningNEDA Neighbouring Countries Development Co-operation Agency (Thai aid) NGO Non-governmental Organization NGPES National Growth and Poverty Eradication Strategy NPSE Nam Papa State EnterpriseNSEDP National Socio-Economic Development PlanPDR People’s Democratic RepublicPEFA Public Expenditure and Financial Accountability PIP Project Investment ProgramPM Prime MinisterPRF Poverty Reduction FundSDC Swiss Development CooperationSDA Service Delivery Assessment SNV Netherlands Development OrganizationSIP Sector Investment Plan UDAA Urban Development Administration AuthorityVUDAA Vientiane Urban Development Administration AuthorityWASH Water, Sanitation and Hygiene WASRO Water Supply Regulation OfficeWSP World Bank - Water and Sanitation Program WSRC Water Supply Regulatory Committee
Acronyms and Abbreviations

Service Delivery Assessment 1
1. Introduction
Water and Sanitation Service Delivery Assessments (SDAs) are taking place in seven countries in the East Asia and the Pacific region under the guidance of the World Bank’s Wa-ter and Sanitation Program (WSP) and local partners. This regional work, implemented through a country-led process, draws on experience of water and sanitation SDAs conduct-ed in more than 40 countries in Africa, Latin America and South Asia.5
The SDA analysis has three main components: a review of past water and sanitation coverage, a costing model to assess the adequacy of future investments, and a score-card that allows diagnosis of bottlenecks along the service delivery pathway. SDA’s contribution is to answer not only whether past trends and future finance are sufficient to meet sector targets for infrastructure and hardware but also what specific issues need to be addressed to ensure that finance is effectively turned into accelerated and sustainable wa-ter supply and sanitation service delivery. Bottlenecks can in fact occur throughout the service delivery pathway—all the institutions, processes, and actors that translate sec-tor funding into sustainable services. Where the pathway is well developed, sector funding should turn into services at the estimated unit costs. Where the pathway is not well developed, investment requirements may be gross under-estimates because additional investment may be needed to ‘unblock’ the bottlenecks in the pathway.
The scorecard looks at nine building blocks of the service de-livery pathway, which correspond to specific functions classi-fied in three categories: three functions that refer to enabling conditions for putting services in place (policy development, planning new undertakings, budgeting), three actions that re-late to developing the service (expenditure of funds, equity in the use of these funds, service output), and three functions that relate to sustaining these services (facility maintenance, expansion of infrastructure, use of the service). Each building
block is assessed against specific indicators and is scored from 0 to 3 accordingly. The scorecard uses a simple color code to indicate building blocks that are largely in place, act-ing as a driver for service delivery (score >2, green); building blocks that are a drag on service delivery and that require at-tention (score 1–2, yellow); and building blocks that are inad-equate, constituting a barrier to service delivery and a priority for reform (score <1, red).
The SDA analysis relies on an intensive, facilitated consulta-tion process, with government ownership and self-assess-ment at its core. Through the SDA process, an evidence-based analysis has been conducted to better understand what undermines progress in water supply and sanitation and what the Government of Lao PDR can do to accelerate progress. A series of meetings and urban and rural sub-sector workshops with government and external support agencies from mid-2012 to mid-2013, together with re-views of available data, budgets and reports, has provided the information on which the analysis in this report is based. Sources of evidence are referenced at the end of this report and in the annexes. The analysis aims to help the Government of Lao PDR as-sess how it can strengthen pathways for turning finance into water supply and sanitation services in each of four sub-sectors. Specific priority actions were identified through consultation with government and other sector stakehold-ers and confirmed in a workshop with government decision makers and other sector stakeholders in April 2013. This report evaluates the service delivery pathway in its entirety, locating the bottlenecks and presenting the agreed priority actions to help address them.
The Water and Sanitation Program, in collaboration with the Government of Lao PDR, development partners and interna-tional NGOs active in the sector, produced this SDA report.
5 Further information is available at www.wsp.org/content/pathways-progress-status-water-and-sanitation-africa
Water Supply and Sanitation in Lao PDR2
XAYABULY
OUDOMXAYHUAPHANH
BOKEO
PHONGSALI
SEKONG
ATTAPEU
XIENGKHUANG
LUANGPRABANG
LUANGNAMTHA
VIENTIANE
SAVANNAKHET
CHAMPASAK
KHAMMUANE
BORIKHAMXAY
SARAVANE
Vangviang
Ban Na Phan
Xiangkho
Gnot-Ou
Phokhoun
Samouay
Xaisomboun
Viangxai
PaklayKhamkeut
Meung
Xebangfai
Pakbeng
Nambak
Xanakham
Boun-Nua
Khong
MuangKhoa
Kasi
Xéno
Khongxedon
Ban Nalé
Pakxong
Kham
Phin
Nan
Xepon
Sanamxai
Pakxe
Thakhek
Luangprabang
Lamam
Samakhixai
PekXayabuly
Xai
Kaysone
Saravane
Luangnamtha
Phongsali
Viangkham
Xam-NeuaHouyxay
Pakxan
VIENTIANE
PREFECTURE OFVIENTIANE MUN.
C H I N A
VIETNAMMYANMAR
THAILAND
CAMBODIA
XAYABULY
OUDOMXAYHUAPHANH
BOKEO
PHONGSALI
SEKONG
ATTAPEU
XIENGKHUANG
LUANGPRABANG
LUANGNAMTHA
VIENTIANE
PREFECTURE OFVIENTIANE MUN.
SAVANNAKHET
CHAMPASAK
KHAMMUANE
BORIKHAMXAY
SARAVANE
Vangviang
Ban Na Phan
Xiangkho
Gnot-Ou
Phokhoun
Samouay
Xaisomboun
Viangxai
PaklayKhamkeut
Meung
Xebangfai
Pakbeng
Nambak
Xanakham
Boun-Nua
Khong
MuangKhoa
Kasi
Xéno
Khongxedon
Ban Nalé
Pakxong
Kham
Phin
Nan
Xepon
Sanamxai
Pakxe
Thakhek
Luangprabang
Lamam
Samakhixai
PekXayabuly
Xai
Kaysone
Saravane
Luangnamtha
Phongsali
Viangkham
Xam-NeuaHouyxay
Pakxan
VIENTIANE
C H I N A
VIETNAMMYANMAR
THAILAND
CAMBODIA
Kading
Don
Ta
Mek
ong
Ou
Ou
Xe Bangfai
Beng
Noy
M
ekon
g
Se Banghiong
Mekong
Gulf ofTonkin
Nam NgumReservoir
To Khon Kaen
To C
hian
g Ra
i
To Hanoi
To Khon Kaen
To Ubon
Ratchathani
To Lincang
To Vinh
To Gejiu
To Qui Nhon
To Daluo
P lain of Jars
Cammon Plateau
BolovensPlateau
Xiangkhoang Plateau
Phou Bia(2,817 m)
22°N
104°E 106°E
16°N
18°N 18°N
20°N
16°N
100°E
14°N
108°E104°E
22°N
102°E 106°E
14N
LAO P.D.R.
0
75
50
0 25 50 100 Miles
100 Kilometers
IBRD 33431R1
OCTOBER 2013
CITIES AND TOWNS
PROVINCE CAPITALS
NATIONAL CAPITAL
RIVERS
MAIN ROADS
RAILROADS
PROVINCE BOUNDARIES
INTERNATIONAL BOUNDARIES
LAO PEOPLE'SDEMOCRATIC
REPUBLIC
This map was produced by the Map Design Unit of The World Bank. The boundaries, colors, denominations and any other informationshown on this map do not imply, on the part of The World BankGroup, any judgment on the legal status of any territory, or anyendorsement or acceptance of such boundaries.
Service Delivery Assessment 3
Coverage: Assessing Past Progress
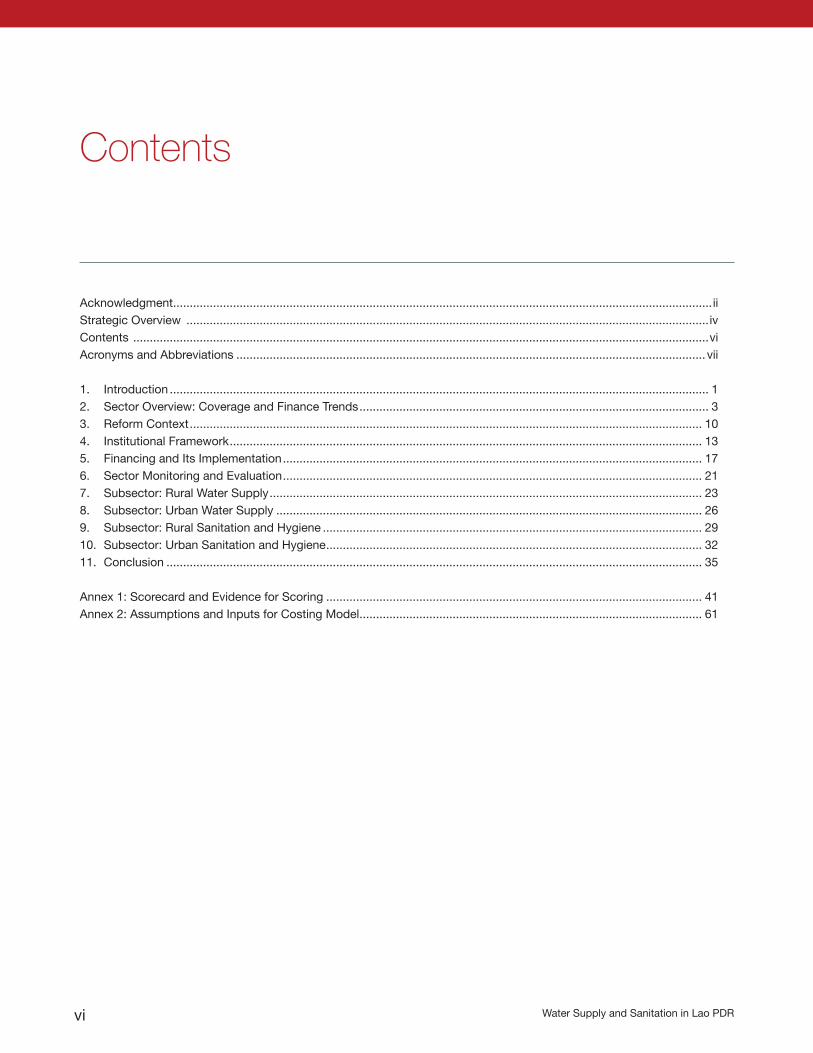
The population of Lao PDR in 2010 was estimated to be 6.3 million, of which 4.5 million (71%) lived in rural areas and 1.8 million (29%) in urban areas.6
The country has experienced significant economic progress in recent years, with GDP growth averaging 7% per annum over the last decade7 and reaching 8.2% in 2012.8 It is now a lower-middle income country with an aspiration to gradu-ate from least developed country status by 2020 and join the ranks of middle-income countries. Government data indicate that economic growth has been accompanied by a drop in poverty, with the headcount falling from 33.5% in 2002/3 to 28% in 2008,9 based on a nationally-defined pov-erty line, and aiming to reach 24% by 2015 as per the MDG.
Recent improvements in infrastructure and communications have delivered important benefits, especially to the rural population, which makes up 70% of the national total. The country nevertheless remains very poor in comparison to regional neighbours, and the benefits of economic develop-ment are not equally spread across the country. Urban areas and districts along the Thai border (where the five largest ur-ban centers are located) have experienced rapid growth and
2. Sector Overview: Coverage and Finance Trends
poverty reduction, but other areas continue to lag behind: the northern part of the country remains poorer than the south-ern and central regions, as do upland areas in comparison to lowlands. The urban-rural balance is also shifting, with small towns (which currently account for 13% of the population) growing at a rate of 4% to 5% per annum as compared to the national average of 2.5%.10
Poverty rates also vary according to ethnicity, with the Lao-Tai displaying lower poverty incidence. Although gov-ernment support has been targeted at the poorest groups and regions, these have benefitted less from the process of economic development, and lack of access to infrastruc-ture and markets remain barriers to growth and poverty re-duction.11
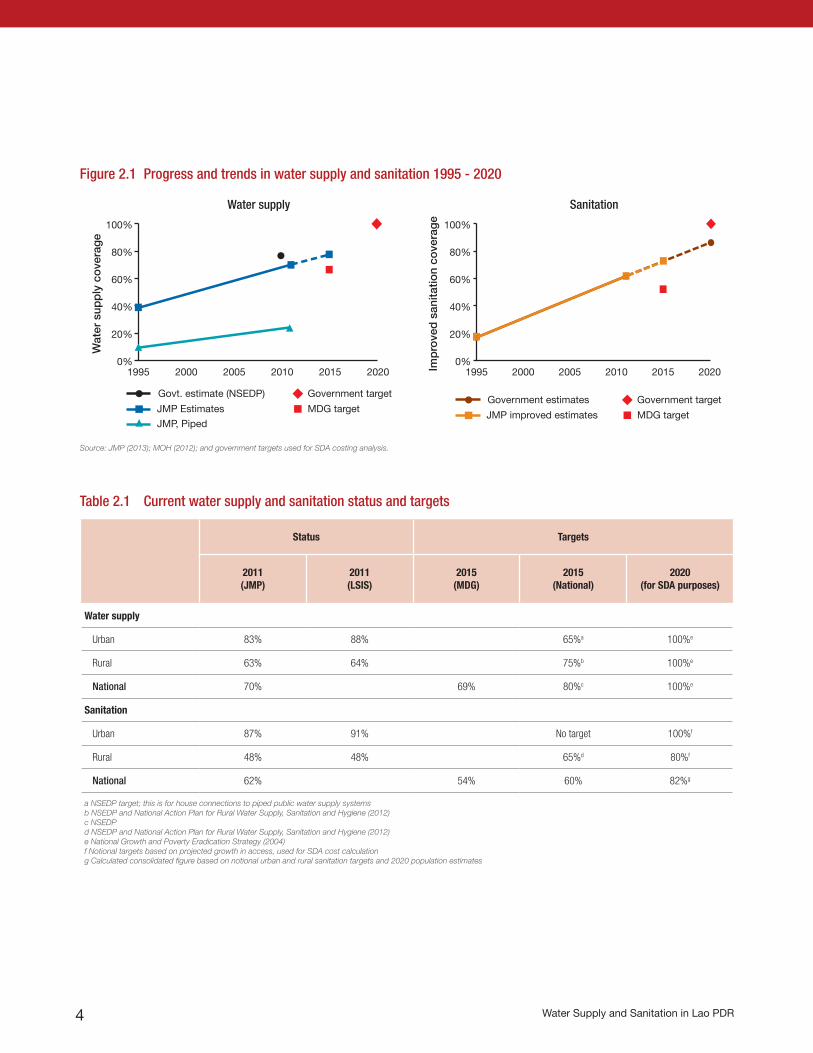
The Millennium Development Goal (MDG) targets for Lao PDR include providing 69% of the total population with ac-cess to an improved drinking water source and 54% with access to improved sanitation by 2015. Latest JMP figures indicate that both the water- and sanitation-related MDG targets have already been reached. However, the national NSEDP 2015 targets for water supply will likely not be met, while for sanitation this has been met due to high access in urban area (see table 2.1).
6 Source: Annex 2, Table A2.1. Based on government figures stated in the Seventh National Socio-Economic Development Plan 2011-2015 (NSEDP). 7IMF (2011) 8 World Bank. 2013. “Country Dashboard - Lao PDR”. Accessed December 15, 2013. http://povertydata.worldbank.org/poverty/country/LAO 9 National Statistics Center. 2013. Accessed November 10, 2013. http://www.nsc.gov.la/index.php?option=com_content&view=article&id=55&Itemid=80 10 World Bank (2010a) 11 ibid
Water Supply and Sanitation in Lao PDR4
Table 2.1 Current water supply and sanitation status and targets
Status Targets
2011(JMP)
2011(LSIS)
2015(MDG)
2015(National)
2020(for SDA purposes)
Water supply
Urban 83% 88% 65%a 100%e
Rural 63% 64% 75%b 100%e
National 70% 69% 80%c 100%e
Sanitation
Urban 87% 91% No target 100%f
Rural 48% 48% 65%d 80%f
National 62% 54% 60% 82%g
a NSEDP target; this is for house connections to piped public water supply systems b NSEDP and National Action Plan for Rural Water Supply, Sanitation and Hygiene (2012) c NSEDP d NSEDP and National Action Plan for Rural Water Supply, Sanitation and Hygiene (2012) e National Growth and Poverty Eradication Strategy (2004) f Notional targets based on projected growth in access, used for SDA cost calculationg Calculated consolidated figure based on notional urban and rural sanitation targets and 2020 population estimates
Figure 2.1 Progress and trends in water supply and sanitation 1995 - 2020
0%
20%
40%
60%
80%
100%
1995 2000 2005 2010 2015 2020
Wat
er s
upp
ly c
ove
rag
e
Govt. estimate (NSEDP) Government target
JMP Estimates MDG target
JMP, Piped
Water supply
0%
20%
40%
60%
80%
100%
1995 2000 2005 2010Imp
rove
d s
anita
tion
cove
rag
e
2015 2020
Government estimates Government target
JMP improved estimates MDG target
Sanitation
Source: JMP (2013); MOH (2012); and government targets used for SDA costing analysis.
Service Delivery Assessment 5
Much of the progress in sanitation has resulted from the initiative of households who have installed facilities at their own expense, since government and external support in this area has been modest over the last ten years.12 For water supply, however, there have been substantial invest-ments in urban areas and many rural projects, though most of these have been on a fairly small scale, projects funded via the Poverty Reduction Fund being the exception.
This level of progress is encouraging, but it should be borne in mind that in rural areas where two-thirds of the population live, 1995 baseline figures were very low, so that meeting both MDG targets still leaves 31% of the total population without access to improved water supply and 46% without access to improved sanitation. Recognizing this, govern-ment has adopted more ambitious 2015 targets for urban water supply and for rural water supply and sanitation, via the National Socio-Economic Development Plan (NSEDP) 2011-2015 and National Action Plan for Rural Water Sup-ply, Sanitation and Hygiene (2011-15). So far, however, no targets have been formulated for urban sanitation.
For 2020 (the target year used in the SDA financial model) the National Growth and Poverty Eradication Strategy (NG-PES) envisages 100% access to safe water nationwide, and while there is no national target for sanitation, a target of 82% was calculated based on projected growth in access in urban (100%) and rural areas (80%); see Table 2.1. Fur-ther details on the assumptions used in the SDA financial model are provided in Annex Two.
National coverage data also disguise significant disparities in access between locations and wealth quintiles. The 2011 Lao Social Indicators Survey (LSIS), for example, found that the use of improved drinking water sources stood at 66.5% in rural areas with road access, but only 42% in rural areas without a road. Similarly, the use of improved sanitation fa-
cilities was 51.2% in rural areas with road access and just 22.6% in those without. In terms of access across wealth quintiles, differences were not that stark for improved water supply but for sanitation were extreme, with almost 100% of the richest quintile using improved facilities but only 13% of the poorest.14 Conversely, open defecation within the poorest quintile stood at 82%, but almost zero in the rich-est. Overall, the number of people without access to im-proved sanitation is higher in the southern provinces than in the north, and the open defecation rate remains high: while the Southeast Asia regional average stands at 14%, and 19% in rural areas, in Lao PDR it is 32% nationally and 45% in rural areas.15
Nationally identified poor communities (based on govern-ment poverty criteria) are mainly located in the mountainous northern and eastern areas, where access by road is limited and difficult. These communities are also prone to water access difficulties. The unit costs of providing water sup-ply and sanitation services to remote communities will be significantly higher than for lowland communities with easy access to roads and markets.
Regarding the water supply technologies in common use, 58% of urban residents have house connections while a further 25% use other improved sources including public taps, boreholes, protected springs or dug wells. In rural ar-eas, just 5% have house connections while 58% use other improved sources such as public taps, boreholes, protect-ed springs and dug wells.
In the case of sanitation, both urban and rural residents use on-site facilities since there is almost no sewerage in the country. In urban areas there is near-universal use of flush toilets which discharge into an on-site septic tank, storage tank or pit. In rural areas, households tend to have either a pour-flush latrine or none at all.
12 WSP (2010)13 In a validation workshop, participants stated the 65% rural sanitation target in Lao version of NSEDP but the English version says 60%. 14 MOH (2012a)15 JMP (2013)
Water Supply and Sanitation in Lao PDR6
Investment Requirements: Testing the Sufficiency of Finance
Given the 2020 goals articulated in government policy or assumed for SDA purposes (see Table 2.1 above), Table 2.2 presents the estimated capital investment targets for all four subsectors.
The estimate of investment requirements is based on ac-cess rates, water and sanitation targets, population data, unit costs of facilities and lifespan and presumed technol-ogy mix using the following assumptions, which are ex-plained in more detail in Annex 2:
• The annual population growth rate of 2.1% is extrapo-lated from NSEDP 7 (2010-15). The rural/urban split in 2020 is from a draft urban sanitation strategy, which cites a figure of 33% for urban areas in 2020.
• Unit costs of technologies were estimated from infor-mation provided by sector officials and information from project documents.
• The future technology mix is based on interviews with sector officials and has been discussed with officials in SDA validation meetings.
The investment requirements are calculated on an annual average basis using the SDA financial model. These repre-sent not only the necessary expenditures for new facilities but also for replacing existing facilities (replacement costs). These are for capital (‘hardware’) costs only.
To calculate gaps in investment, the study estimated in-vestments for 2013 to 2015 from various potential financ-ing sources (government, donors and households) to derive an average annual anticipated investment per subsector (based on this 3-year average). This task was quite difficult because information had to be pieced together from many different sources. The SDA had excellent cooperation from the Lao Ministry of Planning and Investment, where a data-base of investment projects is kept by Lao-defined sectors
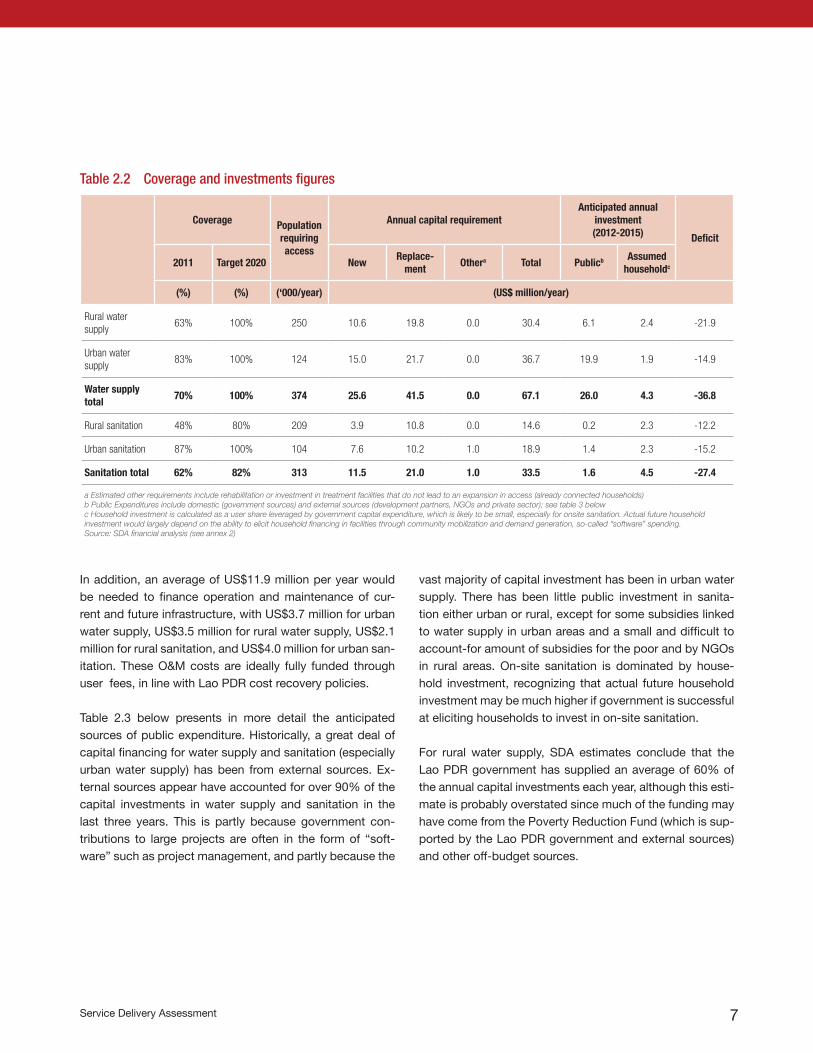
(water supply and sanitation are ‘social’ sectors), but the source of financing for some rural sanitation investments is not entirely clear (see discussion below). Other govern-ment and development partner investments are tracked by responsible ministries or agencies. Information on develop-ment partner projects and expenditures came from meeting development partners directly and from project documents. Table 2.1 shows the annual capital expenditure require-ments needed to meet the government’s 2020 targets for water supply and sanitation. To meet these targets for ac-cess to improved water supply, US$67.1 million on aver-age for every year will be required. About US$33.5 million every year will be required for sanitation. A slightly larger proportion of the required investment in water supply is for urban areas (US$36.7 million per year). Although access to improved water supply is currently higher in towns and cities, the SDA financial model assumes that costs for re-placing many facilities that are expected to wear-out during the period of analysis are in total quite high. Also, the gov-ernment intends to move from a 2011 level of 72% of the urban population with access to piped water supply on the premises to 80% in 2020. (For rural areas, the comparable figures are 12% and 15%). To achieve the government’s 2020 targets for rural areas, an estimated 374,000 people will need to gain access to improved water supply every year until 2020, while every year during the same period, an estimated 313,000 people will need to gain access to improved sanitation. Urban areas account for most of the required sanitation investments, which is caused by the as-sumption that 15% of urban households will be connected to sewerage in 2020, up from 5% in 2011. Overall, 38% of water supply investment requirements are expected to come from government and development partners (‘public’ sources). Just 5% of sanitation requirements are expected to come from these sources, owing to the assumption that on-site sanitation is expected to dominate in 2020, and the source of financing for this is assumed to be overwhelm-ingly from households (except for some few subsidies for the poor).
Service Delivery Assessment 7
In addition, an average of US$11.9 million per year would be needed to finance operation and maintenance of cur-rent and future infrastructure, with US$3.7 million for urban water supply, US$3.5 million for rural water supply, US$2.1 million for rural sanitation, and US$4.0 million for urban san-itation. These O&M costs are ideally fully funded through user fees, in line with Lao PDR cost recovery policies.
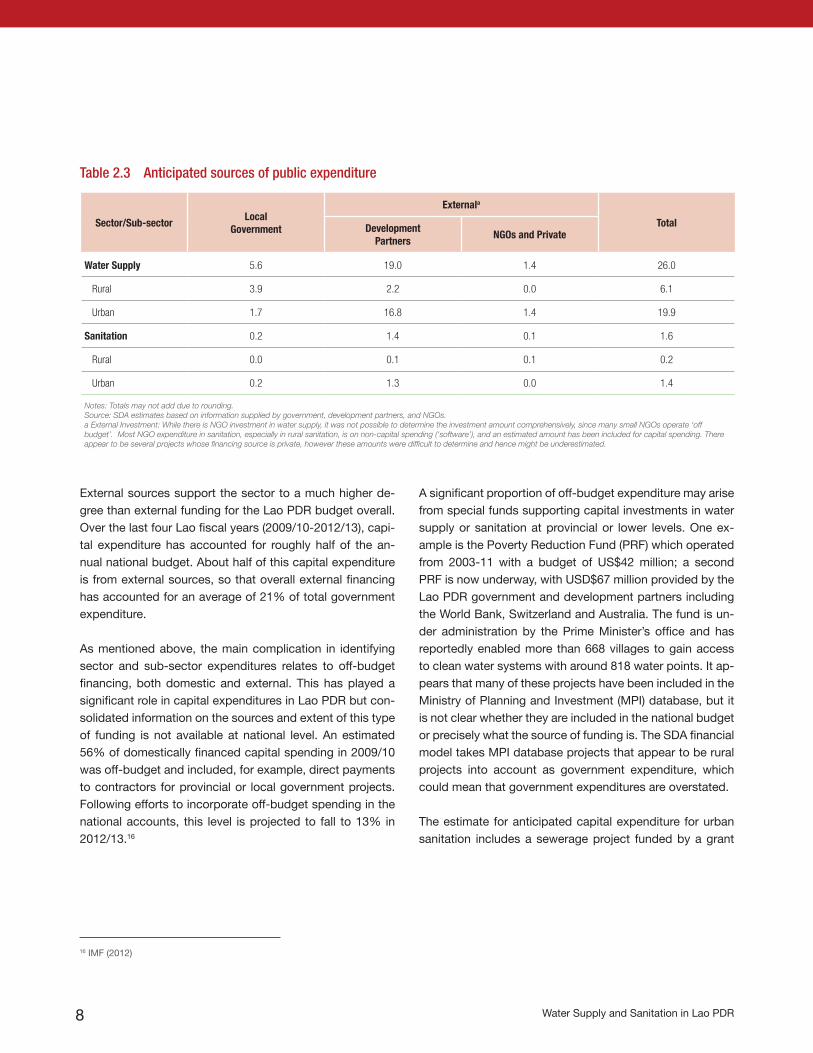
Table 2.3 below presents in more detail the anticipated sources of public expenditure. Historically, a great deal of capital financing for water supply and sanitation (especially urban water supply) has been from external sources. Ex-ternal sources appear have accounted for over 90% of the capital investments in water supply and sanitation in the last three years. This is partly because government con-tributions to large projects are often in the form of “soft-ware” such as project management, and partly because the
vast majority of capital investment has been in urban water supply. There has been little public investment in sanita-tion either urban or rural, except for some subsidies linked to water supply in urban areas and a small and difficult to account-for amount of subsidies for the poor and by NGOs in rural areas. On-site sanitation is dominated by house-hold investment, recognizing that actual future household investment may be much higher if government is successful at eliciting households to invest in on-site sanitation.
For rural water supply, SDA estimates conclude that the Lao PDR government has supplied an average of 60% of the annual capital investments each year, although this esti-mate is probably overstated since much of the funding may have come from the Poverty Reduction Fund (which is sup-ported by the Lao PDR government and external sources) and other off-budget sources.
Table 2.2 Coverage and investments figures
Coverage Population requiring access
Annual capital requirementAnticipated annual
investment (2012-2015) Deficit
2011 Target 2020 New Replace-ment Othera Total Publicb Assumed
householdc
(%) (%) (‘000/year) (US$ million/year)
Rural water supply
63% 100% 250 10.6 19.8 0.0 30.4 6.1 2.4 -21.9
Urban water supply
83% 100% 124 15.0 21.7 0.0 36.7 19.9 1.9 -14.9
Water supply total 70% 100% 374 25.6 41.5 0.0 67.1 26.0 4.3 -36.8
Rural sanitation 48% 80% 209 3.9 10.8 0.0 14.6 0.2 2.3 -12.2
Urban sanitation 87% 100% 104 7.6 10.2 1.0 18.9 1.4 2.3 -15.2
Sanitation total 62% 82% 313 11.5 21.0 1.0 33.5 1.6 4.5 -27.4
a Estimated other requirements include rehabilitation or investment in treatment facilities that do not lead to an expansion in access (already connected households)b Public Expenditures include domestic (government sources) and external sources (development partners, NGOs and private sector); see table 3 belowc Household investment is calculated as a user share leveraged by government capital expenditure, which is likely to be small, especially for onsite sanitation. Actual future household investment would largely depend on the ability to elicit household financing in facilities through community mobilization and demand generation, so-called “software” spending. Source: SDA financial analysis (see annex 2)
Water Supply and Sanitation in Lao PDR8
External sources support the sector to a much higher de-gree than external funding for the Lao PDR budget overall. Over the last four Lao fiscal years (2009/10-2012/13), capi-tal expenditure has accounted for roughly half of the an-nual national budget. About half of this capital expenditure is from external sources, so that overall external financing has accounted for an average of 21% of total government expenditure.
As mentioned above, the main complication in identifying sector and sub-sector expenditures relates to off-budget financing, both domestic and external. This has played a significant role in capital expenditures in Lao PDR but con-solidated information on the sources and extent of this type of funding is not available at national level. An estimated 56% of domestically financed capital spending in 2009/10 was off-budget and included, for example, direct payments to contractors for provincial or local government projects. Following efforts to incorporate off-budget spending in the national accounts, this level is projected to fall to 13% in 2012/13.16
Table 2.3 Anticipated sources of public expenditure
Sector/Sub-sector LocalGovernment
Externala
TotalDevelopmentPartners NGOs and Private
Water Supply 5.6 19.0 1.4 26.0
Rural 3.9 2.2 0.0 6.1
Urban 1.7 16.8 1.4 19.9
Sanitation 0.2 1.4 0.1 1.6
Rural 0.0 0.1 0.1 0.2
Urban 0.2 1.3 0.0 1.4
Notes: Totals may not add due to rounding. Source: SDA estimates based on information supplied by government, development partners, and NGOs. a External Investment: While there is NGO investment in water supply, it was not possible to determine the investment amount comprehensively, since many small NGOs operate ‘off budget’. Most NGO expenditure in sanitation, especially in rural sanitation, is on non-capital spending (‘software’), and an estimated amount has been included for capital spending. There appear to be several projects whose financing source is private, however these amounts were difficult to determine and hence might be underestimated.
A significant proportion of off-budget expenditure may arise from special funds supporting capital investments in water supply or sanitation at provincial or lower levels. One ex-ample is the Poverty Reduction Fund (PRF) which operated from 2003-11 with a budget of US$42 million; a second PRF is now underway, with USD$67 million provided by the Lao PDR government and development partners including the World Bank, Switzerland and Australia. The fund is un-der administration by the Prime Minister’s office and has reportedly enabled more than 668 villages to gain access to clean water systems with around 818 water points. It ap-pears that many of these projects have been included in the Ministry of Planning and Investment (MPI) database, but it is not clear whether they are included in the national budget or precisely what the source of funding is. The SDA financial model takes MPI database projects that appear to be rural projects into account as government expenditure, which could mean that government expenditures are overstated.
The estimate for anticipated capital expenditure for urban sanitation includes a sewerage project funded by a grant
16 IMF (2012)
Service Delivery Assessment 9
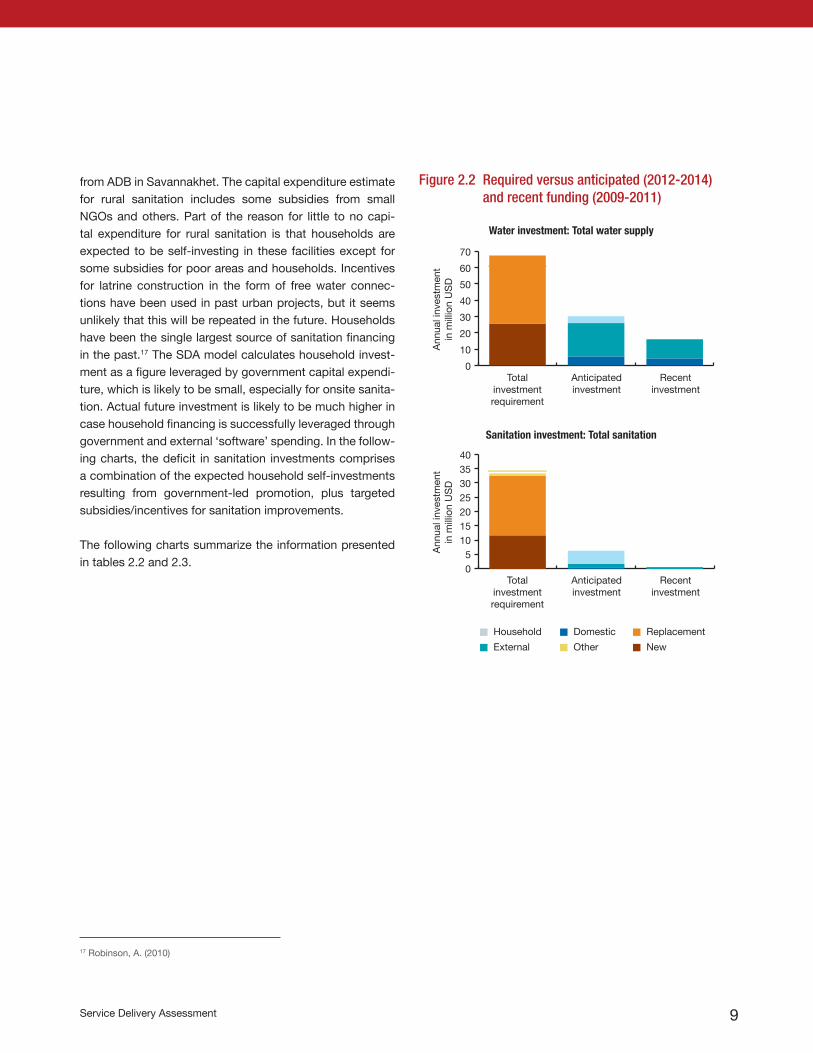
from ADB in Savannakhet. The capital expenditure estimate for rural sanitation includes some subsidies from small NGOs and others. Part of the reason for little to no capi-tal expenditure for rural sanitation is that households are expected to be self-investing in these facilities except for some subsidies for poor areas and households. Incentives for latrine construction in the form of free water connec-tions have been used in past urban projects, but it seems unlikely that this will be repeated in the future. Households have been the single largest source of sanitation financing in the past.17 The SDA model calculates household invest-ment as a figure leveraged by government capital expendi-ture, which is likely to be small, especially for onsite sanita-tion. Actual future investment is likely to be much higher in case household financing is successfully leveraged through government and external ‘software’ spending. In the follow-ing charts, the deficit in sanitation investments comprises a combination of the expected household self-investments resulting from government-led promotion, plus targeted subsidies/incentives for sanitation improvements.
The following charts summarize the information presented in tables 2.2 and 2.3.
Totalinvestmentrequirement
Anticipatedinvestment
Recentinvestment
Ann
ual i
nves
tmen
tin
mill
ion
US
D
Other
Replacement
New
Household
External
Domestic
0
10
20
30
40
50
60
70
Totalinvestmentrequirement
Anticipatedinvestment
Recentinvestment
Ann
ual i
nves
tmen
tin
mill
ion
US
D
05
10152025303540
Sanitation investment: Total sanitation
Water investment: Total water supply
Figure 2.2 Required versus anticipated (2012-2014) and recent funding (2009-2011)
17 Robinson, A. (2010)
Water Supply and Sanitation in Lao PDR10
3. Reform Context
A longstanding concern among sector stakeholders has been the low priority afforded to WASH on the national development agenda—particularly rural water supply and sanitation. The subject has limited visibility at policy level and institutions struggle to compete for resources within the ministries of Health and Public Works and Transport, which have primary responsibility for water supply and sanitation. As a result, activity in the sector has long been heavily do-nor-dependent. There have, however, been some important developments in the policy and institutional framework for WASH over the last two decades and the sector is steadily gaining more strength and prominence.
Urban Water Supply and Sanitation
In 1999 a Water Policy Statement was issued under which re-sponsibility for public water supply systems was reassigned from the former national water utility, Nam Papa Lao, to 17 provincial water utilities known as Nam Papa State Enterpris-es. A Sector Investment Plan (SIP) was adopted at the same time and significant investments were made in the following years. The 1999 SIP was updated in 2004 to reflect the gov-ernment’s growing emphasis on equitable development by improving small towns, particularly in the poorest districts. In 2008, an Urban Water Supply Sector Road Map was ad-opted, followed in 2009 by a draft Wastewater Strategy and Investment Plan; both initiatives were supported by ADB. In the same year, urban water supply regulation was strength-ened with the creation of a Water Supply Regulation Com-mittee and Water Supply Regulatory Office as its secretariat.
More recently, a Water Supply Law came into force in 2010 to underpin the policy framework for the sector. Amongst other things the law confirmed that responsibility for piped public water supply schemes lies with the provincial utili-ties, with Nam Saat responsible for non-networked (in other words, rural) schemes.
Current policy encourages private sector participation in service provision and indicates that utilities should adopt a commercial orientation. In practice this has not happened, though the utilities now have a significant degree of finan-cial autonomy and depend on revenue from customers to meet their operating costs (though not the cost of new in-vestments).18 There has also been some progress with pri-vate sector participation in the development and operation of small piped schemes, but only limited involvement so far in the financing or operation of provincial utilities.
While the draft wastewater strategy of 2009 was not taken forward by government, the 2008 Road Map paved the way for drafts of two key documents issued in 2013: a Strategic Framework for the Development of the Urban Water Supply and Sanitation Sector 2013-2030 and a Revised Water Sup-ply Sector Investment Plan covering the period 2012-2020. The latter has now been approved.
The Strategic Framework consolidates and extends a num-ber of ongoing initiatives in the sector to build the capac-ity of provincial utilities and create a policy and institutional environment more conducive to private sector participation and sustainable service delivery. Specific aims are set out in
18 The Mini-Réseaux d’Eau Potable (meaning small-scale water supply) programme (MIREP), developed seven piped water supply schemes from 2004 onwards, with a further two started in 2011. Each one is managed by a local private operator.
Service Delivery Assessment 11
ten goals that are to be achieved through the implementa-tion of four programmes designed to:
1. Strengthen the institutional framework and capacity of the sector.
2. Improve the enabling environment, via legal amend-ments and technical guidance.
3. Expand piped water supply coverage, and improve service quality, through rehabilitation and new invest-ments, with special attention to small and emerging towns. Some pilot work on decentralized wastewa-
ter management and feasibility studies on centralized sewerage are also envisaged.
4. Introduce corporate planning for provincial water utili-ties nationwide, building on earlier work under the ADB-funded Small Towns Water Supply and Sanita-tion Sector Project. This will be accompanied by ca-pacity building support for the utilities in areas such as business and financial management; billing and ac-counting; operation and maintenance; and meeting the requirements of service agreements based on Key Per-formance Indicators (KPIs) and regulated by WASRO.
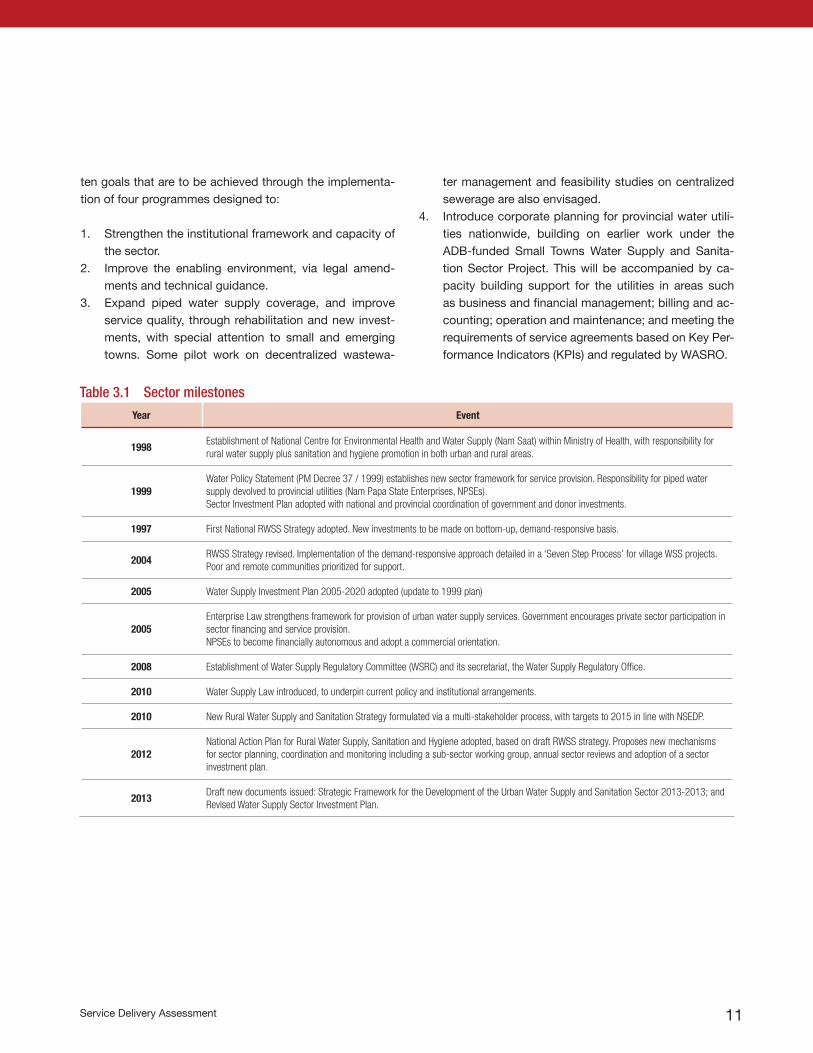
Table 3.1 Sector milestones
Year Event
1998 Establishment of National Centre for Environmental Health and Water Supply (Nam Saat) within Ministry of Health, with responsibility for rural water supply plus sanitation and hygiene promotion in both urban and rural areas.
1999Water Policy Statement (PM Decree 37 / 1999) establishes new sector framework for service provision. Responsibility for piped water supply devolved to provincial utilities (Nam Papa State Enterprises, NPSEs). Sector Investment Plan adopted with national and provincial coordination of government and donor investments.
1997 First National RWSS Strategy adopted. New investments to be made on bottom-up, demand-responsive basis.
2004 RWSS Strategy revised. Implementation of the demand-responsive approach detailed in a ‘Seven Step Process’ for village WSS projects. Poor and remote communities prioritized for support.
2005 Water Supply Investment Plan 2005-2020 adopted (update to 1999 plan)
2005Enterprise Law strengthens framework for provision of urban water supply services. Government encourages private sector participation in sector financing and service provision. NPSEs to become financially autonomous and adopt a commercial orientation.
2008 Establishment of Water Supply Regulatory Committee (WSRC) and its secretariat, the Water Supply Regulatory Office.
2010 Water Supply Law introduced, to underpin current policy and institutional arrangements.
2010 New Rural Water Supply and Sanitation Strategy formulated via a multi-stakeholder process, with targets to 2015 in line with NSEDP.
2012National Action Plan for Rural Water Supply, Sanitation and Hygiene adopted, based on draft RWSS strategy. Proposes new mechanisms for sector planning, coordination and monitoring including a sub-sector working group, annual sector reviews and adoption of a sector investment plan.
2013 Draft new documents issued: Strategic Framework for the Development of the Urban Water Supply and Sanitation Sector 2013-2013; and Revised Water Supply Sector Investment Plan.
Water Supply and Sanitation in Lao PDR12
In the area of finance, the draft strategy also includes a government commitment to fund the development of two water supply systems by 2020 and increase sector budget allocations by 10% per annum. The SIP is discussed further in section 5.
The urban sanitation sub-sector is in an early stage of de-velopment, reflecting the fact that there is, so far, no sewer-age in Lao PDR. Relatively low urban population density means that on-site services are generally viable, though there has also been some use of decentralized wastewater treatment systems on a pilot scale. To some extent this ex-plains the limited references to sewerage in the draft Strate-gic Framework, though the lack of attention to fecal sludge management - essential for the effective long term use of on-site sanitation - is an important gap.
Rural Water Supply and Sanitation
In the rural sub-sector, there have been three principal policy developments during the last two decades. The first was the assignment of lead responsibility for rural water supply, sanitation and hygiene promotion (plus hygiene promotion in urban areas) to Nam Saat, the National Centre for Environ-mental Health and Water Supply. Established in 1998, Nam Saat is one of a number of centers operating under the um-brella of the Department of Hygiene and Health Promotion at the Ministry of Health (MOH). The second was the adoption of a National Rural Water Supply and Sanitation Strategy in 1999, with an update in 2004. The strategy was a milestone for the sector in that it signalled the end of the established supply-driven approach to new investments; future projects would instead be developed on a demand-responsive basis. In support of this the strategy defined a new ‘seven step’ process for the implementation of village level projects.
While the strategy marked an important step forward for the sector it did not - despite its title - establish a national operational strategy, for example by defining baselines and targets as a basis for sector monitoring; setting out the roles
and responsibilities of government and other players at na-tional, provincial and local levels; or introducing an invest-ment plan and financing mechanism. Rural WASH has for many years been marginalized within MOH budgets and in the absence of any other government-funded national pro-gram, the strategy has had limited impact and most new investments continue to be funded by development part-ners. Having said this, Nam Saat usually plays a key role in implementation to the extent possible given its limited staffing at district level.
In recent years, the Ministry of Health and development partners have recognized the limitations of the 1997/2004 strategy and with UNICEF support a new Draft Rural Water Supply and Sanitation Strategy was produced in 2011 and subsequently adopted under the revised title of ‘National Action Plan for Rural Water Supply, Sanitation and Hygiene.’ The comprehensive Action Plan covers the period 2011-15 and, amongst other things, proposes sector targets, a new monitoring framework and improved government-donor coordination including the introduction of joint annual sec-tor reviews at which progress will be reviewed against a set of key indicators.
The third significant development, which happened within the last five years, has been the introduction of Community-led Total Sanitation (CLTS) in several locations and, more recently, sanitation marketing. These initiatives were spear-headed by a number of international development agencies including SNV, WSP and Plan International (amongst others) but with growing support from MOH for the ‘no subsidy’ ap-proach to the promotion of household toilets. The new Ac-tion Plan indicates that hardware subsidies for household toilets should not be provided except for the very poor.
Sections 4 to 6 below highlight progress and challenges within the WASH sector across three thematic areas: the institutional framework, finance, and monitoring and evalu-ation. The scorecards for each subsector are presented in Sections 7 to 10.
Service Delivery Assessment 13
Decentralization is a work in progress in Lao PDR but the government has recently taken steps to advance policy implementation via a two-year pilot whereby selected pi-lot provincial governments will function as ‘Strategic Units’, their Districts as ‘Enhanced Capacity Units’ and Villages as ‘Development Units’ (also referred to as ‘Implementing Units’). It is evident that government intends to increase the power and responsibilities of the lower tiers of govern-ment, with the aim of improving service delivery to villag-ers. The implications of the decentralization process for the water and sanitation sector are at this stage unclear and a review at the end of the two-year pilot could inform the di-rection of sector developments in line with the decentraliza-tion process. Due to the limited implementation capacities
4. Institutional Framework
through the line agencies at provincial and district levels, the decentralization process could provide opportunities for strengthening local services delivery through sub-national authorities.
At present, the WASH sector in Lao PDR is split into dis-tinct urban and rural components and no comprehensive overview of sector status is available from government at national level, neither a comprehensive WASH policy. Wa-ter supply and sanitation is one of many subjects managed by the parent ministries of Public Works and Transport (for urban water and sanitation) and Health (for rural). It is not surprising, therefore, that the subject tends to be margin-alized in resource allocation at national level, particularly
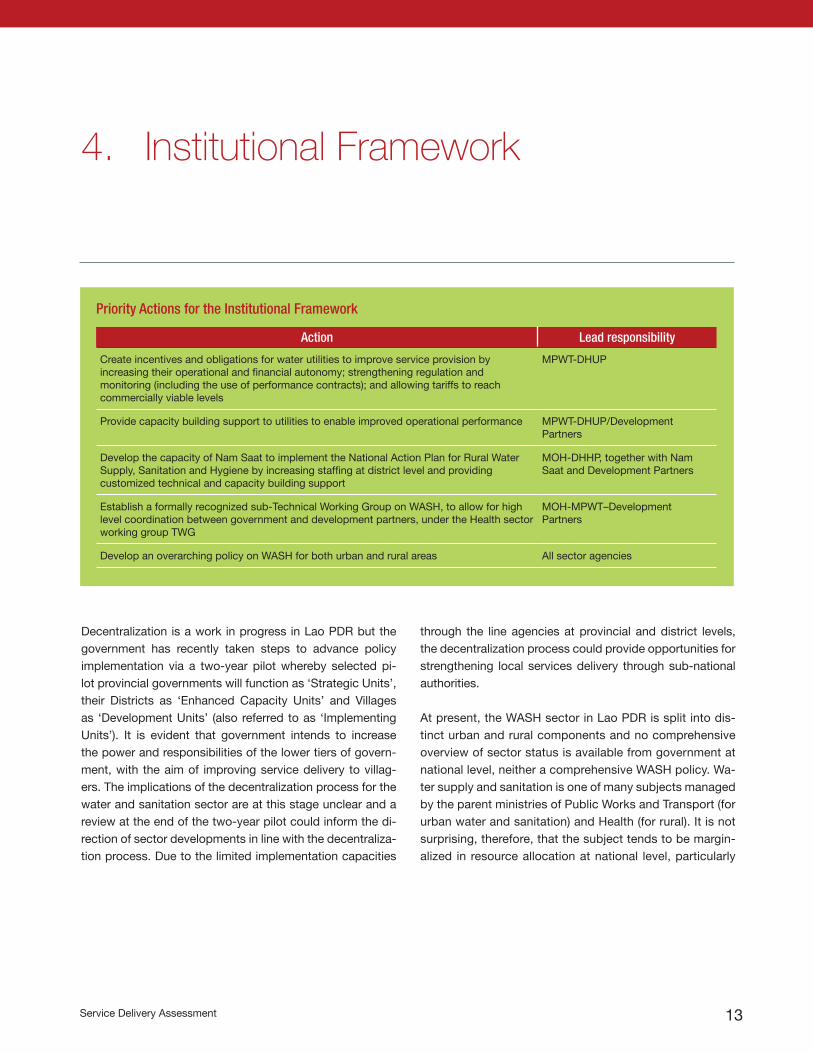
Priority Actions for the Institutional Framework
Action Lead responsibility
Create incentives and obligations for water utilities to improve service provision by increasing their operational and financial autonomy; strengthening regulation and monitoring (including the use of performance contracts); and allowing tariffs to reach commercially viable levels
MPWT-DHUP
Provide capacity building support to utilities to enable improved operational performance MPWT-DHUP/Development Partners
Develop the capacity of Nam Saat to implement the National Action Plan for Rural Water Supply, Sanitation and Hygiene by increasing staffing at district level and providing customized technical and capacity building support
MOH-DHHP, together with Nam Saat and Development Partners
Establish a formally recognized sub-Technical Working Group on WASH, to allow for high level coordination between government and development partners, under the Health sector working group TWG
MOH-MPWT–Development Partners
Develop an overarching policy on WASH for both urban and rural areas All sector agencies
Water Supply and Sanitation in Lao PDR14
within the Ministry of Health. The vast majority of water supply investments in recent years have been funded by donors and by households themselves, although the full extent of self-supply is not known. This situation high-lights the need for effective planning and coordination of government and donor inputs to the sector, both technical and financial.
Sector Coordination
Sector coordination is well advanced for urban water supply in comparison to the other sub-sectors, not least because the Ministry of Public Works and Transport (MPWT) has a sector investment plan, periodically updated, which pro-vides a framework for the deployment of external support. There is an Infrastructure Technical Working Group under MPWT with both government and donor membership, and an annual Round Table Meeting is held to review progress in urban development generally, though not specifically for water supply. Donor support is also incorporated into pro-vincial budgets and investment plans. The same arrange-ments would apply for urban sanitation but there has not, so far, been any significant government or donor invest-ment in this sub-sector.
The new Action Plan proposes to establish a more formal-ized approach including a joint annual sector review specifi-cally for rural WASH.
In the case of rural water supply and sanitation, an infor-mal Technical Working Group has existed for some time and is well-attended by development partners. This oper-ates outside of the government framework, however, and is not connected to decision-making processes in the sector. Government recognizes the need to improve sector coor-dination and at the 2012 international High Level Meeting of Sanitation and Water for All, the Minister of Health and Chair of the National Commission on Mother and Child Health announced that, by 2014, a formal WASH coordina-
tion mechanism encompassing both government and de-velopment partners would be set up under the joint stew-ardship of MOH and MPWT.19 There has been some recent progress in this area and the Department of Hygiene and Health Promotion within MOH now hosts a regular WASH Technical Working Group meeting to which selected devel-opment partners are invited, as are representatives of DHUP and WASRO. This is an encouraging development, though the group is positioned at low level within the government hierarchy and as such has limited power. Ideally, the group is to be established as a formal MOH-MPWT-Development Partner Working Group and repositioned as a sub-group of the main Health Technical Working Group, with a high-level chair.
Urban Water Supply and Sanitation
In general, institutional arrangements for urban water sup-ply are more developed than for rural, and the sub-sector is better funded. Urban water supply falls under MPWT and specific responsibility lies with the Water Supply Division the Department of Housing and Urban Planning (DHUP). The draft Strategic Framework issued in 2013 indicates that this Division will shortly be upgraded to the status of a Depart-ment. There are 17 provincial water utilities, officially called Nam Papa State Enterprises (NPSEs), which operate public water supply networks.
The NSEDP stipulates that NPSEs should operate as finan-cially autonomous corporations. They do not, therefore, re-ceive any direct operating subsidies from provincial govern-ment. Despite this level of financial autonomy, NPSEs have yet to adopt a commercial orientation and are under little pressure to do so, though the draft Strategic Framework notes that the majority do now recover all or most of their operating costs.
Staffing levels are high relative to regional benchmarks, and the utilities follow government administrative procedures,
19 See http://www.sanitationandwaterforall.org/files/LAO_PDR_-_Statement_to_2012_HLM_EN.pdf. Seven commitments were made in total and progress is being monitored and reported on to SWA.
Service Delivery Assessment 15
including remuneration policies, making it doubly difficult for service providers to attract capable personnel in a coun-try that already has a dearth of professional staff in the sec-tor.
While there have been some promising first steps in foster-ing private sector participation in the development and op-eration of small piped networks, tariff controls and the lack of autonomy in service provision mean that the environment is not yet conducive for private sector participation in the operation of large urban schemes.
Established in 2008, the regulator, known as the Water Sup-ply Regulatory Committee (WSRC), and its secretariat, the Water Supply Regulatory Office (WASRO), have so far fo-cused on bi-annual tariff reviews and the preparation of an-nual performance reports of NPSEs. So far, however, tariffs have not been raised to levels that would enable the utilities to achieve financial sustainability and it is widely acknowl-edged that performance monitoring is weak.
WASRO is currently developing performance guidelines and standard agreements to improve the monitoring and regulation of water utilities. It is also proposed to bring small independent suppliers within this monitoring and regulatory framework. A major concern of WSRC and WASRO is the lack of capacity of their own staff and those of the NPSEs (plus in due course private providers) to undertake their re-spective functions and responsibilities.
Lao PDR does not currently have municipalities though there are plans to introduce them within the next ten years. Lead responsibility for the development of urban sanita-tion rests with the Urban Development Division of MPWT. Outside of the capital, provision of urban infrastructure and services is assigned to Provincial Urban Development Ad-ministration Authorities (UDAAs). This responsibility covers infrastructure and services relating to drainage, solid waste and wastewater.
Within Vientiane, responsibility for the management of hu-man waste is not clearly assigned and in practice is split between Vientiane Urban Development Administration Au-thority (VUDAA); the Department of Urban Housing and Planning of MPWT; and the Public Works and Transport Institute, which also falls under the MPWT. The lack of clarity is partly explained by the fact that Vientiane has no sewerage and the management of human waste has long been regarded by government as primarily a household re-sponsibility, though there is at least public provision for the dumping of septage at a government landfill site outside the capital. As population density increases and sewerage is gradually introduced, it will be essential to define more clearly institutional roles and responsibilities for the man-agement of urban wastewater.
Nam Saat, meanwhile, has a role to promote sanitation and hygiene in both urban and rural areas, but its involvement in urban sanitation tends to be not on an institutional basis but via individual officers participating in donor-funded projects.
Rural Water Supply and Sanitation
Nam Saat is responsible for the development of rural water services and the promotion of hygiene in both urban and ru-ral areas. Its mandate in relation to rural water supply (specifi-cally non-networked schemes) was confirmed by the Water Act 2010, but it has limited technical and human resources in this area (typically just one or two officers per district) and to date the Ministry of Health has not funded and spearheaded any substantial WASH investment programs.
Development partners play a very significant role in WASH in terms of both funding and technical assistance. However, with the exception of urban water supply, there is to date no national or provincial mechanism for coordinating govern-ment and donor inputs. In the absence of budget support or multi-donor basket funding, donor-funded projects are mostly developed on a stand-alone basis, though within
Water Supply and Sanitation in Lao PDR16
these limitations government-development partner co-op-eration is generally good.
A number of national and international NGOs are active in rural areas and the Lao Women’s Union (a government-sponsored mass organisation) is also a significant player. Due its huge membership and close relationship with gov-ernment it has capacity and influence at both local and na-tional level.
At present, national private sector capacity in WASH is quite limited, which reflects not only the small urban population of Lao PDR but also the fact that service provision was for
many years regarded as the preserve of government. This is slowly changing as government policy now actively en-courages private sector participation in all areas of WASH. A number of independent operators are now providing wa-ter supplies via small piped schemes and the scaling up of sanitation promotion via CLTS and sanitation marketing is predicated on strengthening the local supply of hardware and skilled labour via the private sector.
Large-scale private sector participation in the financing and operation of networked services is still some way off, how-ever, as the adoption of a commercial orientation to service provision has not yet taken root.
Service Delivery Assessment 17
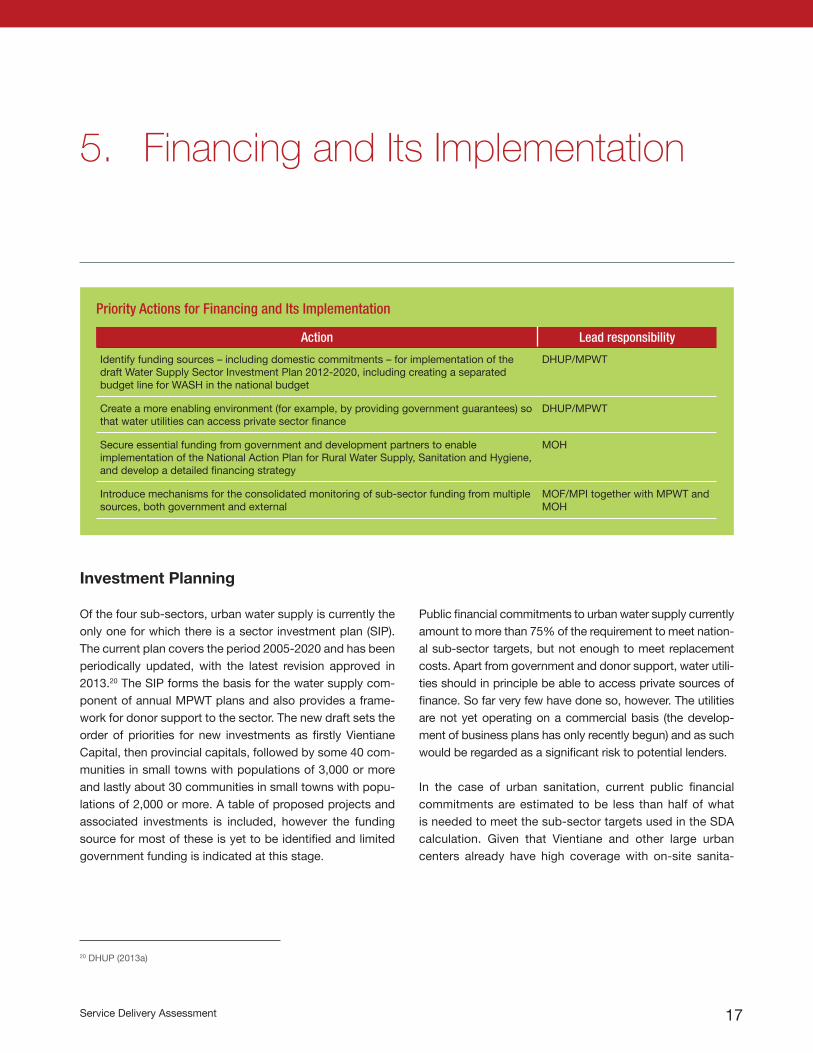
Priority Actions for Financing and Its Implementation
Action Lead responsibility
Identify funding sources – including domestic commitments – for implementation of the draft Water Supply Sector Investment Plan 2012-2020, including creating a separated budget line for WASH in the national budget
DHUP/MPWT
Create a more enabling environment (for example, by providing government guarantees) so that water utilities can access private sector finance
DHUP/MPWT
Secure essential funding from government and development partners to enable implementation of the National Action Plan for Rural Water Supply, Sanitation and Hygiene, and develop a detailed financing strategy
MOH
Introduce mechanisms for the consolidated monitoring of sub-sector funding from multiple sources, both government and external
MOF/MPI together with MPWT and MOH
Investment Planning
Of the four sub-sectors, urban water supply is currently the only one for which there is a sector investment plan (SIP). The current plan covers the period 2005-2020 and has been periodically updated, with the latest revision approved in 2013.20 The SIP forms the basis for the water supply com-ponent of annual MPWT plans and also provides a frame-work for donor support to the sector. The new draft sets the order of priorities for new investments as firstly Vientiane Capital, then provincial capitals, followed by some 40 com-munities in small towns with populations of 3,000 or more and lastly about 30 communities in small towns with popu-lations of 2,000 or more. A table of proposed projects and associated investments is included, however the funding source for most of these is yet to be identified and limited government funding is indicated at this stage.
Public financial commitments to urban water supply currently amount to more than 75% of the requirement to meet nation-al sub-sector targets, but not enough to meet replacement costs. Apart from government and donor support, water utili-ties should in principle be able to access private sources of finance. So far very few have done so, however. The utilities are not yet operating on a commercial basis (the develop-ment of business plans has only recently begun) and as such would be regarded as a significant risk to potential lenders.
In the case of urban sanitation, current public financial commitments are estimated to be less than half of what is needed to meet the sub-sector targets used in the SDA calculation. Given that Vientiane and other large urban centers already have high coverage with on-site sanita-
5. Financing and Its Implementation
20 DHUP (2013a)
Water Supply and Sanitation in Lao PDR18
tion, and that access to sewerage is likely to remain low in the short to medium term, most of the costs relate to replacement of existing facilities and would be funded largely by households.
Turning to rural water supply and sanitation, the new Action Plan contains only an outline of investment requirements and urgently needs further work to develop it into a Sec-tor Investment Plan. For now, public financial commitments are less than half of what is needed to meet national sub-sector targets. At the 2013 High Level Meeting of Sanita-tion and Water for All, the Lao PDR delegation announced that the government would commit US$15 million to rural WASH and mobilize and additional US$28 million from de-velopment partners to implement the Action Plan to 2015. Translation of this announcement into action has been slow. However, the 2014 Sanitation and Water for All meeting will reconfirm annual budget allocation from the Ministry of Health of 30% for rural water supply and sanitation, includ-ing creating a separated budget line in the national budget for rural water supply and sanitation.
Budget Transparency
As discussed in section 2 above, it is difficult to identify investments in water supply and sanitation from budget statements, even those at sub-national levels. The most recent Public Expenditure and Financial Accountability Re-view (PEFA) for Lao PDR (published in 2010 based on fiscal year 2008/09 data) gave low scores for both the extent of unreported government operations and for transparency of intergovernmental fiscal relations.
Some water supply utilities in Lao PDR make a profit before taxes (which includes minor capital repair and maintenance and interest on some project loans). The Vientiane Province Nam Papa, for example, made a profit in each of the years 2009-11 but payment of taxes to government put the utility in the red for 2011. In contrast, the Bolikamxay Province
Nam Papa reported a loss in each of those years. However, adding back the depreciation that is included in the profit and loss statements, the utilities appear to have had a posi-tive cash flow. This means that any transfers from provincial budgets may not have been necessary; in any case spe-cific transfers or operating subsidies are not identified in the available provincial budgets.
For rural water supply, Nam Saat budgets for the fiscal years 2009/10 through 2011/12 appear to include little or no capital investment because most domestic funding for rural water supply has been routed through provincial budgets or (it appears) through off-budget or special fund financing. Nam Saat does have a domestic capital budget allocation of some US$0.2 million in 2012/13.
Utilization of Budgets
There are no bottlenecks in the spending of recurrent do-mestic budgets for urban water supply and the small govern-ment allocations for capital expenditure. For donor-funded projects, however, implementation delays are common and most loans take longer to complete than planned. Minimal domestic allocations are made for urban sanitation, either capital or recurrent, and donor funding is also very small and easy to spend.
The situation with rural water supply is a little different. Here budget releases are slow and Nam Saat capacity for project implementation is low at provincial and district lev-els. Furthermore, delays in the granting of government ap-proval for international NGO projects can be a serious ob-stacle, preventing these agencies from spending available funds. Only recurrent government spending—which is essentially for staff and related operational costs—seems to be unproblematic. As a result there are no spending bottlenecks reported in relation to sanitation and hygiene promotion, for which little or no capital expenditure is in-volved.
21 World Bank 2010b. While scoring well (a ‘B’) on indicators such as budget execution and comprehensiveness of information, Lao PDR scored much lower (‘D’ or’ D+’) on the indicators mentioned and on multi-year planning. Donor practices in reporting were mid-grade (C+) or below.
Service Delivery Assessment 19
Budget Adequacy
It is clear from the graphs presented in section 2 that there are large deficits in investment requirements in all sub-sectors.
For rural water supply, based on information in the social sector PIP from the Ministry of Planning and Investment da-tabase, domestic expenditure may finance close to 13% of the estimated requirement.
Domestic funding for urban water supply is mostly dedi-cated to project management, which is not included in capi-tal expenditures for the purposes of the SDA model. Some domestic resources for construction are included in the PIP for FY 2011/12, but they are negligible compared with an-ticipated capital requirements. Development partners have been willing to finance urban water supply in the near past and are anticipated to do so in the future.
The vast majority of basic sanitation infrastructure (rural and urban) in Lao PDR is on-site and financed by households. Substantial support is available from NGOs and donors for community-level promotion to accelerate household invest-ments. Nam Saat operational budgets at district level are not sufficient, however, to enable district staff to participate fully in sanitation or water supply initiatives at community
level. Nam Saat central receives less than 1% of the Minis-try of Health’s total budget, and under 5% of its administra-tive budget .22
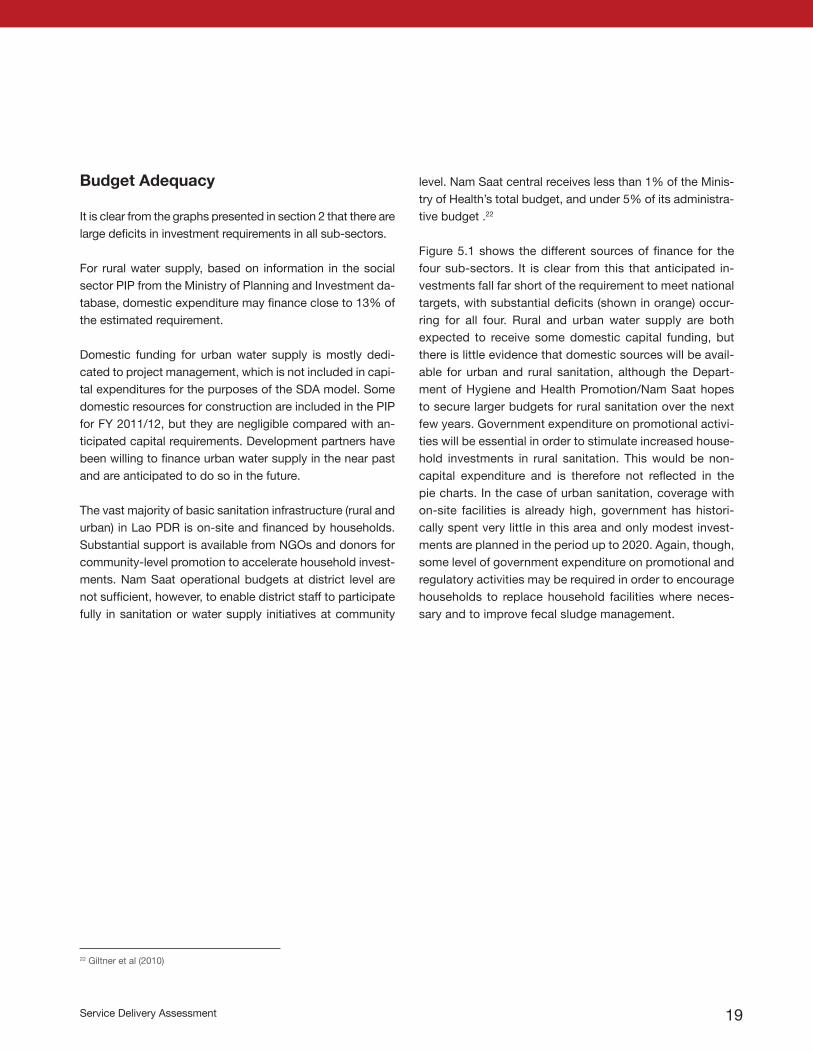
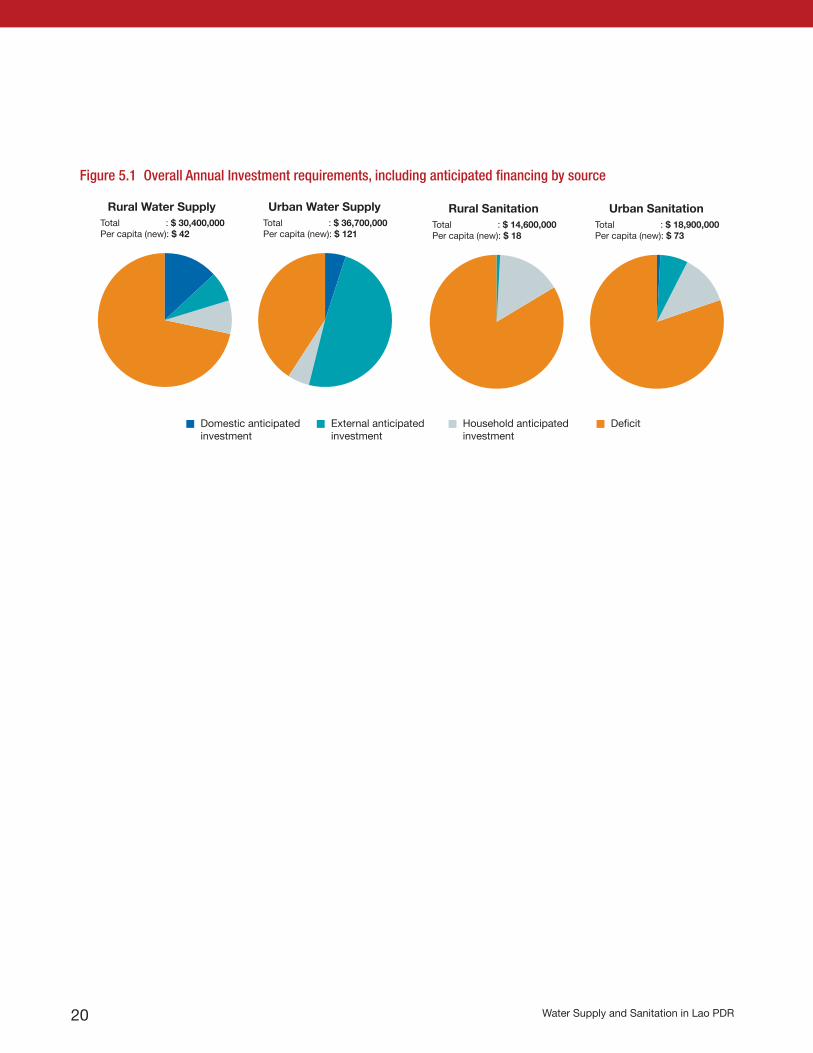
Figure 5.1 shows the different sources of finance for the four sub-sectors. It is clear from this that anticipated in-vestments fall far short of the requirement to meet national targets, with substantial deficits (shown in orange) occur-ring for all four. Rural and urban water supply are both expected to receive some domestic capital funding, but there is little evidence that domestic sources will be avail-able for urban and rural sanitation, although the Depart-ment of Hygiene and Health Promotion/Nam Saat hopes to secure larger budgets for rural sanitation over the next few years. Government expenditure on promotional activi-ties will be essential in order to stimulate increased house-hold investments in rural sanitation. This would be non-capital expenditure and is therefore not reflected in the pie charts. In the case of urban sanitation, coverage with on-site facilities is already high, government has histori-cally spent very little in this area and only modest invest-ments are planned in the period up to 2020. Again, though, some level of government expenditure on promotional and regulatory activities may be required in order to encourage households to replace household facilities where neces-sary and to improve fecal sludge management.
22 Giltner et al (2010)
Water Supply and Sanitation in Lao PDR20
Figure 5.1 Overall Annual Investment requirements, including anticipated financing by source
Domestic anticipated investment
External anticipated investment
Household anticipated investment
Deficit
Urban Water SupplyTotal : $ 36,700,000Per capita (new): $ 121
Rural Water SupplyTotal : $ 30,400,000Per capita (new): $ 42
Urban SanitationTotal : $ 18,900,000Per capita (new): $ 73
Rural SanitationTotal : $ 14,600,000Per capita (new): $ 18
Service Delivery Assessment 21
6. Sector Monitoring and Evaluation
At present, the sector monitoring framework is incomplete, much of the available data are unreliable and there is no focal point of reference for information on the status of the water supply and sanitation sector overall.
In the case of urban water supply, each provincial utility pro-duces an annual report and submits it to WASRO, which produces a national summary report. Though this is useful, there are widely acknowledged misgivings about the reliabil-ity of the data submitted, which is not subject to third party verification, and WSRC/WASRO acknowledge that service providers do not fully understand the reporting requirements. The quality of data analysis and interpretation at national lev-el is also a concern and WASRO reports of declining access to house connections in the last few years must therefore be treated with caution. It is also important to note that pub-lished data relate only to the population living within utility catchment areas, not to urban populations as whole. JMP data, which are based on national household surveys as well
as reports from DHUP, show a clear trend of increasing ac-cess to piped services in urban areas.
WASRO is currently developing five performance guidelines and two standard service agreements to improve the moni-toring and regulation of water utilities. Service agreements between the Provincial Governor and service provider are already being introduced progressively across the country, their function being to clarify the responsibilities of both parties, define tariffs and set out key performance indica-tors that will form the basis of annual monitoring reports to WASRO.
There is currently no monitoring system in place for urban sanitation. JMP reports indicate that national and MDG tar-gets for household facilities have already been met, but fecal sludge management is a neglected subject and no targets have yet been set for the collection and treatment of waste-water.
Priority Actions for Sector Monitoring and Evaluation
Action Lead responsibility
Establish a system of joint annual sector reviews (urban and rural) focusing on key indicators that track progress towards sector goals; equity in the allocation of sector funding; the quality and functionality of facilities and services; and the effectiveness of implementation processes
MOH, MPWT
Improve the quality and reliability of utility performance monitoring by the regulator WASRO DHUP-WASRO
Strengthen the rural WASH monitoring framework, with greater emphasis on the functionality and use of facilities
Department of Hygiene and Health Promotion, MOH
Water Supply and Sanitation in Lao PDR22
For rural water supply and sanitation, district Nam Saat offic-es produce annual monitoring reports that are consolidated at provincial and national level. Nam Saat then produces an annual report that includes, amongst other things, an esti-mate of water supply and sanitation coverage and compared this with previous years. A fundamental weakness of the re-porting system is that it records what has been built, so far as this is known to Nam Saat, but not what is functional and used. As a result, government consistently reports rural wa-ter supply coverage figures which are higher than reported through JMP, since the latter is based on household surveys investigating the services people use.
The National Action Plan on Rural Water Supply, Sanitation and Hygiene, adopted in 2012, proposes a new and im-proved monitoring framework for rural WASH based on three streams of monitoring:
1. Progress against annual or multi-year plans of action2. Monitoring for effectiveness3. Process monitoring of strategy implementation
The Action Plan also identifies the range of parameters to be monitored, though it does not set specific benchmarks
for each; these are yet to be developed. Furthermore, it pro-poses that every year the rural WASH sector will review its performance against a set of ‘Golden Indicators’ designed to show whether coverage and the effectiveness of operational arrangements (not least for the management and mainte-nance of services) are improving. Progress will be recorded in an annual sector performance report, which will contribute to periodic national sector assessments for water and sanita-tion. The annual report will be presented and discussed at a joint annual sector review meeting attended by government and development partners, where it will be used for lesson learning and setting corrective actions.
In the case of rural sanitation and hygiene, the new monitor-ing framework will need to encompass not only the construc-tion of toilets but also the achievement of open defecation-free (ODF) status and the use of improved or unimproved toilets. Efforts are already underway to improve monitoring in the rural sub-sector, with UNICEF supporting the develop-ment of a National Water and Sanitation Information System (NaWaSIS). In the short term, national household surveys such as the biannual Lao Social Indicators Survey (LSIS) will continue to provide valuable information on levels of access to functional water supply and sanitation services.
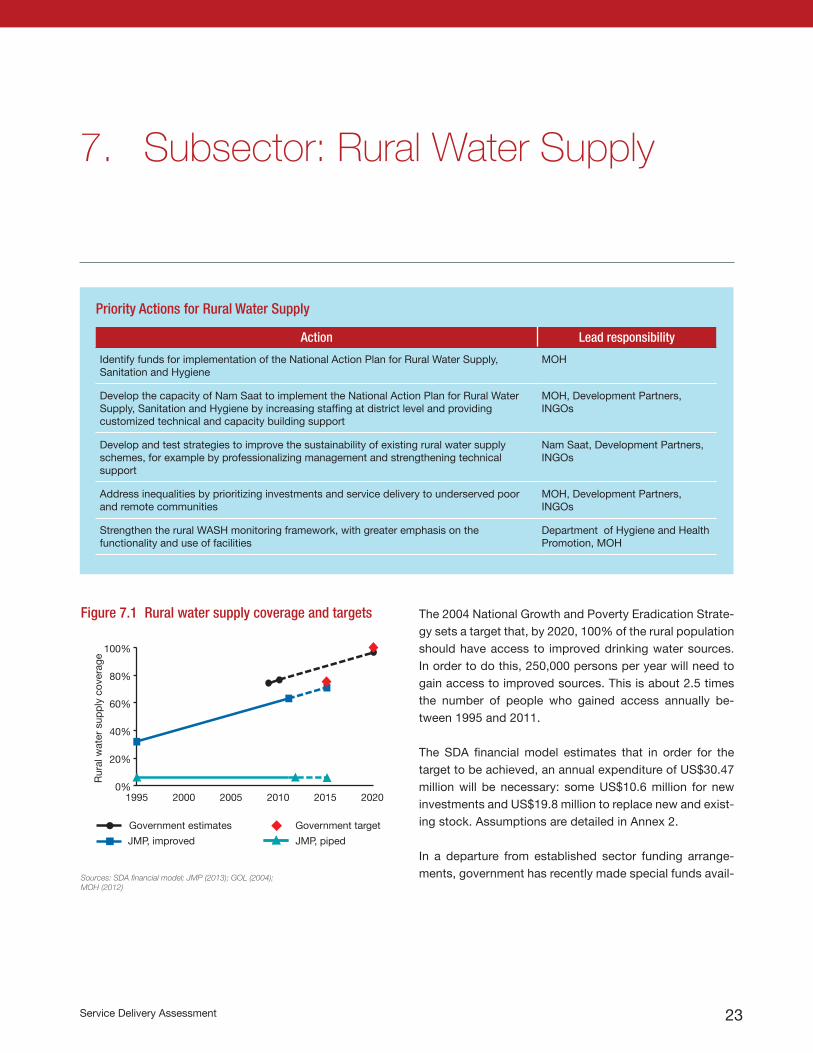
Service Delivery Assessment 23
7. Subsector: Rural Water Supply
0%
20%
40%
60%
80%
100%
1995 2000 2005 2010
Rur
al w
ater
sup
ply
cove
rage
Government estimates Government target
JMP, improved JMP, piped
2015 2020
Figure 7.1 Rural water supply coverage and targets
Sources: SDA financial model; JMP (2013); GOL (2004); MOH (2012)
The 2004 National Growth and Poverty Eradication Strate-gy sets a target that, by 2020, 100% of the rural population should have access to improved drinking water sources. In order to do this, 250,000 persons per year will need to gain access to improved sources. This is about 2.5 times the number of people who gained access annually be-tween 1995 and 2011.
The SDA financial model estimates that in order for the target to be achieved, an annual expenditure of US$30.47 million will be necessary: some US$10.6 million for new investments and US$19.8 million to replace new and exist-ing stock. Assumptions are detailed in Annex 2.
In a departure from established sector funding arrange-ments, government has recently made special funds avail-
Priority Actions for Rural Water Supply
Action Lead responsibility
Identify funds for implementation of the National Action Plan for Rural Water Supply, Sanitation and Hygiene
MOH
Develop the capacity of Nam Saat to implement the National Action Plan for Rural Water Supply, Sanitation and Hygiene by increasing staffing at district level and providing customized technical and capacity building support
MOH, Development Partners, INGOs
Develop and test strategies to improve the sustainability of existing rural water supply schemes, for example by professionalizing management and strengthening technical support
Nam Saat, Development Partners, INGOs
Address inequalities by prioritizing investments and service delivery to underserved poor and remote communities
MOH, Development Partners, INGOs
Strengthen the rural WASH monitoring framework, with greater emphasis on the functionality and use of facilities
Department of Hygiene and Health Promotion, MOH
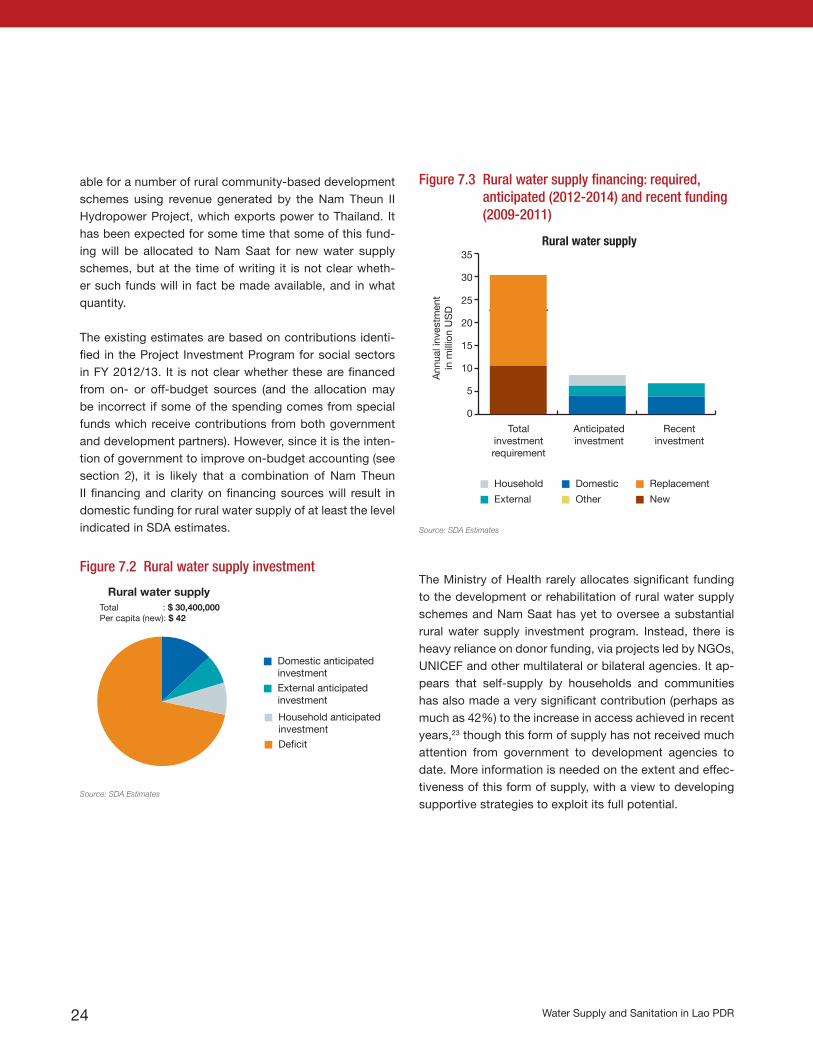
Water Supply and Sanitation in Lao PDR24
Figure 7.3 Rural water supply financing: required, anticipated (2012-2014) and recent funding (2009-2011)
Totalinvestmentrequirement
Anticipatedinvestment
Recentinvestment
Ann
ual i
nves
tmen
tin
mill
ion
US
D
Rural water supply
0
5
10
15
20
25
Other
Replacement
New
Household
External
Domestic
30
35
Source: SDA Estimates
Figure 7.2 Rural water supply investment
Household anticipated investmentDeficit
Domestic anticipated investmentExternal anticipated investment
Rural water supplyTotal : $ 30,400,000Per capita (new): $ 42
able for a number of rural community-based development schemes using revenue generated by the Nam Theun II Hydropower Project, which exports power to Thailand. It has been expected for some time that some of this fund-ing will be allocated to Nam Saat for new water supply schemes, but at the time of writing it is not clear wheth-er such funds will in fact be made available, and in what quantity.
The existing estimates are based on contributions identi-fied in the Project Investment Program for social sectors in FY 2012/13. It is not clear whether these are financed from on- or off-budget sources (and the allocation may be incorrect if some of the spending comes from special funds which receive contributions from both government and development partners). However, since it is the inten-tion of government to improve on-budget accounting (see section 2), it is likely that a combination of Nam Theun II financing and clarity on financing sources will result in domestic funding for rural water supply of at least the level indicated in SDA estimates.
The Ministry of Health rarely allocates significant funding to the development or rehabilitation of rural water supply schemes and Nam Saat has yet to oversee a substantial rural water supply investment program. Instead, there is heavy reliance on donor funding, via projects led by NGOs, UNICEF and other multilateral or bilateral agencies. It ap-pears that self-supply by households and communities has also made a very significant contribution (perhaps as much as 42%) to the increase in access achieved in recent years,23 though this form of supply has not received much attention from government to development agencies to date. More information is needed on the extent and effec-tiveness of this form of supply, with a view to developing supportive strategies to exploit its full potential.
Source: SDA Estimates
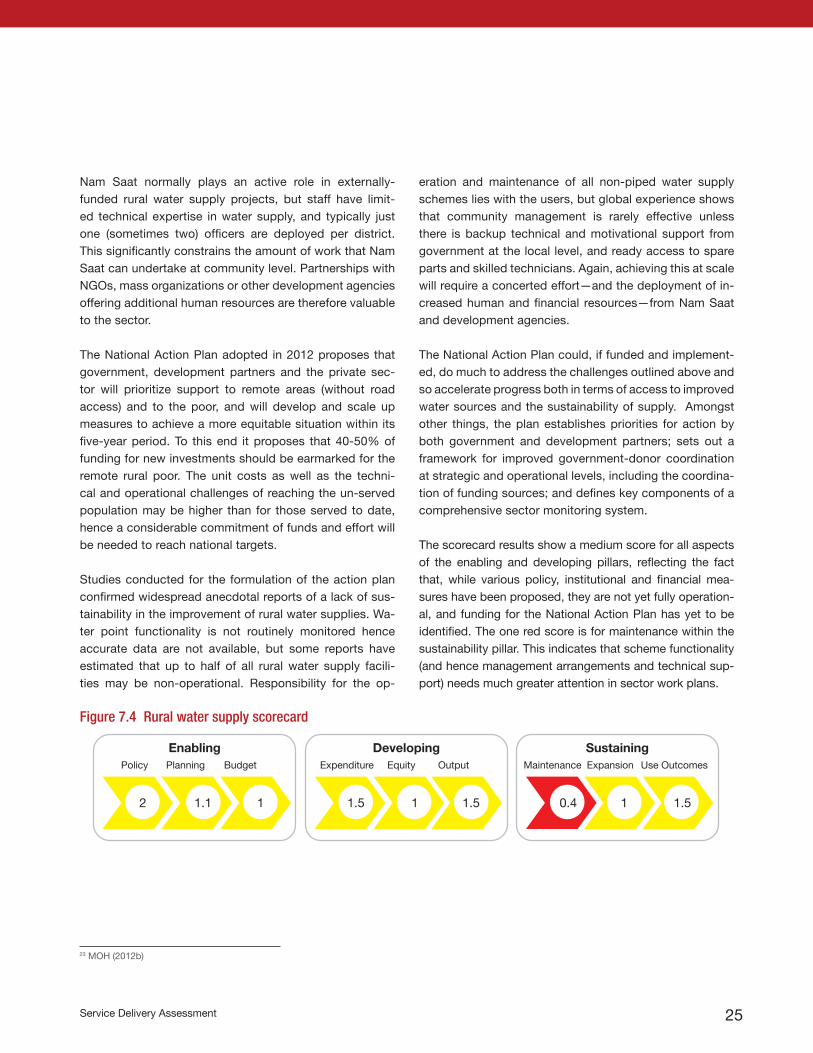
Service Delivery Assessment 25
Nam Saat normally plays an active role in externally-funded rural water supply projects, but staff have limit-ed technical expertise in water supply, and typically just one (sometimes two) officers are deployed per district. This significantly constrains the amount of work that Nam Saat can undertake at community level. Partnerships with NGOs, mass organizations or other development agencies offering additional human resources are therefore valuable to the sector.
The National Action Plan adopted in 2012 proposes that government, development partners and the private sec-tor will prioritize support to remote areas (without road access) and to the poor, and will develop and scale up measures to achieve a more equitable situation within its five-year period. To this end it proposes that 40-50% of funding for new investments should be earmarked for the remote rural poor. The unit costs as well as the techni-cal and operational challenges of reaching the un-served population may be higher than for those served to date, hence a considerable commitment of funds and effort will be needed to reach national targets.
Studies conducted for the formulation of the action plan confirmed widespread anecdotal reports of a lack of sus-tainability in the improvement of rural water supplies. Wa-ter point functionality is not routinely monitored hence accurate data are not available, but some reports have estimated that up to half of all rural water supply facili-ties may be non-operational. Responsibility for the op-
Enabling Developing SustainingPlanning
1.1
Policy
2
Budget
1
Output
1.5
Expenditure
1.5
Maintenance
0.4
Equity
1
Expansion
1 1.5
Use Outcomes
eration and maintenance of all non-piped water supply schemes lies with the users, but global experience shows that community management is rarely effective unless there is backup technical and motivational support from government at the local level, and ready access to spare parts and skilled technicians. Again, achieving this at scale will require a concerted effort—and the deployment of in-creased human and financial resources—from Nam Saat and development agencies.
The National Action Plan could, if funded and implement-ed, do much to address the challenges outlined above and so accelerate progress both in terms of access to improved water sources and the sustainability of supply. Amongst other things, the plan establishes priorities for action by both government and development partners; sets out a framework for improved government-donor coordination at strategic and operational levels, including the coordina-tion of funding sources; and defines key components of a comprehensive sector monitoring system.
The scorecard results show a medium score for all aspects of the enabling and developing pillars, reflecting the fact that, while various policy, institutional and financial mea-sures have been proposed, they are not yet fully operation-al, and funding for the National Action Plan has yet to be identified. The one red score is for maintenance within the sustainability pillar. This indicates that scheme functionality (and hence management arrangements and technical sup-port) needs much greater attention in sector work plans.
23 MOH (2012b)
Figure 7.4 Rural water supply scorecard
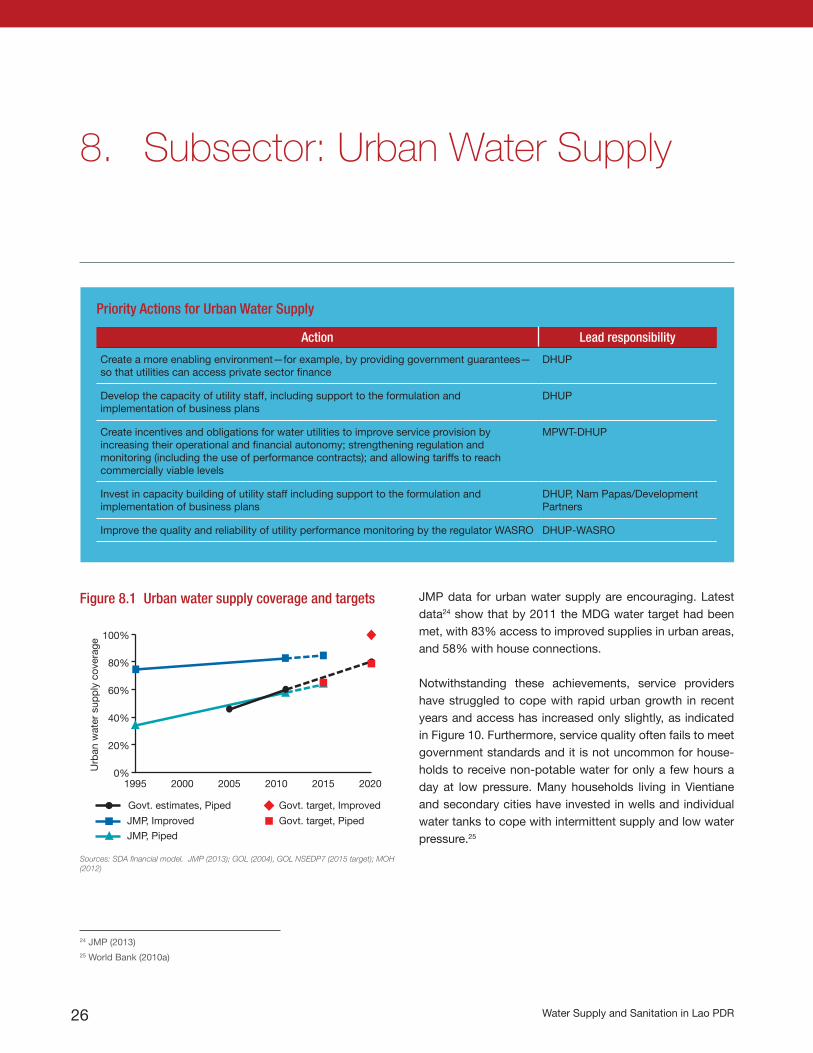
Water Supply and Sanitation in Lao PDR26
JMP data for urban water supply are encouraging. Latest data24 show that by 2011 the MDG water target had been met, with 83% access to improved supplies in urban areas, and 58% with house connections.
Notwithstanding these achievements, service providers have struggled to cope with rapid urban growth in recent years and access has increased only slightly, as indicated in Figure 10. Furthermore, service quality often fails to meet government standards and it is not uncommon for house-holds to receive non-potable water for only a few hours a day at low pressure. Many households living in Vientiane and secondary cities have invested in wells and individual water tanks to cope with intermittent supply and low water pressure.25
8. Subsector: Urban Water Supply
0%
20%
40%
60%
80%
100%
1995 2000 2005 2010
Urb
an w
ater
sup
ply
cove
rage
2015 2020
Govt. estimates, Piped Govt. target, Improved
JMP, Improved Govt. target, Piped
JMP, Piped
Figure 8.1 Urban water supply coverage and targets
Sources: SDA financial model. JMP (2013); GOL (2004), GOL NSEDP7 (2015 target); MOH (2012)
24 JMP (2013)25 World Bank (2010a)
Priority Actions for Urban Water Supply
Action Lead responsibility
Create a more enabling environment—for example, by providing government guarantees—so that utilities can access private sector finance
DHUP
Develop the capacity of utility staff, including support to the formulation and implementation of business plans
DHUP
Create incentives and obligations for water utilities to improve service provision by increasing their operational and financial autonomy; strengthening regulation and monitoring (including the use of performance contracts); and allowing tariffs to reach commercially viable levels
MPWT-DHUP
Invest in capacity building of utility staff including support to the formulation and implementation of business plans
DHUP, Nam Papas/Development Partners
Improve the quality and reliability of utility performance monitoring by the regulator WASRO DHUP-WASRO
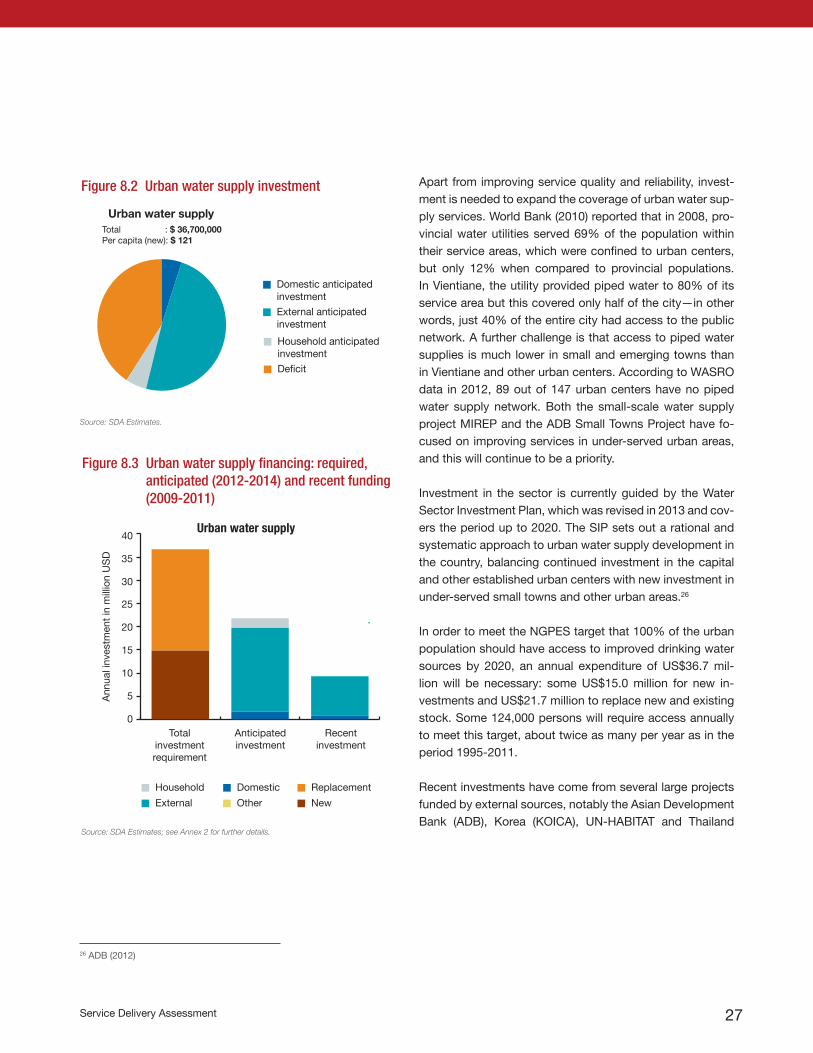
Service Delivery Assessment 27
Figure 8.3 Urban water supply financing: required, anticipated (2012-2014) and recent funding (2009-2011)
Figure 8.2 Urban water supply investment
Household anticipated investmentDeficit
Domestic anticipated investmentExternal anticipated investment
Urban water supplyTotal : $ 36,700,000Per capita (new): $ 121
Source: SDA Estimates.
Source: SDA Estimates; see Annex 2 for further details.
Totalinvestmentrequirement
Anticipatedinvestment
Recentinvestment
Ann
ual i
nves
tmen
t in
mill
ion
US
D
Urban water supply
0
5
10
15
20
25
Other
Replacement
New
Household
External
Domestic
30
35
40
Apart from improving service quality and reliability, invest-ment is needed to expand the coverage of urban water sup-ply services. World Bank (2010) reported that in 2008, pro-vincial water utilities served 69% of the population within their service areas, which were confined to urban centers, but only 12% when compared to provincial populations. In Vientiane, the utility provided piped water to 80% of its service area but this covered only half of the city—in other words, just 40% of the entire city had access to the public network. A further challenge is that access to piped water supplies is much lower in small and emerging towns than in Vientiane and other urban centers. According to WASRO data in 2012, 89 out of 147 urban centers have no piped water supply network. Both the small-scale water supply project MIREP and the ADB Small Towns Project have fo-cused on improving services in under-served urban areas, and this will continue to be a priority.
Investment in the sector is currently guided by the Water Sector Investment Plan, which was revised in 2013 and cov-ers the period up to 2020. The SIP sets out a rational and systematic approach to urban water supply development in the country, balancing continued investment in the capital and other established urban centers with new investment in under-served small towns and other urban areas.26
In order to meet the NGPES target that 100% of the urban population should have access to improved drinking water sources by 2020, an annual expenditure of US$36.7 mil-lion will be necessary: some US$15.0 million for new in-vestments and US$21.7 million to replace new and existing stock. Some 124,000 persons will require access annually to meet this target, about twice as many per year as in the period 1995-2011.
Recent investments have come from several large projects funded by external sources, notably the Asian Development Bank (ADB), Korea (KOICA), UN-HABITAT and Thailand
26 ADB (2012)
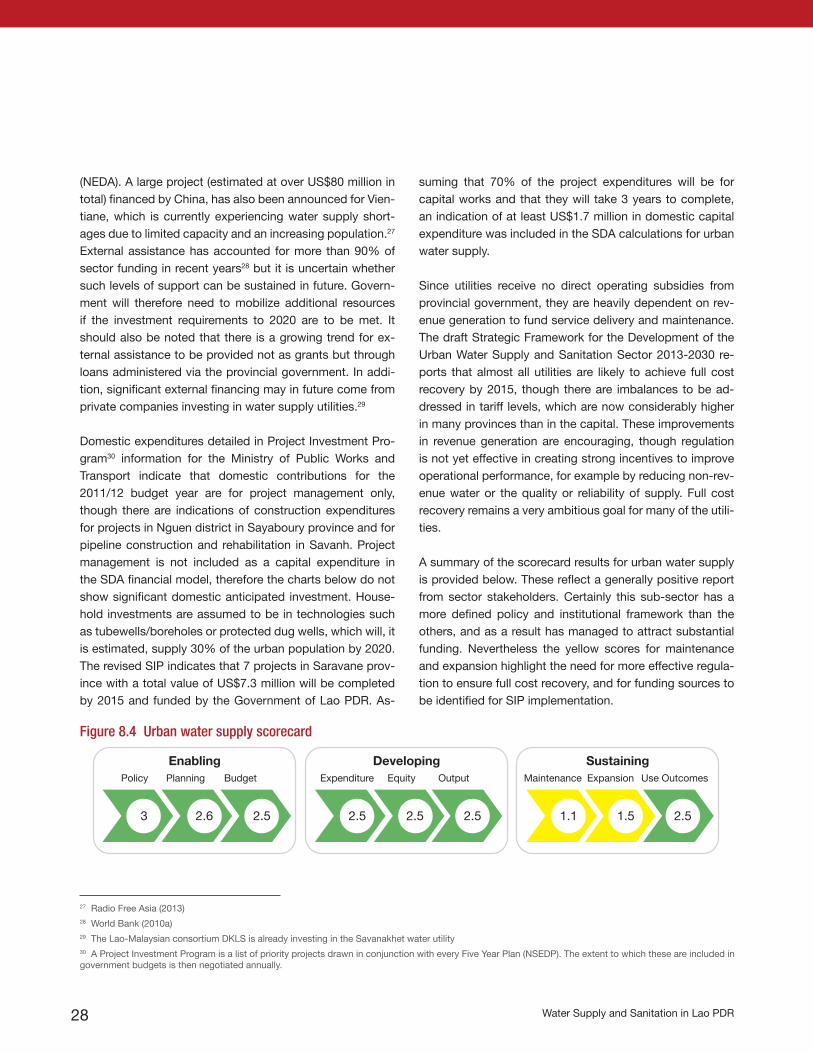
Water Supply and Sanitation in Lao PDR28
Enabling Developing SustainingPlanning
2.6
Policy
3
Budget
2.5
Output
2.5
Expenditure
2.5
Maintenance
1.1
Equity
2.5
Expansion
1.5 2.5
Use Outcomes
(NEDA). A large project (estimated at over US$80 million in total) financed by China, has also been announced for Vien-tiane, which is currently experiencing water supply short-ages due to limited capacity and an increasing population.27
External assistance has accounted for more than 90% of sector funding in recent years28 but it is uncertain whether such levels of support can be sustained in future. Govern-ment will therefore need to mobilize additional resources if the investment requirements to 2020 are to be met. It should also be noted that there is a growing trend for ex-ternal assistance to be provided not as grants but through loans administered via the provincial government. In addi-tion, significant external financing may in future come from private companies investing in water supply utilities.29
Domestic expenditures detailed in Project Investment Pro-gram30 information for the Ministry of Public Works and Transport indicate that domestic contributions for the 2011/12 budget year are for project management only, though there are indications of construction expenditures for projects in Nguen district in Sayaboury province and for pipeline construction and rehabilitation in Savanh. Project management is not included as a capital expenditure in the SDA financial model, therefore the charts below do not show significant domestic anticipated investment. House-hold investments are assumed to be in technologies such as tubewells/boreholes or protected dug wells, which will, it is estimated, supply 30% of the urban population by 2020. The revised SIP indicates that 7 projects in Saravane prov-ince with a total value of US$7.3 million will be completed by 2015 and funded by the Government of Lao PDR. As-
suming that 70% of the project expenditures will be for capital works and that they will take 3 years to complete, an indication of at least US$1.7 million in domestic capital expenditure was included in the SDA calculations for urban water supply.
Since utilities receive no direct operating subsidies from provincial government, they are heavily dependent on rev-enue generation to fund service delivery and maintenance. The draft Strategic Framework for the Development of the Urban Water Supply and Sanitation Sector 2013-2030 re-ports that almost all utilities are likely to achieve full cost recovery by 2015, though there are imbalances to be ad-dressed in tariff levels, which are now considerably higher in many provinces than in the capital. These improvements in revenue generation are encouraging, though regulation is not yet effective in creating strong incentives to improve operational performance, for example by reducing non-rev-enue water or the quality or reliability of supply. Full cost recovery remains a very ambitious goal for many of the utili-ties.
A summary of the scorecard results for urban water supply is provided below. These reflect a generally positive report from sector stakeholders. Certainly this sub-sector has a more defined policy and institutional framework than the others, and as a result has managed to attract substantial funding. Nevertheless the yellow scores for maintenance and expansion highlight the need for more effective regula-tion to ensure full cost recovery, and for funding sources to be identified for SIP implementation.
27 Radio Free Asia (2013) 28 World Bank (2010a)29 The Lao-Malaysian consortium DKLS is already investing in the Savanakhet water utility30 A Project Investment Program is a list of priority projects drawn in conjunction with every Five Year Plan (NSEDP). The extent to which these are included in government budgets is then negotiated annually.
Figure 8.4 Urban water supply scorecard
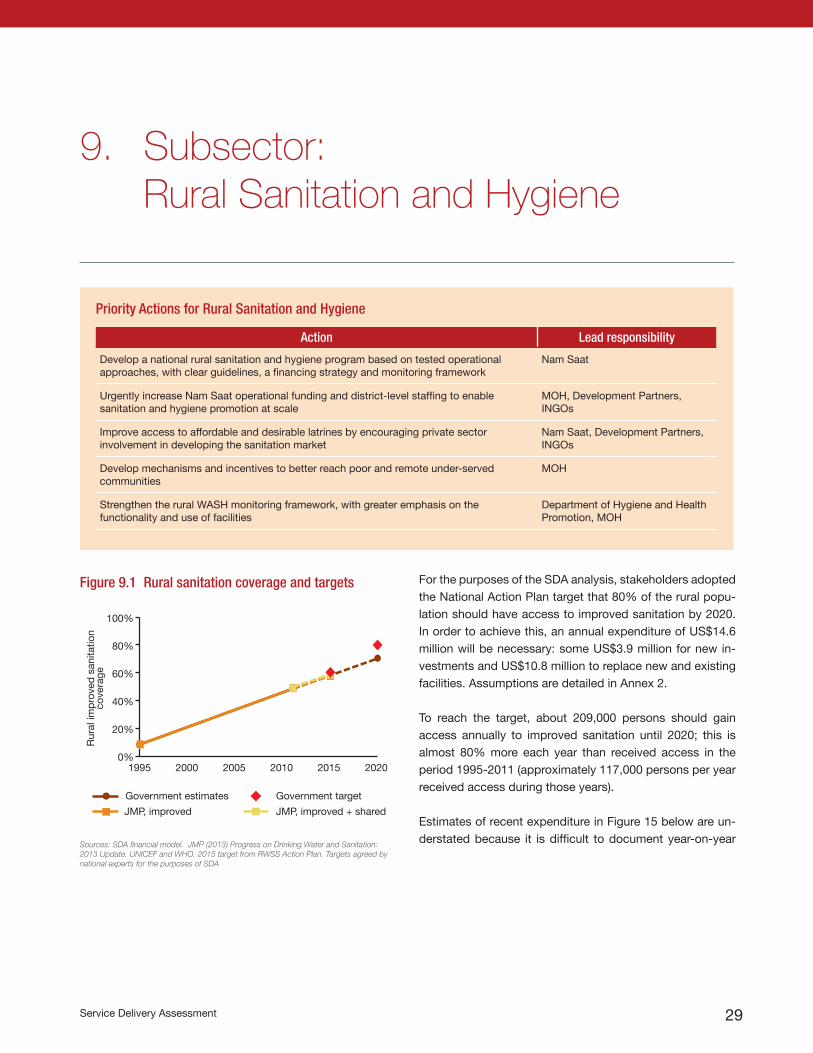
Service Delivery Assessment 29
Priority Actions for Rural Sanitation and Hygiene
Action Lead responsibility
Develop a national rural sanitation and hygiene program based on tested operational approaches, with clear guidelines, a financing strategy and monitoring framework
Nam Saat
Urgently increase Nam Saat operational funding and district-level staffing to enable sanitation and hygiene promotion at scale
MOH, Development Partners, INGOs
Improve access to affordable and desirable latrines by encouraging private sector involvement in developing the sanitation market
Nam Saat, Development Partners, INGOs
Develop mechanisms and incentives to better reach poor and remote under-served communities
MOH
Strengthen the rural WASH monitoring framework, with greater emphasis on the functionality and use of facilities
Department of Hygiene and Health Promotion, MOH
9. Subsector: Rural Sanitation and Hygiene
For the purposes of the SDA analysis, stakeholders adopted the National Action Plan target that 80% of the rural popu-lation should have access to improved sanitation by 2020. In order to achieve this, an annual expenditure of US$14.6 million will be necessary: some US$3.9 million for new in-vestments and US$10.8 million to replace new and existing facilities. Assumptions are detailed in Annex 2.
To reach the target, about 209,000 persons should gain access annually to improved sanitation until 2020; this is almost 80% more each year than received access in the period 1995-2011 (approximately 117,000 persons per year received access during those years).
Estimates of recent expenditure in Figure 15 below are un-derstated because it is difficult to document year-on-year
Figure 9.1 Rural sanitation coverage and targets
Sources: SDA financial model. JMP (2013) Progress on Drinking Water and Sanitation: 2013 Update. UNICEF and WHO. 2015 target from RWSS Action Plan. Targets agreed by national experts for the purposes of SDA
0%
20%
40%
60%
80%
100%
1995 2000 2005 2010
Rur
al im
prov
ed s
anita
tion
cove
rage
Government estimates Government target
JMP, improved JMP, improved + shared
2015 2020
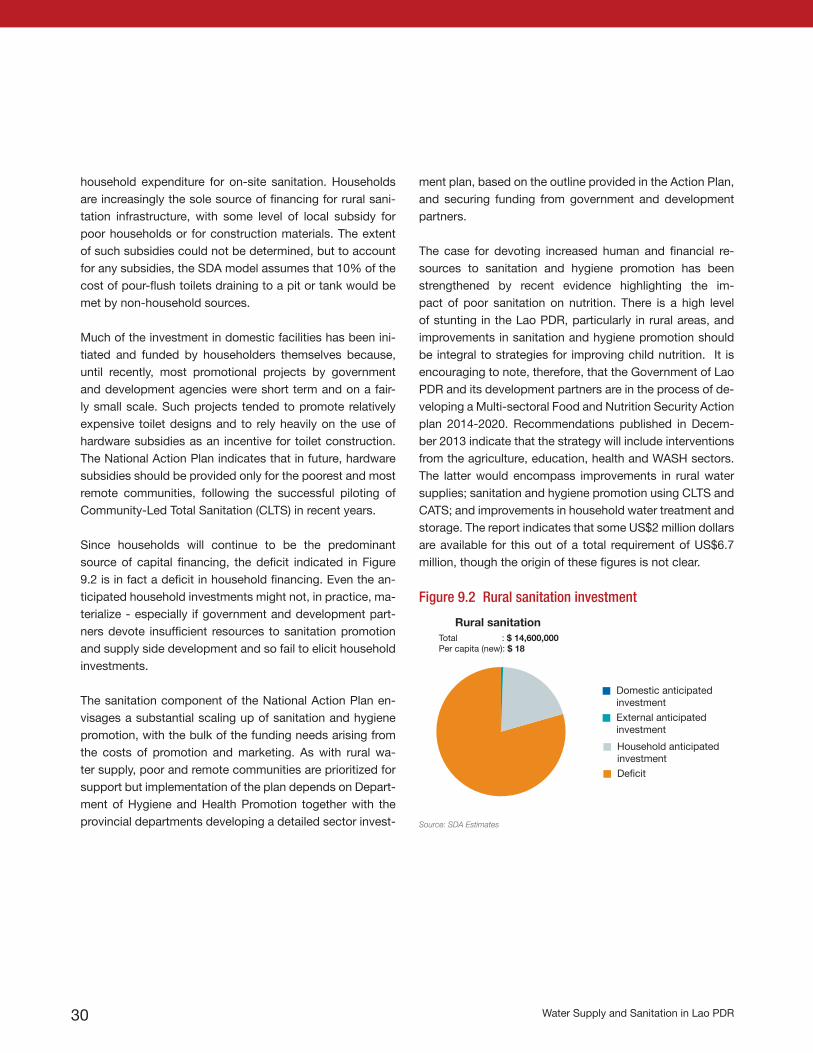
Water Supply and Sanitation in Lao PDR30
ment plan, based on the outline provided in the Action Plan, and securing funding from government and development partners.
The case for devoting increased human and financial re-sources to sanitation and hygiene promotion has been strengthened by recent evidence highlighting the im-pact of poor sanitation on nutrition. There is a high level of stunting in the Lao PDR, particularly in rural areas, and improvements in sanitation and hygiene promotion should be integral to strategies for improving child nutrition. It is encouraging to note, therefore, that the Government of Lao PDR and its development partners are in the process of de-veloping a Multi-sectoral Food and Nutrition Security Action plan 2014-2020. Recommendations published in Decem-ber 2013 indicate that the strategy will include interventions from the agriculture, education, health and WASH sectors. The latter would encompass improvements in rural water supplies; sanitation and hygiene promotion using CLTS and CATS; and improvements in household water treatment and storage. The report indicates that some US$2 million dollars are available for this out of a total requirement of US$6.7 million, though the origin of these figures is not clear.
Figure 9.2 Rural sanitation investment
Source: SDA Estimates
Household anticipated investmentDeficit
Domestic anticipated investmentExternal anticipated investment
Rural sanitationTotal : $ 14,600,000Per capita (new): $ 18
household expenditure for on-site sanitation. Households are increasingly the sole source of financing for rural sani-tation infrastructure, with some level of local subsidy for poor households or for construction materials. The extent of such subsidies could not be determined, but to account for any subsidies, the SDA model assumes that 10% of the cost of pour-flush toilets draining to a pit or tank would be met by non-household sources.
Much of the investment in domestic facilities has been ini-tiated and funded by householders themselves because, until recently, most promotional projects by government and development agencies were short term and on a fair-ly small scale. Such projects tended to promote relatively expensive toilet designs and to rely heavily on the use of hardware subsidies as an incentive for toilet construction. The National Action Plan indicates that in future, hardware subsidies should be provided only for the poorest and most remote communities, following the successful piloting of Community-Led Total Sanitation (CLTS) in recent years.
Since households will continue to be the predominant source of capital financing, the deficit indicated in Figure 9.2 is in fact a deficit in household financing. Even the an-ticipated household investments might not, in practice, ma-terialize - especially if government and development part-ners devote insufficient resources to sanitation promotion and supply side development and so fail to elicit household investments.
The sanitation component of the National Action Plan en-visages a substantial scaling up of sanitation and hygiene promotion, with the bulk of the funding needs arising from the costs of promotion and marketing. As with rural wa-ter supply, poor and remote communities are prioritized for support but implementation of the plan depends on Depart-ment of Hygiene and Health Promotion together with the provincial departments developing a detailed sector invest-
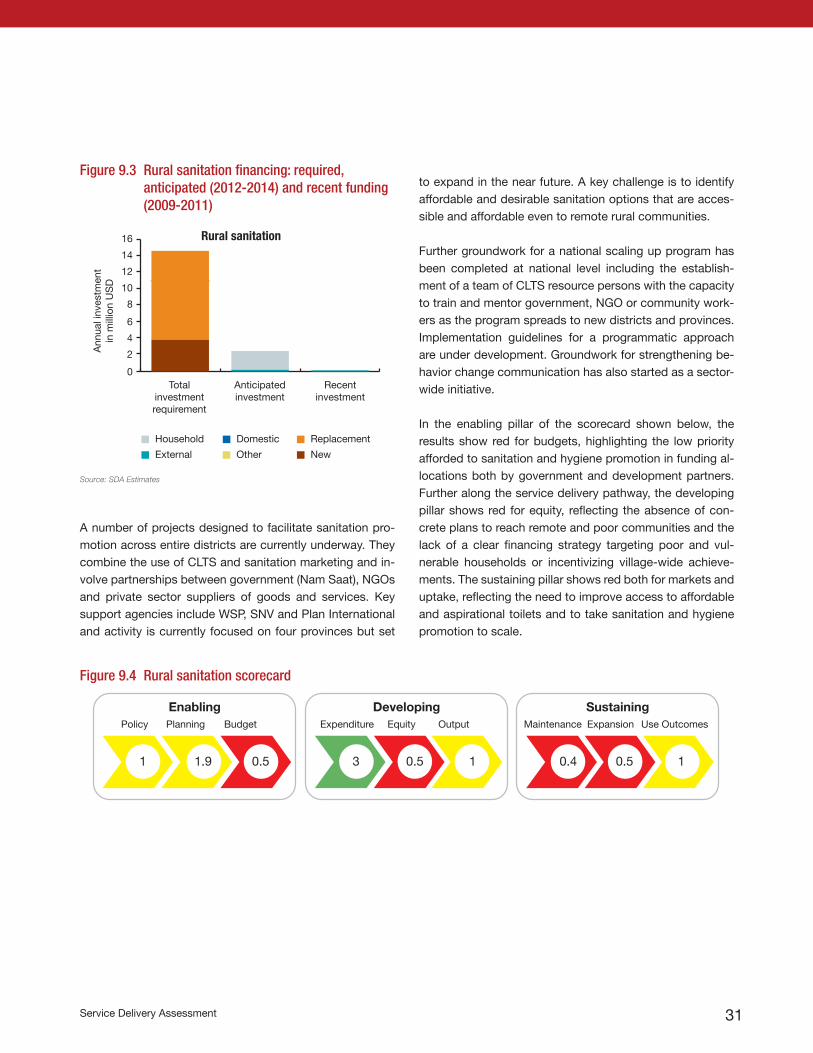
Service Delivery Assessment 31
Enabling Developing SustainingPlanning
1.9
Policy
1
Budget
0.5
Output
1
Expenditure
3
Maintenance
0.4
Equity
0.5
Expansion
0.5
Use Outcomes
1
A number of projects designed to facilitate sanitation pro-motion across entire districts are currently underway. They combine the use of CLTS and sanitation marketing and in-volve partnerships between government (Nam Saat), NGOs and private sector suppliers of goods and services. Key support agencies include WSP, SNV and Plan International and activity is currently focused on four provinces but set
to expand in the near future. A key challenge is to identify affordable and desirable sanitation options that are acces-sible and affordable even to remote rural communities.
Further groundwork for a national scaling up program has been completed at national level including the establish-ment of a team of CLTS resource persons with the capacity to train and mentor government, NGO or community work-ers as the program spreads to new districts and provinces. Implementation guidelines for a programmatic approach are under development. Groundwork for strengthening be-havior change communication has also started as a sector-wide initiative.
In the enabling pillar of the scorecard shown below, the results show red for budgets, highlighting the low priority afforded to sanitation and hygiene promotion in funding al-locations both by government and development partners. Further along the service delivery pathway, the developing pillar shows red for equity, reflecting the absence of con-crete plans to reach remote and poor communities and the lack of a clear financing strategy targeting poor and vul-nerable households or incentivizing village-wide achieve-ments. The sustaining pillar shows red both for markets and uptake, reflecting the need to improve access to affordable and aspirational toilets and to take sanitation and hygiene promotion to scale.
Figure 9.3 Rural sanitation financing: required, anticipated (2012-2014) and recent funding (2009-2011)
Totalinvestmentrequirement
Anticipatedinvestment
Recentinvestment
Ann
ual i
nves
tmen
tin
mill
ion
US
D
Rural sanitation
0
2
4
6
8
10
Other
Replacement
New
Household
External
Domestic
12
14
16
Source: SDA Estimates
Figure 9.4 Rural sanitation scorecard
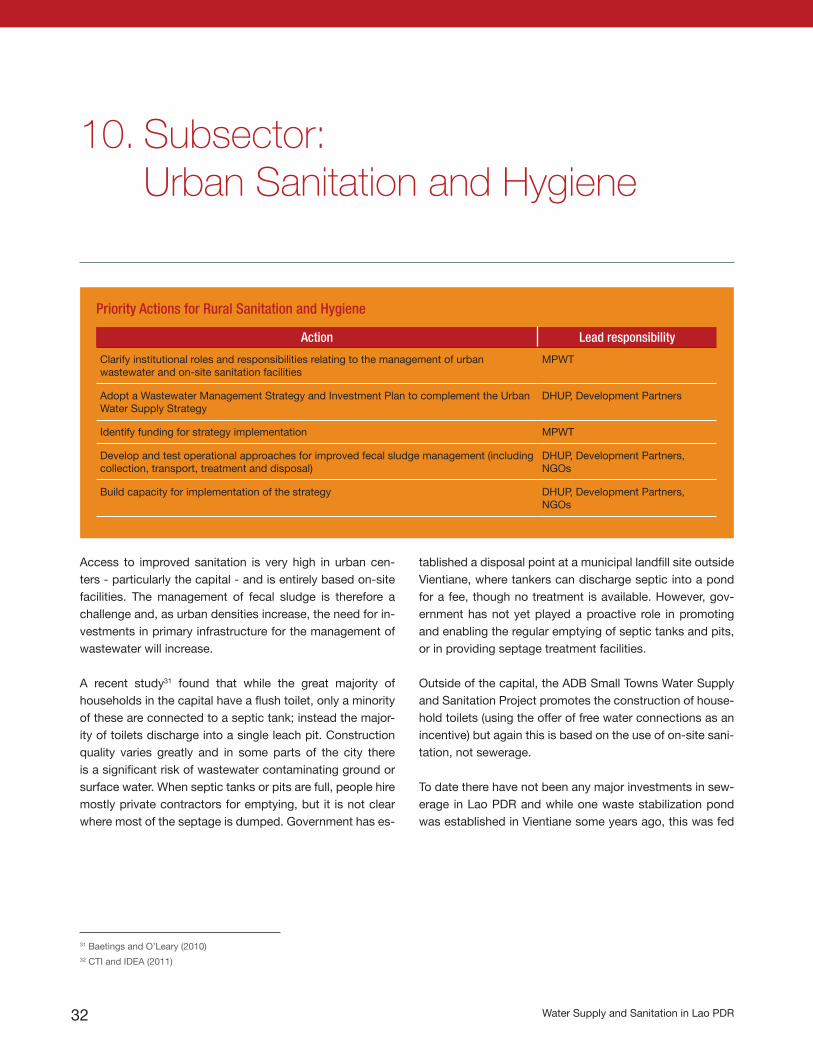
Water Supply and Sanitation in Lao PDR32
Access to improved sanitation is very high in urban cen-ters - particularly the capital - and is entirely based on-site facilities. The management of fecal sludge is therefore a challenge and, as urban densities increase, the need for in-vestments in primary infrastructure for the management of wastewater will increase.
A recent study31 found that while the great majority of households in the capital have a flush toilet, only a minority of these are connected to a septic tank; instead the major-ity of toilets discharge into a single leach pit. Construction quality varies greatly and in some parts of the city there is a significant risk of wastewater contaminating ground or surface water. When septic tanks or pits are full, people hire mostly private contractors for emptying, but it is not clear where most of the septage is dumped. Government has es-
10. Subsector: Urban Sanitation and Hygiene
tablished a disposal point at a municipal landfill site outside Vientiane, where tankers can discharge septic into a pond for a fee, though no treatment is available. However, gov-ernment has not yet played a proactive role in promoting and enabling the regular emptying of septic tanks and pits, or in providing septage treatment facilities.
Outside of the capital, the ADB Small Towns Water Supply and Sanitation Project promotes the construction of house-hold toilets (using the offer of free water connections as an incentive) but again this is based on the use of on-site sani-tation, not sewerage.
To date there have not been any major investments in sew-erage in Lao PDR and while one waste stabilization pond was established in Vientiane some years ago, this was fed
31 Baetings and O’Leary (2010) 32 CTI and IDEA (2011)
Priority Actions for Rural Sanitation and Hygiene
Action Lead responsibility
Clarify institutional roles and responsibilities relating to the management of urban wastewater and on-site sanitation facilities
MPWT
Adopt a Wastewater Management Strategy and Investment Plan to complement the Urban Water Supply Strategy
DHUP, Development Partners
Identify funding for strategy implementation MPWT
Develop and test operational approaches for improved fecal sludge management (including collection, transport, treatment and disposal)
DHUP, Development Partners, NGOs
Build capacity for implementation of the strategy DHUP, Development Partners, NGOs
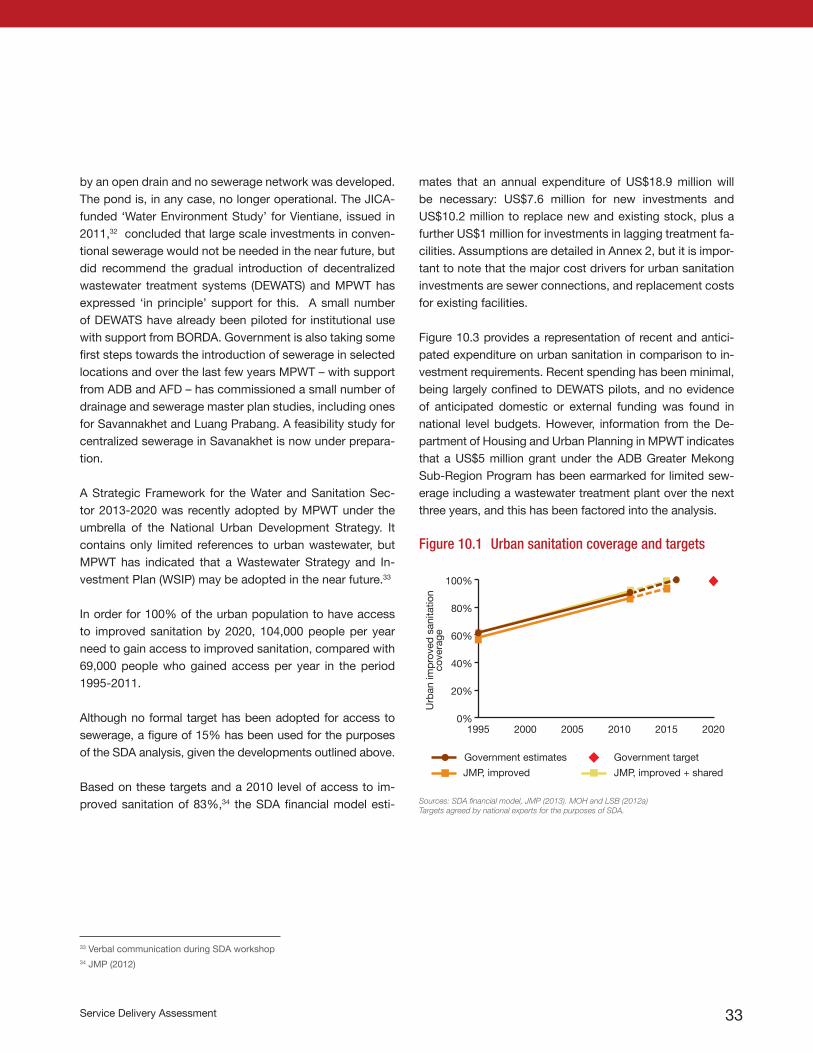
Service Delivery Assessment 33
0%
20%
40%
60%
80%
100%
1995 2000 2005 2010
Urb
an im
prov
ed s
anita
tion
cove
rage
Government estimates Government target
JMP, improved JMP, improved + shared
2015 2020
by an open drain and no sewerage network was developed. The pond is, in any case, no longer operational. The JICA-funded ‘Water Environment Study’ for Vientiane, issued in 2011,32 concluded that large scale investments in conven-tional sewerage would not be needed in the near future, but did recommend the gradual introduction of decentralized wastewater treatment systems (DEWATS) and MPWT has expressed ‘in principle’ support for this. A small number of DEWATS have already been piloted for institutional use with support from BORDA. Government is also taking some first steps towards the introduction of sewerage in selected locations and over the last few years MPWT – with support from ADB and AFD – has commissioned a small number of drainage and sewerage master plan studies, including ones for Savannakhet and Luang Prabang. A feasibility study for centralized sewerage in Savanakhet is now under prepara-tion.
A Strategic Framework for the Water and Sanitation Sec-tor 2013-2020 was recently adopted by MPWT under the umbrella of the National Urban Development Strategy. It contains only limited references to urban wastewater, but MPWT has indicated that a Wastewater Strategy and In-vestment Plan (WSIP) may be adopted in the near future.33
In order for 100% of the urban population to have access to improved sanitation by 2020, 104,000 people per year need to gain access to improved sanitation, compared with 69,000 people who gained access per year in the period 1995-2011.
Although no formal target has been adopted for access to sewerage, a figure of 15% has been used for the purposes of the SDA analysis, given the developments outlined above.
Based on these targets and a 2010 level of access to im-proved sanitation of 83%,34 the SDA financial model esti-
mates that an annual expenditure of US$18.9 million will be necessary: US$7.6 million for new investments and US$10.2 million to replace new and existing stock, plus a further US$1 million for investments in lagging treatment fa-cilities. Assumptions are detailed in Annex 2, but it is impor-tant to note that the major cost drivers for urban sanitation investments are sewer connections, and replacement costs for existing facilities.
Figure 10.3 provides a representation of recent and antici-pated expenditure on urban sanitation in comparison to in-vestment requirements. Recent spending has been minimal, being largely confined to DEWATS pilots, and no evidence of anticipated domestic or external funding was found in national level budgets. However, information from the De-partment of Housing and Urban Planning in MPWT indicates that a US$5 million grant under the ADB Greater Mekong Sub-Region Program has been earmarked for limited sew-erage including a wastewater treatment plant over the next three years, and this has been factored into the analysis.
Figure 10.1 Urban sanitation coverage and targets
Sources: SDA financial model, JMP (2013). MOH and LSB (2012a) Targets agreed by national experts for the purposes of SDA.
33 Verbal communication during SDA workshop34 JMP (2012)
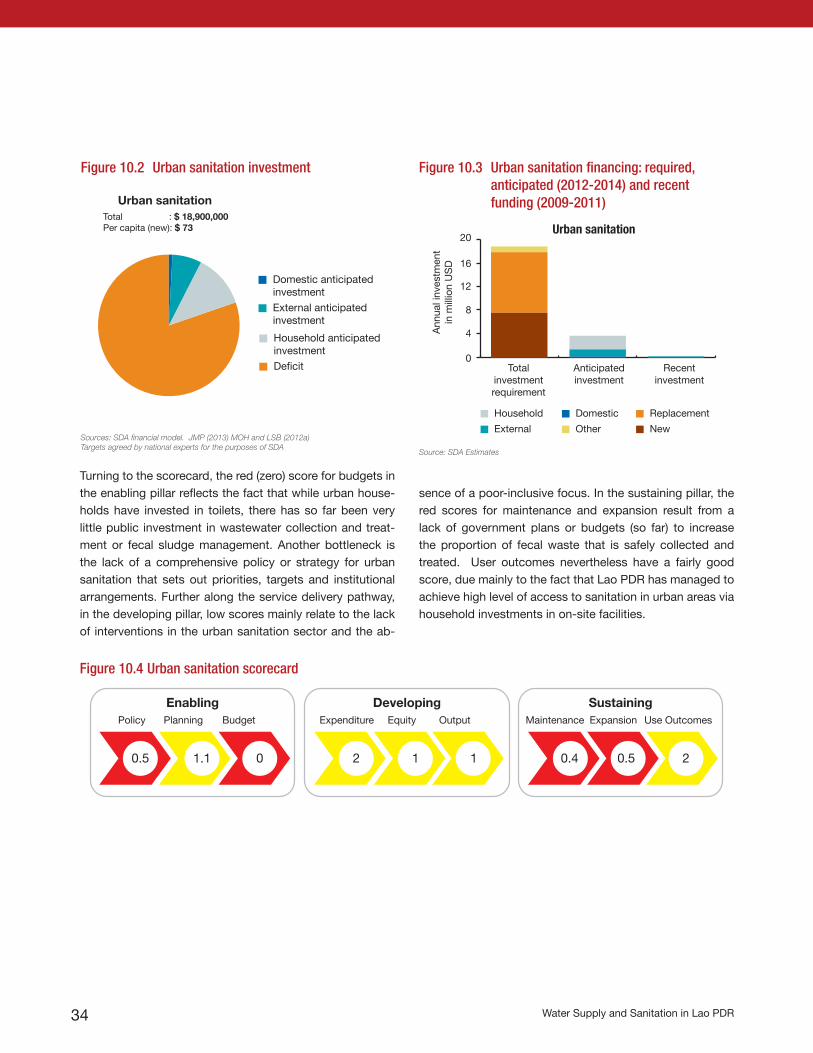
Water Supply and Sanitation in Lao PDR34
Totalinvestmentrequirement
Anticipatedinvestment
Recentinvestment
Ann
ual i
nves
tmen
tin
mill
ion
US
D
Urban sanitation
0
4
8
12
Other
Replacement
New
Household
External
Domestic
16
20
Figure 10.3 Urban sanitation financing: required, anticipated (2012-2014) and recent funding (2009-2011)
Turning to the scorecard, the red (zero) score for budgets in the enabling pillar reflects the fact that while urban house-holds have invested in toilets, there has so far been very little public investment in wastewater collection and treat-ment or fecal sludge management. Another bottleneck is the lack of a comprehensive policy or strategy for urban sanitation that sets out priorities, targets and institutional arrangements. Further along the service delivery pathway, in the developing pillar, low scores mainly relate to the lack of interventions in the urban sanitation sector and the ab-
Enabling Developing SustainingPlanning
1.1
Policy
0.5
Budget
0
Output
1
Expenditure
2
Maintenance
0.4
Equity
1
Expansion
0.5
Use Outcomes
2
Figure 10.2 Urban sanitation investment
Source: SDA Estimates
Household anticipated investmentDeficit
Domestic anticipated investmentExternal anticipated investment
Urban sanitationTotal : $ 18,900,000Per capita (new): $ 73
Figure 10.4 Urban sanitation scorecard
sence of a poor-inclusive focus. In the sustaining pillar, the red scores for maintenance and expansion result from a lack of government plans or budgets (so far) to increase the proportion of fecal waste that is safely collected and treated. User outcomes nevertheless have a fairly good score, due mainly to the fact that Lao PDR has managed to achieve high level of access to sanitation in urban areas via household investments in on-site facilities.
Sources: SDA financial model. JMP (2013) MOH and LSB (2012a) Targets agreed by national experts for the purposes of SDA
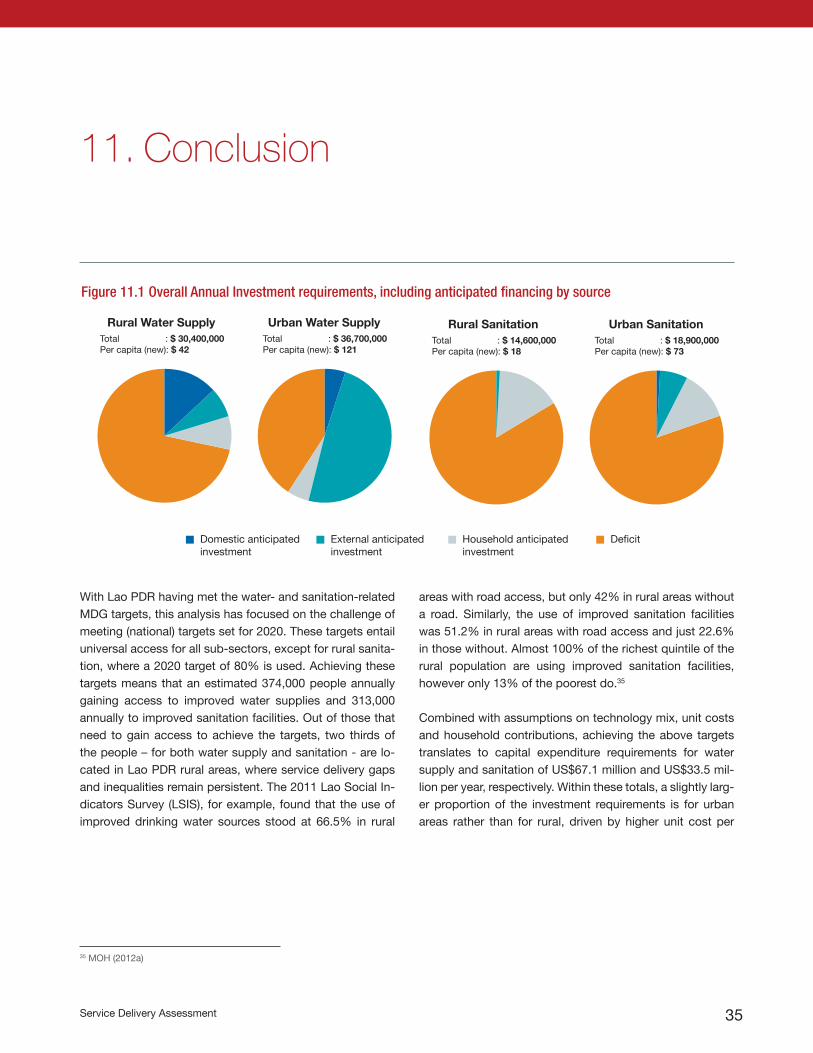
Service Delivery Assessment 35
Domestic anticipated investment
External anticipated investment
Household anticipated investment
Deficit
Urban Water SupplyTotal : $ 36,700,000Per capita (new): $ 121
Rural Water SupplyTotal : $ 30,400,000Per capita (new): $ 42
Urban SanitationTotal : $ 18,900,000Per capita (new): $ 73
Rural SanitationTotal : $ 14,600,000Per capita (new): $ 18
With Lao PDR having met the water- and sanitation-related MDG targets, this analysis has focused on the challenge of meeting (national) targets set for 2020. These targets entail universal access for all sub-sectors, except for rural sanita-tion, where a 2020 target of 80% is used. Achieving these targets means that an estimated 374,000 people annually gaining access to improved water supplies and 313,000 annually to improved sanitation facilities. Out of those that need to gain access to achieve the targets, two thirds of the people – for both water supply and sanitation - are lo-cated in Lao PDR rural areas, where service delivery gaps and inequalities remain persistent. The 2011 Lao Social In-dicators Survey (LSIS), for example, found that the use of improved drinking water sources stood at 66.5% in rural
11. Conclusion
areas with road access, but only 42% in rural areas without a road. Similarly, the use of improved sanitation facilities was 51.2% in rural areas with road access and just 22.6% in those without. Almost 100% of the richest quintile of the rural population are using improved sanitation facilities, however only 13% of the poorest do.35
Combined with assumptions on technology mix, unit costs and household contributions, achieving the above targets translates to capital expenditure requirements for water supply and sanitation of US$67.1 million and US$33.5 mil-lion per year, respectively. Within these totals, a slightly larg-er proportion of the investment requirements is for urban areas rather than for rural, driven by higher unit cost per
35 MOH (2012a)
Figure 11.1 Overall Annual Investment requirements, including anticipated financing by source
Water Supply and Sanitation in Lao PDR36
capita in urban settings and higher levels of services. How-ever, the projected expenditures of government and devel-opment for water supply are estimated to be only US$26.1 million, of which over three quarters for urban water supply, and only US$1.6 for sanitation, of which almost nothing for rural sanitation. This illustrates the bias towards urban in-vestments and stepping up investments in rural water sup-ply and sanitation remains a critical area for government and development partner action.
Assuming that all of the anticipated household contributions materialize, these findings imply capital expenditure deficits for water supply of US$36.8 million and US$30.3 million per year for sanitation, respectively. Apart from investment requirements, an estimated US$12 million per year is re-quired for the operation and maintenance of water supply and sanitation services, largely to be covered through user fees and contributions.
While increased funding is essential if the targets are to be met, there are other conditions, which also need to be in place if access to improved services is to be expanded and sustained. These are indicated across the scorecard as yel-low - or worse - red buildings blocks, representing block-ages in service delivery, while green indicates a driver for service delivery.
Rural water supply scores well on policy but not on plan-ning and finance, reflecting the fact that a National Action Plan has been approved but is not yet funded, and that sub-sector planning and coordination are fragmented. Fur-ther challenges relate to low rates of access in poor and remote communities, and low scores on maintenance for rural areas as whole, reflecting high reported rates of non-functioning water points. Addressing these challenges will require not only an increase in the allocation of human and financial resources but also improved technical support
mechanisms for rural communities, viable operation and maintenance provisions and the development of more ef-fective and professionalized management arrangements for rural water supply schemes.
The enabling pillar of the rural sanitation sub-sector score-card reflects low budgets and the absence of policy and sector-wide planning mechanisms. Under the developing pillar, limited modest scores for equity and output reflect the lack of pro-poor operational strategies and the generally low level of activity in sanitation and hygiene promotion in most districts (which in itself allows fairly good expenditure as the amounts allocated are tiny). Under the sustaining pil-lar, low scores on market and uptake indicate that demand generation for, and private sector provision of, sanitation goods and services are both under-developed and that such “software” interventions will require much more finan-cial and human resources to reach those unserved.
Only urban water supply shows a good score for the three elements of policy, planning and budgets within the enabling pillar. This reflects the fact that the policy and institutional framework is well established for this sub-sector and a sec-tor investment plan is in place. This foundation combined with fund mobilization means that further along the service delivery pathway, urban water supply again scores well on developing new services. There are bottlenecks, however, under the sustaining pillar, both in terms of expansion to un-derserved areas including provincial capitals, smaller towns and ‘urban’ districts, and in ensuring cost recovery, mainte-nance and quality of services through effective regulation.
This situation is in marked contrast to urban sanitation, which scores poorly across the enabling, developing and sustaining pillars, especially in light of more public policy goals beyond on-site access, which already is high in Lao PDR. The scorecard thus reflects the fact that the urban
Service Delivery Assessment 37
sanitation sub-sector is still developing. So far there has not been large scale investment in wastewater collection and treatment while the management of on-site services on which most people depend, in particular fecal sludge man-agement, has not yet received much attention from govern-ment. This may change, however, if a Wastewater Strategy and Investment Plan is developed.
Key actions for the sector to resolve the challenges high-lighted by this Service Delivery Assessment are to:
• Implement the National Rural Water Supply, Sanita-tion and Hygiene Action Plan, since funding gaps and inequalities in access are most profound in these sub-sectors, especially in remote and ethnic areas.
• Develop an overarching policy on WASH for both urban and rural areas, including creating a separate budget line for WASH in the national budget.
• Develop a national capacity building program to improve district-level operational resources and capabilities for rural water supply and sanitation service delivery.
• Improve regulatory environment, financial autonomy and investment climate for water utilities, so as to en-courage increased private sector involvement, expan-sion and sustainability of service delivery.
• Improve financial monitoring mechanisms so that gov-ernment and donor expenditure in each sub-sector can be reported effectively at national and sub-national level.
• Strengthen sector monitoring and government-donor coordination through the establishment of a system of Joint Annual Sector Reviews (urban and rural), focusing on key indicators relating to sector goals; equity in the allocation of sector funding; the effectiveness of imple-mentation processes; and the quality, functionality and use of facilities and services.
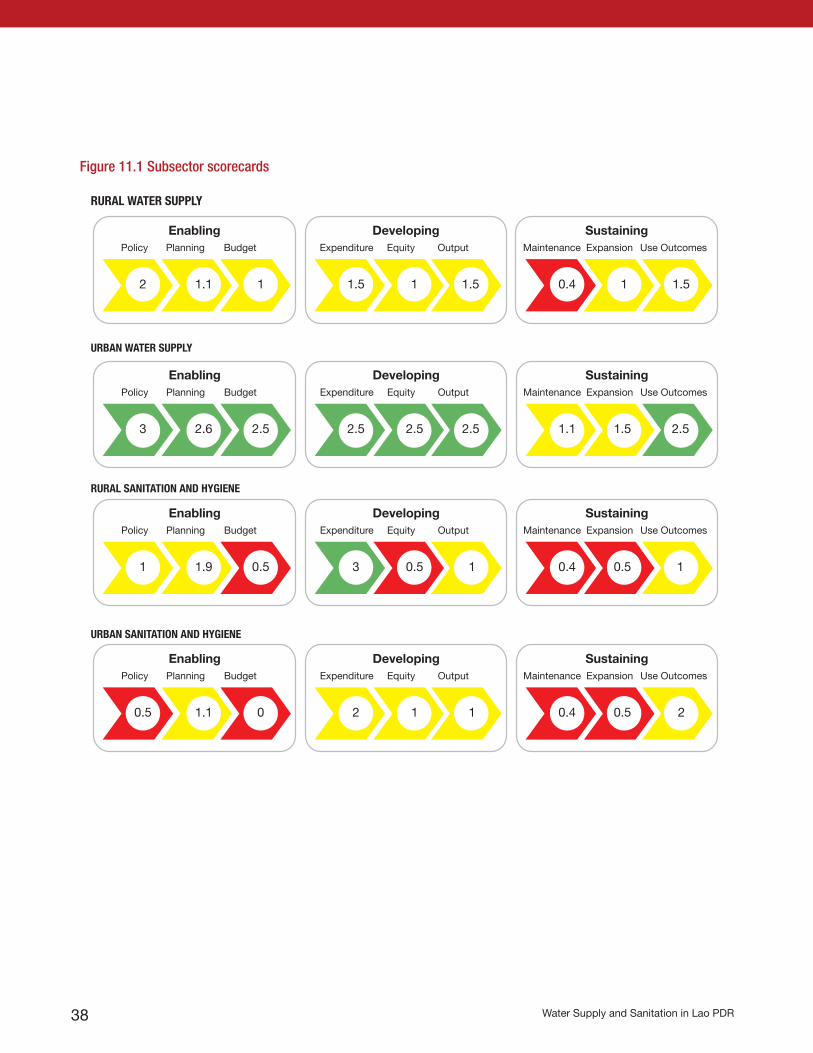
Water Supply and Sanitation in Lao PDR38
RURAL WATER SUPPLY
URBAN WATER SUPPLY
RURAL SANITATION AND HYGIENE
URBAN SANITATION AND HYGIENE
Enabling Developing SustainingPlanning
1.1
Policy
2
Budget
1
Output
1.5
Expenditure
1.5
Maintenance
0.4
Equity
1
Expansion
1 1.5
Use Outcomes
Enabling Developing SustainingPlanning
2.6
Policy
3
Budget
2.5
Output
2.5
Expenditure
2.5
Maintenance
1.1
Equity
2.5
Expansion
1.5 2.5
Use Outcomes
Enabling Developing SustainingPlanning
1.9
Policy
1
Budget
0.5
Output
1
Expenditure
3
Maintenance
0.4
Equity
0.5
Expansion
0.5
Use Outcomes
1
Enabling Developing SustainingPlanning
1.1
Policy
0.5
Budget
0
Output
1
Expenditure
2
Maintenance
0.4
Equity
1
Expansion
0.5
Use Outcomes
2
Figure 11.1 Subsector scorecards
Annexes

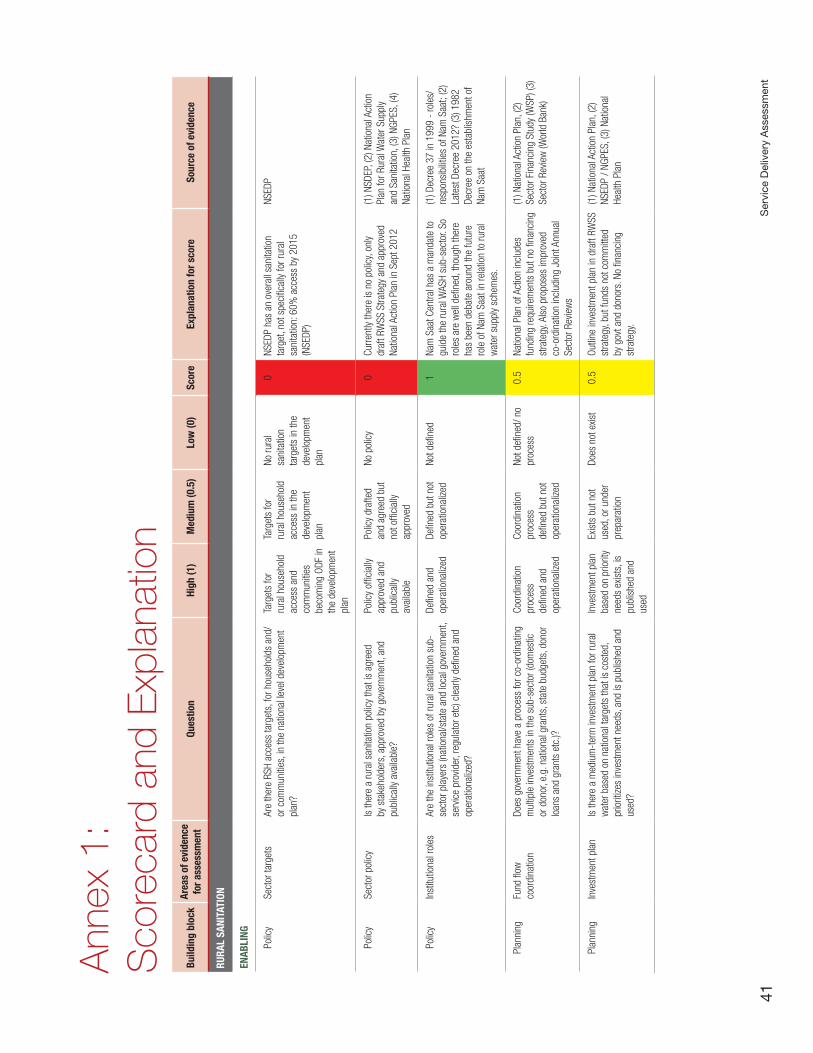
Ser
vice
Del
iver
y A
sses
smen
t41
Ann
ex 1
: S
core
card
and
Exp
lana
tion
Build
ing
bloc
kAr
eas
of e
vide
nce
for a
sses
smen
tQu
estio
nHi
gh (1
)M
ediu
m (0
.5)
Low
(0)
Scor
eEx
plan
atio
n fo
r sco
reSo
urce
of e
vide
nce
RURA
L SA
NITA
TION
ENAB
LING
Polic
ySe
ctor
targ
ets
Are
ther
e RS
H ac
cess
targ
ets,
for h
ouse
hold
s an
d/or
com
mun
ities
, in
the
natio
nal l
evel
dev
elop
men
t pl
an?
Targ
ets
for
rura
l hou
seho
ld
acce
ss a
nd
com
mun
ities
be
com
ing
ODF
in
the
deve
lopm
ent
plan
Targ
ets
for
rura
l hou
seho
ld
acce
ss in
the
deve
lopm
ent
plan
No ru
ral
sani
tatio
n ta
rget
s in
the
deve
lopm
ent
plan
0NS
EDP
has
an o
vera
ll sa
nita
tion
targ
et, n
ot s
peci
fical
ly fo
r rur
al
sani
tatio
n: 6
0% a
cces
s by
201
5 (N
SEDP
)
NSED
P
Polic
ySe
ctor
pol
icy
Is th
ere
a ru
ral s
anita
tion
polic
y th
at is
agr
eed
by s
take
hold
ers,
app
rove
d by
gov
ernm
ent,
and
publ
ical
ly av
aila
ble?
Polic
y of
ficia
lly
appr
oved
and
pu
blic
ally
avai
labl
e
Polic
y dr
afte
d an
d ag
reed
but
no
t offi
cial
ly ap
prov
ed
No p
olic
y0
Curre
ntly
ther
e is
no
polic
y, on
ly dr
aft R
WSS
Stra
tegy
and
app
rove
d Na
tiona
l Act
ion
Plan
in S
ept 2
012
(1) N
SDEP
, (2)
Nat
iona
l Act
ion
Plan
for R
ural
Wat
er S
uppl
y an
d Sa
nita
tion,
(3) N
GPES
, (4)
Na
tiona
l Hea
lth P
lan
Polic
yIn
stitu
tiona
l rol
es
Are
the
inst
itutio
nal r
oles
of r
ural
san
itatio
n su
b-se
ctor
pla
yers
(nat
iona
l/sta
te a
nd lo
cal g
over
nmen
t, se
rvic
e pr
ovid
er, r
egul
ator
etc
) cle
arly
defin
ed a
nd
oper
atio
naliz
ed?
Defin
ed a
nd
oper
atio
naliz
edDe
fined
but
not
op
erat
iona
lized
Not d
efine
d1
Nam
Saa
t Cen
tral h
as a
man
date
to
guid
e th
e ru
ral W
ASH
sub-
sect
or. S
o ro
les
are
wel
l defi
ned,
thou
gh th
ere
has
been
deb
ate
arou
nd th
e fu
ture
ro
le o
f Nam
Saa
t in
rela
tion
to ru
ral
wat
er s
uppl
y sc
hem
es.
(1) D
ecre
e 37
in 1
999
- ro
les/
resp
onsi
bilit
ies
of N
am S
aat;
(2)
Late
st D
ecre
e 20
12?
(3) 1
982
Decr
ee o
n th
e es
tabl
ishm
ent o
f Na
m S
aat
Plan
ning
Fund
flow
co
ordi
natio
nDo
es g
over
nmen
t hav
e a
proc
ess
for c
o-or
dina
ting
mul
tiple
inve
stm
ents
in th
e su
b-se
ctor
(dom
estic
or
don
or, e
.g. n
atio
nal g
rant
s, s
tate
bud
gets
, don
or
loan
s an
d gr
ants
etc
.)?
Coor
dina
tion
proc
ess
defin
ed a
nd
oper
atio
naliz
ed
Coor
dina
tion
proc
ess
defin
ed b
ut n
ot
oper
atio
naliz
ed
Not d
efine
d/ n
o pr
oces
s0.
5Na
tiona
l Pla
n of
Act
ion
incl
udes
fu
ndin
g re
quire
men
ts b
ut n
o fin
anci
ng
stra
tegy
. Als
o pr
opos
es im
prov
ed
co-o
rdin
atio
n in
clud
ing
Join
t Ann
ual
Sect
or R
evie
ws
(1) N
atio
nal A
ctio
n Pl
an, (
2)
Sect
or F
inan
cing
Stu
dy (W
SP) (
3)
Sect
or R
evie
w (W
orld
Ban
k)
Plan
ning
Inve
stm
ent p
lan
Is th
ere
a m
ediu
m-t
erm
inve
stm
ent p
lan
for r
ural
w
ater
bas
ed o
n na
tiona
l tar
gets
that
is c
oste
d,
prio
ritize
s in
vest
men
t nee
ds, a
nd is
pub
lishe
d an
d us
ed?
Inve
stm
ent p
lan
base
d on
prio
rity
need
s ex
ists
, is
publ
ishe
d an
d us
ed
Exis
ts b
ut n
ot
used
, or u
nder
pr
epar
atio
n
Does
not
exis
t0.
5Ou
tline
inve
stm
ent p
lan
in d
raft
RWSS
st
rate
gy, b
ut fu
nds
not c
omm
itted
by
gov
t and
don
ors.
No
finan
cing
st
rate
gy.
(1) N
atio
nal A
ctio
n Pl
an, (
2)
NSED
P / N
GPES
, (3)
Nat
iona
l He
alth
Pla
n
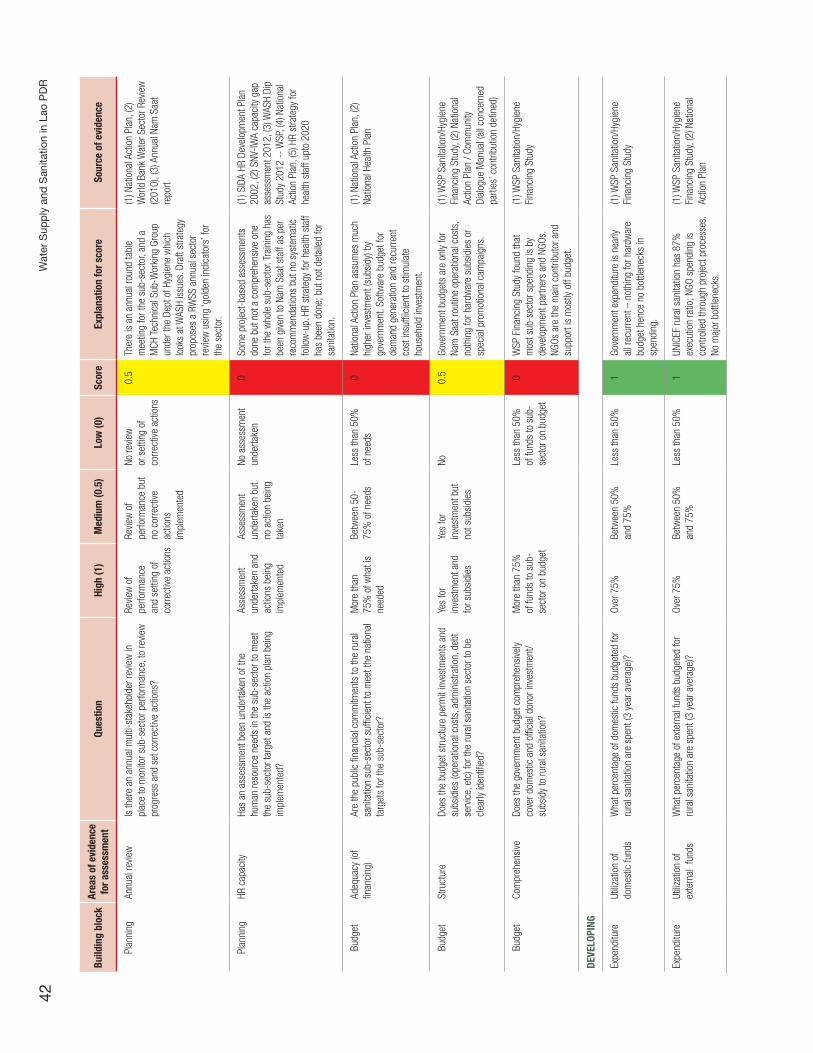
Wat
er S
upp
ly a
nd S
anita
tion
in L
ao P
DR
42
Build
ing
bloc
kAr
eas
of e
vide
nce
for a
sses
smen
tQu
estio
nHi
gh (1
)M
ediu
m (0
.5)
Low
(0)
Scor
eEx
plan
atio
n fo
r sco
reSo
urce
of e
vide
nce
Plan
ning
Annu
al re
view
Is th
ere
an a
nnua
l mul
ti-st
akeh
olde
r rev
iew
in
plac
e to
mon
itor s
ub-s
ecto
r per
form
ance
, to
revie
w
prog
ress
and
set
cor
rect
ive a
ctio
ns?
Revie
w o
f pe
rform
ance
an
d se
tting
of
corre
ctive
act
ions
Revie
w o
f pe
rform
ance
but
no
cor
rect
ive
actio
ns
impl
emen
ted
No re
view
or
set
ting
of
corre
ctive
act
ions
0.5
Ther
e is
an
annu
al ro
und
tabl
e m
eetin
g fo
r the
sub
-sec
tor,
and
a M
CH T
echn
ical
Sub
-Wor
king
Gro
up
unde
r the
Dep
t of H
ygie
ne w
hich
lo
oks
at W
ASH
issu
es. D
raft
stra
tegy
pr
opos
es a
RW
SS a
nnua
l sec
tor
revie
w u
sing
‘gol
den
indi
cato
rs’ f
or
the
sect
or.
(1) N
atio
nal A
ctio
n Pl
an, (
2)
Wor
ld B
ank
Wat
er S
ecto
r Rev
iew
(2
010)
, (3)
Ann
ual N
am S
aat
repo
rt
Plan
ning
HR c
apac
ityHa
s an
ass
essm
ent b
een
unde
rtake
n of
the
hum
an re
sour
ce n
eeds
in th
e su
b-se
ctor
to m
eet
the
sub-
sect
or ta
rget
and
is th
e ac
tion
plan
bei
ng
impl
emen
ted?
Asse
ssm
ent
unde
rtake
n an
d ac
tions
bei
ng
impl
emen
ted
Asse
ssm
ent
unde
rtake
n bu
t no
act
ion
bein
g ta
ken
No a
sses
smen
t un
derta
ken
0So
me
proj
ect-
base
d as
sess
men
ts
done
but
not
a c
ompr
ehen
sive
one
fo
r the
who
le s
ub-s
ecto
r. Tr
aini
ng h
as
been
give
n to
Nam
Saa
t sta
ff as
per
re
com
men
datio
ns b
ut n
o sy
stem
atic
fo
llow
-up.
HR
stra
tegy
for h
ealth
sta
ff ha
s be
en d
one;
but
not
det
aile
d fo
r sa
nita
tion.
(1) S
IDA
HR D
evel
opm
ent P
lan
2002
, (2)
SNV
-IWA
capa
city
gap
as
sess
men
t 201
2, (3
) WAS
H Di
p St
udy
2012
-- W
SP, (
4) N
atio
nal
Actio
n Pl
an, (
5) H
R st
rate
gy fo
r he
alth
sta
ff up
to 2
020
Budg
etAd
equa
cy (o
f fin
anci
ng)
Are
the
publ
ic fi
nanc
ial c
omm
itmen
ts to
the
rura
l sa
nita
tion
sub-
sect
or s
uffic
ient
to m
eet t
he n
atio
nal
targ
ets
for t
he s
ub-s
ecto
r?
Mor
e th
an
75%
of w
hat i
s ne
eded
Betw
een
50-
75%
of n
eeds
Less
than
50%
of
nee
ds0
Natio
nal A
ctio
n Pl
an a
ssum
es m
uch
high
er in
vest
men
t (su
bsid
y) b
y go
vern
men
t. So
ftwar
e bu
dget
for
dem
and
gene
ratio
n an
d re
curre
nt
cost
insu
ffiic
ient
to s
timul
ate
hous
ehol
d in
vest
men
t.
(1) N
atio
nal A
ctio
n Pl
an, (
2)
Natio
nal H
ealth
Pla
n
Budg
etSt
ruct
ure
Does
the
budg
et s
truct
ure
perm
it in
vest
men
ts a
nd
subs
idie
s (o
pera
tiona
l cos
ts, a
dmin
istra
tion,
deb
t se
rvic
e, e
tc) f
or th
e ru
ral s
anita
tion
sect
or to
be
clea
rly id
entifi
ed?
Yes
for
inve
stm
ent a
nd
for s
ubsi
dies
Yes
for
inve
stm
ent b
ut
not s
ubsi
dies
No0.
5Go
vern
men
t bud
gets
are
onl
y fo
r Na
m S
aat r
outin
e op
erat
iona
l cos
ts,
noth
ing
for h
ardw
are
subs
idie
s or
sp
ecia
l pro
mot
iona
l cam
paig
ns.
(1) W
SP S
anita
tion/
Hygi
ene
Fina
ncin
g St
udy,
(2) N
atio
nal
Actio
n Pl
an /
Com
mun
ity
Dial
ogue
Man
ual (
all c
once
rned
pa
rties
’ con
tribu
tion
defin
ed)
Budg
etCo
mpr
ehen
sive
Does
the
gove
rnm
ent b
udge
t com
preh
ensi
vely
cove
r dom
estic
and
offi
cial
don
or in
vest
men
t/su
bsid
y to
rura
l san
itatio
n?
Mor
e th
an 7
5%
of fu
nds
to s
ub-
sect
or o
n bu
dget
Less
than
50%
of
fund
s to
sub
-se
ctor
on
budg
et
0W
SP F
inan
cing
Stu
dy fo
und
that
m
ost s
ub-s
ecto
r spe
ndin
g is
by
deve
lopm
ent p
artn
ers
and
NGOs
. NG
Os a
re th
e m
ain
cont
ribut
or a
nd
supp
ort i
s m
ostly
off
budg
et.
(1) W
SP S
anita
tion/
Hygi
ene
Fina
ncin
g St
udy
DEVE
LOPI
NG
Expe
nditu
reUt
ilizat
ion
of
dom
estic
fund
sW
hat p
erce
ntag
e of
dom
estic
fund
s bu
dget
ed fo
r ru
ral s
anita
tion
are
spen
t (3
year
ave
rage
)?
Over
75%
Betw
een
50%
an
d 75
%Le
ss th
an 5
0%1
Gove
rnm
ent e
xpen
ditu
re is
nea
rly
all r
ecur
rent
– n
othi
ng fo
r har
dwar
e bu
dget
hen
ce n
o bo
ttlen
ecks
in
spen
ding
.
(1) W
SP S
anita
tion/
Hygi
ene
Fina
ncin
g St
udy
Expe
nditu
reUt
ilizat
ion
of
exte
rnal
fun
dsW
hat p
erce
ntag
e of
ext
erna
l fun
ds b
udge
ted
for
rura
l san
itatio
n ar
e sp
ent (
3 ye
ar a
vera
ge)?
Ov
er 7
5%Be
twee
n 50
%
and
75%
Less
than
50%
1UN
ICEF
rura
l san
itatio
n ha
s 87
%
exec
utio
n ra
tio; N
GO s
pend
ing
is
cont
rolle
d th
roug
h pr
ojec
t pro
cess
es.
No m
ajor
bot
tlene
cks.
(1) W
SP S
anita
tion/
Hygi
ene
Fina
ncin
g St
udy,
(2) N
atio
nal
Actio
n Pl
an
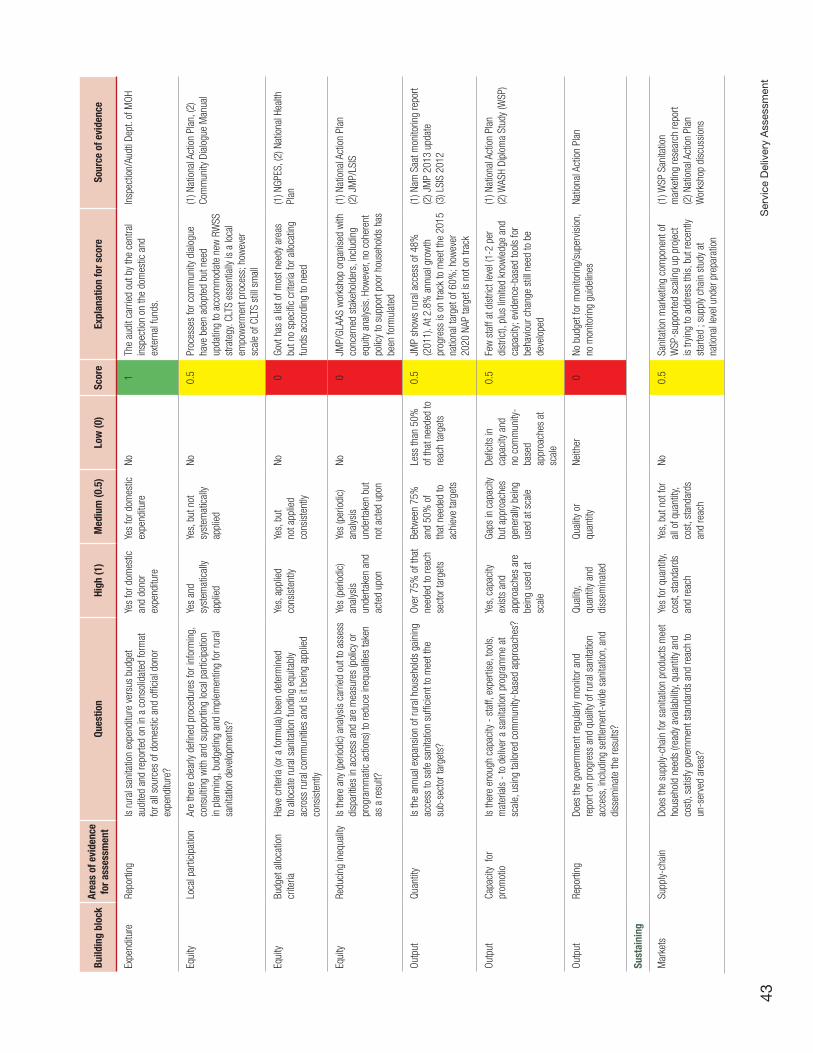
Ser
vice
Del
iver
y A
sses
smen
t43
Build
ing
bloc
kAr
eas
of e
vide
nce
for a
sses
smen
tQu
estio
nHi
gh (1
)M
ediu
m (0
.5)
Low
(0)
Scor
eEx
plan
atio
n fo
r sco
reSo
urce
of e
vide
nce
Expe
nditu
reRe
porti
ngIs
rura
l san
itatio
n ex
pend
iture
ver
sus
budg
et
audi
ted
and
repo
rted
on in
a c
onso
lidat
ed fo
rmat
fo
r all
sour
ces
of d
omes
tic a
nd o
ffici
al d
onor
ex
pend
iture
?
Yes
for d
omes
tic
and
dono
r ex
pend
iture
Yes
for d
omes
tic
expe
nditu
reNo
1Th
e au
dit c
arrie
d ou
t by
the
cent
ral
insp
ectio
n on
the
dom
estic
and
ex
tern
al fu
nds.
Insp
ectio
n/Au
dti D
ept.
of M
OH
Equi
tyLo
cal p
artic
ipat
ion
Are
ther
e cl
early
defi
ned
proc
edur
es fo
r inf
orm
ing,
co
nsul
ting
with
and
sup
porti
ng lo
cal p
artic
ipat
ion
in p
lann
ing,
bud
getin
g an
d im
plem
entin
g fo
r rur
al
sani
tatio
n de
velo
pmen
ts?
Yes
and
syst
emat
ical
ly ap
plie
d
Yes,
but
not
sy
stem
atic
ally
appl
ied
No0.
5Pr
oces
ses
for c
omm
unity
dia
logu
e ha
ve b
een
adop
ted
but n
eed
upda
ting
to a
ccom
mod
ate
new
RW
SS
stra
tegy
. CLT
S es
sent
ially
is a
loca
l em
pow
erm
ent p
roce
ss; h
owev
er
scal
e of
CLT
S st
ill sm
all
(1) N
atio
nal A
ctio
n Pl
an, (
2)
Com
mun
ity D
ialo
gue
Man
ual
Equi
tyBu
dget
allo
catio
n cr
iteria
Have
crit
eria
(or a
form
ula)
bee
n de
term
ined
to
allo
cate
rura
l san
itatio
n fu
ndin
g eq
uita
bly
acro
ss ru
ral c
omm
uniti
es a
nd is
it b
eing
app
lied
cons
iste
ntly
Yes,
app
lied
cons
iste
ntly
Yes,
but
no
t app
lied
cons
iste
ntly
No0
Govt
has
a li
st o
f mos
t nee
dy a
reas
bu
t no
spec
ific
crite
ria fo
r allo
catin
g fu
nds
acco
rdin
g to
nee
d
(1) N
GPES
, (2)
Nat
iona
l Hea
lth
Plan
Equi
tyRe
duci
ng in
equa
lity
Is th
ere
any
(per
iodi
c) a
nalys
is c
arrie
d ou
t to
asse
ss
disp
ariti
es in
acc
ess
and
are
mea
sure
s (p
olic
y or
pr
ogra
mm
atic
act
ions
) to
redu
ce in
equa
litie
s ta
ken
as a
resu
lt?
Yes
(per
iodi
c)
anal
ysis
un
derta
ken
and
acte
d up
on
Yes
(per
iodi
c)
anal
ysis
un
derta
ken
but
not a
cted
upo
n
No0
JMP/
GLAA
S w
orks
hop
orga
nise
d w
ith
conc
erne
d st
akeh
olde
rs, i
nclu
ding
eq
uity
ana
lysis
. How
ever
, no
cohe
rent
po
licy
to s
uppo
rt po
or h
ouse
hold
s ha
s be
en fo
rmul
ated
(1) N
atio
nal A
ctio
n Pl
an
(2) J
MP/
LSIS
Outp
utQu
antit
yIs
the
annu
al e
xpan
sion
of r
ural
hou
seho
lds
gain
ing
acce
ss to
saf
e sa
nita
tion
suffi
cien
t to
mee
t the
su
b-se
ctor
targ
ets?
Over
75%
of t
hat
need
ed to
reac
h se
ctor
targ
ets
Betw
een
75%
an
d 50
% o
f th
at n
eede
d to
ac
hiev
e ta
rget
s
Less
than
50%
of
that
nee
ded
to
reac
h ta
rget
s
0.5
JMP
show
s ru
ral a
cces
s of
48%
(2
011)
. At 2
.8%
ann
ual g
row
th
prog
ress
is o
n tra
ck to
mee
t the
201
5 na
tiona
l tar
get o
f 60%
; how
ever
20
20 N
AP ta
rget
is n
ot o
n tra
ck
(1) N
am S
aat m
onito
ring
repo
rt (2
) JM
P 20
13 u
pdat
e
(3) L
SIS
2012
Outp
utCa
paci
ty f
or
prom
otio
Is th
ere
enou
gh c
apac
ity -
sta
ff, e
xper
tise,
tool
s,
mat
eria
ls -
to d
elive
r a s
anita
tion
prog
ram
me
at
scal
e, u
sing
tailo
red
com
mun
ity-b
ased
app
roac
hes?
Yes,
cap
acity
ex
ists
and
ap
proa
ches
are
be
ing
used
at
scal
e
Gaps
in c
apac
ity
but a
ppro
ache
s ge
nera
lly b
eing
us
ed a
t sca
le
Defic
its in
ca
paci
ty a
nd
no c
omm
unity
-ba
sed
appr
oach
es a
t sc
ale
0.5
Few
sta
ff at
dis
trict
leve
l (1-
2 pe
r di
stric
t), p
lus
limite
d kn
owle
dge
and
capa
city
; evid
ence
-bas
ed to
ols
for
beha
viour
cha
nge
still
need
to b
e de
velo
ped
(1) N
atio
nal A
ctio
n Pl
an
(2
) WAS
H Di
plom
a St
udy
(WSP
)
Outp
utRe
porti
ngDo
es th
e go
vern
men
t reg
ular
ly m
onito
r and
re
port
on p
rogr
ess
and
qual
ity o
f rur
al s
anita
tion
acce
ss, i
nclu
ding
set
tlem
ent-
wid
e sa
nita
tion,
and
di
ssem
inat
e th
e re
sults
?
Qual
ity,
quan
tity
and
diss
emin
ated
Qual
ity o
r qu
antit
yNe
ither
0No
bud
get f
or m
onito
ring/
supe
rvis
ion,
no
mon
itorin
g gu
idel
ines
Natio
nal A
ctio
n Pl
an
Sust
aini
ng
Mar
kets
Supp
ly-ch
ain
Does
the
supp
ly-ch
ain
for s
anita
tion
prod
ucts
mee
t ho
useh
old
need
s (re
ady
avai
labi
lity,
quan
tity
and
cost
), sa
tisfy
gov
ernm
ent s
tand
ards
and
reac
h to
un
-ser
ved
area
s?
Yes
for q
uant
ity,
cost
, sta
ndar
ds
and
reac
h
Yes,
but
not
for
all o
f qua
ntity
, co
st, s
tand
ards
an
d re
ach
No0.
5Sa
nita
tion
mar
ketin
g co
mpo
nent
of
WSP
-sup
porte
d sc
alin
g up
pro
ject
is
tryin
g to
add
ress
this
, but
rece
ntly
star
ted
; sup
ply
chai
n st
udy
at
natio
nal l
evel
und
er p
repa
ratio
n
(1) W
SP S
anita
tion
mar
ketin
g re
sear
ch re
port
(2) N
atio
nal A
ctio
n Pl
an
Wor
ksho
p di
scus
sion
s
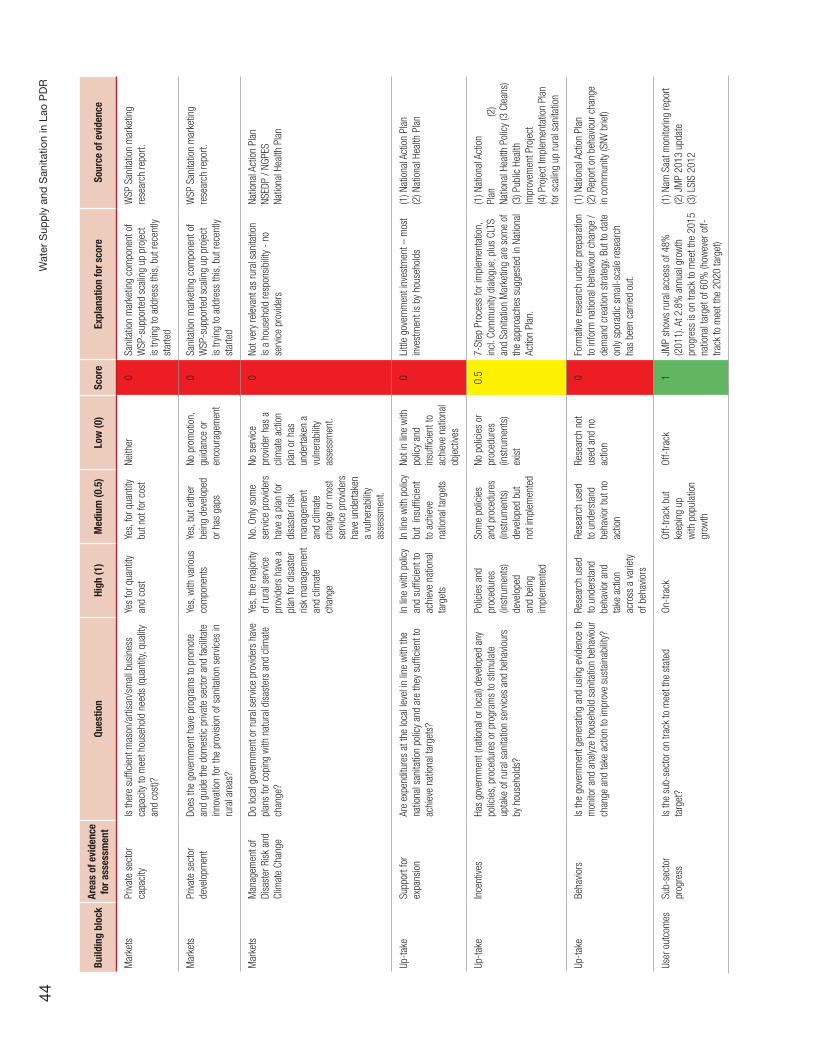
Wat
er S
upp
ly a
nd S
anita
tion
in L
ao P
DR
44
Build
ing
bloc
kAr
eas
of e
vide
nce
for a
sses
smen
tQu
estio
nHi
gh (1
)M
ediu
m (0
.5)
Low
(0)
Scor
eEx
plan
atio
n fo
r sco
reSo
urce
of e
vide
nce
Mar
kets
Priva
te s
ecto
r ca
paci
tyIs
ther
e su
ffici
ent m
ason
/arti
san/
smal
l bus
ines
s ca
paci
ty to
mee
t hou
seho
ld n
eeds
(qua
ntity
, qua
lity
and
cost
)?
Yes
for q
uant
ity
and
cost
Yes,
for q
uant
ity
but n
ot fo
r cos
tNe
ither
0Sa
nita
tion
mar
ketin
g co
mpo
nent
of
WSP
-sup
porte
d sc
alin
g up
pro
ject
is
tryin
g to
add
ress
this
, but
rece
ntly
star
ted
WSP
San
itatio
n m
arke
ting
rese
arch
repo
rt.
Mar
kets
Priva
te s
ecto
r de
velo
pmen
tDo
es th
e go
vern
men
t hav
e pr
ogra
ms
to p
rom
ote
and
guid
e th
e do
mes
tic p
rivat
e se
ctor
and
faci
litat
e in
nova
tion
for t
he p
rovis
ion
of s
anita
tion
serv
ices
in
rura
l are
as?
Yes,
with
var
ious
co
mpo
nent
sYe
s, b
ut e
ither
be
ing
deve
lope
d or
has
gap
s
No p
rom
otio
n,
guid
ance
or
enco
urag
emen
t
0Sa
nita
tion
mar
ketin
g co
mpo
nent
of
WSP
-sup
porte
d sc
alin
g up
pro
ject
is
tryin
g to
add
ress
this
, but
rece
ntly
star
ted
WSP
San
itatio
n m
arke
ting
rese
arch
repo
rt.
Mar
kets
Man
agem
ent o
f Di
sast
er R
isk
and
Clim
ate
Chan
ge
Do lo
cal g
over
nmen
t or r
ural
ser
vice
prov
ider
s ha
ve
plan
s fo
r cop
ing
with
nat
ural
dis
aste
rs a
nd c
limat
e ch
ange
?
Yes,
the
maj
ority
of
rura
l ser
vice
prov
ider
s ha
ve a
pl
an fo
r dis
aste
r ris
k m
anag
emen
t an
d cl
imat
e ch
ange
No. O
nly
som
e se
rvic
e pr
ovid
ers
have
a p
lan
for
disa
ster
risk
m
anag
emen
t an
d cl
imat
e ch
ange
or m
ost
serv
ice
prov
ider
s ha
ve u
nder
take
n a
vuln
erab
ility
asse
ssm
ent.
No s
ervic
e pr
ovid
er h
as a
cl
imat
e ac
tion
plan
or h
as
unde
rtake
n a
vuln
erab
ility
asse
ssm
ent.
0No
t ver
y re
leva
nt a
s ru
ral s
anita
tion
is a
hou
seho
ld re
spon
sibi
lity
- no
se
rvic
e pr
ovid
ers
Natio
nal A
ctio
n Pl
an
NSED
P / N
GPES
Natio
nal H
ealth
Pla
n
Up-t
ake
Supp
ort f
or
expa
nsio
nAr
e ex
pend
iture
s at
the
loca
l lev
el in
line
with
the
natio
nal s
anita
tion
polic
y an
d ar
e th
ey s
uffic
ient
to
achi
eve
natio
nal t
arge
ts?
In li
ne w
ith p
olic
y an
d su
ffici
ent t
o ac
hiev
e na
tiona
l ta
rget
s
In li
ne w
ith p
olic
y bu
t in
suffi
cien
t to
ach
ieve
na
tiona
l tar
gets
Not i
n lin
e w
ith
polic
y an
d in
suffi
cien
t to
achi
eve
natio
nal
obje
ctive
s
0Li
ttle
gove
rnm
ent i
nves
tmen
t – m
ost
inve
stm
ent i
s by
hou
seho
lds
(1) N
atio
nal A
ctio
n Pl
an
(2
) Nat
iona
l Hea
lth P
lan
Up-t
ake
Ince
ntive
sHa
s go
vern
men
t (na
tiona
l or l
ocal
) dev
elop
ed a
ny
polic
ies,
pro
cedu
res
or p
rogr
ams
to s
timul
ate
upta
ke o
f rur
al s
anita
tion
serv
ices
and
beh
avio
urs
by h
ouse
hold
s?
Polic
ies
and
proc
edur
es
(inst
rum
ents
) de
velo
ped
and
bein
g im
plem
ente
d
Som
e po
licie
s an
d pr
oced
ures
(in
stru
men
ts)
deve
lope
d bu
t no
t im
plem
ente
d
No p
olic
ies
or
proc
edur
es
(inst
rum
ents
) ex
ist
0.5
7-St
ep P
roce
ss fo
r im
plem
enta
tion,
in
cl. C
omm
unity
dia
logu
e; p
lus
CLTS
an
d Sa
nita
tion
Mar
ketin
g ar
e so
me
of
the
appr
oach
es s
ugge
sted
in N
atio
nal
Actio
n Pl
an.
(1) N
atio
nal A
ctio
n Pl
an
(2)
Natio
nal H
ealth
Pol
icy
(3 C
lean
s)
(3) P
ublic
Hea
lth
Impr
ovem
ent P
roje
ct
(4
) Pro
ject
Impl
emen
tatio
n Pl
an
for s
calin
g up
rura
l san
itatio
n
Up-t
ake
Beha
viors
Is th
e go
vern
men
t gen
erat
ing
and
usin
g ev
iden
ce to
m
onito
r and
ana
lyze
hous
ehol
d sa
nita
tion
beha
viour
ch
ange
and
take
act
ion
to im
prov
e su
stai
nabi
lity?
Rese
arch
use
d to
und
erst
and
beha
vior a
nd
take
act
ion
acro
ss a
var
iety
of
beh
avio
rs
Rese
arch
use
d to
und
erst
and
beha
vior b
ut n
o ac
tion
Rese
arch
not
us
ed a
nd n
o ac
tion
0Fo
rmat
ive re
sear
ch u
nder
pre
para
tion
to in
form
nat
iona
l beh
avio
ur c
hang
e /
dem
and
crea
tion
stra
tegy
. But
to d
ate
only
spor
adic
sm
all-s
cale
rese
arch
ha
s be
en c
arrie
d ou
t.
(1) N
atio
nal A
ctio
n Pl
an
(2
) Rep
ort o
n be
havio
ur c
hang
e in
com
mun
ity (S
NV b
rief)
User
out
com
esSu
b-se
ctor
pr
ogre
ssIs
the
sub-
sect
or o
n tra
ck to
mee
t the
sta
ted
targ
et?
On-t
rack
Off-
track
but
ke
epin
g up
w
ith p
opul
atio
n gr
owth
Off-
track
1JM
P sh
ows
rura
l acc
ess
of 4
8%
(201
1). A
t 2.8
% a
nnua
l gro
wth
pr
ogre
ss is
on
track
to m
eet t
he 2
015
natio
nal t
arge
t of 6
0% (h
owev
er o
ff-tra
ck to
mee
t the
202
0 ta
rget
)
(1) N
am S
aat m
onito
ring
repo
rt
(2) J
MP
2013
upd
ate
(3
) LSI
S 20
12
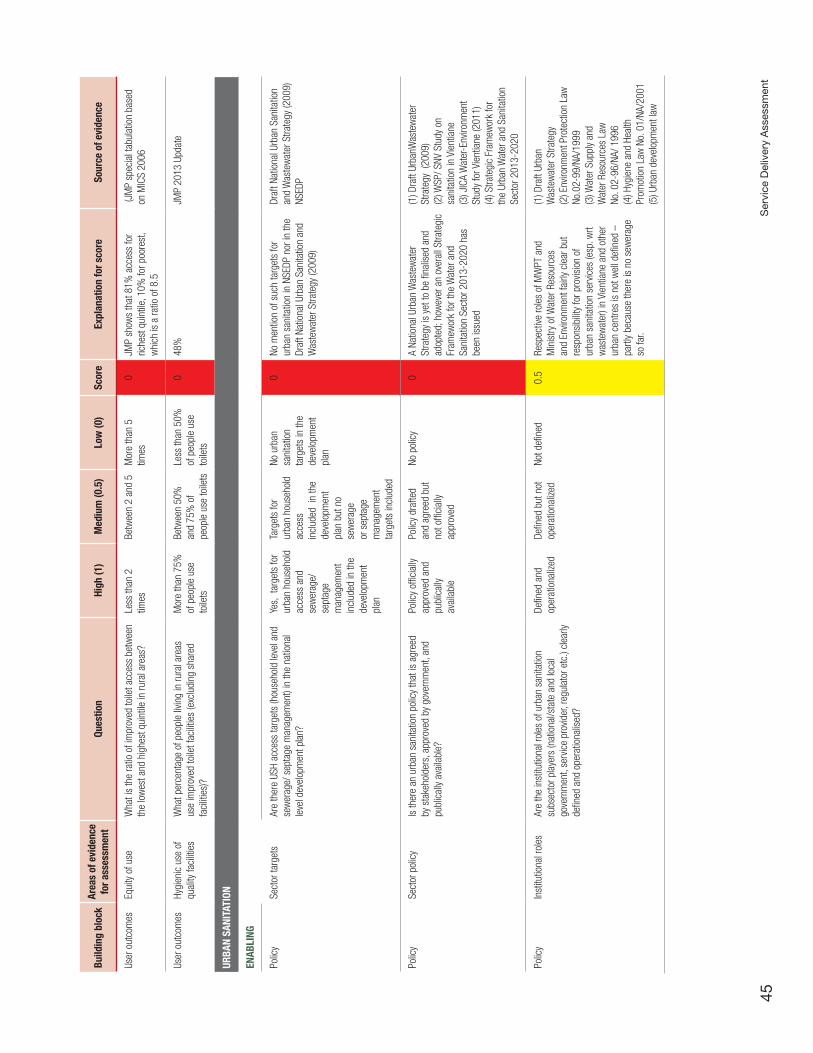
Ser
vice
Del
iver
y A
sses
smen
t45
Build
ing
bloc
kAr
eas
of e
vide
nce
for a
sses
smen
tQu
estio
nHi
gh (1
)M
ediu
m (0
.5)
Low
(0)
Scor
eEx
plan
atio
n fo
r sco
reSo
urce
of e
vide
nce
User
out
com
esEq
uity
of u
seW
hat i
s th
e ra
tio o
f im
prov
ed to
ilet a
cces
s be
twee
n th
e lo
wes
t and
hig
hest
qui
ntile
in ru
ral a
reas
?Le
ss th
an 2
tim
esBe
twee
n 2
and
5M
ore
than
5
times
0JM
P sh
ows
that
81%
acc
ess
for
riche
st q
uint
ile, 1
0% fo
r poo
rest
, w
hich
is a
ratio
of 8
.5
(JM
P sp
ecia
l tab
ulat
ion
base
d on
MIC
S 20
06
User
out
com
esHy
gien
ic u
se o
f qu
ality
faci
litie
sW
hat p
erce
ntag
e of
peo
ple
livin
g in
rura
l are
as
use
impr
oved
toile
t fac
ilitie
s (e
xclu
ding
sha
red
faci
litie
s)?
Mor
e th
an 7
5%
of p
eopl
e us
e to
ilets
Betw
een
50%
an
d 75
% o
f pe
ople
use
toile
ts
Less
than
50%
of
peo
ple
use
toile
ts
048
%
JMP
2013
Upd
ate
URBA
N SA
NITA
TION
ENAB
LING
Polic
ySe
ctor
targ
ets
Are
ther
e US
H ac
cess
targ
ets
(hou
seho
ld le
vel a
nd
sew
erag
e/ s
epta
ge m
anag
emen
t) in
the
natio
nal
leve
l dev
elop
men
t pla
n?
Yes,
tar
gets
for
urba
n ho
useh
old
acce
ss a
nd
sew
erag
e/se
ptag
e m
anag
emen
t in
clud
ed in
the
deve
lopm
ent
plan
Targ
ets
for
urba
n ho
useh
old
acce
ss
incl
uded
in
the
deve
lopm
ent
plan
but
no
sew
erag
e or
sep
tage
m
anag
emen
t ta
rget
s in
clud
ed
No u
rban
sa
nita
tion
targ
ets
in th
e
deve
lopm
ent
plan
0No
men
tion
of s
uch
targ
ets
for
urba
n sa
nita
tion
in N
SEDP
nor
in th
e Dr
aft N
atio
nal U
rban
San
itatio
n an
d W
aste
wat
er S
trate
gy (2
009)
Draf
t Nat
iona
l Urb
an S
anita
tion
and
Was
tew
ater
Stra
tegy
(200
9)
NSED
P
Polic
ySe
ctor
pol
icy
Is th
ere
an u
rban
san
itatio
n po
licy
that
is a
gree
d by
sta
keho
lder
s, a
ppro
ved
by g
over
nmen
t, an
d pu
blic
ally
avai
labl
e?
Polic
y of
ficia
lly
appr
oved
and
pu
blic
ally
avai
labl
e
Polic
y dr
afte
d an
d ag
reed
but
no
t offi
cial
ly ap
prov
ed
No p
olic
y0
A Na
tiona
l Urb
an W
aste
wat
er
Stra
tegy
is y
et to
be
final
ised
and
ad
opte
d; h
owev
er a
n ov
eral
l Stra
tegi
c Fr
amew
ork
for t
he W
ater
and
Sa
nita
tion
Sect
or 2
013-
2020
has
be
en is
sued
(1) D
raft
Urba
nWas
tew
ater
St
rate
gy (
2009
)
(2) W
SP/ S
NV S
tudy
on
sani
tatio
n in
Vie
ntia
ne
(3) J
ICA
Wat
er-E
nviro
nmen
t St
udy
for V
ient
iane
(201
1)(4
) Stra
tegi
c Fr
amew
ork
for
the
Urba
n W
ater
and
San
itatio
n Se
ctor
201
3-20
20
Polic
yIn
stitu
tiona
l rol
esAr
e th
e in
stitu
tiona
l rol
es o
f urb
an s
anita
tion
subs
ecto
r pla
yers
(nat
iona
l/sta
te a
nd lo
cal
gove
rnm
ent,
serv
ice
prov
ider
, reg
ulat
or e
tc.)
clea
rly
defin
ed a
nd o
pera
tiona
lised
?
Defin
ed a
nd
oper
atio
naliz
edDe
fined
but
not
op
erat
iona
lized
Not d
efine
d0.
5Re
spec
tive
role
s of
MW
PT a
nd
Min
istry
of W
ater
Res
ourc
es
and
Envir
onm
ent f
airly
cle
ar b
ut
resp
onsi
bilit
y fo
r pro
visio
n of
ur
ban
sani
tatio
n se
rvic
es (e
sp. w
rt w
aste
wat
er) i
n Vi
entia
ne a
nd o
ther
ur
ban
cent
res
is n
ot w
ell d
efine
d –
partl
y be
caus
e th
ere
is n
o se
wer
age
so fa
r.
(1) D
raft
Urba
n W
aste
wat
er S
trate
gy
(2) E
nviro
nmen
t Pro
tect
ion
Law
No
.02-
99/N
A/19
99
(3) W
ater
Sup
ply
and
Wat
er R
esou
rces
Law
No
. 02-
96/N
A/ 1
996
(4
) Hyg
iene
and
Hea
lth
Prom
otio
n La
w N
o. 0
1/NA
/200
1
(5) U
rban
dev
elop
men
t law
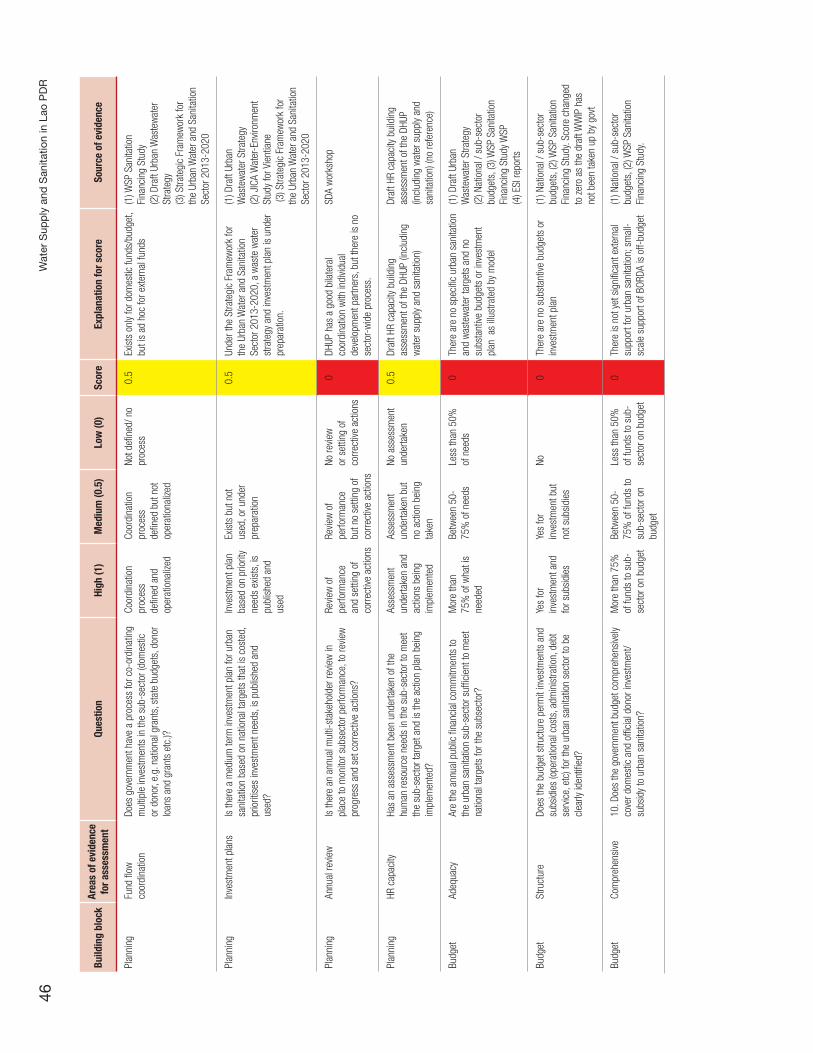
Wat
er S
upp
ly a
nd S
anita
tion
in L
ao P
DR
46
Build
ing
bloc
kAr
eas
of e
vide
nce
for a
sses
smen
tQu
estio
nHi
gh (1
)M
ediu
m (0
.5)
Low
(0)
Scor
eEx
plan
atio
n fo
r sco
reSo
urce
of e
vide
nce
Plan
ning
Fund
flow
co
ordi
natio
nDo
es g
over
nmen
t hav
e a
proc
ess
for c
o-or
dina
ting
mul
tiple
inve
stm
ents
in th
e su
b-se
ctor
(dom
estic
or
don
or, e
.g. n
atio
nal g
rant
s, s
tate
bud
gets
, don
or
loan
s an
d gr
ants
etc
.)?
Coor
dina
tion
proc
ess
defin
ed a
nd
oper
atio
naliz
ed
Coor
dina
tion
proc
ess
defin
ed b
ut n
ot
oper
atio
naliz
ed
Not d
efine
d/ n
o pr
oces
s0.
5Ex
ists
onl
y fo
r dom
estic
fund
s/bu
dget
, bu
t is
ad h
oc fo
r ext
erna
l fun
ds(1
) WSP
San
itatio
n Fi
nanc
ing
Stud
y
(2
) Dra
ft Ur
ban
Was
tew
ater
St
rate
gy
(3) S
trate
gic
Fram
ewor
k fo
r th
e Ur
ban
Wat
er a
nd S
anita
tion
Sect
or 2
013-
2020
Plan
ning
Inve
stm
ent p
lans
Is th
ere
a m
ediu
m te
rm in
vest
men
t pla
n fo
r urb
an
sani
tatio
n ba
sed
on n
atio
nal t
arge
ts th
at is
cos
ted,
pr
iorit
ises
inve
stm
ent n
eeds
, is
publ
ishe
d an
d us
ed?
Inve
stm
ent p
lan
base
d on
prio
rity
need
s ex
ists
, is
publ
ishe
d an
d us
ed
Exis
ts b
ut n
ot
used
, or u
nder
pr
epar
atio
n
0.5
Unde
r the
Stra
tegi
c Fr
amew
ork
for
the
Urba
n W
ater
and
San
itatio
n Se
ctor
201
3-20
20, a
was
te w
ater
st
rate
gy a
nd in
vest
men
t pla
n is
und
er
prep
arat
ion.
(1) D
raft
Urba
n W
aste
wat
er S
trate
gy
(2
) JIC
A W
ater
-Env
ironm
ent
Stud
y fo
r Vie
ntia
ne (3
) Stra
tegi
c Fr
amew
ork
for
the
Urba
n W
ater
and
San
itatio
n Se
ctor
201
3-20
20
Plan
ning
Annu
al re
view
Is th
ere
an a
nnua
l mul
ti-st
akeh
olde
r rev
iew
in
plac
e to
mon
itor s
ubse
ctor
per
form
ance
, to
revie
w
prog
ress
and
set
cor
rect
ive a
ctio
ns?
Revie
w o
f pe
rform
ance
an
d se
tting
of
corre
ctive
act
ions
Revie
w o
f pe
rform
ance
bu
t no
setti
ng o
f co
rrect
ive a
ctio
ns
No re
view
or
set
ting
of
corre
ctive
act
ions
0DH
UP h
as a
goo
d bi
late
ral
coor
dina
tion
with
indi
vidua
l de
velo
pmen
t par
tner
s, b
ut th
ere
is n
o se
ctor
-wid
e pr
oces
s.
SDA
wor
ksho
p
Plan
ning
HR c
apac
ityHa
s an
ass
essm
ent b
een
unde
rtake
n of
the
hum
an re
sour
ce n
eeds
in th
e su
b-se
ctor
to m
eet
the
sub-
sect
or ta
rget
and
is th
e ac
tion
plan
bei
ng
impl
emen
ted?
Asse
ssm
ent
unde
rtake
n an
d ac
tions
bei
ng
impl
emen
ted
Asse
ssm
ent
unde
rtake
n bu
t no
act
ion
bein
g ta
ken
No a
sses
smen
t un
derta
ken
0.5
Draf
t HR
capa
city
bui
ldin
g as
sess
men
t of t
he D
HUP
(incl
udin
g w
ater
sup
ply
and
sani
tatio
n)
Draf
t HR
capa
city
bui
ldin
g as
sess
men
t of t
he D
HUP
(incl
udin
g w
ater
sup
ply
and
sani
tatio
n) (n
o re
fere
nce)
Budg
etAd
equa
cyAr
e th
e an
nual
pub
lic fi
nanc
ial c
omm
itmen
ts to
th
e ur
ban
sani
tatio
n su
b-se
ctor
suf
ficie
nt to
mee
t na
tiona
l tar
gets
for t
he s
ubse
ctor
?
Mor
e th
an
75%
of w
hat i
s ne
eded
Betw
een
50-
75%
of n
eeds
Less
than
50%
of
nee
ds0
Ther
e ar
e no
spe
cific
urb
an s
anita
tion
and
was
tew
ater
targ
ets
and
no
subs
tant
ive b
udge
ts o
r inv
estm
ent
plan
as
illust
rate
d by
mod
el
(1) D
raft
Urba
n W
aste
wat
er S
trate
gy
(2
) Nat
iona
l / s
ub-s
ecto
r bu
dget
s, (3
) WSP
San
itatio
n Fi
nanc
ing
Stud
y W
SP
(4) E
SI re
ports
Budg
etSt
ruct
ure
Does
the
budg
et s
truct
ure
perm
it in
vest
men
ts a
nd
subs
idie
s (o
pera
tiona
l cos
ts, a
dmin
istra
tion,
deb
t se
rvic
e, e
tc) f
or th
e ur
ban
sani
tatio
n se
ctor
to b
e cl
early
iden
tified
?
Yes
for
inve
stm
ent a
nd
for s
ubsi
dies
Yes
for
inve
stm
ent b
ut
not s
ubsi
dies
No0
Ther
e ar
e no
sub
stan
tive
budg
ets
or
inve
stm
ent p
lan
(1) N
atio
nal /
sub
-sec
tor
budg
ets,
(2) W
SP S
anita
tion
Fina
ncin
g St
udy.
Scor
e ch
ange
d to
zer
o as
the
draf
t WW
IP h
as
not b
een
take
n up
by
govt
Budg
etCo
mpr
ehen
sive
10. D
oes
the
gove
rnm
ent b
udge
t com
preh
ensi
vely
cove
r dom
estic
and
offi
cial
don
or in
vest
men
t/ su
bsid
y to
urb
an s
anita
tion?
Mor
e th
an 7
5%
of fu
nds
to s
ub-
sect
or o
n bu
dget
Betw
een
50-
75%
of f
unds
to
sub-
sect
or o
n bu
dget
Less
than
50%
of
fund
s to
sub
-se
ctor
on
budg
et
0Th
ere
is n
ot y
et s
igni
fican
t ext
erna
l su
ppor
t for
urb
an s
anita
tion;
sm
all-
scal
e su
ppor
t of B
ORDA
is o
ff-bu
dget
(1) N
atio
nal /
sub
-sec
tor
budg
ets,
(2) W
SP S
anita
tion
Fina
ncin
g St
udy.
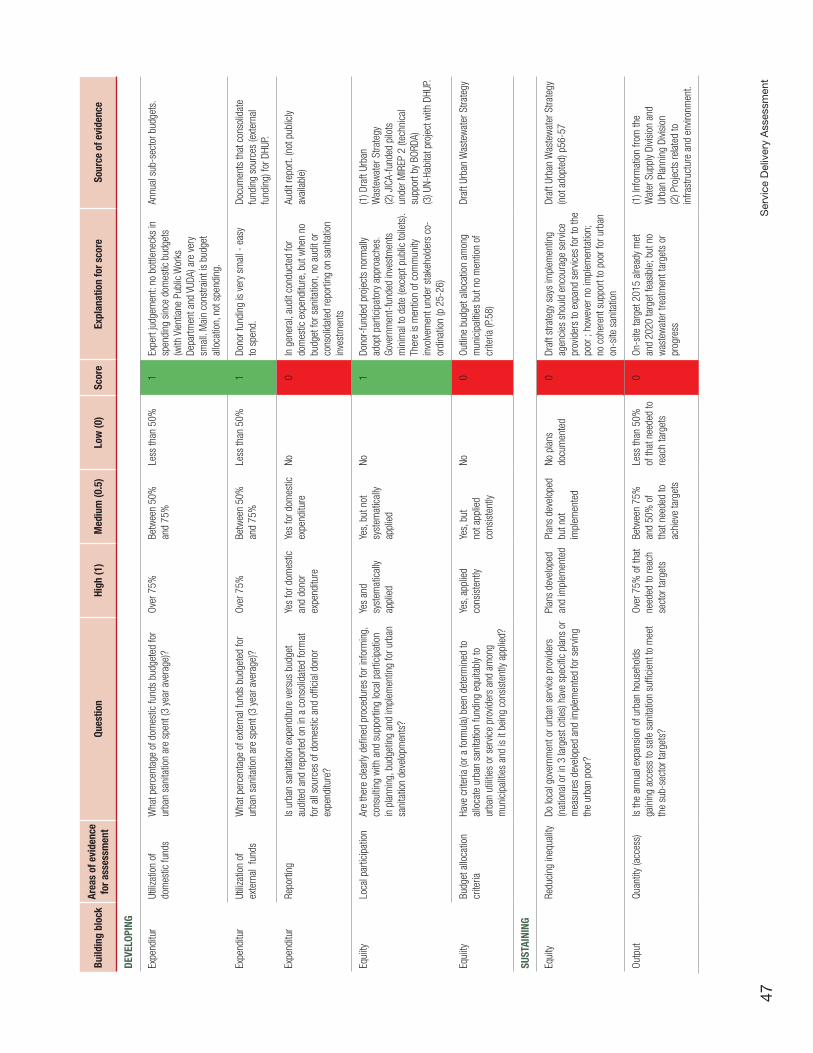
Ser
vice
Del
iver
y A
sses
smen
t47
Build
ing
bloc
kAr
eas
of e
vide
nce
for a
sses
smen
tQu
estio
nHi
gh (1
)M
ediu
m (0
.5)
Low
(0)
Scor
eEx
plan
atio
n fo
r sco
reSo
urce
of e
vide
nce
DEVE
LOPI
NG
Expe
nditu
rUt
ilizat
ion
of
dom
estic
fund
sW
hat p
erce
ntag
e of
dom
estic
fund
s bu
dget
ed fo
r ur
ban
sani
tatio
n ar
e sp
ent (
3 ye
ar a
vera
ge)?
Over
75%
Betw
een
50%
an
d 75
%Le
ss th
an 5
0%1
Expe
rt ju
dgem
ent:
no b
ottle
neck
s in
sp
endi
ng s
ince
dom
estic
bud
gets
(w
ith V
ient
iane
Pub
lic W
orks
De
partm
ent a
nd V
UDA)
are
ver
y sm
all.
Mai
n co
nstra
int i
s bu
dget
al
loca
tion,
not
spe
ndin
g.
Annu
al s
ub-s
ecto
r bud
gets
.
Expe
nditu
rUt
ilizat
ion
of
exte
rnal
fun
dsW
hat p
erce
ntag
e of
ext
erna
l fun
ds b
udge
ted
for
urba
n sa
nita
tion
are
spen
t (3
year
ave
rage
)?
Over
75%
Betw
een
50%
an
d 75
%Le
ss th
an 5
0%1
Dono
r fun
ding
is v
ery
smal
l - e
asy
to s
pend
.Do
cum
ents
that
con
solid
ate
fund
ing
sour
ces
(ext
erna
l fu
ndin
g) fo
r DHU
P.
Expe
nditu
rRe
porti
ngIs
urb
an s
anita
tion
expe
nditu
re v
ersu
s bu
dget
au
dite
d an
d re
porte
d on
in a
con
solid
ated
form
at
for a
ll so
urce
s of
dom
estic
and
offi
cial
don
or
expe
nditu
re?
Yes
for d
omes
tic
and
dono
r ex
pend
iture
Yes
for d
omes
tic
expe
nditu
reNo
0In
gen
eral
, aud
it co
nduc
ted
for
dom
estic
exp
endi
ture
, but
whe
n no
bu
dget
for s
anita
tion,
no
audi
t or
cons
olid
ated
repo
rting
on
sani
tatio
n in
vest
men
ts
Audi
t rep
ort.
(not
pub
licly
avai
labl
e)
Equi
ityLo
cal p
artic
ipat
ion
Are
ther
e cl
early
defi
ned
proc
edur
es fo
r inf
orm
ing,
co
nsul
ting
with
and
sup
porti
ng lo
cal p
artic
ipat
ion
in p
lann
ing,
bud
getin
g an
d im
plem
entin
g fo
r urb
an
sani
tatio
n de
velo
pmen
ts?
Yes
and
syst
emat
ical
ly ap
plie
d
Yes,
but
not
sy
stem
atic
ally
appl
ied
No1
Dono
r-fu
nded
pro
ject
s no
rmal
ly ad
opt p
artic
ipat
ory
appr
oach
es.
Gove
rnm
ent-
fund
ed in
vest
men
ts
min
imal
to d
ate
(exc
ept p
ublic
toile
ts).
Ther
e is
men
tion
of c
omm
unity
in
volve
men
t und
er s
take
hold
ers
co-
ordi
natio
n (p
25-
26)
(1) D
raft
Urba
n W
aste
wat
er S
trate
gy
(2
) JIC
A-fu
nded
pilo
ts
unde
r MIR
EP 2
(tec
hnic
al
supp
ort b
y BO
RDA)
(3
) UN-
Habi
tat p
roje
ct w
ith D
HUP.
Equi
ityBu
dget
allo
catio
n cr
iteria
Have
crit
eria
(or a
form
ula)
bee
n de
term
ined
to
allo
cate
urb
an s
anita
tion
fund
ing
equi
tabl
y to
ur
ban
utilit
ies
or s
ervic
e pr
ovid
ers
and
amon
g m
unic
ipal
ities
and
is it
bei
ng c
onsi
sten
tly a
pplie
d?
Yes,
app
lied
cons
iste
ntly
Yes,
but
no
t app
lied
cons
iste
ntly
No0
Outli
ne b
udge
t allo
catio
n am
ong
mun
icip
aliti
es b
ut n
o m
entio
n of
cr
iteria
(P.5
8)
Draf
t Urb
an W
aste
wat
er S
trate
gy
SUST
AINI
NG
Equi
tyRe
duci
ng in
equa
lity
Do lo
cal g
over
nmen
t or u
rban
ser
vice
prov
ider
s (n
atio
nal o
r in
3 la
rges
t citi
es) h
ave
spec
ific
plan
s or
m
easu
res
deve
lope
d an
d im
plem
ente
d fo
r ser
ving
the
urba
n po
or?
Plan
s de
velo
ped
and
impl
emen
ted
Plan
s de
velo
ped
but n
ot
impl
emen
ted
No p
lans
do
cum
ente
d0
Draf
t stra
tegy
say
s im
plem
entin
g ag
enci
es s
houl
d en
cour
age
serv
ice
prov
ider
s to
exp
and
serv
ices
for t
o th
e po
or ;
how
ever
no
impl
emen
tatio
n;
no c
oher
ent s
uppo
rt to
poo
r for
urb
an
on-s
ite s
anita
tion
Draf
t Urb
an W
aste
wat
er S
trate
gy
(not
ado
pted
) p56
-57
Outp
utQu
antit
y (a
cces
s)Is
the
annu
al e
xpan
sion
of u
rban
hou
seho
lds
gain
ing
acce
ss to
saf
e sa
nita
tion
suffi
cien
t to
mee
t th
e su
b-se
ctor
targ
ets?
Over
75%
of t
hat
need
ed to
reac
h se
ctor
targ
ets
Betw
een
75%
an
d 50
% o
f th
at n
eede
d to
ac
hiev
e ta
rget
s
Less
than
50%
of
that
nee
ded
to
reac
h ta
rget
s
0On
-site
targ
et 2
015
alre
ady
met
an
d 20
20 ta
rget
feas
ible
; but
no
was
tew
ater
trea
tmen
t tar
gets
or
prog
ress
(1) I
nfor
mat
ion
from
the
Wat
er S
uppl
y Di
visio
n an
d Ur
ban
Plan
ning
Divi
sion
(2) P
roje
cts
rela
ted
to
infra
stru
ctur
e an
d en
viron
men
t.
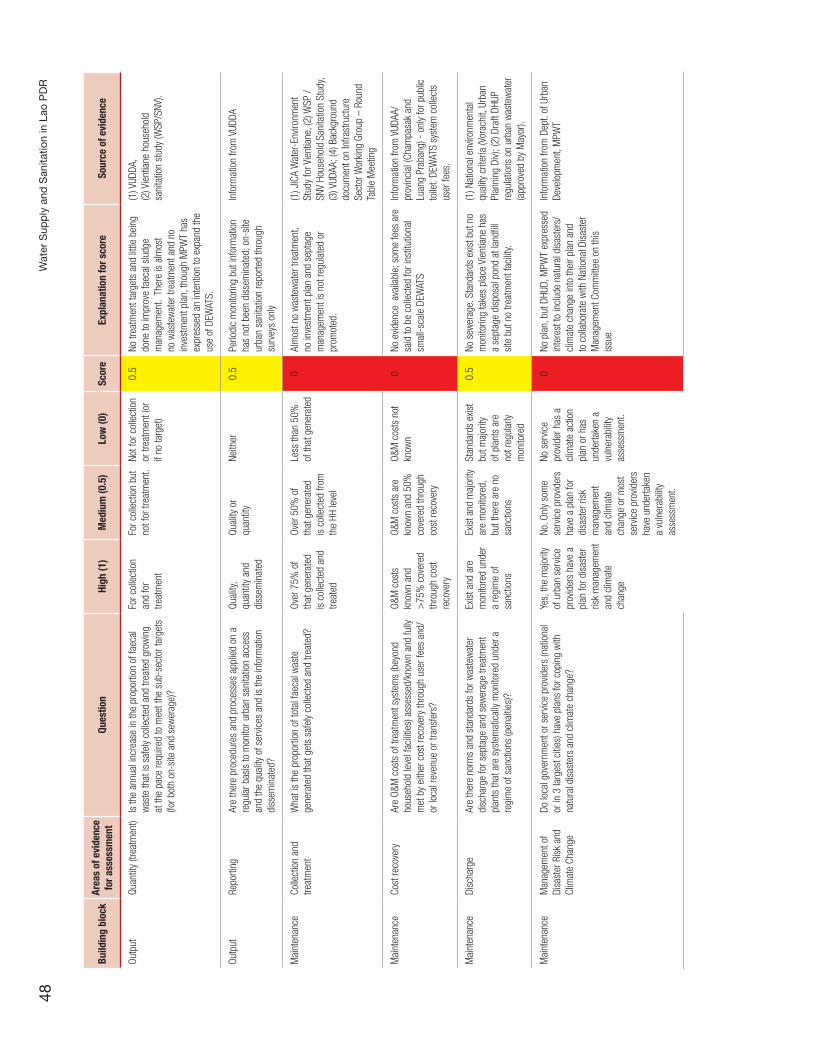
Wat
er S
upp
ly a
nd S
anita
tion
in L
ao P
DR
48
Build
ing
bloc
kAr
eas
of e
vide
nce
for a
sses
smen
tQu
estio
nHi
gh (1
)M
ediu
m (0
.5)
Low
(0)
Scor
eEx
plan
atio
n fo
r sco
reSo
urce
of e
vide
nce
Outp
utQu
antit
y (tr
eatm
ent)
Is th
e an
nual
incr
ease
in th
e pr
opor
tion
of fa
ecal
w
aste
that
is s
afel
y co
llect
ed a
nd tr
eate
d gr
owin
g at
the
pace
requ
ired
to m
eet t
he s
ub-s
ecto
r tar
gets
(fo
r bot
h on
-site
and
sew
erag
e)?
For c
olle
ctio
n an
d fo
r tre
atm
ent
For c
olle
ctio
n bu
t no
t for
trea
tmen
t.No
t for
col
lect
ion
or tr
eatm
ent (
or
if no
targ
et)
0.5
No tr
eatm
ent t
arge
ts a
nd li
ttle
bein
g do
ne to
impr
ove
faec
al s
ludg
e m
anag
emen
t. T
here
is a
lmos
t no
was
tew
ater
trea
tmen
t and
no
inve
stm
ent p
lan,
thou
gh M
PWT
has
expr
esse
d an
inte
ntio
n to
exp
and
the
use
of D
EWAT
S.
(1) V
UDDA
,
(2) V
ient
iane
hou
seho
ld
sani
tatio
n st
udy
(WSP
/SNV
).
Outp
utRe
porti
ngAr
e th
ere
proc
edur
es a
nd p
roce
sses
app
lied
on a
re
gula
r bas
is to
mon
itor u
rban
san
itatio
n ac
cess
an
d th
e qu
ality
of s
ervic
es a
nd is
the
info
rmat
ion
diss
emin
ated
?
Qual
ity,
quan
tity
and
diss
emin
ated
Qual
ity o
r qu
antit
yNe
ither
0.5
Perio
dic
mon
itorin
g bu
t inf
orm
atio
n ha
s no
t bee
n di
ssem
inat
ed; o
n-si
te
urba
n sa
nita
tion
repo
rted
thro
ugh
surv
eys
only
Info
rmat
ion
from
VUD
DA
Mai
nten
ance
Colle
ctio
n an
d tre
atm
ent
Wha
t is
the
prop
ortio
n of
tota
l fae
cal w
aste
ge
nera
ted
that
get
s sa
fely
colle
cted
and
trea
ted?
Over
75%
of
that
gen
erat
ed
is c
olle
cted
and
tre
ated
Over
50%
of
that
gen
erat
ed
is c
olle
cted
from
th
e HH
leve
l
Less
than
50%
of
that
gen
erat
ed0
Alm
ost n
o w
aste
wat
er tr
eatm
ent,
no in
vest
men
t pla
n an
d se
ptag
e m
anag
emen
t is
not r
egul
ated
or
prom
oted
.
(1) J
ICA
Wat
er-E
nviro
nmen
t St
udy
for V
ient
iane
, (2)
WSP
/ SN
V Ho
useh
old
Sani
tatio
n St
udy,
(3
) VUD
AA; (
4) B
ackg
roun
d do
cum
ent o
n In
frast
ruct
ure
Sect
or W
orki
ng G
roup
– R
ound
Ta
ble
Mee
ting
Mai
nten
ance
Cost
reco
very
Are
O&M
cos
ts o
f tre
atm
ent s
yste
ms
(bey
ond
hous
ehol
d le
vel f
acilit
ies)
ass
esse
d/kn
own
and
fully
m
et b
y ei
ther
cos
t rec
over
y th
roug
h us
er fe
es a
nd/
or lo
cal r
even
ue o
r tra
nsfe
rs?
O&M
cos
ts
know
n an
d >
75%
cov
ered
th
roug
h co
st
reco
very
O&M
cos
ts a
re
know
n an
d 50
%
cove
red
thro
ugh
cost
reco
very
O&M
cos
ts n
ot
know
n0
No e
viden
ce a
vaila
ble;
som
e fe
es a
re
said
to b
e co
llect
ed fo
r ins
titut
iona
l sm
all-s
cale
DEW
ATS
Info
rmat
ion
from
VUD
AA/
prov
inci
al (C
ham
pasa
k an
d Lu
ang
Prab
ang)
- o
nly
for p
ublic
to
ilet.
DEW
ATS
syst
em c
olle
cts
user
fees
.
Mai
nten
ance
Disc
harg
eAr
e th
ere
norm
s an
d st
anda
rds
for w
aste
wat
er
disc
harg
e fo
r sep
tage
and
sew
erag
e tre
atm
ent
plan
ts th
at a
re s
yste
mat
ical
ly m
onito
red
unde
r a
regi
me
of s
anct
ions
(pen
altie
s)?
Exis
t and
are
m
onito
red
unde
r a
regi
me
of
sanc
tions
Exis
t and
maj
ority
ar
e m
onito
red,
bu
t the
re a
re n
o sa
nctio
ns
Stan
dard
s ex
ist
but m
ajor
ity
of p
lant
s ar
e no
t reg
ular
ly m
onito
red
0.5
No s
ewer
age.
Sta
ndar
ds e
xist b
ut n
o m
onito
ring
take
s pl
ace
Vien
tiane
has
a
sept
age
disp
osal
pon
d at
land
fill
site
but
no
treat
men
t fac
ility.
(1) N
atio
nal e
nviro
nmen
tal
qual
ity c
riter
ia (V
orac
hit,
Urba
n Pl
anni
ng D
iv); (
2) D
raft
DHUP
re
gula
tions
on
urba
n w
aste
wat
er
(app
rove
d by
May
or).
Mai
nten
ance
Man
agem
ent o
f Di
sast
er R
isk
and
Clim
ate
Chan
ge
Do lo
cal g
over
nmen
t or s
ervic
e pr
ovid
ers
(nat
iona
l or
in 3
larg
est c
ities
) hav
e pl
ans
for c
opin
g w
ith
natu
ral d
isas
ters
and
clim
ate
chan
ge?
Yes,
the
maj
ority
of
urb
an s
ervic
e pr
ovid
ers
have
a
plan
for d
isas
ter
risk
man
agem
ent
and
clim
ate
chan
ge
No. O
nly
som
e se
rvic
e pr
ovid
ers
have
a p
lan
for
disa
ster
risk
m
anag
emen
t an
d cl
imat
e ch
ange
or m
ost
serv
ice
prov
ider
s ha
ve u
nder
take
n a
vuln
erab
ility
asse
ssm
ent.
No s
ervic
e pr
ovid
er h
as a
cl
imat
e ac
tion
plan
or h
as
unde
rtake
n a
vuln
erab
ility
asse
ssm
ent.
0No
pla
n, b
ut D
HUD,
MPW
T ex
pres
sed
inte
rest
to in
clud
e na
tura
l dis
aste
rs/
clim
ate
chan
ge in
to th
eir p
lan
and
to c
olla
bora
te w
ith N
atio
nal D
isas
ter
Man
agem
ent C
omm
ittee
on
this
is
sue.
Info
rmat
ion
from
Dep
t. of
Urb
an
Deve
lopm
ent,
MPW
T
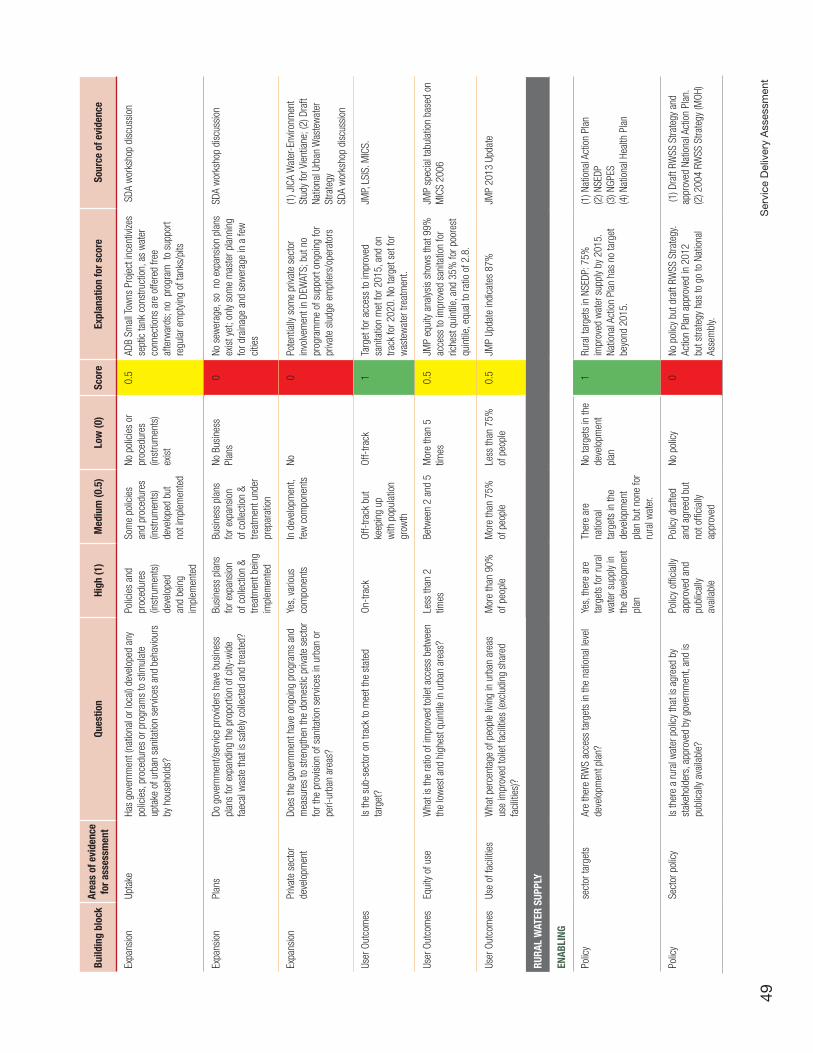
Ser
vice
Del
iver
y A
sses
smen
t49
Build
ing
bloc
kAr
eas
of e
vide
nce
for a
sses
smen
tQu
estio
nHi
gh (1
)M
ediu
m (0
.5)
Low
(0)
Scor
eEx
plan
atio
n fo
r sco
reSo
urce
of e
vide
nce
Expa
nsio
nUp
take
Has
gove
rnm
ent (
natio
nal o
r loc
al) d
evel
oped
any
po
licie
s, p
roce
dure
s or
pro
gram
s to
stim
ulat
e up
take
of u
rban
san
itatio
n se
rvic
es a
nd b
ehav
iour
s by
hou
seho
lds?
Polic
ies
and
proc
edur
es
(inst
rum
ents
) de
velo
ped
and
bein
g im
plem
ente
d
Som
e po
licie
s an
d pr
oced
ures
(in
stru
men
ts)
deve
lope
d bu
t no
t im
plem
ente
d
No p
olic
ies
or
proc
edur
es
(inst
rum
ents
) ex
ist
0.5
ADB
Smal
l Tow
ns P
roje
ct in
cent
ivize
s se
ptic
tank
con
stru
ctio
n, a
s w
ater
co
nnec
tions
are
offe
red
free
afte
rwar
ds; n
o p
rogr
am t
o su
ppor
t re
gula
r em
ptyin
g of
tank
s/pi
ts
SDA
wor
ksho
p di
scus
sion
Expa
nsio
nPl
ans
Do g
over
nmen
t/ser
vice
prov
ider
s ha
ve b
usin
ess
plan
s fo
r exp
andi
ng th
e pr
opor
tion
of c
ity-w
ide
faec
al w
aste
that
is s
afel
y co
llect
ed a
nd tr
eate
d?
Busi
ness
pla
ns
for e
xpan
sion
of
col
lect
ion
& tre
atm
ent b
eing
im
plem
ente
d
Busi
ness
pla
ns
for e
xpan
sion
of
col
lect
ion
& tre
atm
ent u
nder
pr
epar
atio
n
No B
usin
ess
Plan
s0
No s
ewer
age,
so
no
expa
nsio
n pl
ans
exis
t yet
; onl
y so
me
mas
ter p
lann
ing
for d
rain
age
and
sew
erag
e in
a fe
w
citie
s
SDA
wor
ksho
p di
scus
sion
Expa
nsio
nPr
ivate
sec
tor
deve
lopm
ent
Does
the
gove
rnm
ent h
ave
ongo
ing
prog
ram
s an
d m
easu
res
to s
treng
then
the
dom
estic
priv
ate
sect
or
for t
he p
rovis
ion
of s
anita
tion
serv
ices
in u
rban
or
peri-
urba
n ar
eas?
Yes,
var
ious
co
mpo
nent
sIn
dev
elop
men
t, fe
w c
ompo
nent
sNo
0Po
tent
ially
som
e pr
ivate
sec
tor
invo
lvem
ent i
n DE
WAT
S; b
ut n
o pr
ogra
mm
e of
sup
port
ongo
ing
for
priva
te s
ludg
e em
ptie
rs/o
pera
tors
(1) J
ICA
Wat
er-E
nviro
nmen
t St
udy
for V
ient
iane
; (2)
Dra
ft Na
tiona
l Urb
an W
aste
wat
er
Stra
tegy
SDA
wor
ksho
p di
scus
sion
User
Out
com
esIs
the
sub-
sect
or o
n tra
ck to
mee
t the
sta
ted
targ
et?
On-t
rack
Off-
track
but
ke
epin
g up
w
ith p
opul
atio
n gr
owth
Off-
track
1Ta
rget
for a
cces
s to
impr
oved
sa
nita
tion
met
for 2
015,
and
on
track
for 2
020.
No
targ
et s
et fo
r w
aste
wat
er tr
eatm
ent.
JMP,
LSIS
. MIC
S.
User
Out
com
esEq
uity
of u
seW
hat i
s th
e ra
tio o
f im
prov
ed to
ilet a
cces
s be
twee
n th
e lo
wes
t and
hig
hest
qui
ntile
in u
rban
are
as?
Less
than
2
times
Betw
een
2 an
d 5
Mor
e th
an 5
tim
es0.
5JM
P eq
uity
ana
lysis
sho
ws
that
99%
ac
cess
to im
prov
ed s
anita
tion
for
riche
st q
uint
ile, a
nd 3
5% fo
r poo
rest
qu
intil
e, e
qual
to ra
tio o
f 2.8
.
JMP
spec
ial t
abul
atio
n ba
sed
on
MIC
S 20
06
User
Out
com
esUs
e of
faci
litie
sW
hat p
erce
ntag
e of
peo
ple
livin
g in
urb
an a
reas
us
e im
prov
ed to
ilet f
acilit
ies
(exc
ludi
ng s
hare
d fa
cilit
ies)
?
Mor
e th
an 9
0%
of p
eopl
eM
ore
than
75%
of
peo
ple
Less
than
75%
of
peo
ple
0.5
JMP
Upda
te in
dica
tes
87%
JMP
2013
Upd
ate
RURA
L W
ATER
SUP
PLY
ENAB
LING
Polic
yse
ctor
targ
ets
Are
ther
e RW
S ac
cess
targ
ets
in th
e na
tiona
l lev
el
deve
lopm
ent p
lan?
Yes,
ther
e ar
e ta
rget
s fo
r rur
al
wat
er s
uppl
y in
th
e de
velo
pmen
t pl
an
Ther
e ar
e na
tiona
l ta
rget
s in
the
deve
lopm
ent
plan
but
non
e fo
r ru
ral w
ater
.
No ta
rget
s in
the
deve
lopm
ent
plan
1Ru
ral t
arge
ts in
NSE
DP: 7
5%
impr
oved
wat
er s
uppl
y by
201
5.
Natio
nal A
ctio
n Pl
an h
as n
o ta
rget
be
yond
201
5.
(1) N
atio
nal A
ctio
n Pl
an
(2
) NSE
DP
(3) N
GPES
(4
) Nat
iona
l Hea
lth P
lan
Polic
ySe
ctor
pol
icy
Is th
ere
a ru
ral w
ater
pol
icy
that
is a
gree
d by
st
akeh
olde
rs, a
ppro
ved
by g
over
nmen
t, an
d is
pu
blic
ally
avai
labl
e?
Polic
y of
ficia
lly
appr
oved
and
pu
blic
ally
avai
labl
e
Polic
y dr
afte
d an
d ag
reed
but
no
t offi
cial
ly ap
prov
ed
No p
olic
y0
No p
olic
y bu
t dra
ft RW
SS S
trate
gy.
Actio
n Pl
an a
ppro
ved
in 2
012
but s
trate
gy h
as to
go
to N
atio
nal
Asse
mbl
y.
(1) D
raft
RWSS
Stra
tegy
and
ap
prov
ed N
atio
nal A
ctio
n Pl
an.
(2
) 200
4 RW
SS S
trate
gy (M
OH)
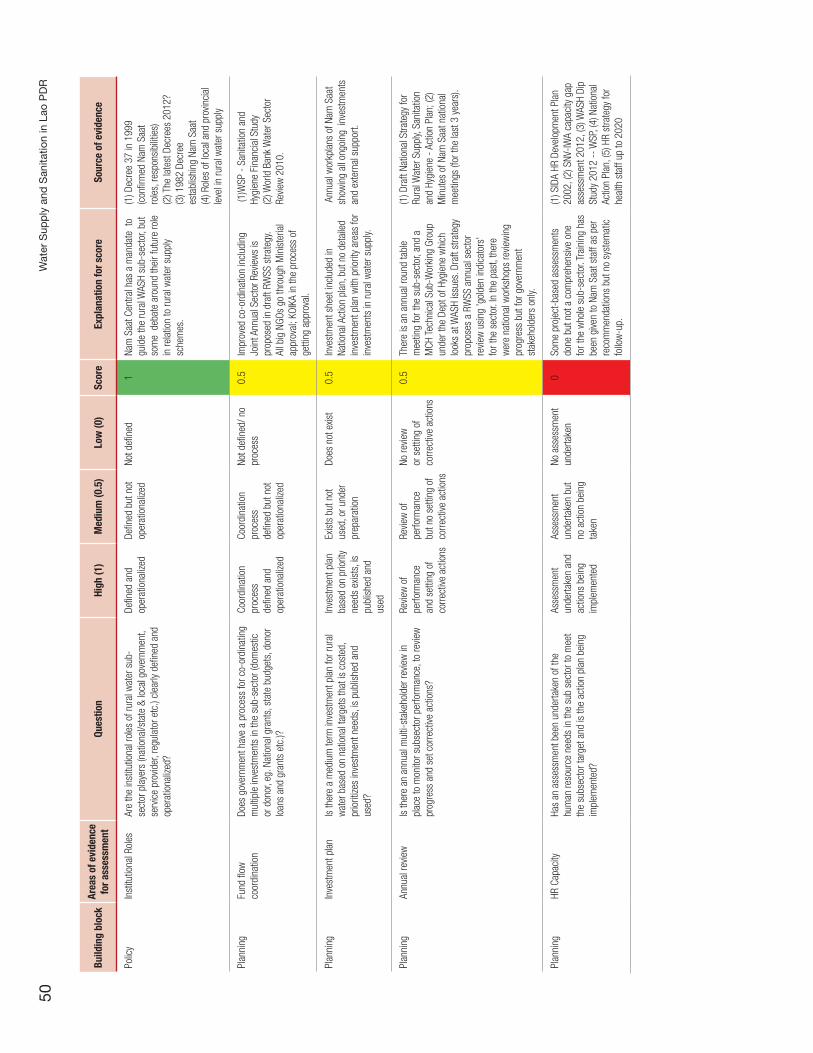
Wat
er S
upp
ly a
nd S
anita
tion
in L
ao P
DR
50
Build
ing
bloc
kAr
eas
of e
vide
nce
for a
sses
smen
tQu
estio
nHi
gh (1
)M
ediu
m (0
.5)
Low
(0)
Scor
eEx
plan
atio
n fo
r sco
reSo
urce
of e
vide
nce
Polic
yIn
stitu
tiona
l Rol
esAr
e th
e in
stitu
tiona
l rol
es o
f rur
al w
ater
sub
-se
ctor
pla
yers
(nat
iona
l/sta
te &
loca
l gov
ernm
ent,
serv
ice
prov
ider
, reg
ulat
or e
tc.)
clea
rly d
efine
d an
d op
erat
iona
lized
?
Defin
ed a
nd
oper
atio
naliz
edDe
fined
but
not
op
erat
iona
lized
Not d
efine
d1
Nam
Saa
t Cen
tral h
as a
man
date
to
guid
e th
e ru
ral W
ASH
sub-
sect
or, b
ut
som
e d
ebat
e ar
ound
thei
r fut
ure
role
in
rela
tion
to ru
ral w
ater
sup
ply
sche
mes
.
(1) D
ecre
e 37
in 1
999
(con
firm
ed N
am S
aat
role
s, re
spon
sibi
litie
s)
(2) T
he la
test
Dec
rees
201
2?
(3) 1
982
Decr
ee
esta
blis
hing
Nam
Saa
t
(4
) Rol
es o
f loc
al a
nd p
rovin
cial
le
vel i
n ru
ral w
ater
sup
ply
Plan
ning
Fund
flow
co
ordi
natio
nDo
es g
over
nmen
t hav
e a
proc
ess
for c
o-or
dina
ting
mul
tiple
inve
stm
ents
in th
e su
b-se
ctor
(dom
estic
or
don
or, e
g. N
atio
nal g
rant
s, s
tate
bud
gets
, don
or
loan
s an
d gr
ants
etc
.)?
Coor
dina
tion
proc
ess
defin
ed a
nd
oper
atio
naliz
ed
Coor
dina
tion
proc
ess
defin
ed b
ut n
ot
oper
atio
naliz
ed
Not d
efine
d/ n
o pr
oces
s0.
5Im
prov
ed c
o-or
dina
tion
incl
udin
g Jo
int A
nnua
l Sec
tor R
evie
ws
is
prop
osed
in d
raft
RWSS
stra
tegy
. Al
l big
NGO
s go
thro
ugh
Min
iste
rial
appr
oval
; KOI
KA in
the
proc
ess
of
getti
ng a
ppro
val.
(1)W
SP -
San
itatio
n an
d Hy
gien
e Fi
nanc
ial S
tudy
(2) W
orld
Ban
k W
ater
Sec
tor
Revie
w 2
010.
Plan
ning
Inve
stm
ent p
lan
Is th
ere
a m
ediu
m te
rm in
vest
men
t pla
n fo
r rur
al
wat
er b
ased
on
natio
nal t
arge
ts th
at is
cos
ted,
pr
iorit
izes
inve
stm
ent n
eeds
, is
publ
ishe
d an
d us
ed?
Inve
stm
ent p
lan
base
d on
prio
rity
need
s ex
ists
, is
publ
ishe
d an
d us
ed
Exis
ts b
ut n
ot
used
, or u
nder
pr
epar
atio
n
Does
not
exis
t0.
5In
vest
men
t she
et in
clud
ed in
Na
tiona
l Act
ion
plan
, but
no
deta
iled
inve
stm
ent p
lan
with
prio
rity
area
s fo
r in
vest
men
ts in
rura
l wat
er s
uppl
y.
Ann
ual w
orkp
lans
of N
am S
aat
show
ing
all o
ngoi
ng i
nves
tmen
ts
and
exte
rnal
sup
port.
Plan
ning
Annu
al re
view
Is th
ere
an a
nnua
l mul
ti-st
akeh
olde
r rev
iew
in
plac
e to
mon
itor s
ubse
ctor
per
form
ance
, to
revie
w
prog
ress
and
set
cor
rect
ive a
ctio
ns?
Revie
w o
f pe
rform
ance
an
d se
tting
of
corre
ctive
act
ions
Revie
w o
f pe
rform
ance
bu
t no
setti
ng o
f co
rrect
ive a
ctio
ns
No re
view
or
set
ting
of
corre
ctive
act
ions
0.5
Ther
e is
an
annu
al ro
und
tabl
e m
eetin
g fo
r the
sub
-sec
tor,
and
a M
CH T
echn
ical
Sub
-Wor
king
Gro
up
unde
r the
Dep
t of H
ygie
ne w
hich
lo
oks
at W
ASH
issu
es. D
raft
stra
tegy
pr
opos
es a
RW
SS a
nnua
l sec
tor
revie
w u
sing
'gol
den
indi
cato
rs'
for t
he s
ecto
r. In
the
past
, the
re
wer
e na
tiona
l wor
ksho
ps re
view
ing
prog
ress
but
for g
over
nmen
t st
akeh
olde
rs o
nly.
(1) D
raft
Natio
nal S
trate
gy fo
r Ru
ral W
ater
Sup
ply,
Sani
tatio
n an
d Hy
gien
e - A
ctio
n Pl
an; (
2)
Min
utes
of N
am S
aat n
atio
nal
mee
tings
(for
the
last
3 y
ears
).
Plan
ning
HR C
apac
ityHa
s an
ass
essm
ent b
een
unde
rtake
n of
the
hum
an re
sour
ce n
eeds
in th
e su
b se
ctor
to m
eet
the
subs
ecto
r tar
get a
nd is
the
actio
n pl
an b
eing
im
plem
ente
d?
Asse
ssm
ent
unde
rtake
n an
d ac
tions
bei
ng
impl
emen
ted
Asse
ssm
ent
unde
rtake
n bu
t no
act
ion
bein
g ta
ken
No a
sses
smen
t un
derta
ken
0So
me
proj
ect-
base
d as
sess
men
ts
done
but
not
a c
ompr
ehen
sive
one
fo
r the
who
le s
ub-s
ecto
r. Tr
aini
ng h
as
been
give
n to
Nam
Saa
t sta
ff as
per
re
com
men
datio
ns b
ut n
o sy
stem
atic
fo
llow
-up.
(1) S
IDA
HR D
evel
opm
ent P
lan
2002
, (2)
SNV
-IWA
capa
city
gap
as
sess
men
t 201
2, (3
) WAS
H Di
p St
udy
2012
-- W
SP, (
4) N
atio
nal
Actio
n Pl
an, (
5) H
R st
rate
gy fo
r he
alth
sta
ff up
to 2
020
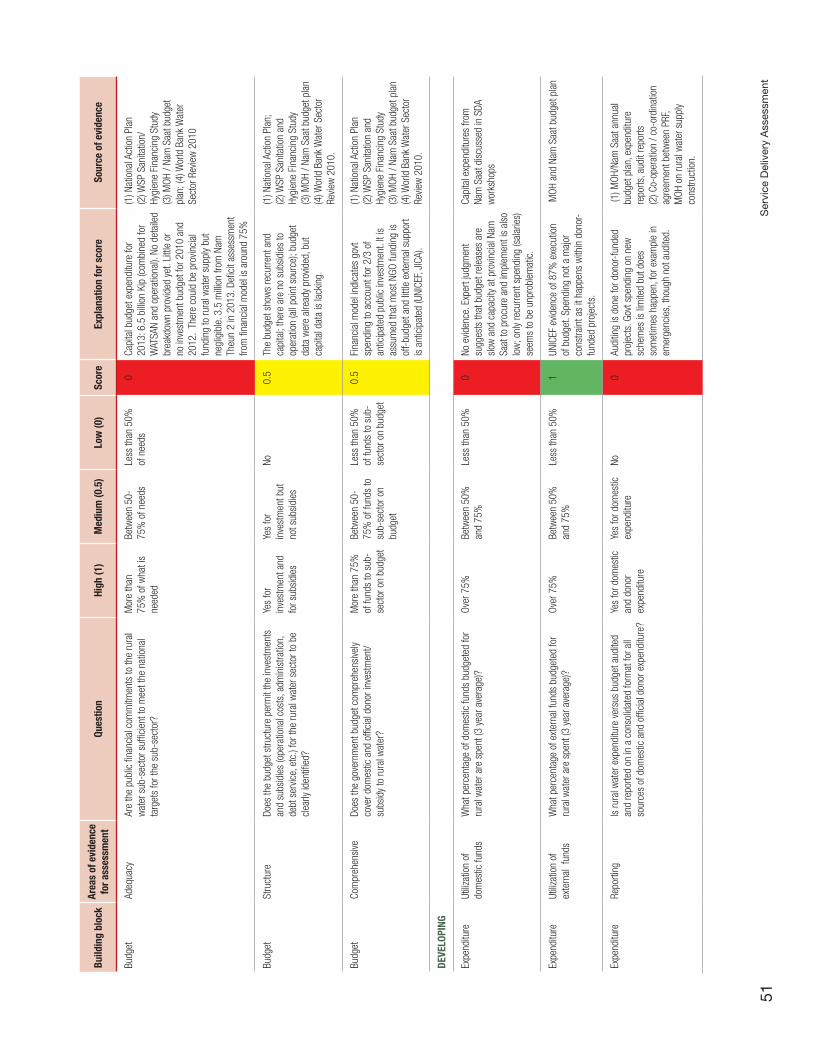
Ser
vice
Del
iver
y A
sses
smen
t51
Build
ing
bloc
kAr
eas
of e
vide
nce
for a
sses
smen
tQu
estio
nHi
gh (1
)M
ediu
m (0
.5)
Low
(0)
Scor
eEx
plan
atio
n fo
r sco
reSo
urce
of e
vide
nce
Budg
etAd
equa
cyAr
e th
e pu
blic
fina
ncia
l com
mitm
ents
to th
e ru
ral
wat
er s
ub-s
ecto
r suf
ficie
nt to
mee
t the
nat
iona
l ta
rget
s fo
r the
sub
-sec
tor?
Mor
e th
an
75%
of w
hat i
s ne
eded
Betw
een
50-
75%
of n
eeds
Less
than
50%
of
nee
ds0
Capi
tal b
udge
t exp
endi
ture
for
2013
: 6.5
billi
on K
ip (c
ombi
ned
for
WAT
SAN
and
oper
atio
nal).
No
deta
iled
brea
kdow
n pr
ovid
ed y
et. L
ittle
or
no in
vest
men
t bud
get f
or 2
010
and
2012
. Th
ere
coul
d be
pro
vinci
al
fund
ing
to ru
ral w
ater
sup
ply
but
negl
igib
le. 3
.5 m
illion
from
Nam
Th
eun
2 in
201
3. D
efici
t ass
essm
ent
from
fina
ncia
l mod
el is
aro
und
75%
(1) N
atio
nal A
ctio
n Pl
an
(2
) WSP
San
itatio
n/Hy
gien
e Fi
nanc
ing
Stud
y
(3) M
OH /
Nam
Saa
t bud
get
plan
; (4)
Wor
ld B
ank
Wat
er
Sect
or R
evie
w 2
010
Budg
etSt
ruct
ure
Does
the
budg
et s
truct
ure
perm
it th
e in
vest
men
ts
and
subs
idie
s (o
pera
tiona
l cos
ts, a
dmin
istra
tion,
de
bt s
ervic
e, e
tc.)
for t
he ru
ral w
ater
sec
tor t
o be
cl
early
iden
tified
?
Yes
for
inve
stm
ent a
nd
for s
ubsi
dies
Yes
for
inve
stm
ent b
ut
not s
ubsi
dies
No0.
5Th
e bu
dget
sho
ws
recu
rrent
and
ca
pita
l; th
ere
are
no s
ubsi
dies
to
oper
atio
n (a
ll po
int s
ourc
e); b
udge
t da
ta w
ere
alre
ady
prov
ided
, but
ca
pita
l dat
a is
lack
ing.
(1) N
atio
nal A
ctio
n Pl
an;
(2
) WSP
San
itatio
n an
d Hy
gien
e Fi
nanc
ing
Stud
y
(3) M
OH /
Nam
Saa
t bud
get p
lan
(4) W
orld
Ban
k W
ater
Sec
tor
Revie
w 2
010.
Budg
etCo
mpr
ehen
sive
Does
the
gove
rnm
ent b
udge
t com
preh
ensi
vely
cove
r dom
estic
and
offi
cial
don
or in
vest
men
t/ su
bsid
y to
rura
l wat
er?
Mor
e th
an 7
5%
of fu
nds
to s
ub-
sect
or o
n bu
dget
Betw
een
50-
75%
of f
unds
to
sub-
sect
or o
n bu
dget
Less
than
50%
of
fund
s to
sub
-se
ctor
on
budg
et
0.5
Fina
ncia
l mod
el in
dica
tes
govt
sp
endi
ng to
acc
ount
for 2
/3 o
f an
ticip
ated
pub
lic in
vest
men
t. It
is
assu
med
that
mos
t NGO
fund
ing
is
off-
budg
et a
nd li
ttle
exte
rnal
sup
port
is a
ntic
ipat
ed (U
NICE
F, JI
CA).
(1) N
atio
nal A
ctio
n Pl
an
(2) W
SP S
anita
tion
and
Hygi
ene
Fina
ncin
g St
udy
(3
) MOH
/ Na
m S
aat b
udge
t pla
n (4
) Wor
ld B
ank
Wat
er S
ecto
r Re
view
201
0.
DEVE
LOPI
NG
Expe
nditu
reUt
ilizat
ion
of
dom
estic
fund
sW
hat p
erce
ntag
e of
dom
estic
fund
s bu
dget
ed fo
r ru
ral w
ater
are
spe
nt (3
yea
r ave
rage
)?Ov
er 7
5%Be
twee
n 50
%
and
75%
Less
than
50%
0No
evid
ence
. Exp
ert j
udgm
ent
sugg
ests
that
bud
get r
elea
ses
are
slow
and
cap
acity
at p
rovin
cial
Nam
Sa
at to
pro
cure
and
impl
emen
t is
also
lo
w; o
nly
recu
rrent
spe
ndin
g (s
alar
ies)
se
ems
to b
e un
prob
lem
atic
.
Capi
tal e
xpen
ditu
res
from
Na
m S
aat d
iscu
ssed
in S
DA
wor
ksho
ps
Expe
nditu
reUt
ilizat
ion
of
exte
rnal
fun
dsW
hat p
erce
ntag
e of
ext
erna
l fun
ds b
udge
ted
for
rura
l wat
er a
re s
pent
(3 y
ear a
vera
ge)?
Ov
er 7
5%Be
twee
n 50
%
and
75%
Less
than
50%
1UN
ICEF
evid
ence
of 8
7% e
xecu
tion
of b
udge
t. Sp
endi
ng n
ot a
maj
or
cons
train
t as
it ha
ppen
s w
ithin
don
or-
fund
ed p
roje
cts.
MOH
and
Nam
Saa
t bud
get p
lan
Expe
nditu
reRe
porti
ngIs
rura
l wat
er e
xpen
ditu
re v
ersu
s bu
dget
aud
ited
and
repo
rted
on in
a c
onso
lidat
ed fo
rmat
for a
ll so
urce
s of
dom
estic
and
offi
cial
don
or e
xpen
ditu
re?
Yes
for d
omes
tic
and
dono
r ex
pend
iture
Yes
for d
omes
tic
expe
nditu
reNo
0Au
ditin
g is
don
e fo
r don
or-f
unde
d pr
ojec
ts. G
ovt s
pend
ing
on n
ew
sche
mes
is li
mite
d bu
t doe
s so
met
imes
hap
pen,
for e
xam
ple
in
emer
genc
ies,
thou
gh n
ot a
udite
d.
(1) M
OH/N
am S
aat a
nnua
l bu
dget
pla
n, e
xpen
ditu
re
repo
rts, a
udit
repo
rts
(2) C
o-op
erat
ion
/ co-
ordi
natio
n ag
reem
ent b
etw
een
PRF,
MOH
on
rura
l wat
er s
uppl
y co
nstru
ctio
n.
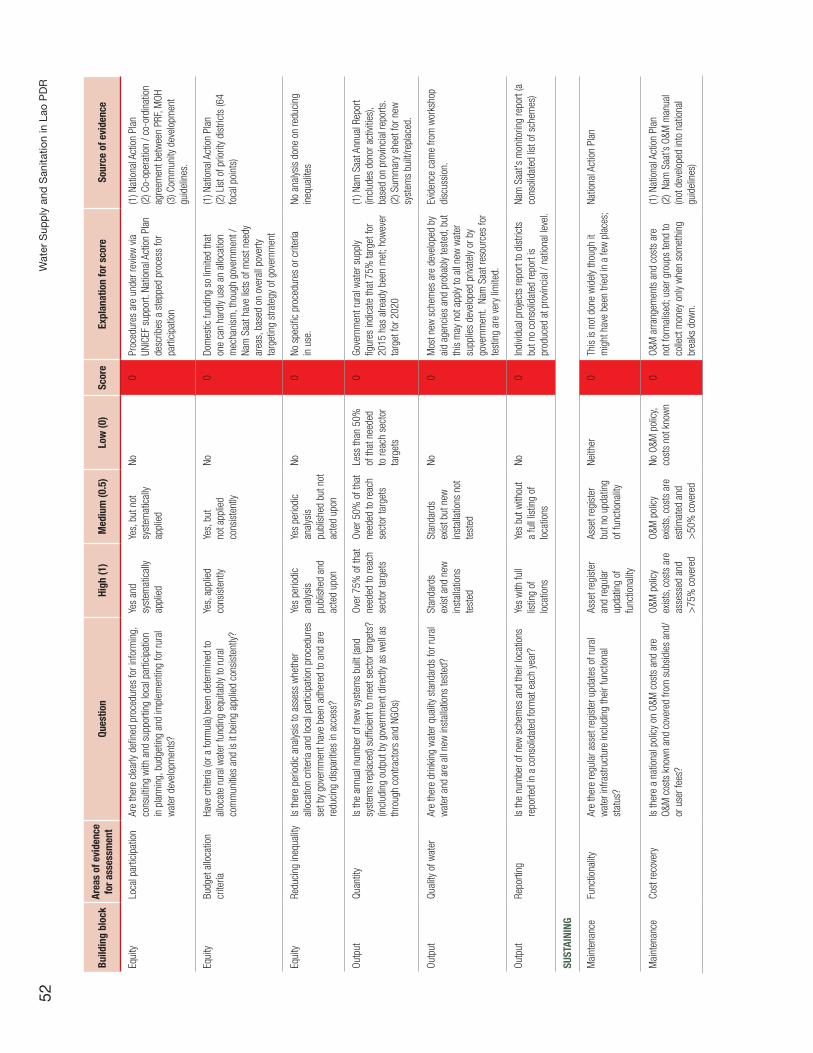
Wat
er S
upp
ly a
nd S
anita
tion
in L
ao P
DR
52
Build
ing
bloc
kAr
eas
of e
vide
nce
for a
sses
smen
tQu
estio
nHi
gh (1
)M
ediu
m (0
.5)
Low
(0)
Scor
eEx
plan
atio
n fo
r sco
reSo
urce
of e
vide
nce
Equi
tyLo
cal p
artic
ipat
ion
Are
ther
e cl
early
defi
ned
proc
edur
es fo
r inf
orm
ing,
co
nsul
ting
with
and
sup
porti
ng lo
cal p
artic
ipat
ion
in p
lann
ing,
bud
getin
g an
d im
plem
entin
g fo
r rur
al
wat
er d
evel
opm
ents
?
Yes
and
syst
emat
ical
ly ap
plie
d
Yes,
but
not
sy
stem
atic
ally
appl
ied
No0
Proc
edur
es a
re u
nder
revie
w v
ia
UNIC
EF s
uppo
rt. N
atio
nal A
ctio
n Pl
an
desc
ribes
a s
tepp
ed p
roce
ss fo
r pa
rtici
patio
n
(1) N
atio
nal A
ctio
n Pl
an
(2
) Co-
oper
atio
n / c
o-or
dina
tion
agre
emen
t bet
wee
n PR
F, M
OH
(3) C
omm
unity
dev
elop
men
t gu
idel
ines
.
Equi
tyBu
dget
allo
catio
n cr
iteria
Have
crit
eria
(or a
form
ula)
bee
n de
term
ined
to
allo
cate
rura
l wat
er fu
ndin
g eq
uita
bly
to ru
ral
com
mun
ities
and
is it
bei
ng a
pplie
d co
nsis
tent
ly?
Yes,
app
lied
cons
iste
ntly
Yes,
but
no
t app
lied
cons
iste
ntly
No0
Dom
estic
fund
ing
so li
mite
d th
at
one
can
hard
ly us
e an
allo
catio
n m
echa
nism
, tho
ugh
gove
rnm
ent /
Na
m S
aat h
ave
lists
of m
ost n
eedy
ar
eas,
bas
ed o
n ov
eral
l pov
erty
ta
rget
ing
stra
tegy
of g
over
nmen
t
(1) N
atio
nal A
ctio
n Pl
an
(2
) Lis
t of p
riorit
y di
stric
ts (6
4 fo
cal p
oint
s)
Equi
tyRe
duci
ng in
equa
lity
Is th
ere
perio
dic
anal
ysis
to a
sses
s w
heth
er
allo
catio
n cr
iteria
and
loca
l par
ticip
atio
n pr
oced
ures
se
t by
gove
rnm
ent h
ave
been
adh
ered
to a
nd a
re
redu
cing
dis
parit
ies
in a
cces
s?
Yes
perio
dic
anal
ysis
pu
blis
hed
and
acte
d up
on
Yes
perio
dic
anal
ysis
pu
blis
hed
but n
ot
acte
d up
on
No0
No s
peci
fic p
roce
dure
s or
crit
eria
in
use
. No
ana
lysis
don
e on
redu
cing
in
equa
lites
Outp
ut
Quan
tity
Is th
e an
nual
num
ber o
f new
sys
tem
s bu
ilt (a
nd
syst
ems
repl
aced
) suf
ficie
nt to
mee
t sec
tor t
arge
ts?
(incl
udin
g ou
tput
by
gove
rnm
ent d
irect
ly as
wel
l as
thro
ugh
cont
ract
ors
and
NGOs
)
Over
75%
of t
hat
need
ed to
reac
h se
ctor
targ
ets
Over
50%
of t
hat
need
ed to
reac
h se
ctor
targ
ets
Less
than
50%
of
that
nee
ded
to re
ach
sect
or
targ
ets
0Go
vern
men
t rur
al w
ater
sup
ply
figur
es in
dica
te th
at 7
5% ta
rget
for
2015
has
alre
ady
been
met
; how
ever
ta
rget
for 2
020
(1) N
am S
aat A
nnua
l Rep
ort
(incl
udes
don
or a
ctivi
ties)
, ba
sed
on p
rovin
cial
repo
rts.
(2
) Sum
mar
y sh
eet f
or n
ew
syst
ems
built
/repl
aced
.
Outp
ut
Qual
ity o
f wat
erAr
e th
ere
drin
king
wat
er q
ualit
y st
anda
rds
for r
ural
w
ater
and
are
all
new
inst
alla
tions
test
ed?
Stan
dard
s ex
ist a
nd n
ew
inst
alla
tions
te
sted
Stan
dard
s ex
ist b
ut n
ew
inst
alla
tions
not
te
sted
No0
Mos
t new
sch
emes
are
dev
elop
ed b
y ai
d ag
enci
es a
nd p
roba
bly
test
ed, b
ut
this
may
not
app
ly to
all
new
wat
er
supp
lies
deve
lope
d pr
ivate
ly or
by
gove
rnm
ent.
Nam
Saa
t res
ourc
es fo
r te
stin
g ar
e ve
ry li
mite
d.
Evid
ence
cam
e fro
m w
orks
hop
disc
ussi
on.
Outp
ut
Repo
rting
Is th
e nu
mbe
r of n
ew s
chem
es a
nd th
eir l
ocat
ions
re
porte
d in
a c
onso
lidat
ed fo
rmat
eac
h ye
ar?
Yes
with
full
listin
g of
lo
catio
ns
Yes
but w
ithou
t a
full
listin
g of
lo
catio
ns
No0
Indi
vidua
l pro
ject
s re
port
to d
istri
cts
but n
o co
nsol
idat
ed re
port
is
prod
uced
at p
rovin
cial
/ na
tiona
l lev
el.
Nam
Saa
t's m
onito
ring
repo
rt (a
co
nsol
idat
ed li
st o
f sch
emes
)
SUST
AINI
NG
Mai
nten
ance
Func
tiona
lity
Are
ther
e re
gula
r ass
et re
gist
er u
pdat
es o
f rur
al
wat
er in
frast
ruct
ure
incl
udin
g th
eir f
unct
iona
l st
atus
?
Asse
t reg
iste
r an
d re
gula
r up
datin
g of
fu
nctio
nalit
y
Asse
t reg
iste
r bu
t no
upda
ting
of fu
nctio
nalit
y
Neith
er0
This
is n
ot d
one
wid
ely
thou
gh it
m
ight
hav
e be
en tr
ied
in a
few
pla
ces;
Na
tiona
l Act
ion
Plan
Mai
nten
ance
Cost
reco
very
Is th
ere
a na
tiona
l pol
icy
on O
&M c
osts
and
are
O&
M c
osts
kno
wn
and
cove
red
from
sub
sidi
es a
nd/
or u
ser f
ees?
O&M
pol
icy
exis
ts, c
osts
are
as
sess
ed a
nd
>75
% c
over
ed
O&M
pol
icy
exis
ts, c
osts
are
es
timat
ed a
nd
>50
% c
over
ed
No O
&M p
olic
y, co
sts
not k
now
n0
O&M
arra
ngem
ents
and
cos
ts a
re
not f
orm
alis
ed; u
ser g
roup
s te
nd to
co
llect
mon
ey o
nly
whe
n so
met
hing
br
eaks
dow
n.
(1) N
atio
nal A
ctio
n Pl
an
(2
) Na
m S
aat’s
O&M
man
ual
(not
dev
elop
ed in
to n
atio
nal
guid
elin
es)
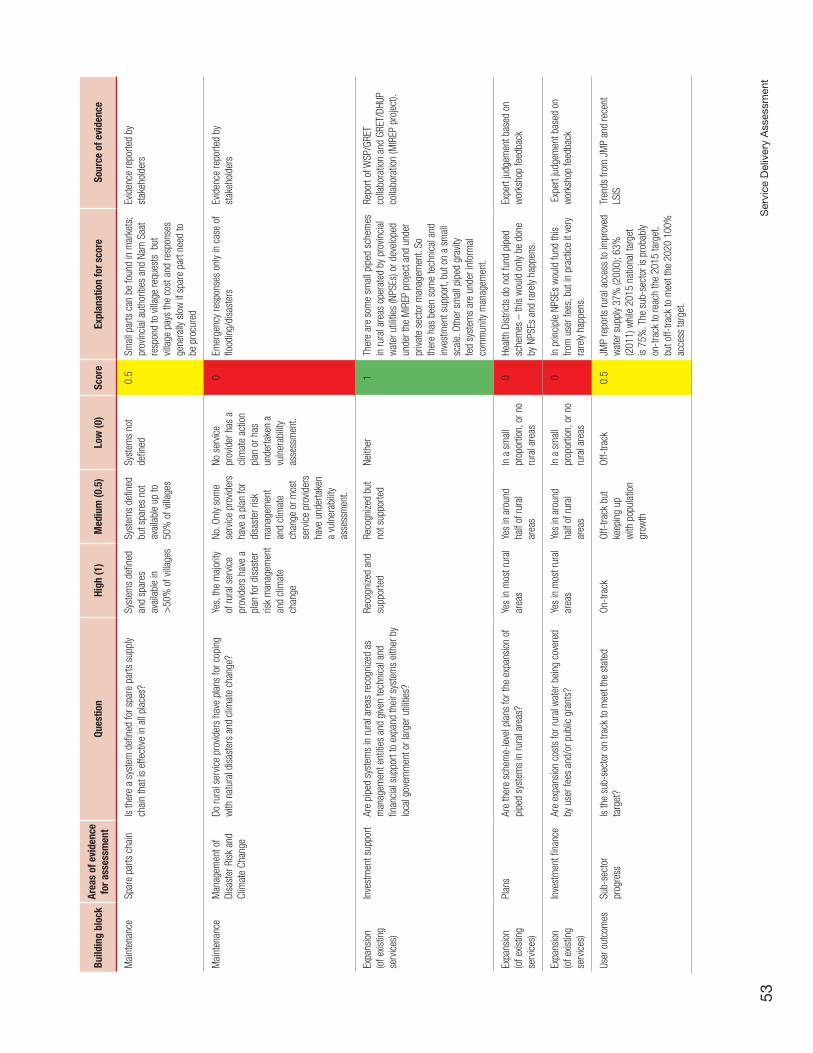
Ser
vice
Del
iver
y A
sses
smen
t53
Build
ing
bloc
kAr
eas
of e
vide
nce
for a
sses
smen
tQu
estio
nHi
gh (1
)M
ediu
m (0
.5)
Low
(0)
Scor
eEx
plan
atio
n fo
r sco
reSo
urce
of e
vide
nce
Mai
nten
ance
Spar
e pa
rts c
hain
Is th
ere
a sy
stem
defi
ned
for s
pare
par
ts s
uppl
y ch
ain
that
is e
ffect
ive in
all
plac
es?
Syst
ems
defin
ed
and
spar
es
avai
labl
e in
>
50%
of v
illage
s
Syst
ems
defin
ed
but s
pare
s no
t av
aila
ble
up to
50
% o
f villa
ges
Syst
ems
not
defin
ed0.
5Sm
all p
arts
can
be
foun
d in
mar
kets
; pr
ovin
cial
aut
horit
ies
and
Nam
Saa
t re
spon
d to
villa
ge re
ques
ts b
ut
villa
ge p
ays
the
cost
and
resp
onse
s ge
nera
lly s
low
if s
pare
par
t nee
d to
be
pro
cure
d
Evid
ence
repo
rted
by
stak
ehol
ders
Mai
nten
ance
Man
agem
ent o
f Di
sast
er R
isk
and
Clim
ate
Chan
ge
Do ru
ral s
ervic
e pr
ovid
ers
have
pla
ns fo
r cop
ing
with
nat
ural
dis
aste
rs a
nd c
limat
e ch
ange
?Ye
s, th
e m
ajor
ity
of ru
ral s
ervic
e pr
ovid
ers
have
a
plan
for d
isas
ter
risk
man
agem
ent
and
clim
ate
chan
ge
No. O
nly
som
e se
rvic
e pr
ovid
ers
have
a p
lan
for
disa
ster
risk
m
anag
emen
t an
d cl
imat
e ch
ange
or m
ost
serv
ice
prov
ider
s ha
ve u
nder
take
n a
vuln
erab
ility
asse
ssm
ent.
No s
ervic
e pr
ovid
er h
as a
cl
imat
e ac
tion
plan
or h
as
unde
rtake
n a
vuln
erab
ility
asse
ssm
ent.
0Em
erge
ncy
resp
onse
s on
ly in
cas
e of
flo
odin
g/di
sast
ers
Evid
ence
repo
rted
by
stak
ehol
ders
Expa
nsio
n
(of e
xistin
g se
rvic
es)
Inve
stm
ent s
uppo
rtAr
e pi
ped
syst
ems
in ru
ral a
reas
reco
gnize
d as
m
anag
emen
t ent
ities
and
give
n te
chni
cal a
nd
finan
cial
sup
port
to e
xpan
d th
eir s
yste
ms
eith
er b
y lo
cal g
over
nmen
t or l
arge
r util
ities
?
Reco
gnize
d an
d su
ppor
ted
Reco
gnize
d bu
t no
t sup
porte
dNe
ither
1Th
ere
are
som
e sm
all p
iped
sch
emes
in
rura
l are
as o
pera
ted
by p
rovin
cial
w
ater
util
ities
(NPS
Es) o
r dev
elop
ed
unde
r the
MIR
EP p
roje
ct a
nd u
nder
pr
ivate
sec
tor m
anag
emen
t. So
th
ere
has
been
som
e te
chni
cal a
nd
inve
stm
ent s
uppo
rt, b
ut o
n a
smal
l sc
ale.
Oth
er s
mal
l pip
ed g
ravit
y fe
d sy
stem
s ar
e un
der i
nfor
mal
co
mm
unity
man
agem
ent.
Repo
rt of
WSP
/GRE
T co
llabo
ratio
n an
d GR
ET/D
HUP
colla
bora
tion
(MIR
EP p
roje
ct).
Expa
nsio
n
(of e
xistin
g se
rvic
es)
Plan
sAr
e th
ere
sche
me-
leve
l pla
ns fo
r the
exp
ansi
on o
f pi
ped
syst
ems
in ru
ral a
reas
?Ye
s in
mos
t rur
al
area
sYe
s in
aro
und
half
of ru
ral
area
s
In a
sm
all
prop
ortio
n, o
r no
rura
l are
as
0He
alth
Dis
trict
s do
not
fund
pip
ed
sche
mes
– th
is w
ould
onl
y be
don
e by
NPS
Es a
nd ra
rely
happ
ens.
Expe
rt ju
dgem
ent b
ased
on
wor
ksho
p fe
edba
ck
Expa
nsio
n
(of e
xistin
g se
rvic
es)
Inve
stm
ent fi
nanc
eAr
e ex
pans
ion
cost
s fo
r rur
al w
ater
bei
ng c
over
ed
by u
ser f
ees
and/
or p
ublic
gra
nts?
Ye
s in
mos
t rur
al
area
sYe
s in
aro
und
half
of ru
ral
area
s
In a
sm
all
prop
ortio
n, o
r no
rura
l are
as
0In
prin
cipl
e NP
SEs
wou
ld fu
nd th
is
from
use
r fee
s, b
ut in
pra
ctic
e it
very
ra
rely
happ
ens.
Exp
ert j
udge
men
t bas
ed o
n w
orks
hop
feed
back
User
out
com
esSu
b-se
ctor
pr
ogre
ssIs
the
sub-
sect
or o
n tra
ck to
mee
t the
sta
ted
targ
et?
On-t
rack
Off-
track
but
ke
epin
g up
w
ith p
opul
atio
n gr
owth
Off-
track
0.5
JMP
repo
rts ru
ral a
cces
s to
impr
oved
w
ater
sup
ply
37%
(200
0); 6
3%
(201
1) w
hile
201
5 na
tiona
l tar
get
is 7
5%. T
he s
ub-s
ecto
r is
prob
ably
on-t
rack
to re
ach
the
2015
targ
et,
but o
ff-tra
ck to
mee
t the
202
0 10
0%
acce
ss ta
rget
.
Tren
ds fr
om J
MP
and
rece
nt
LSIS
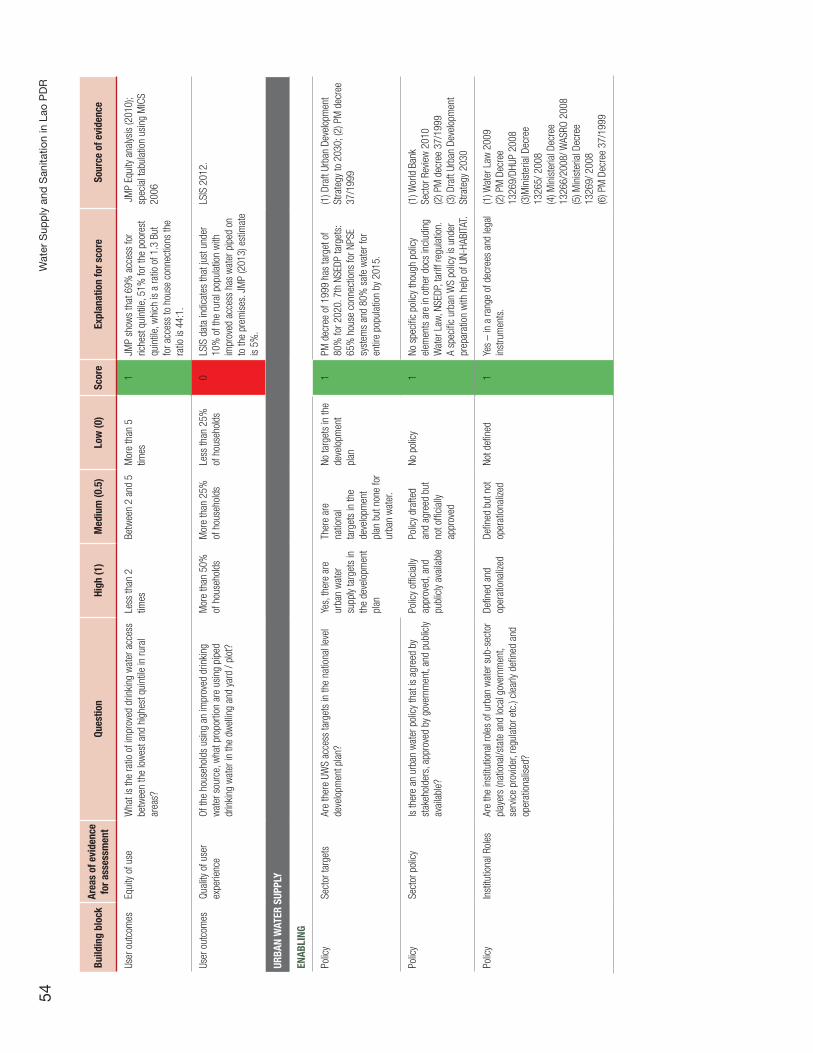
Wat
er S
upp
ly a
nd S
anita
tion
in L
ao P
DR
54
Build
ing
bloc
kAr
eas
of e
vide
nce
for a
sses
smen
tQu
estio
nHi
gh (1
)M
ediu
m (0
.5)
Low
(0)
Scor
eEx
plan
atio
n fo
r sco
reSo
urce
of e
vide
nce
User
out
com
esEq
uity
of u
seW
hat i
s th
e ra
tio o
f im
prov
ed d
rinki
ng w
ater
acc
ess
betw
een
the
low
est a
nd h
ighe
st q
uint
ile in
rura
l ar
eas?
Less
than
2
times
Betw
een
2 an
d 5
Mor
e th
an 5
tim
es1
JMP
show
s th
at 6
9% a
cces
s fo
r ric
hest
qui
ntile
, 51%
for t
he p
oore
st
quin
tile,
whi
ch is
a ra
tio o
f 1.3
But
fo
r acc
ess
to h
ouse
con
nect
ions
the
ratio
is 4
4:1.
JM
P Eq
uity
ana
lysis
(201
0);
spec
ial t
abul
atio
n us
ing
MIC
S 20
06
User
out
com
esQu
ality
of u
ser
expe
rienc
eOf
the
hous
ehol
ds u
sing
an
impr
oved
drin
king
w
ater
sou
rce,
wha
t pro
porti
on a
re u
sing
pip
ed
drin
king
wat
er in
the
dwel
ling
and
yard
/ pl
ot?
Mor
e th
an 5
0%
of h
ouse
hold
sM
ore
than
25%
of
hou
seho
lds
Less
than
25%
of
hou
seho
lds
0LS
IS d
ata
indi
cate
s th
at ju
st u
nder
10
% o
f the
rura
l pop
ulat
ion
with
im
prov
ed a
cces
s ha
s w
ater
pip
ed o
n to
the
prem
ises
. JM
P (2
013)
est
imat
e is
5%
.
LSIS
201
2.
URBA
N W
ATER
SUP
PLY
ENAB
LING
Polic
ySe
ctor
targ
ets
Are
ther
e UW
S ac
cess
targ
ets
in th
e na
tiona
l lev
el
deve
lopm
ent p
lan?
Ye
s, th
ere
are
urba
n w
ater
su
pply
targ
ets
in
the
deve
lopm
ent
plan
Ther
e ar
e na
tiona
l ta
rget
s in
the
deve
lopm
ent
plan
but
non
e fo
r ur
ban
wat
er.
No ta
rget
s in
the
deve
lopm
ent
plan
1PM
dec
ree
of 1
999
has
targ
et o
f 80
% fo
r 202
0. 7
th N
SEDP
targ
ets:
65
% h
ouse
con
nect
ions
for N
PSE
syst
ems
and
80%
saf
e w
ater
for
entir
e po
pula
tion
by 2
015.
(1) D
raft
Urba
n De
velo
pmen
t St
rate
gy to
203
0; (2
) PM
dec
ree
37/1
999
Polic
ySe
ctor
pol
icy
Is th
ere
an u
rban
wat
er p
olic
y th
at is
agr
eed
by
stak
ehol
ders
, app
rove
d by
gov
ernm
ent,
and
publ
icly
avai
labl
e?
Polic
y of
ficia
lly
appr
oved
, and
pu
blic
ly av
aila
ble
Polic
y dr
afte
d an
d ag
reed
but
no
t offi
cial
ly ap
prov
ed
No p
olic
y1
No s
peci
fic p
olic
y th
ough
pol
icy
elem
ents
are
in o
ther
doc
s in
clud
ing
Wat
er L
aw, N
SEDP
, tar
iff re
gula
tion.
A
spec
ific
urba
n W
S po
licy
is u
nder
pr
epar
atio
n w
ith h
elp
of U
N-HA
BITA
T.
(1) W
orld
Ban
k Se
ctor
Rev
iew
201
0
(2
) PM
dec
ree
37/1
999
(3
) Dra
ft Ur
ban
Deve
lopm
ent
Stra
tegy
203
0
Polic
yIn
stitu
tiona
l Rol
esAr
e th
e in
stitu
tiona
l rol
es o
f urb
an w
ater
sub
-sec
tor
play
ers
(nat
iona
l/sta
te a
nd lo
cal g
over
nmen
t, se
rvic
e pr
ovid
er, r
egul
ator
etc
.) cl
early
defi
ned
and
oper
atio
nalis
ed?
Defin
ed a
nd
oper
atio
naliz
edDe
fined
but
not
op
erat
iona
lized
Not d
efine
d1
Yes
– in
a ra
nge
of d
ecre
es a
nd le
gal
inst
rum
ents
. (1
) Wat
er L
aw 2
009
(2
) PM
Dec
ree
1326
9/DH
UP 2
008
(3)M
inis
teria
l Dec
ree
1326
5/ 2
008
(4
) Min
iste
rial D
ecre
e 13
266/
2008
/ WAS
RO 2
008
(5
) Min
iste
rial D
ecre
e 13
269/
200
8
(6) P
M D
ecre
e 37
/199
9
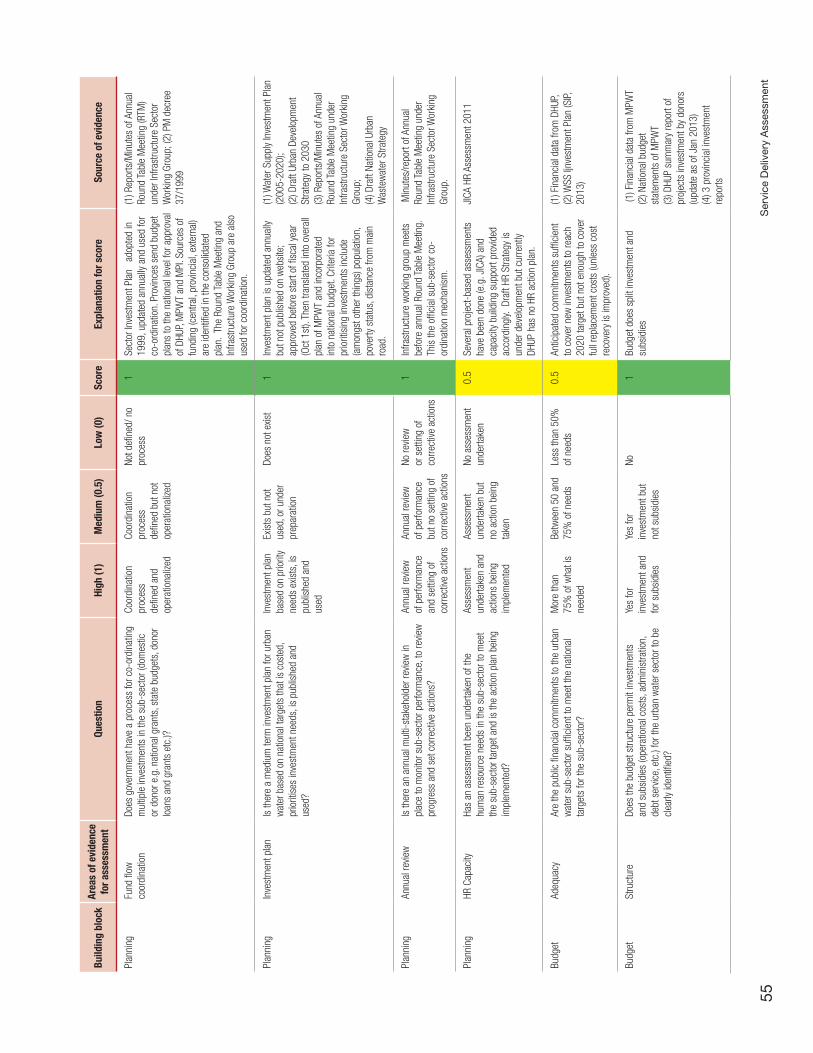
Ser
vice
Del
iver
y A
sses
smen
t55
Build
ing
bloc
kAr
eas
of e
vide
nce
for a
sses
smen
tQu
estio
nHi
gh (1
)M
ediu
m (0
.5)
Low
(0)
Scor
eEx
plan
atio
n fo
r sco
reSo
urce
of e
vide
nce
Plan
ning
Fund
flow
co
ordi
natio
nDo
es g
over
nmen
t hav
e a
proc
ess
for c
o-or
dina
ting
mul
tiple
inve
stm
ents
in th
e su
b-se
ctor
(dom
estic
or
don
or e
.g. n
atio
nal g
rant
s, s
tate
bud
gets
, don
or
loan
s an
d gr
ants
etc
.)?
Coor
dina
tion
proc
ess
defin
ed a
nd
oper
atio
naliz
ed
Coor
dina
tion
proc
ess
defin
ed b
ut n
ot
oper
atio
naliz
ed
Not d
efine
d/ n
o pr
oces
s1
Sect
or In
vest
men
t Pla
n a
dopt
ed in
19
99, u
pdat
ed a
nnua
lly a
nd u
sed
for
co-o
rdin
atio
n. P
rovin
ces
send
bud
get
plan
s to
the
natio
nal l
evel
for a
ppro
val
of D
HUP,
MPW
T an
d M
PI. S
ourc
es o
f fu
ndin
g (c
entra
l, pr
ovin
cial
, ext
erna
l) ar
e id
entifi
ed in
the
cons
olid
ated
pl
an.
The
Roun
d Ta
ble
Mee
ting
and
Infra
stru
ctur
e W
orki
ng G
roup
are
als
o us
ed fo
r coo
rdin
atio
n.
(1) R
epor
ts/M
inut
es o
f Ann
ual
Roun
d Ta
ble
Mee
ting
(RTM
) un
der I
nfra
stru
ctur
e Se
ctor
W
orki
ng G
roup
; (2)
PM
dec
ree
37/1
999
Plan
ning
Inve
stm
ent p
lan
Is th
ere
a m
ediu
m te
rm in
vest
men
t pla
n fo
r urb
an
wat
er b
ased
on
natio
nal t
arge
ts th
at is
cos
ted,
pr
iorit
ises
inve
stm
ent n
eeds
, is
publ
ishe
d an
d us
ed?
Inve
stm
ent p
lan
base
d on
prio
rity
need
s ex
ists
, is
publ
ishe
d an
d us
ed
Exis
ts b
ut n
ot
used
, or u
nder
pr
epar
atio
n
Does
not
exis
t1
Inve
stm
ent p
lan
is u
pdat
ed a
nnua
lly
but n
ot p
ublis
hed
on w
ebsi
te;
appr
oved
bef
ore
star
t of fi
scal
yea
r (O
ct 1
st).
Then
tran
slat
ed in
to o
vera
ll pl
an o
f MPW
T an
d in
corp
orat
ed
into
nat
iona
l bud
get.
Crite
ria fo
r pr
iorit
isin
g in
vest
men
ts in
clud
e (a
mon
gst o
ther
thin
gs) p
opul
atio
n,
pove
rty s
tatu
s, d
ista
nce
from
mai
n ro
ad.
(1) W
ater
Sup
ply
Inve
stm
ent P
lan
(200
5-20
20);
(2) D
raft
Urba
n De
velo
pmen
t St
rate
gy to
203
0
(3) R
epor
ts/M
inut
es o
f Ann
ual
Roun
d Ta
ble
Mee
ting
unde
r In
frast
ruct
ure
Sect
or W
orki
ng
Grou
p;
(4) D
raft
Natio
nal U
rban
W
aste
wat
er S
trate
gy
Plan
ning
Annu
al re
view
Is th
ere
an a
nnua
l mul
ti-st
akeh
olde
r rev
iew
in
plac
e to
mon
itor s
ub-s
ecto
r per
form
ance
, to
revie
w
prog
ress
and
set
cor
rect
ive a
ctio
ns?
Annu
al re
view
of
per
form
ance
an
d se
tting
of
corre
ctive
act
ions
Annu
al re
view
of
per
form
ance
bu
t no
setti
ng o
f co
rrect
ive a
ctio
ns
No re
view
or
set
ting
of
corre
ctive
act
ions
1In
frast
ruct
ure
wor
king
gro
up m
eets
be
fore
ann
ual R
ound
Tab
le M
eetin
g.
This
the
offic
ial s
ub-s
ecto
r co-
ordi
natio
n m
echa
nism
.
Min
utes
/repo
rt of
Ann
ual
Roun
d Ta
ble
Mee
ting
unde
r In
frast
ruct
ure
Sect
or W
orki
ng
Grou
p.
Plan
ning
HR C
apac
ityHa
s an
ass
essm
ent b
een
unde
rtake
n of
the
hum
an re
sour
ce n
eeds
in th
e su
b-se
ctor
to m
eet
the
sub-
sect
or ta
rget
and
is th
e ac
tion
plan
bei
ng
impl
emen
ted?
Asse
ssm
ent
unde
rtake
n an
d ac
tions
bei
ng
impl
emen
ted
Asse
ssm
ent
unde
rtake
n bu
t no
act
ion
bein
g ta
ken
No a
sses
smen
t un
derta
ken
0.5
Seve
ral p
roje
ct-b
ased
ass
essm
ents
ha
ve b
een
done
(e.g
. JIC
A) a
nd
capa
city
bui
ldin
g su
ppor
t pro
vided
ac
cord
ingl
y. D
raft
HR S
trate
gy is
un
der d
evel
opm
ent b
ut c
urre
ntly
DHUP
has
no
HR a
ctio
n pl
an.
JICA
HR
Asse
ssm
ent 2
011
Budg
etAd
equa
cyAr
e th
e pu
blic
fina
ncia
l com
mitm
ents
to th
e ur
ban
wat
er s
ub-s
ecto
r suf
ficie
nt to
mee
t the
nat
iona
l ta
rget
s fo
r the
sub
-sec
tor?
Mor
e th
an
75%
of w
hat i
s ne
eded
Betw
een
50 a
nd
75%
of n
eeds
Less
than
50%
of
nee
ds0.
5An
ticip
ated
com
mitm
ents
suf
ficie
nt
to c
over
new
inve
stm
ents
to re
ach
2020
targ
et b
ut n
ot e
noug
h to
cov
er
full
repl
acem
ent c
osts
(unl
ess
cost
re
cove
ry is
impr
oved
).
(1) F
inan
cial
dat
a fro
m D
HUP,
(2) W
SS Ij
nves
tmen
t Pla
n (S
IP,
2013
)
Budg
etSt
ruct
ure
Does
the
budg
et s
truct
ure
perm
it in
vest
men
ts
and
subs
idie
s (o
pera
tiona
l cos
ts, a
dmin
istra
tion,
de
bt s
ervic
e, e
tc.)
for t
he u
rban
wat
er s
ecto
r to
be
clea
rly id
entifi
ed?
Yes
for
inve
stm
ent a
nd
for s
ubsi
dies
Yes
for
inve
stm
ent b
ut
not s
ubsi
dies
No1
Budg
et d
oes
split
inve
stm
ent a
nd
subs
idie
s (1
) Fin
anci
al d
ata
from
MPW
T
(2
) Nat
iona
l bud
get
stat
emen
ts o
f MPW
T
(3) D
HUP
sum
mar
y re
port
of
proj
ects
inve
stm
ent b
y do
nors
(u
pdat
e as
of J
an 2
013)
(4
) 3 p
rovin
cial
inve
stm
ent
repo
rts
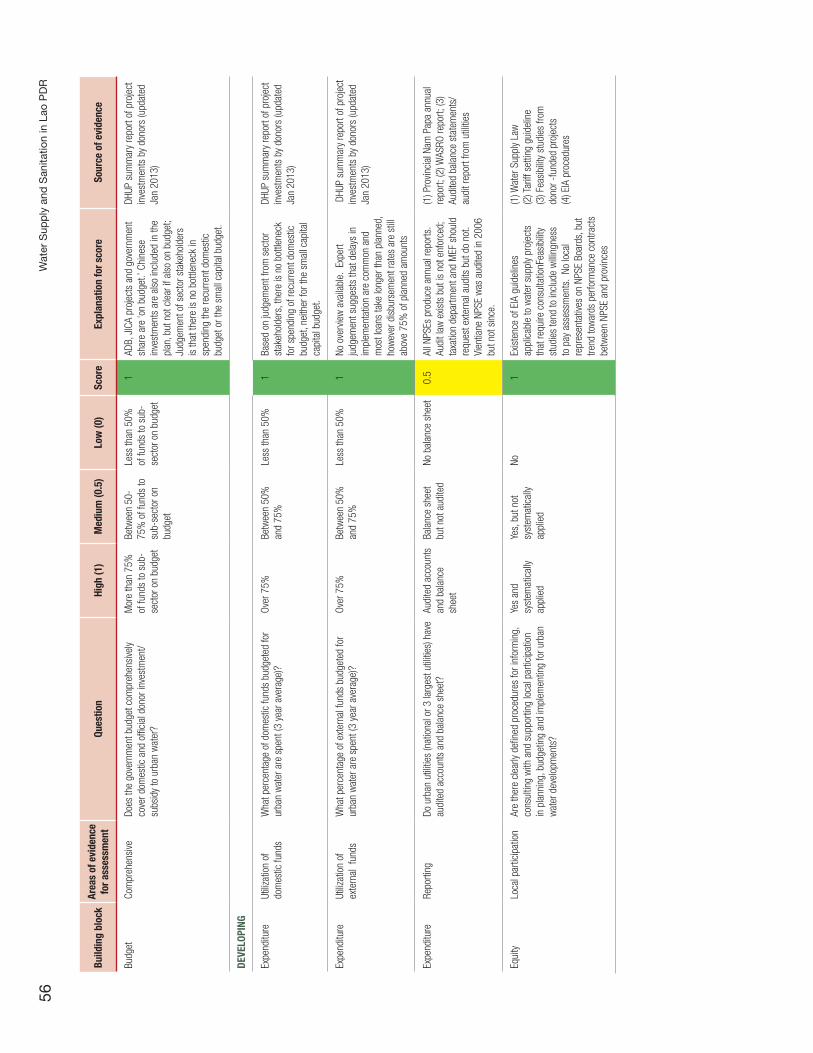
Wat
er S
upp
ly a
nd S
anita
tion
in L
ao P
DR
56
Build
ing
bloc
kAr
eas
of e
vide
nce
for a
sses
smen
tQu
estio
nHi
gh (1
)M
ediu
m (0
.5)
Low
(0)
Scor
eEx
plan
atio
n fo
r sco
reSo
urce
of e
vide
nce
Budg
etCo
mpr
ehen
sive
Does
the
gove
rnm
ent b
udge
t com
preh
ensi
vely
cove
r dom
estic
and
offi
cial
don
or in
vest
men
t/ su
bsid
y to
urb
an w
ater
?
Mor
e th
an 7
5%
of fu
nds
to s
ub-
sect
or o
n bu
dget
Betw
een
50-
75%
of f
unds
to
sub-
sect
or o
n bu
dget
Less
than
50%
of
fund
s to
sub
-se
ctor
on
budg
et
1AD
B, J
ICA
proj
ects
and
gov
ernm
ent
shar
e ar
e ‘o
n bu
dget
.’ Ch
ines
e in
vest
men
ts a
re a
lso
incl
uded
in th
e pl
an, b
ut n
ot c
lear
if a
lso
on b
udge
t; Ju
dgem
ent o
f sec
tor s
take
hold
ers
is th
at th
ere
is n
o bo
ttlen
eck
in
spen
ding
the
recu
rrent
dom
estic
bu
dget
or t
he s
mal
l cap
ital b
udge
t.
DHUP
sum
mar
y re
port
of p
roje
ct
inve
stm
ents
by
dono
rs (u
pdat
ed
Jan
2013
)
DEVE
LOPI
NG
Expe
nditu
reUt
ilizat
ion
of
dom
estic
fund
sW
hat p
erce
ntag
e of
dom
estic
fund
s bu
dget
ed fo
r ur
ban
wat
er a
re s
pent
(3 y
ear a
vera
ge)?
Ov
er 7
5%Be
twee
n 50
%
and
75%
Less
than
50%
1Ba
sed
on ju
dgem
ent f
rom
sec
tor
stak
ehol
ders
, the
re is
no
bottl
enec
k fo
r spe
ndin
g of
recu
rrent
dom
estic
bu
dget
, nei
ther
for t
he s
mal
l cap
ital
capi
tal b
udge
t.
DHUP
sum
mar
y re
port
of p
roje
ct
inve
stm
ents
by
dono
rs (u
pdat
ed
Jan
2013
)
Expe
nditu
reUt
ilizat
ion
of
exte
rnal
fun
dsW
hat p
erce
ntag
e of
ext
erna
l fun
ds b
udge
ted
for
urba
n w
ater
are
spe
nt (3
yea
r ave
rage
)?
Over
75%
Betw
een
50%
an
d 75
%Le
ss th
an 5
0%1
No o
verv
iew
ava
ilabl
e. E
xper
t ju
dgem
ent s
ugge
sts
that
del
ays
in
impl
emen
tatio
n ar
e co
mm
on a
nd
mos
t loa
ns ta
ke lo
nger
than
pla
nned
, ho
wev
er d
isbu
rsem
ent r
ates
are
stil
l ab
ove
75%
of p
lann
ed a
mou
nts
DHU
P su
mm
ary
repo
rt of
pro
ject
in
vest
men
ts b
y do
nors
(upd
ated
Ja
n 20
13)
Expe
nditu
reRe
porti
ngDo
urb
an u
tiliti
es (n
atio
nal o
r 3 la
rges
t util
ities
) hav
e au
dite
d ac
coun
ts a
nd b
alan
ce s
heet
? Au
dite
d ac
coun
ts
and
bala
nce
shee
t
Bala
nce
shee
t bu
t not
aud
ited
No b
alan
ce s
heet
0.5
All N
PSEs
pro
duce
ann
ual r
epor
ts.
Audi
t law
exis
ts b
ut is
not
enf
orce
d;
taxa
tion
depa
rtmen
t and
MEF
sho
uld
requ
est e
xter
nal a
udits
but
do
not.
Vi
entia
ne N
PSE
was
aud
ited
in 2
006
but n
ot s
ince
.
(1) P
rovin
cial
Nam
Pap
a an
nual
re
port;
(2) W
ASRO
repo
rt; (3
) Au
dite
d ba
lanc
e st
atem
ents
/au
dit r
epor
t fro
m u
tiliti
es
Equi
tyLo
cal p
artic
ipat
ion
Are
ther
e cl
early
defi
ned
proc
edur
es fo
r inf
orm
ing,
co
nsul
ting
with
and
sup
porti
ng lo
cal p
artic
ipat
ion
in p
lann
ing,
bud
getin
g an
d im
plem
entin
g fo
r urb
an
wat
er d
evel
opm
ents
?
Yes
and
syst
emat
ical
ly ap
plie
d
Yes,
but
not
sy
stem
atic
ally
appl
ied
No1
Exis
tenc
e of
EIA
gui
delin
es
appl
icab
le to
wat
er s
uppl
y pr
ojec
ts
that
requ
ire c
onsu
ltatio
nFea
sibi
lity
stud
ies
tend
to in
clud
e w
illing
ness
to
pay
ass
essm
ents
. No
loca
l re
pres
enta
tives
on
NPSE
Boa
rds,
but
tre
nd to
war
ds p
erfo
rman
ce c
ontra
cts
betw
een
NPSE
and
pro
vince
s
(1) W
ater
Sup
ply
Law
(2
) Tar
iff s
ettin
g gu
idel
ine
(3) F
easi
bilit
y st
udie
s fro
m
dono
r -fu
nded
pro
ject
s
(4
) EIA
pro
cedu
res
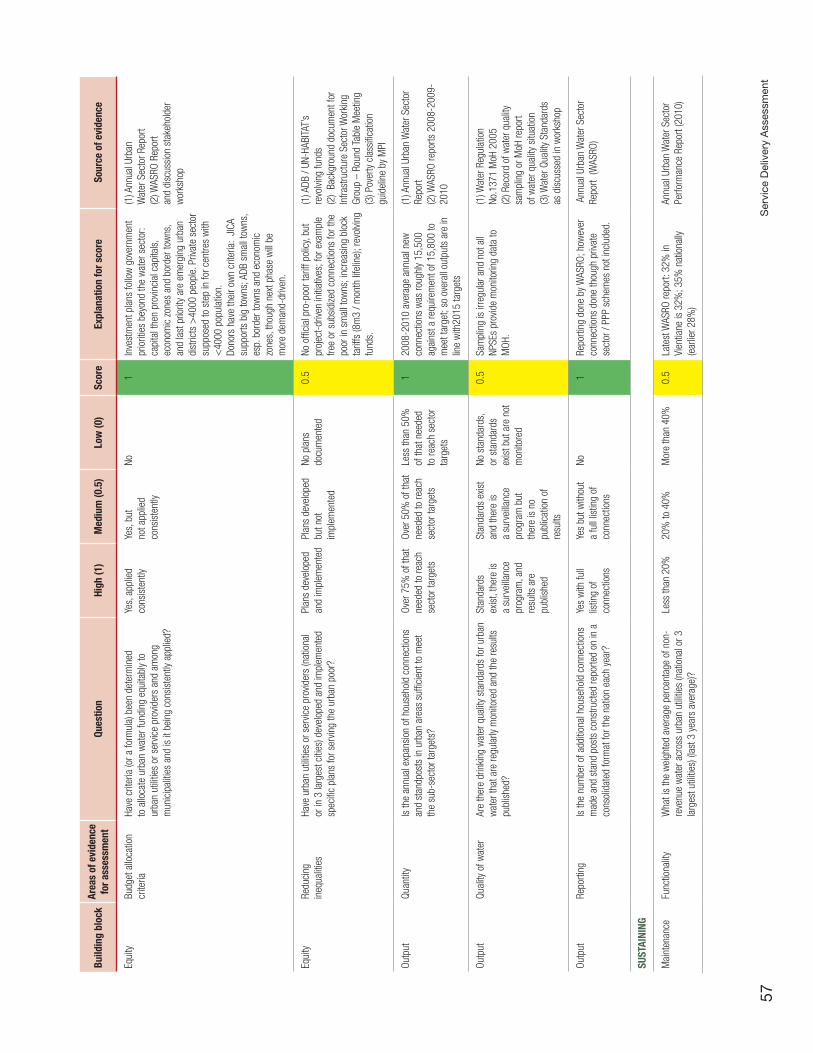
Ser
vice
Del
iver
y A
sses
smen
t57
Build
ing
bloc
kAr
eas
of e
vide
nce
for a
sses
smen
tQu
estio
nHi
gh (1
)M
ediu
m (0
.5)
Low
(0)
Scor
eEx
plan
atio
n fo
r sco
reSo
urce
of e
vide
nce
Equi
tyBu
dget
allo
catio
n cr
iteria
Have
crit
eria
(or a
form
ula)
bee
n de
term
ined
to
allo
cate
urb
an w
ater
fund
ing
equi
tabl
y to
ur
ban
utilit
ies
or s
ervic
e pr
ovid
ers
and
amon
g m
unic
ipal
ities
and
is it
bei
ng c
onsi
sten
tly a
pplie
d?
Yes,
app
lied
cons
iste
ntly
Yes,
but
no
t app
lied
cons
iste
ntly
No1
Inve
stm
ent p
lans
follo
w g
over
nmen
t pr
iorit
ies
beyo
nd th
e w
ater
sec
tor:
capi
tal t
hen
prov
inci
al c
apita
ls,
econ
omic
zon
es a
nd b
orde
r tow
ns,
and
last
prio
rity
are
emer
ging
urb
an
dist
ricts
>40
00 p
eopl
e. P
rivat
e se
ctor
su
ppos
ed to
ste
p in
for c
entre
s w
ith
<40
00 p
opul
atio
n.
Dono
rs h
ave
thei
r ow
n cr
iteria
: JI
CA
supp
orts
big
tow
ns; A
DB s
mal
l tow
ns,
esp.
bor
der t
owns
and
eco
nom
ic
zone
s, th
ough
nex
t pha
se w
ill be
m
ore
dem
and-
drive
n.
(1) A
nnua
l Urb
an
Wat
er S
ecto
r Rep
ort
(2
) WAS
RO R
epor
tan
d di
scus
sion
sta
keho
lder
w
orks
hop
Equi
tyRe
duci
ng
ineq
ualit
ies
Have
urb
an u
tiliti
es o
r ser
vice
prov
ider
s (n
atio
nal
or in
3 la
rges
t citi
es) d
evel
oped
and
impl
emen
ted
spec
ific
plan
s fo
r ser
ving
the
urba
n po
or?
Plan
s de
velo
ped
and
impl
emen
ted
Plan
s de
velo
ped
but n
ot
impl
emen
ted
No p
lans
do
cum
ente
d0.
5No
offi
cial
pro
-poo
r tar
iff p
olic
y, bu
t pr
ojec
t-dr
iven
initi
ative
s; fo
r exa
mpl
e fre
e or
sub
sidi
zed
conn
ectio
ns fo
r the
po
or in
sm
all t
owns
; inc
reas
ing
bloc
k ta
riffs
(8m
3 / m
onth
life
line)
; rev
olvin
g fu
nds.
(1) A
DB /
UN-H
ABIT
AT’s
re
volvi
ng fu
nds
(2
) Ba
ckgr
ound
doc
umen
t for
In
frast
ruct
ure
Sect
or W
orki
ng
Grou
p –
Roun
d Ta
ble
Mee
ting
(3) P
over
ty c
lass
ifica
tion
guid
elin
e by
MPI
Outp
utQu
antit
yIs
the
annu
al e
xpan
sion
of h
ouse
hold
con
nect
ions
an
d st
andp
osts
in u
rban
are
as s
uffic
ient
to m
eet
the
sub-
sect
or ta
rget
s?
Over
75%
of t
hat
need
ed to
reac
h se
ctor
targ
ets
Over
50%
of t
hat
need
ed to
reac
h se
ctor
targ
ets
Less
than
50%
of
that
nee
ded
to re
ach
sect
or
targ
ets
120
08-2
010
aver
age
annu
al n
ew
conn
ectio
ns w
as ro
ughl
y 15
,500
ag
ains
t a re
quire
men
t of 1
5,80
0 to
m
eet t
arge
t; so
ove
rall
outp
uts
are
in
line
with
2015
targ
ets
(1) A
nnua
l Urb
an W
ater
Sec
tor
Repo
rt(2
) WAS
RO re
ports
200
8-20
09-
2010
Outp
utQu
ality
of w
ater
Are
ther
e dr
inki
ng w
ater
qua
lity
stan
dard
s fo
r urb
an
wat
er th
at a
re re
gula
rly m
onito
red
and
the
resu
lts
publ
ishe
d?
Stan
dard
s ex
ist,
ther
e is
a
surv
eilla
nce
prog
ram
, and
re
sults
are
pu
blis
hed
Stan
dard
s ex
ist
and
ther
e is
a
surv
eilla
nce
prog
ram
but
th
ere
is n
o pu
blic
atio
n of
re
sults
No s
tand
ards
, or
sta
ndar
ds
exis
t but
are
not
m
onito
red
0.5
Sam
plin
g is
irre
gula
r and
not
all
NPSE
s pr
ovid
e m
onito
ring
data
to
MOH
.
(1) W
ater
Reg
ulat
ion
No.1
371
MoH
200
5
(2
) Rec
ord
of w
ater
qua
lity
sam
plin
g or
MoH
repo
rt of
wat
er q
ualit
y si
tuat
ion
(3
) Wat
er Q
ualit
y St
anda
rds
as d
iscu
ssed
in w
orks
hop
Outp
utRe
porti
ngIs
the
num
ber o
f add
ition
al h
ouse
hold
con
nect
ions
m
ade
and
stan
d po
sts
cons
truct
ed re
porte
d on
in a
co
nsol
idat
ed fo
rmat
for t
he n
atio
n ea
ch y
ear?
Yes
with
full
listin
g of
co
nnec
tions
Yes
but w
ithou
t a
full
listin
g of
co
nnec
tions
No1
Repo
rting
don
e by
WAS
RO; h
owev
er
conn
ectio
ns d
one
thou
gh p
rivat
e se
ctor
/ PP
P sc
hem
es n
ot in
clud
ed.
Ann
ual U
rban
Wat
er S
ecto
r Re
port
(WAS
RO)
SUST
AINI
NG
Mai
nten
ance
Func
tiona
lity
Wha
t is
the
wei
ghte
d av
erag
e pe
rcen
tage
of n
on-
reve
nue
wat
er a
cros
s ur
ban
utilit
ies
(nat
iona
l or 3
la
rges
t util
ities
) (la
st 3
yea
rs a
vera
ge)?
Less
than
20%
20%
to 4
0%M
ore
than
40%
0.5
Late
st W
ASRO
repo
rt: 3
2% in
Vi
entia
ne is
32%
; 35%
nat
iona
lly
(ear
lier 2
8%)
Annu
al U
rban
Wat
er S
ecto
r Pe
rform
ance
Rep
ort (
2010
)
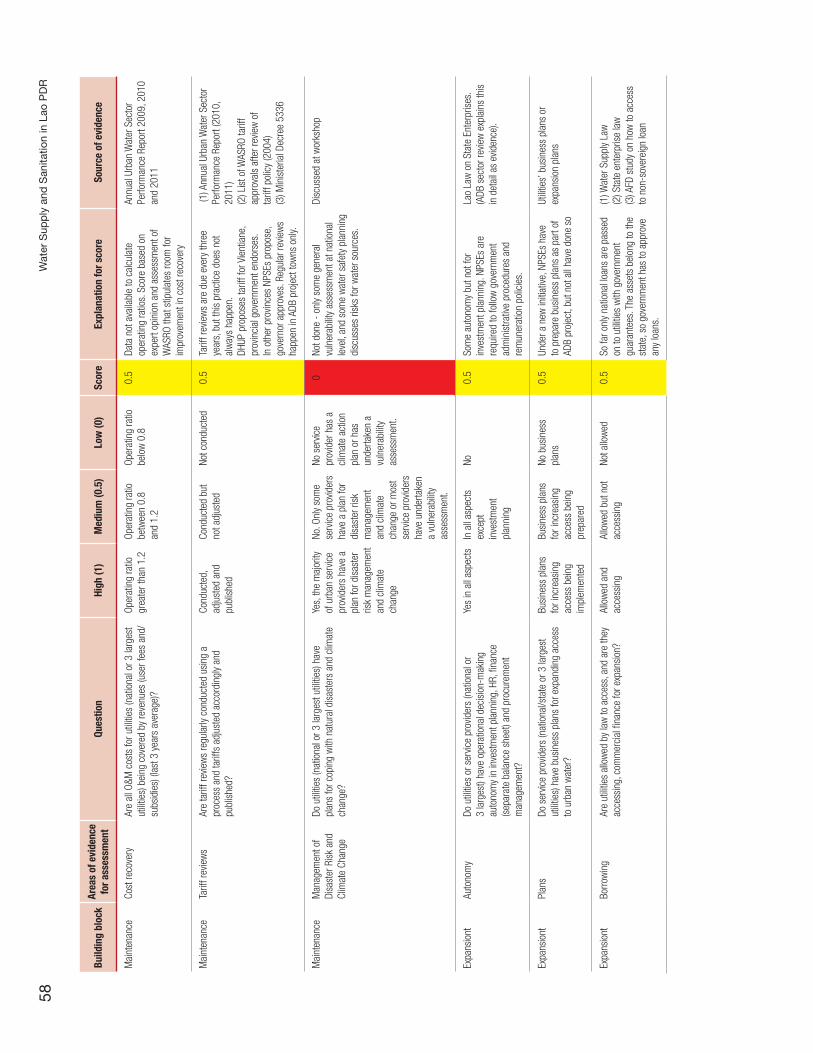
Wat
er S
upp
ly a
nd S
anita
tion
in L
ao P
DR
58
Build
ing
bloc
kAr
eas
of e
vide
nce
for a
sses
smen
tQu
estio
nHi
gh (1
)M
ediu
m (0
.5)
Low
(0)
Scor
eEx
plan
atio
n fo
r sco
reSo
urce
of e
vide
nce
Mai
nten
ance
Cost
reco
very
Are
all O
&M c
osts
for u
tiliti
es (n
atio
nal o
r 3 la
rges
t ut
ilitie
s) b
eing
cov
ered
by
reve
nues
(use
r fee
s an
d/su
bsid
ies)
(las
t 3 y
ears
ave
rage
)?
Oper
atin
g ra
tio
grea
ter t
han
1.2
Oper
atin
g ra
tio
betw
een
0.8
and
1.2
Oper
atin
g ra
tio
belo
w 0
.80.
5Da
ta n
ot a
vaila
ble
to c
alcu
late
op
erat
ing
ratio
s. S
core
bas
ed o
n ex
pert
opin
ion
and
asse
ssm
ent o
f W
ASRO
that
stip
ulat
es ro
om fo
r im
prov
emen
t in
cost
reco
very
Annu
al U
rban
Wat
er S
ecto
r Pe
rform
ance
Rep
ort 2
009,
201
0 an
d 20
11
Mai
nten
ance
Tarif
f rev
iew
sAr
e ta
riff r
evie
ws
regu
larly
con
duct
ed u
sing
a
proc
ess
and
tarif
fs a
djus
ted
acco
rdin
gly
and
publ
ishe
d?
Cond
ucte
d,
adju
sted
and
pu
blis
hed
Cond
ucte
d bu
t no
t adj
uste
dNo
t con
duct
ed0.
5Ta
riff r
evie
ws
are
due
ever
y th
ree
year
s, b
ut th
is p
ract
ice
does
not
al
way
s ha
ppen
. DH
UP p
ropo
ses
tarif
f for
Vie
ntia
ne,
prov
inci
al g
over
nmen
t end
orse
s.
In o
ther
pro
vince
s NP
SEs
prop
ose,
go
vern
or a
ppro
ves.
Reg
ular
revie
ws
happ
en in
ADB
pro
ject
tow
ns o
nly.
(1) A
nnua
l Urb
an W
ater
Sec
tor
Perfo
rman
ce R
epor
t (20
10,
2011
)(2
) Lis
t of W
ASRO
tarif
f ap
prov
als
afte
r rev
iew
of
tarif
f pol
icy
(200
4)
(3) M
inis
teria
l Dec
ree
5336
Mai
nten
ance
Man
agem
ent o
f Di
sast
er R
isk
and
Clim
ate
Chan
ge
Do u
tiliti
es (n
atio
nal o
r 3 la
rges
t util
ities
) hav
e pl
ans
for c
opin
g w
ith n
atur
al d
isas
ters
and
clim
ate
chan
ge?
Yes,
the
maj
ority
of
urb
an s
ervic
e pr
ovid
ers
have
a
plan
for d
isas
ter
risk
man
agem
ent
and
clim
ate
chan
ge
No. O
nly
som
e se
rvic
e pr
ovid
ers
have
a p
lan
for
disa
ster
risk
m
anag
emen
t an
d cl
imat
e ch
ange
or m
ost
serv
ice
prov
ider
s ha
ve u
nder
take
n a
vuln
erab
ility
asse
ssm
ent.
No s
ervic
e pr
ovid
er h
as a
cl
imat
e ac
tion
plan
or h
as
unde
rtake
n a
vuln
erab
ility
asse
ssm
ent.
0No
t don
e -
only
som
e ge
nera
l vu
lner
abilit
y as
sess
men
t at n
atio
nal
leve
l, an
d so
me
wat
er s
afet
y pl
anni
ng
disc
usse
s ris
ks fo
r wat
er s
ourc
es.
Disc
usse
d at
wor
ksho
p
Expa
nsio
ntAu
tono
my
Do u
tiliti
es o
r ser
vice
prov
ider
s (n
atio
nal o
r 3
larg
est)
have
ope
ratio
nal d
ecis
ion-
mak
ing
auto
nom
y in
inve
stm
ent p
lann
ing,
HR,
fina
nce
(sep
arat
e ba
lanc
e sh
eet)
and
proc
urem
ent
man
agem
ent?
Yes
in a
ll as
pect
sIn
all
aspe
cts
exce
pt
inve
stm
ent
plan
ning
No0.
5So
me
auto
nom
y bu
t not
for
inve
stm
ent p
lann
ing.
NPS
Es a
re
requ
ired
to fo
llow
gov
ernm
ent
adm
inis
trativ
e pr
oced
ures
and
re
mun
erat
ion
polic
ies.
Lao
Law
on
Stat
e En
terp
rises
. (A
DB s
ecto
r rev
iew
exp
lain
s th
is
in d
etai
l as
evid
ence
).
Expa
nsio
ntPl
ans
Do s
ervic
e pr
ovid
ers
(nat
iona
l/sta
te o
r 3 la
rges
t ut
ilitie
s) h
ave
busi
ness
pla
ns fo
r exp
andi
ng a
cces
s to
urb
an w
ater
?
Busi
ness
pla
ns
for i
ncre
asin
g ac
cess
bei
ng
impl
emen
ted
Busi
ness
pla
ns
for i
ncre
asin
g ac
cess
bei
ng
prep
ared
No b
usin
ess
plan
s0.
5Un
der a
new
initi
ative
, NPS
Es h
ave
to p
repa
re b
usin
ess
plan
s as
par
t of
ADB
proj
ect,
but n
ot a
ll ha
ve d
one
so
Utilit
ies’
bus
ines
s pl
ans
or
expa
nsio
n pl
ans
Expa
nsio
ntBo
rrow
ing
Are
utilit
ies
allo
wed
by
law
to a
cces
s, a
nd a
re th
ey
acce
ssin
g, c
omm
erci
al fi
nanc
e fo
r exp
ansi
on?
Allo
wed
and
ac
cess
ing
Allo
wed
but
not
ac
cess
ing
Not a
llow
ed0.
5So
far o
nly
natio
nal l
oans
are
pas
sed
on to
util
ities
with
gov
ernm
ent
guar
ante
es. T
he a
sset
s be
long
to th
e st
ate,
so
gove
rnm
ent h
as to
app
rove
an
y lo
ans.
(1) W
ater
Sup
ply
Law
(2
) Sta
te e
nter
pris
e la
w
(3
) AFD
stu
dy o
n ho
w to
acc
ess
to n
on-s
over
eign
loan
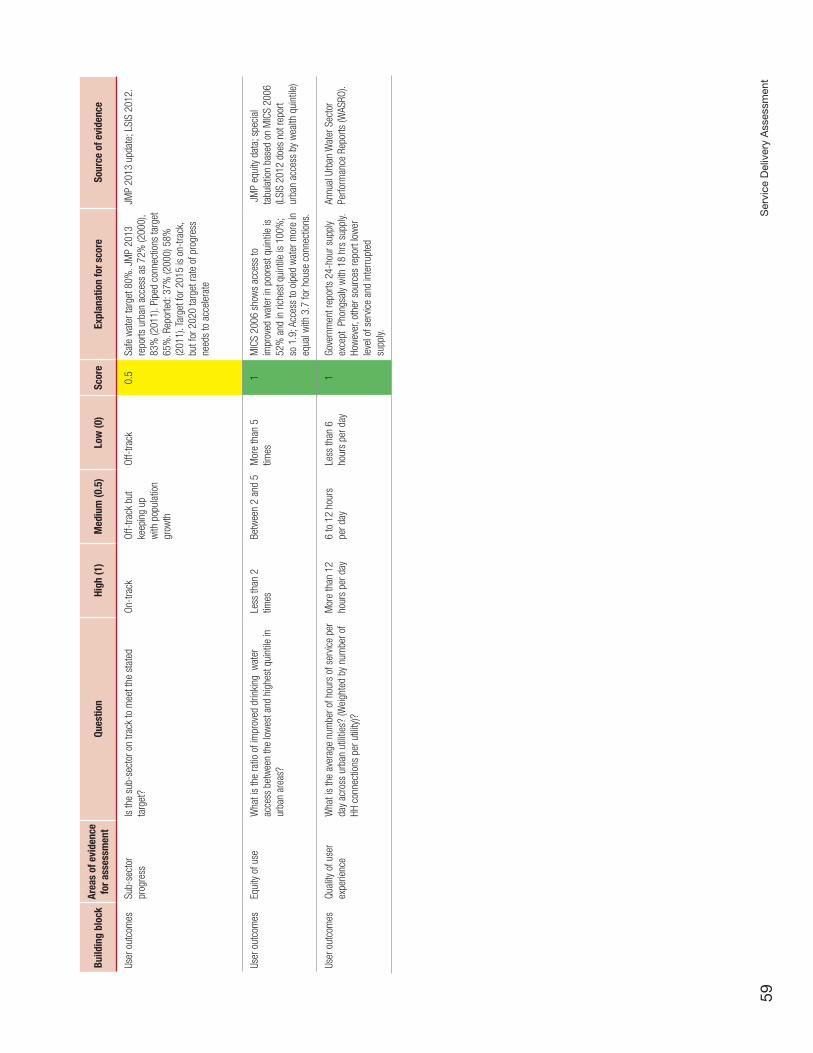
Ser
vice
Del
iver
y A
sses
smen
t59
Build
ing
bloc
kAr
eas
of e
vide
nce
for a
sses
smen
tQu
estio
nHi
gh (1
)M
ediu
m (0
.5)
Low
(0)
Scor
eEx
plan
atio
n fo
r sco
reSo
urce
of e
vide
nce
User
out
com
esSu
b-se
ctor
pr
ogre
ssIs
the
sub-
sect
or o
n tra
ck to
mee
t the
sta
ted
targ
et?
On-t
rack
Off-
track
but
ke
epin
g up
w
ith p
opul
atio
n gr
owth
Off-
track
0.5
Safe
wat
er ta
rget
80%
. JM
P 20
13
repo
rts u
rban
acc
ess
as 7
2% (2
000)
, 83
% (2
011)
. Pip
ed c
onne
ctio
ns ta
rget
65
%. R
epor
ted:
37%
(200
0) 5
8%
(201
1). T
arge
t for
201
5 is
on-
track
, bu
t for
202
0 ta
rget
rate
of p
rogr
ess
need
s to
acc
eler
ate
JMP
2013
upd
ate;
LSI
S 20
12.
User
out
com
esEq
uity
of u
seW
hat i
s th
e ra
tio o
f im
prov
ed d
rinki
ng w
ater
ac
cess
bet
wee
n th
e lo
wes
t and
hig
hest
qui
ntile
in
urba
n ar
eas?
Less
than
2
times
Betw
een
2 an
d 5
Mor
e th
an 5
tim
es1
MIC
S 20
06 s
how
s ac
cess
to
impr
oved
wat
er in
poo
rest
qui
ntile
is
52%
and
in ri
ches
t qui
ntile
is 1
00%
; so
1.9
; Acc
ess
to o
iped
wat
er m
ore
in
equa
l with
3.7
for h
ouse
con
nect
ions
.
JM
P eq
uity
dat
a; s
peci
al
tabu
latio
n ba
sed
on M
ICS
2006
(LSI
S 20
12 d
oes
not r
epor
t ur
ban
acce
ss b
y w
ealth
qui
ntile
)
User
out
com
esQu
ality
of u
ser
expe
rienc
eW
hat i
s th
e av
erag
e nu
mbe
r of h
ours
of s
ervic
e pe
r da
y ac
ross
urb
an u
tiliti
es?
(Wei
ghte
d by
num
ber o
f HH
con
nect
ions
per
util
ity)?
Mor
e th
an 1
2 ho
urs
per d
ay6
to 1
2 ho
urs
per d
ayLe
ss th
an 6
ho
urs
per d
ay1
Gove
rnm
ent r
epor
ts 2
4-ho
ur s
uppl
y ex
cept
Pho
ngsa
ly w
ith 1
8 hr
s su
pply.
Ho
wev
er, o
ther
sou
rces
repo
rt lo
wer
le
vel o
f ser
vice
and
inte
rrupt
ed
supp
ly.
Annu
al U
rban
Wat
er S
ecto
r Pe
rform
ance
Rep
orts
(WAS
RO).

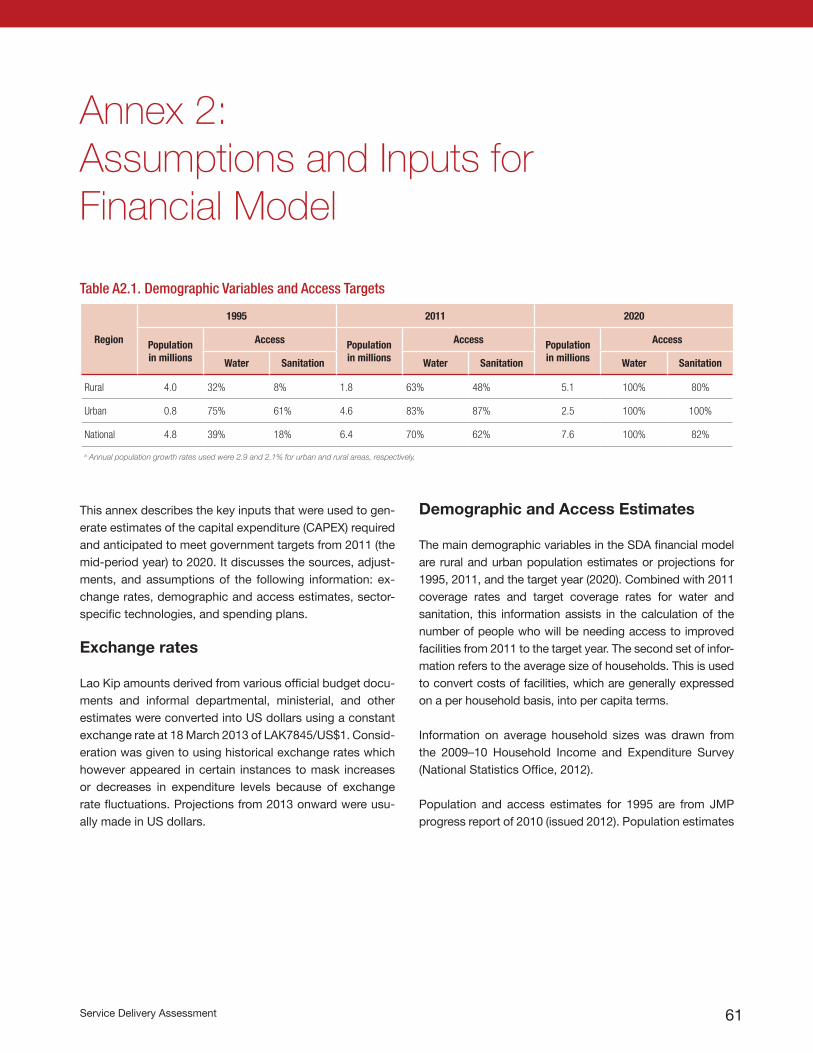
Service Delivery Assessment 61
Annex 2: Assumptions and Inputs for Financial Model
This annex describes the key inputs that were used to gen-erate estimates of the capital expenditure (CAPEX) required and anticipated to meet government targets from 2011 (the mid-period year) to 2020. It discusses the sources, adjust-ments, and assumptions of the following information: ex-change rates, demographic and access estimates, sector-specific technologies, and spending plans.
Exchange rates
Lao Kip amounts derived from various official budget docu-ments and informal departmental, ministerial, and other estimates were converted into US dollars using a constant exchange rate at 18 March 2013 of LAK7845/US$1. Consid-eration was given to using historical exchange rates which however appeared in certain instances to mask increases or decreases in expenditure levels because of exchange rate fluctuations. Projections from 2013 onward were usu-ally made in US dollars.
Demographic and Access Estimates
The main demographic variables in the SDA financial model are rural and urban population estimates or projections for 1995, 2011, and the target year (2020). Combined with 2011 coverage rates and target coverage rates for water and sanitation, this information assists in the calculation of the number of people who will be needing access to improved facilities from 2011 to the target year. The second set of infor-mation refers to the average size of households. This is used to convert costs of facilities, which are generally expressed on a per household basis, into per capita terms.
Information on average household sizes was drawn from the 2009–10 Household Income and Expenditure Survey (National Statistics Office, 2012).
Population and access estimates for 1995 are from JMP progress report of 2010 (issued 2012). Population estimates
Table A2.1. Demographic Variables and Access Targets
Region
1995 2011 2020
Population in millions
Access Population in millions
Access Population in millions
Access
Water Sanitation Water Sanitation Water Sanitation
Rural 4.0 32% 8% 1.8 63% 48% 5.1 100% 80%
Urban 0.8 75% 61% 4.6 83% 87% 2.5 100% 100%
National 4.8 39% 18% 6.4 70% 62% 7.6 100% 82%
a Annual population growth rates used were 2.9 and 2.1% for urban and rural areas, respectively.
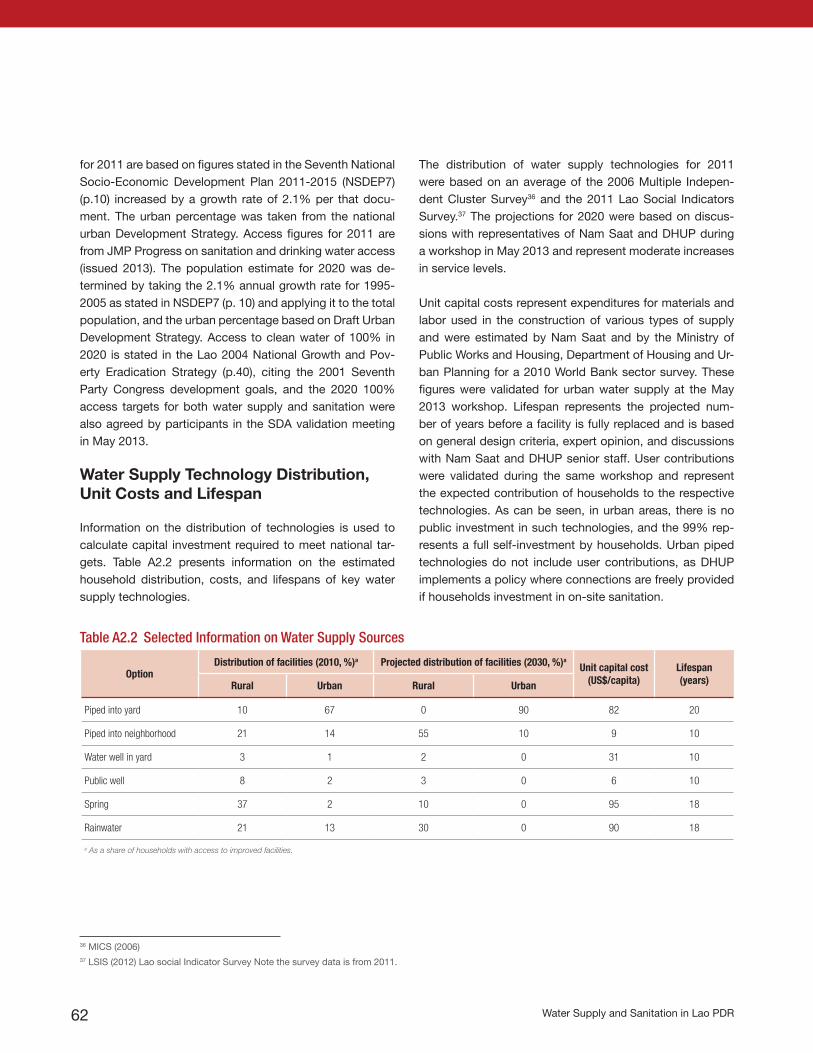
Water Supply and Sanitation in Lao PDR62
Table A2.2 Selected Information on Water Supply Sources
OptionDistribution of facilities (2010, %)a Projected distribution of facilities (2030, %)a
Unit capital cost(US$/capita)
Lifespan(years)Rural Urban Rural Urban
Piped into yard 10 67 0 90 82 20
Piped into neighborhood 21 14 55 10 9 10
Water well in yard 3 1 2 0 31 10
Public well 8 2 3 0 6 10
Spring 37 2 10 0 95 18
Rainwater 21 13 30 0 90 18
a As a share of households with access to improved facilities.
for 2011 are based on figures stated in the Seventh National Socio-Economic Development Plan 2011-2015 (NSDEP7) (p.10) increased by a growth rate of 2.1% per that docu-ment. The urban percentage was taken from the national urban Development Strategy. Access figures for 2011 are from JMP Progress on sanitation and drinking water access (issued 2013). The population estimate for 2020 was de-termined by taking the 2.1% annual growth rate for 1995-2005 as stated in NSDEP7 (p. 10) and applying it to the total population, and the urban percentage based on Draft Urban Development Strategy. Access to clean water of 100% in 2020 is stated in the Lao 2004 National Growth and Pov-erty Eradication Strategy (p.40), citing the 2001 Seventh Party Congress development goals, and the 2020 100% access targets for both water supply and sanitation were also agreed by participants in the SDA validation meeting in May 2013.
Water Supply Technology Distribution, Unit Costs and Lifespan
Information on the distribution of technologies is used to calculate capital investment required to meet national tar-gets. Table A2.2 presents information on the estimated household distribution, costs, and lifespans of key water supply technologies.
The distribution of water supply technologies for 2011 were based on an average of the 2006 Multiple Indepen-dent Cluster Survey36 and the 2011 Lao Social Indicators Survey.37 The projections for 2020 were based on discus-sions with representatives of Nam Saat and DHUP during a workshop in May 2013 and represent moderate increases in service levels.
Unit capital costs represent expenditures for materials and labor used in the construction of various types of supply and were estimated by Nam Saat and by the Ministry of Public Works and Housing, Department of Housing and Ur-ban Planning for a 2010 World Bank sector survey. These figures were validated for urban water supply at the May 2013 workshop. Lifespan represents the projected num-ber of years before a facility is fully replaced and is based on general design criteria, expert opinion, and discussions with Nam Saat and DHUP senior staff. User contributions were validated during the same workshop and represent the expected contribution of households to the respective technologies. As can be seen, in urban areas, there is no public investment in such technologies, and the 99% rep-resents a full self-investment by households. Urban piped technologies do not include user contributions, as DHUP implements a policy where connections are freely provided if households investment in on-site sanitation.
36 MICS (2006)37 LSIS (2012) Lao social Indicator Survey Note the survey data is from 2011.
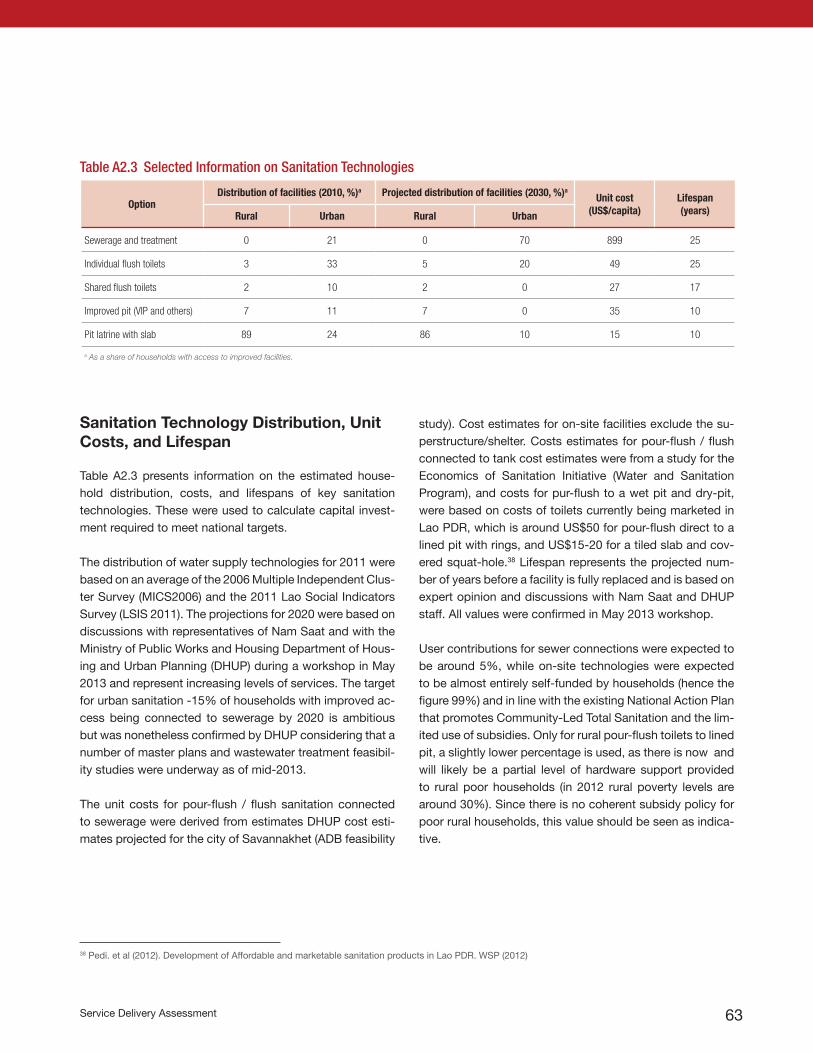
Service Delivery Assessment 63
Sanitation Technology Distribution, Unit Costs, and Lifespan
Table A2.3 presents information on the estimated house-hold distribution, costs, and lifespans of key sanitation technologies. These were used to calculate capital invest-ment required to meet national targets.
The distribution of water supply technologies for 2011 were based on an average of the 2006 Multiple Independent Clus-ter Survey (MICS2006) and the 2011 Lao Social Indicators Survey (LSIS 2011). The projections for 2020 were based on discussions with representatives of Nam Saat and with the Ministry of Public Works and Housing Department of Hous-ing and Urban Planning (DHUP) during a workshop in May 2013 and represent increasing levels of services. The target for urban sanitation -15% of households with improved ac-cess being connected to sewerage by 2020 is ambitious but was nonetheless confirmed by DHUP considering that a number of master plans and wastewater treatment feasibil-ity studies were underway as of mid-2013.
The unit costs for pour-flush / flush sanitation connected to sewerage were derived from estimates DHUP cost esti-mates projected for the city of Savannakhet (ADB feasibility
study). Cost estimates for on-site facilities exclude the su-perstructure/shelter. Costs estimates for pour-flush / flush connected to tank cost estimates were from a study for the Economics of Sanitation Initiative (Water and Sanitation Program), and costs for pur-flush to a wet pit and dry-pit, were based on costs of toilets currently being marketed in Lao PDR, which is around US$50 for pour-flush direct to a lined pit with rings, and US$15-20 for a tiled slab and cov-ered squat-hole.38 Lifespan represents the projected num-ber of years before a facility is fully replaced and is based on expert opinion and discussions with Nam Saat and DHUP staff. All values were confirmed in May 2013 workshop.
User contributions for sewer connections were expected to be around 5%, while on-site technologies were expected to be almost entirely self-funded by households (hence the figure 99%) and in line with the existing National Action Plan that promotes Community-Led Total Sanitation and the lim-ited use of subsidies. Only for rural pour-flush toilets to lined pit, a slightly lower percentage is used, as there is now and will likely be a partial level of hardware support provided to rural poor households (in 2012 rural poverty levels are around 30%). Since there is no coherent subsidy policy for poor rural households, this value should be seen as indica-tive.
Table A2.3 Selected Information on Sanitation Technologies
OptionDistribution of facilities (2010, %)a Projected distribution of facilities (2030, %)a
Unit cost(US$/capita)
Lifespan(years)Rural Urban Rural Urban
Sewerage and treatment 0 21 0 70 899 25
Individual flush toilets 3 33 5 20 49 25
Shared flush toilets 2 10 2 0 27 17
Improved pit (VIP and others) 7 11 7 0 35 10
Pit latrine with slab 89 24 86 10 15 10
a As a share of households with access to improved facilities.
38 Pedi. et al (2012). Development of Affordable and marketable sanitation products in Lao PDR. WSP (2012)
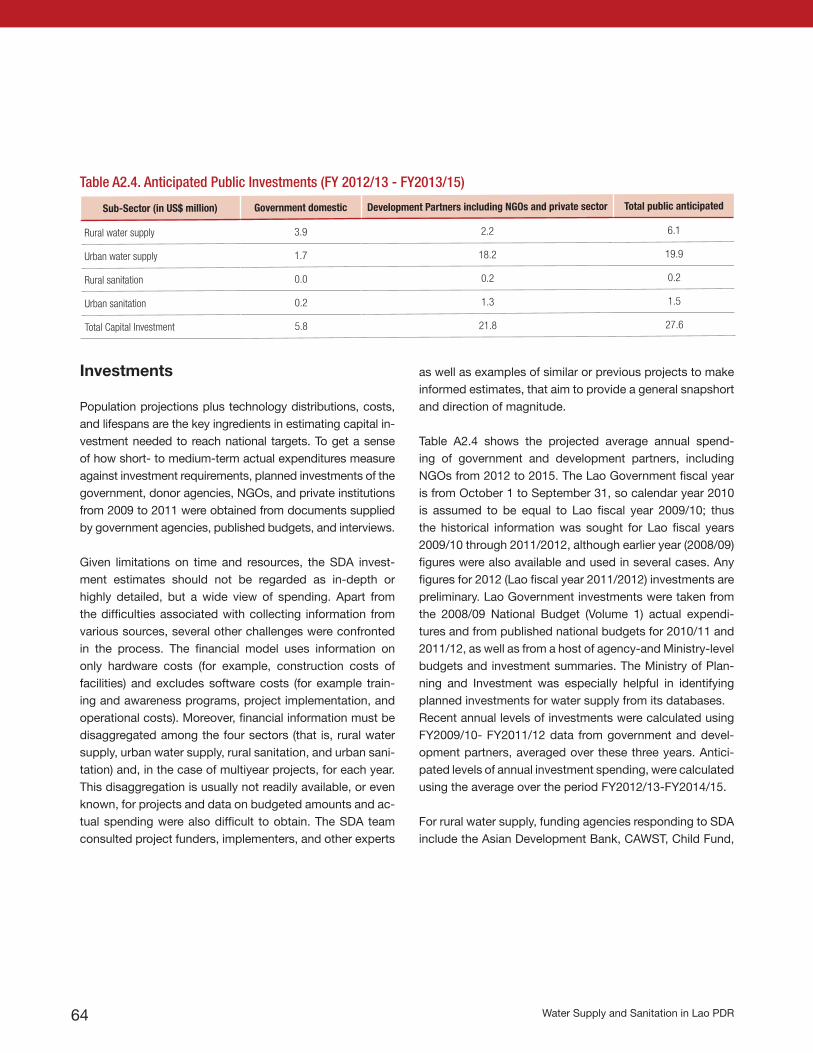
Water Supply and Sanitation in Lao PDR64
Table A2.4. Anticipated Public Investments (FY 2012/13 - FY2013/15)
Sub-Sector (in US$ million) Government domestic Development Partners including NGOs and private sector Total public anticipated
Rural water supply 3.9 2.2 6.1
Urban water supply 1.7 18.2 19.9
Rural sanitation 0.0 0.2 0.2
Urban sanitation 0.2 1.3 1.5
Total Capital Investment 5.8 21.8 27.6
as well as examples of similar or previous projects to make informed estimates, that aim to provide a general snapshort and direction of magnitude.
Table A2.4 shows the projected average annual spend-ing of government and development partners, including NGOs from 2012 to 2015. The Lao Government fiscal year is from October 1 to September 31, so calendar year 2010 is assumed to be equal to Lao fiscal year 2009/10; thus the historical information was sought for Lao fiscal years 2009/10 through 2011/2012, although earlier year (2008/09) figures were also available and used in several cases. Any figures for 2012 (Lao fiscal year 2011/2012) investments are preliminary. Lao Government investments were taken from the 2008/09 National Budget (Volume 1) actual expendi-tures and from published national budgets for 2010/11 and 2011/12, as well as from a host of agency-and Ministry-level budgets and investment summaries. The Ministry of Plan-ning and Investment was especially helpful in identifying planned investments for water supply from its databases.Recent annual levels of investments were calculated using FY2009/10- FY2011/12 data from government and devel-opment partners, averaged over these three years. Antici-pated levels of annual investment spending, were calculated using the average over the period FY2012/13-FY2014/15.
For rural water supply, funding agencies responding to SDA include the Asian Development Bank, CAWST, Child Fund,
Investments
Population projections plus technology distributions, costs, and lifespans are the key ingredients in estimating capital in-vestment needed to reach national targets. To get a sense of how short- to medium-term actual expenditures measure against investment requirements, planned investments of the government, donor agencies, NGOs, and private institutions from 2009 to 2011 were obtained from documents supplied by government agencies, published budgets, and interviews.
Given limitations on time and resources, the SDA invest-ment estimates should not be regarded as in-depth or highly detailed, but a wide view of spending. Apart from the difficulties associated with collecting information from various sources, several other challenges were confronted in the process. The financial model uses information on only hardware costs (for example, construction costs of facilities) and excludes software costs (for example train-ing and awareness programs, project implementation, and operational costs). Moreover, financial information must be disaggregated among the four sectors (that is, rural water supply, urban water supply, rural sanitation, and urban sani-tation) and, in the case of multiyear projects, for each year. This disaggregation is usually not readily available, or even known, for projects and data on budgeted amounts and ac-tual spending were also difficult to obtain. The SDA team consulted project funders, implementers, and other experts
Service Delivery Assessment 65
France, (AFD) Poverty Health Action, PLAN, SNV, UNICEF, WHO and through the Poverty Reduction Fund, the World Bank, SDC and development partners participating in the Multi-donor Trust Fund. Many of these are participating through software investment only.
For urban water supply, the largest development partner is China through its loan (forecast at over US$80 million) for the Vientiane Water Supply Project. Other major partners in-clude the Asian Development Bank, France (AFD), KOICA, and WHO. JICA is also planning an urban water environment project for Vientiane that is aimed at cleaner water in canals (not urban water supply) as well as support for design of wa-ter supply extension in Khammoane Province, which does not at this time appear to have a capital spending component
There is little evidence of capital spending for household rural sanitation and hygiene, except for some from Poverty Health Action, but several partners provide software sup-port or have been active in funding school latrines and hy-gine education (not counted in SDA financing). These part-ners include CAWST, Child Fund, Helvetas, JICA, PLAN, SNV, UNICEF, and WHO.
While some capital spending is forecast for urban sanita-tion, it is in total very small. ADB will fund networked sew-erage for Savannakhet, and may subsidize some onsite sanitation, but not after 2014. JICA has funded an urban sanitation and drainage master plan study for Vientiane, but does not forecast capital spending in the near future. No other development partners responding to SDA forecast spending on urban sanitation in the next several years.
The anticipated spending of households is computed by specifying the proportion of investments that the authori-ties believe households should contribute. This could be an expressed policy, supported by documentation. In the ab-sence of such a policy, however, the approach was to con-sult experts in the water and sanitation sector. It is through this consultation process that the user shares for urban and
rural water supply were obtained (see table A2.5). In the cases of rural and urban sanitation, the consultation pro-cess did not yield clear percentages and the approach used in the analysis is to assume a share that the household is expected to contribute for different technologies based on current sector directions and practices.
Future Estimates of Household Expendi-tures
The assumed contributions of the households for invest-ments in water supply and sanitation are given in tables A.2.2 and A.2.3 above. Weighted by technology distribu-tion, this assumes the 28% of the capital costs of rural wa-ter supply and 59% of the capital cost of urban water sup-ply is born by users, while 94% of the capital cost for rural sanitation and 62% of the capital cost for urban sanitation is born by users, including both new and replacement costs. Thus, the amounts of household expenditures expected in the future were not generated by applying past estimates of household expenditure based on evidence, which often is scarce, nor by assuming that households will certainly pay some percentage in the future.
Instead, in all cases, household investment is calculated based on a leverage ratio whose denominator is public in-vestment (external and domestic). For example, for a lever-age ratio of 2:1, for every unit of public capital (hardware) investment (dollar or kip), the household would invest two units. For onsite sanitation, this is difficult to conceptual-ize because in many countries the government is in fact contributing very little capital. Virtually all the cost of onsite sanitation are borne by the household. However, this does not mean that the households will certainly invest 100% of the requirements in the future; their expenditures need to be mobilized by corresponding ‘software’ expenditures. In many cases, such software expenditure is inadequate to elicit household investments and the projected ‘anticipated household investments’ might not fully materialize. More-over, the high deficits displayed for rural sanitation house-
Water Supply and Sanitation in Lao PDR66
hold expenditure can be conceptualized as a combination of mainly household (94%) and only little public hardware (6%) (see above weighted user shares for each sub-sector). These amounts would need be elicited in the future with ‘software’ expenditures such as CLTS programs.
Service Delivery Assessment 67
Asian Development Bank. 2012. Lao People’s Democratic Republic: Urban Development Sector Assessment, Strategy, and Road Map, Manila. Available from http://www.adb.org/sites/default/files/lao-pdr-urban-sector-assessment.pdf
Beatings, E. and D. O’Leary. 2010. Rapid Assessment of Household Sanitation Services, Vientiane, Lao PDR. Vien-tiane: Water and Sanitation Program (WSP)
COWI (2009) Urban Wastewater Strategy and Investment Plan, final draft for MPWT, ADB and NORAD.
CTI Engineering International Co., Ltd. and IDEA Consul-tants, Inc. (2011) The Study on Improvement of Water Envi-ronment in Vientiane City, JICA and Ministry of Public Works and Transport, Vientiane.
Department of Housing and Urban Planning (2013a) Revised Water Supply Sector Investment Plan, Ministry of Public Works and Transport, Vientiane.
Department of Housing and Urban Planning (2013b) Stra-tegic Framework for the Development of the Urban Water Supply and Sanitation Sector 2013-2030, Draft, Ministry of Housing and Public Transport, Vientiane.
Giltner, S., Dutton, P. and Kouangpalath, P. (2010) Lao PDR Sanitation and Hygiene Financing Study, WSP: Vientiane.
Government of Lao PDR (2004) National Growth and Poverty Eradication Strategy, Vientiane.
IMF (2011) Lao People’s Democratic Republic—Staff Report; Staff Supplement; Public Information Notice on the Execu-tive Board Discussion; and Statement by the Executive Direc-tor for Lao P.D.R., Country Report No. 11/257, August 2011.
References
IMF (2012) Lao People’s Democratic Republic, 2012 Article IV Consultation, IMF Country report No. 12/286, October 2012.
IMF (2013) Table 3. Lao PDR. General Government Opera-tions 2007/08-2011/12.
JMP [Joint Monitoring Program] (2012a) Estimates for the Use of Improved Drinking Water Sources. UNICEF and WHO. Available from wss.info.org.
JMP (2012b) Estimates for the Use of Improved Sanitation Facilities. UNICEF and WHO. Available from wss.info.org.
JMP (2013) Progress on Drinking Water and Sanitation: 2013 Update. UNICEF and WHO. Available from wss.info.org.
Lao Statistics Office , Poverty in Lao PDR 2008 http://www.nsc.gov.la/index.php?option=com_content&view=article&id=55&Itemid=80
Accessed October 2013.
Ministry of Finance (2009) Lao Budget 08/09, Official Gazette Special Issue. Vol I. Summary Vol II.
Ministry of Finance (2011) Lao Budget 09/10, Official Gazette Special Issue. Budget Revenue-Expenditure Implementation FY 2009-10 (Unofficial Translation) Vol I National. Summary Vol II.
Ministry of Health and Lao Statistics Bureau (2012a) Lao So-cial Indicator Survey 2011-12, http://www.childinfo.org/files/Lao_2011-12_MICS-DHS.pdf
Ministry of Health (2012b) National Action Plan for Rural Wa-ter Supply, Sanitation and Hygiene, Rural Water Supply and Environmental Health Sector.
Water Supply and Sanitation in Lao PDR68
Ministry of Planning and Investment (2011) The Seventh Five-year National Socio-Economic Development Plan (2011-2015),(Full Version).
Ministry of Public Works and Transport (201X) National Urban Development Strategy.
Radio Free Asia (2013) ‘Vientiane Water supply Plagued by Budget Shortages,’ July 23 2013, http://www.rfa.org/english/news/laos/water-07232013201528.html. Viewed 3 August 2013.
Robinson, A. (2010) Review of the National Strategy for the Rural Water Supply and Environmental Health Sector, Lao PDR, Strategy Update: Review, Process Design and Vision. Unpublished report to UNICEF.
Sanitation and Water for All (2012), http://www.sanitation-andwaterforall.org/files/LAO_PDR_-_Statement_to_2012_HLM_EN.pdf Accessed May 2013
World Bank (2010a) Lao People’s Democratic Republic, Wa-ter Supply and Sanitation Sector Review, Vientiane.
World Bank 2010b (June). The Lao People’s Democratic Republic Public Expenditure and Financial Accountability (PEFA) Public Financial Management Assessment. Report No. 61791-LA, Poverty Reduction and Economic Manage-ment Unit, East Asia and Pacific Region.
World Bank (undated) Poverty and Equity http://povertydata.worldbank.org/poverty/country/LAO. Accessed October 2013.
WSP (2009) Economic Impacts of Sanitation in Lao PDR, A five-country study conducted in Cambodia, Indonesia, Lao PDR, the Philippines, and Vietnam under the Economics of Sanitation Initiative (ESI), World Bank, Jakarta.
Additional Financial Information
Bolikamxay Province Water Supply Enterprise (Nam Papa). Income and expenses statements 2009-11. (NB used calen-dar year, not Lao fiscal year).
Department of Housing and Urban Planning (2013) Project Implementation Summary through January 2013 (spread-sheet). Ministry of Public Works and Transport.
Government of Lao PDR (20XX) Implementation FY 2009-10 (Unofficial Translation) Vol I. National by Sector and Ministry. Vol II: Provincial by Sector.
Ministry of Finance (2011) Lao Budget 11/12. State Expen-diture Plan FY 2011/12 By Sector. ‘Budget Revenue-Expen-diture.’ Official Gazette 24 June 2011.
Ministry of Health and Lao Statistics Bureau (200X), Multiple Indicator Cluster Survey 2006.
Ministry of Planning and Investment (20XX) Public Invest-ment Plans FY 2012/13 for social sectors (spreadsheet).
Ministry of Planning and Investment (20XX) Public Invest-ment Plans for Ministry of Public Works and Transport relat-ed to Water supply FY 2009/10 and 2010/11 (spreadsheets).
Nam Saat (Year) Budget 2009/10, Ministry of Health.
Nam Saat (Year) Budget 20010/11, Ministry of Health, Vien-tiane
Nam Saat (Year) Budget 2012/13 (preliminary), Ministry of Health, Vientiane
Government of Lao PDR (20XX) Vientiane Capital District List of Investment Projects FY 09/10 and FY 11/12. Spread-sheet.
Service Delivery Assessment 69
Agency? (20XX) Vientiane Province Investment Plan for the Department of Public Works and Transport, selected budget information from Province Budget FY 08/09 and 09/10 and Five year plan dated 10 Nov 2009. (spreadsheets).
Vientiane Province Water Supply Enterprise (Nam Papa) (20XX) Income and expenses statements 2009-11.
World Bank (undated) World Development Indicators http://data.worldbank.org/data-catalog/world-development-indi-cators

Water Supply and Sanitation in Lao PDR70


Water Supply and Sanitation in Lao PDRTurning Finance into Services for the Future
November 2014Service Delivery Assessment
Recommended