Welcome, Everyone!
Retention is Hard Work
And FUN!!
Pilot Study
5/00 - 9/01
Compelling Need
Continuous turnover
Vacancies unfilled
New competition for talent
Lack of competitive salaries
Limited resources for marketing/advertising
Our Approach
Identify economic impact & build resolve
Develop targeted sourcing strategy
Redesign recruitment and selection process
Create a compelling value proposition
Implement measurement system
Five Highest Rated Tactics (Mercer)
• Challenging Work
• Career Development Opportunities
• Leadership
• Work Environment
• Incentives
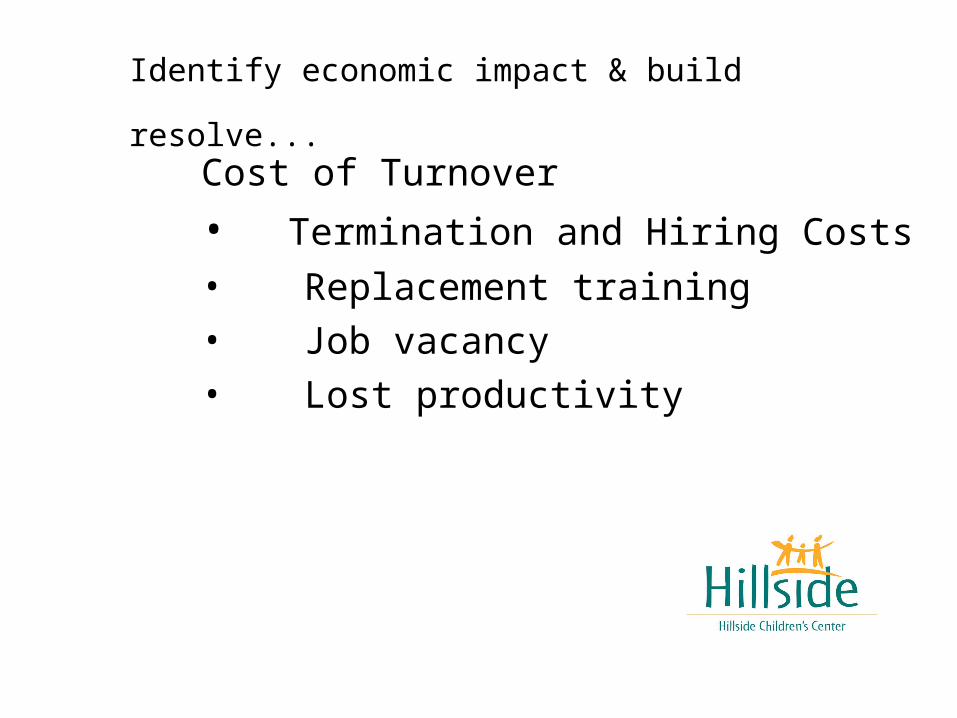
Identify economic impact & build resolve... Cost of Turnover
• Termination and Hiring Costs
• Replacement training• Job vacancy• Lost productivity
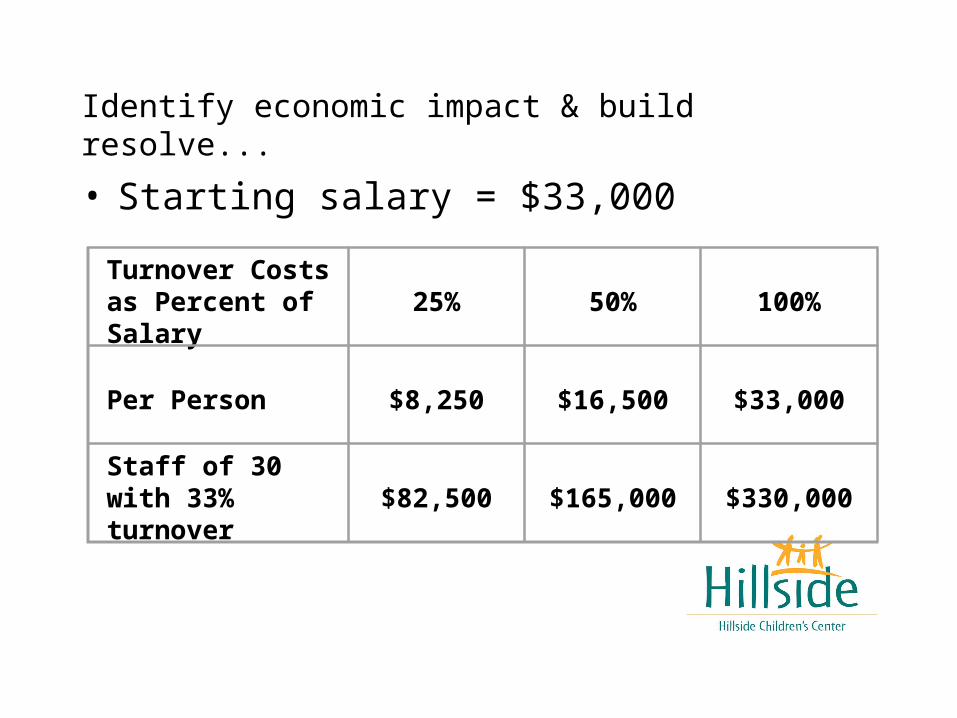
Identify economic impact & build resolve...
• Starting salary = $33,000
Turnover Costs as Percent of Salary
25%
50%
100%
Per Person
$8,250
$16,500
$33,000
Staff of 30 with 33% turnover
$82,500
$165,000
$330,000
Develop targeted sourcing strategy…
• Education Level
• Sourcing
• Personal Success Characteristics
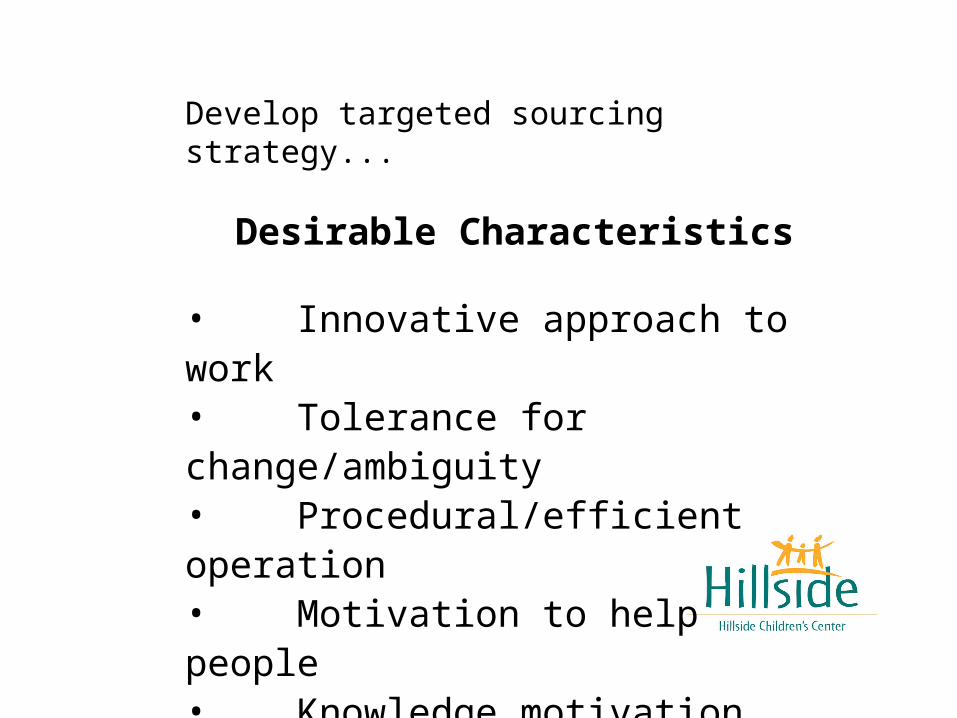
Develop targeted sourcing strategy...
Desirable Characteristics
• Innovative approach to work• Tolerance for change/ambiguity• Procedural/efficient operation• Motivation to help people• Knowledge motivation • Teamwork orientation
Redesign recruitment and selection process...
• Job Requisition
• On-line Recruiting
• Selection
• On Board
Redesign recruitment and selection process...
Deliverables:
Candidate-friendly website Decreased Cycle Time by 2 weeks Interviewing Tool Referral Incentives Relationship Training
Create a compelling value proposition…
• Brand (Organization Mission)
• Products (Challenging Jobs)
• Price (Rewards)
Create a compelling value proposition...
Deliverables:
• Value Proposition Statement
• Reward and Recognition Program
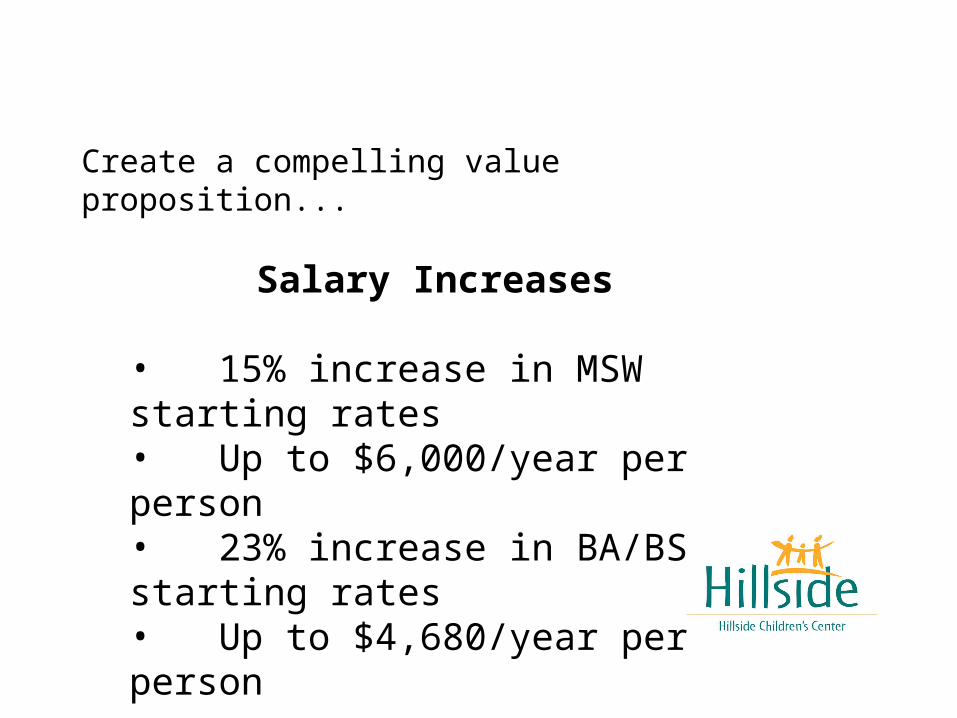
Create a compelling value proposition...
Salary Increases
• 15% increase in MSW starting rates • Up to $6,000/year per person• 23% increase in BA/BS starting rates • Up to $4,680/year per person
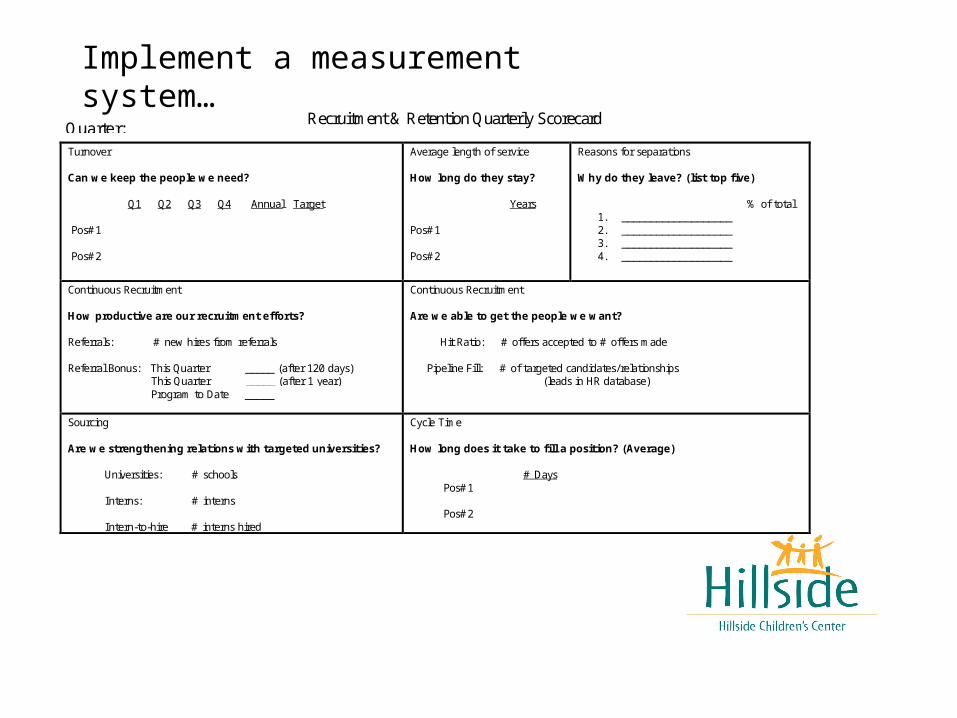
Recruitment & Retention Quarterly Scorecard
Turnover
Can we keep the people we need?
Q1 Q2 Q3 Q4 Annual Target
Pos#1
Pos#2
Average length of service
How long do they stay?
Years
Pos#1
Pos#2
Reasons for separations
Why do they leave? (list top five)
% of total1. ___________________2. ___________________3. ___________________4. ___________________
Continuous Recruitment
How productive are our recruitment efforts?
Referrals: # new hires from referrals
Referral Bonus: This Quarter _____ (after 120 days) This Quarter _____ (after 1 year) Program to Date _____
Continuous Recruitment
Are we able to get the people we want?
Hit Ratio: # offers accepted to # offers made
Pipeline Fill: # of targeted candidates/relationships (leads in HR database)
Sourcing
Are we strengthening relations with targeted universities?
Universities: # schools
Interns: # interns
Intern-to-hire # interns hired
Cycle Time
How long does it take to fill a position? (Average)
# Days Pos#1
Pos#2
Quarter: ____________
Implement a measurement system…
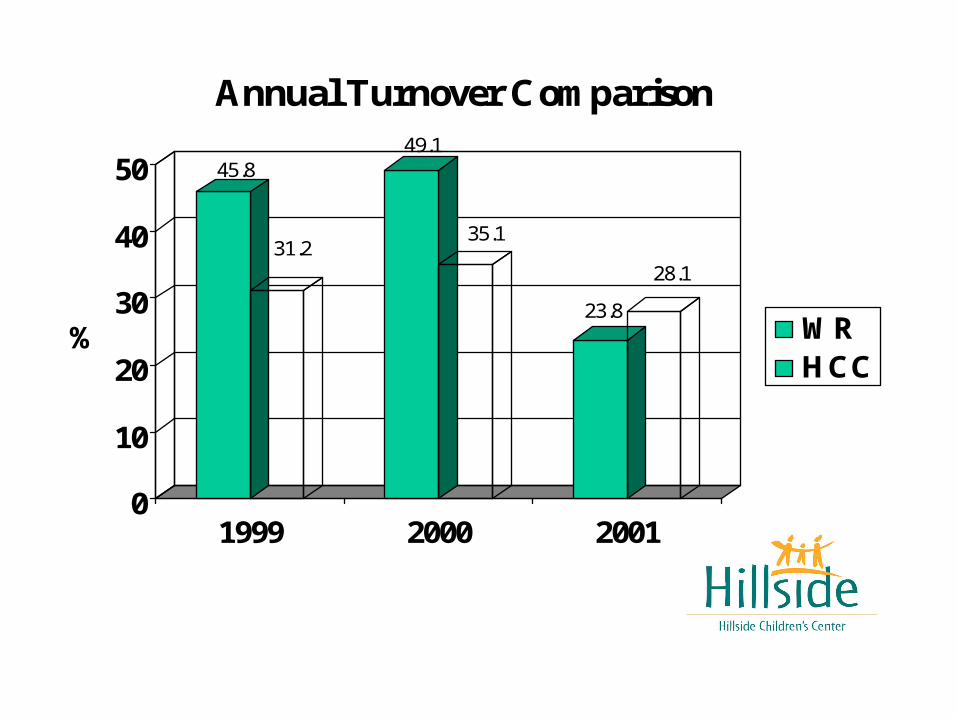
45.8
31.2
49.1
35.1
23.8
28.1
0
10
20
30
40
50
%
1999 2000 2001
Annual Turnover Comparison
WRHCC
Results
Dramatic reduction in turnover Quarterly visibility on results/trends
Able to attract more desirable candidates
Increased affiliation to agency
Improved retention
Better accountability and supervision
Overall Perspective on Recruitment
• Know exactly the kind of talent you need
• Be able to answer the question,
“Why should a really good person want to work here?”
Overall Perspective on Recruitment
• Be data driven
Know the type of individual most suited to positions
Understand where to find your best employees
Overall Perspective on Recruitment
• Develop creative solutions
• Be selective
• Provide competitive salaries
Recommended