Withholding Taxes and Foreign Portfolio Investment
Martin Jacob
WHU – Otto Beisheim School of Management
Maximilian Todtenhaupt
Norwegian School of Economics and LMU Munich
This draft: March 2020
Abstract
We examine the role of withholding taxes on foreign portfolio
investment (FPI) using data on U.S. mutual fund holdings and on
bilateral FPI. Exploiting variation in withholding tax rates for 38
investor countries and 115 issuer countries over 2008–2015, we find
that, conversely to the intended design of the international tax system,
withholding taxes adversely affect FPI. We show that this is due to
compliance frictions in claiming foreign tax credits. We further provide
evidence that frictions in claiming foreign tax credits are reflected in
lower stock returns in the setting of American Depositary Receipts.
Keywords: Foreign portfolio investment, withholding taxes, shareholder taxation, home bias
JEL codes: D25; G11; G25; H20; H24
We gratefully acknowledge helpful comments from Harald Amberger, Dan Amiram, Tobias Bornemann, Alex
Edwards, Jesse van der Geest, Kevin Markle, Maximilian Müller, Terry Shevlin, Siew Hong Teoh, Ryan Wilson,
Chenqi Zhu, and seminar participants at the University of California, Irvine, WHU – Otto Beisheim School of
Management, and the University of Tuebingen.
1
1 Introduction
With globalization, the removal of trade barriers, and global economic integration, capital markets
are also becoming integrated across borders. In addition to firms directly investing via subsidiaries
abroad—foreign direct investment (FDI)—individual and institutional investors are increasingly
investing in shares of foreign companies. Globally, such foreign portfolio investment (FPI)
witnessed enormous growth, from USD 5 trillion in 2001 to USD 22 trillion in 2015 (12.3% of the
global financial wealth, or 32% of the global market capitalization).1 FPI is an important source of
financing for firms seeking capital to invest and, thus, for economic growth. According to
international portfolio theory (e.g., Adler and Dumas 1983), costs such as withholding taxes on
foreign dividends can theoretically reduce foreign investment (e.g., Cooper and Kaplanis 1986,
1994). On paper, the cross-border taxation of dividends via domestic dividend taxes and foreign
withholding taxes is therefore designed in a capital export–neutral way, which means that the
location of FPI is independent of taxation: Double tax agreements (DTAs) ensure that the
withholding tax rate in the foreign country (where the firm is located) is below the dividend tax
rate in the home country (where the investor is located).2 Since foreign withholding tax payments
are usually fully credited against the domestic dividend tax, they would be rendered irrelevant.
Therefore, cross-border equity investments and individual portfolio decisions should not be
affected by withholding taxes.
However, this irrelevance of withholding taxes for FPI is based on the assumption that
investors claim credits for the foreign withholding tax. In this paper, we challenge this view and
1 Source: Coordinated Portfolio Investment Survey (CPIS), International Monetary Fund (IMF). According to data
from Credit Suisse (Global Wealth Databook 2019), global financial wealth was USD 175.4 trillion in 2015. The
World Federation of Exchanges reports a global market capitalization of USD 67 trillion in 2015. 2 The very few cases with a withholding tax above the final dividend tax 0 F comprise mainly investments from tax havens,
where dividends are usually not tax exempt (e.g., Cayman Islands or Bermuda).
2
examine the effect of compliance frictions in claiming foreign tax credits on FPI. A significant
part of the tax credit—the difference between the withholding tax rate in the respective DTA and
the standard withholding tax in the foreign country—must be actively claimed from foreign tax
authorities, increasing the costs associated with cross-border investments. Anecdotal evidence
suggests substantial compliance issues in this process due to extensive reporting requirements,
lengthy processes, and fees.3 To date, the academic literature on FPI lacks an understanding of this
issue and its consequences.4 We fill this void by showing that compliance hurdles in claiming
foreign withholding tax credits have adverse effects on FPI. In short, although withholding taxes
on dividends should not matter for FPI, since they are designed in a capital export–neutral way,
withholding taxes can affect FPI due to compliance frictions in claiming foreign tax credits.
We build a large data set of dividend withholding tax rates for bilateral combinations of 38
investor countries and 115 issuer countries over the period 2008–2015, taking into account DTAs.
We obtain information on dividend tax rates in the investor’s home country to calculate the country
pair–specific effective dividend tax rate on cross-border FPI, assuming the credit is granted. A
novel aspect of our paper is the computation of what we call the withholding tax overpayment that
the investor must claim from the tax authorities of the foreign country. The withholding tax
overpayment is the difference between the actual tax rate withheld in the foreign country, which
is usually the same for all foreign investors, and the tax rate that is applicable under an effective
DTA for that particular country pair. The important insight highlighted in our paper is that claiming
back the withholding tax overpayment often comes at a high compliance cost. To summarize,
3 For example, the media (e.g., Lodge 2010), policy makers (e.g., European Commission 2016), think tanks (e.g.,
Næss-Schmidt et al. 2012), and investors (e.g., European Federation of Investors 2011) have been alerted that
withholding taxes are burdensome because of compliance issues. 4 For instance, Chan et al. (2005), Ammer et al. (2012), and Amiram and Frank (2016) study the effects of withholding
or dividend taxes on FPI, but do not consider compliance frictions.
3
while the effective dividend tax rate captures tax payments assuming that shareholders are granted
the full tax credit, our withholding tax overpayment variable isolates the compliance hurdle in the
cross-border withholding tax credit system for individual investors.
Our empirical analysis is based on data from two sources. First, we obtain information on
bilateral equity FPI holdings from the IMF’s Coordinated Portfolio Investment Survey (CPIS) over
the period 2008–2015. Second, we obtain foreign portfolio holdings for individual investors and
securities from the Form 13F filings of U.S. institutional investors with the U.S. Securities and
Exchange Commission (SEC).
In our bilateral tests, we exploit the variation in effective dividend taxes and withholding tax
overpayments in a generalized difference-in-differences design, using FPI as the dependent
variable. The level of withholding tax overpayment can change when DTAs change or when issuer
countries reform their withholding tax systems. We observe 616 bilateral changes (383 increases
and 233 decreases) in withholding tax overpayments in our sample. Most of these are driven by
changes in unilateral withholding tax rates, which reduces the likelihood of the changes in our
main independent variable being a response to (the lack of) country pair–specific FPI. We then
compare the FPI for a given country pair experiencing a change in withholding tax overpayment
to another country pair from either the same issuer or the same holder country, but without a change
in withholding tax overpayments (first difference) around the change in withholding tax
overpayment (second difference). The identification approach absorbs any issuer country–year as
well as investor country–year–specific and any time-invariant country pair–specific characteristics
to account for nontax characteristics driving bilateral FPI.
Our main results indeed indicate an economically large effect of compliance hurdles on FPI.
For an average country pair, a one percentage point decrease in withholding tax overpayments in
4
terms of cross-border dividends paid increases the investor country FPI to the issuer country by
2.3%, or USD 186 million.5 Note that the overall FPI in a particular issuer country is the sum of
FPI from all investor countries, such that the overall effect of reducing withholding tax
overpayments for an individual country is likely to be substantial. Consistent with this effect being
driven by dividend payments, we find a stronger tax effect of withholding tax overpayments on
FPI when companies in the foreign country have higher dividend payout ratios. This effect is robust
to the inclusion or exclusion of additional country pair–specific control variables, as well as to the
inclusion of the effective dividend tax rate that accounts for tax incentives, assuming no
compliance issues. Overall, these initial results suggest that compliance issues in claiming
withholding tax credits can have first-order effects on FPI.
Next, we examine the heterogeneity of the effect of compliance issues on FPI. Our argument
is that the statutory withholding tax is not a good proxy for the tax credit actually claimed because
some countries make it inherently complicated to claim withholding tax credits across borders. If,
however, institutional features make these claims less costly, the negative impact of withholding
tax overpayments should be alleviated. For instance, relief-at-source mechanisms that allow for
double tax relief at source by the dividend-paying firm significantly reduce the compliance burden
for the foreign investor. In our empirical tests, we find that this is indeed the case. Further, we also
test whether investors’ frictions in claiming tax credits across borders are lower if a given country
pair shares institutional, economic, or cultural characteristics. We find that the effect of
withholding tax overpayments on FPI becomes weaker for geographically close country pairs (i.e.,
neighboring countries), for pairs of countries that exchange high numbers of visitors, for issuer
countries with higher audit quality, and issuer–investor country pairs within the Eurozone.
5 This is equivalent to a semi-elasticity of -2.3. To put this figure into perspective, the literature review by de Mooij
and Ederveen (2003) reports a semi-elasticity of -3.3 to -4 for FDI with respect to the (corporate) tax rate.
5
We subject our results to two important additional analyses. First, we run a placebo test using
FDI. FDI is distinct from FPI because FDI captures substantial foreign shareholdings (above 10%
ownership), mostly those of corporations. FPI captures smaller equity investments (maximum 10%
ownership), mostly those of individuals or their intermediaries. FDI should not be sensitive to the
compliance issues inherent in our withholding tax overpayment measure, since corporations are
subject to a different withholding tax system, typically with 0% withholding tax rates (Barrios et
al. 2012). Since FDI is affected by the same underlying economic and political conditions in a
given country pair, using FDI as a placebo test addresses concerns that political and economic
conditions are correlated with changes in compliance issues, as well as with changes in FPI. We
find that FDI is uncorrelated with withholding tax overpayments, suggesting that our main results
are not driven by unobserved changes in country pair–specific political or economic conditions.
Second, we provide evidence in favor of the parallel trends assumption. FPI does not respond to
future changes in compliance hurdles, indicating that treated and control country pairs follow a
common trend prior to a change in withholding tax overpayments.
We next examine the role of withholding tax overpayments in FPI at the investor level, using
data on foreign investments by U.S. institutional investors from their mandatory 13F filings with
the SEC. Using this granular investment data, we confirm the findings from the bilateral tests. First,
we find that withholding tax overpayments reduce equity investments in foreign countries. Second,
the existence of a relief-at-source mechanism mutes the adverse effect of withholding tax
overpayments on foreign investments. Third, we find that the adverse effect of withholding tax
overpayments on foreign investments is stronger for firms with higher dividend yields.
We also provide evidence for the mechanism through which frictions in claiming tax credits
can affect FPI. If higher compliance costs for a particular investor decrease that investor’s effective
6
withholding tax credit, the investor’s effective tax burden on the equity investment increases.
Thereby, after-tax returns decline, resulting in lower portfolio investment by that investor. We test
this channel by using the unique setting of American Depositary Receipts (ADRs) and examine
the effect of withholding tax overpayments on ADR returns. In these tests, we benchmark this
return against the return of the underlying stock in its respective home market before the dividend
day. We find that higher withholding tax overpayments reduce the ADR return relative to the
underlying stock. This effect increases with firm dividend yield, since higher dividend yields
amplify the role of withholding tax overpayments. These results are consistent with compliance
issues in claiming tax credits across borders decreasing after-tax returns.
By providing evidence that compliance frictions in the form of withholding tax
(over)payments have adverse effects on FPI, our paper contributes to two streams of the literature.
First, we directly contribute to the literature on the role of taxes on FPI (e.g., Chan et al. 2005;
Ammer et al. 2012). We show that administrative frictions in the process of claiming foreign tax
credits have a first-order impact on cross-border equity investment. Put differently, even though
investors are entitled to the tax credits (ensuring on paper that taxes do not matter for FPI), we
show that complexity in the administrative process of claiming these credits substantially reduces
FPI and inhibits the integration of global capital markets. Thereby, we also expand the literature
that analyzes the direct and indirect effects of dividend taxes on foreign portfolios (Desai and
Dharmapala 2011; Amiram and Frank 2016). Further, our findings are related to the large literature
on the home bias puzzle (e.g., French and Poterba 1991; Cooper and Kaplanis 1994; Lewis 1999)
and explanations of this puzzle, such as asymmetric information between local and foreign
investors (e.g., Coval and Moskowitz 1999). We show that the process of claiming foreign tax
credits creates significant costs for individual investors, reducing investments in foreign shares.

7
Second, we contribute to the literature on the role of taxes in the trading of cross-listed assets
(e.g., Callaghan and Barry 2003), as well as the prices of such assets (Blouin et al. 2009). We show
that not only nominal tax payments but also frictions in claiming tax credits affect asset prices.
Such frictions result in the lower asset prices of ADRs relative to their underlying issues traded in
the home market. Altogether, we show that compliance frictions in claiming tax credits have real
consequences on aggregate cross-border investment, as well as on cross-listed firms’ asset prices.
These effects translate into lower after-tax returns for affected firms. Since lower after-tax returns
imply the provision of less capital, this reduces firm investment. Higher tax revenues from
unclaimed credits could thus come at the cost of reduced investment and economic growth.6
2 Institutional Background and Hypotheses
In most countries, individual investors are taxed on their worldwide capital income,
independently of whether they hold foreign stocks directly, or through institutional investors, as is
the case for the large majority of investors (e.g., Ferreira and Matos 2008). In the latter case, the
foreign income of the institutional investor is either directly passed through as taxable capital
income to the individual shareholder (e.g., as a mutual fund dividend) or affects the individual
shareholder’s taxable returns on his or her investment fund holdings. Individual investors with
direct or indirect foreign equity holdings receiving foreign dividends or realizing capital gains
from selling shares in foreign firms are taxed at the rates applicable in their home country. While
capital gains are only taxed in the home country, foreign dividends can also be taxed abroad, that
is, in the residence country of the dividend-paying company, if that foreign country levies a
withholding tax on dividends. Without appropriate relief, this leads to double taxation, since
6 To document that the positive relation between FPI and firm-level investment also holds in our sample, we run firm-
level tests, as shown in the Online Appendix. We find that FPI is positively associated with firm-level investment and
that firms’ investments become less sensitive to internal cash flows or financial frictions as FPI increases.
8
foreign-source dividends are taxed more heavily than domestic-source dividends. To illustrate,
consider a foreign-source dividend payment 𝐷 to which the foreign country applies a withholding
tax rate of 𝜏𝑤 and the home country applies a dividend tax rate of 𝜏ℎ , such that the after-tax
dividend is (1 − 𝜏𝑤 − 𝜏ℎ)𝐷. If the same dividend were from a domestic source, the after-tax
dividend would be (1 − 𝜏ℎ)𝐷, implying a double taxation of 𝜏𝑤𝐷.
To mitigate the adverse effects of this double taxation, countries typically allow investors to
credit dividend withholding taxes paid abroad (𝜏𝑤𝐷) against domestic dividend tax payments
(𝜏ℎ𝐷). This approach prevents double taxation if the foreign withholding tax rate is below the
domestic dividend tax rate (𝜏ℎ > 𝜏𝑤). Many countries have therefore signed bilateral DTAs that
limit withholding tax rates (to 10% or 15% for most OECD model treaties). Effectively, this
combination of low withholding tax rates in the foreign country with foreign tax credits results in
capital export neutrality for most country pairs around the world. Hence, FPI is unaffected by
dividend taxes.
However, this argumentation is based on the assumption that the full available credit can be
claimed without additional costs. Due to administrative compliance hurdles, this is rarely the case
in practice because foreign countries initially deduct the standard withholding tax rate applicable
to domestic investors ( 𝜏𝑙𝑜𝑐𝑎𝑙𝑤 ) 7 while the investor’s home country credits only the foreign
withholding tax rate agreed upon in the DTA (𝜏𝐷𝑇𝐴𝑤 ) against domestic dividend taxes. We denote
the remaining credit, that is, the difference between the withholding tax for local investors and the
withholding tax in the DTA (𝜏𝑙𝑜𝑐𝑎𝑙𝑤 − 𝜏𝐷𝑇𝐴
𝑤 ), as the withholding tax overpayment.8 This part must
be claimed from the foreign country. Such reclamation involves lengthy procedures in which the
7 In most countries, this same dividend withholding tax rate is applied to domestic investors. 8 In Appendix B, we provide a brief practical example for a U.S. shareholder receiving dividends from a German
company.
9
individual or institutional investor must apply to each individual foreign tax authority for the
reclamation of the withholding tax overpayment on dividends received from equity held in the
corresponding country. Tax authorities often take several years to process these claims and can
require additional information (e.g., proof of residence or proof of stock ownership).
This process not only is burdensome for individual investors but also imposes significant
administrative costs on institutional investors, who must provide this information separately for
each of their individual shareholders.9 The authorities then have to transfer the reclaimed amounts
across borders to the investor’s account. Therefore, investors often do not retrieve their
withholding tax overpayments at all, or they do so with a substantial delay and/or at a significant
compliance cost in terms of either their own time or fees paid to agencies that process the
reclamation10 or to government institutions that provide the necessary forms. Indeed, anecdotal
evidence suggests that many investors do not claim withholding tax overpayments at all (see also
Zwick 2018 and the case of eligible firms not claiming tax credits).11
Frictions in claiming withholding tax overpayment can thus reduce the after-tax return from
investing in a particular country by imposing additional administrative costs on eligible investors
claiming tax credits. Since both institutional investors, whose after-tax returns determine their
inflows (Bergstresser and Poterba 2002), and individual investors with direct foreign holdings seek
9 These issues have been highlighted by institutional investors on several occasions (e.g., in consultations with the
European Commission; see the 2017 Code of Conduct on Withholding Tax published by the European Commission,
Ref. Ares(2017)5654449 – November 20, 2017). 10 Goal Group, a withholding tax reclamation service provider, estimates that, in 2017, about USD 3.5 billion in
dividend withholding tax overpayment were never claimed. Globally, this figure amounts to USD 18 billion annually
(http://www.goalgroup.com/media/66497/Athanasiou-08-27-2018-.pdf). 11 A U.S. shareholder who would like to claim withholding tax overpayments in Germany needs a Certification of
Residency (IRS Form 6166), which costs USD 85. Because of this, BASF, a large German chemical company, urges
U.S. shareholders to “weigh the cost of obtaining this form along with the processing fees associated submitting tax
relief claims through the Depositary Bank and its agents against the anticipated amount of recovery from German
source income to determine if it is cost-effective to file claims in the German market” (see
https://www.basf.com/global/de/investors/share-and-adrs/adrs-for-us-investors/taxation/faq-adr-taxation.html,
retrieved October 9, 2019).
10
to invest in countries with higher after-tax returns, FPI should be lower in countries with a high
level of withholding tax overpayment. This leads us to our first hypothesis, as follows.
H1: Conditional on the overall effective tax burden on dividends received from each
country, FPI is lower in countries with higher withholding tax overpayment.
There are three reasons we might not observe a negative effect of withholding tax
overpayments on FPI. First, withholding tax overpayments for individual countries might not be
sufficiently salient to investors (Chetty et al. 2009; Frydman and Wang 2019). Firms might not
inform all their foreign shareholders about their specific rights to claim withholding tax
overpayments, and country-specific withholding taxes applicable to local investors are often not
featured prominently in the firm’s investment prospectus.
Second, the cost of withholding tax overpayments could be too small to affect investment
behavior. For example, if private agencies are able to process shareholder reclamations efficiently
and there is competition among them, the service fees they can demand could be relatively small.
In this context, we also note that one could consider round tripping (e.g., via equity swaps) to
circumvent withholding tax overpayment. In practice, it appears too costly to do so via hubs such
as Singapore or the United Kingdom because of transaction costs and high fees (Dharmapala and
Desai 2011), which prevents individual and institutional investors from setting up treaty-shopping
systems. Thus, as pointed out by Desai and Dharmapala (2011) and Hanlon et al. (2015), the
circumvention of dividend withholding tax is difficult.
Third, if firms will not pay or reduce dividends in response to withholding tax overpayments,
these could be less of an issue. However, we consider it unlikely that firms will reduce dividends
in response to withholding taxes because (1) dividends tend to be sticky (Lintner 1956), (2) the
reduction or cutting of dividends is negatively perceived by capital markets (e.g., Bhattacharya
11
1979; Miller and Rock 1985), and (3) the majority of shareholders are domestic (e.g., Coval and
Moskowitz 1999). Hence, FPI is unlikely to be a first-order determinant of payout policies. Taken
together, whether withholding tax overpayments affect FPI is an empirical question.
Further, we argue that the effect of withholding tax overpayments on FPI depends on the
actual compliance hurdles that make the reclamation of overpayments difficult. In particular, the
availability of so-called relief-at-source mechanisms that allow the lower DTA withholding tax
rate to be applied immediately upon dividend distribution (thus avoiding the reclamation of
withholding tax overpayment) reduces the compliance cost of double taxation relief. Furthermore,
the cultural and economic proximity between issuer and investor countries could reduce the
compliance costs of claiming withholding tax overpayments across borders (e.g., Felbermayr and
Toubal 2010). For instance, cross-border communications can be easier if the investor’s home
country and the foreign country are geographically closer to each other or share a common cultural
understanding due to social and economic bilateral integration. In addition, collecting the
necessary information from issuing firms and transmitting it to the tax authorities could be easier
in countries with higher-quality reporting and auditing standards. Thus, we expect heterogeneity
in the responsiveness of FPI with respect to the compliance costs of investors claiming withholding
tax overpayments in the foreign country. This leads us to our second hypothesis, as follows.
H2: Withholding tax overpayments have a weaker effect on FPI if the compliance burden
of claiming withholding tax overpayments is smaller.
We also explore the mechanism underlying the investment effect of dividend withholding
taxes. Theory suggests that, because withholding tax overpayments and the reclamation process
impose additional costs on investors, these costs should increase the after-tax return for investing
in the issuing firm. That is, the withholding of tax overpayments should be reflected in security
12
prices. We use ADRs to test this mechanism. An ADR is a security that is traded on the U.S. stock
market and represents a particular foreign security, in the sense that, in principle, it can always be
exchanged for a predetermined amount of shares of the underlying foreign security. To obtain an
ADR, a U.S. investor (or broker–dealer) must deposit the underlying foreign security with a
depositary bank in the country of residence of the issuing foreign firm. The depository bank than
hands out the ADR. Owners of ADRs receive the same amount of dividends as the owners of the
underlying security, but are treated as foreign shareholders for dividend tax purposes. Hence, they
receive the dividend net of standard withholding taxes levied by the foreign country at a rate of
𝜏𝑙𝑜𝑐𝑎𝑙𝑤 . Investors have to claim a withholding tax overpayment at a rate of 𝜏𝑙𝑜𝑐𝑎𝑙
𝑤 − 𝜏𝐷𝑇𝐴𝑤 from the
foreign tax authority if a DTA between the United States and the foreign country yields a lower
withholding tax rate. Ceteris paribus, this reduces the value of the dividends to an U.S. investor
relative to the value of the dividends to an investor residing in the respective foreign country. If
this scenario is reflected in the returns, the larger the withholding tax overpayment, the lower the
return on the ADR should be relative to the return on the underlying foreign security in the days
before the ex-dividend day (i.e., the day when the security begins trading without the dividend).
In other words, the spread between the ADR return and the underlying security return decreases
with the withholding tax overpayment. We formulate this in the following hypothesis.12
H3: The return of an ADR relative to its underlying foreign security in the days before the
ex-dividend day is smaller if the withholding tax overpayment is larger.
12 One reason we might not find the hypothesized effect is potential arbitrage opportunities between the ADR and the
underlying security. For example, McDonald (2001) and Blouin et al. (2009) find evidence of costly cross-border tax
arbitrage that leads to partial price convergence. If sufficient arbitrage opportunities existed with respect to dividend
capitalization, withholding tax overpayments would be reflected in both the ADR price and the price of the underlying
security and the return spread between the two would not be affected.
13
3 Empirical Approach
3.1 Data on the Taxation of Cross-Border Dividends
We obtain information on the taxation of cross-border dividends from the International
Bureau of Fiscal Documentation (IBFD) Tax Research Platform. As of 2008, IBFD provides
detailed information on national and international tax law for a large number of countries around
the world. We proceed in three steps. First, we collect the domestic tax rates for dividends received
by a foreign listed company (𝜏ℎ,𝑡𝑑 ) for each investor country and each issuer country of our sample
over the sample period. In doing so, we account for investor country–specific treatments of foreign
dividends. For example, some countries apply an imputation credit for dividends from domestic
companies that is not available for foreign-source dividends. In case countries treat dividends
received from substantial and nonsubstantial holdings differently, we consider the rate applied to
dividends from nonsubstantial holdings, since FPI is defined as equity holdings with a voting
power of less than 10%. Second, for all issuer countries, we collect information on the local
withholding tax rate applied to dividends paid to nonresident individual shareholders (𝜏𝑙𝑜𝑐𝑎𝑙,𝑖𝑡𝑤 ).
Third, we collect information on DTAs and the withholding tax rates for cross-border dividends
paid to individuals as stipulated in these agreements (𝜏𝐷𝑇𝐴,𝑖ℎ𝑡𝑤 ).
The effective tax rate on dividends received by an investor residing in country ℎ from a
company residing in country 𝑖 in year 𝑡 is computed as 𝐸𝐹𝐹_𝑇𝐴𝑋𝑖ℎ𝑡 =
max(𝜏ℎ,𝑡𝑑 , min(𝜏𝑙𝑜𝑐𝑎𝑙,𝑖𝑡
𝑤 , 𝜏𝐷𝑇𝐴,𝑖ℎ𝑡𝑤 )). That is, from the investor’s perspective, dividends are taxed at
the higher rate of either the domestic rate on dividends, 𝜏ℎ,𝑡𝑑 , or the foreign withholding tax rate.
This is because all investor countries in our sample grant tax credits on foreign withholding taxes,
up to the tax payments in the home country (i.e., they do not refund excess foreign tax payments).
In 73.4% of the issuer investor–country–year combinations in our sample, a DTA establishes a
14
lower withholding tax rate, 𝜏𝐷𝑇𝐴,𝑖ℎ𝑡𝑤 , than the standard withholding tax rate in the issuer country.
Therefore, domestic dividend taxes rates are higher than foreign withholding tax rates in most
cases (89% of the sample), such that 𝜏ℎ𝑡𝑑 > min(𝜏𝑙𝑜𝑐𝑎𝑙,𝑖𝑡
𝑤 , 𝜏𝐷𝑇𝐴,𝑖ℎ𝑡𝑤 ). Hence, the effective dividend
tax rate 𝐸𝐹𝐹_𝑇𝐴𝑋𝑖ℎ𝑡 becomes 𝜏ℎ𝑡𝑑 for all potential investment locations, which ensures capital
export neutrality. The average effective dividend tax rate in our sample is 28.78%.
However, since the domestic tax authority only allows for credits up to the DTA rate,
𝜏𝐷𝑇𝐴,𝑖ℎ𝑡𝑤 , investors have to claim part of their eligible foreign tax credit from the foreign tax
authority in the form of withholding tax overpayment to arrive at this effective tax rate
(𝐸𝐹𝐹_𝑇𝐴𝑋𝑖ℎ𝑡 = 𝜏ℎ𝑡𝑑 ). We define this withholding tax overpayment as
𝑊𝐻𝑇_𝑂𝑣𝑒𝑟𝑝𝑎𝑦𝑚𝑒𝑛𝑡𝑖ℎ𝑡 = max(𝜏𝑙𝑜𝑐𝑎𝑙,𝑖ℎ𝑡𝑤 − 𝜏𝐷𝑇𝐴,𝑖ℎ𝑡
𝑤 , 0)
The average withholding tax overpayment in our sample is 5% of the dividend paid and
ranges up to 35% (applicable for FPIs from Denmark in Switzerland). Since the withholding tax
overpayment is defined for each possible country pair, there is large variation across country pairs
over time. In total, we observe 616 changes of 𝑊𝐻𝑇_𝑂𝑣𝑒𝑟𝑝𝑎𝑦𝑚𝑒𝑛𝑡, including 383 increases and
233 decreases during our sample period (see Figure 1). The changes arise from the signing or
termination of DTAs, as well as from unilateral adjustments in withholding taxes in the issuer
country 𝑖, with the vast majority stemming from changes in the local withholding tax.13 Therefore,
changes in withholding tax overpayments are less likely to be driven by FPI considerations. In our
empirical strategy, we exploit all changes in withholding tax overpayments.
13 Of the 616 changes in 𝑊𝐻𝑇_𝑂𝑣𝑒𝑟𝑝𝑎𝑦𝑚𝑒𝑛𝑡, 483 changes are due to a change in the local withholding taxes of the
issuer country, 36 changes are due to a change in the bilateral DTA, and 97 changes are the result of coinciding
changes in the local withholding taxes of the issuer country and the bilateral DTA. A change in the unilateral
withholding tax only triggers a change in 𝑊𝐻𝑇_𝑂𝑣𝑒𝑟𝑝𝑎𝑦𝑚𝑒𝑛𝑡 if the DTA withholding tax rate is below the unilateral
withholding tax.
15
3.2 Identification Strategy: Withholding Tax Overpayments and FPI
To analyze the effect of dividend withholding taxes on FPI, we merge our tax information
with two different data sources for FPI: aggregated bilateral foreign portfolio holdings for a large
set of developed economies, obtained from the CPIS, and the FPIs of individual U.S. institutional
investors, obtained from their mandatory 13F filings. For the bilateral analysis using CPIS data,
we estimate the following model:
𝐹𝑃𝐼𝑖ℎ𝑡 = 𝛽1𝐸𝐹𝐹_𝑇𝐴𝑋𝑖ℎ𝑡 + 𝛽2𝑊𝐻𝑇_𝑂𝑣𝑒𝑟𝑝𝑎𝑦𝑚𝑒𝑛𝑡𝑖ℎ𝑡 + 𝜷𝐗𝐢𝐡𝐭 + 𝝓𝒊𝒉 + 𝝓𝒉𝒕 + 𝝓𝒊𝒕 + 𝜖𝑖ℎ𝑡 (1)
where 𝐹𝑃𝐼𝑖ℎ𝑡 is the amount, in US dollars (USD), of foreign equity holdings in country 𝑖 in year 𝑡
of investors residing in country ℎ, defined in terms of its natural logarithm. Because of our fixed
effect structure (i.e., including investor–year fixed effects, see below), we estimate the effect of
our explanatory variables on FPI in country 𝑖 conditional on the overall FPI of country ℎ in a given
year 𝑡. This approach is thus equivalent to using as the dependent variable the shares of individual
issuer countries in the holder country’s portfolio as in Amiram and Frank (2016).
The variable 𝐸𝐹𝐹_𝑇𝐴𝑋𝑖ℎ𝑡 is the effective tax payment on dividends received from a firm
residing in country 𝑖 by an investor residing in country ℎ in year 𝑡 , as defined above, and
𝑊𝐻𝑇_𝑂𝑣𝑒𝑟𝑝𝑎𝑦𝑚𝑒𝑛𝑡𝑖ℎ𝑡 is the amount of withholding tax overpayment that the investor in country
ℎ must claim from the tax authorities in country 𝑖. Thus, 𝐸𝐹𝐹_𝑇𝐴𝑋𝑖ℎ𝑡 + 𝑊𝐻𝑇_𝑂𝑣𝑒𝑟𝑝𝑎𝑦𝑚𝑒𝑛𝑡𝑖ℎ𝑡
is the initial tax rate paid by an investor on dividends received from a company in country 𝑖, while,
absent compliance frictions in the credit claiming process, the investor eventually pays only
𝐸𝐹𝐹_𝑇𝐴𝑋𝑖ℎ𝑡. Consistent with H1, we expect withholding tax overpayments to represent a friction
to investors, so that FPI decreases (𝛽2 < 0).
To isolate the effect of withholding tax overpayments and to arrive at a generalized
difference-in-differences design, we include a comprehensive set of fixed effects. These fixed
16
effects also serve as benchmarks in our portfolio location choice model ( e.g., Edison and Warnock
2004; Ivković and Weisbenner 2005). First, we include country pair fixed effects (𝝓𝒊𝒉) to control
for any differences across country pairs that could affect bilateral FPI, such as geographical,
cultural, or political proximity (Di Giovanni 2005) or a higher level of economic integration (Aviat
and Coeurdacier 2007). These fixed effects also ensure that the 𝛽2 coefficient is identified only
from changes in the withholding tax overpayment. Second, we include issuer country–specific
year fixed effects. These fixed effects control for any institutional, economic, legal, or other
changes in issuer country 𝑖 that could affect how much foreign equity is held there, such as
regulatory changes (Julio and Yook 2016) and changes in audit and reporting quality (Covrig et al.
2007; Chen et al. 2018), local economic growth (Portes and Rey 2005), and local stock prices
(Froot et al. 2001). Finally, we include holder country–year fixed effects that capture any change
in the holder country ℎ that could drive the overall level of its FPI, including macroeconomic
developments and policy changes in country ℎ, as well as changes in investor sentiment.
We further complement our regression model with a set of control variables (𝐗𝐢𝐡𝐭), that vary
at the country pair–year level. First, we include a dummy variable that indicates whether countries
𝑖 and ℎ have signed a DTA in a particular year. While DTAs affect withholding taxes, they can
have additional nontax effects on FPI, such as on the information exchange between countries
(Blonigen et al. 2014). Second, we include the difference in gross domestic product (GDP) growth
between the issuer country and the holder country divided by the GDP growth rate in the holder
country, the difference in credit provided to banks as a percentage of the GDP in the issuer country
divided by the credit provided to banks as a percentage of the GDP in the holder country, and the
difference in stocks traded as percentage of GDP in i divided by the stock traded as a percentage
17
of the GDP in the holder country. This controls for a potential correlation between the financial
and economic dynamics of the two countries.
To further ensure that the effect of dividend withholding tax overpayments is actually driven
by the taxation of dividends (vis-à-vis the taxation on capital gains), we also run a regression where
we interact 𝑊𝐻𝑇_𝑂𝑣𝑒𝑟𝑝𝑎𝑦𝑚𝑒𝑛𝑡 with the (demeaned and standardized) logarithm of the average
dividend payout ratio (weighted by the market value) in the issuer country based on the MSCI
country indexes in the three preceding years. Since 𝑊𝐻𝑇_𝑂𝑣𝑒𝑟𝑝𝑎𝑦𝑚𝑒𝑛𝑡 is expressed as a share
of dividend payments, such that the actual dollar amount of this overpayment depends on the
dividend amount paid by companies, we expect the adverse effect of 𝑊𝐻𝑇_𝑂𝑣𝑒𝑟𝑝𝑎𝑦𝑚𝑒𝑛𝑡 to be
stronger in years when companies in the issuer country pay more dividends.
In the second part of the analysis, we explore the effect of withholding tax overpayments on
FPI at the level of the individual investor, using data on the foreign holdings of institutional
investors obtained from their 13F filings to the SEC. For each investor, we aggregate the holdings
by country and quarter and estimate the following regression model:
𝐹𝑃𝐼𝑖𝑓𝑞 = 𝛽1𝐸𝐹𝐹_𝑇𝐴𝑋𝑖𝑞 + 𝛽2𝑊𝐻𝑇_𝑂𝑣𝑒𝑟𝑝𝑎𝑦𝑚𝑒𝑛𝑡𝑖𝑞 + 𝜷𝐗𝐢𝐪 + 𝝓𝒊 + 𝝓𝒒 + 𝝓𝒇𝒒 + 𝜖𝑖𝑓𝑞 (2)
where 𝐹𝑃𝐼𝑖𝑓𝑞 is the logarithm of the foreign holdings in country 𝑖 of investor 𝑓 in quarter 𝑞 ;
𝐸𝐹𝐹_𝑇𝐴𝑋𝑖𝑓𝑞 and 𝑊𝐻𝑇_𝑂𝑣𝑒𝑟𝑝𝑎𝑦𝑚𝑒𝑛𝑡𝑖𝑓𝑞 are again the effective dividend tax rate and the
withholding tax overpayment, respectively, on dividends received from companies residing in
country 𝑖; and 𝝓𝒊 , 𝝓𝒒, and 𝝓𝒇𝒒 are issuer country, quarter, and investor–quarter fixed effects,
respectively. The country fixed effects capture the time-invariant preferences of U.S. investors for
a particular country, while the quarter fixed effects capture time trends. The investor-specific
quarter fixed effects (𝝓𝒇𝒒) capture the average evolution of a particular investor’s portfolio. Thus,
the coefficient of interest, 𝛽2, captures the deviation from the average evolution of the investor’s
18
portfolio that is induced by changes in the withholding tax overpayment. We augment the model
by a range of potential determinants of portfolio choice (e.g., Chan et al. 2005), including the issuer
country’s GDP growth, the logarithm of the GDP per capita, the logarithm of market capitalization,
the logarithm of the trade ratio (measured as the sum of exports and imports divided by the GDP),
and the logarithm of FDI inflows. We also include indicators for capital controls, the protection of
minority shareholders, and the quality of the legal system in the issuer country.
In an extension, we also run the regression at the level of the individual security, that is, the
dependent variable being the holdings of investor 𝑓 in security 𝑠 in quarter 𝑞, which is regressed
on the effective dividend tax rate and the withholding tax overpayment on dividends received from
the company issuing this security:
𝐹𝑃𝐼𝑠𝑓𝑞 = 𝛽1𝐸𝐹𝐹_𝑇𝐴𝑋𝑖𝑞 + 𝛽2𝑊𝐻𝑇_𝑂𝑣𝑒𝑟𝑝𝑎𝑦𝑚𝑒𝑛𝑡𝑖𝑞 + 𝛽3𝐸𝐹𝐹_𝑇𝐴𝑋𝑖𝑞 × 𝐷𝑌𝑠𝑞
+ 𝛽4𝑊𝐻𝑇_𝑂𝑣𝑒𝑟𝑝𝑎𝑦𝑚𝑒𝑛𝑡𝑖𝑞 × 𝐷𝑌𝑠𝑞 + 𝜷𝐗𝐢𝐟𝐪 + 𝝓𝒊𝒒 + 𝝓𝒔 + 𝝓𝒇𝒒 + 𝜖𝑠𝑖𝑓𝑞
(3)
The advantage of this model is that it allows us to relate the effect of withholding tax
overpayments directly to the dividend payments of the corresponding company (i.e., dividend
yields, 𝐷𝑌𝑠𝑞 ) and thus identify the effect of withholding tax overpayments from firm-level
variation in dividend payments, controlling for any change at the foreign country level via country–
quarter fixed effects (𝝓𝒊𝒒). A limitation of this regression is that, in contrast to equation (3), we
only observe portfolio changes in countries where the investor already holds assets; that is, we
capture the intensive margin but not the extensive margin of the investor’s portfolio choice.
3.3 Testing H2
To test H2, we extend equation (1) by an interaction of the withholding tax overpayment
(𝑊𝐻𝑇_𝑂𝑣𝑒𝑟𝑝𝑎𝑦𝑚𝑒𝑛𝑡) and several proxy variables for administrative costs to file cross-border
withholding tax claims. First, we use a dummy variable that is equal to one if the issuer country’s
19
legislation on withholding taxes allows for relief at source, that is, the double taxation relief can
be applied immediately when the dividend is paid out to the foreign shareholder. The issuing
company then deducts only the lower withholding tax under the DTA from the gross dividend,
which allows the receiving shareholder to avoid having to claim withholding tax overpayment. To
be eligible for relief at source, shareholders (or their intermediaries) need to comply with
substantial documentation requirements, but this procedure often simplifies the reclamation of
withholding tax overpayments.14
Second, we extend the model with several proxies for compliance costs for claiming
withholding tax overpayments in the issuer country. For instance, we employ a dummy variable
indicating whether the investor and issuer countries share a common land border, which proxies
for geographical proximity. Prior literature shows that geographic distance leads to information
asymmetries that are likely to increase the communication costs between two locations (Ghoul et
al. 2013).15 The second proxy is the logarithm of the number of visitors from the holder country to
the issuer country as a share of the inhabitants of the holder country. Greater cross-border mobility
toward the issuer country could increase cultural knowledge (Parey and Waldinger 2011), which,
in turn, can improve communication and make it easier to apply for the cross-border refund of
withholding tax overpayments. We also explore reporting quality as a proxy for compliance costs.
A high level of reporting quality in the issuer country simplifies communications with tax
authorities, since it makes it easier to process corporate disclosures and to obtain the necessary
documentation to file reclaims (Holthausen 2009; Fang et al. 2015). Thus, we use a dummy
variable for high audit and reporting quality in the issuer country as an additional proxy for the
14 For this reason, the relief-at-source mechanism has been suggested as a possible policy solution to withholding tax
overpayments (e.g., Næss-Schmidt et al. 2012; Anon. 2013). 15 In untabulated results, we obtain qualitatively similar findings if we use the actual distance between capital cities.
20
administrative costs of cross-border tax reclaims. Finally, we use a dummy indicating whether the
holder and issuer countries are members of the eurozone. Operating under a common currency
avoids documentation requirements with regard to exchange rates and makes it easier to transfer
withholding tax claims granted to the investor.
3.4 Testing H3
The second part of our empirical analysis explores a potential mechanism through which
withholding taxes affect FPI (H3). We test whether the spread in returns between an ADR traded
in the United States and its underlying foreign security traded abroad is negatively associated with
the magnitude of the withholding tax overpayment in the days leading up to the ex-dividend day.
We estimate the following regression model:
𝑆𝑃𝑅𝐸𝐴𝐷𝑐,𝑖,𝑑 = 𝛽1𝐸𝐹𝐹_𝑇𝐴𝑋_𝐷𝑖,𝑑 + 𝛽2𝑊𝐻𝑇_𝑂𝑣𝑒𝑟𝑝𝑎𝑦𝑚𝑒𝑛𝑡𝑖,𝑑 + 𝜷𝐗 + 𝝓𝒅 + 𝝓𝒊 + 𝜖𝑐,𝑖,𝑑 (4)
where 𝑆𝑃𝑅𝐸𝐴𝐷𝑐,𝑖,𝑑 is the difference between the return on the ADR of company 𝑐 and the return
on its corresponding foreign market security in country 𝑖 on the last cum dividend day of dividend
𝑑 (i.e., the day before the ex-dividend day). Returns are computed as the difference in the stock
price (adjusted for stock splits) on the last cum dividend day and the stock price 30 trading days
earlier divided by the latter. Since we use the spread between the ADR return and its underlying
security, we effectively control for market trends. We include two tax-related variables in equation
(4): first, 𝐸𝐹𝐹_𝑇𝐴𝑋_𝐷𝑖,𝑑, the difference in the effective tax rate between a U.S. shareholder and a
shareholder in home market 𝑖 of company 𝑐 for dividend 𝑑 (𝐸𝐹𝐹_𝑇𝐴𝑋_𝐷𝑖,𝑑 = 𝐸𝐹𝐹_𝑇𝐴𝑋𝑖,ℎ,𝑡 −
𝜏𝑖𝑡𝑑 ), and, second, 𝑊𝐻𝑇_𝑂𝑣𝑒𝑟𝑝𝑎𝑦𝑚𝑒𝑛𝑡𝑖,𝑑, the amount of withholding tax overpayment that the
investor in the United States has to claim from the tax authorities in the residence country 𝑖 of
company 𝑐. The terms 𝝓𝒅 and 𝝓𝒊 are fixed effects for the last cum dividend day of dividend 𝑑 and
home market 𝑖, respectively, and 𝐗 is a vector of control variables for company c that includes size
21
(total), total cash holdings over total assets, and the leverage ratio (total debt divided by total assets)
reported in the year prior to dividend 𝑑.
In this setting, the coefficient 𝛽2 captures the effect of the withholding tax overpayment on
the return spread between the ADR and the underlying security. Any difference in dividend
taxation between U.S. investors and investors residing in the home market of the ADR is captured
by 𝛽1. If withholding tax overpayments constitute a cost to U.S. investors, 𝑆𝑃𝑅𝐸𝐴𝐷𝑐,𝑖,𝑑 should be
negatively associated with 𝑊𝐻𝑇_𝑂𝑣𝑒𝑟𝑝𝑎𝑦𝑚𝑒𝑛𝑡𝑖,𝑑 (i.e., 𝛽2 < 0).
The negative effect of withholding tax overpayments on the return spread should be more
pronounced for firms with higher dividend yields because the total withholding tax overpayment
is the product of the dividend amount and the tax rate difference between the local withholding tax
in the foreign market of the ADR’s underlying security and the applicable DTA withholding tax.
We test this prediction by adding interactions with the dividend yield to equation (4), to estimate
the following regression:
𝑆𝑃𝑅𝐸𝐴𝐷𝑐,𝑖,𝑑 = 𝛽1𝐸𝐹𝐹_𝑇𝐴𝑋_𝐷𝑖,𝑑 + 𝛽2𝐸𝐹𝐹_𝑇𝐴𝑋_𝐷𝑖,𝑑 × 𝐷𝑌𝑐,𝑑
+ 𝛽3𝑊𝐻𝑇_𝑂𝑣𝑒𝑟𝑝𝑎𝑦𝑚𝑒𝑛𝑡𝑖,𝑑 + 𝛽4𝑊𝐻𝑇_𝑂𝑣𝑒𝑟𝑝𝑎𝑦𝑚𝑒𝑛𝑡𝑖,𝑑 × 𝐷𝑌𝑐,𝑑
+ 𝛽5𝐷𝑌𝑐,𝑑 + 𝜷𝐗 + 𝝓𝒅 + 𝝓𝒊 + 𝜖𝑐,𝑖,𝑑
(5)
where 𝐷𝑌𝑐,𝑑 is the dividend yield, defined as the dividend 𝑑 divided by the ADR price 30 trading
days prior to the last cum dividend day, and 𝛽4 measures the effect of withholding tax
overpayments as a percentage of the dividend yield on the return spread. Consistent with H3, we
expect 𝛽4 to be negative if withholding tax overpayments are priced into ADR returns. The
coefficient 𝛽3 captures the effect of withholding tax overpayments independent of the dividend
yield. It can be negative if investors generally dislike withholding overpayments independent of
the actual cost they accrue.
22
3.5 Data
3.5.1 FPIs
To analyze FPI, we use two sets of data: bilateral FPI data and data on U.S. mutual fund
holdings. For both sets, FPI is defined as foreign equity holdings that entitle shareholders to voting
rights of less than 10%. Bilateral FPI is obtained from the IMF’s Coordinated Portfolio Investment
Survey (CPIS). For each participating country, the corresponding central bank collects information
on foreign equity held by resident investors. The data are available on an annual basis, and
separately for each issuer country; that is, for a particular investor country ℎ, we know the level of
foreign equity held in each issuer country 𝑖 on an annual basis. Collecting data from the asset-
owning country rather than from the security-issuing country helps ensure data precision because
investors are more likely to know where their foreign equity is issued than issuers would know the
residence of all their investors.
The data in the CPIS have been collected since 1997. However, participation varied in the
first years (see also Amiram and Frank 2016) and the data are not complete in very recent years.
Since our bilateral withholding tax data are available from 2008 onward, we use CPIS data from
2008 to 2015. During this period, a large number of countries consistently reported foreign equity
holdings in CPIS. We include the foreign equity holdings of 38 developed countries, including all
major OECD and European Union member states. Table 1 reports the number of observations in
the sample and the amount invested per investor country. To further ensure data quality, we use
only issuer–investor country pairs that report bilateral equity holdings for at least five years and
which have a median of USD 1 million in equity holdings during the sample period. This leaves
us with 115 issuer countries and 1,869 country pairs in our regression sample.
23
Figure 2 displays FPI by investor country in 2012 as a share of the GDP relative to the FDI
in 2012. In many countries, the FPI is substantial and similar in size to the FDI. The average level
of FPI of an investor country in a particular issuer country is USD 8.2 billion, whereas the average
FDI for a country pair is USD 7.9 billion (see Table 2). In 2012, our sample comprises a total of
USD 14.79 trillion in foreign equity holdings. Although a large part of the foreign equity in our
sample is both held by U.S. investors (USD 5.17 trillion in 2012, see Table 1) and invested in the
United States (USD 2.47 trillion in 2012), small, open economies such as the Netherlands and
Belgium are also particularly involved in cross-border investment relative to the size of their
economy via both FPI and FDI. Two countries that stand out are Ireland and Luxembourg, with
shares of FPI above 100% of their GDP, likely reflecting the fact that these locations are often
used as tax shelters by investors (Hanlon et al. 2015). Note that the investor country–specific year
fixed effects included in our empirical model fully capture these country-specific effects and
dynamics. Further, we show in a robustness test that no single investor country is driving our
findings.
Few countries report equity FPI disaggregated for specific investor types. Data from
countries that report such detail suggest that the bulk of the FPI (92% in 2015) comes from
households and their intermediaries, such as investment funds or banks (see Figure 3). The ultimate
owners of this FPI are thus taxed at the personal level and are directly affected by the withholding
tax systems that we study. While 11% of FPI is held directly by households, the vast majority of
foreign stocks are held indirectly through institutional investors, consistent with their dominance
among foreign investors reported in previous studies (e.g., Dahlquist and Robertsson 2001;
Ferreira and Matos 2008; Ammer et al. 2012).
24
Data on U.S. institutional investor holdings are obtained from their SEC 13F filings. The
SEC requires institutional investment managers with more than USD 100 billion of assets under
management to disclose their equity holdings on a quarterly basis. The mandatory 13F filings have
been previously used to study institutional investor behavior (e.g., Lewellen 2011; Blouin et al.
2017). We obtain the data from Backus et al. (2019), who have scraped all the 13F filings from
the SEC webpage.16 Consistent with the FPI definition for the CPIS data in our main test, we use
the foreign holdings with a voting rights share of less than 10% of institutional investors residing
in the United States for the sample period 2008–2015. We merge this information with pricing
data from Compustat to obtain the market value of the holdings. During the sample period, we
observe 4,537 institutional investors holding, on average, USD 17 million in each individual
security. A limitation of the 13F filings is that they report only the holdings of securities traded on
the U.S. market (i.e., stocks of cross-listed companies and ADRs). Direct holdings via foreign
stock exchanges are not reported. However, U.S. investors tend to prefer U.S. traded securities
(e.g., Lang et al. 2003; Edison and Warnock 2004), as reflected in the size of the funds reported in
the 13F filings. For 2012, the FPI in our 13F sample amounts to USD 3.2 trillion, or about 62% of
the U.S. FPI reported by CPIS.17
3.5.2 Relief-at-Source Mechanisms
Using information from national tax authorities, as well as financial service providers (i.e.,
BNY Mellon, Clearstream), we collect data on the availability of relief-at-source mechanisms for
dividend withholding taxes on foreign investors in the issuer countries. We define a relief-at-
source mechanism as a provision that allows the dividend-paying company to deduct the
16 The data were downloaded from Michael Sinkinson’s webpage and they contain several improvements over the
Thomson Reuters S34 database, an alternative source for 13F filings. 17 See Table 1. For further details on the distribution of U.S. institutional investor countries and more summary
statistics, see the corresponding table in the Online Appendix.
25
shareholder-specific effective dividend withholding tax rate (taking into account reductions due to
DTAs with the shareholder’s country of residence) from dividend payments rather than the higher
standard withholding tax. Only 26% of the issuer countries in our sample have such a mechanism
(hosting about 46% of the FPI in the CPIS sample). To be eligible for these relief-at-source
provisions, foreign shareholders or their intermediaries usually have to file applications and
provide documentation to the tax authorities in the issuer country prior to the dividend distribution.
3.5.3 ADRs
For the ADR pricing analysis, we use data on ADRs traded on OTC markets, for which
pricing and dividend information is available from WRDS and FINRA. OTC markets host the
large majority (approximately three-quarters) of ADRs. Foreign firms have mainly chosen to place
their ADRs on OTC markets to avoid having to comply with the complex regulations for stock
exchange listings introduced by the Sarbanes–Oxley Act of 2002. Furthermore, in 2008, the SEC
exempted foreign issuers from registration if they traded on OTC markets.
To study the pricing of ADRs, we combine four sets of data: (1) We collect ticker symbols,
market locations, countries, and the ISIN of the underlying securities for all ADRs from J.P.
Morgan’s website (adr.com). (2) We obtain information on the daily prices of ADRs on over-the-
counter (OTC) markets from WRDS OTC Markets database. (3) Daily pricing data for the
underlying security and financial data for the issuing firm are available from Datastream.
(4) Information on dividend amounts, relevant dividend dates (i.e., record day, declaration day,
ex-dividend day), and dividend characteristics (e.g., taxable vs. nontaxable) are available from the
Financial Industry Regulatory Authority (FINRA). FINRA reports data on all securities for which
trades and events are reported via FINRA’s OTC Reporting Facility.
26
Since OTC pricing data are not available for full years prior to 2012, we use ADR data over
the period 2012–2018. Consistent with prior research, we exclude thinly traded ADRs (Callaghan
and Barry 2003), that is, we exclude ADRs in years in which they are traded on fewer than 100
trading days. We also exclude ADRs from Japan and Korea because firms listed in these countries
declare dividends traditionally only several weeks after the ex-dividend day, such that it is
impossible to accurately capitalize them around the ex-dividend day.18 We consider taxable cash
dividends with dividend payments at or below 25% of the security value. Dividends above this
threshold constitute a small minority of cases for which substantially different regulations apply,
particularly with respect to the ex-dividend date.19 This approach leads to a sample of 3,888
dividend payments by 652 different foreign companies that issued ADRs on U.S. OTC markets.
These companies reside in 40 different countries. The average dividend yield is 2.4% (see Panel
B of Table 2), and the return spread between the ADRs and the underlying security on the last
cum-dividend day is 0.38 percentage points, ranging from -4.84 to 7.36 percentage points. This
spread is similar to those observed in earlier studies (Blouin et al. 2009).
4 Results
4.1 FPI
The results of testing equation (1) are presented in Table 3. Columns (1) to (3) present the
results of a model including the tax rate variables and a set of fixed effects with no country pair
controls. According to H1, dividend withholding taxes are only neutral with respect to the FPI
location if one assumes that withholding tax overpayments can be easily and fully claimed. Our
empirical results suggest that withholding tax overpayments matter for FPI. Across all
18 This is also reflected in the fact that Japanese and Korean ADRs are usually not quoted ex-dividends. 19 Both FINRA and stock exchanges set the ex-dividend day of a dividend payment of more than 25% of the company’s
stock price on the first business day after the payment date, that is, usually several days after the record date.
27
specifications in Table 3 and consistent with H1, we observe a significantly negative coefficient
for 𝑊𝐻𝑇_𝑂𝑣𝑒𝑟𝑝𝑎𝑦𝑚𝑒𝑛𝑡 that is robust to the inclusion of additional control variables (see column
(4)). Consistent with the notion that this effect is related to dividend payments, we find a
significantly negative coefficient when we interact 𝑊𝐻𝑇_𝑂𝑣𝑒𝑟𝑝𝑎𝑦𝑚𝑒𝑛𝑡 with 𝑃𝐴𝑌𝑂𝑈𝑇 in
column (5), which implies that frictions from dividend withholding tax overpayments are stronger
when issuer countries pay more dividends.20
Thus, withholding tax overpayments are an additional friction in cross-border portfolio
investment that lead to less FPI in locations from which investors face high levels of withholding
tax overpayment. The results are also economically large. The estimates from column (3) in Table
3 indicate that a one percentage point increase in the withholding tax overpayment rate for a
particular investor–issuer country pair lowers FPI for this country pair by 2.3% annually.
Evaluated at the average sample FPI, this implies an average decrease in FPI of USD 186 million
per country pair for each percentage point of withholding tax overpayment. Note that, since overall
FPI in a particular issuer country is the sum of the FPI from all investor countries, the overall effect
for an individual country is likely to be substantially larger. For example, in 2015, the investor
countries in our sample held USD 857 billion in equity FPI in Germany. Our estimates suggest
that FPI to Germany increases by USD 19 billion if withholding tax overpayments in Germany are
reduced by one percentage point.
Further, the estimated coefficient of 𝐸𝐹𝐹_𝑇𝐴𝑋 is weak and nonsignificant across all
specifications. This is because foreign withholding tax rates are often below the domestic dividend
tax rate. The international tax system of foreign tax credits and withholding tax rates aims to
20 The variable 𝑃𝐴𝑌𝑂𝑈𝑇 is demeaned and standardized such that the coefficient is to be interpreted as estimated
responses to deviations from the mean. Note that issuer country–year fixed effects capture any direct effect of issuer–
country payout ratios on equity FPI.
28
preserve capital export neutrality by ensuring that investors face the same tax rate on dividends
from any issuer country. Hence, 𝐸𝐹𝐹_𝑇𝐴𝑋 does not vary across issuer countries. It could impact
overall FPI, but should not differentially affect investments in individual issuer countries. The
evolution of the overall level of FPI is absorbed by the investor country–year fixed effects.
We subject our results to two robustness tests.21 First, we address concerns that withholding
tax overpayments are correlated with unobserved country pair–year–specific variation driving FPI
and taxes by using the logarithm of FDI as the dependent variable instead. FDI should not respond
to withholding tax overpayments, since they are not applicable to such investments. FDI would,
however, be affected by similar bilateral dynamics as FPI. This point is reflected in a high
correlation (0.64 in our sample) between FPI and FDI. If the coefficient estimates on
𝑊𝐻𝑇_𝑂𝑣𝑒𝑟𝑝𝑎𝑦𝑚𝑒𝑛𝑡 in Table 3 capture some of these dynamics, they should also show up in the
regressions with FDI. However, we find in Table 4 that FDI does not respond to bilateral changes
in 𝑊𝐻𝑇_𝑂𝑣𝑒𝑟𝑝𝑎𝑦𝑚𝑒𝑛𝑡, reassuring us that the results in Table 3 are not driven by unobserved
country pair–year–specific variation in economic conditions.
Second, we test whether there are any pre-trends in the explanatory variable. To this end, we
run a changes model that regresses year-on-year changes in the logarithm of FPI in year 𝑡
(winsorized at the 99th percentile) on the year-on-year change of the tax variables in 𝑡, as well as
on the year-on-year changes of the tax variables in the years before and after 𝑡. If there are no pre-
trends, changes in FPI in the current year (𝑡) should not respond to changes in the tax variables in
future years (e.g., 𝑡 + 1, 𝑡 + 2, and 𝑡 + 3), but only to tax variable changes in the current year (𝑡).
Furthermore, if the effect of withholding tax overpayments on FPI is persistent, FPI changes in the
21 We also check whether our results are driven by single countries by excluding them one by one from the regression.
In the Online Appendix, we present the estimated coefficients for 𝑊𝐻𝑇_𝑂𝑣𝑒𝑟𝑝𝑎𝑦𝑚𝑒𝑛𝑡 by rerunning specification
(3) from Table 3, excluding individual investor countries. Throughout the specifications, the estimated coefficient
remains significantly negative. Thus, our findings are not the result of a particular country’s investment behavior.
29
current year would not respond to the tax variable changes in previous years (e.g., 𝑡 − 1 or 𝑡 − 2).
Figure 4 plots the results of this exercise for our variable of interest, 𝑊𝐻𝑇_𝑂𝑣𝑒𝑟𝑝𝑎𝑦𝑚𝑒𝑛𝑡 .
Although current increases in 𝑊𝐻𝑇_𝑂𝑣𝑒𝑟𝑝𝑎𝑦𝑚𝑒𝑛𝑡 reduce FPI, we find future changes in
𝑊𝐻𝑇_𝑂𝑣𝑒𝑟𝑝𝑎𝑦𝑚𝑒𝑛𝑡 to have no significant effects on current FPI changes. We also cannot reject
the hypothesis of parallel pre-trends (i.e., that all estimated coefficients for
𝑊𝐻𝑇_𝑂𝑣𝑒𝑟𝑝𝑎𝑦𝑚𝑒𝑛𝑡 changes in future years are jointly zero; t-statistic = 0.10), which further
validates our research design. Figure 4 also shows that the effect is immediate and persistent, as
indicated by the nonsignificant coefficients on lagged changes in 𝑊𝐻𝑇_𝑂𝑣𝑒𝑟𝑝𝑎𝑦𝑚𝑒𝑛𝑡 ,
suggesting that investors consider the compliance frictions ex ante in their investment decisions.
This result is consistent with institutional investors—the main driver of FPI—openly raising
concerns about the issue of frictions in claiming tax credits (e.g., European Federation of Investors
2011).
4.2 Heterogeneity in the FPI Effect of Withholding Tax Overpayments
In the next step, we examine the heterogeneity in the FPI effect of withholding tax
overpayments across country pairs (H2). Table 5 presents the results of our first test relating to the
existence of relief-at-source mechanisms. Column (1) shows the regression results for a sample
that includes only country pairs with an issuer country that does not allow for relief at source. The
coefficient of 𝑊𝐻𝑇_𝑂𝑣𝑒𝑟𝑝𝑎𝑦𝑚𝑒𝑛𝑡 remains significantly negative and increases in magnitude
compared to the baseline results presented in Table 3, consistent with the notion that it is issuer
countries without relief at source that impose the greatest frictions on foreign investors. In column
(2), we present the results for the subsample of country pairs where relief at source is available in
the issuer country. Here, the effect of 𝑊𝐻𝑇_𝑂𝑣𝑒𝑟𝑝𝑎𝑦𝑚𝑒𝑛𝑡 is nonsignificant, and, most
importantly, the economic magnitude of the coefficient is very close to zero. These results suggest
30
that the distortive effect of withholding tax overpayments is alleviated if the issuer country allows
for some sort of relief-at-source mechanism. Withholding tax overpayments no longer have
adverse effects on FPI given a relief-at-source mechanism in place. This finding is similar in the
full sample when interacting the relief-at-source dummy with 𝑊𝐻𝑇_𝑂𝑣𝑒𝑟𝑝𝑎𝑦𝑚𝑒𝑛𝑡. Columns (3)
and (4) of Table 5 present these results without and with controls, respectively. This test also allows
us to show that the 𝑊𝐻𝑇_𝑂𝑣𝑒𝑟𝑝𝑎𝑦𝑚𝑒𝑛𝑡 coefficients for the two groups are statistically different
from each other.
Next, we interact 𝑊𝐻𝑇_𝑂𝑣𝑒𝑟𝑝𝑎𝑦𝑚𝑒𝑛𝑡 with various proxies for the administrative costs to
file cross-border withholding tax claims.22 The results are presented in Table 6. Consistent with
H2, the negative effect of 𝑊𝐻𝑇_𝑂𝑣𝑒𝑟𝑝𝑎𝑦𝑚𝑒𝑛𝑡 on FPI is attenuated for investor–issuer country
pairs that are neighbors (column (1)) or have a higher number of bilateral visits (column (2)). Note
that our measure for bilateral visits is demeaned and standardized such that the coefficient must be
interpreted as estimated responses to deviations from its mean. Similarly, better audit and reporting
quality (column (3)) as well as a common currency (column (4)) mitigate the burden of
withholding tax overpayments. Across all specifications, the estimated coefficient on
𝑊𝐻𝑇_𝑂𝑣𝑒𝑟𝑝𝑎𝑦𝑚𝑒𝑛𝑡 remains negative and significant. Hence, while the average effect of
𝑊𝐻𝑇_𝑂𝑣𝑒𝑟𝑝𝑎𝑦𝑚𝑒𝑛𝑡 is significantly negative, there is substantial heterogeneity in the effect
across issuer and investor countries with respect to administrative costs for withholding tax
overpayment reclamation. These results further corroborate the notion that the compliance burden
of claiming withholding tax overpayments drives their negative effect on FPI.
22 As an additional test, we run regressions including the interactions of our cross-sectional test variables with
𝐸𝐹𝐹_𝑇𝐴𝑋. The results for these regressions are presented in the Online Appendix. If the proxy variables accurately
capture bilateral variation in compliance costs for withholding tax claims, the effect of 𝐸𝐹𝐹_𝑇𝐴𝑋, which constitutes
the tax payment—assuming that any overpayment has already been claimed—should not vary with these variables.
Indeed, none of the interactions with 𝐸𝐹𝐹_𝑇𝐴𝑋 turns out to be significant, while the estimated coefficients of the
interactions with 𝑊𝐻𝑇_𝑂𝑣𝑒𝑟𝑝𝑎𝑦𝑚𝑒𝑛𝑡 remain significant, with the expected sign.
31
4.3 Withholding Tax Overpayments and FPI: Investor-Level Evidence
While the previous results are based on aggregated FPI data, we next test H1 and H2 using
investor-level data on the foreign equity holdings of U.S. institutional investors. Panel A of Table
7 presents the results from estimating equation (2) for each possible combination of investor,
foreign country, and quarter. In column (1), we do not find any effect of withholding tax
overpayments on foreign investment. The potential reason for this nonsignificant average effect
can be seen in columns (2) and (3): once we interact 𝑊𝐻𝑇_𝑂𝑣𝑒𝑟𝑝𝑎𝑦𝑚𝑒𝑛t with the relief-at-source
indicator, we find that withholding tax overpayments without a relief-at-source mechanism have a
significantly negative effect on foreign equity investments by institutional investors, as indicated
by the negative and significant 𝑊𝐻𝑇_𝑂𝑣𝑒𝑟𝑝𝑎𝑦𝑚𝑒𝑛𝑡 coefficient. The positive and significant
interaction of 𝑊𝐻𝑇_𝑂𝑣𝑒𝑟𝑝𝑎𝑦𝑚𝑒𝑛𝑡 and 𝑅𝐸𝐿_𝐴𝑇_𝑆𝑂𝑈𝑅𝐶𝐸 suggests that withholding tax
overpayments do not affect foreign investments if there a relief-at-source mechanism is in place
(the untabulated sum of coefficients -0.008 is nonsignificant). These results hold even when we
include a battery of country-level control variables (columns (4) and (5)).
In Panel B of Table 7, we turn to analyses where each observation represents an investment
by a mutual fund in a specific foreign firm in a given quarter. Columns (1) and (2) show that, on
average, withholding tax overpayments reduce institutional investors’ equity holdings in a specific
foreign firm. In columns (3) and (4), we additionally interact withholding tax overpayments with
the dividend yield (𝐷𝑌) to examine the role of dividend payouts at the investor–firm pair level.
We find results consistent with our prediction that the adverse effect of frictions in claiming foreign
withholding tax overpayments is stronger when firms pay dividends. This finding is indicated by
the negative and significant coefficient for 𝑊𝐻𝑇_𝑂𝑣𝑒𝑟𝑝𝑎𝑦𝑚𝑒𝑛𝑡 × 𝐷𝑌 . In column (5), we
additionally include foreign country–quarter fixed effects to absorb any foreign country–specific
32
observable and unobservable characteristic and dynamics (e.g., the main effect of
𝑊𝐻𝑇_𝑂𝑣𝑒𝑟𝑝𝑎𝑦𝑚𝑒𝑛𝑡). Again, we find empirical support for the prediction that the adverse effect
of frictions in claiming foreign withholding tax overpayments is stronger when foreign firms pay
dividends. Overall, the results in Table 7 confirm the findings in the bilateral analysis. Both micro-
and macro-level tests suggest compliance frictions in claiming foreign tax credits that reduce FPI.23
4.4 Withholding Tax Overpayments and Returns
In the final step, we examine the mechanism—lower returns—through which withholding
tax overpayments can affect FPI (H3). The results for the ADR pricing analysis are displayed in
Table 8. In columns (1) and (2), we only include the variables of interest and different sets of fixed
effects in the regression model. We find the withholding tax overpayment to have a negative effect
on the spread between ADR returns and the returns of their underlying securities in both
specifications, supporting H3. The effect is larger when we include issuer country fixed effects in
addition to day fixed effects, pointing to confounding factors at the country level. For example,
issuer countries with high dividend withholding taxes can also have better institutions or more
dynamic stock markets. Our results remain robust when adding firm-level control variables
capturing size, leverage, and cash flow in columns (3) and (4). Taking the estimate in column (4)
as a benchmark, we find that the difference between the return of an ADR and the return of its
underlying security decreases by 25 basis points in response to a one percentage point increase in
withholding tax overpayment. This result implies that investors perceive withholding tax
overpayments as an additional cost and have a lower valuation of dividends from stock with larger
withholding tax overpayments, which is reflected in the issuing firm’s lower ADR returns.
23 In the Online Appendix, we show that these results are robust to the exclusion of locations that commonly serve as
financial centers (e.g., tax havens).
33
To demonstrate that the effect of withholding tax overpayments is related to the valuation of
dividends and not to other unobservable factors, we conduct a placebo test in which we randomly
assign the dividend day within each issuer–year and then rerun specification (2) of Table 8. We
repeat this exercise for 10,000 different random assignments of the dividend day and find that the
estimated coefficient for 𝑊𝐻𝑇_𝑂𝑣𝑒𝑟𝑝𝑎𝑦𝑚𝑒𝑛𝑡 is significantly negative (95% confidence interval)
and smaller or equal to our benchmark coefficient in only 3% of the estimations (see Figure 5).
Since the magnitude of withholding tax overpayments depends on the size of the dividend,
we expect the negative effect of withholding tax overpayments on the return spread to increase
with the dividend yield. Table 9 presents the results of adding interactions of the dividend yield
with the tax rate variables to the benchmark model. We first present the results from parsimonious
models without and with issuer country fixed effects in columns (1) and (2) and then add issuer
country–specific year fixed effects in column (3). Columns (4) to (6) include additional firm-level
controls. The estimated coefficient for the interaction of 𝑊𝐻𝑇_𝑂𝑣𝑒𝑟𝑝𝑎𝑦𝑚𝑒𝑛𝑡 and the dividend
yield (𝐷𝑌) is significantly negative in all specifications, which implies that larger dividend yields
lead to a more negative effect of withholding tax overpayments. Note that, with the issuer country–
specific year fixed effects in columns (3) and (6), the identification is further strengthened, since
any issuer country–specific dynamics are controlled for and the impact of withholding tax
overpayments is identified from variations in their effect across dividend payments with different
dividend yields.
5 Conclusion
This paper examines the effect of compliance frictions in claiming foreign withholding taxes
on FPI. While the international withholding tax system is generally designed such that it does not
distort the location of FPI, we show that withholding taxes can affect FPI due to compliance
34
hurdles in claiming foreign tax credits. A significant part of the tax credit—the difference between
the reduced withholding tax rate in the respective DTA and the standard withholding tax in the
foreign country (the withholding tax overpayment)—must be claimed from foreign tax authorities.
We show that claiming these foreign credits results in frictions that prevent investors from
investing abroad. A one percentage point decrease in the rate of withholding tax overpayments
increases FPI by a particular investor country in the issuer country by 2.3%. This effect is
attenuated when there is a relief-at-source mechanism and for geographically close countries,
country pairs with high numbers of mutual visitors, issuer countries with higher audit quality, and
countries in the eurozone. Finally, we also show that withholding tax overpayments are reflected
in share prices, indicating that withholding tax overpayments represent an economically significant
cost to investors.
Our results show that compliance costs in granting withholding tax credits to foreign
investors adversely affect FPI. While such frictions in the process of claiming tax credits could
secure tax revenues for the country in which the firm is located, reduced FPI could come at the
cost of lowering the investment activities of domestic firms and, in particular, of financially
constrained firms, which could benefit from increased access to capital via FPI. Hence, our results
also have policy implications. Higher tax revenues from unclaimed credits come at the cost of
reduced investment and, thus, economic growth. We do not, however, conduct a full welfare
analysis. Our results are informative to the debate on cross-border investments and offer another
potential friction contributing to the home bias (French and Poterba 1991; Cooper and Kaplanis
1994; Lewis 1999).
35
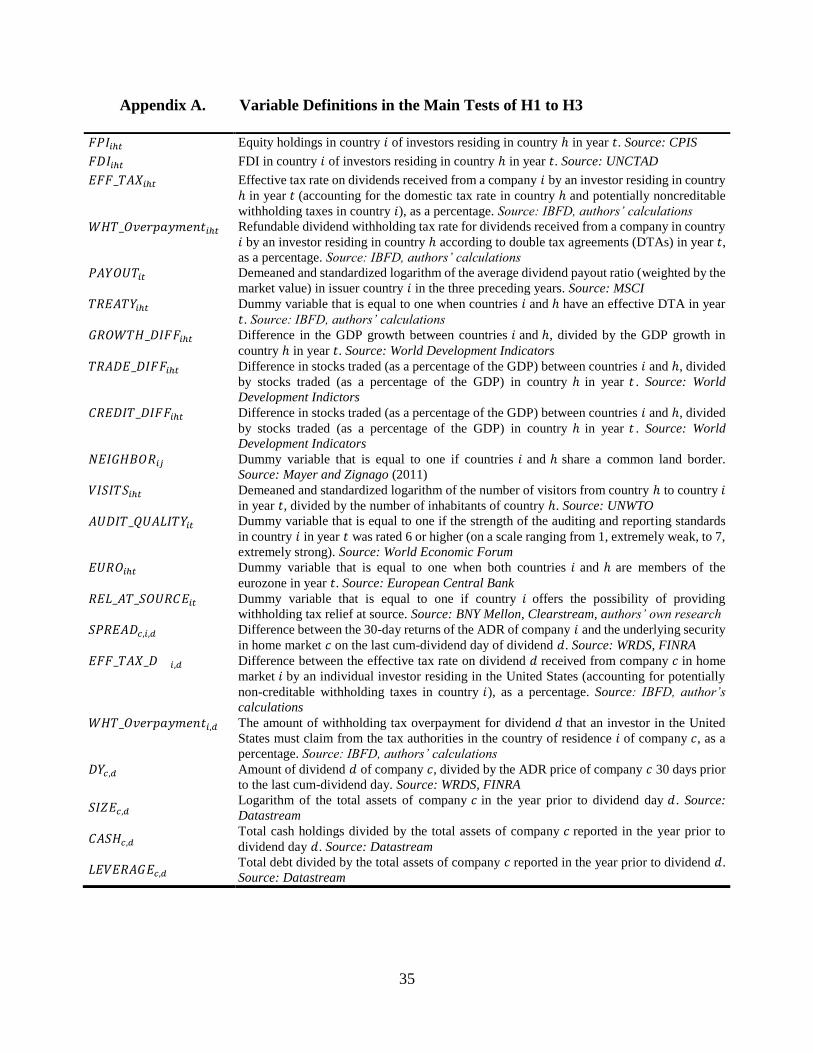
Appendix A. Variable Definitions in the Main Tests of H1 to H3
𝐹𝑃𝐼𝑖ℎ𝑡 Equity holdings in country 𝑖 of investors residing in country ℎ in year 𝑡. Source: CPIS
𝐹𝐷𝐼𝑖ℎ𝑡 FDI in country 𝑖 of investors residing in country ℎ in year 𝑡. Source: UNCTAD
𝐸𝐹𝐹_𝑇𝐴𝑋𝑖ℎ𝑡 Effective tax rate on dividends received from a company 𝑖 by an investor residing in country
ℎ in year 𝑡 (accounting for the domestic tax rate in country ℎ and potentially noncreditable
withholding taxes in country 𝑖), as a percentage. Source: IBFD, authors’ calculations
𝑊𝐻𝑇_𝑂𝑣𝑒𝑟𝑝𝑎𝑦𝑚𝑒𝑛𝑡𝑖ℎ𝑡 Refundable dividend withholding tax rate for dividends received from a company in country
𝑖 by an investor residing in country ℎ according to double tax agreements (DTAs) in year 𝑡,
as a percentage. Source: IBFD, authors’ calculations
𝑃𝐴𝑌𝑂𝑈𝑇𝑖𝑡 Demeaned and standardized logarithm of the average dividend payout ratio (weighted by the
market value) in issuer country 𝑖 in the three preceding years. Source: MSCI
𝑇𝑅𝐸𝐴𝑇𝑌𝑖ℎ𝑡 Dummy variable that is equal to one when countries 𝑖 and ℎ have an effective DTA in year
𝑡. Source: IBFD, authors’ calculations
𝐺𝑅𝑂𝑊𝑇𝐻_𝐷𝐼𝐹𝐹𝑖ℎ𝑡 Difference in the GDP growth between countries 𝑖 and ℎ, divided by the GDP growth in
country ℎ in year 𝑡. Source: World Development Indicators
𝑇𝑅𝐴𝐷𝐸_𝐷𝐼𝐹𝐹𝑖ℎ𝑡 Difference in stocks traded (as a percentage of the GDP) between countries 𝑖 and ℎ, divided
by stocks traded (as a percentage of the GDP) in country ℎ in year 𝑡 . Source: World
Development Indictors
𝐶𝑅𝐸𝐷𝐼𝑇_𝐷𝐼𝐹𝐹𝑖ℎ𝑡 Difference in stocks traded (as a percentage of the GDP) between countries 𝑖 and ℎ, divided
by stocks traded (as a percentage of the GDP) in country ℎ in year 𝑡 . Source: World
Development Indicators
𝑁𝐸𝐼𝐺𝐻𝐵𝑂𝑅𝑖𝑗 Dummy variable that is equal to one if countries 𝑖 and ℎ share a common land border.
Source: Mayer and Zignago (2011)
𝑉𝐼𝑆𝐼𝑇𝑆𝑖ℎ𝑡 Demeaned and standardized logarithm of the number of visitors from country ℎ to country 𝑖 in year 𝑡, divided by the number of inhabitants of country ℎ. Source: UNWTO
𝐴𝑈𝐷𝐼𝑇_𝑄𝑈𝐴𝐿𝐼𝑇𝑌𝑖𝑡 Dummy variable that is equal to one if the strength of the auditing and reporting standards
in country 𝑖 in year 𝑡 was rated 6 or higher (on a scale ranging from 1, extremely weak, to 7,
extremely strong). Source: World Economic Forum
𝐸𝑈𝑅𝑂𝑖ℎ𝑡 Dummy variable that is equal to one when both countries 𝑖 and ℎ are members of the
eurozone in year 𝑡. Source: European Central Bank
𝑅𝐸𝐿_𝐴𝑇_𝑆𝑂𝑈𝑅𝐶𝐸𝑖𝑡 Dummy variable that is equal to one if country 𝑖 offers the possibility of providing
withholding tax relief at source. Source: BNY Mellon, Clearstream, authors’ own research
𝑆𝑃𝑅𝐸𝐴𝐷𝑐,𝑖,𝑑 Difference between the 30-day returns of the ADR of company 𝑖 and the underlying security
in home market 𝑐 on the last cum-dividend day of dividend 𝑑. Source: WRDS, FINRA
𝐸𝐹𝐹_𝑇𝐴𝑋_𝐷 𝑖,𝑑 Difference between the effective tax rate on dividend 𝑑 received from company 𝑐 in home
market 𝑖 by an individual investor residing in the United States (accounting for potentially
non-creditable withholding taxes in country 𝑖), as a percentage. Source: IBFD, author’s
calculations
𝑊𝐻𝑇_𝑂𝑣𝑒𝑟𝑝𝑎𝑦𝑚𝑒𝑛𝑡𝑖,𝑑 The amount of withholding tax overpayment for dividend 𝑑 that an investor in the United
States must claim from the tax authorities in the country of residence 𝑖 of company 𝑐, as a
percentage. Source: IBFD, authors’ calculations
𝐷𝑌𝑐,𝑑 Amount of dividend 𝑑 of company 𝑐, divided by the ADR price of company 𝑐 30 days prior
to the last cum-dividend day. Source: WRDS, FINRA
𝑆𝐼𝑍𝐸𝑐,𝑑 Logarithm of the total assets of company 𝑐 in the year prior to dividend day 𝑑. Source:
Datastream
𝐶𝐴𝑆𝐻𝑐,𝑑 Total cash holdings divided by the total assets of company 𝑐 reported in the year prior to
dividend day 𝑑. Source: Datastream
𝐿𝐸𝑉𝐸𝑅𝐴𝐺𝐸𝑐,𝑑 Total debt divided by the total assets of company 𝑐 reported in the year prior to dividend 𝑑.
Source: Datastream
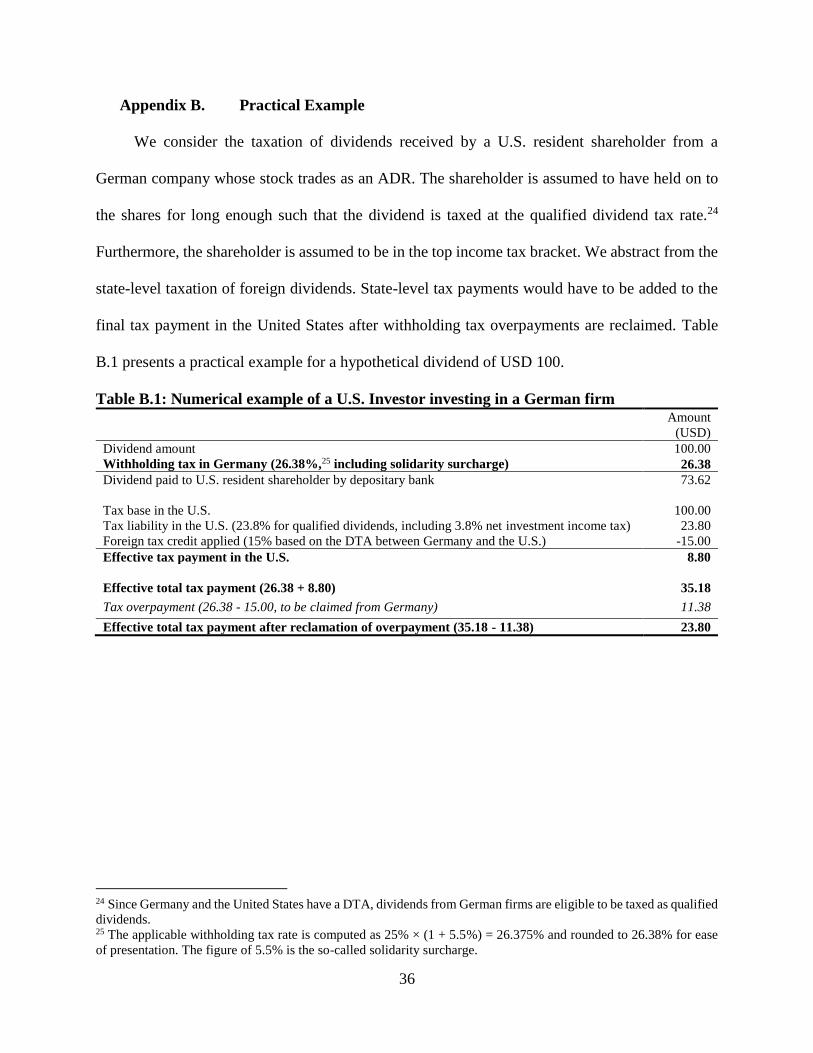
36
Appendix B. Practical Example
We consider the taxation of dividends received by a U.S. resident shareholder from a
German company whose stock trades as an ADR. The shareholder is assumed to have held on to
the shares for long enough such that the dividend is taxed at the qualified dividend tax rate.24
Furthermore, the shareholder is assumed to be in the top income tax bracket. We abstract from the
state-level taxation of foreign dividends. State-level tax payments would have to be added to the
final tax payment in the United States after withholding tax overpayments are reclaimed. Table
B.1 presents a practical example for a hypothetical dividend of USD 100.
Table B.1: Numerical example of a U.S. Investor investing in a German firm
Amount
(USD)
Dividend amount 100.00
Withholding tax in Germany (26.38%,25 including solidarity surcharge) 26.38
Dividend paid to U.S. resident shareholder by depositary bank 73.62
Tax base in the U.S. 100.00
Tax liability in the U.S. (23.8% for qualified dividends, including 3.8% net investment income tax) 23.80
Foreign tax credit applied (15% based on the DTA between Germany and the U.S.) -15.00
Effective tax payment in the U.S. 8.80
Effective total tax payment (26.38 + 8.80) 35.18
Tax overpayment (26.38 - 15.00, to be claimed from Germany) 11.38
Effective total tax payment after reclamation of overpayment (35.18 - 11.38) 23.80
24 Since Germany and the United States have a DTA, dividends from German firms are eligible to be taxed as qualified
dividends. 25 The applicable withholding tax rate is computed as 25% × (1 + 5.5%) = 26.375% and rounded to 26.38% for ease
of presentation. The figure of 5.5% is the so-called solidarity surcharge.
37
References
Adler, M., and B. Dumas. 1983. International portfolio choice and corporation finance: A
synthesis. The Journal of Finance 38 (3): 925–984.
Amiram, D., and M. M. Frank. 2016. Foreign portfolio investment and shareholder dividend
taxes. The Accounting Review 91 (3): 717–740.
Ammer, J., S. B. Holland, D. C. Smith, and F. E. Warnock. 2012. U.S. international equity
investment. Journal of Accounting Research 50 (5): 1109–1139.
Anon. 2013. TRACE implementation package for the adoption of an authorized intermediary
system: A standardised system for effective withholding tax relief procedures for cross-
border portfolio income. Report to the OECD Committee on Fiscal Affairs. Paris.
Aviat, A., and N. Coeurdacier. 2007. The geography of trade in goods and asset holdings.
Journal of International Economics 71 (1): 22–51.
Backus, M., C. Conlon, and M. Sinkinson. 2019. Common ownership in America: 1980-2017.
Working paper. National Bureau of Economic Research.
Barrios, S., H. Huizinga, L. Laeven, and G. Nicodème. 2012. International taxation and
multinational firm location decisions. Journal of Public Economics 96 (11): 946–958.
Bergstresser, D., and J. Poterba. 2002. Do after-tax returns affect mutual fund inflows? Journal
of Financial Economics 63 (3): 381–414.
Bhattacharya, S. 1979. Imperfect information, dividend policy, and “the bird in the hand”
fallacy. The Bell Journal of Economics 10 (1): 259–270.
Blonigen, B. A., L. Oldenski, and N. Sly. 2014. The Differential Effects of Bilateral Tax
Treaties. American Economic Journal: Economic Policy 6 (2): 1–18.
Blouin, J., L. Hail, and M. H. Yetman. 2009. Capital gains taxes, pricing spreads, and arbitrage:
Evidence from cross‐listed firms in the U.S. The Accounting Review 84 (5): 1321–1361.
Blouin, J. L., B. J. Bushee, and S. A. Sikes. 2017. Measuring tax-sensitive institutional investor
ownership. The Accounting Review 92 (6): 49–76.
Callaghan, S. R., and C. B. Barry. 2003. Tax-induced trading of equity securities: Evidence from
the ADR market. The Journal of Finance 58 (4): 1583–1612.
Chan, K., V. Covrig, and L. Ng. 2005. What determines the domestic bias and foreign bias?
Evidence from mutual fund equity allocations worldwide. The Journal of Finance 60 (3):
1495–1534.
Chen, F., O.-K. Hope, Q. Li, and X. Wang. 2018. Flight to quality in international markets:
Investors’ demand for financial reporting quality during political uncertainty events.
Contemporary Accounting Research 35 (1): 117–155.
Chetty, R., A. Looney, and K. Kroft. 2009. Salience and taxation: Theory and evidence.
American Economic Review 99 (4): 1145–1177.
Cooper, I. A., and E. Kaplanis. 1986. Costs to cross-border investment and international equity
market equilibrium. In Recent developments in corporate finance, edited by J. Edwards,
J. Franks, C. Mayer, and S. Schaefer, 209–240. Cambridge, MA: Cambridge University
Press.
Cooper, I., and E. Kaplanis. 1994. Home bias in equity portfolios, inflation hedging, and
international capital market equilibrium. The Review of Financial Studies 7 (1): 45–60.
Coval, J. D., and T. J. Moskowitz. 1999. Home bias at home: Local equity preference in
domestic portfolios. The Journal of Finance 54 (6): 2045–2073.
38
Covrig, V. M., M. L. Defond, and M. Hung. 2007. Home bias, foreign mutual fund holdings, and
the voluntary adoption of international accounting standards. Journal of Accounting
Research 45 (1): 41–70.
Dahlquist, M., and G. Robertsson. 2001. Direct foreign ownership, institutional investors, and
firm characteristics. Journal of Financial Economics 59 (3): 413–440.
De Mooij, R. A., and S. Ederveen. 2003. Taxation and foreign direct investment: A synthesis of
empirical research. International Tax and Public Finance 10 (6): 673–693.
Desai, M. A., and D. Dharmapala. 2011. Dividend taxes and international portfolio choice. The
Review of Economics and Statistics 93 (1): 266–284.
Dharmapala, D., and M. A. Desai. 2011. Investor taxation in open economies. Unpublished
manuscript. UNC Tax Center, Kenan-Flagler Business School, University of North
Carolina at Chapel Hill.
Di Giovanni, J. 2005. What drives capital flows? The case of cross-border M&A activity and
financial deepening. Journal of International Economics 65 (1): 127–149.
Edison, H. J., and F. E. Warnock. 2004. U.S. investors’ emerging market equity portfolios: A
security-level analysis. The Review of Economics and Statistics 86 (3): 691–704.
European Commission. 2016. Non-paper on the withholding tax for discussion at the Expert
Group on barriers to free movement of capital. Report.
European Federation of Investors. 2011. Consultation on the taxation problems that arise when
dividends are distributed across borders to portfolio and individual investors and
possible solutions - Reply from the European Federation of Investors. Brussels.
Fang, V. W., M. Maffett, and B. Zhang. 2015. Foreign institutional ownership and the global
convergence of financial reporting practices. Journal of Accounting Research 53 (3):
593–631.
Felbermayr, G. J., and F. Toubal. 2010. Cultural proximity and trade. European Economic
Review 54 (2): 279–293.
Ferreira, M. A., and P. Matos. 2008. The colors of investors’ money: The role of institutional
investors around the world. Journal of Financial Economics 88 (3): 499–533.
French, K. R., and J. M. Poterba. 1991. Investor diversification and international equity markets.
The American Economic Review 81 (2): 222.
Froot, K. A., P. G. J. O’Connell, and M. S. Seasholes. 2001. The portfolio flows of international
investors. Journal of Financial Economics 59 (2): 151–193.
Frydman, C., and B. Wang. 2019. The impact of salience on Investor Behavior: Evidence from a
natural experiment. Journal of Finance 75: 229–276.
Ghoul, S. E., O. Guedhami, Y. Ni, J. Pittman, and S. Saadi. 2013. Does information asymmetry
matter to equity pricing? Evidence from firms’ geographic location. Contemporary
Accounting Research 30 (1): 140–181.
Hanlon, M., E. L. Maydew, and J. R. Thornock. 2015. Taking the long way home: US tax
evasion and offshore investments in US equity and debt markets. The Journal of Finance
70 (1): 257–287.
Holthausen, R. W. 2009. Accounting standards, financial reporting outcomes, and enforcement.
Journal of Accounting Research 47 (2): 447–458.
Ivković, Z., and S. Weisbenner. 2005. Local does as local is: Information content of the
geography of individual investors’ common Stock investments. The Journal of Finance
60 (1): 267–306.

39
Julio, B., and Y. Yook. 2016. Policy uncertainty, irreversibility, and cross-border flows of
capital. Journal of International Economics 103: 13–26.
Lang, M. H., K. V. Lins, and D. P. Miller. 2003. ADRs, analysts, and accuracy: Does cross
listing in the United States improve a firm’s information environment and increase
market value? Journal of Accounting Research 41 (2): 317–345.
Lewellen, J. 2011. Institutional investors and the limits of arbitrage. Journal of Financial
Economics 102 (1): 62–80.
Lewis, K. K. 1999. Trying to explain home bias in equities and consumption. Journal of
Economic Literature 37 (2): 571–608.
Lintner, J. 1956. Distribution of incomes of corporations among dividends, retained earnings,
and taxes. The American Economic Review 46 (2): 97–113.
Lodge, S. 2010. Investors could reclaim millions of overseas tax. Financial Times, October 17.
Mayer, T., and S. Zignago. 2011. Notes on CEPII’s Distances Measures: The GeoDist Database.
SSRN Scholarly Paper. Rochester, NY: Social Science Research Network.
McDonald, R. L. 2001. Cross-border investing with tax arbitrage: The case of German dividend
tax credits. The Review of Financial Studies 14 (3): 617–657.
Miller, M. H., and K. Rock. 1985. Dividend policy under asymmetric information. The Journal
of Finance 40 (4): 1031–1051.
Næss-Schmidt, S., E. Rytter Sunesen, M. B. Hansen, and H. N. Jensen. 2012. Taxation of cross-
border dividend payments within the EU. Report for DG TAXUD. Copenhagen
Economics.
Parey, M., and F. Waldinger. 2011. Studying abroad and the effect on international labour
market mobility: Evidence from the Introduction of ERASMUS. The Economic Journal
121 (551): 194–222.
Portes, R., and H. Rey. 2005. The determinants of cross-border equity flows. Journal of
International Economics 65 (2): 269–296.
Zwick, E. 2018. The costs of corporate tax complexity. Working paper. National Bureau of
Economic Research.
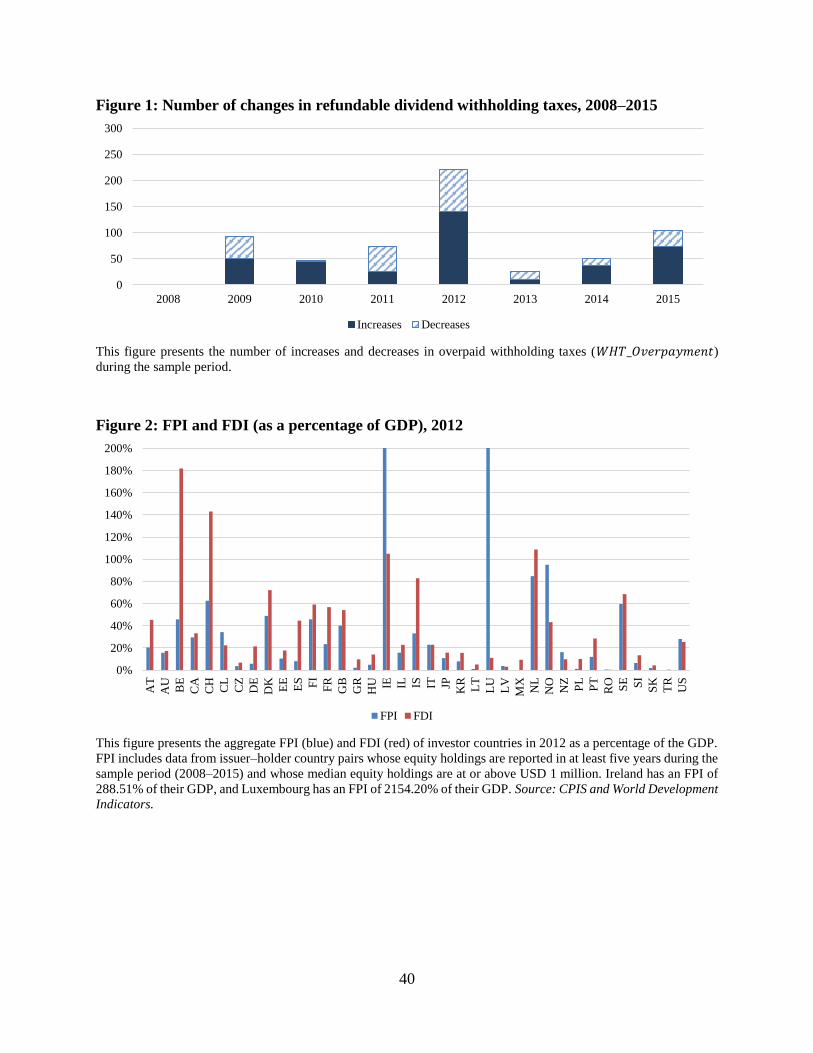
40
Figure 1: Number of changes in refundable dividend withholding taxes, 2008–2015
This figure presents the number of increases and decreases in overpaid withholding taxes (𝑊𝐻𝑇_𝑂𝑣𝑒𝑟𝑝𝑎𝑦𝑚𝑒𝑛𝑡)
during the sample period.
Figure 2: FPI and FDI (as a percentage of GDP), 2012
This figure presents the aggregate FPI (blue) and FDI (red) of investor countries in 2012 as a percentage of the GDP.
FPI includes data from issuer–holder country pairs whose equity holdings are reported in at least five years during the
sample period (2008–2015) and whose median equity holdings are at or above USD 1 million. Ireland has an FPI of
288.51% of their GDP, and Luxembourg has an FPI of 2154.20% of their GDP. Source: CPIS and World Development
Indicators.
0
50
100
150
200
250
300
2008 2009 2010 2011 2012 2013 2014 2015
Increases Decreases
0%
20%
40%
60%
80%
100%
120%
140%
160%
180%
200%
AT
AU
BE
CA
CH
CL
CZ
DE
DK
EE
ES FI
FR
GB
GR
HU IE IL IS IT JP KR
LT
LU
LV
MX
NL
NO
NZ
PL
PT
RO SE SI
SK
TR
US
FPI FDI
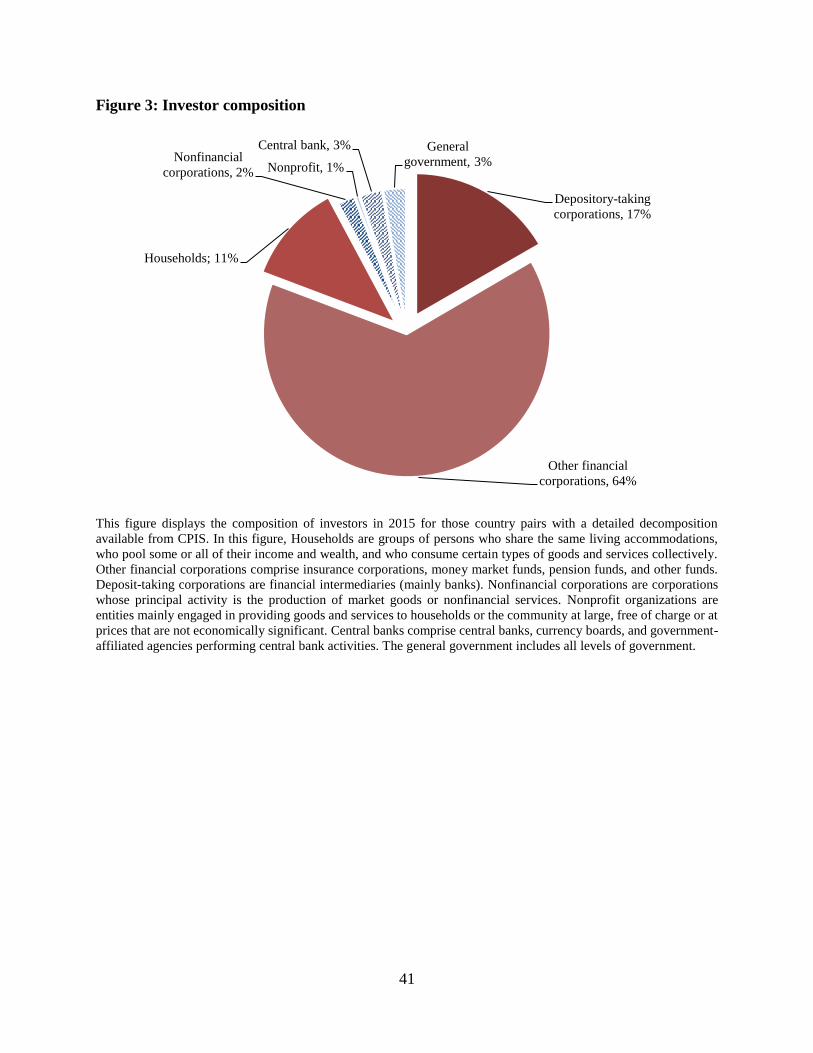
41
Figure 3: Investor composition
This figure displays the composition of investors in 2015 for those country pairs with a detailed decomposition
available from CPIS. In this figure, Households are groups of persons who share the same living accommodations,
who pool some or all of their income and wealth, and who consume certain types of goods and services collectively.
Other financial corporations comprise insurance corporations, money market funds, pension funds, and other funds.
Deposit-taking corporations are financial intermediaries (mainly banks). Nonfinancial corporations are corporations
whose principal activity is the production of market goods or nonfinancial services. Nonprofit organizations are
entities mainly engaged in providing goods and services to households or the community at large, free of charge or at
prices that are not economically significant. Central banks comprise central banks, currency boards, and government-
affiliated agencies performing central bank activities. The general government includes all levels of government.
Depository-taking
corporations, 17%
Other financial
corporations, 64%
Households; 11%
Nonfinancial
corporations, 2% Nonprofit, 1%
Central bank, 3% General
government, 3%
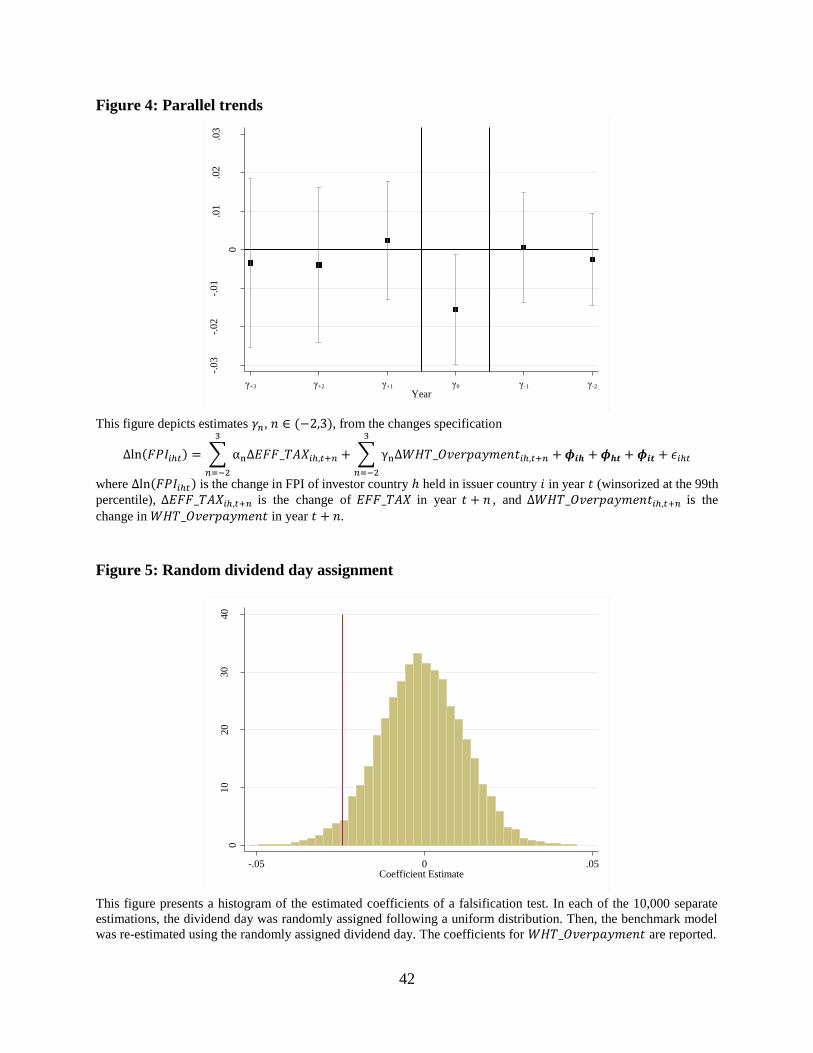
42
Figure 4: Parallel trends
This figure depicts estimates 𝛾𝑛, 𝑛 ∈ (−2,3), from the changes specification
Δln(𝐹𝑃𝐼𝑖ℎ𝑡) = ∑ αnΔ𝐸𝐹𝐹_𝑇𝐴𝑋𝑖ℎ,𝑡+𝑛
3
𝑛=−2
+ ∑ γnΔ𝑊𝐻𝑇_𝑂𝑣𝑒𝑟𝑝𝑎𝑦𝑚𝑒𝑛𝑡𝑖ℎ,𝑡+𝑛
3
𝑛=−2
+ 𝝓𝒊𝒉 + 𝝓𝒉𝒕 + 𝝓𝒊𝒕 + 𝜖𝑖ℎ𝑡
where Δln(𝐹𝑃𝐼𝑖ℎ𝑡) is the change in FPI of investor country ℎ held in issuer country 𝑖 in year 𝑡 (winsorized at the 99th
percentile), Δ𝐸𝐹𝐹_𝑇𝐴𝑋𝑖ℎ,𝑡+𝑛 is the change of 𝐸𝐹𝐹_𝑇𝐴𝑋 in year 𝑡 + 𝑛 , and Δ𝑊𝐻𝑇_𝑂𝑣𝑒𝑟𝑝𝑎𝑦𝑚𝑒𝑛𝑡𝑖ℎ,𝑡+𝑛 is the
change in 𝑊𝐻𝑇_𝑂𝑣𝑒𝑟𝑝𝑎𝑦𝑚𝑒𝑛𝑡 in year 𝑡 + 𝑛.
Figure 5: Random dividend day assignment
This figure presents a histogram of the estimated coefficients of a falsification test. In each of the 10,000 separate
estimations, the dividend day was randomly assigned following a uniform distribution. Then, the benchmark model
was re-estimated using the randomly assigned dividend day. The coefficients for 𝑊𝐻𝑇_𝑂𝑣𝑒𝑟𝑝𝑎𝑦𝑚𝑒𝑛𝑡 are reported.
-.0
3-.
02
-.0
1
0
.01
.02
.03
Coef
fici
ent
Est
imat
e
ΔWHT_Overpaym
ent
γ+3 γ+2 γ+1 γ0 γ-1 γ-2
Year
010
20
30
40
Den
sity
, 1
0,0
00
Est
imat
ions
-.05 0 .05Coefficient Estimate
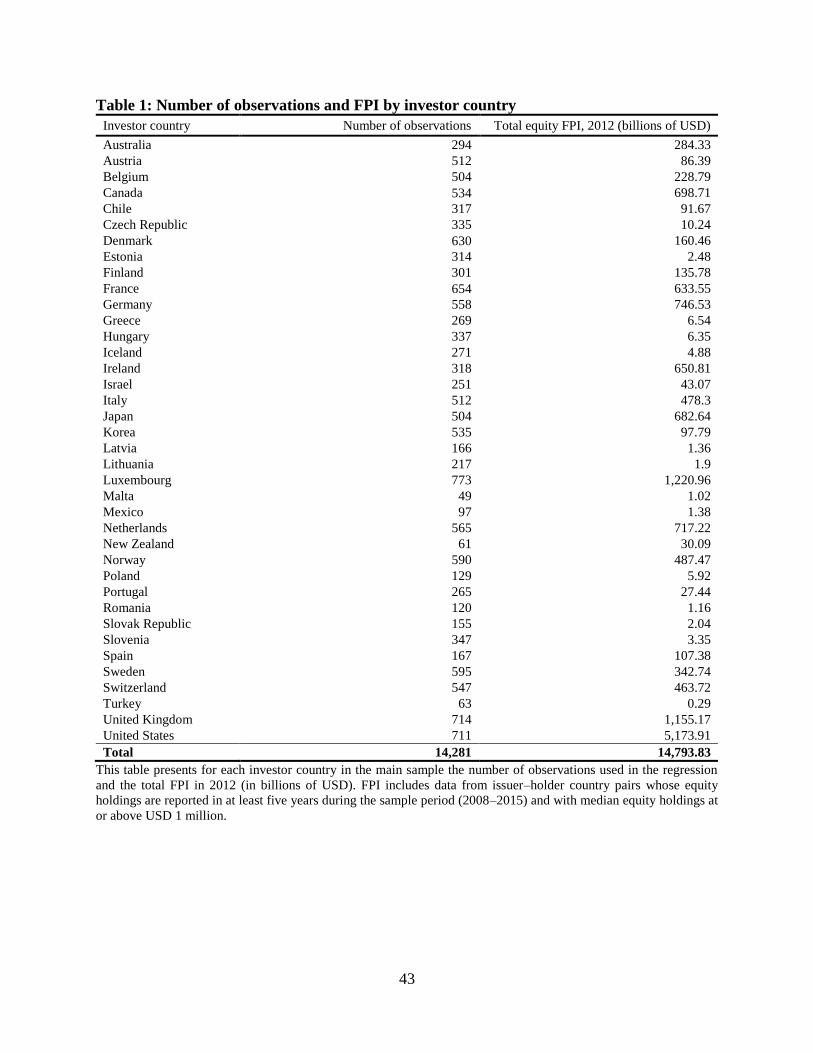
43
Table 1: Number of observations and FPI by investor country
Investor country Number of observations Total equity FPI, 2012 (billions of USD)
Australia 294 284.33
Austria 512 86.39
Belgium 504 228.79
Canada 534 698.71
Chile 317 91.67
Czech Republic 335 10.24
Denmark 630 160.46
Estonia 314 2.48
Finland 301 135.78
France 654 633.55
Germany 558 746.53
Greece 269 6.54
Hungary 337 6.35
Iceland 271 4.88
Ireland 318 650.81
Israel 251 43.07
Italy 512 478.3
Japan 504 682.64
Korea 535 97.79
Latvia 166 1.36
Lithuania 217 1.9
Luxembourg 773 1,220.96
Malta 49 1.02
Mexico 97 1.38
Netherlands 565 717.22
New Zealand 61 30.09
Norway 590 487.47
Poland 129 5.92
Portugal 265 27.44
Romania 120 1.16
Slovak Republic 155 2.04
Slovenia 347 3.35
Spain 167 107.38
Sweden 595 342.74
Switzerland 547 463.72
Turkey 63 0.29
United Kingdom 714 1,155.17
United States 711 5,173.91
Total 14,281 14,793.83
This table presents for each investor country in the main sample the number of observations used in the regression
and the total FPI in 2012 (in billions of USD). FPI includes data from issuer–holder country pairs whose equity
holdings are reported in at least five years during the sample period (2008–2015) and with median equity holdings at
or above USD 1 million.
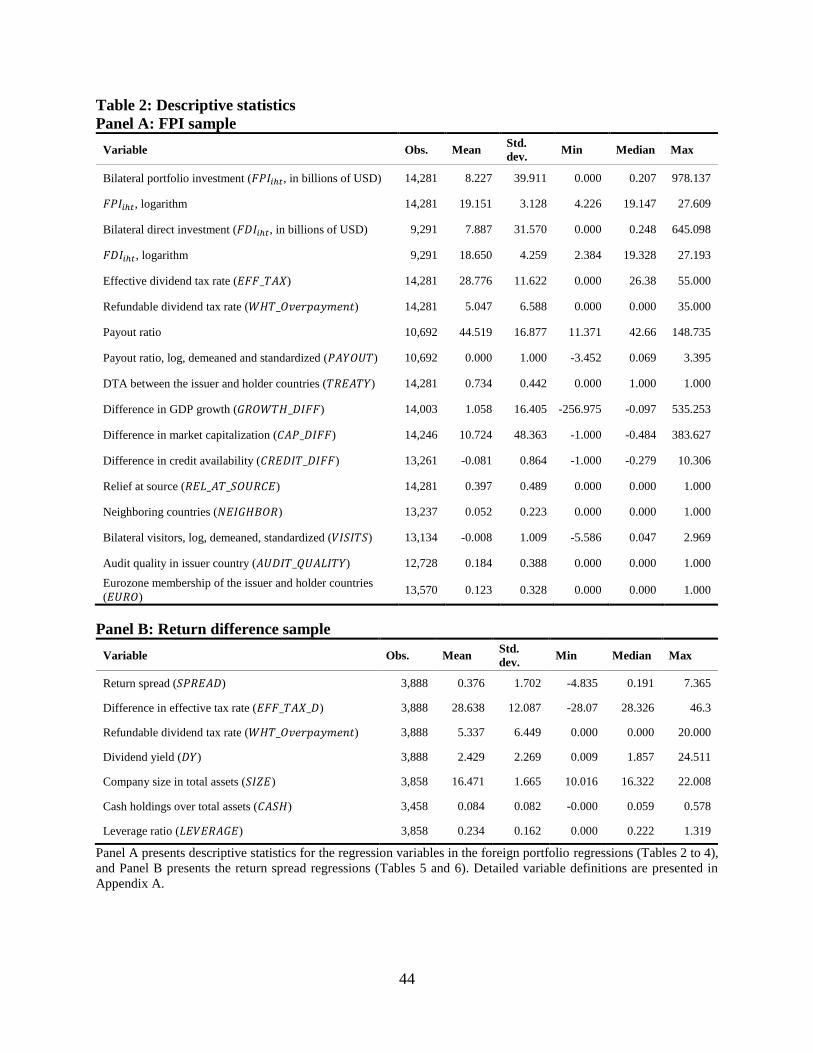
44
Table 2: Descriptive statistics
Panel A: FPI sample
Variable Obs. Mean Std.
dev. Min Median Max
Bilateral portfolio investment (𝐹𝑃𝐼𝑖ℎ𝑡, in billions of USD) 14,281 8.227 39.911 0.000 0.207 978.137
𝐹𝑃𝐼𝑖ℎ𝑡, logarithm 14,281 19.151 3.128 4.226 19.147 27.609
Bilateral direct investment (𝐹𝐷𝐼𝑖ℎ𝑡, in billions of USD) 9,291 7.887 31.570 0.000 0.248 645.098
𝐹𝐷𝐼𝑖ℎ𝑡, logarithm 9,291 18.650 4.259 2.384 19.328 27.193
Effective dividend tax rate (𝐸𝐹𝐹_𝑇𝐴𝑋) 14,281 28.776 11.622 0.000 26.38 55.000
Refundable dividend tax rate (𝑊𝐻𝑇_𝑂𝑣𝑒𝑟𝑝𝑎𝑦𝑚𝑒𝑛𝑡) 14,281 5.047 6.588 0.000 0.000 35.000
Payout ratio 10,692 44.519 16.877 11.371 42.66 148.735
Payout ratio, log, demeaned and standardized (𝑃𝐴𝑌𝑂𝑈𝑇) 10,692 0.000 1.000 -3.452 0.069 3.395
DTA between the issuer and holder countries (𝑇𝑅𝐸𝐴𝑇𝑌) 14,281 0.734 0.442 0.000 1.000 1.000
Difference in GDP growth (𝐺𝑅𝑂𝑊𝑇𝐻_𝐷𝐼𝐹𝐹) 14,003 1.058 16.405 -256.975 -0.097 535.253
Difference in market capitalization (𝐶𝐴𝑃_𝐷𝐼𝐹𝐹) 14,246 10.724 48.363 -1.000 -0.484 383.627
Difference in credit availability (𝐶𝑅𝐸𝐷𝐼𝑇_𝐷𝐼𝐹𝐹) 13,261 -0.081 0.864 -1.000 -0.279 10.306
Relief at source (𝑅𝐸𝐿_𝐴𝑇_𝑆𝑂𝑈𝑅𝐶𝐸) 14,281 0.397 0.489 0.000 0.000 1.000
Neighboring countries (𝑁𝐸𝐼𝐺𝐻𝐵𝑂𝑅) 13,237 0.052 0.223 0.000 0.000 1.000
Bilateral visitors, log, demeaned, standardized (𝑉𝐼𝑆𝐼𝑇𝑆) 13,134 -0.008 1.009 -5.586 0.047 2.969
Audit quality in issuer country (𝐴𝑈𝐷𝐼𝑇_𝑄𝑈𝐴𝐿𝐼𝑇𝑌) 12,728 0.184 0.388 0.000 0.000 1.000
Eurozone membership of the issuer and holder countries
(𝐸𝑈𝑅𝑂) 13,570 0.123 0.328 0.000 0.000 1.000
Panel B: Return difference sample
Variable Obs. Mean Std.
dev. Min Median Max
Return spread (𝑆𝑃𝑅𝐸𝐴𝐷) 3,888 0.376 1.702 -4.835 0.191 7.365
Difference in effective tax rate (𝐸𝐹𝐹_𝑇𝐴𝑋_𝐷) 3,888 28.638 12.087 -28.07 28.326 46.3
Refundable dividend tax rate (𝑊𝐻𝑇_𝑂𝑣𝑒𝑟𝑝𝑎𝑦𝑚𝑒𝑛𝑡) 3,888 5.337 6.449 0.000 0.000 20.000
Dividend yield (𝐷𝑌) 3,888 2.429 2.269 0.009 1.857 24.511
Company size in total assets (𝑆𝐼𝑍𝐸) 3,858 16.471 1.665 10.016 16.322 22.008
Cash holdings over total assets (𝐶𝐴𝑆𝐻) 3,458 0.084 0.082 -0.000 0.059 0.578
Leverage ratio (𝐿𝐸𝑉𝐸𝑅𝐴𝐺𝐸) 3,858 0.234 0.162 0.000 0.222 1.319
Panel A presents descriptive statistics for the regression variables in the foreign portfolio regressions (Tables 2 to 4),
and Panel B presents the return spread regressions (Tables 5 and 6). Detailed variable definitions are presented in
Appendix A.
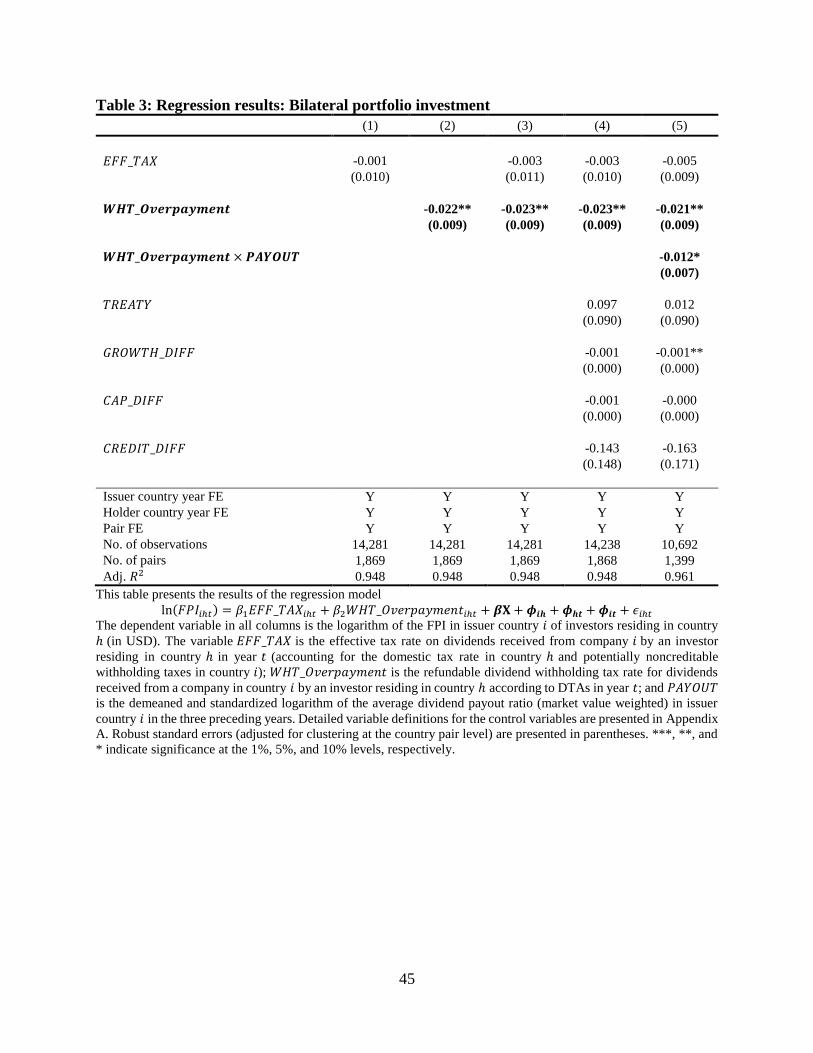
45
Table 3: Regression results: Bilateral portfolio investment
(1) (2) (3) (4) (5)
𝐸𝐹𝐹_𝑇𝐴𝑋 -0.001 -0.003 -0.003 -0.005
(0.010) (0.011) (0.010) (0.009)
𝑾𝑯𝑻_𝑶𝒗𝒆𝒓𝒑𝒂𝒚𝒎𝒆𝒏𝒕 -0.022** -0.023** -0.023** -0.021**
(0.009) (0.009) (0.009) (0.009)
𝑾𝑯𝑻_𝑶𝒗𝒆𝒓𝒑𝒂𝒚𝒎𝒆𝒏𝒕 × 𝑷𝑨𝒀𝑶𝑼𝑻 -0.012*
(0.007)
𝑇𝑅𝐸𝐴𝑇𝑌 0.097 0.012
(0.090) (0.090)
𝐺𝑅𝑂𝑊𝑇𝐻_𝐷𝐼𝐹𝐹 -0.001 -0.001**
(0.000) (0.000)
𝐶𝐴𝑃_𝐷𝐼𝐹𝐹 -0.001 -0.000
(0.000) (0.000)
𝐶𝑅𝐸𝐷𝐼𝑇_𝐷𝐼𝐹𝐹 -0.143 -0.163
(0.148) (0.171)
Issuer country year FE Y Y Y Y Y
Holder country year FE Y Y Y Y Y
Pair FE Y Y Y Y Y
No. of observations 14,281 14,281 14,281 14,238 10,692
No. of pairs 1,869 1,869 1,869 1,868 1,399
Adj. 𝑅2 0.948 0.948 0.948 0.948 0.961
This table presents the results of the regression model
ln(𝐹𝑃𝐼𝑖ℎ𝑡) = 𝛽1𝐸𝐹𝐹_𝑇𝐴𝑋𝑖ℎ𝑡 + 𝛽2𝑊𝐻𝑇_𝑂𝑣𝑒𝑟𝑝𝑎𝑦𝑚𝑒𝑛𝑡𝑖ℎ𝑡 + 𝜷𝐗 + 𝝓𝒊𝒉 + 𝝓𝒉𝒕 + 𝝓𝒊𝒕 + 𝜖𝑖ℎ𝑡
The dependent variable in all columns is the logarithm of the FPI in issuer country 𝑖 of investors residing in country
ℎ (in USD). The variable 𝐸𝐹𝐹_𝑇𝐴𝑋 is the effective tax rate on dividends received from company 𝑖 by an investor
residing in country ℎ in year 𝑡 (accounting for the domestic tax rate in country ℎ and potentially noncreditable
withholding taxes in country 𝑖); 𝑊𝐻𝑇_𝑂𝑣𝑒𝑟𝑝𝑎𝑦𝑚𝑒𝑛𝑡 is the refundable dividend withholding tax rate for dividends
received from a company in country 𝑖 by an investor residing in country ℎ according to DTAs in year 𝑡; and 𝑃𝐴𝑌𝑂𝑈𝑇
is the demeaned and standardized logarithm of the average dividend payout ratio (market value weighted) in issuer
country 𝑖 in the three preceding years. Detailed variable definitions for the control variables are presented in Appendix
A. Robust standard errors (adjusted for clustering at the country pair level) are presented in parentheses. ***, **, and
* indicate significance at the 1%, 5%, and 10% levels, respectively.
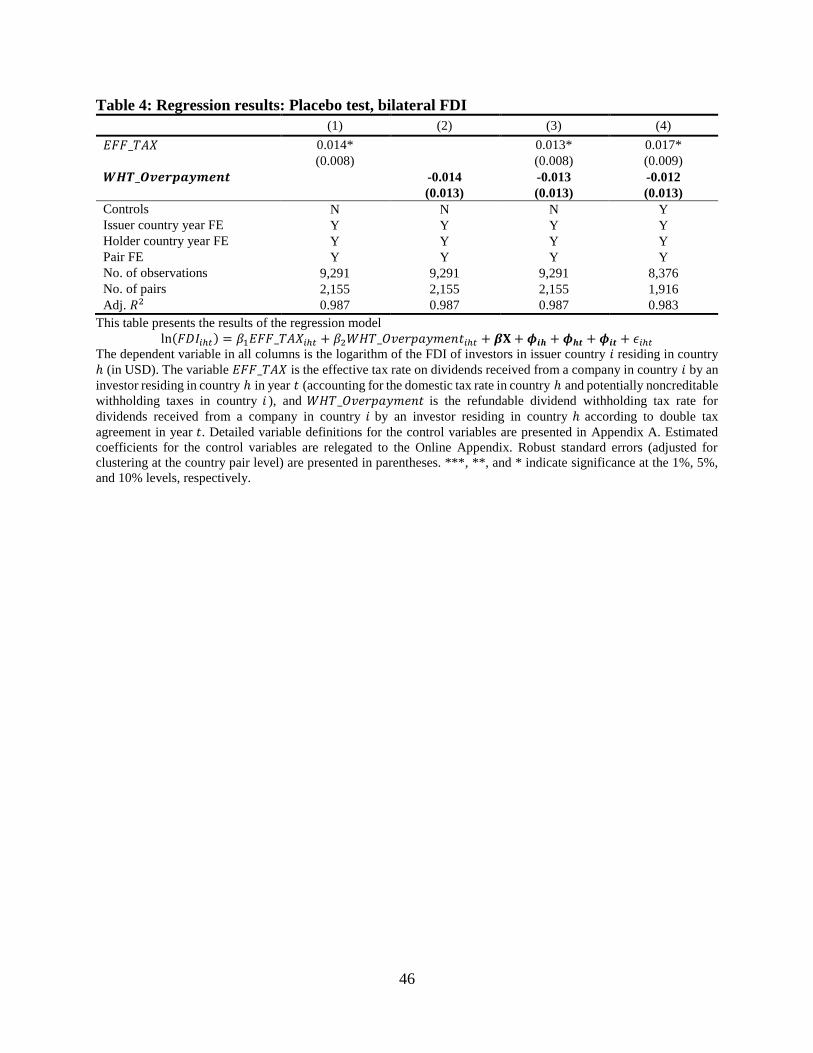
46
Table 4: Regression results: Placebo test, bilateral FDI
(1) (2) (3) (4)
𝐸𝐹𝐹_𝑇𝐴𝑋 0.014* 0.013* 0.017*
(0.008) (0.008) (0.009)
𝑾𝑯𝑻_𝑶𝒗𝒆𝒓𝒑𝒂𝒚𝒎𝒆𝒏𝒕 -0.014 -0.013 -0.012
(0.013) (0.013) (0.013)
Controls N N N Y
Issuer country year FE Y Y Y Y
Holder country year FE Y Y Y Y
Pair FE Y Y Y Y
No. of observations 9,291 9,291 9,291 8,376
No. of pairs 2,155 2,155 2,155 1,916
Adj. 𝑅2 0.987 0.987 0.987 0.983
This table presents the results of the regression model
ln(𝐹𝐷𝐼𝑖ℎ𝑡) = 𝛽1𝐸𝐹𝐹_𝑇𝐴𝑋𝑖ℎ𝑡 + 𝛽2𝑊𝐻𝑇_𝑂𝑣𝑒𝑟𝑝𝑎𝑦𝑚𝑒𝑛𝑡𝑖ℎ𝑡 + 𝜷𝐗 + 𝝓𝒊𝒉 + 𝝓𝒉𝒕 + 𝝓𝒊𝒕 + 𝜖𝑖ℎ𝑡
The dependent variable in all columns is the logarithm of the FDI of investors in issuer country 𝑖 residing in country
ℎ (in USD). The variable 𝐸𝐹𝐹_𝑇𝐴𝑋 is the effective tax rate on dividends received from a company in country 𝑖 by an
investor residing in country ℎ in year 𝑡 (accounting for the domestic tax rate in country ℎ and potentially noncreditable
withholding taxes in country 𝑖 ), and 𝑊𝐻𝑇_𝑂𝑣𝑒𝑟𝑝𝑎𝑦𝑚𝑒𝑛𝑡 is the refundable dividend withholding tax rate for
dividends received from a company in country 𝑖 by an investor residing in country ℎ according to double tax
agreement in year 𝑡. Detailed variable definitions for the control variables are presented in Appendix A. Estimated
coefficients for the control variables are relegated to the Online Appendix. Robust standard errors (adjusted for
clustering at the country pair level) are presented in parentheses. ***, **, and * indicate significance at the 1%, 5%,
and 10% levels, respectively.
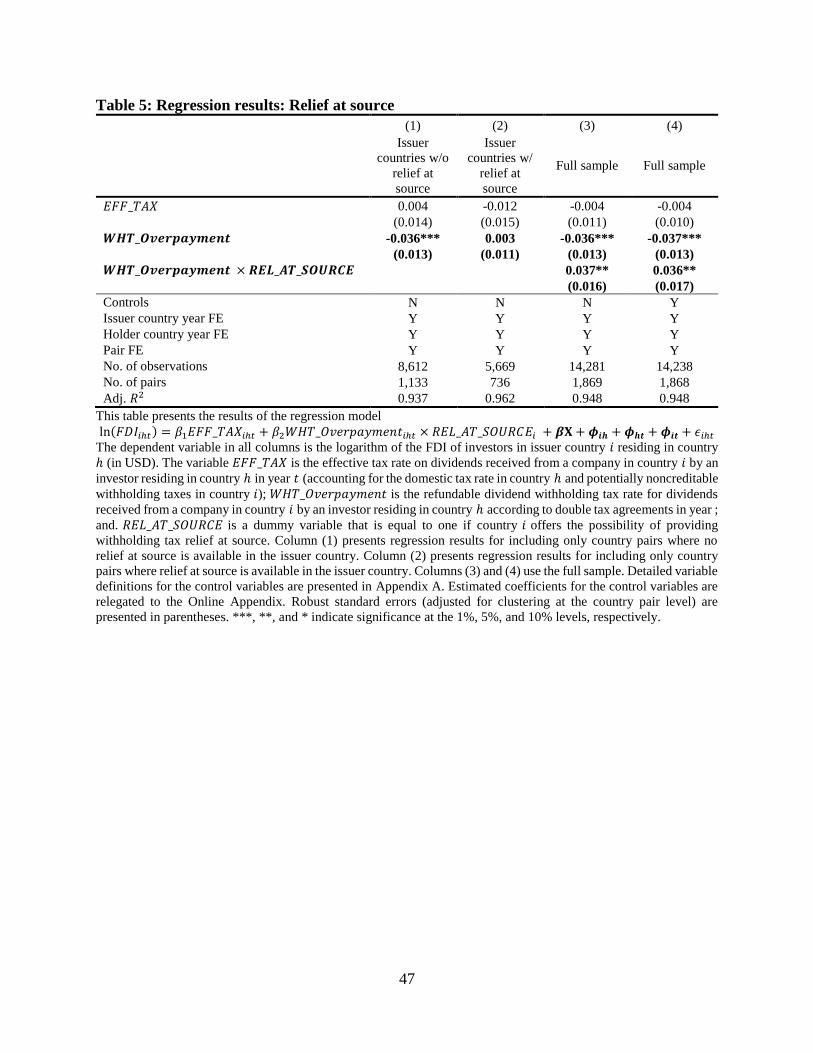
47
Table 5: Regression results: Relief at source
(1) (2) (3) (4)
Issuer
countries w/o
relief at
source
Issuer
countries w/
relief at
source
Full sample Full sample
𝐸𝐹𝐹_𝑇𝐴𝑋 0.004 -0.012 -0.004 -0.004
(0.014) (0.015) (0.011) (0.010)
𝑾𝑯𝑻_𝑶𝒗𝒆𝒓𝒑𝒂𝒚𝒎𝒆𝒏𝒕 -0.036*** 0.003 -0.036*** -0.037***
(0.013) (0.011) (0.013) (0.013)
𝑾𝑯𝑻_𝑶𝒗𝒆𝒓𝒑𝒂𝒚𝒎𝒆𝒏𝒕 × 𝑹𝑬𝑳_𝑨𝑻_𝑺𝑶𝑼𝑹𝑪𝑬 0.037** 0.036**
(0.016) (0.017)
Controls N N N Y
Issuer country year FE Y Y Y Y
Holder country year FE Y Y Y Y
Pair FE Y Y Y Y
No. of observations 8,612 5,669 14,281 14,238
No. of pairs 1,133 736 1,869 1,868
Adj. 𝑅2 0.937 0.962 0.948 0.948
This table presents the results of the regression model
ln(𝐹𝐷𝐼𝑖ℎ𝑡) = 𝛽1𝐸𝐹𝐹_𝑇𝐴𝑋𝑖ℎ𝑡 + 𝛽2𝑊𝐻𝑇_𝑂𝑣𝑒𝑟𝑝𝑎𝑦𝑚𝑒𝑛𝑡𝑖ℎ𝑡 × 𝑅𝐸𝐿_𝐴𝑇_𝑆𝑂𝑈𝑅𝐶𝐸𝑖 + 𝜷𝐗 + 𝝓𝒊𝒉 + 𝝓𝒉𝒕 + 𝝓𝒊𝒕 + 𝜖𝑖ℎ𝑡
The dependent variable in all columns is the logarithm of the FDI of investors in issuer country 𝑖 residing in country
ℎ (in USD). The variable 𝐸𝐹𝐹_𝑇𝐴𝑋 is the effective tax rate on dividends received from a company in country 𝑖 by an
investor residing in country ℎ in year 𝑡 (accounting for the domestic tax rate in country ℎ and potentially noncreditable
withholding taxes in country 𝑖); 𝑊𝐻𝑇_𝑂𝑣𝑒𝑟𝑝𝑎𝑦𝑚𝑒𝑛𝑡 is the refundable dividend withholding tax rate for dividends
received from a company in country 𝑖 by an investor residing in country ℎ according to double tax agreements in year ;
and. 𝑅𝐸𝐿_𝐴𝑇_𝑆𝑂𝑈𝑅𝐶𝐸 is a dummy variable that is equal to one if country 𝑖 offers the possibility of providing
withholding tax relief at source. Column (1) presents regression results for including only country pairs where no
relief at source is available in the issuer country. Column (2) presents regression results for including only country
pairs where relief at source is available in the issuer country. Columns (3) and (4) use the full sample. Detailed variable
definitions for the control variables are presented in Appendix A. Estimated coefficients for the control variables are
relegated to the Online Appendix. Robust standard errors (adjusted for clustering at the country pair level) are
presented in parentheses. ***, **, and * indicate significance at the 1%, 5%, and 10% levels, respectively.
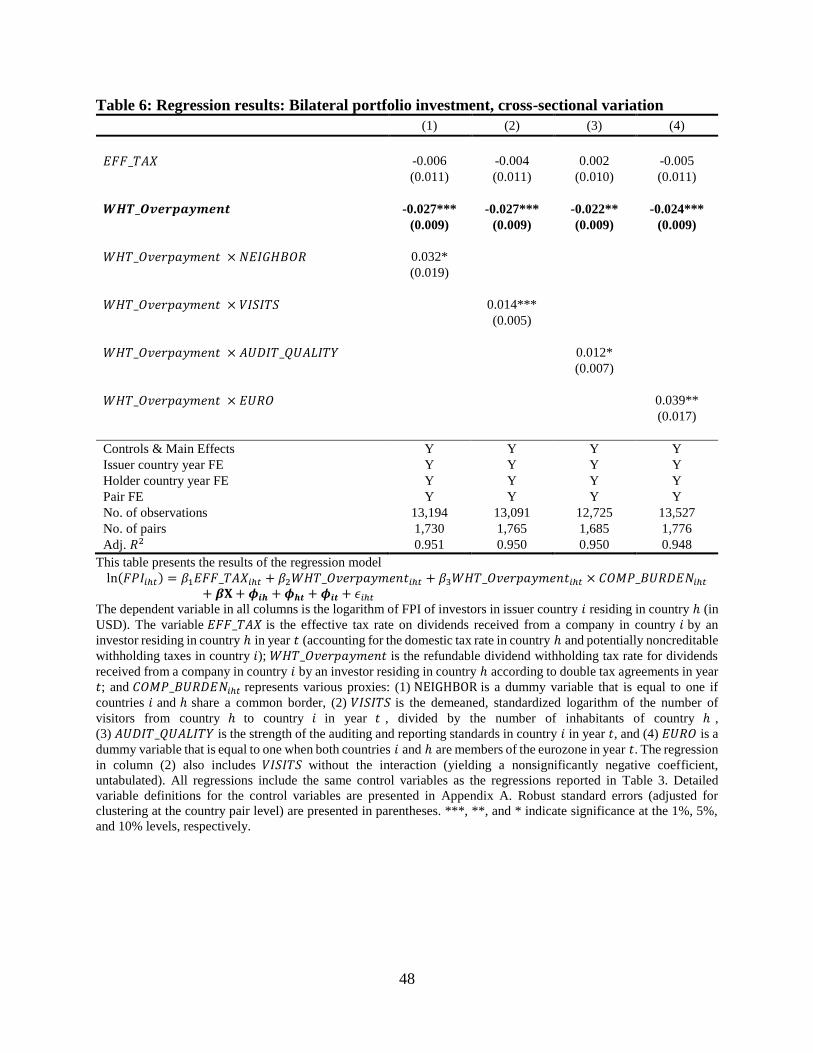
48
Table 6: Regression results: Bilateral portfolio investment, cross-sectional variation
(1) (2) (3) (4)
𝐸𝐹𝐹_𝑇𝐴𝑋 -0.006 -0.004 0.002 -0.005
(0.011) (0.011) (0.010) (0.011)
𝑾𝑯𝑻_𝑶𝒗𝒆𝒓𝒑𝒂𝒚𝒎𝒆𝒏𝒕 -0.027*** -0.027*** -0.022** -0.024***
(0.009) (0.009) (0.009) (0.009)
𝑊𝐻𝑇_𝑂𝑣𝑒𝑟𝑝𝑎𝑦𝑚𝑒𝑛𝑡 × 𝑁𝐸𝐼𝐺𝐻𝐵𝑂𝑅 0.032*
(0.019)
𝑊𝐻𝑇_𝑂𝑣𝑒𝑟𝑝𝑎𝑦𝑚𝑒𝑛𝑡 × 𝑉𝐼𝑆𝐼𝑇𝑆 0.014***
(0.005)
𝑊𝐻𝑇_𝑂𝑣𝑒𝑟𝑝𝑎𝑦𝑚𝑒𝑛𝑡 × 𝐴𝑈𝐷𝐼𝑇_𝑄𝑈𝐴𝐿𝐼𝑇𝑌 0.012*
(0.007)
𝑊𝐻𝑇_𝑂𝑣𝑒𝑟𝑝𝑎𝑦𝑚𝑒𝑛𝑡 × 𝐸𝑈𝑅𝑂 0.039**
(0.017)
Controls & Main Effects Y Y Y Y
Issuer country year FE Y Y Y Y
Holder country year FE Y Y Y Y
Pair FE Y Y Y Y
No. of observations 13,194 13,091 12,725 13,527
No. of pairs 1,730 1,765 1,685 1,776
Adj. 𝑅2 0.951 0.950 0.950 0.948
This table presents the results of the regression model
ln(𝐹𝑃𝐼𝑖ℎ𝑡) = 𝛽1𝐸𝐹𝐹_𝑇𝐴𝑋𝑖ℎ𝑡 + 𝛽2𝑊𝐻𝑇_𝑂𝑣𝑒𝑟𝑝𝑎𝑦𝑚𝑒𝑛𝑡𝑖ℎ𝑡 + 𝛽3𝑊𝐻𝑇_𝑂𝑣𝑒𝑟𝑝𝑎𝑦𝑚𝑒𝑛𝑡𝑖ℎ𝑡 × 𝐶𝑂𝑀𝑃_𝐵𝑈𝑅𝐷𝐸𝑁𝑖ℎ𝑡
+ 𝜷𝐗 + 𝝓𝒊𝒉 + 𝝓𝒉𝒕 + 𝝓𝒊𝒕 + 𝜖𝑖ℎ𝑡
The dependent variable in all columns is the logarithm of FPI of investors in issuer country 𝑖 residing in country ℎ (in
USD). The variable 𝐸𝐹𝐹_𝑇𝐴𝑋 is the effective tax rate on dividends received from a company in country 𝑖 by an
investor residing in country ℎ in year 𝑡 (accounting for the domestic tax rate in country ℎ and potentially noncreditable
withholding taxes in country 𝑖); 𝑊𝐻𝑇_𝑂𝑣𝑒𝑟𝑝𝑎𝑦𝑚𝑒𝑛𝑡 is the refundable dividend withholding tax rate for dividends
received from a company in country 𝑖 by an investor residing in country ℎ according to double tax agreements in year
𝑡; and 𝐶𝑂𝑀𝑃_𝐵𝑈𝑅𝐷𝐸𝑁𝑖ℎ𝑡 represents various proxies: (1) NEIGHBOR is a dummy variable that is equal to one if
countries 𝑖 and ℎ share a common border, (2) 𝑉𝐼𝑆𝐼𝑇𝑆 is the demeaned, standardized logarithm of the number of
visitors from country ℎ to country 𝑖 in year 𝑡 , divided by the number of inhabitants of country ℎ ,
(3) 𝐴𝑈𝐷𝐼𝑇_𝑄𝑈𝐴𝐿𝐼𝑇𝑌 is the strength of the auditing and reporting standards in country 𝑖 in year 𝑡, and (4) 𝐸𝑈𝑅𝑂 is a
dummy variable that is equal to one when both countries 𝑖 and ℎ are members of the eurozone in year 𝑡. The regression
in column (2) also includes 𝑉𝐼𝑆𝐼𝑇𝑆 without the interaction (yielding a nonsignificantly negative coefficient,
untabulated). All regressions include the same control variables as the regressions reported in Table 3. Detailed
variable definitions for the control variables are presented in Appendix A. Robust standard errors (adjusted for
clustering at the country pair level) are presented in parentheses. ***, **, and * indicate significance at the 1%, 5%,
and 10% levels, respectively.
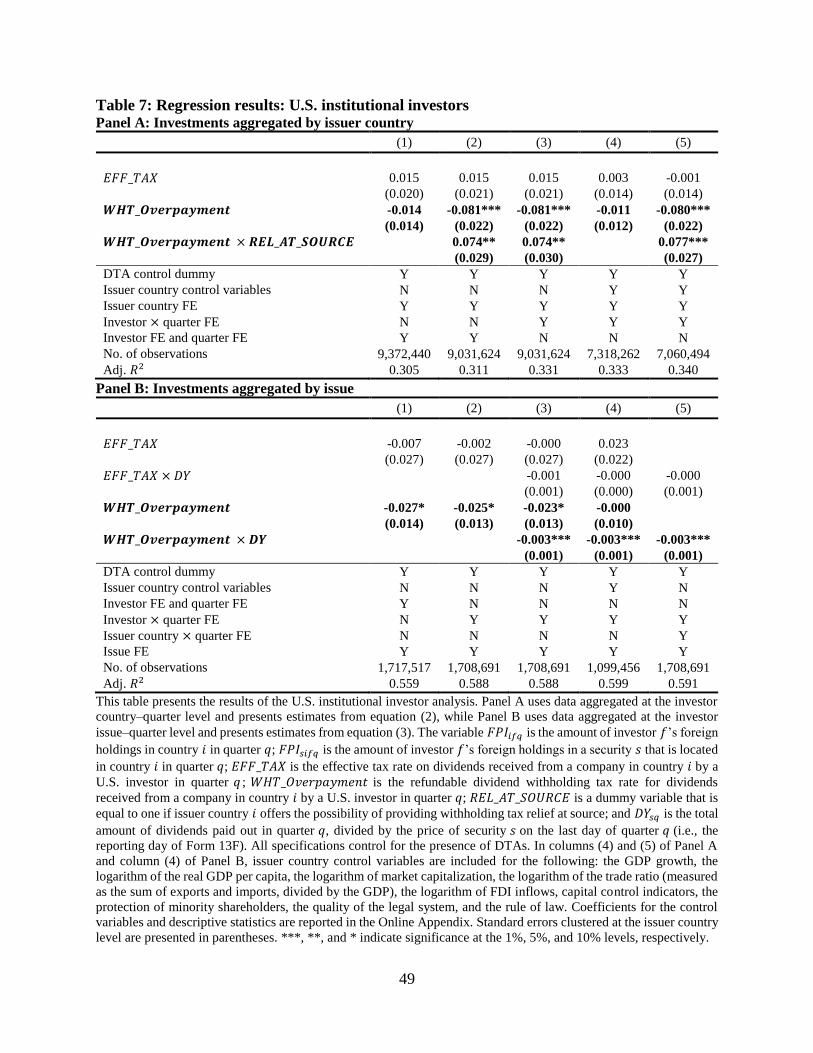
49
Table 7: Regression results: U.S. institutional investors Panel A: Investments aggregated by issuer country
(1) (2) (3) (4) (5)
𝐸𝐹𝐹_𝑇𝐴𝑋 0.015 0.015 0.015 0.003 -0.001
(0.020) (0.021) (0.021) (0.014) (0.014)
𝑾𝑯𝑻_𝑶𝒗𝒆𝒓𝒑𝒂𝒚𝒎𝒆𝒏𝒕 -0.014 -0.081*** -0.081*** -0.011 -0.080***
(0.014) (0.022) (0.022) (0.012) (0.022)
𝑾𝑯𝑻_𝑶𝒗𝒆𝒓𝒑𝒂𝒚𝒎𝒆𝒏𝒕 × 𝑹𝑬𝑳_𝑨𝑻_𝑺𝑶𝑼𝑹𝑪𝑬 0.074** 0.074** 0.077***
(0.029) (0.030) (0.027)
DTA control dummy Y Y Y Y Y
Issuer country control variables N N N Y Y
Issuer country FE Y Y Y Y Y
Investor × quarter FE N N Y Y Y
Investor FE and quarter FE Y Y N N N
No. of observations 9,372,440 9,031,624 9,031,624 7,318,262 7,060,494
Adj. 𝑅2 0.305 0.311 0.331 0.333 0.340
Panel B: Investments aggregated by issue
(1) (2) (3) (4) (5)
𝐸𝐹𝐹_𝑇𝐴𝑋 -0.007 -0.002 -0.000 0.023
(0.027) (0.027) (0.027) (0.022)
𝐸𝐹𝐹_𝑇𝐴𝑋 × 𝐷𝑌 -0.001 -0.000 -0.000
(0.001) (0.000) (0.001)
𝑾𝑯𝑻_𝑶𝒗𝒆𝒓𝒑𝒂𝒚𝒎𝒆𝒏𝒕 -0.027* -0.025* -0.023* -0.000
(0.014) (0.013) (0.013) (0.010)
𝑾𝑯𝑻_𝑶𝒗𝒆𝒓𝒑𝒂𝒚𝒎𝒆𝒏𝒕 × 𝑫𝒀 -0.003*** -0.003*** -0.003***
(0.001) (0.001) (0.001)
DTA control dummy Y Y Y Y Y
Issuer country control variables N N N Y N
Investor FE and quarter FE Y N N N N
Investor × quarter FE N Y Y Y Y
Issuer country × quarter FE N N N N Y
Issue FE Y Y Y Y Y
No. of observations 1,717,517 1,708,691 1,708,691 1,099,456 1,708,691
Adj. 𝑅2 0.559 0.588 0.588 0.599 0.591
This table presents the results of the U.S. institutional investor analysis. Panel A uses data aggregated at the investor
country–quarter level and presents estimates from equation (2), while Panel B uses data aggregated at the investor
issue–quarter level and presents estimates from equation (3). The variable 𝐹𝑃𝐼𝑖𝑓𝑞 is the amount of investor 𝑓’s foreign
holdings in country 𝑖 in quarter 𝑞; 𝐹𝑃𝐼𝑠𝑖𝑓𝑞 is the amount of investor 𝑓’s foreign holdings in a security 𝑠 that is located
in country 𝑖 in quarter 𝑞; 𝐸𝐹𝐹_𝑇𝐴𝑋 is the effective tax rate on dividends received from a company in country 𝑖 by a
U.S. investor in quarter 𝑞 ; 𝑊𝐻𝑇_𝑂𝑣𝑒𝑟𝑝𝑎𝑦𝑚𝑒𝑛𝑡 is the refundable dividend withholding tax rate for dividends
received from a company in country 𝑖 by a U.S. investor in quarter 𝑞; 𝑅𝐸𝐿_𝐴𝑇_𝑆𝑂𝑈𝑅𝐶𝐸 is a dummy variable that is
equal to one if issuer country 𝑖 offers the possibility of providing withholding tax relief at source; and 𝐷𝑌𝑠𝑞 is the total
amount of dividends paid out in quarter 𝑞, divided by the price of security 𝑠 on the last day of quarter 𝑞 (i.e., the
reporting day of Form 13F). All specifications control for the presence of DTAs. In columns (4) and (5) of Panel A
and column (4) of Panel B, issuer country control variables are included for the following: the GDP growth, the
logarithm of the real GDP per capita, the logarithm of market capitalization, the logarithm of the trade ratio (measured
as the sum of exports and imports, divided by the GDP), the logarithm of FDI inflows, capital control indicators, the
protection of minority shareholders, the quality of the legal system, and the rule of law. Coefficients for the control
variables and descriptive statistics are reported in the Online Appendix. Standard errors clustered at the issuer country
level are presented in parentheses. ***, **, and * indicate significance at the 1%, 5%, and 10% levels, respectively.
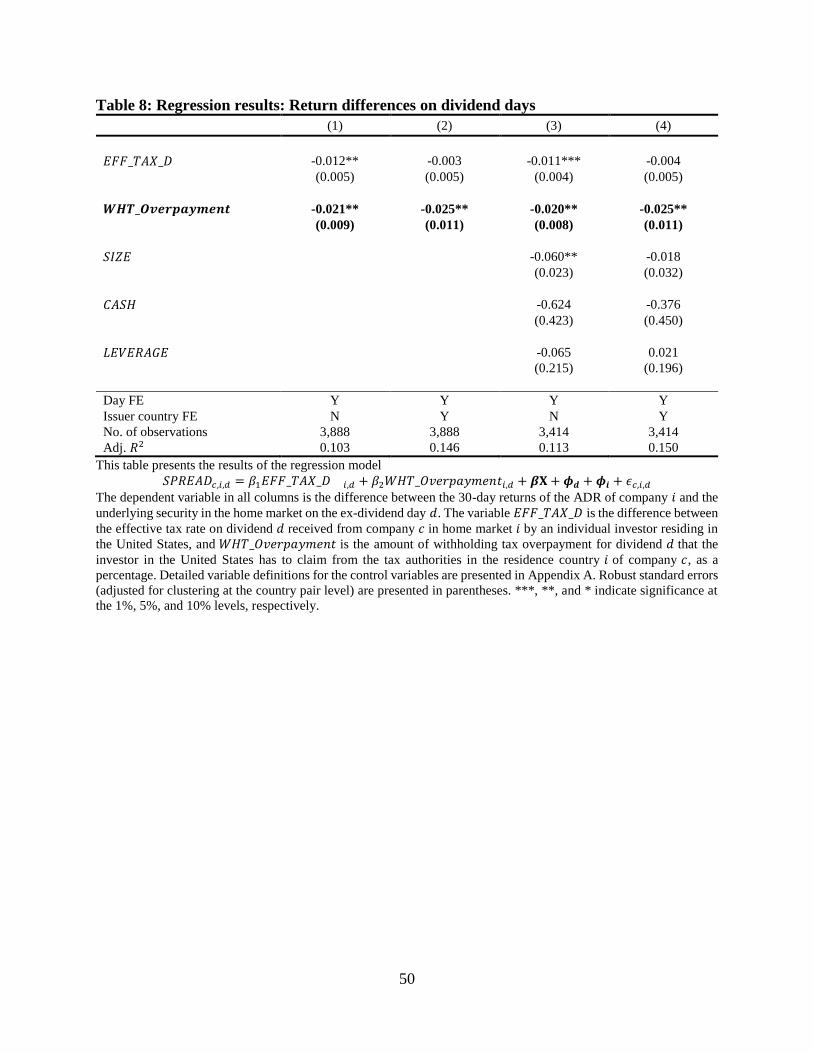
50
Table 8: Regression results: Return differences on dividend days
(1) (2) (3) (4)
𝐸𝐹𝐹_𝑇𝐴𝑋_𝐷 -0.012** -0.003 -0.011*** -0.004
(0.005) (0.005) (0.004) (0.005)
𝑾𝑯𝑻_𝑶𝒗𝒆𝒓𝒑𝒂𝒚𝒎𝒆𝒏𝒕 -0.021** -0.025** -0.020** -0.025**
(0.009) (0.011) (0.008) (0.011)
𝑆𝐼𝑍𝐸 -0.060** -0.018
(0.023) (0.032)
𝐶𝐴𝑆𝐻 -0.624 -0.376
(0.423) (0.450)
𝐿𝐸𝑉𝐸𝑅𝐴𝐺𝐸 -0.065 0.021
(0.215) (0.196)
Day FE Y Y Y Y
Issuer country FE N Y N Y
No. of observations 3,888 3,888 3,414 3,414
Adj. 𝑅2 0.103 0.146 0.113 0.150
This table presents the results of the regression model
𝑆𝑃𝑅𝐸𝐴𝐷𝑐,𝑖,𝑑 = 𝛽1𝐸𝐹𝐹_𝑇𝐴𝑋_𝐷 𝑖,𝑑 + 𝛽2𝑊𝐻𝑇_𝑂𝑣𝑒𝑟𝑝𝑎𝑦𝑚𝑒𝑛𝑡𝑖,𝑑 + 𝜷𝐗 + 𝝓𝒅 + 𝝓𝒊 + 𝜖𝑐,𝑖,𝑑
The dependent variable in all columns is the difference between the 30-day returns of the ADR of company 𝑖 and the
underlying security in the home market on the ex-dividend day 𝑑. The variable 𝐸𝐹𝐹_𝑇𝐴𝑋_𝐷 is the difference between
the effective tax rate on dividend 𝑑 received from company 𝑐 in home market 𝑖 by an individual investor residing in
the United States, and 𝑊𝐻𝑇_𝑂𝑣𝑒𝑟𝑝𝑎𝑦𝑚𝑒𝑛𝑡 is the amount of withholding tax overpayment for dividend 𝑑 that the
investor in the United States has to claim from the tax authorities in the residence country 𝑖 of company 𝑐, as a
percentage. Detailed variable definitions for the control variables are presented in Appendix A. Robust standard errors
(adjusted for clustering at the country pair level) are presented in parentheses. ***, **, and * indicate significance at
the 1%, 5%, and 10% levels, respectively.
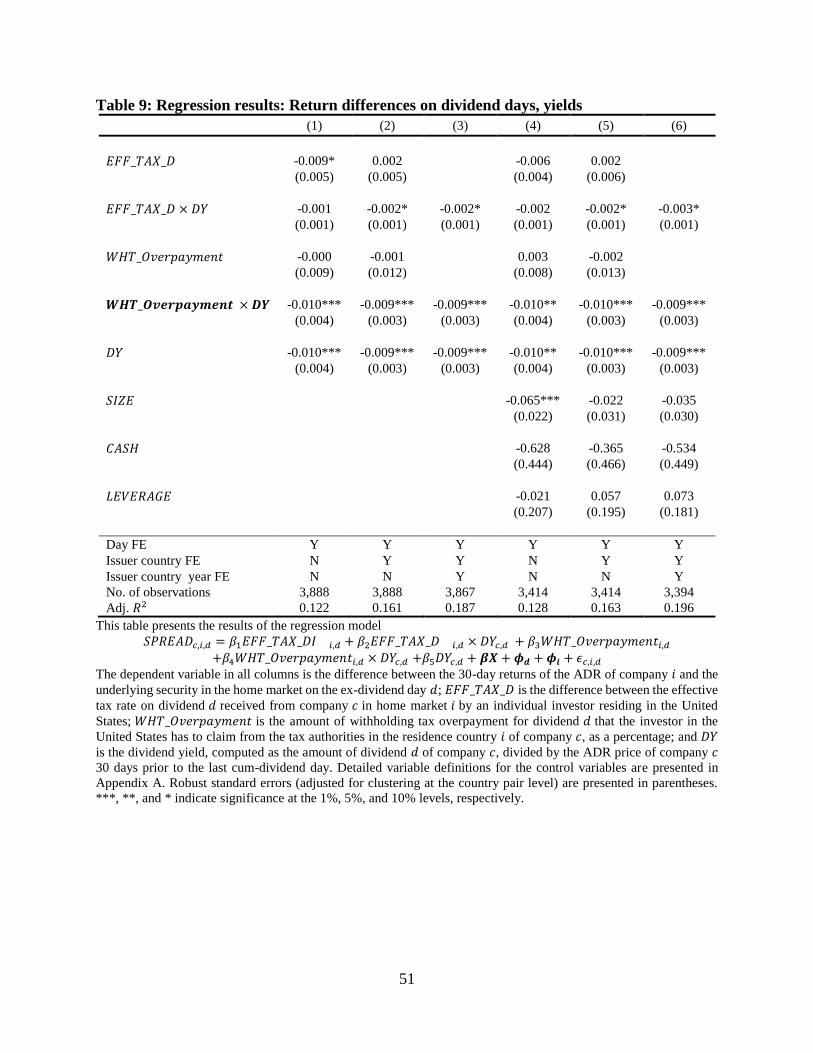
51
Table 9: Regression results: Return differences on dividend days, yields
(1) (2) (3) (4) (5) (6)
𝐸𝐹𝐹_𝑇𝐴𝑋_𝐷 -0.009* 0.002 -0.006 0.002
(0.005) (0.005) (0.004) (0.006)
𝐸𝐹𝐹_𝑇𝐴𝑋_𝐷 × 𝐷𝑌 -0.001 -0.002* -0.002* -0.002 -0.002* -0.003*
(0.001) (0.001) (0.001) (0.001) (0.001) (0.001)
𝑊𝐻𝑇_𝑂𝑣𝑒𝑟𝑝𝑎𝑦𝑚𝑒𝑛𝑡 -0.000 -0.001 0.003 -0.002
(0.009) (0.012) (0.008) (0.013)
𝑾𝑯𝑻_𝑶𝒗𝒆𝒓𝒑𝒂𝒚𝒎𝒆𝒏𝒕 × 𝑫𝒀 -0.010*** -0.009*** -0.009*** -0.010** -0.010*** -0.009***
(0.004) (0.003) (0.003) (0.004) (0.003) (0.003)
𝐷𝑌 -0.010*** -0.009*** -0.009*** -0.010** -0.010*** -0.009***
(0.004) (0.003) (0.003) (0.004) (0.003) (0.003)
𝑆𝐼𝑍𝐸 -0.065*** -0.022 -0.035
(0.022) (0.031) (0.030)
𝐶𝐴𝑆𝐻 -0.628 -0.365 -0.534
(0.444) (0.466) (0.449)
𝐿𝐸𝑉𝐸𝑅𝐴𝐺𝐸 -0.021 0.057 0.073
(0.207) (0.195) (0.181)
Day FE Y Y Y Y Y Y
Issuer country FE N Y Y N Y Y
Issuer country year FE N N Y N N Y
No. of observations 3,888 3,888 3,867 3,414 3,414 3,394
Adj. 𝑅2 0.122 0.161 0.187 0.128 0.163 0.196
This table presents the results of the regression model
𝑆𝑃𝑅𝐸𝐴𝐷𝑐,𝑖,𝑑 = 𝛽1𝐸𝐹𝐹_𝑇𝐴𝑋_𝐷𝐼 𝑖,𝑑 + 𝛽2𝐸𝐹𝐹_𝑇𝐴𝑋_𝐷 𝑖,𝑑 × 𝐷𝑌𝑐,𝑑 + 𝛽3𝑊𝐻𝑇_𝑂𝑣𝑒𝑟𝑝𝑎𝑦𝑚𝑒𝑛𝑡𝑖,𝑑
+𝛽4𝑊𝐻𝑇_𝑂𝑣𝑒𝑟𝑝𝑎𝑦𝑚𝑒𝑛𝑡𝑖,𝑑 × 𝐷𝑌𝑐,𝑑 +𝛽5𝐷𝑌𝑐,𝑑 + 𝜷𝑿 + 𝝓𝒅 + 𝝓𝒊 + 𝜖𝑐,𝑖,𝑑
The dependent variable in all columns is the difference between the 30-day returns of the ADR of company 𝑖 and the
underlying security in the home market on the ex-dividend day 𝑑; 𝐸𝐹𝐹_𝑇𝐴𝑋_𝐷 is the difference between the effective
tax rate on dividend 𝑑 received from company 𝑐 in home market 𝑖 by an individual investor residing in the United
States; 𝑊𝐻𝑇_𝑂𝑣𝑒𝑟𝑝𝑎𝑦𝑚𝑒𝑛𝑡 is the amount of withholding tax overpayment for dividend 𝑑 that the investor in the
United States has to claim from the tax authorities in the residence country 𝑖 of company 𝑐, as a percentage; and 𝐷𝑌
is the dividend yield, computed as the amount of dividend 𝑑 of company 𝑐, divided by the ADR price of company 𝑐
30 days prior to the last cum-dividend day. Detailed variable definitions for the control variables are presented in
Appendix A. Robust standard errors (adjusted for clustering at the country pair level) are presented in parentheses.
***, **, and * indicate significance at the 1%, 5%, and 10% levels, respectively.
1
Online Appendix to
“Withholding Taxes and Foreign Portfolio Investment”
Martin Jacob and Maximilian Todtenhaupt
OA.1 Firm-Level Effects of FPI
We assess the potential costs of having reduced FPI. Since one potential benefit of high
withholding tax overpayments from the government’s perspective relates to higher tax revenues,
reduced FPI could have costs if it is correlated with firm-level investment and, thus, economic
growth. We therefore examine the role of FPI on firm-level investment. To do so, we use data
from Compustat Global and Compustat North America for 60 countries over the period 2001–
2015 for which we were able to obtain not only firm-level information, but also country-level
characteristics. We then regress corporate investment, defined as capital expenditures over the
prior year’s total assets, on firm-level control variables, following prior literature (e.g., Baker et
al. 2003). Specifically, we control for the ratio of cash flow to total assets, leverage, Tobin’s Q,
sales growth, and firm size. All firm-level variables are winsorized at the first and 99th
percentiles. At the country level, we control for several economic characteristics (the level of the
GDP, GDP growth, the inflation rate, the unemployment rate, interest payments by the
government as a percentage of the GDP), the six World Governance Indicators, and four
different tax rate variables (corporate tax, value-added tax, personal income tax on wages, and
dividend taxes). Country-level variables are obtained from the World Bank, and tax rates are
from Jacob et al. (2019). We include firm fixed effects, as well as Fama–French 48 industry–year
fixed effects. Standard errors are clustered at the country level. As our main variable of interest,
we include (the natural logarithm of) the total FPI in a country. To control for overall foreign
2
investment flows, we also control for FDI. To ease the interpretation of FPI, we standardize FPI
to have a mean of zero and a standard deviation of one.
Table OA.1 reports the regression results. We find a positive and significant association
between FPI and firm-level investment. The coefficient estimate suggests that a one standard
deviation increase in FPI inflows in a country is associated with an increase in investment of
1.41% relative to total assets. This result suggests that FPI can potentially help firms to fund
investments. To test this prediction further, we run two cross-sectional tests. First, we examine
whether FPI can reduce the sensitivity of investment to internal cash flows. Second, using size as
a proxy for frictions in financing investments (e.g., Hadlock and Pierce 2010), we examine
whether FPI can reduce financing frictions. The results are reported in columns (2) and (3),
respectively. Consistent with the argument that FPI can help firms overcome financing frictions,
we find negative coefficients for Cash Flow × FPI and Size × FPI. This result indicates that,
when more FPI flows into a country, firm investments become less sensitive to internal cash
flows or financial frictions. It thus appears that FPI is a relevant source of financing for firms
seeking capital to invest and that it can alleviate the financing frictions of financially constrained
firms.
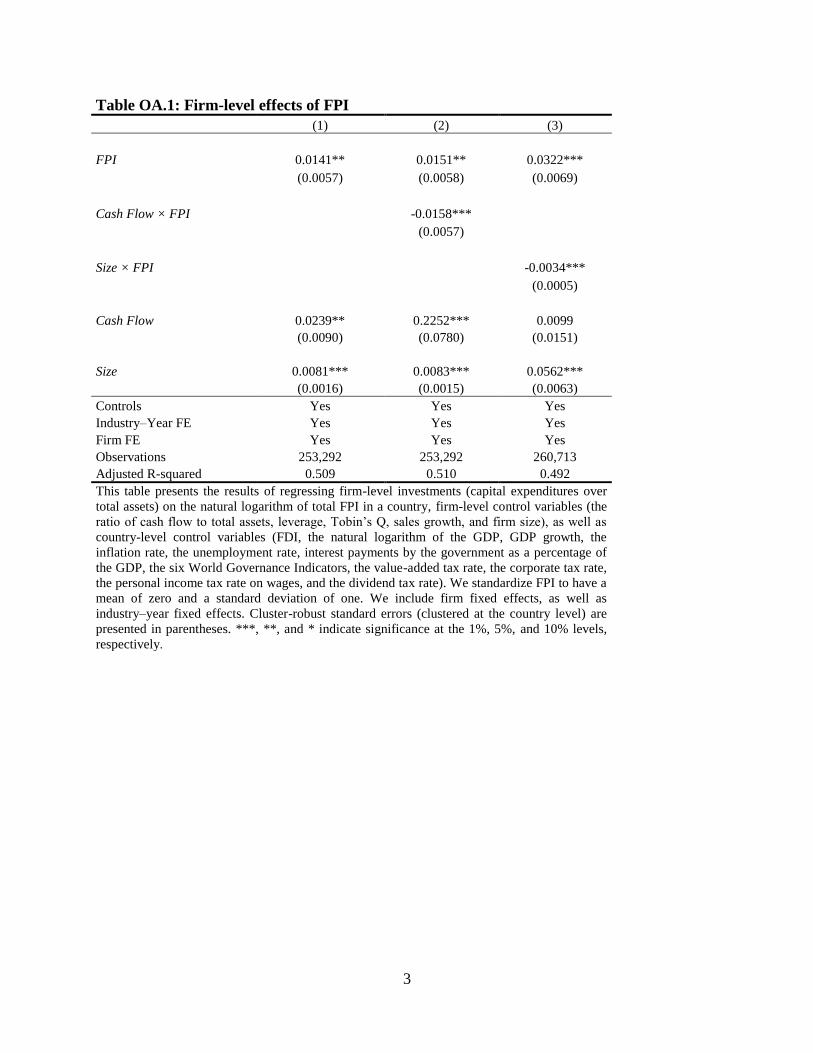
3
Table OA.1: Firm-level effects of FPI
(1) (2) (3)
FPI 0.0141** 0.0151** 0.0322***
(0.0057) (0.0058) (0.0069)
Cash Flow × FPI -0.0158***
(0.0057)
Size × FPI -0.0034***
(0.0005)
Cash Flow 0.0239** 0.2252*** 0.0099
(0.0090) (0.0780) (0.0151)
Size 0.0081*** 0.0083*** 0.0562***
(0.0016) (0.0015) (0.0063)
Controls Yes Yes Yes
Industry–Year FE Yes Yes Yes
Firm FE Yes Yes Yes
Observations 253,292 253,292 260,713
Adjusted R-squared 0.509 0.510 0.492
This table presents the results of regressing firm-level investments (capital expenditures over
total assets) on the natural logarithm of total FPI in a country, firm-level control variables (the
ratio of cash flow to total assets, leverage, Tobin’s Q, sales growth, and firm size), as well as
country-level control variables (FDI, the natural logarithm of the GDP, GDP growth, the
inflation rate, the unemployment rate, interest payments by the government as a percentage of
the GDP, the six World Governance Indicators, the value-added tax rate, the corporate tax rate,
the personal income tax rate on wages, and the dividend tax rate). We standardize FPI to have a
mean of zero and a standard deviation of one. We include firm fixed effects, as well as
industry–year fixed effects. Cluster-robust standard errors (clustered at the country level) are
presented in parentheses. ***, **, and * indicate significance at the 1%, 5%, and 10% levels,
respectively.
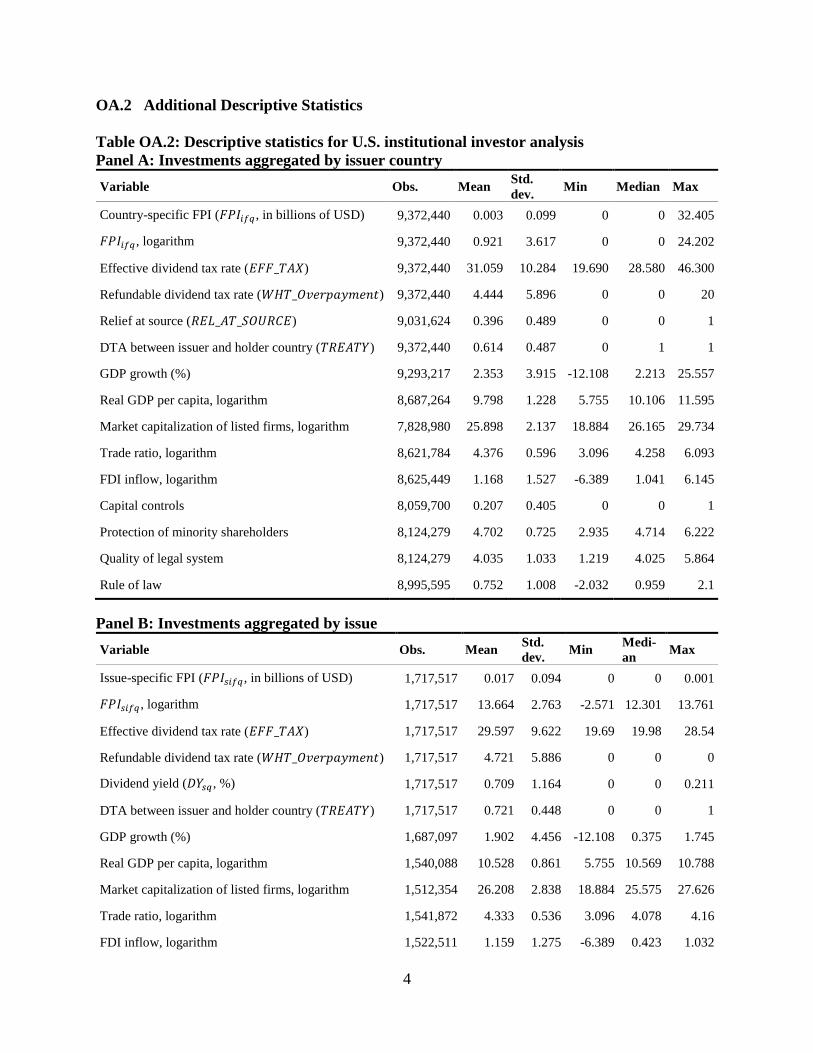
4
OA.2 Additional Descriptive Statistics
Table OA.2: Descriptive statistics for U.S. institutional investor analysis
Panel A: Investments aggregated by issuer country
Variable Obs. Mean Std.
dev. Min Median Max
Country-specific FPI (𝐹𝑃𝐼𝑖𝑓𝑞 , in billions of USD) 9,372,440 0.003 0.099 0 0 32.405
𝐹𝑃𝐼𝑖𝑓𝑞 , logarithm 9,372,440 0.921 3.617 0 0 24.202
Effective dividend tax rate (𝐸𝐹𝐹_𝑇𝐴𝑋) 9,372,440 31.059 10.284 19.690 28.580 46.300
Refundable dividend tax rate (𝑊𝐻𝑇_𝑂𝑣𝑒𝑟𝑝𝑎𝑦𝑚𝑒𝑛𝑡) 9,372,440 4.444 5.896 0 0 20
Relief at source (𝑅𝐸𝐿_𝐴𝑇_𝑆𝑂𝑈𝑅𝐶𝐸) 9,031,624 0.396 0.489 0 0 1
DTA between issuer and holder country (𝑇𝑅𝐸𝐴𝑇𝑌) 9,372,440 0.614 0.487 0 1 1
GDP growth (%) 9,293,217 2.353 3.915 -12.108 2.213 25.557
Real GDP per capita, logarithm 8,687,264 9.798 1.228 5.755 10.106 11.595
Market capitalization of listed firms, logarithm 7,828,980 25.898 2.137 18.884 26.165 29.734
Trade ratio, logarithm 8,621,784 4.376 0.596 3.096 4.258 6.093
FDI inflow, logarithm 8,625,449 1.168 1.527 -6.389 1.041 6.145
Capital controls 8,059,700 0.207 0.405 0 0 1
Protection of minority shareholders 8,124,279 4.702 0.725 2.935 4.714 6.222
Quality of legal system 8,124,279 4.035 1.033 1.219 4.025 5.864
Rule of law 8,995,595 0.752 1.008 -2.032 0.959 2.1
Panel B: Investments aggregated by issue
Variable Obs. Mean Std.
dev. Min
Medi-
an Max
Issue-specific FPI (𝐹𝑃𝐼𝑠𝑖𝑓𝑞 , in billions of USD) 1,717,517 0.017 0.094 0 0 0.001
𝐹𝑃𝐼𝑠𝑖𝑓𝑞 , logarithm 1,717,517 13.664 2.763 -2.571 12.301 13.761
Effective dividend tax rate (𝐸𝐹𝐹_𝑇𝐴𝑋) 1,717,517 29.597 9.622 19.69 19.98 28.54
Refundable dividend tax rate (𝑊𝐻𝑇_𝑂𝑣𝑒𝑟𝑝𝑎𝑦𝑚𝑒𝑛𝑡) 1,717,517 4.721 5.886 0 0 0
Dividend yield (𝐷𝑌𝑠𝑞 , %) 1,717,517 0.709 1.164 0 0 0.211
DTA between issuer and holder country (𝑇𝑅𝐸𝐴𝑇𝑌) 1,717,517 0.721 0.448 0 0 1
GDP growth (%) 1,687,097 1.902 4.456 -12.108 0.375 1.745
Real GDP per capita, logarithm 1,540,088 10.528 0.861 5.755 10.569 10.788
Market capitalization of listed firms, logarithm 1,512,354 26.208 2.838 18.884 25.575 27.626
Trade ratio, logarithm 1,541,872 4.333 0.536 3.096 4.078 4.16
FDI inflow, logarithm 1,522,511 1.159 1.275 -6.389 0.423 1.032
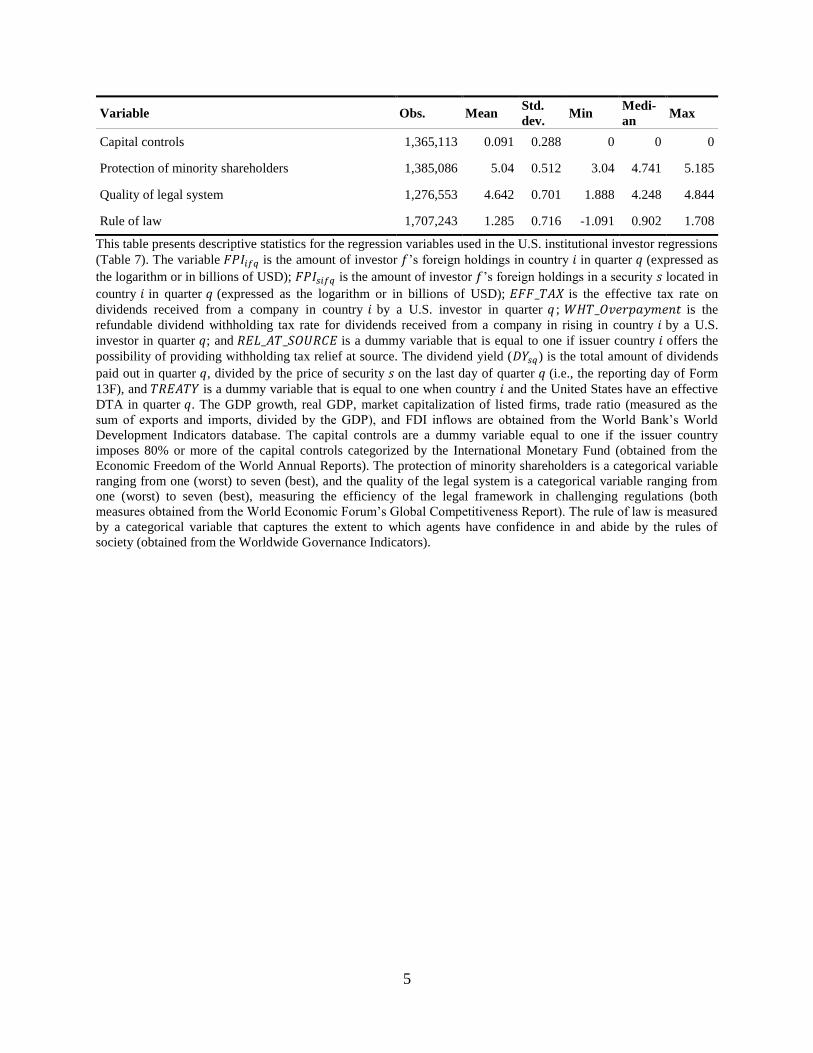
5
Variable Obs. Mean Std.
dev. Min
Medi-
an Max
Capital controls 1,365,113 0.091 0.288 0 0 0
Protection of minority shareholders 1,385,086 5.04 0.512 3.04 4.741 5.185
Quality of legal system 1,276,553 4.642 0.701 1.888 4.248 4.844
Rule of law 1,707,243 1.285 0.716 -1.091 0.902 1.708
This table presents descriptive statistics for the regression variables used in the U.S. institutional investor regressions
(Table 7). The variable 𝐹𝑃𝐼𝑖𝑓𝑞 is the amount of investor 𝑓’s foreign holdings in country 𝑖 in quarter 𝑞 (expressed as
the logarithm or in billions of USD); 𝐹𝑃𝐼𝑠𝑖𝑓𝑞 is the amount of investor 𝑓’s foreign holdings in a security 𝑠 located in
country 𝑖 in quarter 𝑞 (expressed as the logarithm or in billions of USD); 𝐸𝐹𝐹_𝑇𝐴𝑋 is the effective tax rate on
dividends received from a company in country 𝑖 by a U.S. investor in quarter 𝑞 ; 𝑊𝐻𝑇_𝑂𝑣𝑒𝑟𝑝𝑎𝑦𝑚𝑒𝑛𝑡 is the
refundable dividend withholding tax rate for dividends received from a company in rising in country 𝑖 by a U.S.
investor in quarter 𝑞; and 𝑅𝐸𝐿_𝐴𝑇_𝑆𝑂𝑈𝑅𝐶𝐸 is a dummy variable that is equal to one if issuer country 𝑖 offers the
possibility of providing withholding tax relief at source. The dividend yield (𝐷𝑌𝑠𝑞) is the total amount of dividends
paid out in quarter 𝑞, divided by the price of security 𝑠 on the last day of quarter 𝑞 (i.e., the reporting day of Form
13F), and 𝑇𝑅𝐸𝐴𝑇𝑌 is a dummy variable that is equal to one when country 𝑖 and the United States have an effective
DTA in quarter 𝑞. The GDP growth, real GDP, market capitalization of listed firms, trade ratio (measured as the
sum of exports and imports, divided by the GDP), and FDI inflows are obtained from the World Bank’s World
Development Indicators database. The capital controls are a dummy variable equal to one if the issuer country
imposes 80% or more of the capital controls categorized by the International Monetary Fund (obtained from the
Economic Freedom of the World Annual Reports). The protection of minority shareholders is a categorical variable
ranging from one (worst) to seven (best), and the quality of the legal system is a categorical variable ranging from
one (worst) to seven (best), measuring the efficiency of the legal framework in challenging regulations (both
measures obtained from the World Economic Forum’s Global Competitiveness Report). The rule of law is measured
by a categorical variable that captures the extent to which agents have confidence in and abide by the rules of
society (obtained from the Worldwide Governance Indicators).
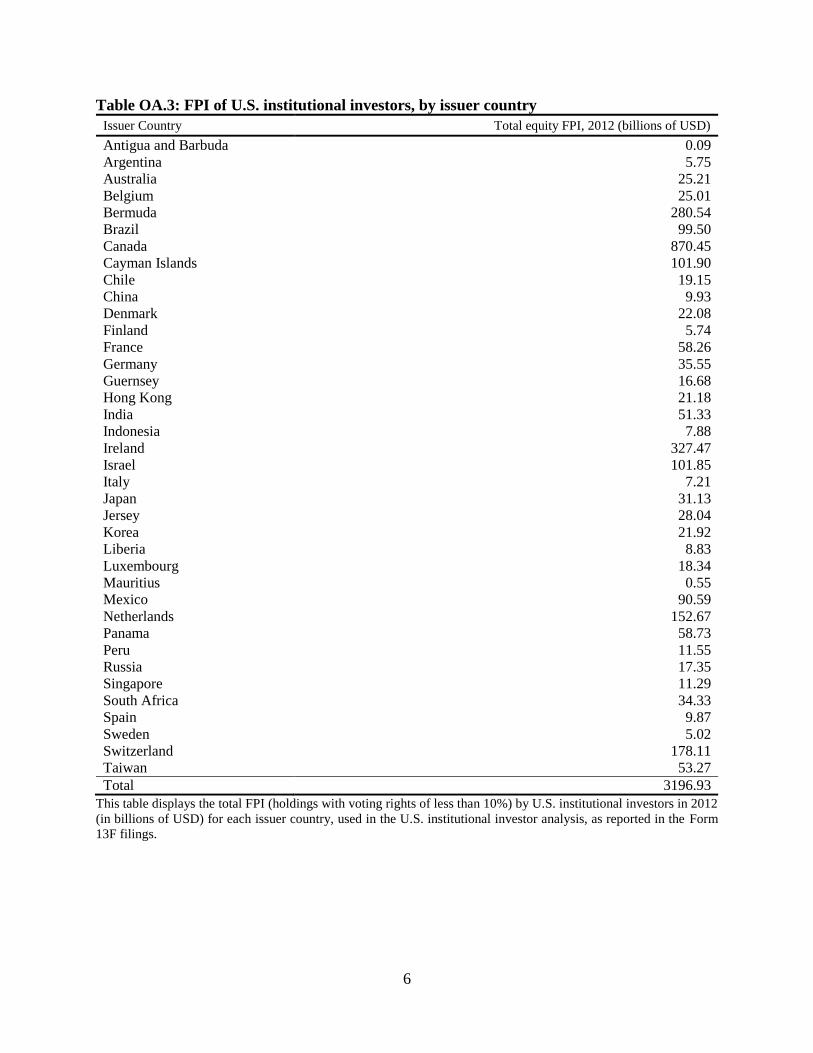
6
Table OA.3: FPI of U.S. institutional investors, by issuer country
Issuer Country Total equity FPI, 2012 (billions of USD)
Antigua and Barbuda 0.09
Argentina 5.75
Australia 25.21
Belgium 25.01
Bermuda 280.54
Brazil 99.50
Canada 870.45
Cayman Islands 101.90
Chile 19.15
China 9.93
Denmark 22.08
Finland 5.74
France 58.26
Germany 35.55
Guernsey 16.68
Hong Kong 21.18
India 51.33
Indonesia 7.88
Ireland 327.47
Israel 101.85
Italy 7.21
Japan 31.13
Jersey 28.04
Korea 21.92
Liberia 8.83
Luxembourg 18.34
Mauritius 0.55
Mexico 90.59
Netherlands 152.67
Panama 58.73
Peru 11.55
Russia 17.35
Singapore 11.29
South Africa 34.33
Spain 9.87
Sweden 5.02
Switzerland 178.11
Taiwan 53.27
Total 3196.93
This table displays the total FPI (holdings with voting rights of less than 10%) by U.S. institutional investors in 2012
(in billions of USD) for each issuer country, used in the U.S. institutional investor analysis, as reported in the Form
13F filings.
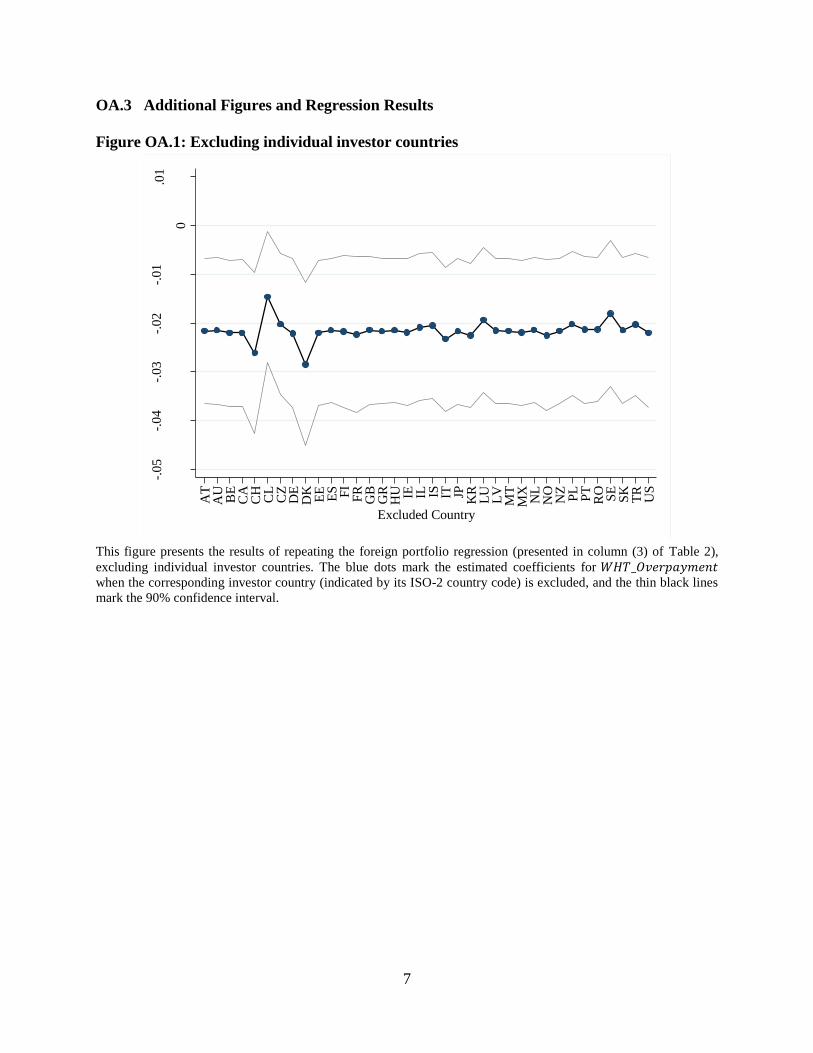
7
OA.3 Additional Figures and Regression Results
Figure OA.1: Excluding individual investor countries
This figure presents the results of repeating the foreign portfolio regression (presented in column (3) of Table 2),
excluding individual investor countries. The blue dots mark the estimated coefficients for 𝑊𝐻𝑇_𝑂𝑣𝑒𝑟𝑝𝑎𝑦𝑚𝑒𝑛𝑡
when the corresponding investor country (indicated by its ISO-2 country code) is excluded, and the thin black lines
mark the 90% confidence interval.
-.05
-.04
-.03
-.02
-.01
0
.01
Est
imat
ed c
oef
fici
ent
for
WH
T_O
verp
aym
ent
AT
AU
BE
CA
CH
CL
CZ
DE
DK
EE
ES FI
FR
GB
GR
HU IE IL IS IT JP KR
LU
LV
MT
MX
NL
NO
NZ
PL
PT
RO SE
SK
TR
US
Excluded Country
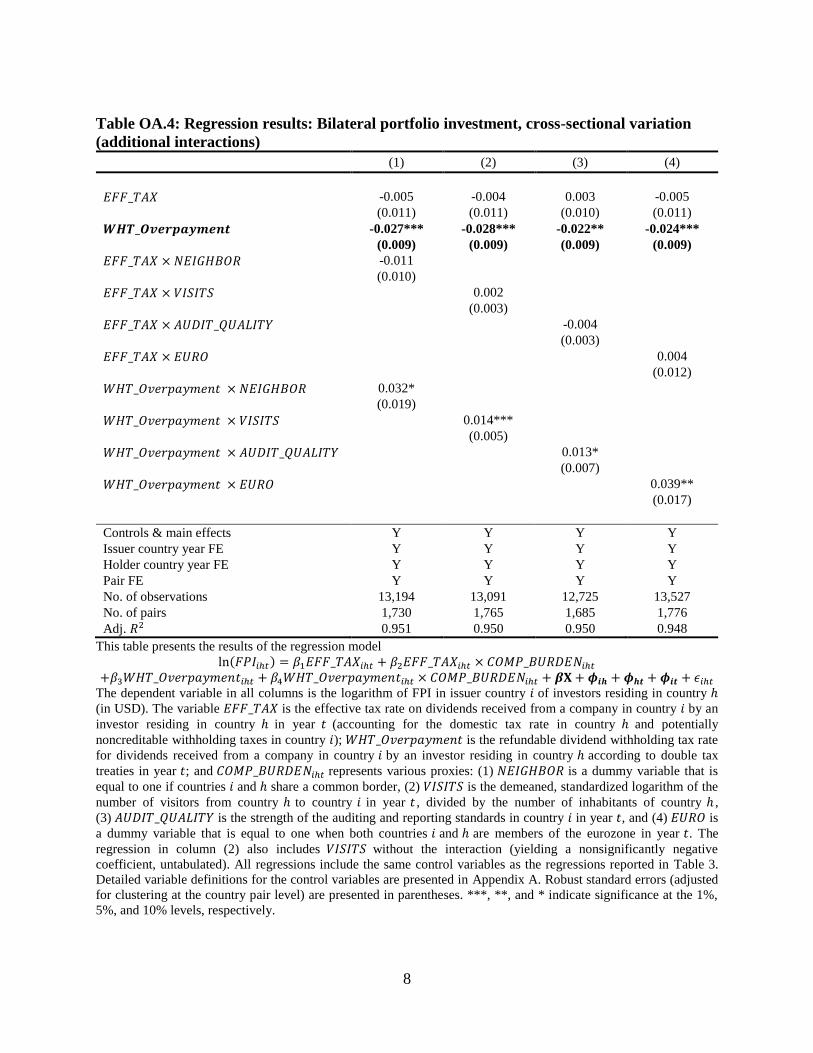
8
Table OA.4: Regression results: Bilateral portfolio investment, cross-sectional variation
(additional interactions)
(1) (2) (3) (4)
𝐸𝐹𝐹_𝑇𝐴𝑋 -0.005 -0.004 0.003 -0.005
(0.011) (0.011) (0.010) (0.011)
𝑾𝑯𝑻_𝑶𝒗𝒆𝒓𝒑𝒂𝒚𝒎𝒆𝒏𝒕 -0.027*** -0.028*** -0.022** -0.024***
(0.009) (0.009) (0.009) (0.009)
𝐸𝐹𝐹_𝑇𝐴𝑋 × 𝑁𝐸𝐼𝐺𝐻𝐵𝑂𝑅 -0.011
(0.010)
𝐸𝐹𝐹_𝑇𝐴𝑋 × 𝑉𝐼𝑆𝐼𝑇𝑆 0.002
(0.003)
𝐸𝐹𝐹_𝑇𝐴𝑋 × 𝐴𝑈𝐷𝐼𝑇_𝑄𝑈𝐴𝐿𝐼𝑇𝑌 -0.004
(0.003)
𝐸𝐹𝐹_𝑇𝐴𝑋 × 𝐸𝑈𝑅𝑂 0.004
(0.012)
𝑊𝐻𝑇_𝑂𝑣𝑒𝑟𝑝𝑎𝑦𝑚𝑒𝑛𝑡 × 𝑁𝐸𝐼𝐺𝐻𝐵𝑂𝑅 0.032*
(0.019)
𝑊𝐻𝑇_𝑂𝑣𝑒𝑟𝑝𝑎𝑦𝑚𝑒𝑛𝑡 × 𝑉𝐼𝑆𝐼𝑇𝑆 0.014***
(0.005)
𝑊𝐻𝑇_𝑂𝑣𝑒𝑟𝑝𝑎𝑦𝑚𝑒𝑛𝑡 × 𝐴𝑈𝐷𝐼𝑇_𝑄𝑈𝐴𝐿𝐼𝑇𝑌 0.013*
(0.007)
𝑊𝐻𝑇_𝑂𝑣𝑒𝑟𝑝𝑎𝑦𝑚𝑒𝑛𝑡 × 𝐸𝑈𝑅𝑂 0.039**
(0.017)
Controls & main effects Y Y Y Y
Issuer country year FE Y Y Y Y
Holder country year FE Y Y Y Y
Pair FE Y Y Y Y
No. of observations 13,194 13,091 12,725 13,527
No. of pairs 1,730 1,765 1,685 1,776
Adj. 𝑅2 0.951 0.950 0.950 0.948
This table presents the results of the regression model
ln(𝐹𝑃𝐼𝑖ℎ𝑡) = 𝛽1𝐸𝐹𝐹_𝑇𝐴𝑋𝑖ℎ𝑡 + 𝛽2𝐸𝐹𝐹_𝑇𝐴𝑋𝑖ℎ𝑡 × 𝐶𝑂𝑀𝑃_𝐵𝑈𝑅𝐷𝐸𝑁𝑖ℎ𝑡
+𝛽3𝑊𝐻𝑇_𝑂𝑣𝑒𝑟𝑝𝑎𝑦𝑚𝑒𝑛𝑡𝑖ℎ𝑡 + 𝛽4𝑊𝐻𝑇_𝑂𝑣𝑒𝑟𝑝𝑎𝑦𝑚𝑒𝑛𝑡𝑖ℎ𝑡 × 𝐶𝑂𝑀𝑃_𝐵𝑈𝑅𝐷𝐸𝑁𝑖ℎ𝑡 + 𝜷𝐗 + 𝝓𝒊𝒉 + 𝝓𝒉𝒕 + 𝝓𝒊𝒕 + 𝜖𝑖ℎ𝑡
The dependent variable in all columns is the logarithm of FPI in issuer country 𝑖 of investors residing in country ℎ
(in USD). The variable 𝐸𝐹𝐹_𝑇𝐴𝑋 is the effective tax rate on dividends received from a company in country 𝑖 by an
investor residing in country ℎ in year 𝑡 (accounting for the domestic tax rate in country ℎ and potentially
noncreditable withholding taxes in country 𝑖); 𝑊𝐻𝑇_𝑂𝑣𝑒𝑟𝑝𝑎𝑦𝑚𝑒𝑛𝑡 is the refundable dividend withholding tax rate
for dividends received from a company in country 𝑖 by an investor residing in country ℎ according to double tax
treaties in year 𝑡; and 𝐶𝑂𝑀𝑃_𝐵𝑈𝑅𝐷𝐸𝑁𝑖ℎ𝑡 represents various proxies: (1) 𝑁𝐸𝐼𝐺𝐻𝐵𝑂𝑅 is a dummy variable that is
equal to one if countries 𝑖 and ℎ share a common border, (2) 𝑉𝐼𝑆𝐼𝑇𝑆 is the demeaned, standardized logarithm of the
number of visitors from country ℎ to country 𝑖 in year 𝑡 , divided by the number of inhabitants of country ℎ ,
(3) 𝐴𝑈𝐷𝐼𝑇_𝑄𝑈𝐴𝐿𝐼𝑇𝑌 is the strength of the auditing and reporting standards in country 𝑖 in year 𝑡, and (4) 𝐸𝑈𝑅𝑂 is
a dummy variable that is equal to one when both countries 𝑖 and ℎ are members of the eurozone in year 𝑡. The
regression in column (2) also includes 𝑉𝐼𝑆𝐼𝑇𝑆 without the interaction (yielding a nonsignificantly negative
coefficient, untabulated). All regressions include the same control variables as the regressions reported in Table 3.
Detailed variable definitions for the control variables are presented in Appendix A. Robust standard errors (adjusted
for clustering at the country pair level) are presented in parentheses. ***, **, and * indicate significance at the 1%,
5%, and 10% levels, respectively.
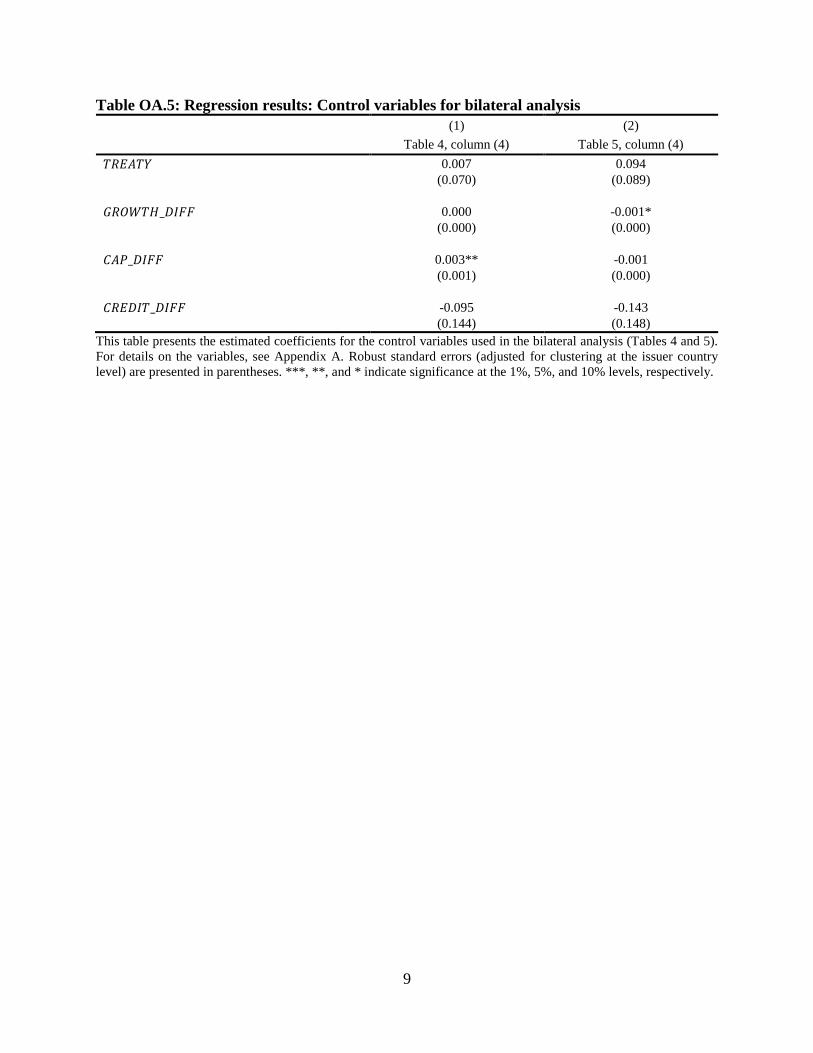
9
Table OA.5: Regression results: Control variables for bilateral analysis
(1) (2)
Table 4, column (4) Table 5, column (4)
𝑇𝑅𝐸𝐴𝑇𝑌 0.007 0.094
(0.070) (0.089)
𝐺𝑅𝑂𝑊𝑇𝐻_𝐷𝐼𝐹𝐹 0.000 -0.001*
(0.000) (0.000)
𝐶𝐴𝑃_𝐷𝐼𝐹𝐹 0.003** -0.001
(0.001) (0.000)
𝐶𝑅𝐸𝐷𝐼𝑇_𝐷𝐼𝐹𝐹 -0.095 -0.143
(0.144) (0.148)
This table presents the estimated coefficients for the control variables used in the bilateral analysis (Tables 4 and 5).
For details on the variables, see Appendix A. Robust standard errors (adjusted for clustering at the issuer country
level) are presented in parentheses. ***, **, and * indicate significance at the 1%, 5%, and 10% levels, respectively.
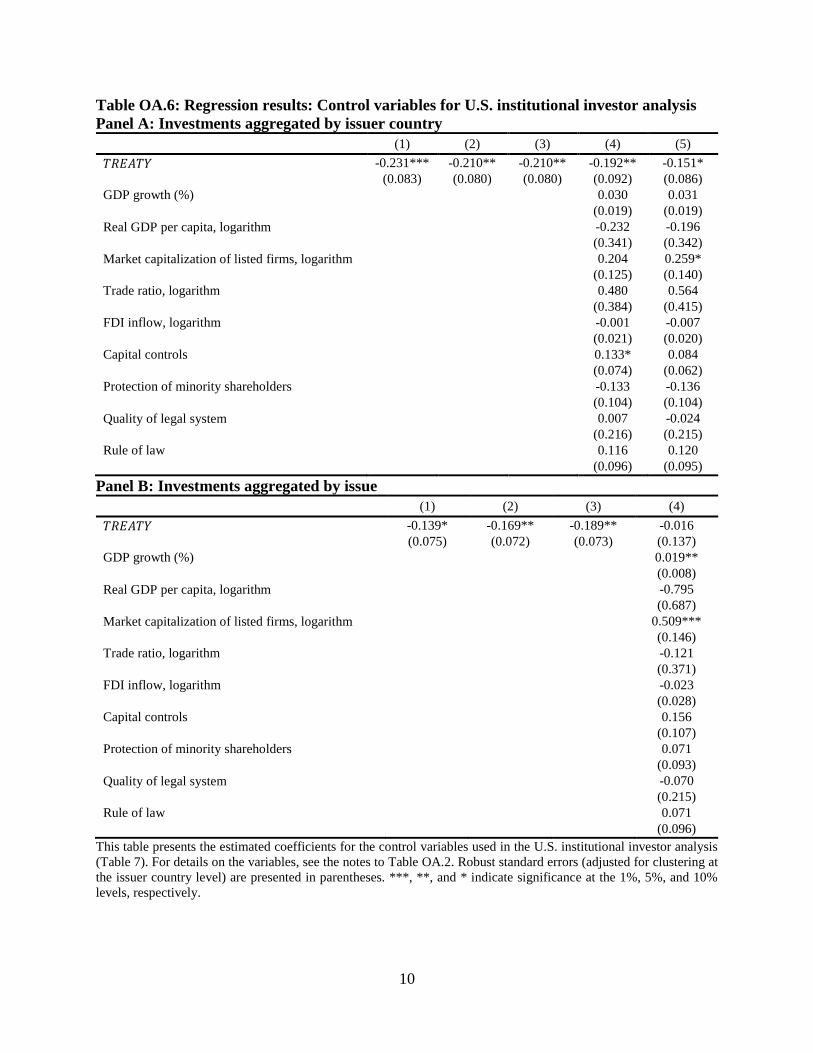
10
Table OA.6: Regression results: Control variables for U.S. institutional investor analysis
Panel A: Investments aggregated by issuer country
(1) (2) (3) (4) (5)
𝑇𝑅𝐸𝐴𝑇𝑌 -0.231*** -0.210** -0.210** -0.192** -0.151*
(0.083) (0.080) (0.080) (0.092) (0.086)
GDP growth (%) 0.030 0.031
(0.019) (0.019)
Real GDP per capita, logarithm -0.232 -0.196
(0.341) (0.342)
Market capitalization of listed firms, logarithm 0.204 0.259*
(0.125) (0.140)
Trade ratio, logarithm 0.480 0.564
(0.384) (0.415)
FDI inflow, logarithm -0.001 -0.007
(0.021) (0.020)
Capital controls 0.133* 0.084
(0.074) (0.062)
Protection of minority shareholders -0.133 -0.136
(0.104) (0.104)
Quality of legal system 0.007 -0.024
(0.216) (0.215)
Rule of law 0.116 0.120
(0.096) (0.095)
Panel B: Investments aggregated by issue
(1) (2) (3) (4)
𝑇𝑅𝐸𝐴𝑇𝑌 -0.139* -0.169** -0.189** -0.016
(0.075) (0.072) (0.073) (0.137)
GDP growth (%) 0.019**
(0.008)
Real GDP per capita, logarithm -0.795
(0.687)
Market capitalization of listed firms, logarithm 0.509***
(0.146)
Trade ratio, logarithm -0.121
(0.371)
FDI inflow, logarithm -0.023
(0.028)
Capital controls 0.156
(0.107)
Protection of minority shareholders 0.071
(0.093)
Quality of legal system -0.070
(0.215)
Rule of law 0.071
(0.096)
This table presents the estimated coefficients for the control variables used in the U.S. institutional investor analysis
(Table 7). For details on the variables, see the notes to Table OA.2. Robust standard errors (adjusted for clustering at
the issuer country level) are presented in parentheses. ***, **, and * indicate significance at the 1%, 5%, and 10%
levels, respectively.
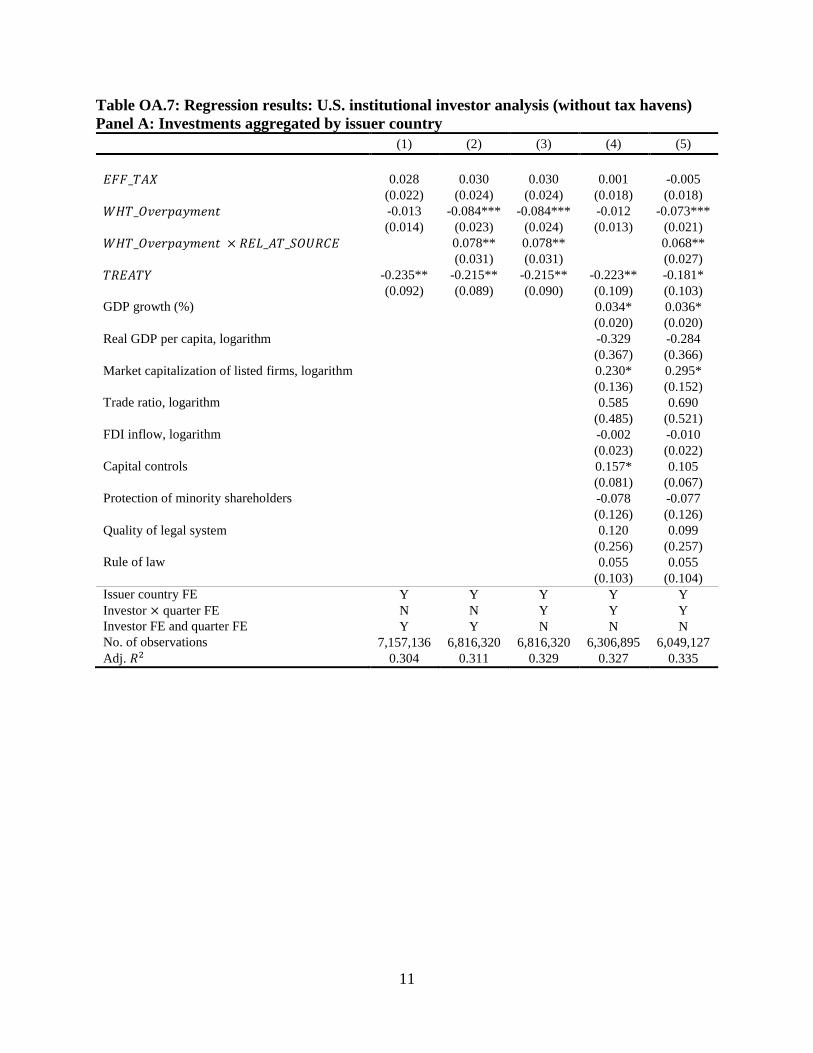
11
Table OA.7: Regression results: U.S. institutional investor analysis (without tax havens)
Panel A: Investments aggregated by issuer country
(1) (2) (3) (4) (5)
𝐸𝐹𝐹_𝑇𝐴𝑋 0.028 0.030 0.030 0.001 -0.005
(0.022) (0.024) (0.024) (0.018) (0.018)
𝑊𝐻𝑇_𝑂𝑣𝑒𝑟𝑝𝑎𝑦𝑚𝑒𝑛𝑡 -0.013 -0.084*** -0.084*** -0.012 -0.073***
(0.014) (0.023) (0.024) (0.013) (0.021)
𝑊𝐻𝑇_𝑂𝑣𝑒𝑟𝑝𝑎𝑦𝑚𝑒𝑛𝑡 × 𝑅𝐸𝐿_𝐴𝑇_𝑆𝑂𝑈𝑅𝐶𝐸 0.078** 0.078** 0.068**
(0.031) (0.031) (0.027)
𝑇𝑅𝐸𝐴𝑇𝑌 -0.235** -0.215** -0.215** -0.223** -0.181*
(0.092) (0.089) (0.090) (0.109) (0.103)
GDP growth (%) 0.034* 0.036*
(0.020) (0.020)
Real GDP per capita, logarithm -0.329 -0.284
(0.367) (0.366)
Market capitalization of listed firms, logarithm 0.230* 0.295*
(0.136) (0.152)
Trade ratio, logarithm 0.585 0.690
(0.485) (0.521)
FDI inflow, logarithm -0.002 -0.010
(0.023) (0.022)
Capital controls 0.157* 0.105
(0.081) (0.067)
Protection of minority shareholders -0.078 -0.077
(0.126) (0.126)
Quality of legal system 0.120 0.099
(0.256) (0.257)
Rule of law 0.055 0.055
(0.103) (0.104)
Issuer country FE Y Y Y Y Y
Investor × quarter FE N N Y Y Y
Investor FE and quarter FE Y Y N N N
No. of observations 7,157,136 6,816,320 6,816,320 6,306,895 6,049,127
Adj. 𝑅2 0.304 0.311 0.329 0.327 0.335
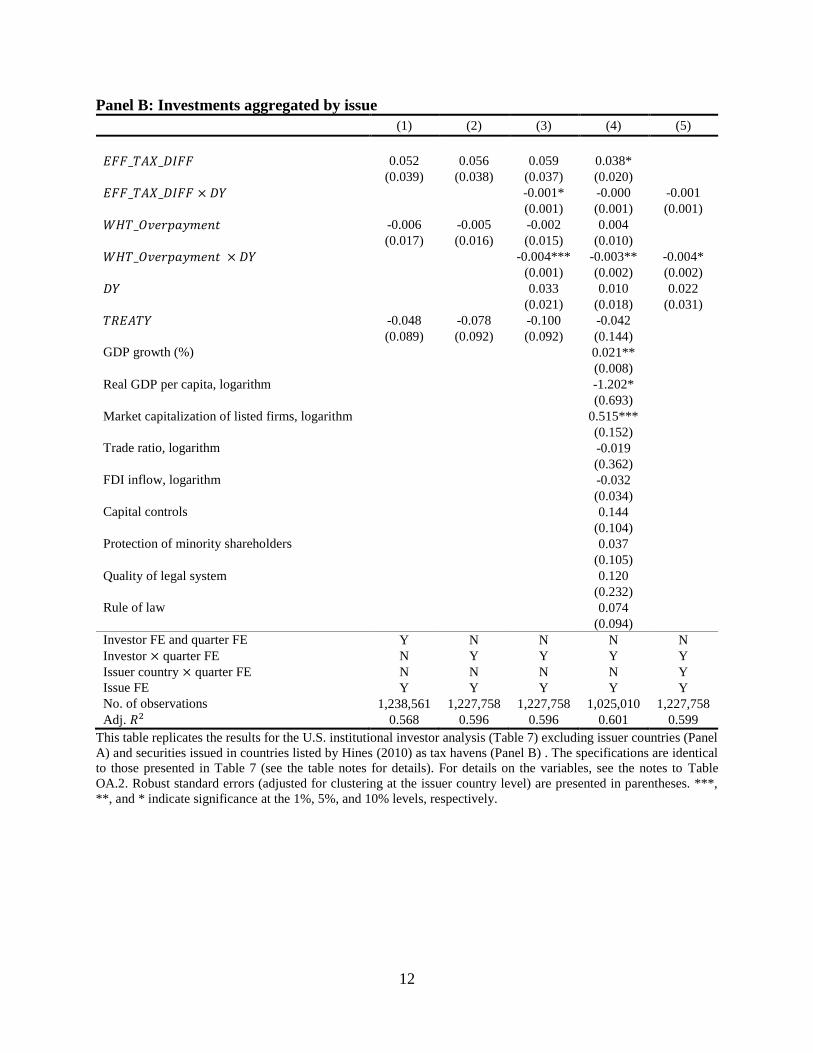
12
Panel B: Investments aggregated by issue
(1) (2) (3) (4) (5)
𝐸𝐹𝐹_𝑇𝐴𝑋_𝐷𝐼𝐹𝐹 0.052 0.056 0.059 0.038*
(0.039) (0.038) (0.037) (0.020)
𝐸𝐹𝐹_𝑇𝐴𝑋_𝐷𝐼𝐹𝐹 × 𝐷𝑌 -0.001* -0.000 -0.001
(0.001) (0.001) (0.001)
𝑊𝐻𝑇_𝑂𝑣𝑒𝑟𝑝𝑎𝑦𝑚𝑒𝑛𝑡 -0.006 -0.005 -0.002 0.004
(0.017) (0.016) (0.015) (0.010)
𝑊𝐻𝑇_𝑂𝑣𝑒𝑟𝑝𝑎𝑦𝑚𝑒𝑛𝑡 × 𝐷𝑌 -0.004*** -0.003** -0.004*
(0.001) (0.002) (0.002)
𝐷𝑌 0.033 0.010 0.022
(0.021) (0.018) (0.031)
𝑇𝑅𝐸𝐴𝑇𝑌 -0.048 -0.078 -0.100 -0.042
(0.089) (0.092) (0.092) (0.144)
GDP growth (%) 0.021**
(0.008)
Real GDP per capita, logarithm -1.202*
(0.693)
Market capitalization of listed firms, logarithm 0.515***
(0.152)
Trade ratio, logarithm -0.019
(0.362)
FDI inflow, logarithm -0.032
(0.034)
Capital controls 0.144
(0.104)
Protection of minority shareholders 0.037
(0.105)
Quality of legal system 0.120
(0.232)
Rule of law 0.074
(0.094)
Investor FE and quarter FE Y N N N N
Investor × quarter FE N Y Y Y Y
Issuer country × quarter FE N N N N Y
Issue FE Y Y Y Y Y
No. of observations 1,238,561 1,227,758 1,227,758 1,025,010 1,227,758
Adj. 𝑅2 0.568 0.596 0.596 0.601 0.599
This table replicates the results for the U.S. institutional investor analysis (Table 7) excluding issuer countries (Panel
A) and securities issued in countries listed by Hines (2010) as tax havens (Panel B) . The specifications are identical
to those presented in Table 7 (see the table notes for details). For details on the variables, see the notes to Table
OA.2. Robust standard errors (adjusted for clustering at the issuer country level) are presented in parentheses. ***,
**, and * indicate significance at the 1%, 5%, and 10% levels, respectively.
13
References
Baker, M., J. C. Stein, and J. Wurgler. 2003. When does the market matter? Stock prices and the
investment of equity-dependent firms. The Quarterly Journal of Economics 118 (3): 969–
1005.
Hadlock, C. J., and J. R. Pierce. 2010. New evidence on measuring financial constraints: Moving
beyond the KZ index. The Review of Financial Studies 23 (5): 1909–1940.
Hines Jr, J. R. 2010. Treasure islands. Journal of Economic Perspectives 24 (4): 103–126.
Jacob, M., R. Michaely, and M. A. Müller. 2019. Consumption taxes and corporate investment.
The Review of Financial Studies 32 (8): 3144–3182.
Recommended