Embed Size (px)
DESCRIPTION
I created this presentation about 3M company with my teammates during Finace class
Citation preview
Savino Bartolomeo
Paula Biste
Camesha Cody-Vera
Renan Dault
Mathieu Picca
Lucas Pilleri
Company Profile
Capital Structure
Dividend Policy
Valuation
23.11.2012 Strategic Finance 2
3M is a diversified technology company serving customers and communities with innovative products and services.
More than 35 business units, organized into six businesses:
Consumer and Office
Display and Graphics
Electro and Communications
Health Care
Industrial and Transportation
Safety, Security and Protection Services
23.11.2012 Strategic Finance 3
Year-end 2011: Global sales: $30 billion International (non-US) sales: $19.5 billion (66% of
total) Operations in more than 65 countries Products sold in nearly 200 countries 84,000 employees globally
Five-year financial objectives: 9% to 11% growth in earnings per share 4% to 6% organic revenue growth More than 20% return on invested capital 100% free cash flow conversion
23.11.2012 Strategic Finance 4
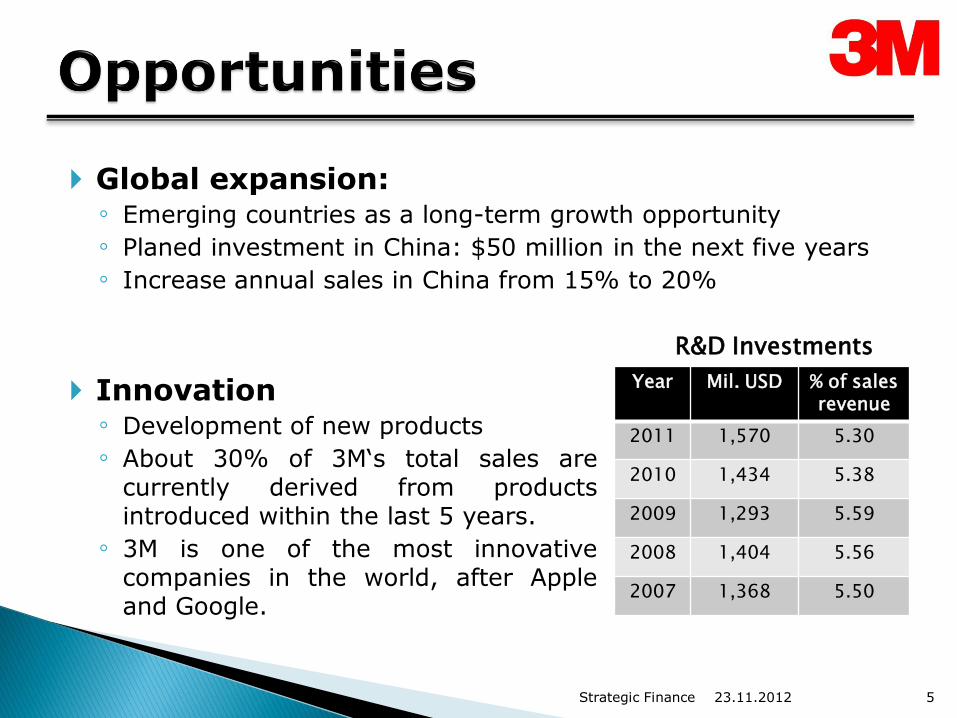
Innovation ◦ Development of new products
◦ About 30% of 3M‘s total sales are currently derived from products introduced within the last 5 years.
◦ 3M is one of the most innovative companies in the world, after Apple and Google.
23.11.2012 Strategic Finance 5
Global expansion: ◦ Emerging countries as a long-term growth opportunity
◦ Planed investment in China: $50 million in the next five years
◦ Increase annual sales in China from 15% to 20%
Year Mil. USD % of sales revenue
2011 1,570 5.30
2010 1,434 5.38
2009 1,293 5.59
2008 1,404 5.56
2007 1,368 5.50
R&D Investments
Rising energy and facility costs: Negative effect on prices of raw materials, increasing cost and
reducing operating margins
Environmental regulations Increase of “environmental remediation” costs, recorded at
$28 Million by December 31 2011 Development of additional Prevention Programs
Currency risk Currency exchange rates volability may affect the achievement
of projected growth rates in sales and earnings.
Economic Conditions Weak economic conditions in certain markets, resulting in
lowering of inventory levels by customers.
23.11.2012 Strategic Finance 6
23.11.2012 7 Strategic Finance
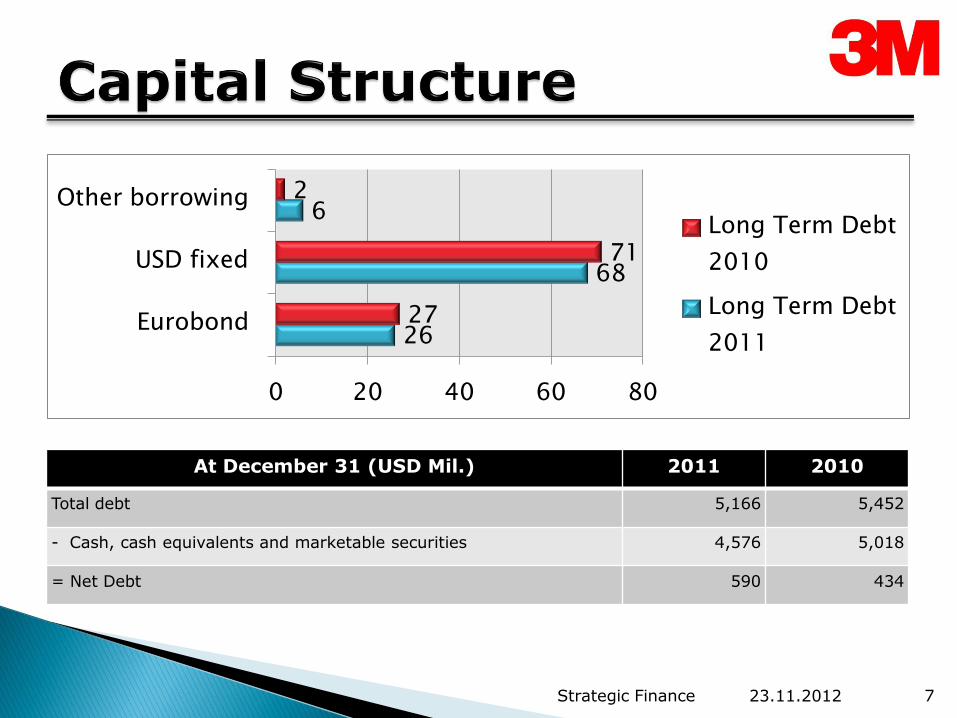
26
68
6
27
71
2
Eurobond
USD fixed
Other borrowing
0 20 40 60 80
Long Term Debt
2010
Long Term Debt
2011
At December 31 (USD Mil.) 2011 2010
Total debt 5,166 5,452
- Cash, cash equivalents and marketable securities 4,576 5,018
= Net Debt 590 434
3800
3850
3900
3950
4000
4050
4100
2009 2010 2011
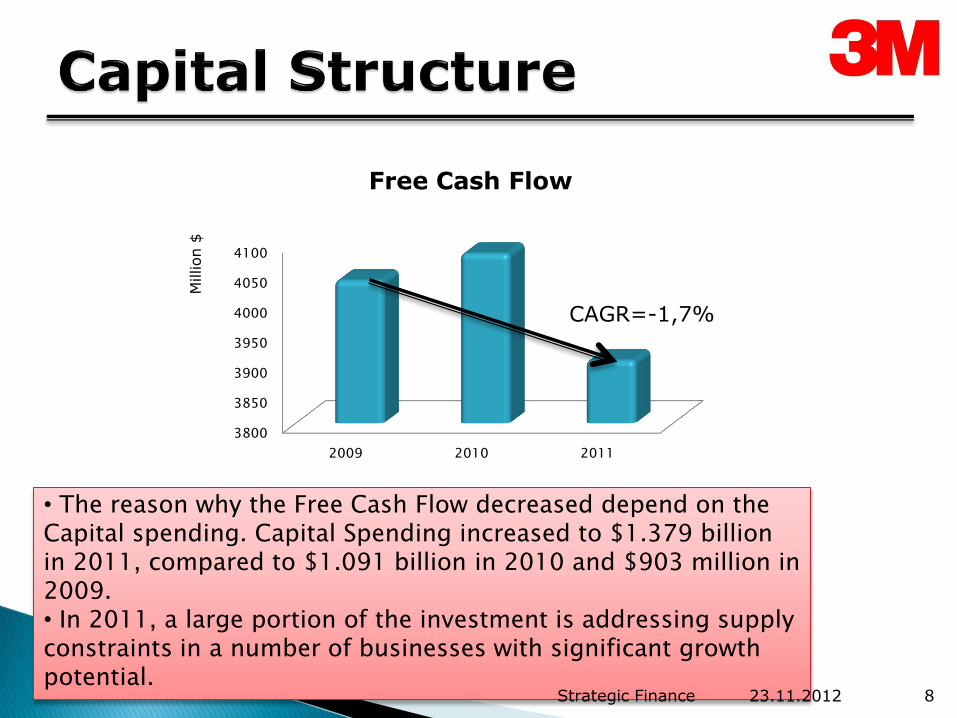
Free Cash Flow M
illion $
CAGR=-1,7%
• The reason why the Free Cash Flow decreased depend on the Capital spending. Capital Spending increased to $1.379 billion in 2011, compared to $1.091 billion in 2010 and $903 million in 2009. • In 2011, a large portion of the investment is addressing supply constraints in a number of businesses with significant growth potential.
23.11.2012 8 Strategic Finance
4700
4800
4900
5000
5100
5200
5300
2009 2010 2011
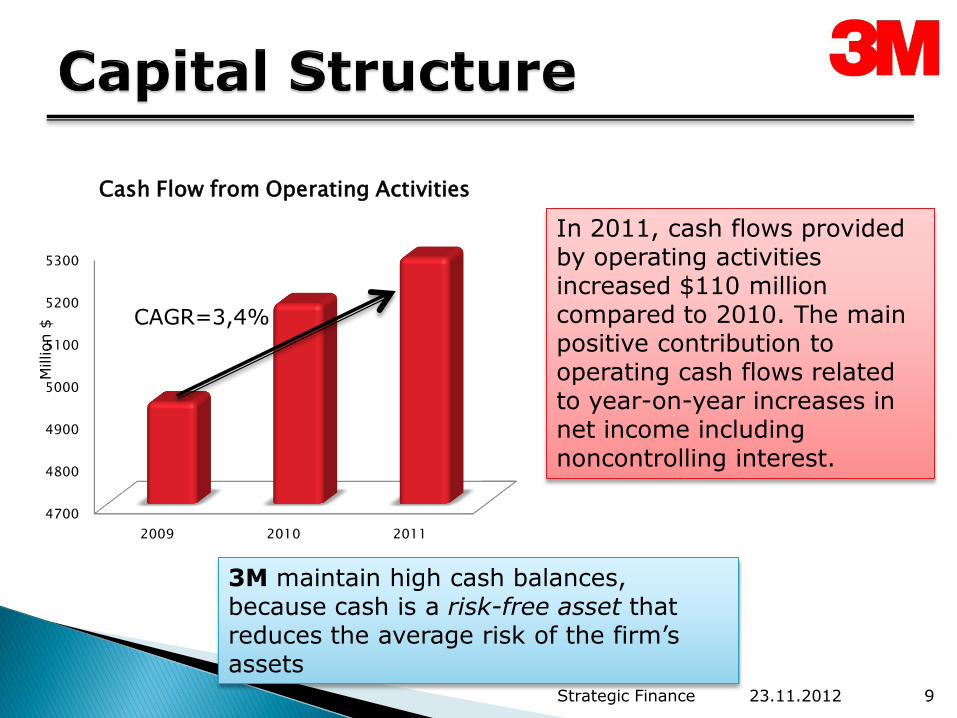
Cash Flow from Operating Activities
Million $
CAGR=3,4%
In 2011, cash flows provided by operating activities increased $110 million compared to 2010. The main positive contribution to operating cash flows related to year-on-year increases in net income including noncontrolling interest.
3M maintain high cash balances, because cash is a risk-free asset that reduces the average risk of the firm’s assets
23.11.2012 9 Strategic Finance
0
0,05
0,1
0,15
0,2
0,25
0,3
0,35
0,4
0,45
31 Dec 2009 31 Dec 2010 31 Dec 2011
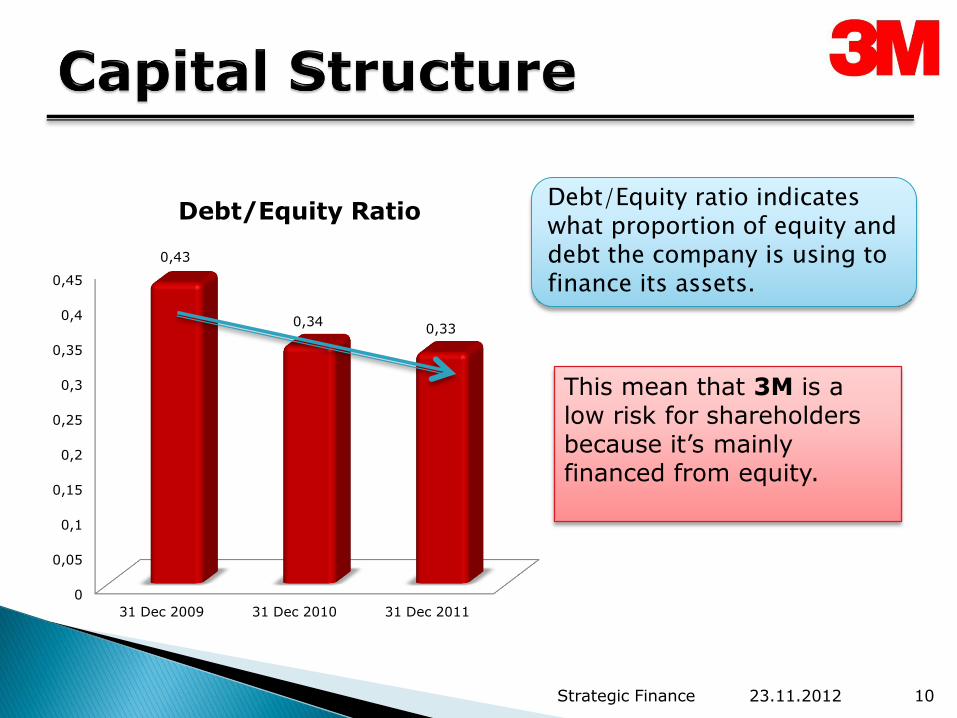
0,43
0,34 0,33
Debt/Equity Ratio Debt/Equity ratio indicates what proportion of equity and debt the company is using to finance its assets.
This mean that 3M is a low risk for shareholders because it’s mainly financed from equity.
23.11.2012 10 Strategic Finance
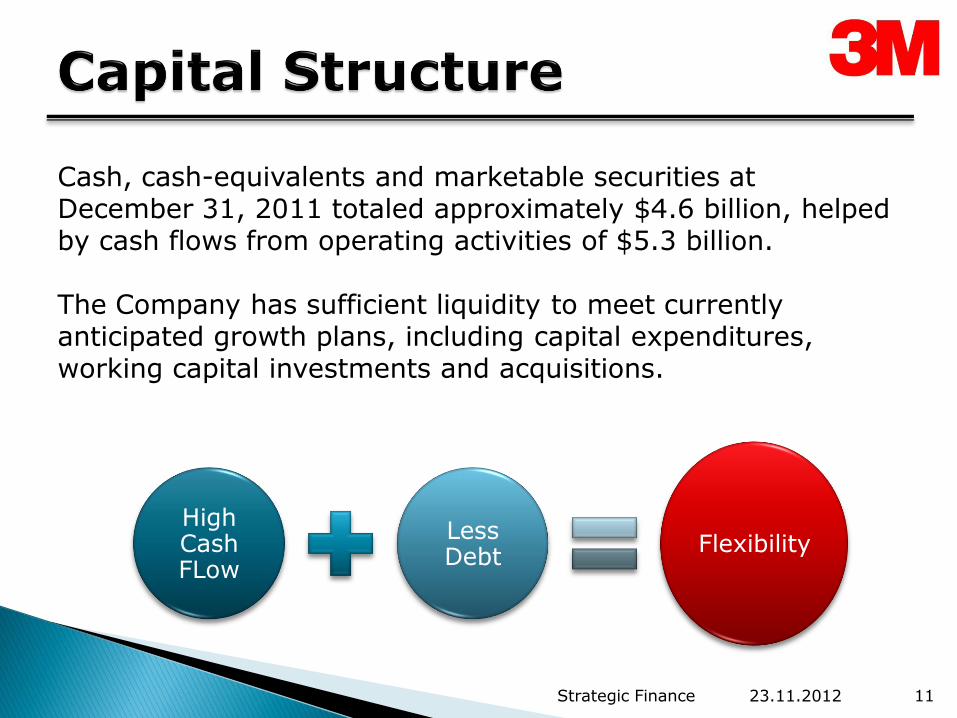
Cash, cash-equivalents and marketable securities at December 31, 2011 totaled approximately $4.6 billion, helped by cash flows from operating activities of $5.3 billion. The Company has sufficient liquidity to meet currently anticipated growth plans, including capital expenditures, working capital investments and acquisitions.
High Cash FLow
Less Debt
Flexibility
23.11.2012 11 Strategic Finance
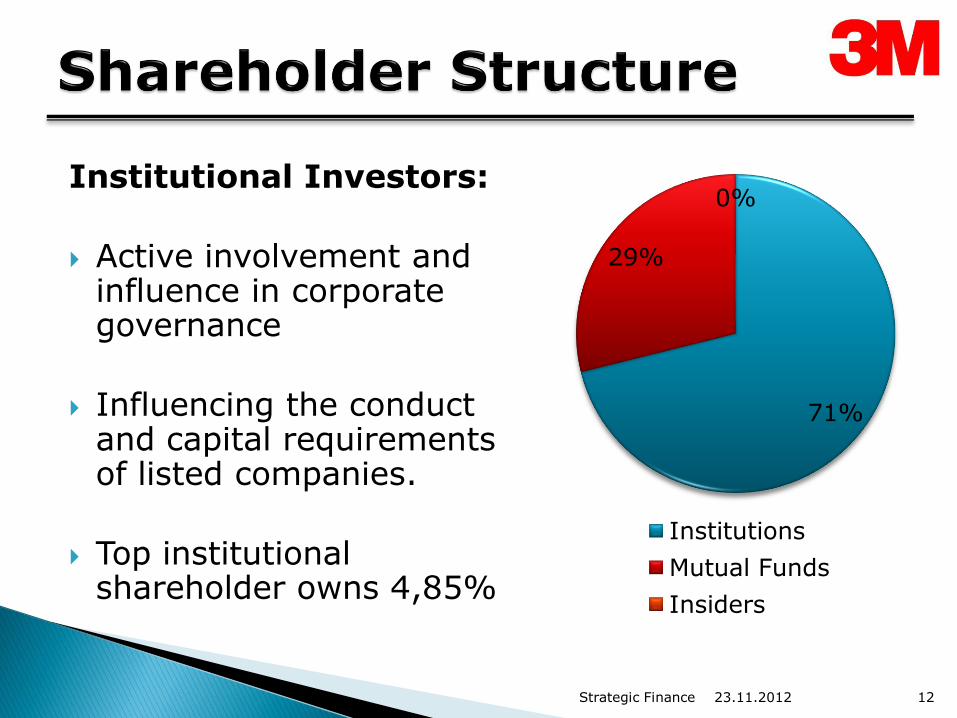
Institutional Investors:
Active involvement and influence in corporate governance
Influencing the conduct and capital requirements of listed companies.
Top institutional shareholder owns 4,85%
71%
29%
0%
Institutions
Mutual Funds
Insiders
23.11.2012 Strategic Finance 12
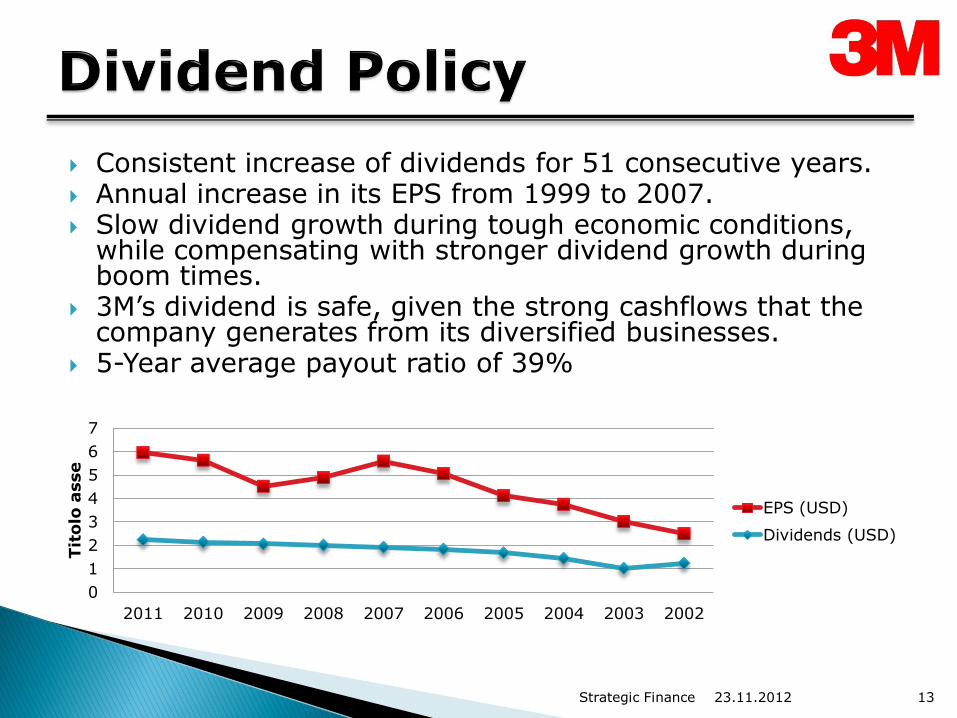
Consistent increase of dividends for 51 consecutive years. Annual increase in its EPS from 1999 to 2007. Slow dividend growth during tough economic conditions,
while compensating with stronger dividend growth during boom times.
3M’s dividend is safe, given the strong cashflows that the company generates from its diversified businesses.
5-Year average payout ratio of 39%
23.11.2012 Strategic Finance 13
0
1
2
3
4
5
6
7
2011 2010 2009 2008 2007 2006 2005 2004 2003 2002
Tit
olo
asse
EPS (USD)
Dividends (USD)
The company has recovered
from 2008-2009 crisis and
reported earnings 4.5% higher
than 2007 compared with
2011.
Positive cash flow, necessary
to pay its dividends and make
acquisitions.
Declining profit margins.
The perspective of the rising
energy costs, 3M has to find
alternatives to keep cost
structure stable otherwise this
will influence future cash flows
and in long term the dividend
policy.
23.11.2012 Strategic Finance 14
Thank you for your attention!
23.11.2012 Strategic Finance 15