Embed Size (px)
Citation preview
0
A Frayed Connection: Joblessness among Teens in Chicago
Neeta Fogg, Paul Harrington
And Ishwar Khatiwada
Center for Labor Markets and Policy
Drexel University
January 2015
Executive Summary
Since the end of the economic expansion of the 1990s, the fraction of teens that work has
plunged, declining to the lowest level in the post-World War II period. The employment
to population ratio of the nation’s teens (aged 16-19) fell to 26% in 2010; half of what it
was during most of the post-WWII period.
In Illinois, the teen employment to population ratio declined dramatically. During the
1998-2000 period, half of all teen residents of Illinois were at work. By the 2011-2013
period, the share of teens with a job plunged to just 27.6 percent.
Teen residents of Chicago have little access to employment opportunities. Even during
the full-employment period of 1998-2000, fewer than one-in-three Chicago teens worked.
By 2011-2013, just 13 percent of the teen residents of Chicago had a job.
Like most major cities in the nation, the employment to population ratio of teens in
Chicago fell quite substantially during the Great Recession. Sadly, the decline in
employment rates among teens in the city has continued during the period of recovery
from the recession.
Employment rates of Chicago’s male teens are now below those of females; the
economic recession appears to have had a disproportionate adverse impact on the
employment prospects of male teen residents of Chicago.
Black teen employment rates in Chicago have reached historically low levels, just one in
ten Black teen residents of the city had a job on average during 2012-2013—nine out of
ten Black teens in the city did not work.
The level of household income appears to be closely linked to the chance of employment
among teens. In Chicago, we found a strong positive relationship between household
annual income and teen employment rates. The likelihood that a Chicago teen had a job
increased considerably with household income. Only 11 percent of teens who lived in a
Chicago household with annual income below $20,000 were employed in 2012-13,
compared to 30 percent of their counterparts from households with incomes between
$100,000 and $150,000.
A large proportion of teens and young adult residents of Chicago are disconnected from
school and work—two activities in which most young persons are engaged; activities that

are thought to aid in their growth and development as productive members of society
with the behavioral skills, attitudes, and proficiencies necessary for labor market success.
We found that nearly one-fifth (18%) of Chicago’s 16- to 24-year old civilian residents
are disconnected from school and work—not enrolled in school and not working.
Disconnection rates vary sharply be race-ethnicity in Chicago with the highest
disconnection rate among Black 16- to 24-year old residents of the city; 28 percent
followed by 16 percent among the city’s Hispanic youth and just 9 percent among non-
Hispanic White youth. The disconnection rate is stunningly high for young adult Black
men in Chicago. One half of 20- to 24-year old Black male residents of the city are not
working and not enrolled in school.
Contents
Introduction ................................................................................................................................................. 1
Employment Rates of Teens in Chicago, Illinois, and the U.S., 2000-2014 ...................................... 4
Trends in the Employment to Population Ratios of the 16 to 19 Year Olds in theLargest
Cities in the Nation ................................................................................................................................. 8
Trends in Employment Rates of Teens Across Gender and Race-Ethnic Groups........................... 11
Employment Rates of Teens in Chicago City, Illinois, and the U.S. by Household
Income, 2012-2013 ............................................................................................................................... 13
Incidence of Disconnection among Teens and Young Adults in City of Chicago, Illinois,
and the U.S., 2013 ................................................................................................................................. 16
Data Sources and Methodology ............................................................................................................. 20
1
Introduction
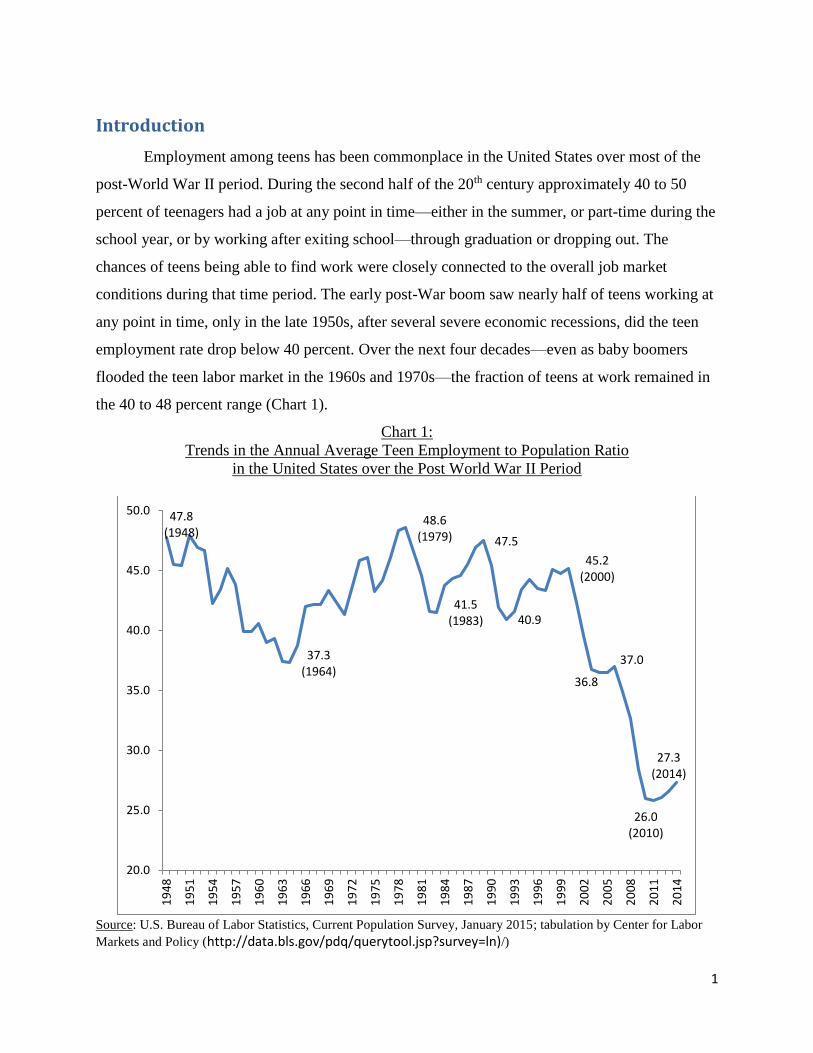
Employment among teens has been commonplace in the United States over most of the
post-World War II period. During the second half of the 20th century approximately 40 to 50
percent of teenagers had a job at any point in time—either in the summer, or part-time during the
school year, or by working after exiting school—through graduation or dropping out. The
chances of teens being able to find work were closely connected to the overall job market
conditions during that time period. The early post-War boom saw nearly half of teens working at
any point in time, only in the late 1950s, after several severe economic recessions, did the teen
employment rate drop below 40 percent. Over the next four decades—even as baby boomers
flooded the teen labor market in the 1960s and 1970s—the fraction of teens at work remained in
the 40 to 48 percent range (Chart 1).
Chart 1:
Trends in the Annual Average Teen Employment to Population Ratio
in the United States over the Post World War II Period
Source: U.S. Bureau of Labor Statistics, Current Population Survey, January 2015; tabulation by Center for Labor
Markets and Policy (http://data.bls.gov/pdq/querytool.jsp?survey=ln)/)
47.8(1948)
37.3(1964)
48.6(1979)
41.5(1983)
47.5
40.9
45.2(2000)
36.8
37.0
26.0(2010)
27.3(2014)
20.0
25.0
30.0
35.0
40.0
45.0
50.0
19
48
19
51
19
54
19
57
19
60
19
63
19
66
19
69
19
72
19
75
19
78
19
81
19
84
19
87
19
90
19
93
19
96
19
99
20
02
20
05
20
08
20
11
20
14
2
The trajectory of teen employment shifted dramatically at the dawn of the 21st century.
After the dot-com recession of 2001 teen employment fell sharply. Even as the nation’s economy
and job market recovered through the end of 2007, the share of teens at work continued to fall,
with no signs of a rebound. The Great Recession and the massive job losses that occurred around
the nation associated with it contributed to further declines in the teen employment rate; falling
to just 25 percent by 2010. Since then, as the nation’s job market has rebounded, with
particularly strong employment gains across the nation last year, the teen employment rate has
improved only slightly rising to 27 percent in 2014—after 5 years of economic growth and jobs
gains.1
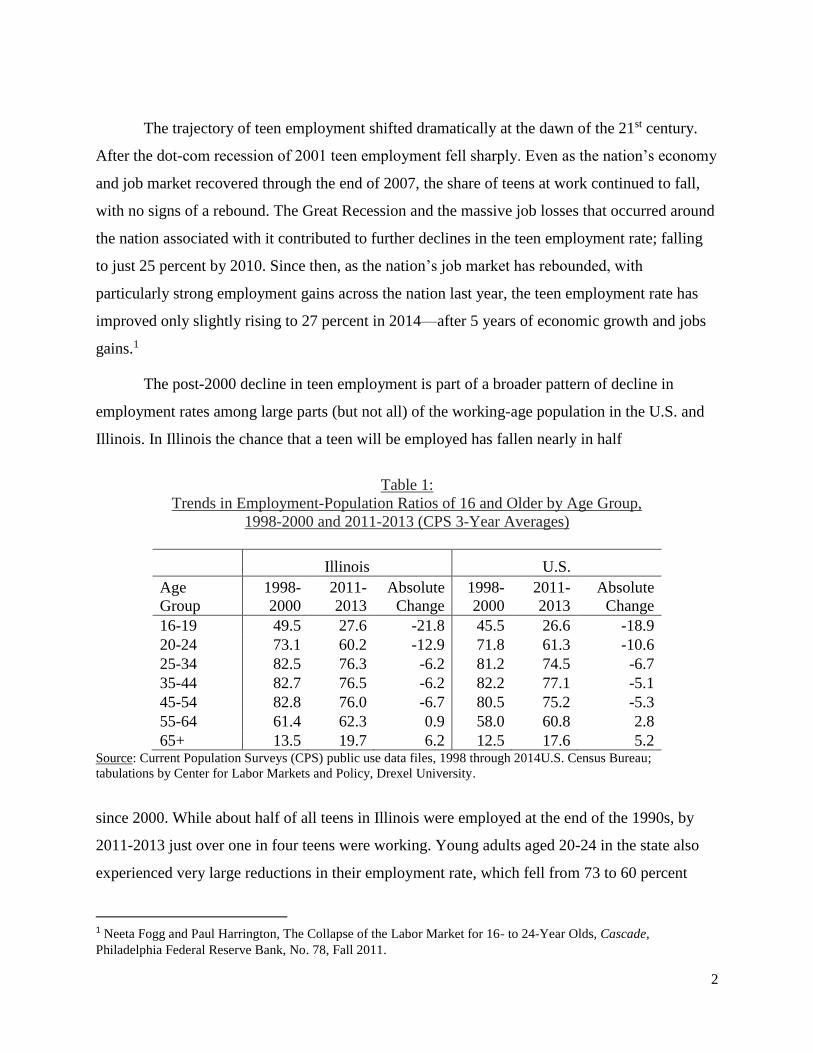
The post-2000 decline in teen employment is part of a broader pattern of decline in
employment rates among large parts (but not all) of the working-age population in the U.S. and
Illinois. In Illinois the chance that a teen will be employed has fallen nearly in half
Table 1:
Trends in Employment-Population Ratios of 16 and Older by Age Group,
1998-2000 and 2011-2013 (CPS 3-Year Averages)
Illinois U.S.
Age
Group
1998-
2000
2011-
2013
Absolute
Change
1998-
2000
2011-
2013
Absolute
Change
16-19 49.5 27.6 -21.8 45.5 26.6 -18.9
20-24 73.1 60.2 -12.9 71.8 61.3 -10.6
25-34 82.5 76.3 -6.2 81.2 74.5 -6.7
35-44 82.7 76.5 -6.2 82.2 77.1 -5.1
45-54 82.8 76.0 -6.7 80.5 75.2 -5.3
55-64 61.4 62.3 0.9 58.0 60.8 2.8
65+ 13.5 19.7 6.2 12.5 17.6 5.2 Source: Current Population Surveys (CPS) public use data files, 1998 through 2014U.S. Census Bureau;
tabulations by Center for Labor Markets and Policy, Drexel University.
since 2000. While about half of all teens in Illinois were employed at the end of the 1990s, by
2011-2013 just over one in four teens were working. Young adults aged 20-24 in the state also
experienced very large reductions in their employment rate, which fell from 73 to 60 percent
1 Neeta Fogg and Paul Harrington, The Collapse of the Labor Market for 16- to 24-Year Olds, Cascade,
Philadelphia Federal Reserve Bank, No. 78, Fall 2011.
3
over the decade-plus period. A look at the findings in Table 1 reveal that while employment
rates declined for all residents of the state under the age of 55, older workers (55 and over)
increased their rate of employment during this time period; especially workers aged 65 and older.
These data reveal an odd reversal in the composition of who gets work. As baby boomers reach
pre-retirement and retirement years they are more likely to work.2 Moreover, there is
considerable evidence that these older workers became employed in entry-level occupations
where teen employment was most heavily concentrated.3
Should we be concerned that teens are working so much less than has been the case in the
past? There are mixed opinions about this question with many of those concerned with
secondary school systems around the nation arguing that work during teen years may reduce
learning time available to young people, without contributing much to these teens except some
income that is often used on frivolous teen consumption activities. This ‘opportunity cost’ view
is based on the notion that as teens work more, the amount of time available to engage in
activities that build academic proficiencies (including homework) is diminished. The kinds of
jobs usually available to teens are not seen as providing experiences that would develop their
abilities, skills and knowledge. Indeed, teen employment is very heavily concentrated in jobs
requiring little education, training or ability, skill or knowledge.4 So, according to this line of
thinking, it is probably a positive development that employers in recent years have hired fewer
teens and shown a preference for hiring older workers for entry-level jobs.
However, an alternative view (one to which the authors subscribe) is that mixing work
and school is a positive experience for most teens and the reduction in work experience at a
young age has negative longer-term consequences on economic and educational outcomes in
2 Neeta P. Fogg and Paul E. Harrington: “Rising Demand for Older Workers Despite Economic Recession,” Public
Policy and Aging Report, Vol. 21, Number 1, Winter 2011; Smith, Christopher. 2011. Polarization, Immigration,
Education: What’s Behind the Dramatic Decline in Youth Employment? Washington, DC: Finance and Economics
Discussion Series, Divisions of Research & Statistics and Monetary Affairs, Federal Reserve Board. 3Neeta P. Fogg and Paul E. Harrington Demographic Characteristics and Labor Force Attachment of the 55 and
Older Population of Eastern Massachusetts, New England Council Commission on the Older Workforce, New
England Council, 2007 and Neeta P. Fogg and Paul E. Harrington, Occupational Profiles for the Mature Worker:
Finding and Using Detailed Information about Occupations with the Largest Share of Mature Workers, A Tapping
Mature Talent Publication, Published with CAEL with Support from The Atlantic Philanthropies, 2012 4 Neeta P. Fogg, Paul E. Harrington and Anja Petrovich, Building Blocks of Labor Market Success: Evidence from
O*NET Job Analysis, Commonwealth Corporation, Boston, April, 2013.
4
adulthood. Indeed, JP Morgan Chase just released a new study decrying the loss of employment
for teens and its impact on young people’s long-term educational and employment outcomes.5
Early work experience seems to exert a positive influence on post high school outcomes
including improved post-high school employment and earnings for those who opt to not attend
college; partially the result of finding work in higher level occupations more quickly after high
school, as these early labor market entry workers advance up the occupational mobility ladder
from where they began as teens. It also appears that working during teen years has important
positive impacts on post-secondary enrollment, retention and graduation from college.
Some findings suggest that summer work reduces criminal and anti-social behavior. A
study conducted in Boston suggests that the higher risk of violent crime among teens who were
jobless during the summer than their peers with summer jobs is likely to be the result of social
isolation that leads to their involvement in risky, deviant, delinquent, and violent behaviors.6
Another study prepared at the University of Pennsylvania showed that summer job programs
reduced violent crimes by African-American teens.7 Finally, there is evidence that work during
teen years yields greater focus and direction when young people make important life choices
about work, school, family formation and child bearing.8
Employment Rates of Teens in Chicago, Illinois, and the U.S., 2000-2014
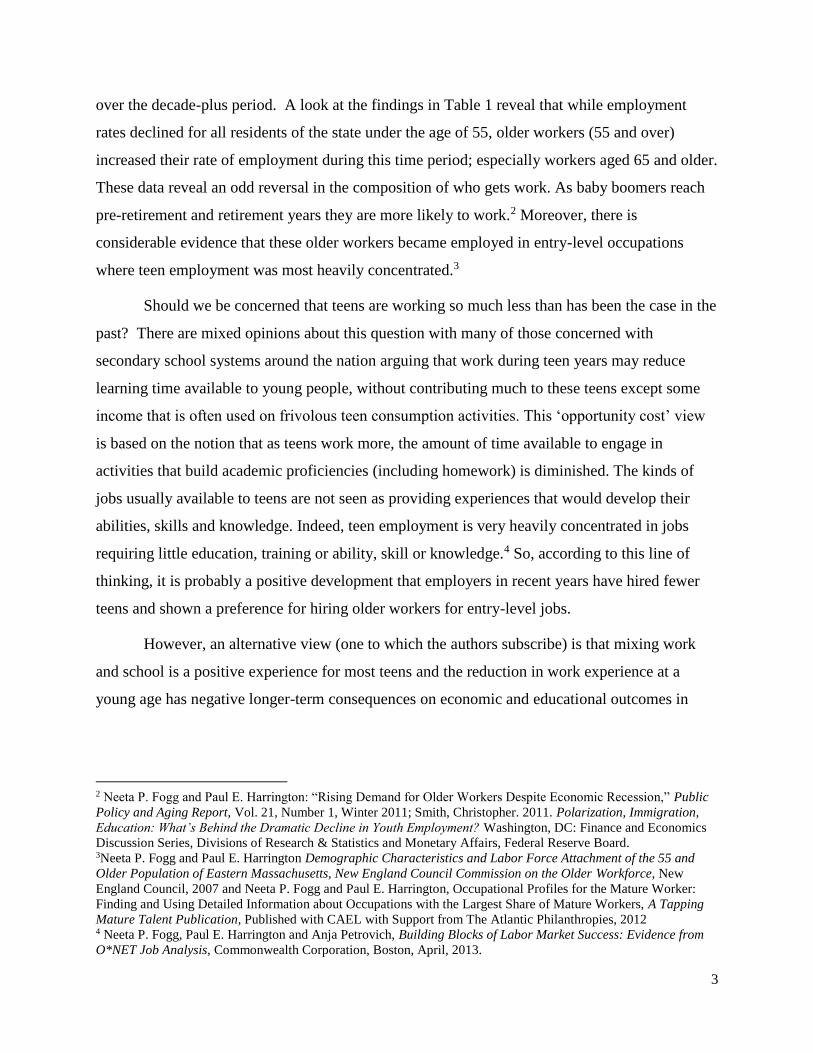
At the peak of the labor market expansion of the 1990s, 32 percent of 16- to 19-year old
residents of Chicago were employed during the year (Chart 2); an employment to population
ratio equal to less than two-thirds of the teen employment rate statewide. After the dot-com bust
of 2001, employment rates among teens in the city, Illinois, and nation began to decline despite
renewed economic and employment growth. Indeed, during the 2005-2007 period, representing
5 Building Skills Through Summer Jobs: Lessons from the Field, J.P. Morgan Chase & Co. January 2015. Retrieved
from: http://www.jpmorganchase.com/corporate/Corporate-Responsibility/document/54887-jpmc-summeryouth-
aw2.pdf. 6 See: Andrew Sum, Mykhaylo Trubskyy, and Walter McHugh, The Summer Employment Experiences and the
Personal/Social Behaviors of Youth Violence Prevention Employment Program Participants and Those of a
Comparison Group, Center for Labor Market Studies, Northeastern University, Prepared for Youth Violence
Prevention Funder Learning Collaborative, Boston, July 2013. 7 See: Sara B. Heller, "Summer jobs reduce violence among disadvantaged youth", Science, Vol. 346, 5 December
2014. 8 For a summary of the gains to early work experience, see: Paul Harrington and Nancy Snyder, Signaling Success:
Boosting Teen Employment Prospects, Commonwealth Corporation, April, 2013. Retrieved from:
http://www.commcorp.org/resources/documents/BoostingTeenEmploymentProspects_042013.pdf
5
the heart of the recovery from the dot-com bust, teen employment rates in Chicago fell to just 19
percent, from 32 percent just five years earlier. As the nation’s economy recovered and added
millions of new jobs, teens lost access to employment across the nation but especially in Chicago
where the teen E/P ratio had a relative decline of more than 40 percent.
Chart 2:
Trends in Employment-Population Ratios of Persons 16-to-19 Year Old in Chicago City, Illinois,
and the U.S., Selected Time Periods 1998-2013 (3-Year Averages)
Source: Current Population Surveys (CPS), 1998 through 2014, public use files, U.S. Census Bureau, tabulations by
Center for Labor Markets and Policy, Drexel University.
Triggered by a crisis in financial markets, the Great Recession of 2008-2009 generated
massive job losses in most states of the nation, with unemployment and underemployment
skyrocketing and young persons, including new college graduates, experiencing tremendous
difficulties in transitioning into employment.9 Teens in Chicago saw their access to employment
reduced markedly from its pre-recession low. During the 2008-2010 period the city’s teen
employment to population ratio fell again to just 15 percent, half the employment rate of the
9 Neeta P. Fogg and Paul E, Harrington, “From Labor Shortage to Labor Surplus: The Changing Labor Market
Context and Its Meaning for Higher Education,” Continuing Higher Education Review, Vol. 73, 2009; Neeta P.
Fogg and Paul E. Harrington, Rising Mal-Employment and the Great Recession: The Growing Disconnection
between Recent College Graduates and the College Labor Market,” Continuing Higher Education Review, Vol. 75,
2011.
32.1
49.5
45.5
19.2
36.8 36.9
15.6
29.9 29.7
13.3
27.6 26.6
0
10
20
30
40
50
60
Chicago City Illinois U.S.
1998-2000 2005-2007 2008-2010 2011-2013
6
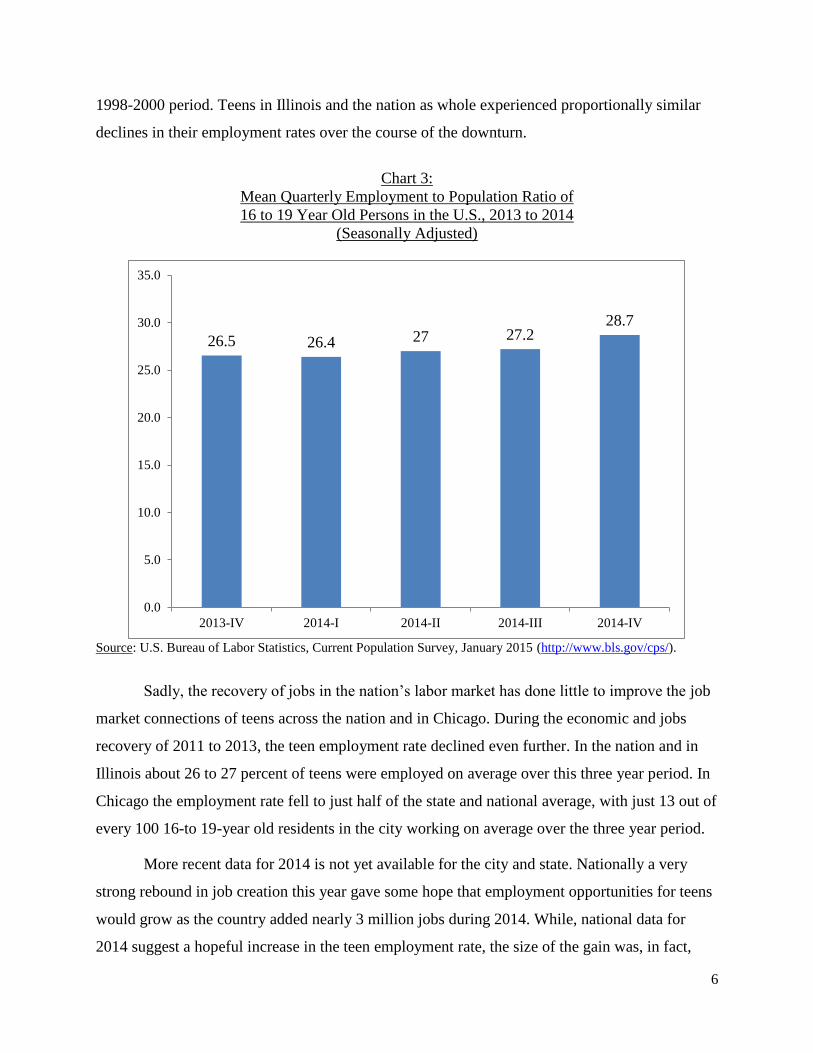
1998-2000 period. Teens in Illinois and the nation as whole experienced proportionally similar
declines in their employment rates over the course of the downturn.
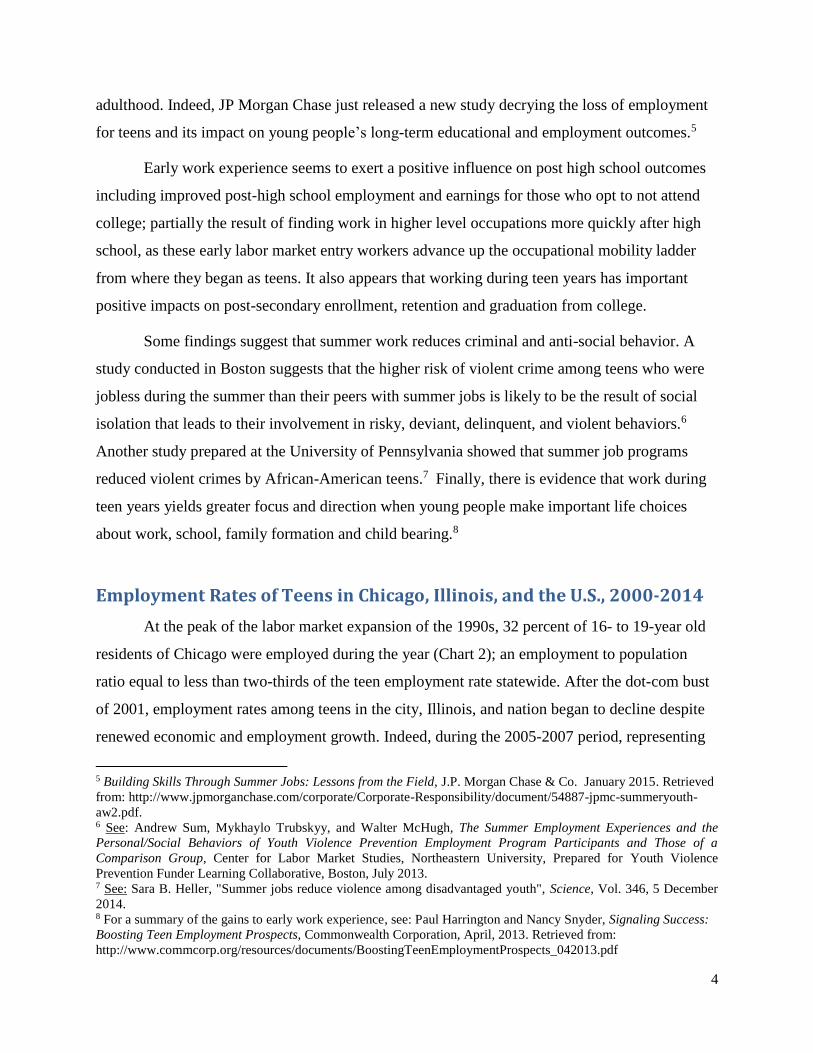
Chart 3:
Mean Quarterly Employment to Population Ratio of
16 to 19 Year Old Persons in the U.S., 2013 to 2014
(Seasonally Adjusted)
Source: U.S. Bureau of Labor Statistics, Current Population Survey, January 2015 (http://www.bls.gov/cps/).
Sadly, the recovery of jobs in the nation’s labor market has done little to improve the job
market connections of teens across the nation and in Chicago. During the economic and jobs
recovery of 2011 to 2013, the teen employment rate declined even further. In the nation and in
Illinois about 26 to 27 percent of teens were employed on average over this three year period. In
Chicago the employment rate fell to just half of the state and national average, with just 13 out of
every 100 16-to 19-year old residents in the city working on average over the three year period.
More recent data for 2014 is not yet available for the city and state. Nationally a very
strong rebound in job creation this year gave some hope that employment opportunities for teens
would grow as the country added nearly 3 million jobs during 2014. While, national data for
2014 suggest a hopeful increase in the teen employment rate, the size of the gain was, in fact,
26.5 26.4 27 27.228.7
0.0
5.0
10.0
15.0
20.0
25.0
30.0
35.0
2013-IV 2014-I 2014-II 2014-III 2014-IV
7
quite modest. The overall employment rate for teens in the nation increased from a near historic
low of 26.5 percent at the end of 2013 to a slightly improved, but still very low 28.7 percent by
the fourth quarter of 2014. We suspect that the chances of a similar increase in teen employment
rates in Illinois or Chicago during 2014 are not strong. The pace of new job creation in Illinois
during 2014 was among the slowest in the nation. The state ranked 46th among all states in its
pace of new job creation, posting a rate of new job gains that was two-thirds slower than the
nation as a whole. This poor pace of state’s new job creation in recent months extends back to
the beginning of the nation’s jobs recovery in early 2010.
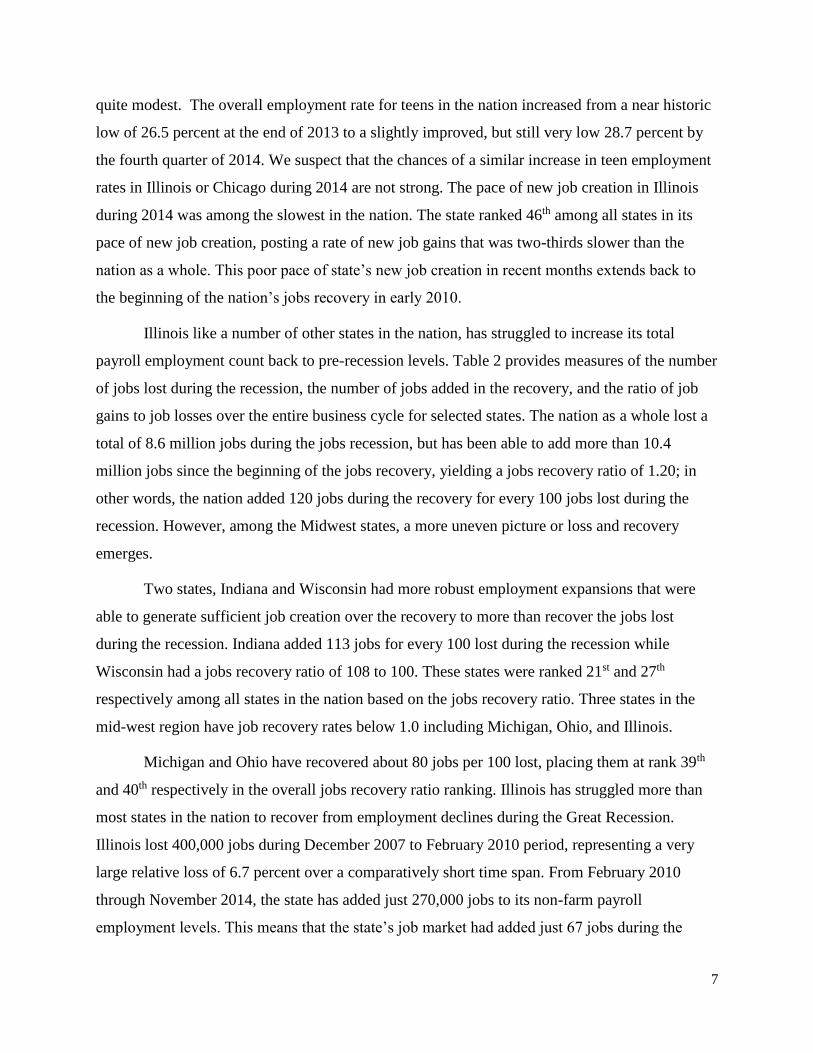
Illinois like a number of other states in the nation, has struggled to increase its total
payroll employment count back to pre-recession levels. Table 2 provides measures of the number
of jobs lost during the recession, the number of jobs added in the recovery, and the ratio of job
gains to job losses over the entire business cycle for selected states. The nation as a whole lost a
total of 8.6 million jobs during the jobs recession, but has been able to add more than 10.4
million jobs since the beginning of the jobs recovery, yielding a jobs recovery ratio of 1.20; in
other words, the nation added 120 jobs during the recovery for every 100 jobs lost during the
recession. However, among the Midwest states, a more uneven picture or loss and recovery
emerges.
Two states, Indiana and Wisconsin had more robust employment expansions that were
able to generate sufficient job creation over the recovery to more than recover the jobs lost
during the recession. Indiana added 113 jobs for every 100 lost during the recession while
Wisconsin had a jobs recovery ratio of 108 to 100. These states were ranked 21st and 27th
respectively among all states in the nation based on the jobs recovery ratio. Three states in the
mid-west region have job recovery rates below 1.0 including Michigan, Ohio, and Illinois.
Michigan and Ohio have recovered about 80 jobs per 100 lost, placing them at rank 39th
and 40th respectively in the overall jobs recovery ratio ranking. Illinois has struggled more than
most states in the nation to recover from employment declines during the Great Recession.
Illinois lost 400,000 jobs during December 2007 to February 2010 period, representing a very
large relative loss of 6.7 percent over a comparatively short time span. From February 2010
through November 2014, the state has added just 270,000 jobs to its non-farm payroll
employment levels. This means that the state’s job market had added just 67 jobs during the
8
current recovery for every 100 jobs lost during the recession, ranking the state 43rd among all 50
states in its ability to generate new employment opportunities of a magnitude sufficient to
overcome the losses that occurred during the Great Recession.
Table 2:
Ratio of Non-Farm Payroll Employment Gains During the Current Recovery to Jobs Lost During
the Great Recession, Selected States and the U.S, Ranked
(Seasonally Adjusted Data)
Relative
Rank
Employment
Change During the
Current Recovery
Employment Change
During the Great
Jobs Recession
Ratio of Jobs
Recovered to
Jobs Lost
43 Illinois 270.6 -400.1 0.67
21 Indiana 240.4 -213.5 1.13
39 Michigan 328.3 -410.5 0.80
40 Ohio 330.3 -419.3 0.79
27 Wisconsin 182.7 -168.6 1.08
U.S. 10440 8645 1.20 Source: U.S. Bureau of Labor Statistics, Current Employment Statistics (CES) Survey; recovery includes job gains
between February 2010 through November 2014. Period of jobs recession includes December 2007 through
February, 2010 tabulations by Center for Labor Markets and Policy, Drexel University.
The large jobs recovery deficit and the slow pace of new job creation in Illinois creates a
labor market environment that is less favorable than the nation as whole. This suggests that the
employment situation for teens in Illinois may not have improved even at the very modest pace
of job market improvement we noted among teens in the nation as a whole.
Trends in the Employment to Population Ratios of the 16 to 19 Year Olds
in the Largest Cities in the Nation
One of our key tasks in preparing this paper is to gain insight into the employment
situation of working-age teen residents of the city of Chicago. Up to this point we have relied
primarily on data derived from the Current Population Survey (CPS) that, while based on a
relatively small sample size, permits us to examine labor market developments over a long
period of time using a consistent set of data concepts and measures. However, we will now rely
on findings from the American Community Survey (ACS), a large, but relatively new, sample
9
survey of households that is used to produce annual average measures of a wide range of
economic, social, demographic and housing characteristics of households and individuals—even
at the city and town level. It is important to note that the ACS survey questionnaire uses
somewhat different labor force measures than the CPS survey that we have used in the preceding
sections (the survey used by the U.S. Bureau of Labor Statistics to produce the monthly
Employment Situation report that includes the official measure of unemployment levels and rates
in the nation).
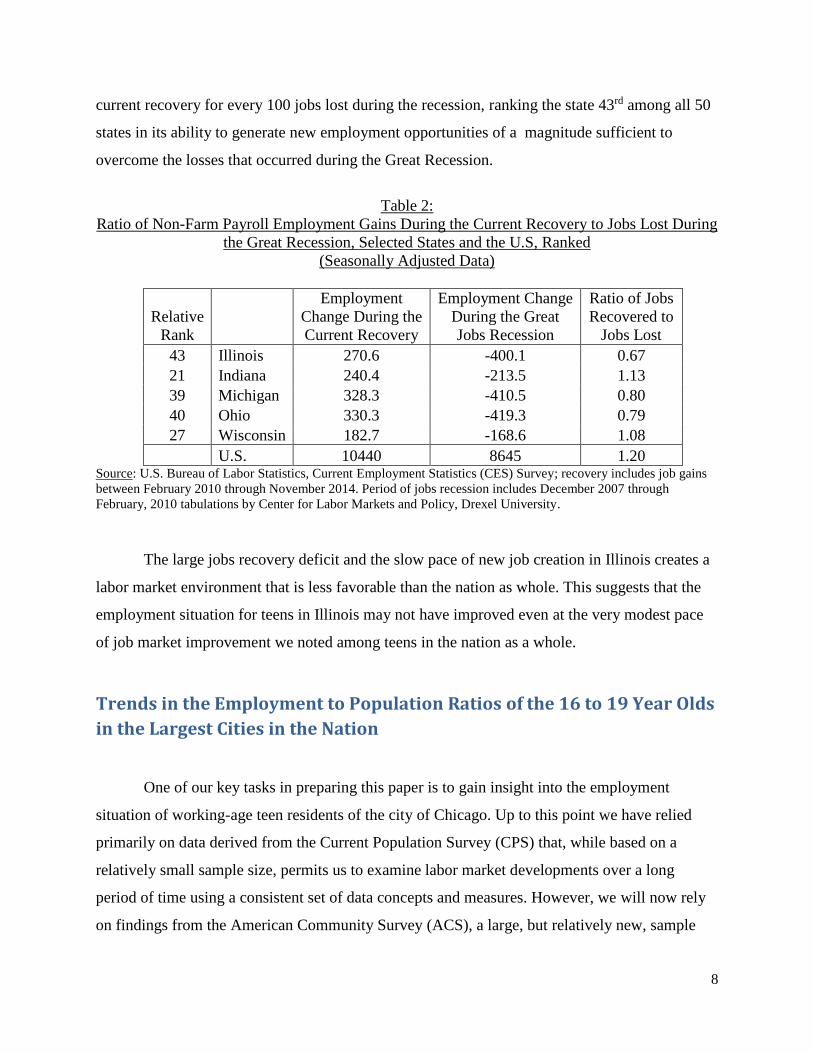
For a comparative perspective, we have analyzed U.S. Census Bureau’s ACS data on
employment status of teens and young adults in the 25 most populous cities across the U.S. and
compared employment outcomes of Chicago’s youth with their counterparts in these 25 cities
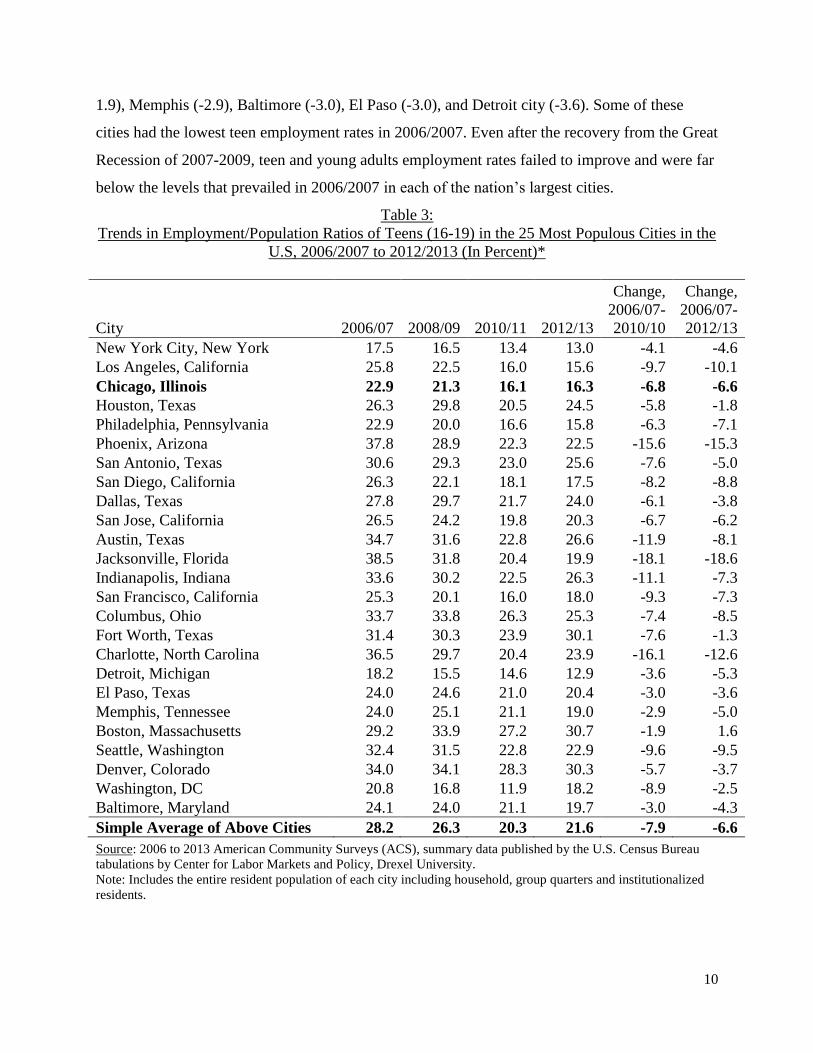
over the 2006-2013 period.10 Table 3 displays employment rates of teens in the 25 most populous
cities in the U.S. before, during, and after the Great Recession of 2007-2009. Overall, average
teen employment rates in these 25 cities fell from 28.2 percent in 2006/2007 to 26.3 percent in
2008/2008 and 20.3 percent in 2011/2012, before increasing slightly to 21.6 percent in
2012/2013.
We found extraordinarily large variations in employment rates of teens in these 25 cities.
During 2006-2007, employment rates of teens in these 25 cities ranged from lows of 17.5 percent
in New York City and 18.2 percent in Detroit to highs of 37.8 percent in Phoenix and 38.5
percent in Jacksonville, Florida. Chicago’s 22.9 percent employment rate in 2006/07 was quite
low and ranked 4th lowest, in a tie with Philadelphia among the 25 largest cities in the country.
During and after the Great Recession of 2007-2009, the already low employment rates of
teens in ALL of these cities fell further. Over the 2006/2007- 2010/2011 period, the
employment-population ratio decline in these cities ranged from a low of 1.9 percentage points
in Boston (Massachusetts) to a high of 18 percentage points in Jacksonville. Chicago city’s 6.8
percentage point employment-population decline of the teen employment rate over the 2006/07-
2010/11 period was in the middle of the pack at 13th. The five cities experiencing more than 10
percentage points decline in teen employment rates over this time period included Indianapolis (-
11.1), Austin (-11.9), Phoenix (-15.6), Charlotte (-16.1), and Jacksonville (-18.1). Five cities
with lowest employment-population ratio decline for teens over this time period were Boston (- 10 Full implementation of the ACS survey began in 2005 but comparable ACS data became available beginning in
2006.
10
1.9), Memphis (-2.9), Baltimore (-3.0), El Paso (-3.0), and Detroit city (-3.6). Some of these
cities had the lowest teen employment rates in 2006/2007. Even after the recovery from the Great
Recession of 2007-2009, teen and young adults employment rates failed to improve and were far
below the levels that prevailed in 2006/2007 in each of the nation’s largest cities.
Table 3:
Trends in Employment/Population Ratios of Teens (16-19) in the 25 Most Populous Cities in the
U.S, 2006/2007 to 2012/2013 (In Percent)*
City 2006/07 2008/09 2010/11 2012/13
Change,
2006/07-
2010/10
Change,
2006/07-
2012/13
New York City, New York 17.5 16.5 13.4 13.0 -4.1 -4.6
Los Angeles, California 25.8 22.5 16.0 15.6 -9.7 -10.1
Chicago, Illinois 22.9 21.3 16.1 16.3 -6.8 -6.6
Houston, Texas 26.3 29.8 20.5 24.5 -5.8 -1.8
Philadelphia, Pennsylvania 22.9 20.0 16.6 15.8 -6.3 -7.1
Phoenix, Arizona 37.8 28.9 22.3 22.5 -15.6 -15.3
San Antonio, Texas 30.6 29.3 23.0 25.6 -7.6 -5.0
San Diego, California 26.3 22.1 18.1 17.5 -8.2 -8.8
Dallas, Texas 27.8 29.7 21.7 24.0 -6.1 -3.8
San Jose, California 26.5 24.2 19.8 20.3 -6.7 -6.2
Austin, Texas 34.7 31.6 22.8 26.6 -11.9 -8.1
Jacksonville, Florida 38.5 31.8 20.4 19.9 -18.1 -18.6
Indianapolis, Indiana 33.6 30.2 22.5 26.3 -11.1 -7.3
San Francisco, California 25.3 20.1 16.0 18.0 -9.3 -7.3
Columbus, Ohio 33.7 33.8 26.3 25.3 -7.4 -8.5
Fort Worth, Texas 31.4 30.3 23.9 30.1 -7.6 -1.3
Charlotte, North Carolina 36.5 29.7 20.4 23.9 -16.1 -12.6
Detroit, Michigan 18.2 15.5 14.6 12.9 -3.6 -5.3
El Paso, Texas 24.0 24.6 21.0 20.4 -3.0 -3.6
Memphis, Tennessee 24.0 25.1 21.1 19.0 -2.9 -5.0
Boston, Massachusetts 29.2 33.9 27.2 30.7 -1.9 1.6
Seattle, Washington 32.4 31.5 22.8 22.9 -9.6 -9.5
Denver, Colorado 34.0 34.1 28.3 30.3 -5.7 -3.7
Washington, DC 20.8 16.8 11.9 18.2 -8.9 -2.5
Baltimore, Maryland 24.1 24.0 21.1 19.7 -3.0 -4.3
Simple Average of Above Cities 28.2 26.3 20.3 21.6 -7.9 -6.6
Source: 2006 to 2013 American Community Surveys (ACS), summary data published by the U.S. Census Bureau
tabulations by Center for Labor Markets and Policy, Drexel University.
Note: Includes the entire resident population of each city including household, group quarters and institutionalized
residents.
11
Trends in Employment Rates of Teens Across Gender and Race-Ethnic
Groups
Once again relying on two years of ACS sample data to increase sample size and
statistical precision, we have produced employment rate measures for a number of demographic
and socio-economic groups of teens and young adults in the city of Chicago, the entire state of
Illinois, and the nation. Using combined ACS data from 2006 and 2007 we have estimated teen
employment rates before the onset of the Great Recession, A comparison with teen employment
rate from the (most recent) combined ACS data (2012 and 2013) provides insights on how these
groups fared on the employment measure from the pre-recession 2006-07 period to the most
recent 2012-13 period-characterized by economic recovery and new job creation in the nation.
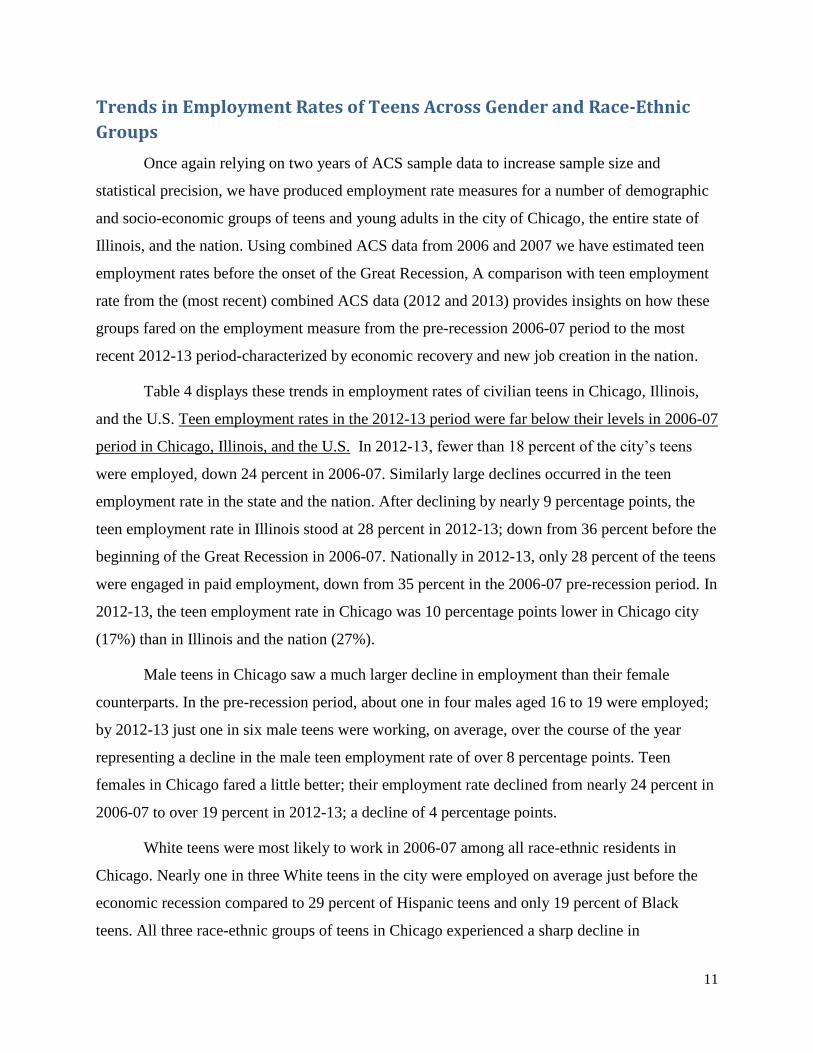
Table 4 displays these trends in employment rates of civilian teens in Chicago, Illinois,
and the U.S. Teen employment rates in the 2012-13 period were far below their levels in 2006-07
period in Chicago, Illinois, and the U.S. In 2012-13, fewer than 18 percent of the city’s teens
were employed, down 24 percent in 2006-07. Similarly large declines occurred in the teen
employment rate in the state and the nation. After declining by nearly 9 percentage points, the
teen employment rate in Illinois stood at 28 percent in 2012-13; down from 36 percent before the
beginning of the Great Recession in 2006-07. Nationally in 2012-13, only 28 percent of the teens
were engaged in paid employment, down from 35 percent in the 2006-07 pre-recession period. In
2012-13, the teen employment rate in Chicago was 10 percentage points lower in Chicago city
(17%) than in Illinois and the nation (27%).
Male teens in Chicago saw a much larger decline in employment than their female
counterparts. In the pre-recession period, about one in four males aged 16 to 19 were employed;
by 2012-13 just one in six male teens were working, on average, over the course of the year
representing a decline in the male teen employment rate of over 8 percentage points. Teen
females in Chicago fared a little better; their employment rate declined from nearly 24 percent in
2006-07 to over 19 percent in 2012-13; a decline of 4 percentage points.
White teens were most likely to work in 2006-07 among all race-ethnic residents in
Chicago. Nearly one in three White teens in the city were employed on average just before the
economic recession compared to 29 percent of Hispanic teens and only 19 percent of Black
teens. All three race-ethnic groups of teens in Chicago experienced a sharp decline in
12
employment. The decline in the city’s teen employment between 2006-07 and 2012-13 was the
highest among Hispanic teens (-7.9 percentage points) and Blacks teens (-5.5 percentage points)
and lowest among White teens (-2.3 percentage points).11 Similar declines in the teen
employment-population ratio occurred in Illinois and the U.S. over the 2006-07 and 2012-13
time period.
Black teens faced the bleakest employment prospects in the city of Chicago. In both
periods, among the major race-ethnic groups, Black teens had the lowest employment rate in the
city. Only 16 percent of Black teens in Chicago were employed in 2006-07. By 2012-13, their
employment rate stood at 10.5 percent. In both periods, Black teen employment rates in Chicago
city was sharply lower than their peers across Illinois and the U.S. In Illinois, 15 percent of Black
teens were employed in 2012-13 compared to 19 percent in the nation. The city’s Hispanic teen
residents were also less likely to be employed compared to their state and national counterparts.
One-fifth of Hispanic teens in Chicago were employed in 2012-13 compared to one-fourth in the
state and the nation.
Table 4:
Employment to (Non Institutional) Population Ratios of Teens (16-19) in The City of Chicago,
Illinois, and the U.S., Total and by Gender and Race-Ethnic Group, 2006-07 and 2012-13 (In %)
Chicago City Illinois U.S.
Group 2006-07
2012-
13
Absolute
Change
2006-
07
2012-
13
Absolute
Change
2006-
07
2012-
13
Absolute
Change
Male 24.7 16.4 -8.2 34.5 24.8 -9.6 34.4 26.1 -8.3
Female 23.7 19.4 -4.3 37.9 30.4 -7.5 36.3 29.3 -7.1
Black 16.0 10.5 -5.5 20.0 14.9 -5.1 25.1 18.8 -6.3
Hispanic 29.2 21.2 -7.9 35.5 25.5 -10.0 32.6 24.6 -8.0
White 32.6 30.3 -2.3 41.4 33.3 -8.1 39.6 32.1 -7.5 Source: 2006, 2007, 2012, and 2013 American Community Surveys, public use files, U.S. Census Bureau,
tabulations by Center for Labor Markets and Policy, Drexel University.
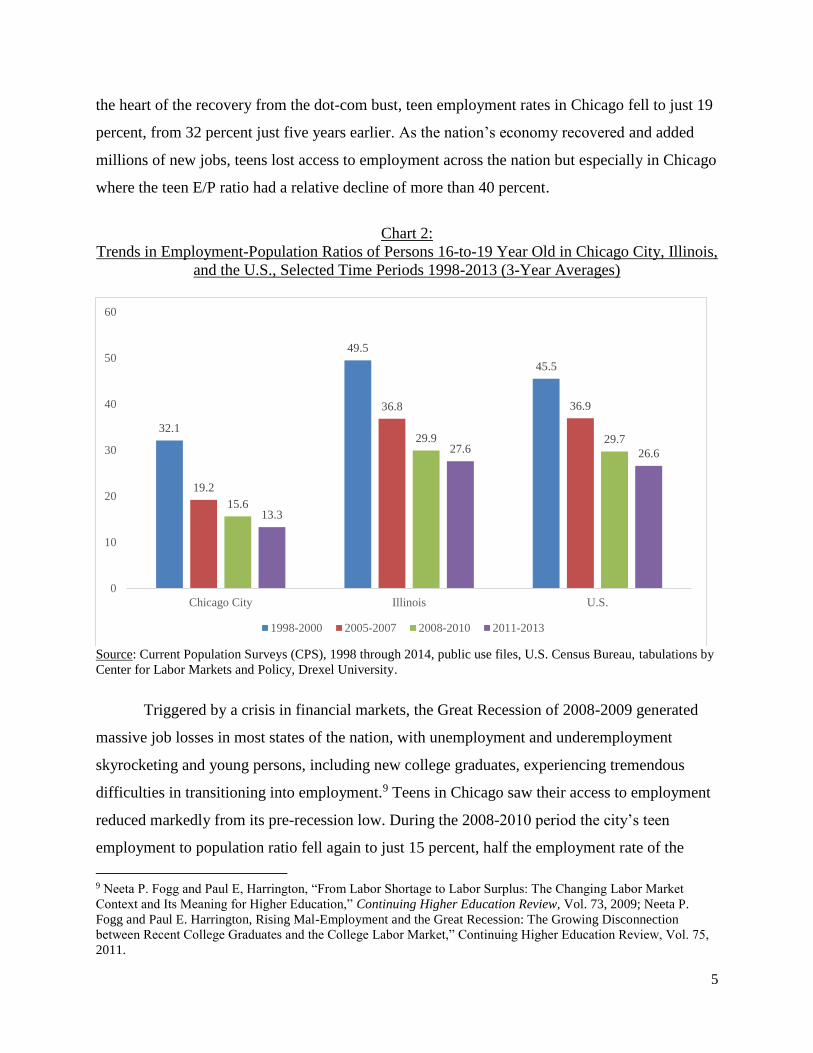
In Chicago, Illinois, and the U.S., minority male teens, Black male teens in particular,
faced severe challenges in obtaining any type of paid employment. Between 2006-07 and 2012-
13, the employment rate among Chicago’s Black male teens declined from 14 percent to just 9
11 White teen employment in Chicago did not decline as sharply (as Illinois or the nation) since a disproportionate
share (indeed most) of the city’s resident White teens were enrolled in school while most of the teen employment
decline in the city has occurred among out-of-school teens. This issue should be explored more carefully in the
future.
13
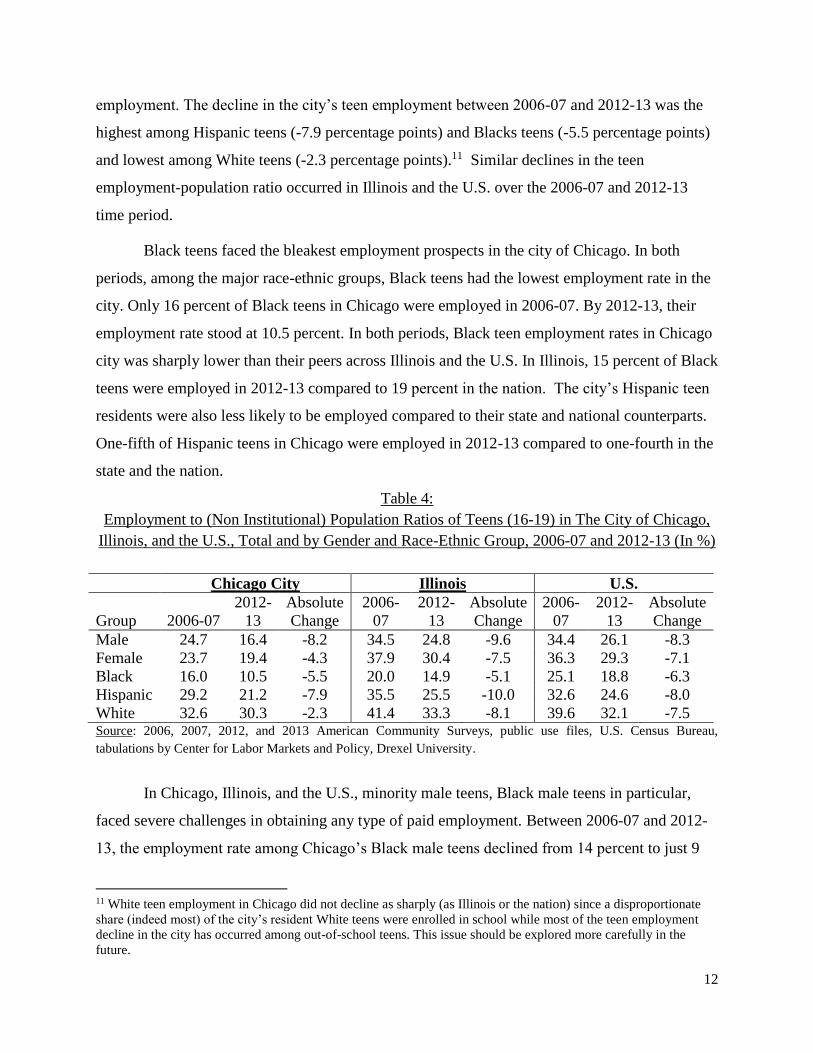
percent; the lowest employment rate among their peers among the major race-ethnic groups. A
startling 91 percent of teenaged Black males in Chicago were jobless in 2012-13 (Chart 4). In
Illinois, the employment rate among Black male teens dropped from 18 percent in 2006-07 to 11
percent in 2012-13. In comparison to their peers nationwide, Black male teens in both Chicago
city and Illinois had much lower employment rates in 2006-07 and 2012-13. In the entire U.S.,
the Black male teen employment rate declined from 24 percent in 2006-07 to 17 percent in 2012-
13, a decline of 6.6 percentage points.
Chart 4:
Employment-Population Ratio of Black Male Teens (16-19) in Chicago City, Illinois, and the
U.S., 2006-07 and 2012-13 (In %)
Source: 2006, 2007, 2012 and 2013 American Community Surveys, public use files, U.S. Census Bureau,
tabulations by Center for Labor Markets and Policy, Drexel University.
Employment Rates of Teens in Chicago City, Illinois, and the U.S. by
Household Income, 2012-2013
The likelihood of a teen working is closely related to the level of family income. Teens
who live in households with middle and upper income levels had employment rates that are
higher than their peers with lower incomes. Teens in the lowest income households were
especially less likely to be employed. In the city of Chicago, employment rates of teens rose
13.6
17.8
23.5
9.1
11.4
16.9
0.0
5.0
10.0
15.0
20.0
25.0
Chicago City Illinois U.S.
2006-07 2012-13
14
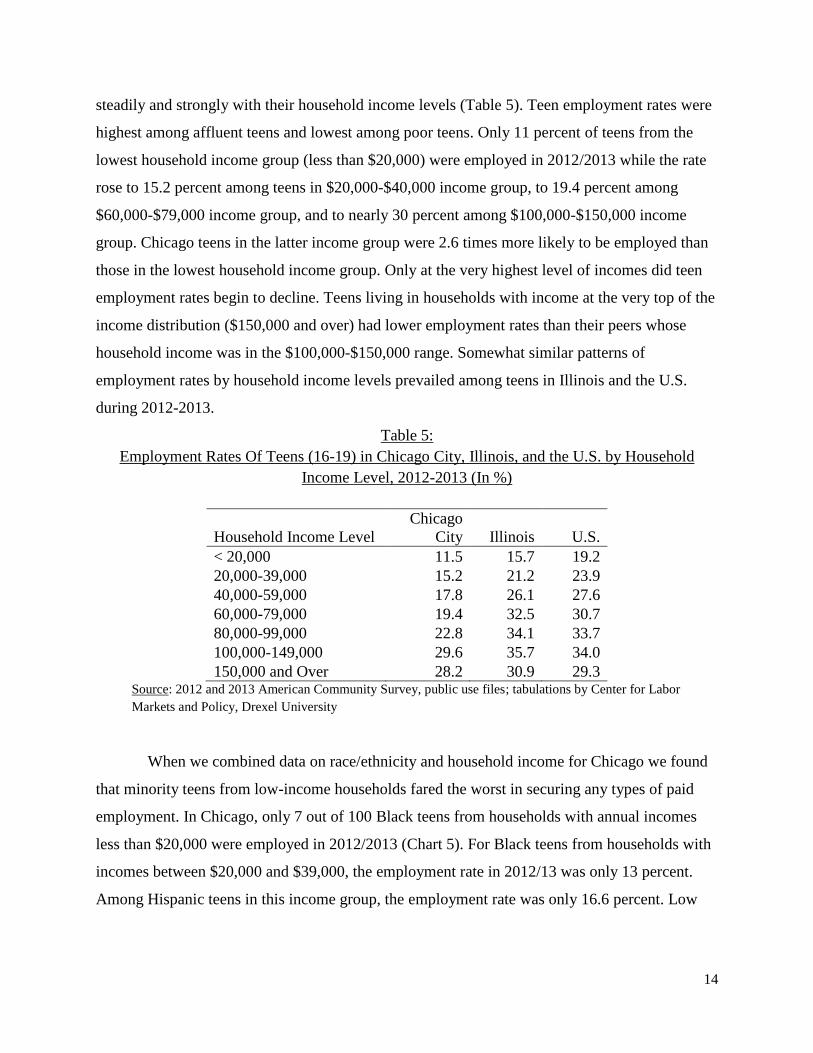
steadily and strongly with their household income levels (Table 5). Teen employment rates were
highest among affluent teens and lowest among poor teens. Only 11 percent of teens from the
lowest household income group (less than $20,000) were employed in 2012/2013 while the rate
rose to 15.2 percent among teens in $20,000-$40,000 income group, to 19.4 percent among
$60,000-$79,000 income group, and to nearly 30 percent among $100,000-$150,000 income
group. Chicago teens in the latter income group were 2.6 times more likely to be employed than
those in the lowest household income group. Only at the very highest level of incomes did teen
employment rates begin to decline. Teens living in households with income at the very top of the
income distribution ($150,000 and over) had lower employment rates than their peers whose
household income was in the $100,000-$150,000 range. Somewhat similar patterns of
employment rates by household income levels prevailed among teens in Illinois and the U.S.
during 2012-2013.
Table 5:
Employment Rates Of Teens (16-19) in Chicago City, Illinois, and the U.S. by Household
Income Level, 2012-2013 (In %)
Household Income Level
Chicago
City Illinois U.S.
< 20,000 11.5 15.7 19.2
20,000-39,000 15.2 21.2 23.9
40,000-59,000 17.8 26.1 27.6
60,000-79,000 19.4 32.5 30.7
80,000-99,000 22.8 34.1 33.7
100,000-149,000 29.6 35.7 34.0
150,000 and Over 28.2 30.9 29.3 Source: 2012 and 2013 American Community Survey, public use files; tabulations by Center for Labor
Markets and Policy, Drexel University
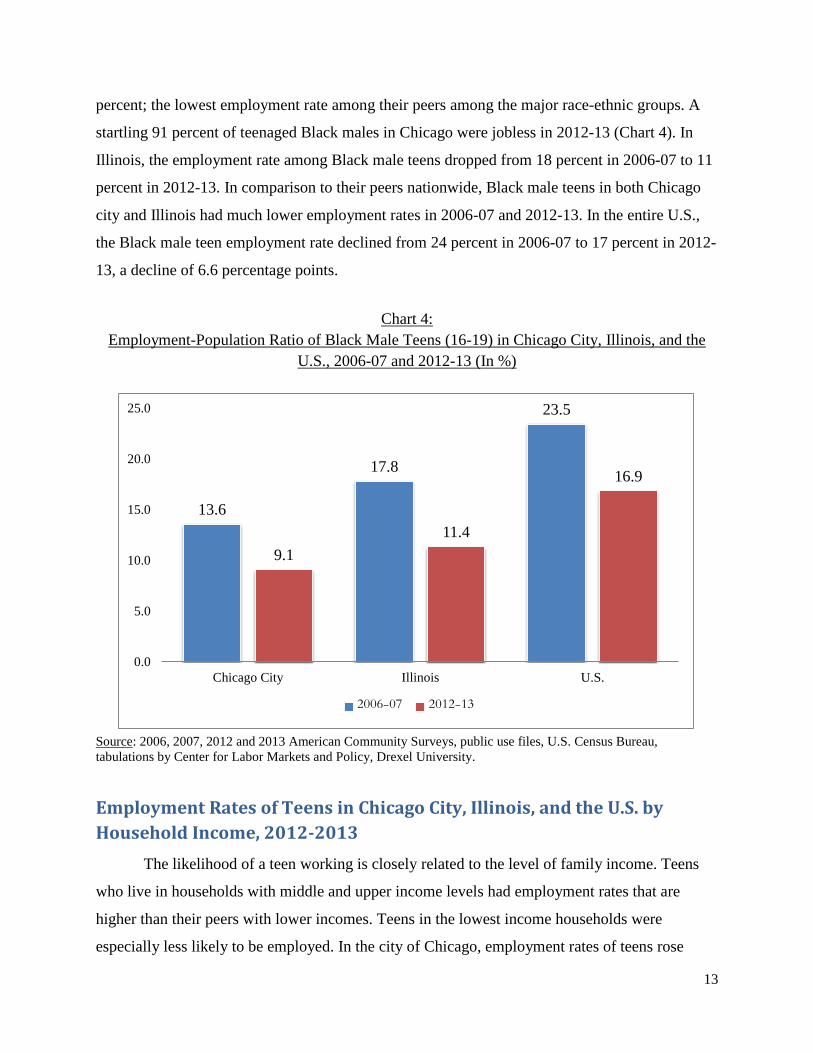
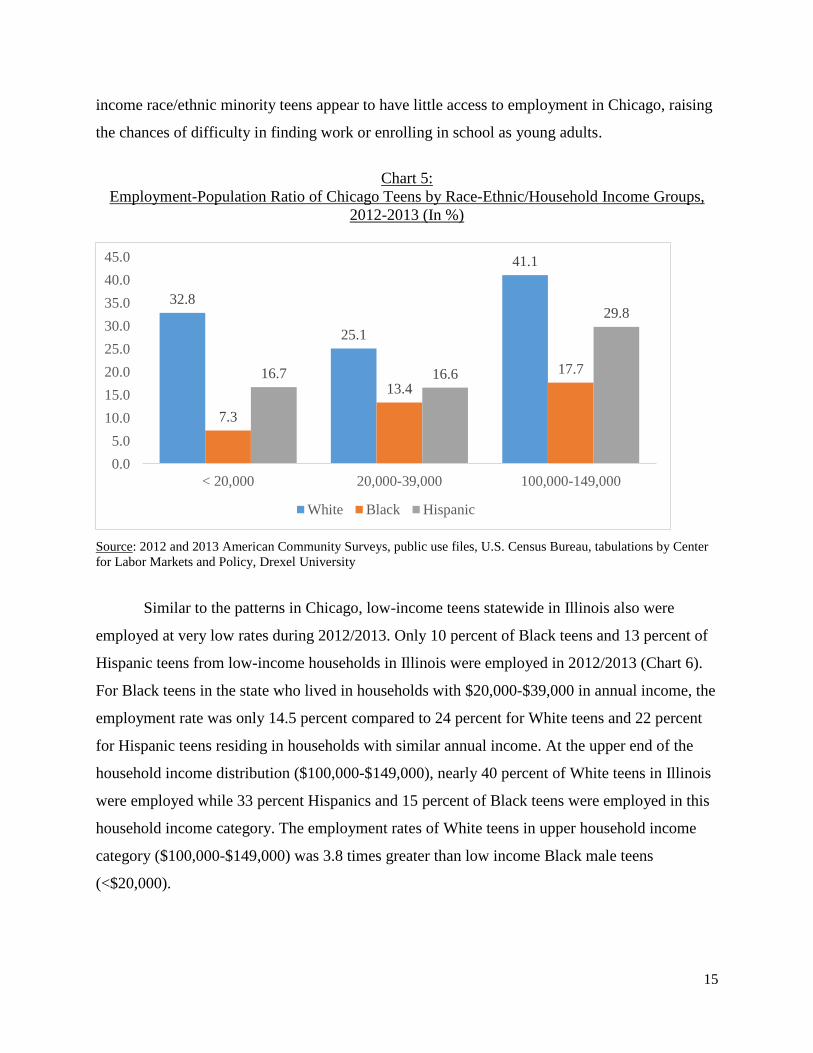
When we combined data on race/ethnicity and household income for Chicago we found
that minority teens from low-income households fared the worst in securing any types of paid
employment. In Chicago, only 7 out of 100 Black teens from households with annual incomes
less than $20,000 were employed in 2012/2013 (Chart 5). For Black teens from households with
incomes between $20,000 and $39,000, the employment rate in 2012/13 was only 13 percent.
Among Hispanic teens in this income group, the employment rate was only 16.6 percent. Low
15
income race/ethnic minority teens appear to have little access to employment in Chicago, raising
the chances of difficulty in finding work or enrolling in school as young adults.
Chart 5:
Employment-Population Ratio of Chicago Teens by Race-Ethnic/Household Income Groups,
2012-2013 (In %)
Source: 2012 and 2013 American Community Surveys, public use files, U.S. Census Bureau, tabulations by Center
for Labor Markets and Policy, Drexel University
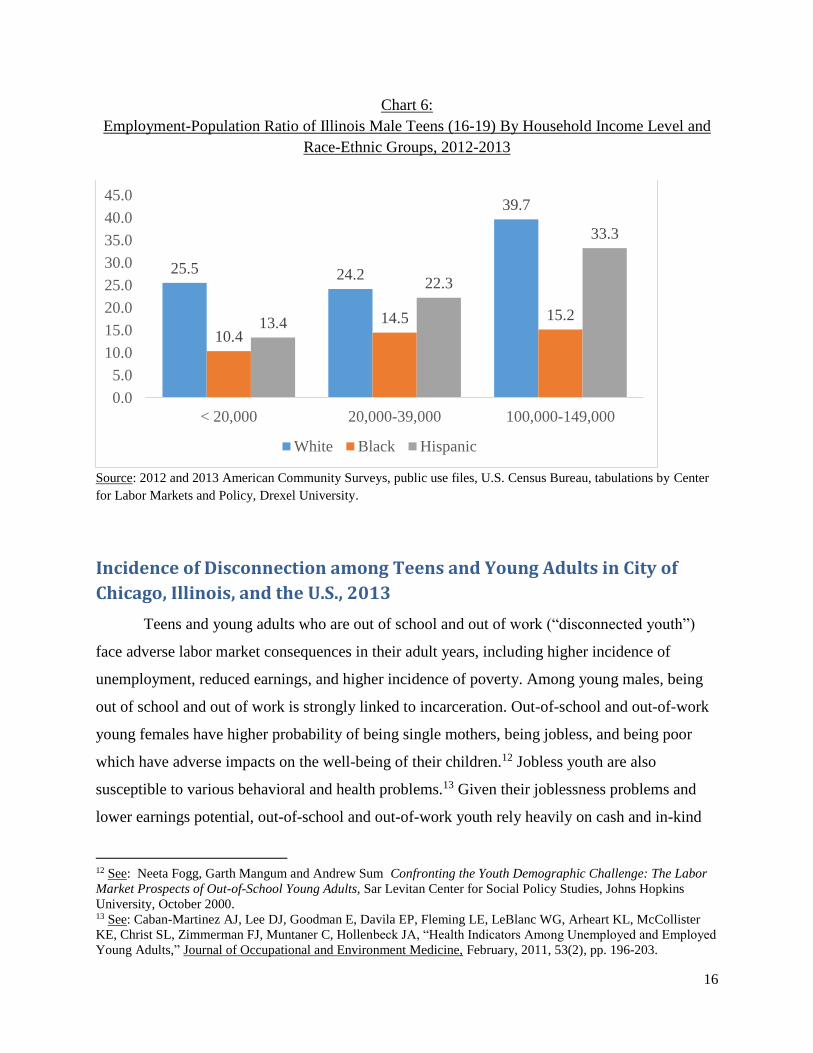
Similar to the patterns in Chicago, low-income teens statewide in Illinois also were
employed at very low rates during 2012/2013. Only 10 percent of Black teens and 13 percent of
Hispanic teens from low-income households in Illinois were employed in 2012/2013 (Chart 6).
For Black teens in the state who lived in households with $20,000-$39,000 in annual income, the
employment rate was only 14.5 percent compared to 24 percent for White teens and 22 percent
for Hispanic teens residing in households with similar annual income. At the upper end of the
household income distribution ($100,000-$149,000), nearly 40 percent of White teens in Illinois
were employed while 33 percent Hispanics and 15 percent of Black teens were employed in this
household income category. The employment rates of White teens in upper household income
category ($100,000-$149,000) was 3.8 times greater than low income Black male teens
(<$20,000).
32.8
25.1
41.1
7.3
13.4
17.716.7 16.6
29.8
0.0
5.0
10.0
15.0
20.0
25.0
30.0
35.0
40.0
45.0
< 20,000 20,000-39,000 100,000-149,000
White Black Hispanic
16
Chart 6:
Employment-Population Ratio of Illinois Male Teens (16-19) By Household Income Level and
Race-Ethnic Groups, 2012-2013
Source: 2012 and 2013 American Community Surveys, public use files, U.S. Census Bureau, tabulations by Center
for Labor Markets and Policy, Drexel University.
Incidence of Disconnection among Teens and Young Adults in City of
Chicago, Illinois, and the U.S., 2013
Teens and young adults who are out of school and out of work (“disconnected youth”)
face adverse labor market consequences in their adult years, including higher incidence of
unemployment, reduced earnings, and higher incidence of poverty. Among young males, being
out of school and out of work is strongly linked to incarceration. Out-of-school and out-of-work
young females have higher probability of being single mothers, being jobless, and being poor
which have adverse impacts on the well-being of their children.12 Jobless youth are also
susceptible to various behavioral and health problems.13 Given their joblessness problems and
lower earnings potential, out-of-school and out-of-work youth rely heavily on cash and in-kind
12 See: Neeta Fogg, Garth Mangum and Andrew Sum Confronting the Youth Demographic Challenge: The Labor
Market Prospects of Out-of-School Young Adults, Sar Levitan Center for Social Policy Studies, Johns Hopkins
University, October 2000. 13 See: Caban-Martinez AJ, Lee DJ, Goodman E, Davila EP, Fleming LE, LeBlanc WG, Arheart KL, McCollister
KE, Christ SL, Zimmerman FJ, Muntaner C, Hollenbeck JA, “Health Indicators Among Unemployed and Employed
Young Adults,” Journal of Occupational and Environment Medicine, February, 2011, 53(2), pp. 196-203.
25.5 24.2
39.7
10.4
14.5 15.213.4
22.3
33.3
0.0
5.0
10.0
15.0
20.0
25.0
30.0
35.0
40.0
45.0
< 20,000 20,000-39,000 100,000-149,000
White Black Hispanic
17
transfers from the government to make their living. The likelihood of being out-of-school and
out-of-work is found to be higher among central city minority youth, among those in poor
neighborhoods, and those living with single parents.
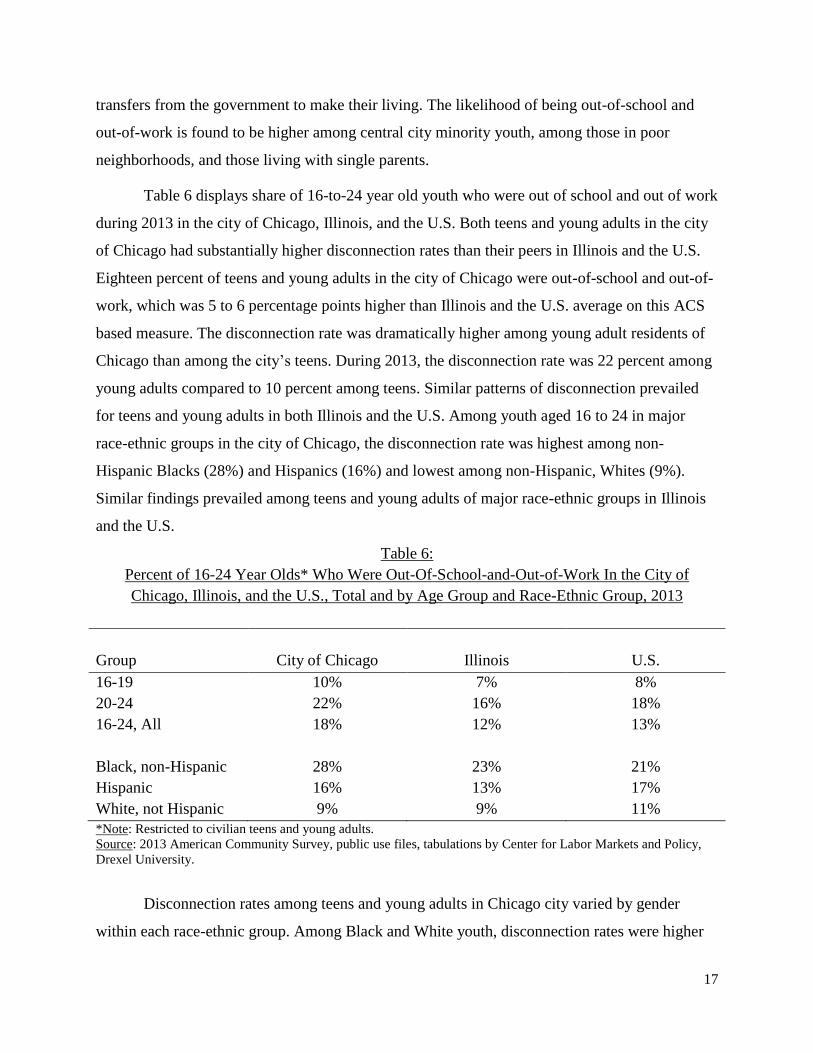
Table 6 displays share of 16-to-24 year old youth who were out of school and out of work
during 2013 in the city of Chicago, Illinois, and the U.S. Both teens and young adults in the city
of Chicago had substantially higher disconnection rates than their peers in Illinois and the U.S.
Eighteen percent of teens and young adults in the city of Chicago were out-of-school and out-of-
work, which was 5 to 6 percentage points higher than Illinois and the U.S. average on this ACS
based measure. The disconnection rate was dramatically higher among young adult residents of
Chicago than among the city’s teens. During 2013, the disconnection rate was 22 percent among
young adults compared to 10 percent among teens. Similar patterns of disconnection prevailed
for teens and young adults in both Illinois and the U.S. Among youth aged 16 to 24 in major
race-ethnic groups in the city of Chicago, the disconnection rate was highest among non-
Hispanic Blacks (28%) and Hispanics (16%) and lowest among non-Hispanic, Whites (9%).
Similar findings prevailed among teens and young adults of major race-ethnic groups in Illinois
and the U.S.
Table 6:
Percent of 16-24 Year Olds* Who Were Out-Of-School-and-Out-of-Work In the City of
Chicago, Illinois, and the U.S., Total and by Age Group and Race-Ethnic Group, 2013
Group City of Chicago Illinois U.S.
16-19 10% 7% 8%
20-24 22% 16% 18%
16-24, All 18% 12% 13%
Black, non-Hispanic 28% 23% 21%
Hispanic 16% 13% 17%
White, not Hispanic 9% 9% 11%
*Note: Restricted to civilian teens and young adults.
Source: 2013 American Community Survey, public use files, tabulations by Center for Labor Markets and Policy,
Drexel University.
Disconnection rates among teens and young adults in Chicago city varied by gender
within each race-ethnic group. Among Black and White youth, disconnection rates were higher
18
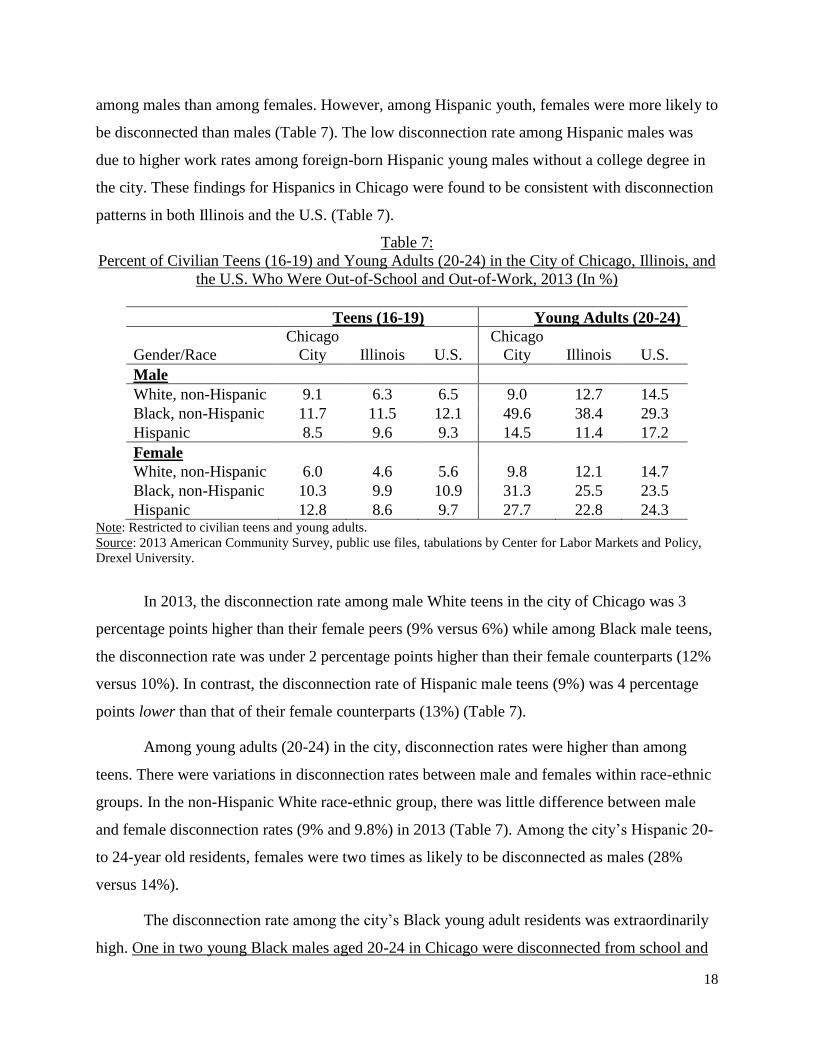
among males than among females. However, among Hispanic youth, females were more likely to
be disconnected than males (Table 7). The low disconnection rate among Hispanic males was
due to higher work rates among foreign-born Hispanic young males without a college degree in
the city. These findings for Hispanics in Chicago were found to be consistent with disconnection
patterns in both Illinois and the U.S. (Table 7).
Table 7:
Percent of Civilian Teens (16-19) and Young Adults (20-24) in the City of Chicago, Illinois, and
the U.S. Who Were Out-of-School and Out-of-Work, 2013 (In %)
Teens (16-19) Young Adults (20-24)
Gender/Race
Chicago
City Illinois U.S.
Chicago
City Illinois U.S.
Male
White, non-Hispanic 9.1 6.3 6.5 9.0 12.7 14.5
Black, non-Hispanic 11.7 11.5 12.1 49.6 38.4 29.3
Hispanic 8.5 9.6 9.3 14.5 11.4 17.2
Female
White, non-Hispanic 6.0 4.6 5.6 9.8 12.1 14.7
Black, non-Hispanic 10.3 9.9 10.9 31.3 25.5 23.5
Hispanic 12.8 8.6 9.7 27.7 22.8 24.3 Note: Restricted to civilian teens and young adults.
Source: 2013 American Community Survey, public use files, tabulations by Center for Labor Markets and Policy,
Drexel University.
In 2013, the disconnection rate among male White teens in the city of Chicago was 3
percentage points higher than their female peers (9% versus 6%) while among Black male teens,
the disconnection rate was under 2 percentage points higher than their female counterparts (12%
versus 10%). In contrast, the disconnection rate of Hispanic male teens (9%) was 4 percentage
points lower than that of their female counterparts (13%) (Table 7).
Among young adults (20-24) in the city, disconnection rates were higher than among
teens. There were variations in disconnection rates between male and females within race-ethnic
groups. In the non-Hispanic White race-ethnic group, there was little difference between male
and female disconnection rates (9% and 9.8%) in 2013 (Table 7). Among the city’s Hispanic 20-
to 24-year old residents, females were two times as likely to be disconnected as males (28%
versus 14%).
The disconnection rate among the city’s Black young adult residents was extraordinarily
high. One in two young Black males aged 20-24 in Chicago were disconnected from school and

19
work. Black females in this age group in the city also had a very high disconnection rate (31%).
Black males between the ages of 20 and 24 in Chicago were 5.5 * more likely to be disconnected
than their White peers (50% versus 9%). Such extreme rates of disconnection among such a large
fraction of the city’s population bodes poorly for the employment and earnings prospects of
young residents of the city, and for the city’s ability to grow and prosper as a center of economic
activity and upward mobility.
20
Data Sources and Methodology
Two major data sources - Monthly Current Population Surveys (CPS) and American
Community Surveys (ACS) were used to generate labor market outcomes for teens and young
adults in the city of Chicago, Illinois, and the U.S. appearing in this report. The CPS is a monthly
national household survey conducted by the U.S. Census Bureau for the U.S. Bureau of Labor
Statistics with a nationally representative sample of approximately 60,000 households per month.
The survey asks working-age non-institutionalized household members 16 and older about their
labor force status, job seeking activities, hours of work, industry and occupations of employment
etc. Monthly estimates of nation’s civilian labor force, employed and unemployed populations
and official unemployment rates published by the U.S. Bureau of Labor Statistics are based on
this survey.
The ACS is a national survey conducted year-round by the U.S. Census Bureau. Nearly 3
million households are randomly surveyed throughout the year. The ACS collects detailed
information on demographic and socioeconomic characteristics of household members, including
their citizenship status, place of birth, place of work, their educational attainment levels and
school enrollment status, college major field of study, labor force status, industry and occupation
of jobs, their mean annual earnings, commuting behavior, receipt of various government cash
and in-kind transfers, health insurance status, home ownership status, property tax payment etc.
Estimates in this report were generated from the ACS’s public use sample data from 2006
to 2013. To generate employment estimates from these ACS public use samples, we used person
weights provided in the public use data files. We have also used U.S. Census Bureau’s published
data from the ACS from 2006 through 2012. Estimates of time series employment for teens and
young adults in the City of Chicago, Illinois, and the U.S. appearing in this report are generated
from Monthly CPS public use files from 1998 to 2014.