Embed Size (px)
Citation preview
Undergraduate Student Persistence and Completion: Do Pell Grants
Matter?
Charles Hatcher, California CompetesCAIR Conference,
Tongshan Chang, University of California Office of the President
November 20, 2013
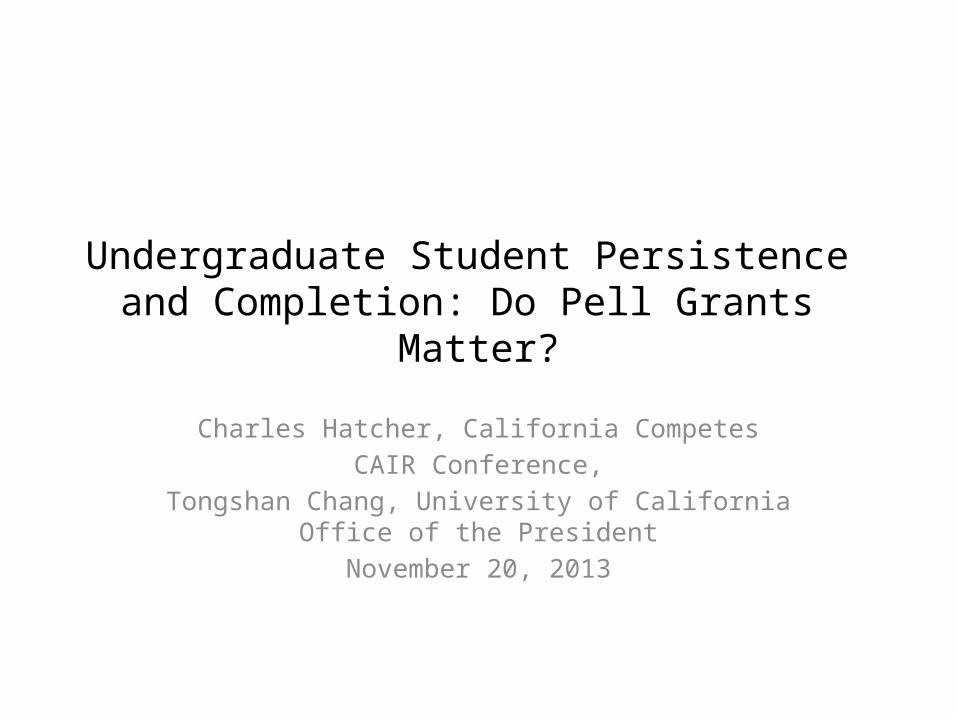
Motivation
What is the purpose of financial aid?1. Incent Enrollment– Boost the Academic Profile of the incoming class– Promote/Advertise Socioeconomic Diversity
2. Provide Support : $$ could increase the likelihood of student success

(1) And (2) are not mutually exclusive, but they aren’t identical either…
Federal Pell Grant Program
• Federal Effort to exclusively provide SUPPORT
– Financial Aid for College Students with no Bachelor’s Degree
– Can be used at participating (accredited) institutions
– Attached to Students, not schools
Federal Pell Grant Program
– Pell eligibility and amount based on federally determined Expected Family Contribution (EFC)• Amount determined additionally by the cost of
attendance
– Maximum Grant is $5645 per year in 2013-14– Maximum Duration of Eligibility is the equivalent
of 6 years of full-time funding
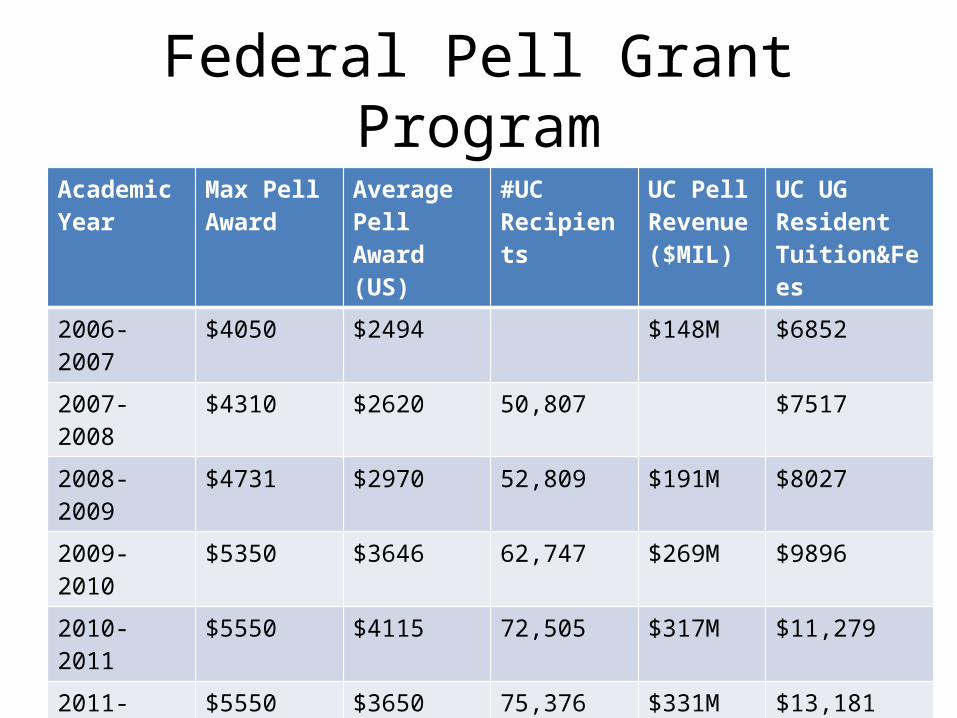
Federal Pell Grant ProgramAcademic Year
Max Pell Award
Average Pell Award (US)
#UC Recipients
UC Pell Revenue ($MIL)
UC UG Resident Tuition&Fees
2006-2007 $4050 $2494 $148M $6852
2007-2008 $4310 $2620 50,807 $7517
2008-2009 $4731 $2970 52,809 $191M $8027
2009-2010 $5350 $3646 62,747 $269M $9896
2010-2011 $5550 $4115 72,505 $317M $11,279
2011-2012 $5550 $3650 75,376 $331M $13,181
Common Factors that lead to student success?
• High School Grades– Difficulty of the curriculum– Highest level of math completed
• Standardized Test Scores• Effects depend on race and gender• Institutional Characteristics and “Match” is
important
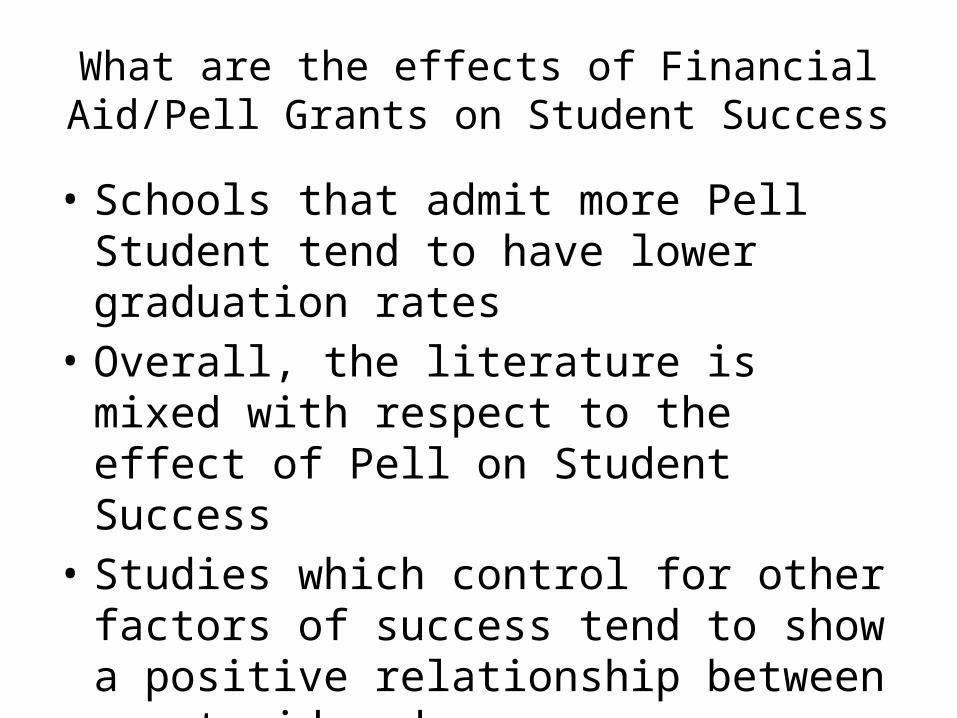
What are the effects of Financial Aid/Pell Grants on Student Success
• Schools that admit more Pell Student tend to have lower graduation rates
• Overall, the literature is mixed with respect to the effect of Pell on Student Success
• Studies which control for other factors of success tend to show a positive relationship between grant aid and success.
Our Research Questions:
• Who Are Pell Grant Recipients in the First Year?
• Who Receives Pell Grants in ANY of the first 4 years?
• Who Receives Pell Grants in ALL of the first four years?
• What Happens to them?
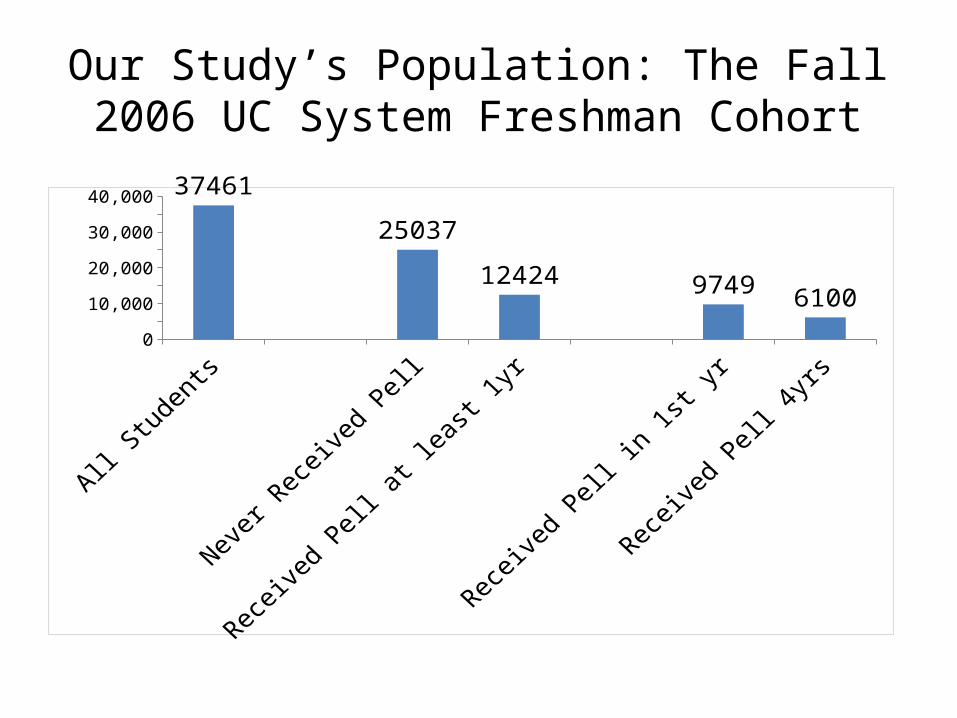
Our Study’s Population: The Fall 2006 UC System Freshman Cohort
All Stu-
dents
Never Received
Pell
Received Pell at
least 1yr
Received Pell in 1st yr
Received Pell 4yrs
0
5,000
10,000
15,000
20,000
25,000
30,000
35,000
40,000 37461
25037
124249749
6100
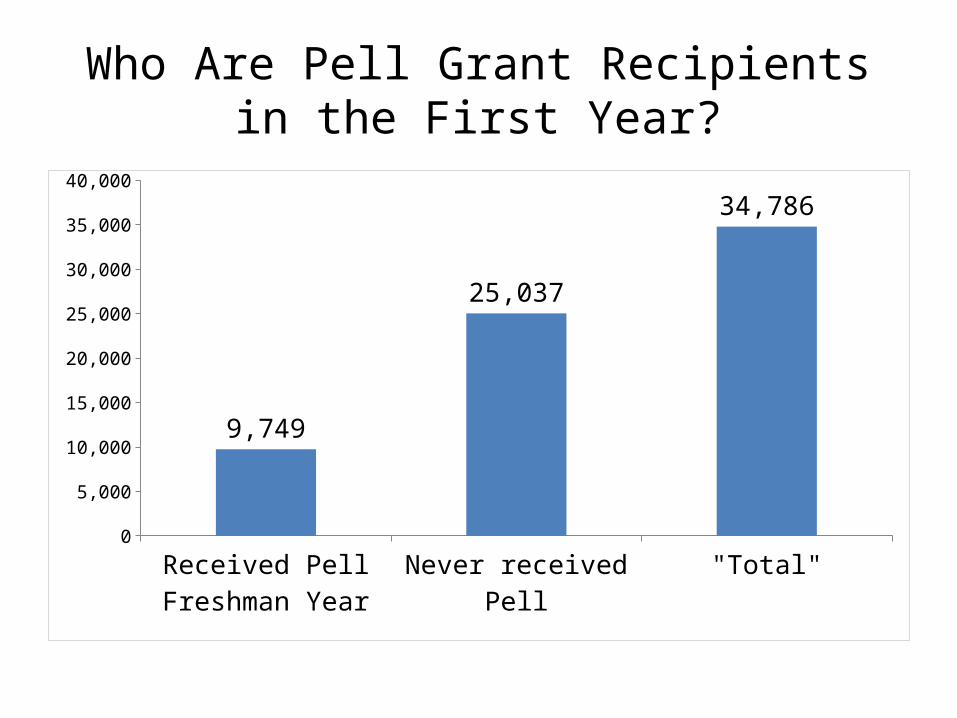
Who Are Pell Grant Recipients in the First Year?
Received Pell Freshman Year
Never received Pell "Total"0
5,000
10,000
15,000
20,000
25,000
30,000
35,000
40,000
9,749
25,037
34,786
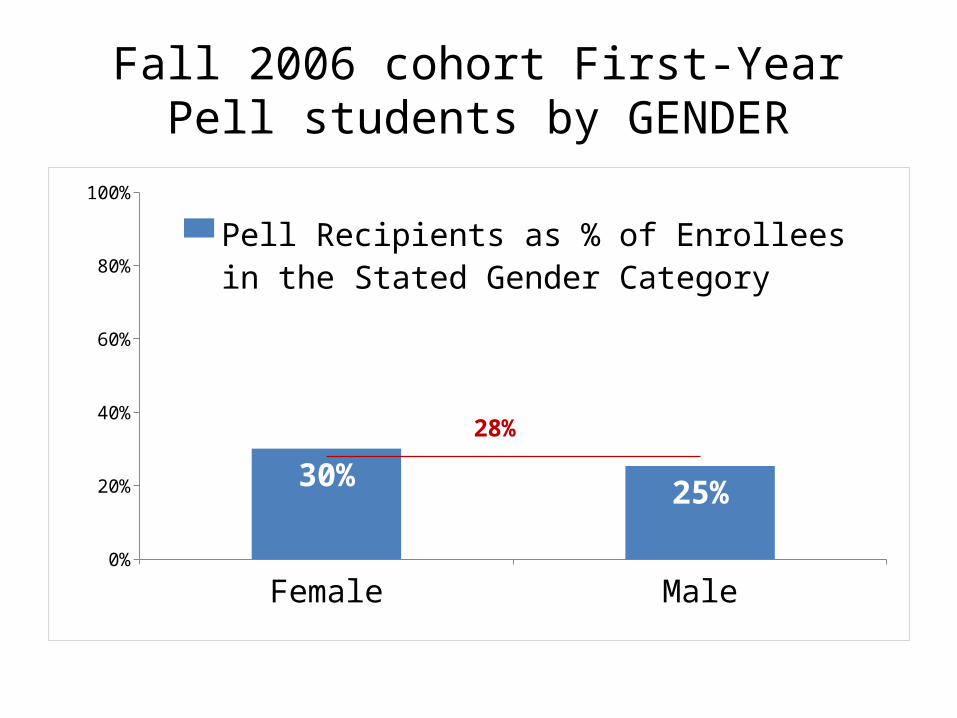
Fall 2006 cohort First-Year Pell students by GENDER
Female Male0%
20%
40%
60%
80%
100%
30% 25%
28%
Pell Recipients as % of Enrollees in the Stated Gender Category
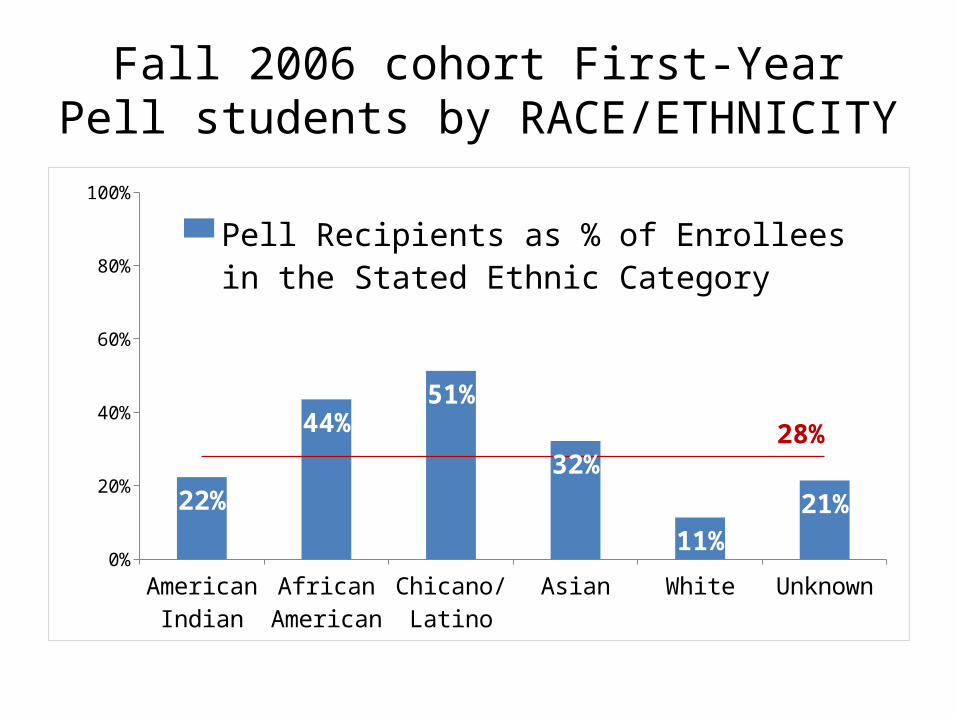
Fall 2006 cohort First-Year Pell students by RACE/ETHNICITY
American Indian
African American
Chicano/ Latino
Asian White Unknown0%
20%
40%
60%
80%
100%
22%
44%51%
32%
11%21%
28%
Pell Recipients as % of Enrollees in the Stated Ethnic Category
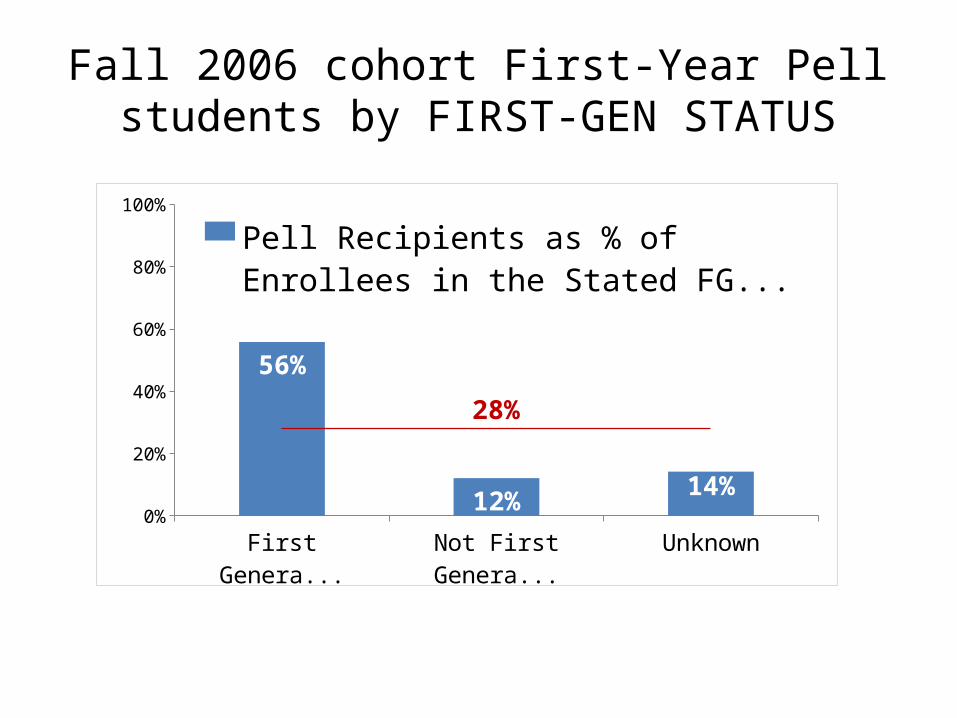
Fall 2006 cohort First-Year Pell students by FIRST-GEN STATUS
First Generation Not First Generation Unknown0%
20%
40%
60%
80%
100%
56%
12% 14%
28%
Pell Recipients as % of Enrollees in the Stated FG CategoryOverall Percent of Pell Recipients
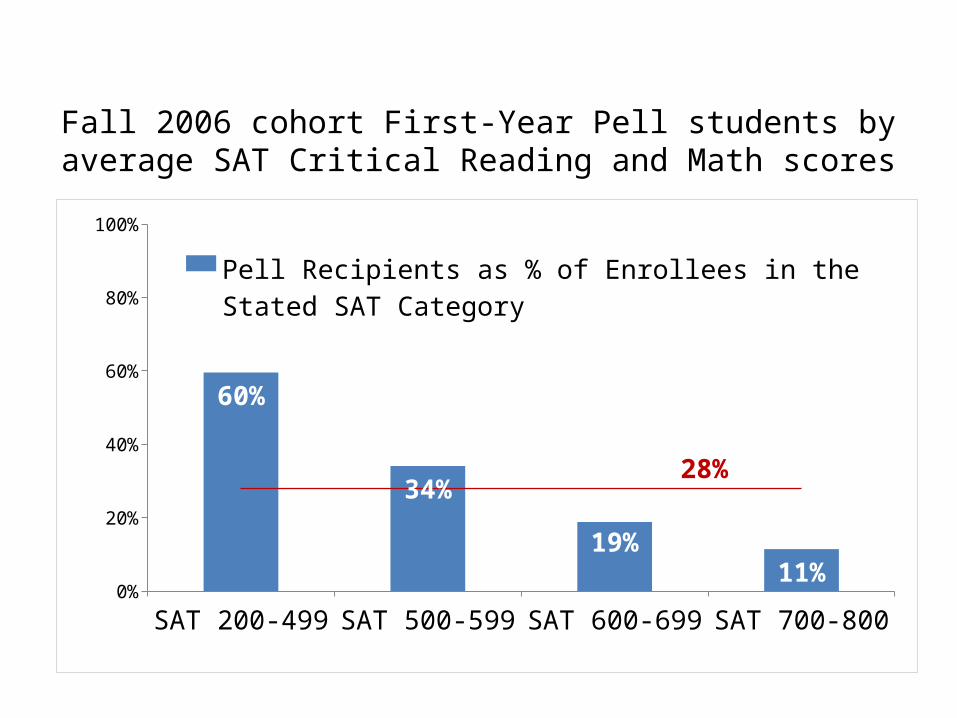
Fall 2006 cohort First-Year Pell students by average SAT Critical Reading and Math scores
SAT 200-499 SAT 500-599 SAT 600-699 SAT 700-8000%
20%
40%
60%
80%
100%
60%
34%
19%11%
28%
Pell Recipients as % of Enrollees in the Stated SAT Category
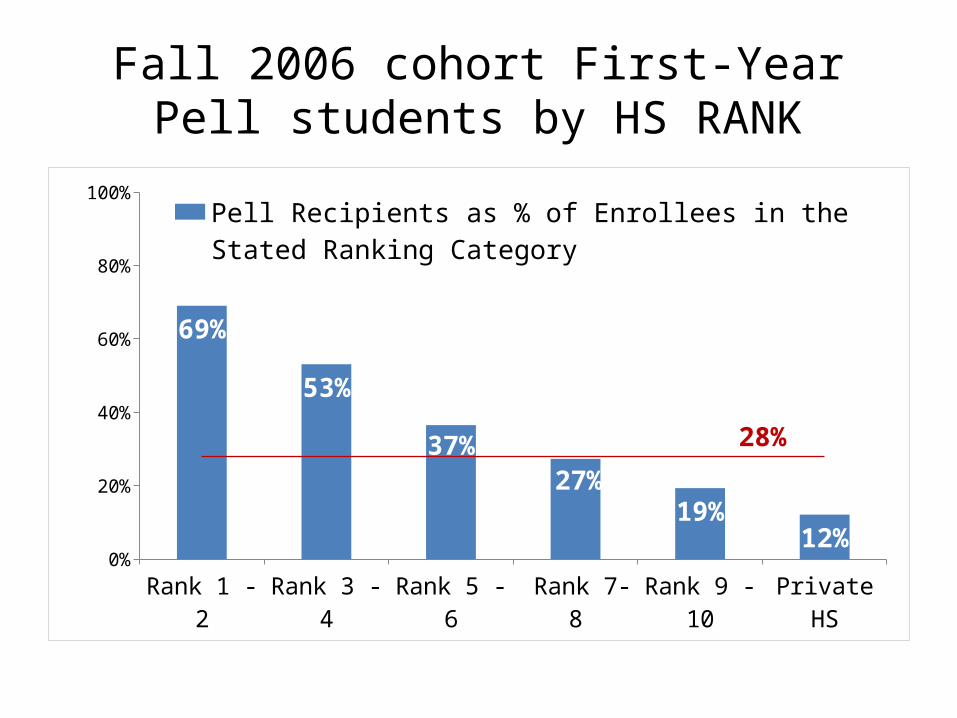
Fall 2006 cohort First-Year Pell students by HS RANK
Rank 1 - 2 Rank 3 - 4 Rank 5 - 6 Rank 7- 8 Rank 9 - 10 Private HS0%
20%
40%
60%
80%
100%
69%
53%
37%27%
19%12%
28%
Pell Recipients as % of Enrollees in the Stated Ranking Cat-egoryOverall Percent of Pell Recipients
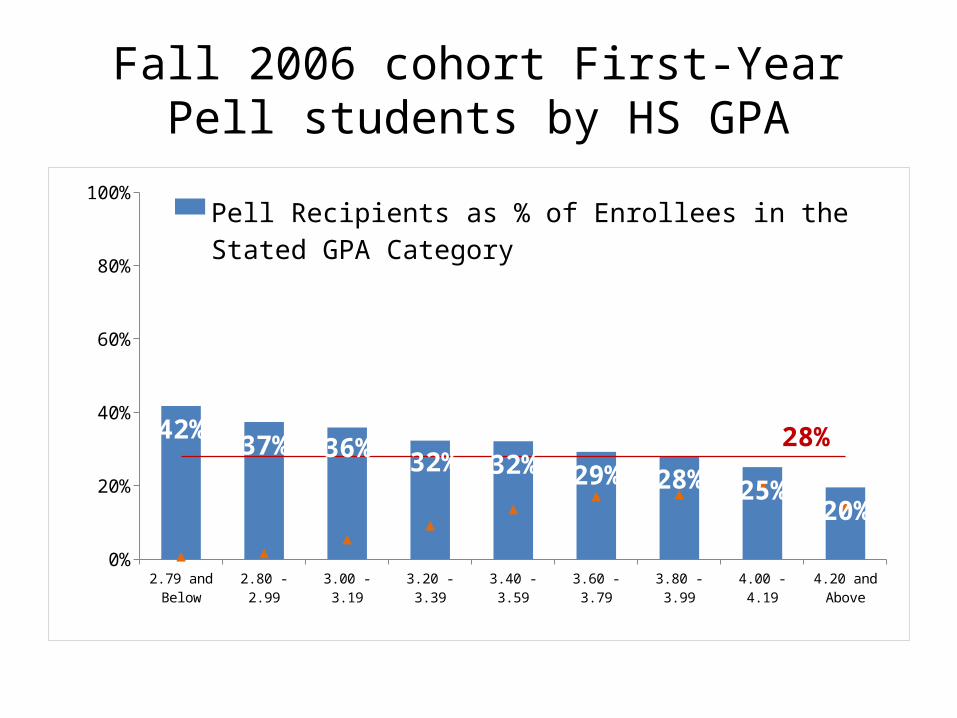
Fall 2006 cohort First-Year Pell students by HS GPA
2.79 and Be-low
2.80 - 2.99 3.00 - 3.19 3.20 - 3.39 3.40 - 3.59 3.60 - 3.79 3.80 - 3.99 4.00 - 4.19 4.20 and Above
0%
20%
40%
60%
80%
100%
42% 37% 36% 32% 32% 29% 28% 25%20%
28%
Pell Recipients as % of Enrollees in the Stated GPA Category
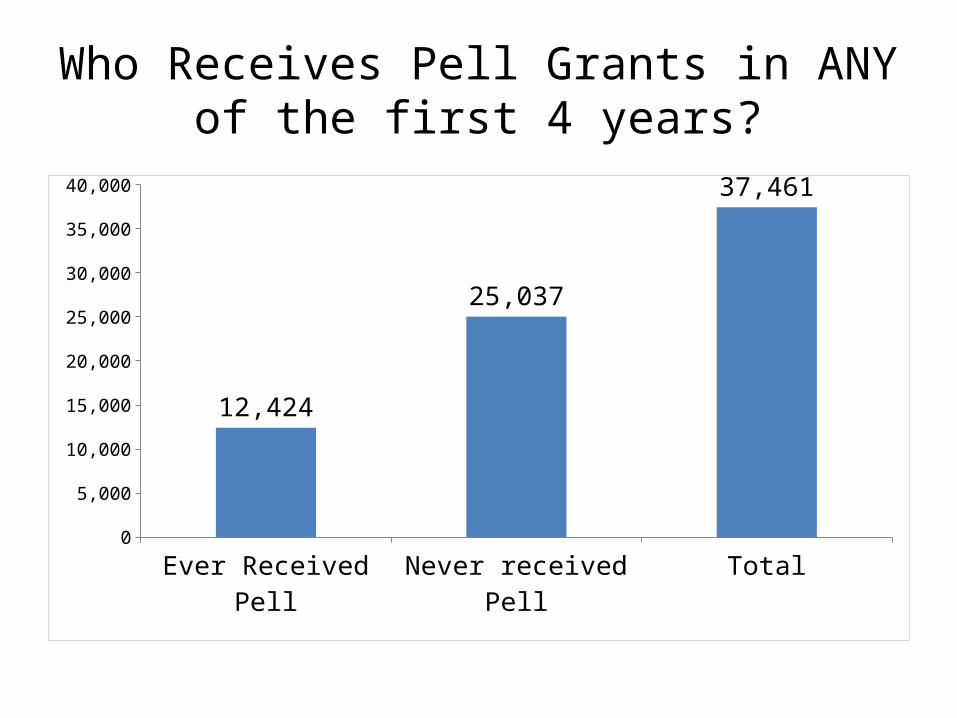
Who Receives Pell Grants in ANY of the first 4 years?
Ever Received Pell Never received Pell Total0
5,000
10,000
15,000
20,000
25,000
30,000
35,000
40,000
12,424
25,037
37,461
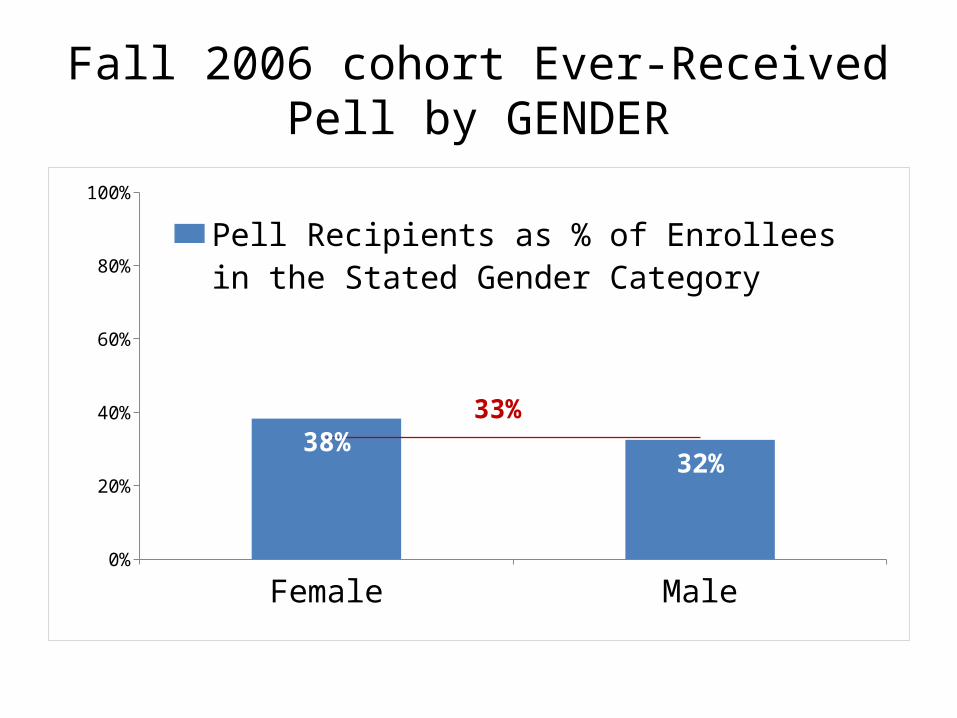
Fall 2006 cohort Ever-Received Pell by GENDER
Female Male0%
20%
40%
60%
80%
100%
38%32%
33%
Pell Recipients as % of Enrollees in the Stated Gender CategoryOverall Percent of Pell Recipients
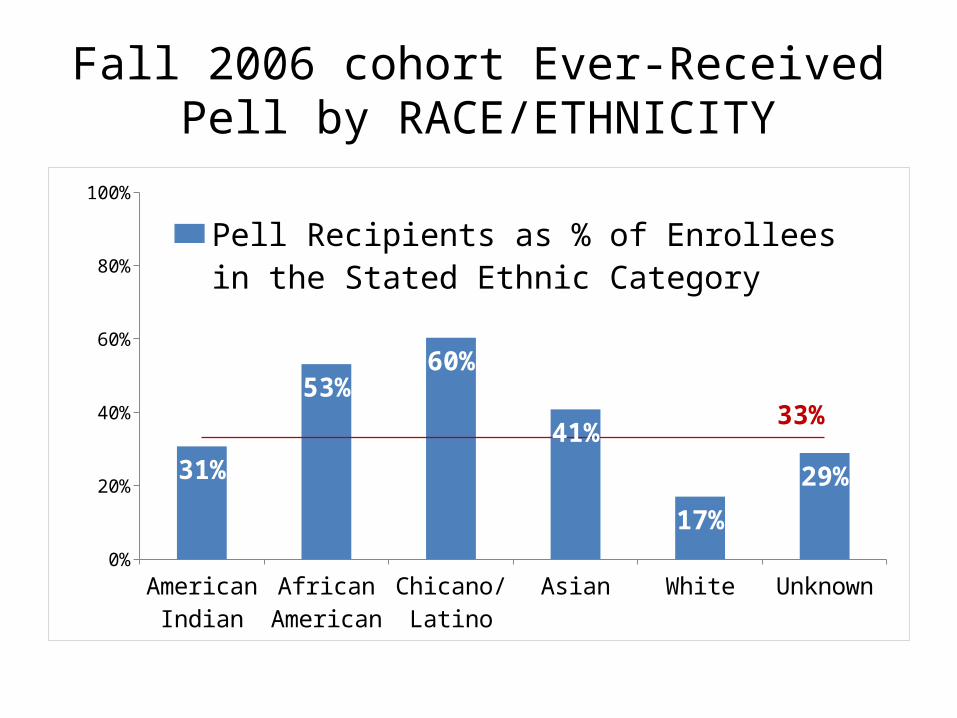
Fall 2006 cohort Ever-Received Pell by RACE/ETHNICITY
American Indian
African American
Chicano/ Latino
Asian White Unknown0%
20%
40%
60%
80%
100%
31%
53%60%
41%
17%
29%
33%
Pell Recipients as % of Enrollees in the Stated Ethnic CategoryOverall Percent of Pell Recipients
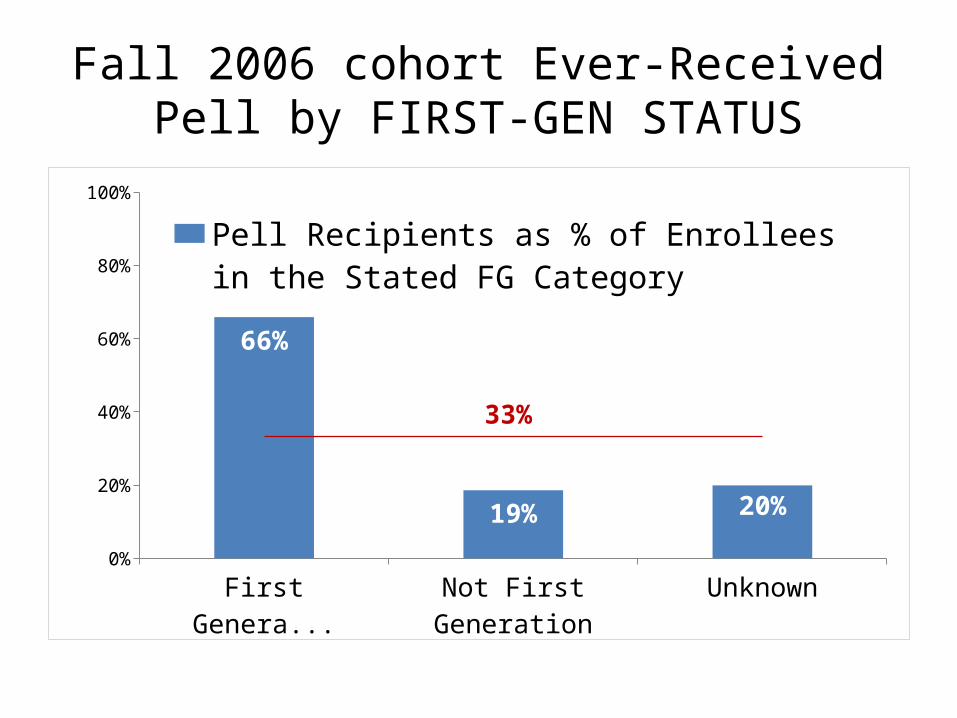
Fall 2006 cohort Ever-Received Pell by FIRST-GEN STATUS
First Generation Not First Generation Unknown0%
20%
40%
60%
80%
100%
66%
19% 20%
33%
Pell Recipients as % of Enrollees in the Stated FG CategoryOverall Percent of Pell Recipients
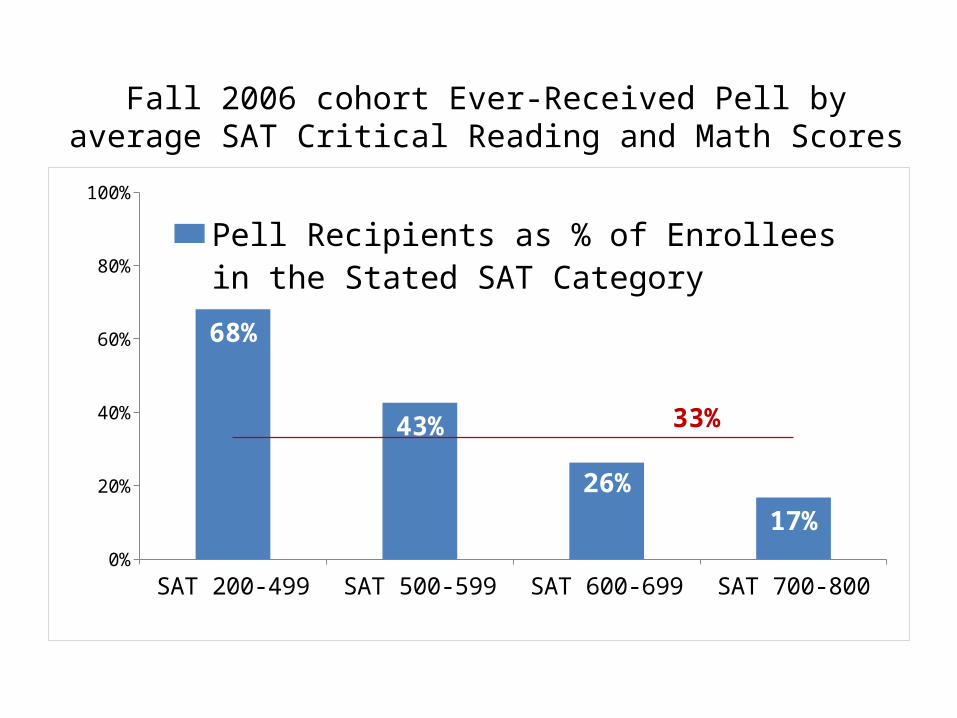
Fall 2006 cohort Ever-Received Pell by average SAT Critical Reading and Math Scores
SAT 200-499 SAT 500-599 SAT 600-699 SAT 700-8000%
20%
40%
60%
80%
100%
68%
43%
26%17%
33%
Pell Recipients as % of Enrollees in the Stated SAT CategoryOverall Percent of Pell Recipients
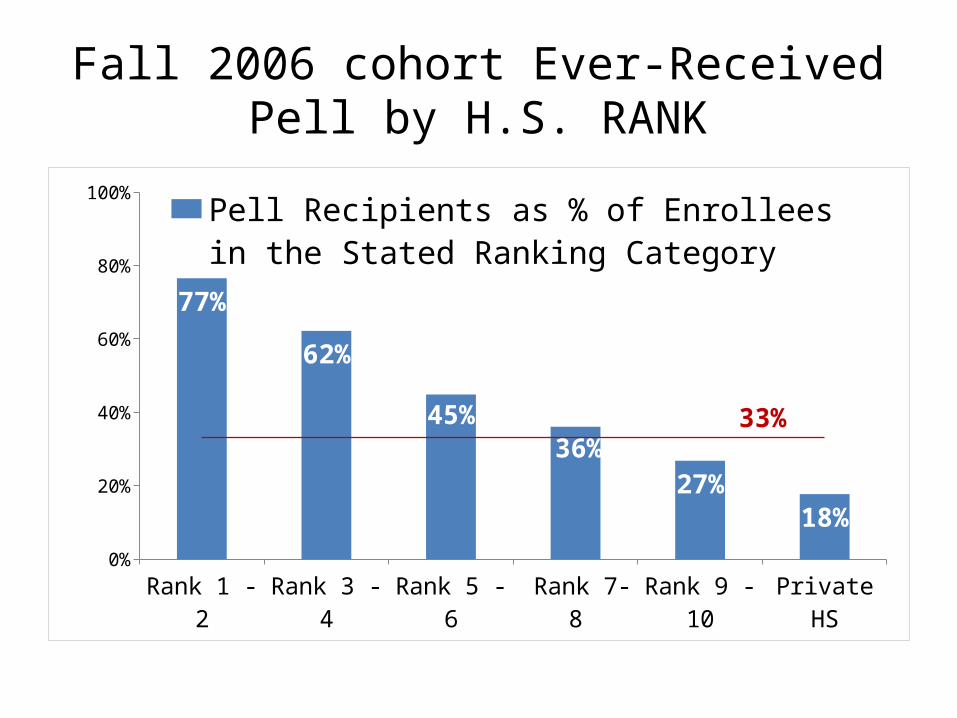
Fall 2006 cohort Ever-Received Pell by H.S. RANK
Rank 1 - 2 Rank 3 - 4 Rank 5 - 6 Rank 7- 8 Rank 9 - 10 Private HS0%
20%
40%
60%
80%
100%
77%
62%
45%36%
27%18%
33%
Pell Recipients as % of Enrollees in the Stated Ranking Category
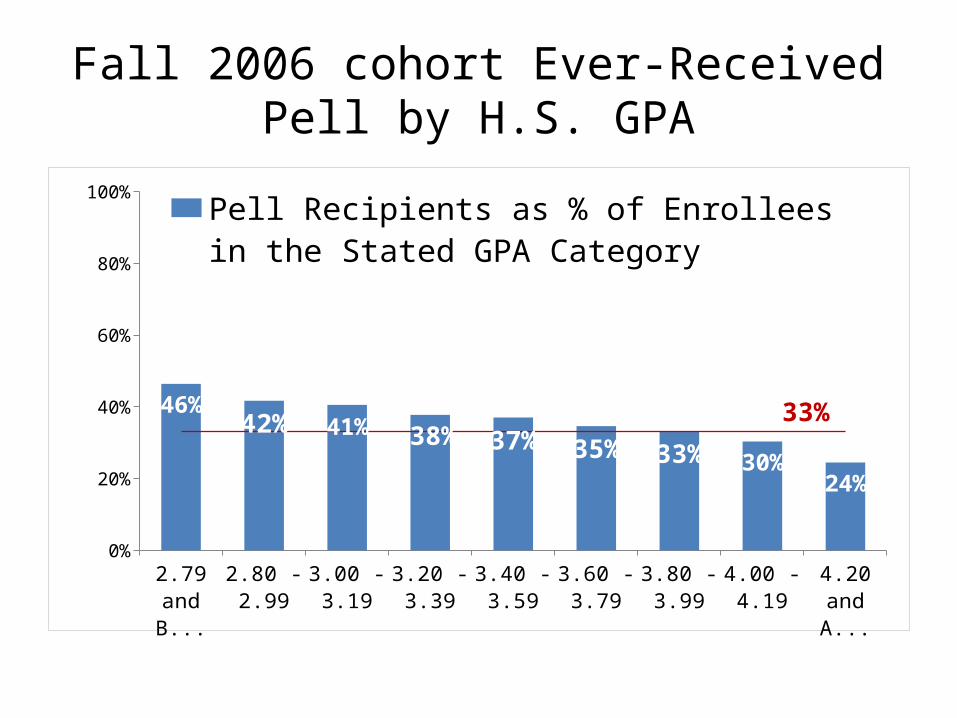
Fall 2006 cohort Ever-Received Pell by H.S. GPA
2.79 and Below
2.80 - 2.99
3.00 - 3.19
3.20 - 3.39
3.40 - 3.59
3.60 - 3.79
3.80 - 3.99
4.00 - 4.19
4.20 and Above
0%
20%
40%
60%
80%
100%
46%42% 41% 38% 37% 35% 33% 30%
24%
33%
Pell Recipients as % of Enrollees in the Stated GPA Category
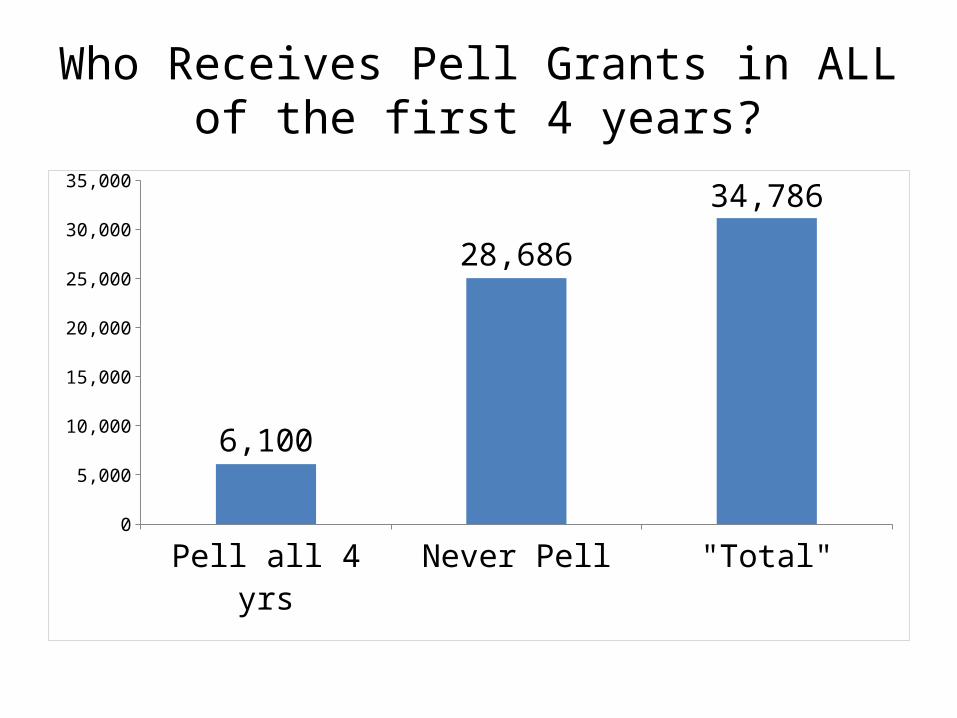
Who Receives Pell Grants in ALL of the first 4 years?
Pell all 4 yrs Never Pell "Total"0
5,000
10,000
15,000
20,000
25,000
30,000
35,000
6,100
28,686
34,786
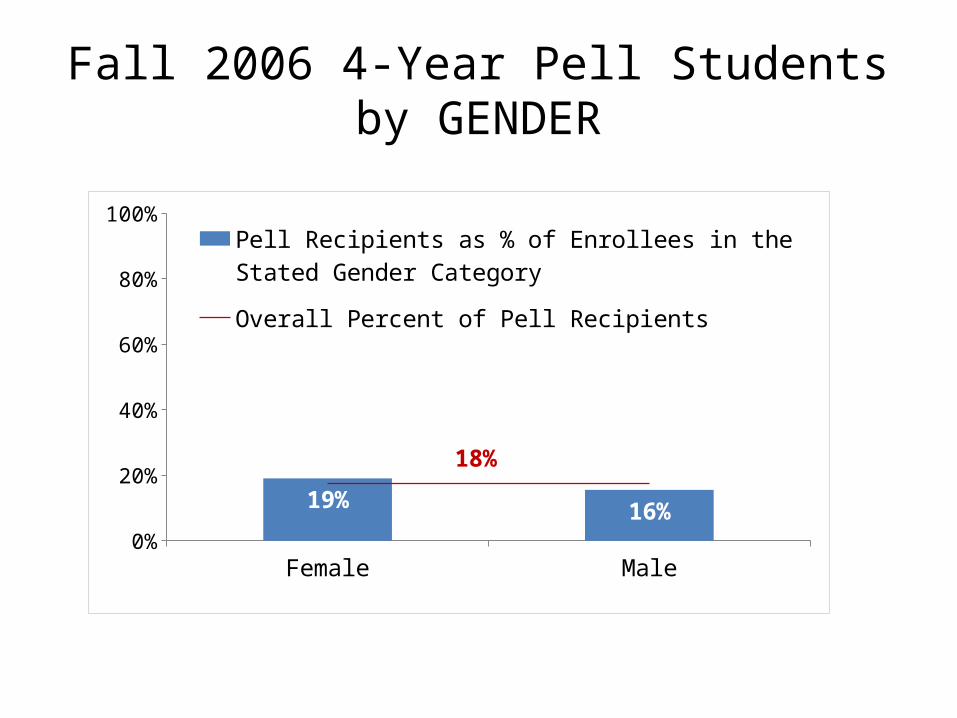
Fall 2006 4-Year Pell Students by GENDER
Female Male0%
20%
40%
60%
80%
100%
19% 16%
18%
Pell Recipients as % of Enrollees in the Stated Gender Category
Overall Percent of Pell Recipients
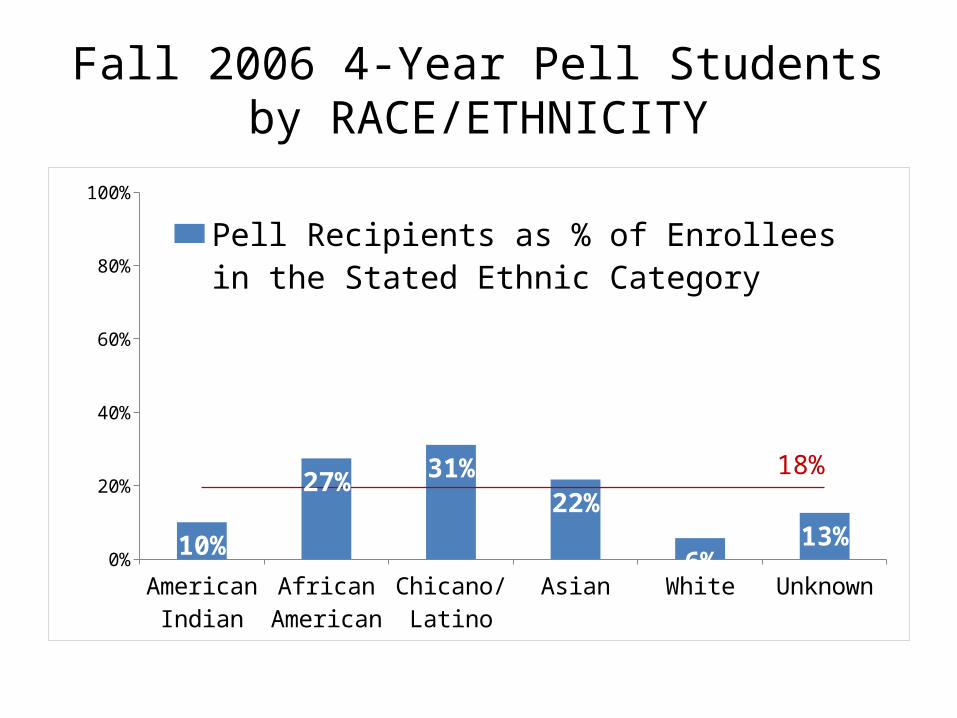
Fall 2006 4-Year Pell Students by RACE/ETHNICITY
American Indian
African American
Chicano/ Latino
Asian White Unknown0%
20%
40%
60%
80%
100%
10%
27% 31%22%
6%13%
18%
Pell Recipients as % of Enrollees in the Stated Ethnic CategoryOverall Percent of Pell Recipients
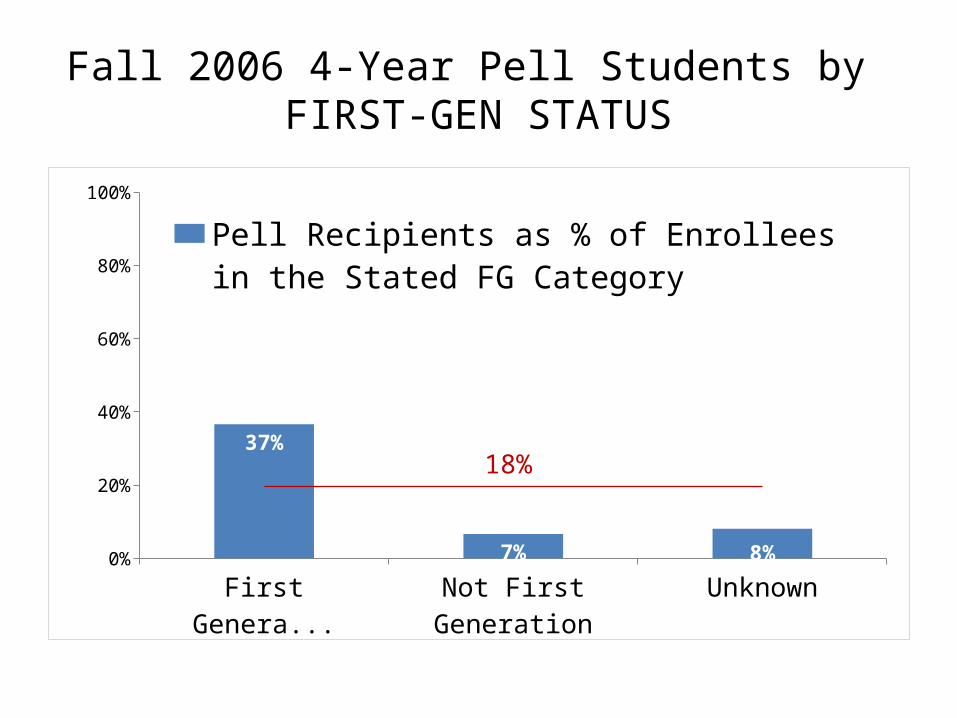
Fall 2006 4-Year Pell Students by FIRST-GEN STATUS
First Generation Not First Generation Unknown0%
20%
40%
60%
80%
100%
37%
7% 8%
18%
Pell Recipients as % of Enrollees in the Stated FG CategoryOverall Percent of Pell Recipients
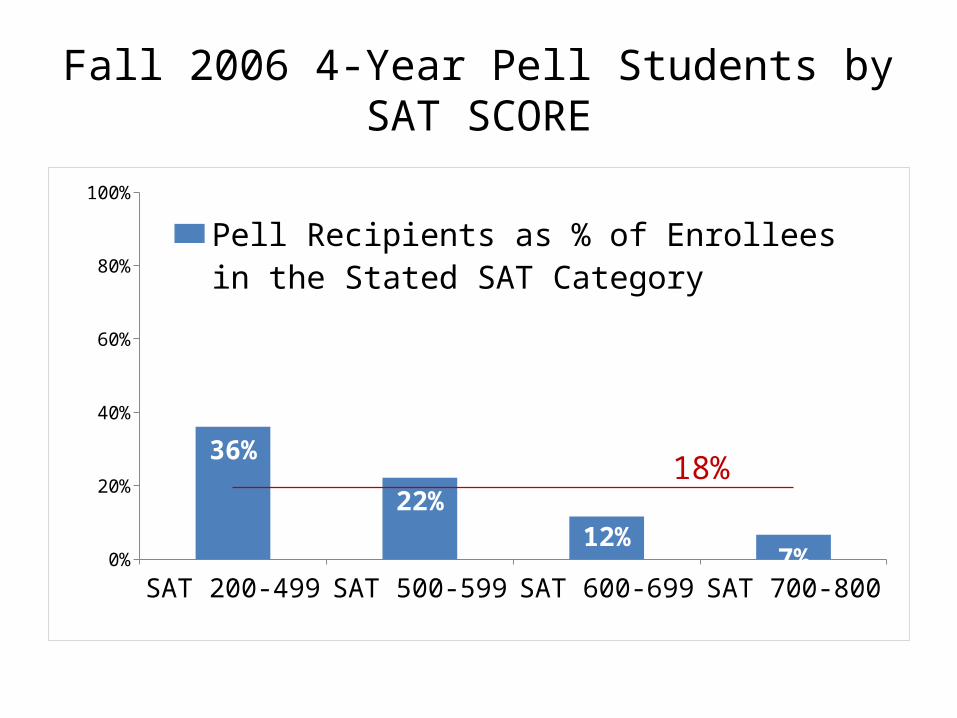
Fall 2006 4-Year Pell Students bySAT SCORE
SAT 200-499 SAT 500-599 SAT 600-699 SAT 700-8000%
20%
40%
60%
80%
100%
36%
22%
12% 7%
18%
Pell Recipients as % of Enrollees in the Stated SAT CategoryOverall Percent of Pell Recipients
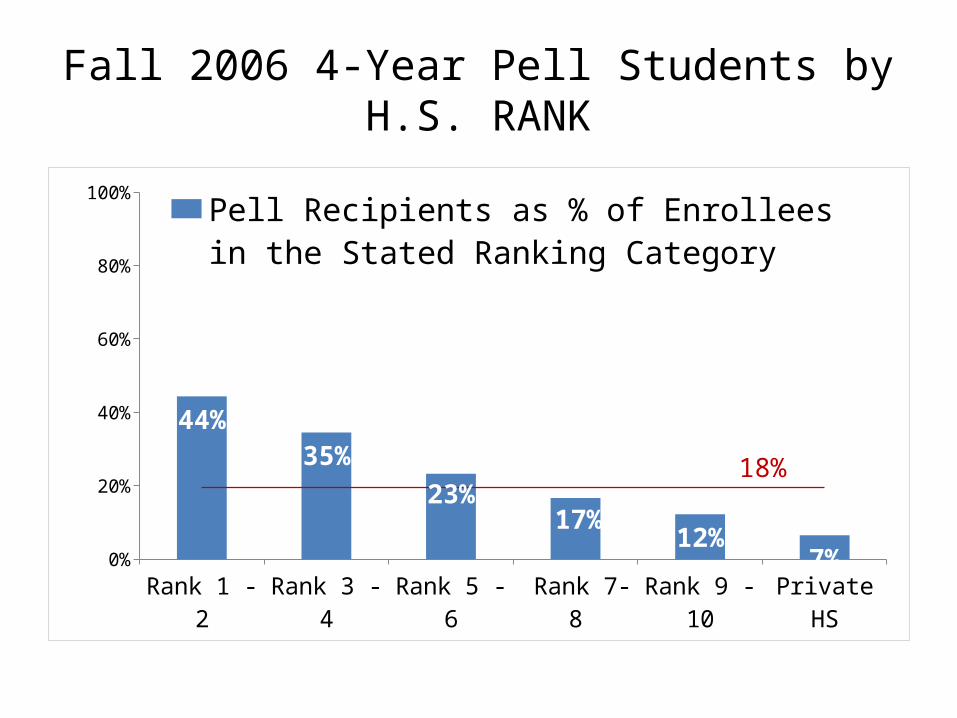
Fall 2006 4-Year Pell Students byH.S. RANK
Rank 1 - 2 Rank 3 - 4 Rank 5 - 6 Rank 7- 8 Rank 9 - 10 Private HS0%
20%
40%
60%
80%
100%
44%35%
23%17% 12%
7%
18%
Pell Recipients as % of Enrollees in the Stated Ranking Category
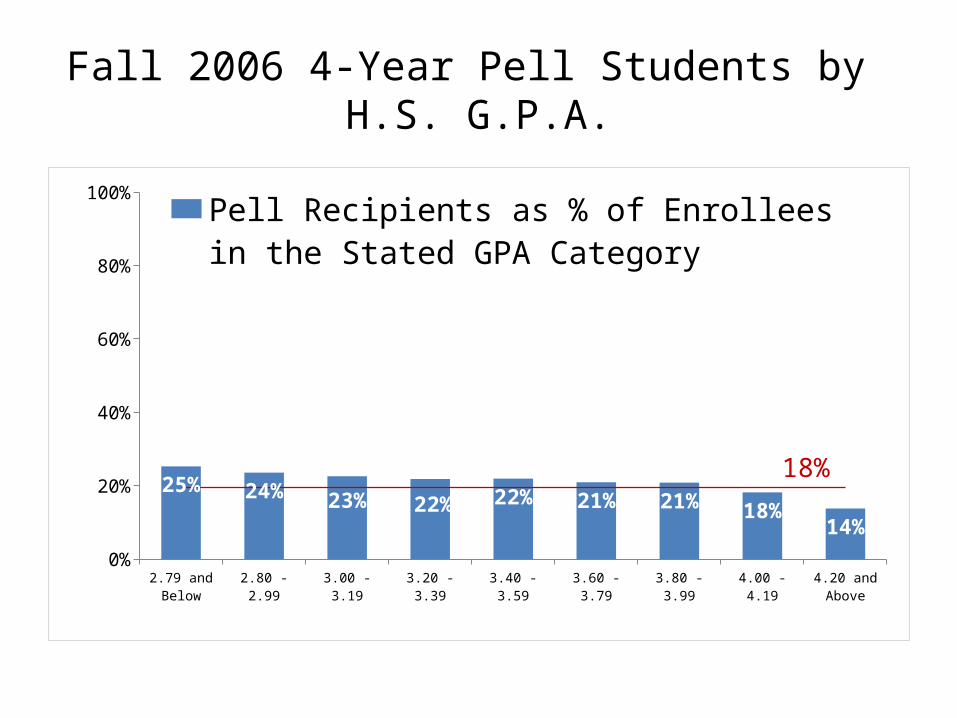
Fall 2006 4-Year Pell Students by H.S. G.P.A.
2.79 and Be-low
2.80 - 2.99 3.00 - 3.19 3.20 - 3.39 3.40 - 3.59 3.60 - 3.79 3.80 - 3.99 4.00 - 4.19 4.20 and Above
0%
20%
40%
60%
80%
100%
25% 24%23% 22%
22% 21% 21% 18%14%
18%
Pell Recipients as % of Enrollees in the Stated GPA Category
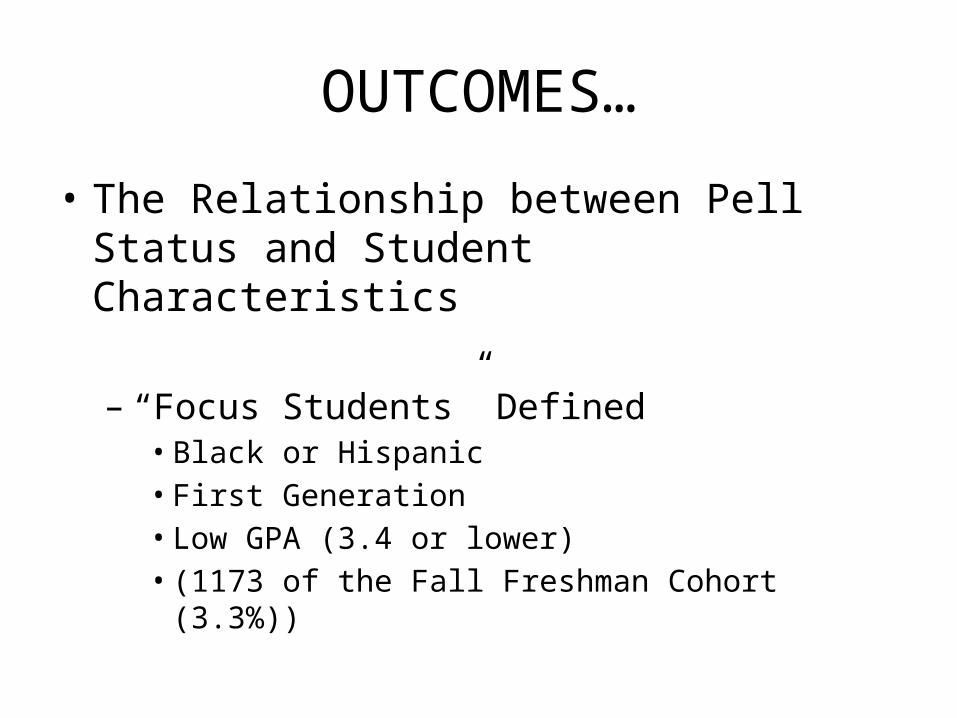
OUTCOMES…
• The Relationship between Pell Status and Student Characteristics
– “Focus Students” Defined• Black or Hispanic• First Generation• Low GPA (3.4 or lower)• (1173 of the Fall Freshman Cohort (3.3%))
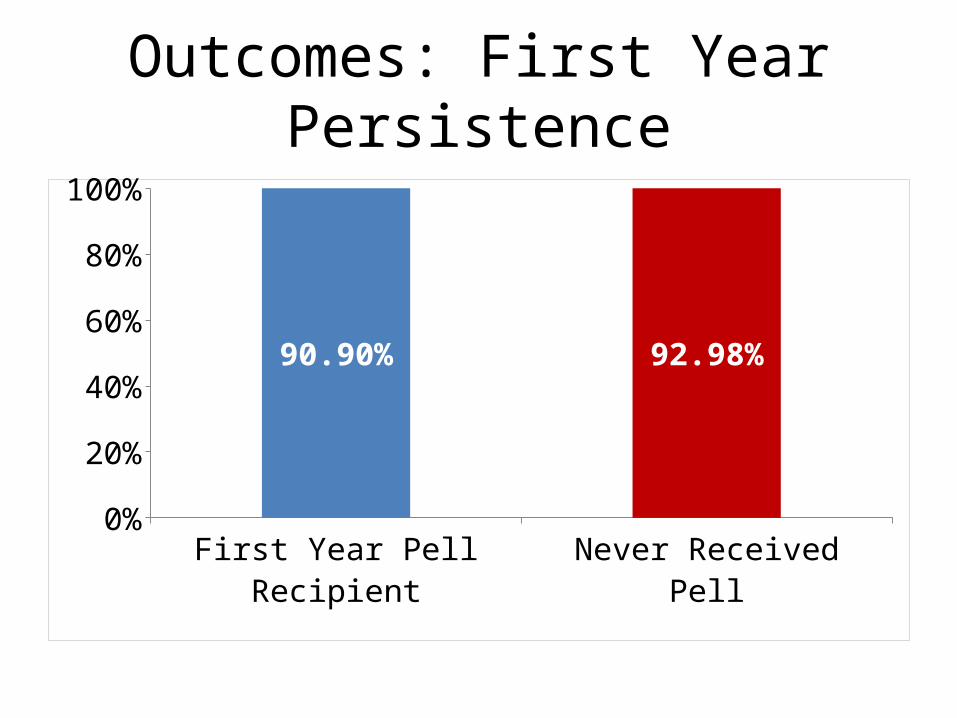
Outcomes: First Year Persistence
First Year Pell Recipient Never Received Pell0%
10%20%30%40%50%60%70%80%90%
100%
90.90% 92.98%
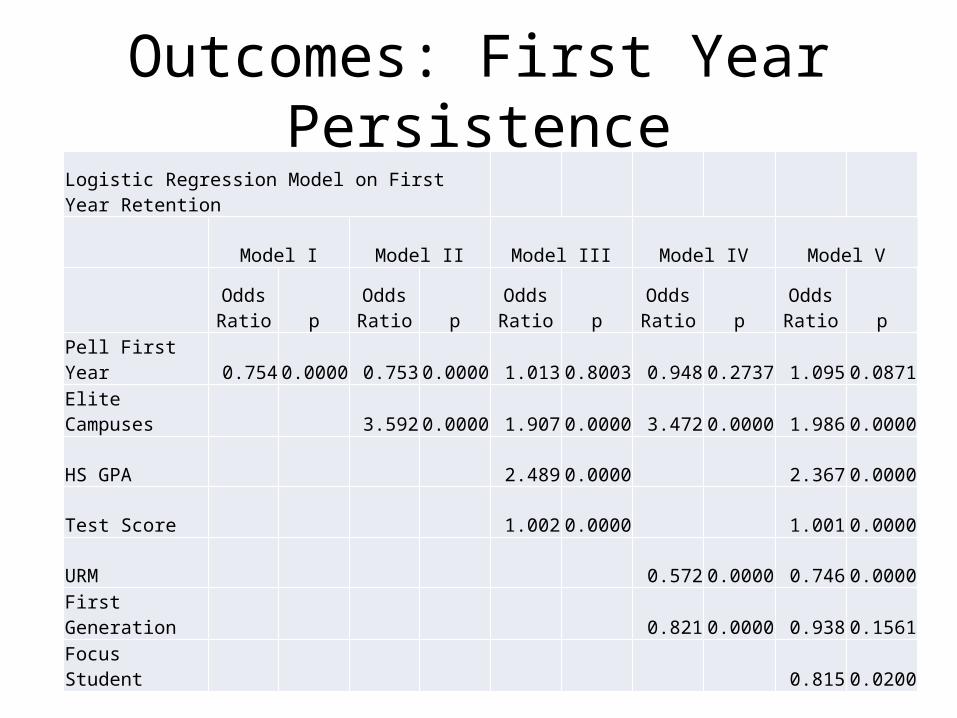
Outcomes: First Year Persistence
Logistic Regression Model on First Year Retention
Model I Model II Model III Model IV Model V
Odds Ratio p
Odds Ratio p
Odds Ratio p
Odds Ratio p
Odds Ratio p
Pell First Year 0.754 0.0000 0.753 0.0000 1.013 0.8003 0.948 0.2737 1.095 0.0871
Elite Campuses 3.592 0.0000 1.907 0.0000 3.472 0.0000 1.986 0.0000
HS GPA 2.489 0.0000 2.367 0.0000
Test Score 1.002 0.0000 1.001 0.0000
URM 0.572 0.0000 0.746 0.0000
First Generation 0.821 0.0000 0.938 0.1561
Focus Student 0.815 0.0200
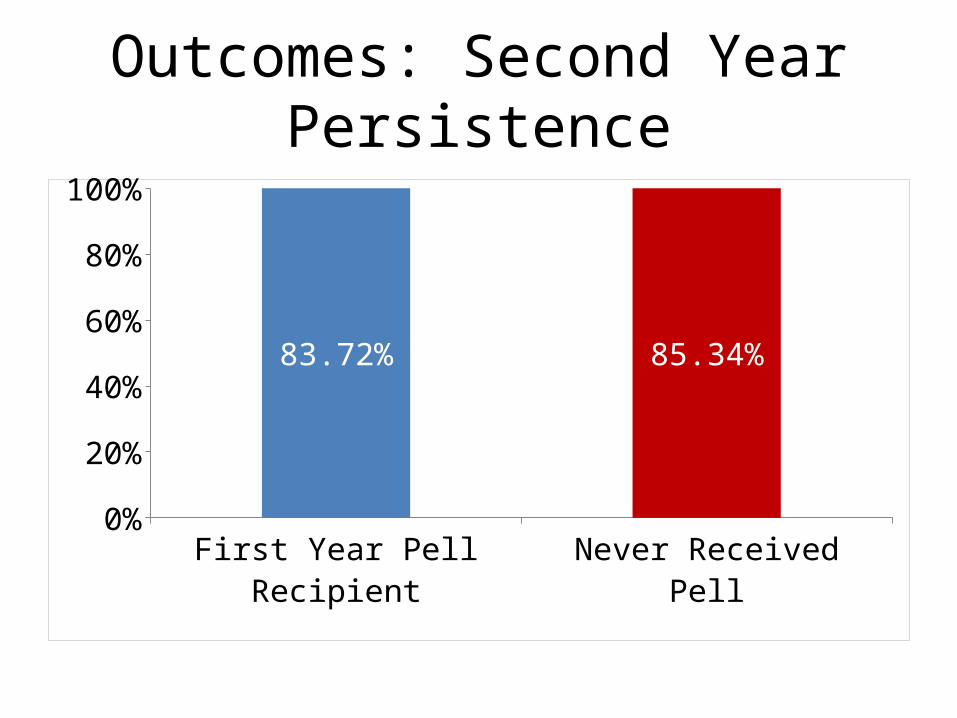
Outcomes: Second Year Persistence
First Year Pell Recipient Never Received Pell0%
10%20%30%40%50%60%70%80%90%
100%
83.72% 85.34%
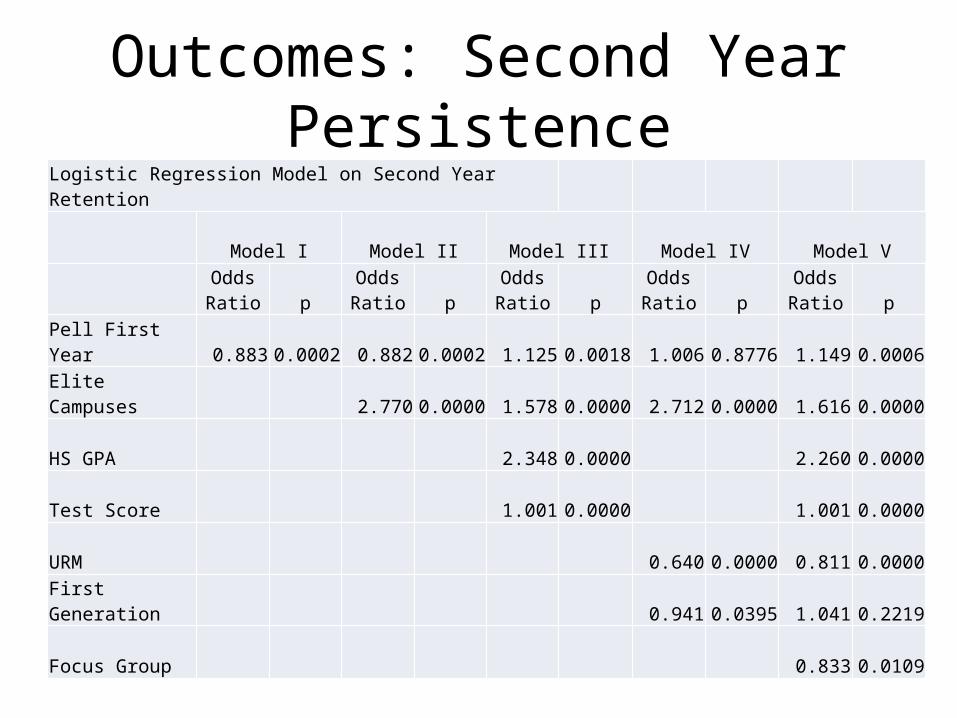
Outcomes: Second Year Persistence
Logistic Regression Model on Second Year Retention
Model I Model II Model III Model IV Model V
Odds Ratio p
Odds Ratio p
Odds Ratio p
Odds Ratio p
Odds Ratio p
Pell First Year 0.883 0.0002 0.882 0.0002 1.125 0.0018 1.006 0.8776 1.149 0.0006
Elite Campuses 2.770 0.0000 1.578 0.0000 2.712 0.0000 1.616 0.0000
HS GPA 2.348 0.0000 2.260 0.0000
Test Score 1.001 0.0000 1.001 0.0000
URM 0.640 0.0000 0.811 0.0000
First Generation 0.941 0.0395 1.041 0.2219
Focus Group 0.833 0.0109
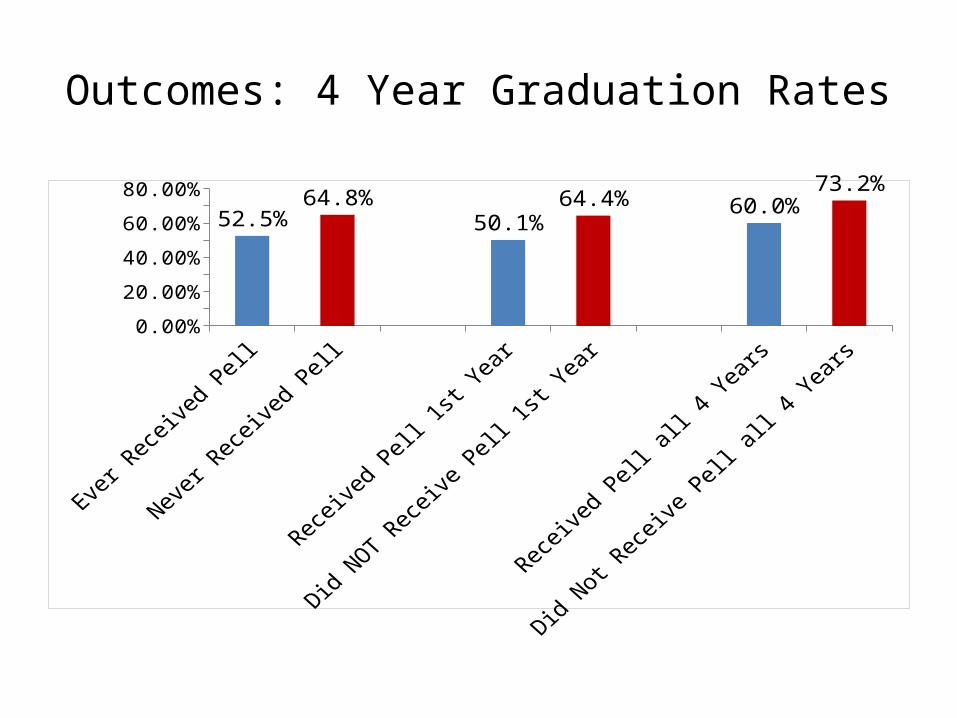
Outcomes: 4 Year Graduation Rates
Ever Re-
ceived Pell
Never Received
Pell
Received Pell 1st
Year
Did NOT Receive Pell 1st
Year
Received Pell all 4
Years
Did Not Receive Pell all 4
Years
0.00%
10.00%
20.00%
30.00%
40.00%
50.00%
60.00%
70.00%
80.00%
52.5%
64.8%
50.1%
64.4%60.0%
73.2%
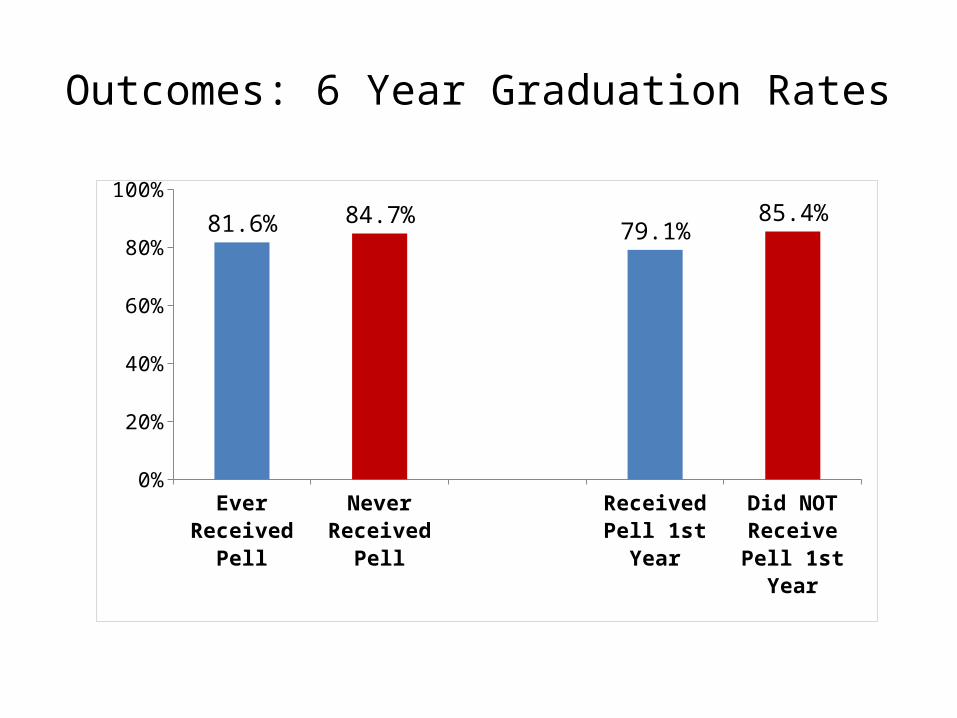
Outcomes: 6 Year Graduation Rates
Ever R
eceive
d Pell
Never R
eceive
d Pell
Receive
d Pell 1st
Year
Did NOT R
eceive
Pell 1st
Year0%
20%
40%
60%
80%
100%81.6% 84.7% 79.1% 85.4%
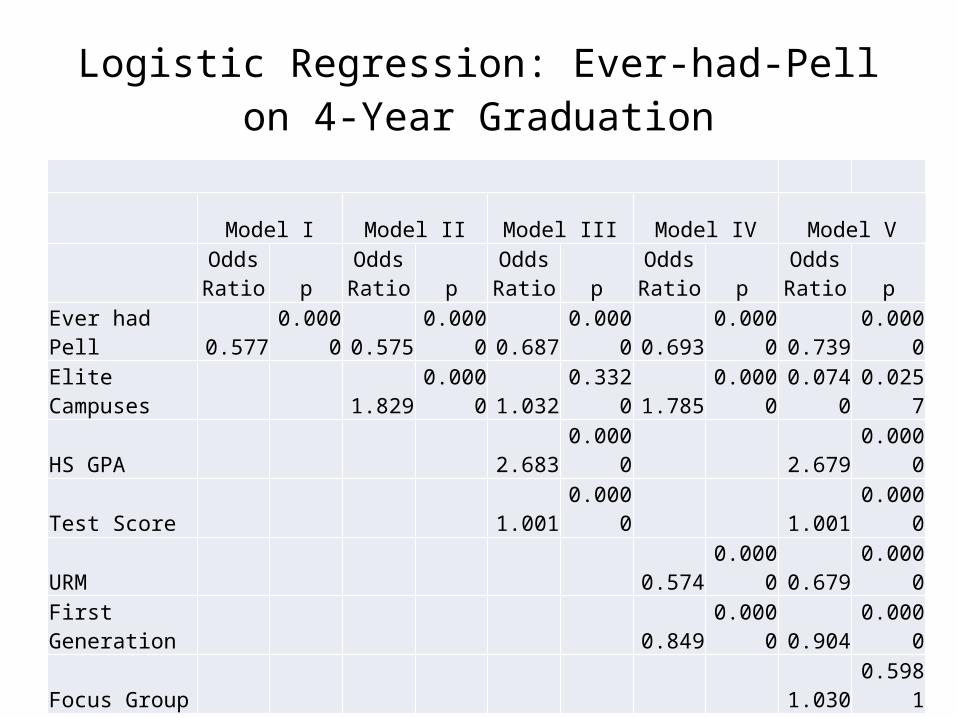
Logistic Regression: Ever-had-Pell on 4-Year Graduation
Model I Model II Model III Model IV Model V
Odds Ratio p
Odds Ratio p
Odds Ratio p
Odds Ratio p
Odds Ratio p
Ever had Pell 0.577 0.0000 0.575 0.0000 0.687 0.0000 0.693 0.0000 0.739 0.0000
Elite Campuses 1.829 0.0000 1.032 0.3320 1.785 0.0000 0.0740 0.0257
HS GPA 2.683 0.0000 2.679 0.0000
Test Score 1.001 0.0000 1.001 0.0000
URM 0.574 0.0000 0.679 0.0000
First Generation 0.849 0.0000 0.904 0.0000
Focus Group 1.030 0.5981
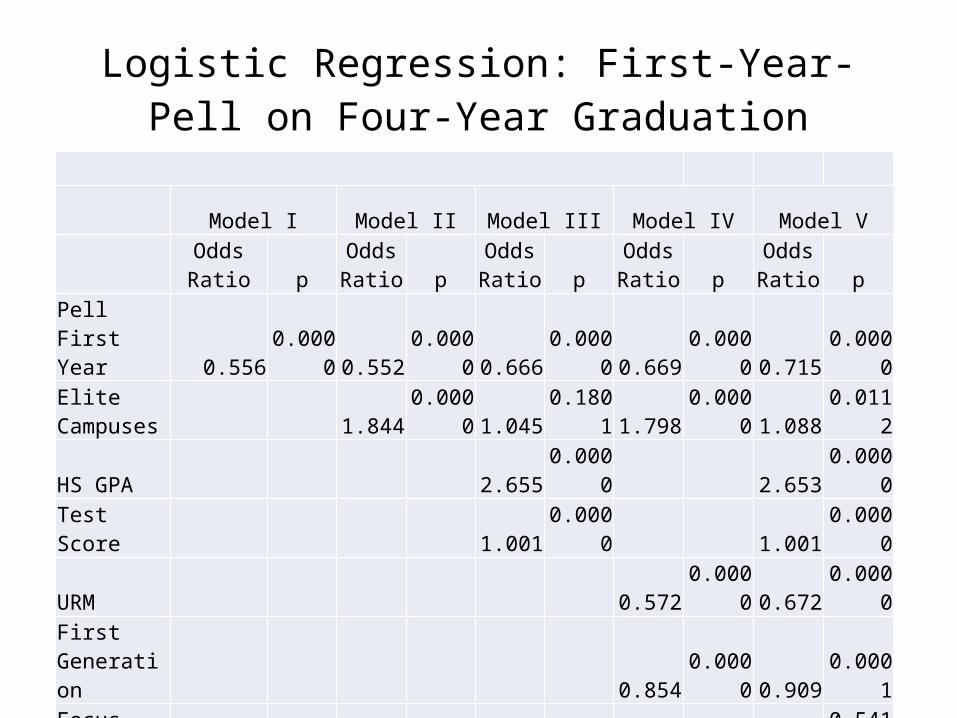
Logistic Regression: First-Year-Pell on Four-Year Graduation
Model I Model II Model III Model IV Model V
Odds Ratio pOdds Ratio p
Odds Ratio p
Odds Ratio p
Odds Ratio p
Pell First Year 0.556 0.0000 0.552 0.0000 0.666 0.0000 0.669 0.0000 0.715 0.0000Elite Campuses 1.844 0.0000 1.045 0.1801 1.798 0.0000 1.088 0.0112
HS GPA 2.655 0.0000 2.653 0.0000
Test Score 1.001 0.0000 1.001 0.0000
URM 0.572 0.0000 0.672 0.0000First Generation 0.854 0.0000 0.909 0.0001
Focus Group 1.039 0.5416
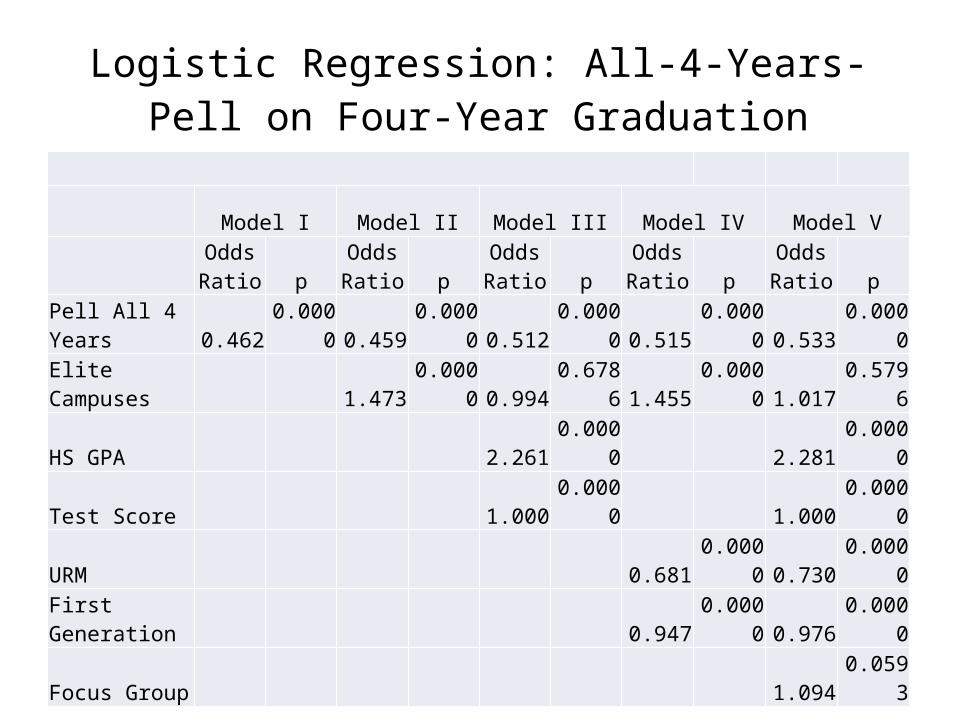
Logistic Regression: All-4-Years-Pell on Four-Year Graduation
Model I Model II Model III Model IV Model V
Odds Ratio p
Odds Ratio p
Odds Ratio p
Odds Ratio p
Odds Ratio p
Pell All 4 Years 0.462 0.0000 0.459 0.0000 0.512 0.0000 0.515 0.0000 0.533 0.0000
Elite Campuses 1.473 0.0000 0.994 0.6786 1.455 0.0000 1.017 0.5796
HS GPA 2.261 0.0000 2.281 0.0000
Test Score 1.000 0.0000 1.000 0.0000
URM 0.681 0.0000 0.730 0.0000
First Generation 0.947 0.0000 0.976 0.0000
Focus Group 1.094 0.0593
Findings
• Pell and non-Pell students have similar rates of first and second year persistence
• When controlling for other factors, Pell students persist slightly better than non-Pell students
• Pell students have significantly lower 4 year graduation rates, even when controlling for student characteristics.
Further Questions
• What happens between 2 years and graduation?
• What about 6-year Graduation?• How are CSU and CCC Different?• What are the effects of other types of aid?• How will the new six-year eligibility limit effect
these results?

Questions?
• THANK YOU!