Embed Size (px)
Citation preview
1
The Residential Mortgage Business
Investor Presentation Global ABS conference
Barcelona, June 2015
2
Disclaimer
This presentation was prepared by Aegon Levensverzekering N.V. (“Aegon Leven”) and Aegon Hypotheken B.V. (together “Aegon” or the “Company”). Although the information in this presentation has been obtained from sources which the Company believes to be reliable, the Company does not represent or warrant its accuracy or completeness, and such information may be incomplete or condensed. The Company will not be responsible for the consequences of reliance upon any opinion or statement contained herein or for any omission. In preparing this presentation, the Company has relied upon and assumed, without independent verification, the accuracy and completeness of all information available from various sources. This presentation may be subject to variation to the extent that any assumptions contained herein prove to be incorrect, or in the light of future information or developments relating to the transaction or following discussions with relevant transaction parties. No assurance can be or is given that the assumptions on which the information is made will prove correct. Information of this kind must be viewed with caution. Any historical information is not indicative of future performance. Opinions and estimates may be changed without notice and involve a number of assumptions which may not prove valid. Average lives of and potential yields on any securities cannot be predicted as the actual rate of repayment as well as other relevant factors cannot be determined precisely. No assurance can be or is given that the assumptions on which such information are made will prove correct. Information of this kind must be viewed with caution. This presentation contains “forward-looking statements”. Such forward-looking statements involve known and unknown risks, uncertainties and other important factors beyond the Company's control that could cause the actual results, performance or achievements of the Company to be materially different from future results, performance or achievements expressed or implied by such forward-looking statements. Such forward-looking statements are based on numerous assumptions regarding the Company's present and future business strategies and the environment in which the Company will operate in the future. By their nature, forward-looking statements involve risks and uncertainties because they relate to events and depend on circumstances that may or may not occur in the future. The Company accepts no obligation to update the forward-looking statements contained herein to reflect actual results, changes in assumptions, or changes in factors affecting these statements. This presentation is provided for discussion purposes only, does not constitute an offer or invitation for the sale, purchase, exchange or transfer of any securities or a recommendation to enter into transactions hereby contemplated and it does not constitute a prospectus or offering document in whole or in part. The structure and facilities described in this presentation are indicative, are meant to develop over time and serve only as examples. The recipient of this information acknowledges that the Company does not owe or assume any duty of care or responsibility to the recipient. None of the Company or any of its subsidiaries or any of their respective directors, officers, employees or agents shall have any liability whatsoever (in negligence or otherwise) for any loss howsoever arising from any use of this presentation or its contents or otherwise arising in connection with the presentation and any and all such liability is expressly disclaimed. No representation, warranty or undertaking, express or implied, is made as to and no reliance should be placed on, the fairness, accuracy, completeness or correctness of the information or the opinions contained herein. This presentation is not to be relied upon in any manner as legal, tax, regulatory, accounting or any other advice and shall not be used in substitution for the exercise of independent judgment and each person made aware of the information set-forth hereof shall be responsible for conducting its own investigation and analysis of the information contained herein. The Company does not accept any obligation to update or otherwise revise any information contained in this presentation to reflect information that subsequently becomes available after the date hereof. The information contained herein is confidential and is intended for use only by the intended recipient. This presentation is not intended for U.S investors. The presentation nor any copy of it may be taken or transmitted into the United States of America, its territories or possessions (collectively, the “United States”) directly or indirectly. Any failure to comply with these restrictions may constitute a violation of U.S. or other securities laws, as applicable. The information contained herein may not be reproduced or redistributed (in whole or in part) in any format without the express written approval of the Company. Aegon Leven is supervised by the Dutch Central Bank. Aegon is regulated by the Netherlands Authority for the Financial Markets in the Netherlands.
3
Content
Page
Executive Summary 4
Aegon Highlights 6
The Dutch Economy and Housing Market 9
The Dutch Residential Mortgage Market 15
Aegon Residential Mortgage Loan Origination, Underwriting & Servicing 29
The Dutch RMBS Market in Perspective 40
The SAECURE Program 47

4
Executive summary
5
The activities of Aegon in the Netherlands show sound financials and the Dutch operations are strongly tied into the global Aegon Group
Aegon is one of the top 5 lenders in the Dutch residential mortgage market
The historical performance of Aegon's residential mortgage loan portfolio has been stable over the last ten years
Successful arrears management and recovery procedures resulted in minimal default and loss rates
Aegon has a high quality and low risk mortgage lending business
► Long fixed interest reset periods
► Predominantly NHG guaranteed mortgage loans
► Broad distribution channel
► Conservative underwriting criteria linked to robust application process
► Reliable servicing
Aegon demonstrated the flexibility to adjust to changing market conditions
► Higher sales volumes in a decreasing mortgage market
► Decreased risk profile of the loan portfolio
Aegon’s Dutch RMBS program
► Securitization is a core funding tool for Aegon’s Dutch mortgage loan business
► The SAECURE program started in 2000 with total outstanding net balance of EUR 9.3bn as at end of March 2015
► Most recent issuance under the SAECURE program (SAECURE 15) in October 2014
► Since the establishment of the DSA and PCS labels, all relevant SAECURE transactions have been awarded these labels
► Bloomberg reference to outstanding SAECURE transactions: SAEC <MTGE>
Executive Summary

6
Aegon Highlights
7
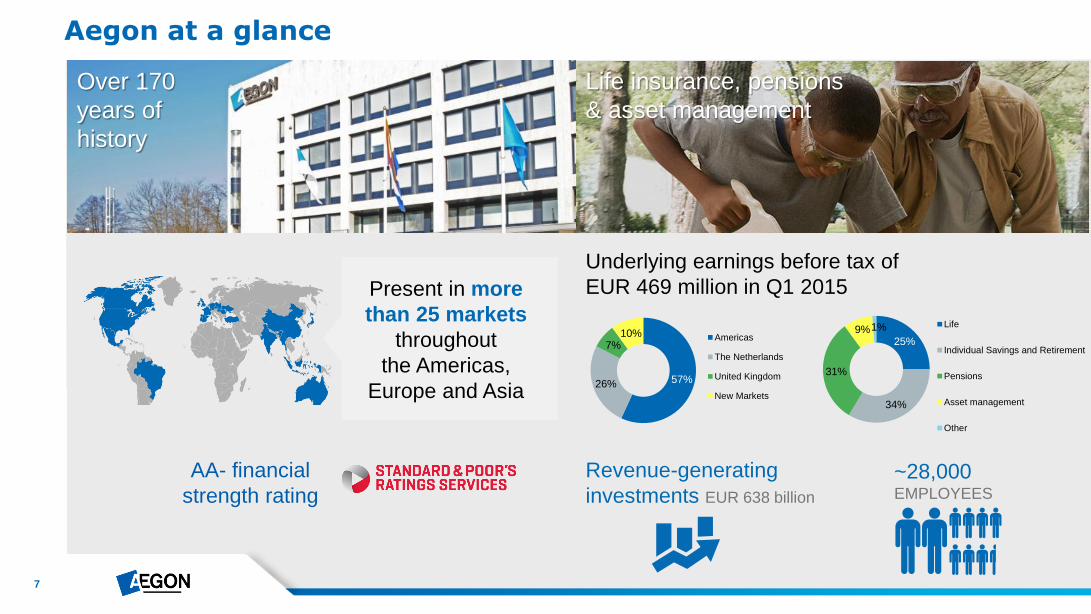
Aegon at a glance
Over 170
years of
history
Life insurance, pensions
& asset management
Present in more
than 25 markets
throughout
the Americas,
Europe and Asia
Underlying earnings before tax of
EUR 469 million in Q1 2015
25%
34%
31%
9% 1% Life
Individual Savings and Retirement
Pensions
Asset management
Other
57% 26%
7% 10% Americas
The Netherlands
United Kingdom
New Markets
~28,000 EMPLOYEES
Revenue-generating
investments EUR 638 billion
AA- financial
strength rating
8
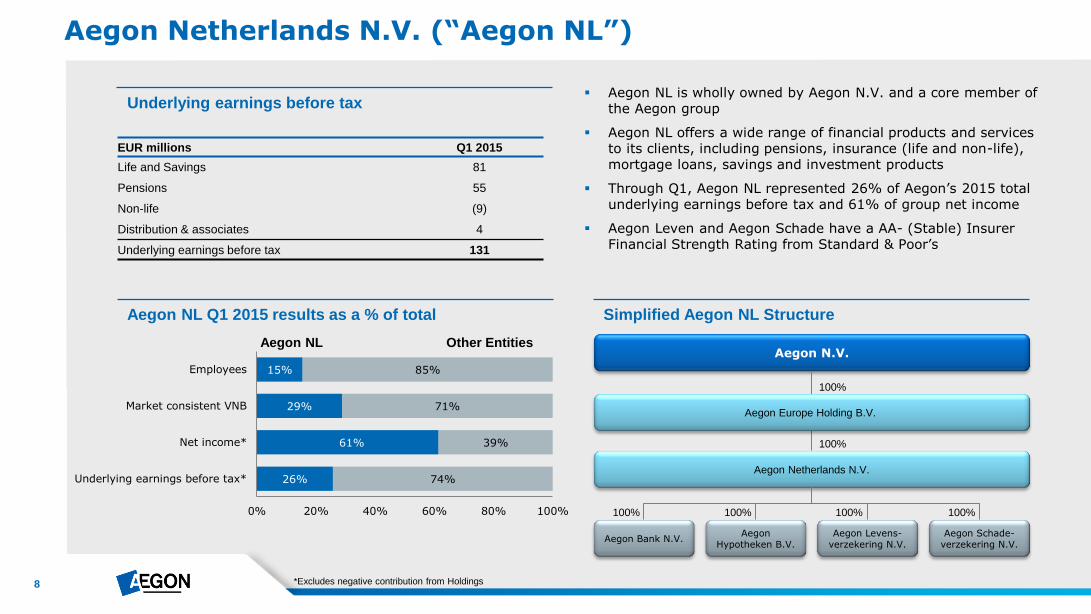
26%
61%
29%
15%
74%
39%
71%
85%
0% 20% 40% 60% 80% 100%
Underlying earnings before tax*
Net income*
Market consistent VNB
Employees
Aegon Netherlands N.V. (“Aegon NL”)
Underlying earnings before tax
Aegon NL Q1 2015 results as a % of total
Aegon NL Other Entities
Aegon NL is wholly owned by Aegon N.V. and a core member of the Aegon group
Aegon NL offers a wide range of financial products and services to its clients, including pensions, insurance (life and non-life), mortgage loans, savings and investment products
Through Q1, Aegon NL represented 26% of Aegon’s 2015 total underlying earnings before tax and 61% of group net income
Aegon Leven and Aegon Schade have a AA- (Stable) Insurer Financial Strength Rating from Standard & Poor’s
Simplified Aegon NL Structure
100%
100% 100% 100%
Aegon N.V.
Aegon Netherlands N.V.
Aegon Bank N.V. Aegon Schade-
verzekering N.V. Aegon Levens-
verzekering N.V. Aegon
Hypotheken B.V.
100%
EUR millions Q1 2015
Life and Savings 81
Pensions 55
Non-life (9)
Distribution & associates 4
Underlying earnings before tax 131
*Excludes negative contribution from Holdings
Aegon Europe Holding B.V.
100%
9
The Dutch Economy and Housing Market
10
-6
-4
-2
0
2
4
6
1990 1992 1994 1996 1998 2000 2002 2004 2006 2008 2010 2012 2014
Eurozone Netherlands UK US
Note: Historical performance is not an indicator of future performance which may differ materially 1 2014 and 2015 GDP growth rates are as forecasted by Eurostat
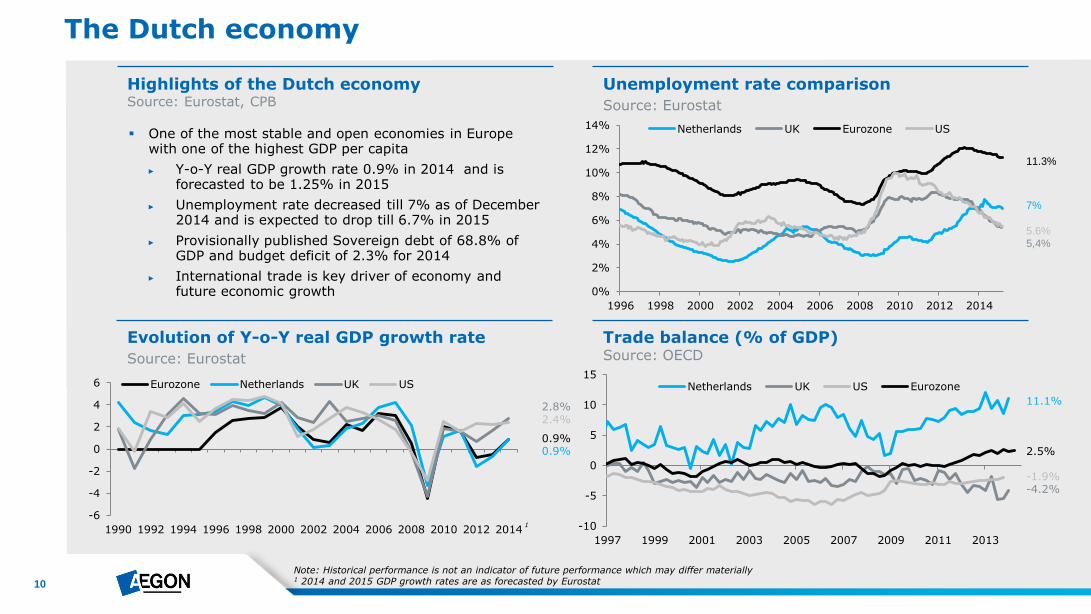
The Dutch economy
Highlights of the Dutch economy Source: Eurostat, CPB
Unemployment rate comparison
Source: Eurostat
Evolution of Y-o-Y real GDP growth rate
Source: Eurostat
Trade balance (% of GDP) Source: OECD
One of the most stable and open economies in Europe with one of the highest GDP per capita
► Y-o-Y real GDP growth rate 0.9% in 2014 and is forecasted to be 1.25% in 2015
► Unemployment rate decreased till 7% as of December 2014 and is expected to drop till 6.7% in 2015
► Provisionally published Sovereign debt of 68.8% of GDP and budget deficit of 2.3% for 2014
► International trade is key driver of economy and future economic growth
0.9% 0.9%
2.8% 2.4%
1
-1.9%
2.5%
11.1%
-4.2%
5.6%
11.3%
7%
5,4%
-10
-5
0
5
10
15
1997 1999 2001 2003 2005 2007 2009 2011 2013
Netherlands UK US Eurozone
0%
2%
4%
6%
8%
10%
12%
14%
1996 1998 2000 2002 2004 2006 2008 2010 2012 2014
Netherlands UK Eurozone US
11
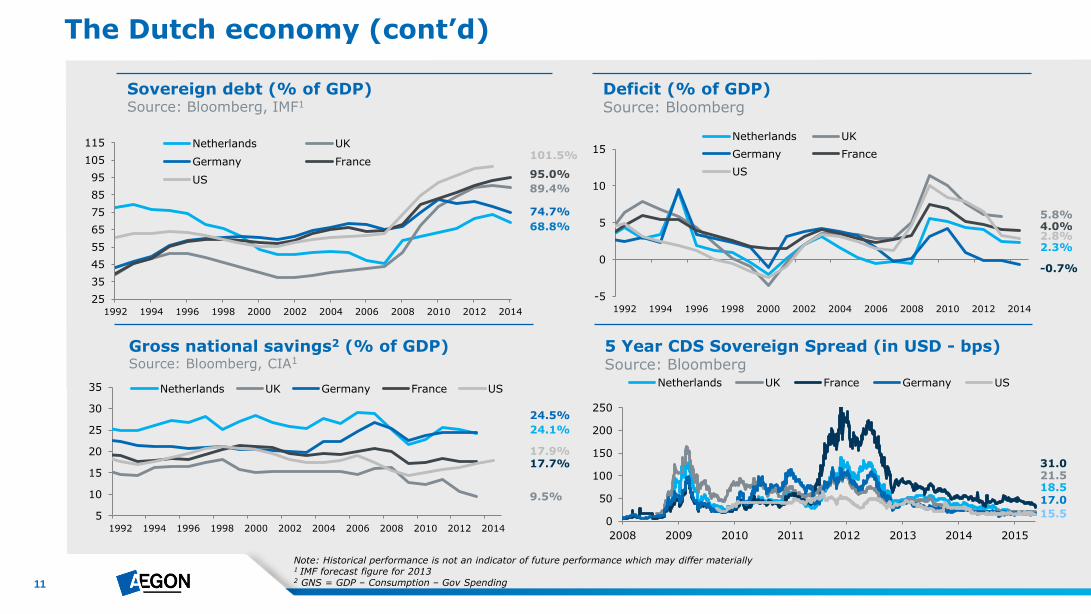
Sovereign debt (% of GDP) Source: Bloomberg, IMF1
Deficit (% of GDP) Source: Bloomberg
Gross national savings2 (% of GDP) Source: Bloomberg, CIA1
5 Year CDS Sovereign Spread (in USD - bps) Source: Bloomberg
The Dutch economy (cont’d)
9.5%
17.7%
24.1%
17.9%
24.5%
Note: Historical performance is not an indicator of future performance which may differ materially 1 IMF forecast figure for 2013 2 GNS = GDP – Consumption – Gov Spending
2.8% 2.3%
4.0%
-0.7%
5.8%
101.5%
89.4%
68.8%
95.0%
74.7%
17.0
31.0 21.5 18.5
15.5 0
50
100
150
200
250
2008 2009 2010 2011 2012 2013 2014 2015
Netherlands UK France Germany US
25
35
45
55
65
75
85
95
105
115
1992 1994 1996 1998 2000 2002 2004 2006 2008 2010 2012 2014
Netherlands UK
Germany France
US
-5
0
5
10
15
1992 1994 1996 1998 2000 2002 2004 2006 2008 2010 2012 2014
Netherlands UK
Germany France
US
5
10
15
20
25
30
35
1992 1994 1996 1998 2000 2002 2004 2006 2008 2010 2012 2014
Netherlands UK Germany France US
12
0% 50% 100% 150% 200% 250%
France
Germany
UK
Netherlands
86%
83%
0%
222%
85%
84%
133%
229%
83%
85%
136%
228%
81%
88%
139%
231%
79%
90%
147%
220%
2009 2010 2011 2012 2013
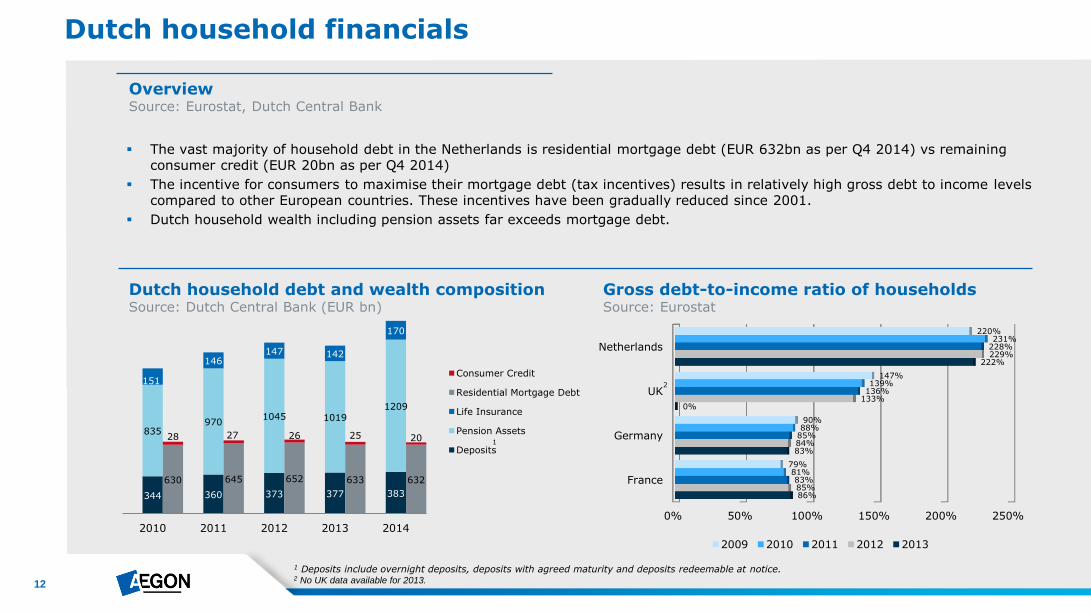
Gross debt-to-income ratio of households Source: Eurostat
Dutch household debt and wealth composition Source: Dutch Central Bank (EUR bn)
Dutch household financials
The vast majority of household debt in the Netherlands is residential mortgage debt (EUR 632bn as per Q4 2014) vs remaining consumer credit (EUR 20bn as per Q4 2014)
The incentive for consumers to maximise their mortgage debt (tax incentives) results in relatively high gross debt to income levels compared to other European countries. These incentives have been gradually reduced since 2001.
Dutch household wealth including pension assets far exceeds mortgage debt.
Overview Source: Eurostat, Dutch Central Bank
1 Deposits include overnight deposits, deposits with agreed maturity and deposits redeemable at notice. 2 No UK data available for 2013.
1
344 360 373 377 383
835 970
1045 1019 1209
151
146 147 142
170
630 645 652 633 632
28 27 26 25 20
2010 2011 2012 2013 2014
Consumer Credit
Residential Mortgage Debt
Life Insurance
Pension Assets
Deposits
2
13
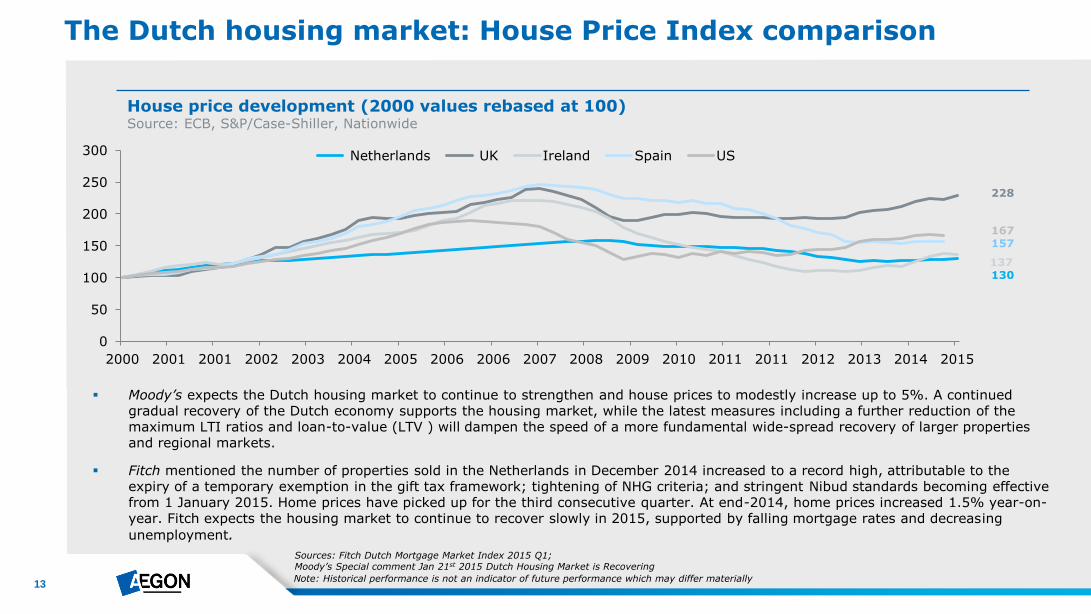
The Dutch housing market: House Price Index comparison
House price development (2000 values rebased at 100) Source: ECB, S&P/Case-Shiller, Nationwide
Note: Historical performance is not an indicator of future performance which may differ materially
130
228
137
157 167
Moody’s expects the Dutch housing market to continue to strengthen and house prices to modestly increase up to 5%. A continued gradual recovery of the Dutch economy supports the housing market, while the latest measures including a further reduction of the maximum LTI ratios and loan-to-value (LTV ) will dampen the speed of a more fundamental wide-spread recovery of larger properties and regional markets.
Sources: Fitch Dutch Mortgage Market Index 2015 Q1; Moody’s Special comment Jan 21st 2015 Dutch Housing Market is Recovering
0
50
100
150
200
250
300
2000 2001 2001 2002 2003 2004 2005 2006 2006 2007 2008 2009 2010 2011 2011 2012 2013 2014 2015
Netherlands UK Ireland Spain US
Fitch mentioned the number of properties sold in the Netherlands in December 2014 increased to a record high, attributable to the expiry of a temporary exemption in the gift tax framework; tightening of NHG criteria; and stringent Nibud standards becoming effective from 1 January 2015. Home prices have picked up for the third consecutive quarter. At end-2014, home prices increased 1.5% year-on-year. Fitch expects the housing market to continue to recover slowly in 2015, supported by falling mortgage rates and decreasing
unemployment.
14
2,2
2,25
2,3
2,35
2,4
2,45
2,5
2,55
14,5
15,0
15,5
16,0
16,5
17,0
1996 1998 2000 2002 2004 2006 2008 2010 2012 2014
Mil
lio
ns
Population (LHS)
Inhabitants per dwelling (RHS)
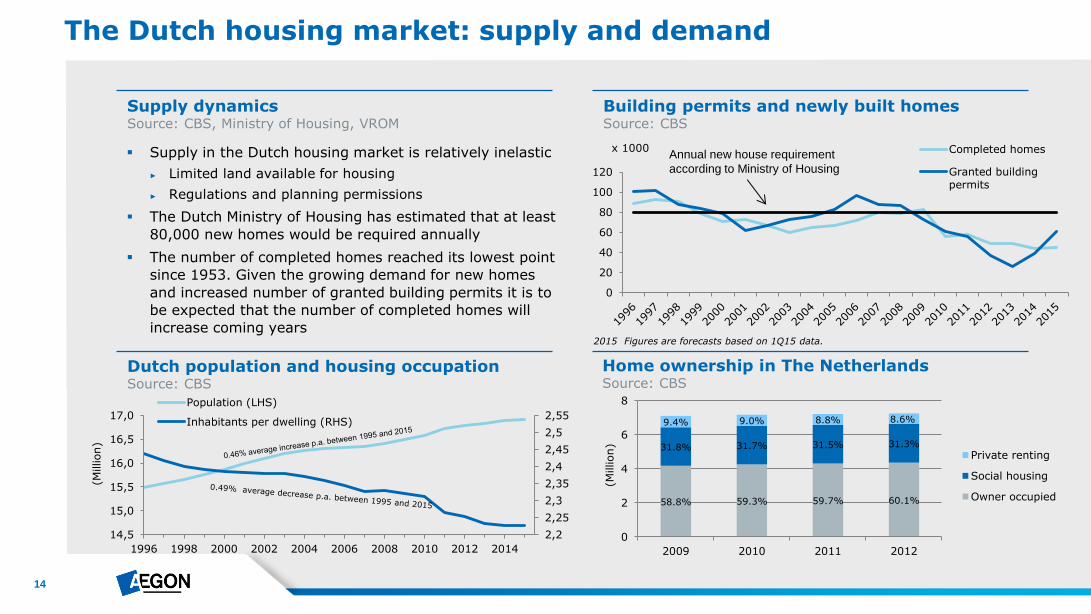
Supply in the Dutch housing market is relatively inelastic
► Limited land available for housing
► Regulations and planning permissions
The Dutch Ministry of Housing has estimated that at least
80,000 new homes would be required annually
The number of completed homes reached its lowest point
since 1953. Given the growing demand for new homes
and increased number of granted building permits it is to
be expected that the number of completed homes will
increase coming years
The Dutch housing market: supply and demand
Supply dynamics Source: CBS, Ministry of Housing, VROM
Building permits and newly built homes Source: CBS
Annual new house requirement
according to Ministry of Housing
x 1000
Dutch population and housing occupation Source: CBS
Home ownership in The Netherlands Source: CBS
(Million)
0
20
40
60
80
100
120
Completed homes
Granted buildingpermits
2015 Figures are forecasts based on 1Q15 data.
58.8% 59.3% 59.7% 60.1%
31.8% 31.7% 31.5% 31.3%
9.4% 9.0% 8.8% 8.6%
0
2
4
6
8
2009 2010 2011 2012
(Million)
Private renting
Social housing
Owner occupied
15
The Dutch Residential Mortgage Market
16
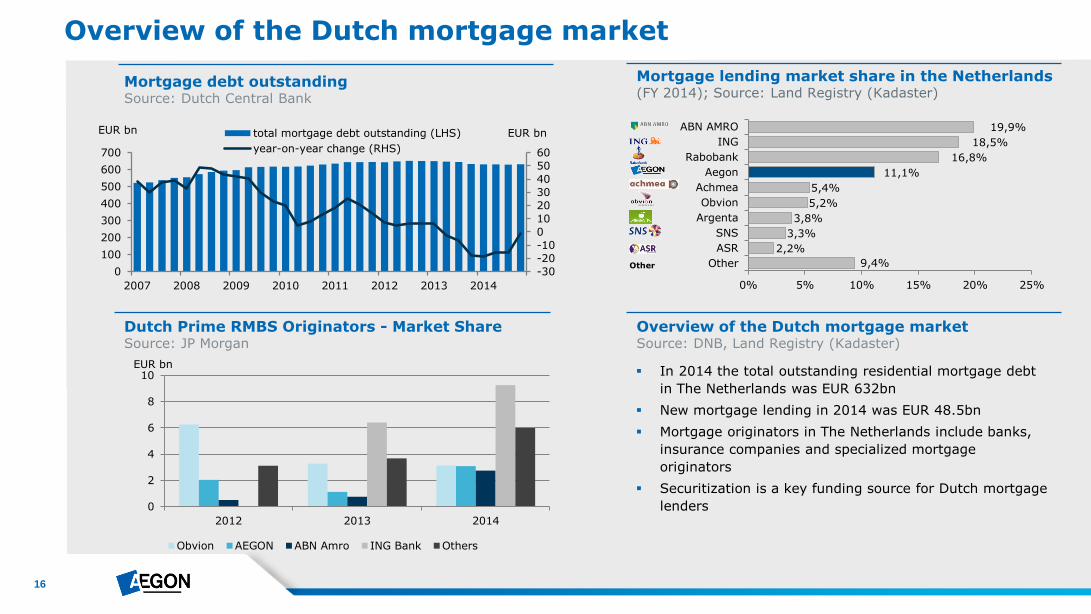
Overview of the Dutch mortgage market
Mortgage lending market share in the Netherlands (FY 2014); Source: Land Registry (Kadaster)
Overview of the Dutch mortgage market Source: DNB, Land Registry (Kadaster)
Dutch Prime RMBS Originators - Market Share Source: JP Morgan
Mortgage debt outstanding Source: Dutch Central Bank
In 2014 the total outstanding residential mortgage debt
in The Netherlands was EUR 632bn
New mortgage lending in 2014 was EUR 48.5bn
Mortgage originators in The Netherlands include banks,
insurance companies and specialized mortgage
originators
Securitization is a key funding source for Dutch mortgage
lenders
Other
EUR bn EUR bn
-30
-20
-10
0
10
20
30
40
50
60
0
100
200
300
400
500
600
700
2007 2008 2009 2010 2011 2012 2013 2014
Thousands
Thousands
total mortgage debt outstanding (LHS)
year-on-year change (RHS)
9,4%
2,2%
3,3%
3,8%
5,2%
5,4%
11,1%
16,8%
18,5%
19,9%
0% 5% 10% 15% 20% 25%
Other
ASR
SNS
Argenta
Obvion
Achmea
Aegon
Rabobank
ING
ABN AMRO
0
2
4
6
8
10
2012 2013 2014
Obvion AEGON ABN Amro ING Bank Others
EUR bn
17
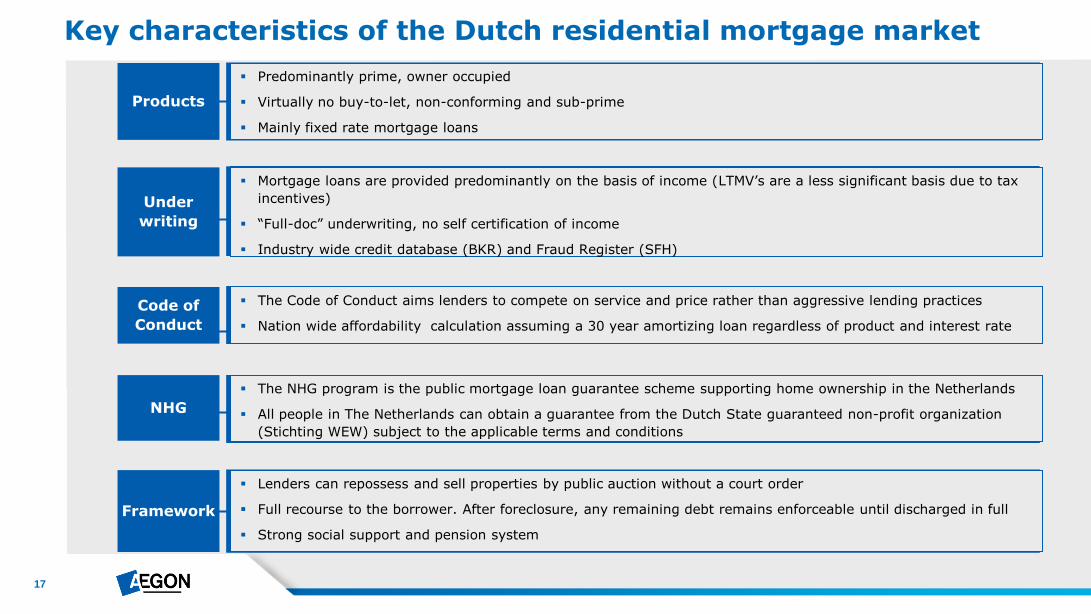
Key characteristics of the Dutch residential mortgage market
Under
writing
Mortgage loans are provided predominantly on the basis of income (LTMV’s are a less significant basis due to tax
incentives)
“Full-doc” underwriting, no self certification of income
Industry wide credit database (BKR) and Fraud Register (SFH)
Code of
Conduct
The Code of Conduct aims lenders to compete on service and price rather than aggressive lending practices
Nation wide affordability calculation assuming a 30 year amortizing loan regardless of product and interest rate
Framework
Lenders can repossess and sell properties by public auction without a court order
Full recourse to the borrower. After foreclosure, any remaining debt remains enforceable until discharged in full
Strong social support and pension system
Products
Predominantly prime, owner occupied
Virtually no buy-to-let, non-conforming and sub-prime
Mainly fixed rate mortgage loans
NHG
The NHG program is the public mortgage loan guarantee scheme supporting home ownership in the Netherlands
All people in The Netherlands can obtain a guarantee from the Dutch State guaranteed non-profit organization
(Stichting WEW) subject to the applicable terms and conditions
18
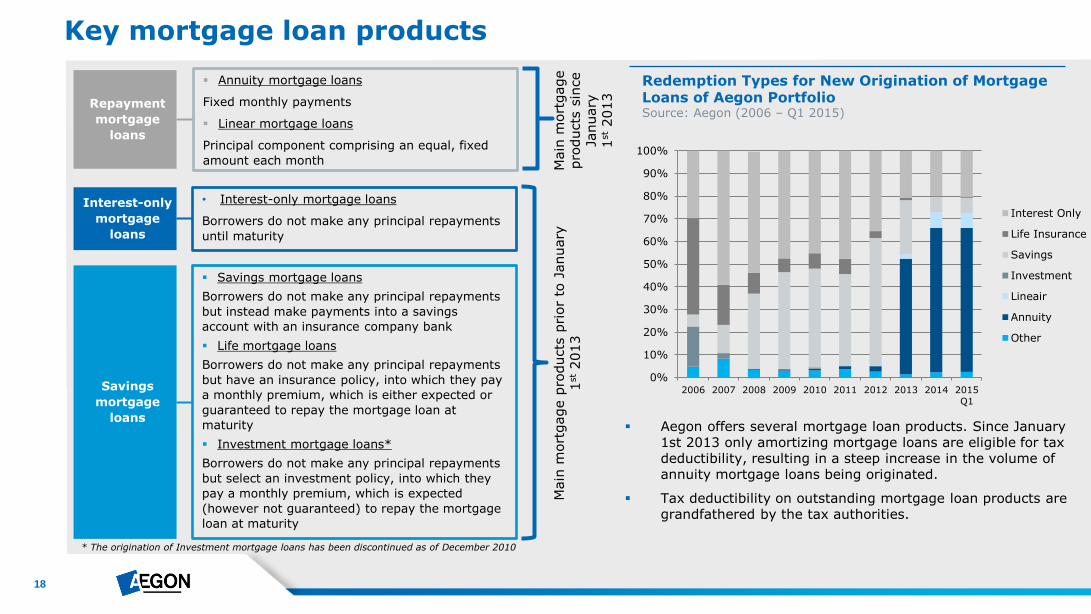
Key mortgage loan products
* The origination of Investment mortgage loans has been discontinued as of December 2010
Repayment
mortgage
loans
Annuity mortgage loans
Fixed monthly payments
Linear mortgage loans
Principal component comprising an equal, fixed
amount each month
Interest-only
mortgage
loans
• Interest-only mortgage loans
Borrowers do not make any principal repayments
until maturity
Savings mortgage loans
Borrowers do not make any principal repayments
but instead make payments into a savings
account with an insurance company bank
Life mortgage loans
Borrowers do not make any principal repayments
but have an insurance policy, into which they pay
a monthly premium, which is either expected or
guaranteed to repay the mortgage loan at
maturity
Investment mortgage loans*
Borrowers do not make any principal repayments
but select an investment policy, into which they
pay a monthly premium, which is expected
(however not guaranteed) to repay the mortgage
loan at maturity
Savings
mortgage
loans
Main
mort
gage p
roducts
pri
or
to J
anuary
1
st 2013
Main
mort
gage
pro
ducts
sin
ce
January
1
st 2013
Redemption Types for New Origination of Mortgage Loans of Aegon Portfolio Source: Aegon (2006 – Q1 2015)
Aegon offers several mortgage loan products. Since January 1st 2013 only amortizing mortgage loans are eligible for tax deductibility, resulting in a steep increase in the volume of annuity mortgage loans being originated.
Tax deductibility on outstanding mortgage loan products are grandfathered by the tax authorities.
0%
10%
20%
30%
40%
50%
60%
70%
80%
90%
100%
2006 2007 2008 2009 2010 2011 2012 2013 2014 2015
Q1
Interest Only
Life Insurance
Savings
Investment
Lineair
Annuity
Other
19
Recent policy developments impacting the Dutch housing market
2001
2011
2012
2013
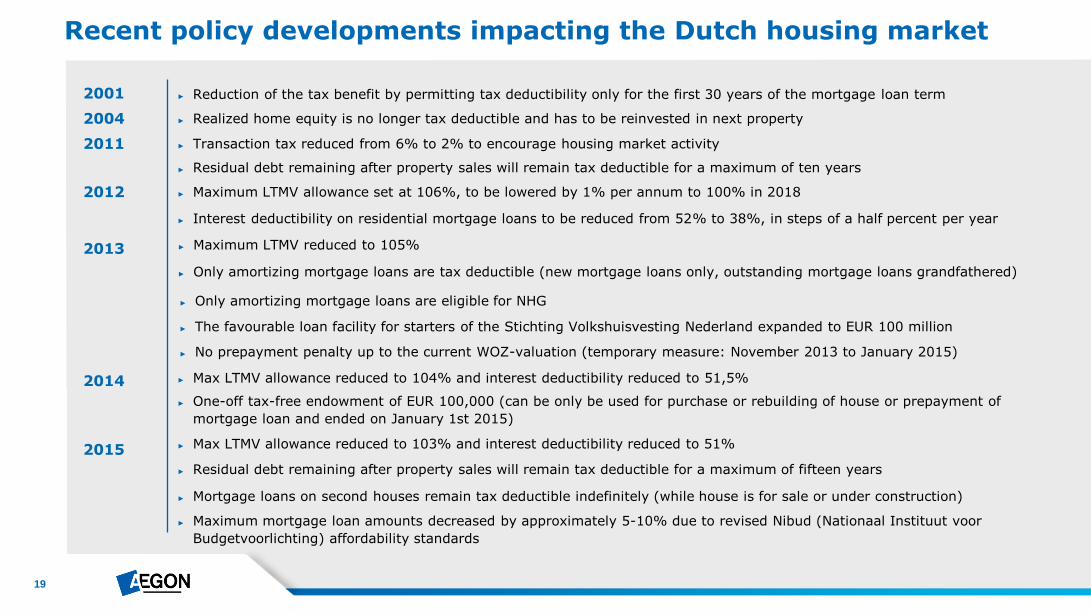
► Reduction of the tax benefit by permitting tax deductibility only for the first 30 years of the mortgage loan term
► Transaction tax reduced from 6% to 2% to encourage housing market activity
► Only amortizing mortgage loans are tax deductible (new mortgage loans only, outstanding mortgage loans grandfathered)
► Interest deductibility on residential mortgage loans to be reduced from 52% to 38%, in steps of a half percent per year
► Maximum LTMV allowance set at 106%, to be lowered by 1% per annum to 100% in 2018
► The favourable loan facility for starters of the Stichting Volkshuisvesting Nederland expanded to EUR 100 million
► Only amortizing mortgage loans are eligible for NHG
► Residual debt remaining after property sales will remain tax deductible for a maximum of ten years
► No prepayment penalty up to the current WOZ-valuation (temporary measure: November 2013 to January 2015)
► One-off tax-free endowment of EUR 100,000 (can be only be used for purchase or rebuilding of house or prepayment of
mortgage loan and ended on January 1st 2015)
2004 ► Realized home equity is no longer tax deductible and has to be reinvested in next property
2014
2015
► Max LTMV allowance reduced to 103% and interest deductibility reduced to 51%
► Residual debt remaining after property sales will remain tax deductible for a maximum of fifteen years
► Maximum mortgage loan amounts decreased by approximately 5-10% due to revised Nibud (Nationaal Instituut voor
Budgetvoorlichting) affordability standards
► Mortgage loans on second houses remain tax deductible indefinitely (while house is for sale or under construction)
► Max LTMV allowance reduced to 104% and interest deductibility reduced to 51,5%
► Maximum LTMV reduced to 105%
20
Code of Conduct for mortgage loans
Overview of the Code of Conduct
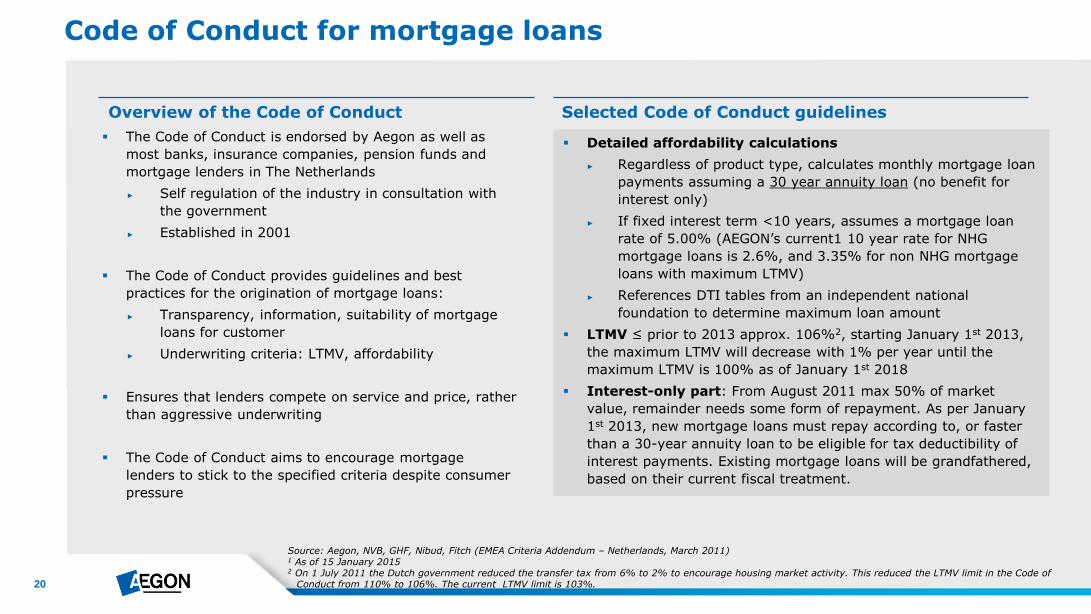
The Code of Conduct is endorsed by Aegon as well as
most banks, insurance companies, pension funds and
mortgage lenders in The Netherlands
► Self regulation of the industry in consultation with
the government
► Established in 2001
The Code of Conduct provides guidelines and best
practices for the origination of mortgage loans:
► Transparency, information, suitability of mortgage
loans for customer
► Underwriting criteria: LTMV, affordability
Ensures that lenders compete on service and price, rather
than aggressive underwriting
The Code of Conduct aims to encourage mortgage
lenders to stick to the specified criteria despite consumer
pressure
Selected Code of Conduct guidelines
Source: Aegon, NVB, GHF, Nibud, Fitch (EMEA Criteria Addendum – Netherlands, March 2011) 1 As of 15 January 2015 2 On 1 July 2011 the Dutch government reduced the transfer tax from 6% to 2% to encourage housing market activity. This reduced the LTMV limit in the Code of
Conduct from 110% to 106%. The current LTMV limit is 103%.
Detailed affordability calculations
► Regardless of product type, calculates monthly mortgage loan
payments assuming a 30 year annuity loan (no benefit for
interest only)
► If fixed interest term <10 years, assumes a mortgage loan
rate of 5.00% (AEGON’s current1 10 year rate for NHG
mortgage loans is 2.6%, and 3.35% for non NHG mortgage
loans with maximum LTMV)
► References DTI tables from an independent national
foundation to determine maximum loan amount
LTMV ≤ prior to 2013 approx. 106%2, starting January 1st 2013,
the maximum LTMV will decrease with 1% per year until the
maximum LTMV is 100% as of January 1st 2018
Interest-only part: From August 2011 max 50% of market
value, remainder needs some form of repayment. As per January
1st 2013, new mortgage loans must repay according to, or faster
than a 30-year annuity loan to be eligible for tax deductibility of
interest payments. Existing mortgage loans will be grandfathered,
based on their current fiscal treatment.
21
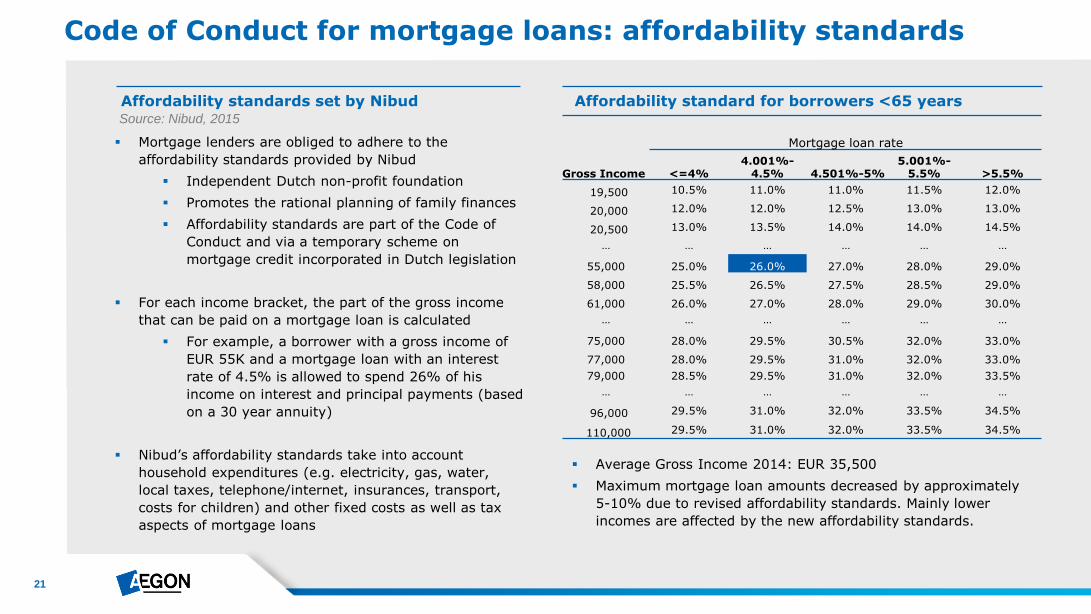
Average Gross Income 2014: EUR 35,500
Maximum mortgage loan amounts decreased by approximately
5-10% due to revised affordability standards. Mainly lower
incomes are affected by the new affordability standards.
Mortgage loan rate
Gross Income <=4% 4.001%-
4.5% 4.501%-5% 5.001%-
5.5% >5.5%
19,500 10.5% 11.0% 11.0% 11.5% 12.0%
20,000 12.0% 12.0% 12.5% 13.0% 13.0%
20,500 13.0% 13.5% 14.0% 14.0% 14.5%
… … … … … …
55,000 25.0% 26.0% 27.0% 28.0% 29.0%
58,000 25.5% 26.5% 27.5% 28.5% 29.0%
61,000 26.0% 27.0% 28.0% 29.0% 30.0%
… … … … … …
75,000 28.0% 29.5% 30.5% 32.0% 33.0%
77,000 28.0% 29.5% 31.0% 32.0% 33.0%
79,000 28.5% 29.5% 31.0% 32.0% 33.5%
… … … … … …
96,000 29.5% 31.0% 32.0% 33.5% 34.5%
110,000 29.5% 31.0% 32.0% 33.5% 34.5%
Code of Conduct for mortgage loans: affordability standards
Affordability standards set by Nibud
Mortgage lenders are obliged to adhere to the
affordability standards provided by Nibud
Independent Dutch non-profit foundation
Promotes the rational planning of family finances
Affordability standards are part of the Code of
Conduct and via a temporary scheme on
mortgage credit incorporated in Dutch legislation
For each income bracket, the part of the gross income
that can be paid on a mortgage loan is calculated
For example, a borrower with a gross income of
EUR 55K and a mortgage loan with an interest
rate of 4.5% is allowed to spend 26% of his
income on interest and principal payments (based
on a 30 year annuity)
Nibud’s affordability standards take into account
household expenditures (e.g. electricity, gas, water,
local taxes, telephone/internet, insurances, transport,
costs for children) and other fixed costs as well as tax
aspects of mortgage loans
Affordability standard for borrowers <65 years Source: Nibud, 2015
22
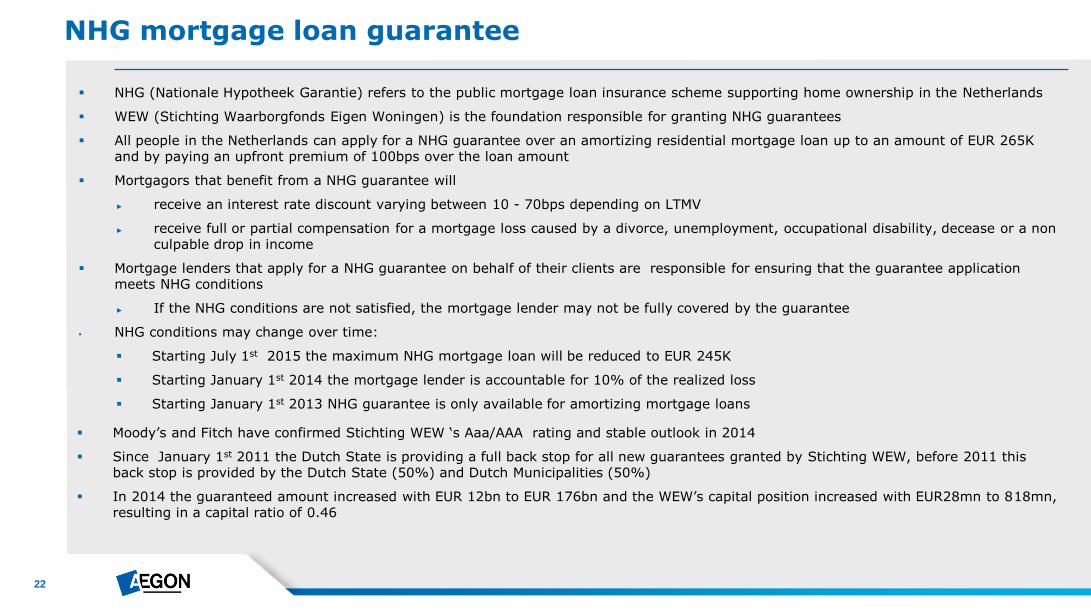
NHG (Nationale Hypotheek Garantie) refers to the public mortgage loan insurance scheme supporting home ownership in the Netherlands
WEW (Stichting Waarborgfonds Eigen Woningen) is the foundation responsible for granting NHG guarantees
All people in the Netherlands can apply for a NHG guarantee over an amortizing residential mortgage loan up to an amount of EUR 265K and by paying an upfront premium of 100bps over the loan amount
Mortgagors that benefit from a NHG guarantee will
► receive an interest rate discount varying between 10 - 70bps depending on LTMV
► receive full or partial compensation for a mortgage loss caused by a divorce, unemployment, occupational disability, decease or a non culpable drop in income
Mortgage lenders that apply for a NHG guarantee on behalf of their clients are responsible for ensuring that the guarantee application meets NHG conditions
► If the NHG conditions are not satisfied, the mortgage lender may not be fully covered by the guarantee
NHG conditions may change over time:
Starting July 1st 2015 the maximum NHG mortgage loan will be reduced to EUR 245K
Starting January 1st 2014 the mortgage lender is accountable for 10% of the realized loss
Starting January 1st 2013 NHG guarantee is only available for amortizing mortgage loans
NHG mortgage loan guarantee
Moody’s and Fitch have confirmed Stichting WEW ‘s Aaa/AAA rating and stable outlook in 2014
Since January 1st 2011 the Dutch State is providing a full back stop for all new guarantees granted by Stichting WEW, before 2011 this back stop is provided by the Dutch State (50%) and Dutch Municipalities (50%)
In 2014 the guaranteed amount increased with EUR 12bn to EUR 176bn and the WEW’s capital position increased with EUR28mn to 818mn, resulting in a capital ratio of 0.46
23
NHG Statistics
NHG statistics
Granted NHG claims Reasons for submitting a NHG claim
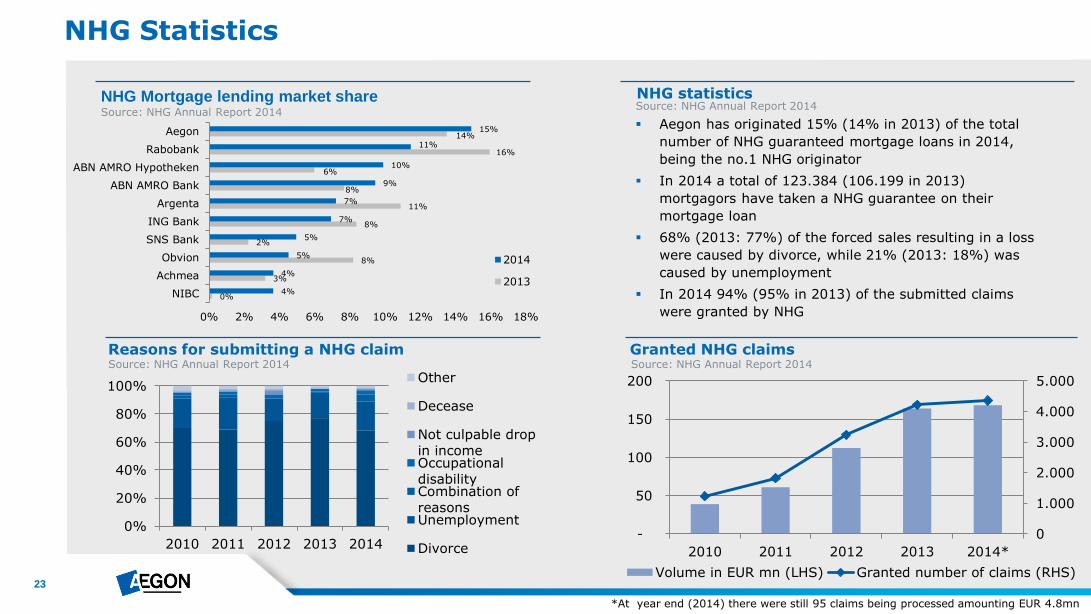
Aegon has originated 15% (14% in 2013) of the total
number of NHG guaranteed mortgage loans in 2014,
being the no.1 NHG originator
In 2014 a total of 123.384 (106.199 in 2013)
mortgagors have taken a NHG guarantee on their
mortgage loan
68% (2013: 77%) of the forced sales resulting in a loss
were caused by divorce, while 21% (2013: 18%) was
caused by unemployment
In 2014 94% (95% in 2013) of the submitted claims
were granted by NHG
0%
3%
8%
2%
8%
11%
8%
6%
16%
14%
4%
4%
5%
5%
7%
7%
9%
10%
11%
15%
0% 2% 4% 6% 8% 10% 12% 14% 16% 18%
NIBC
Achmea
Obvion
SNS Bank
ING Bank
Argenta
ABN AMRO Bank
ABN AMRO Hypotheken
Rabobank
Aegon
2014
2013
NHG Mortgage lending market share Source: NHG Annual Report 2014
0
1.000
2.000
3.000
4.000
5.000
-
50
100
150
200
2010 2011 2012 2013 2014*
Volume in EUR mn (LHS) Granted number of claims (RHS)
Source: NHG Annual Report 2014 Source: NHG Annual Report 2014
*At year end (2014) there were still 95 claims being processed amounting EUR 4.8mn
0%
20%
40%
60%
80%
100%
2010 2011 2012 2013 2014
Other
Decease
Not culpable drop
in incomeOccupational
disabilityCombination of
reasonsUnemployment
Divorce
Source: NHG Annual Report 2014
24
The social security infrastructure in The Netherlands
Employee Insurance Schemes
Unemployment Insurance Act (WW)
Sickness Benefits Act (ZW)
Work and Income according to Labor capacity Act (WIA)
Employer Pension Plans
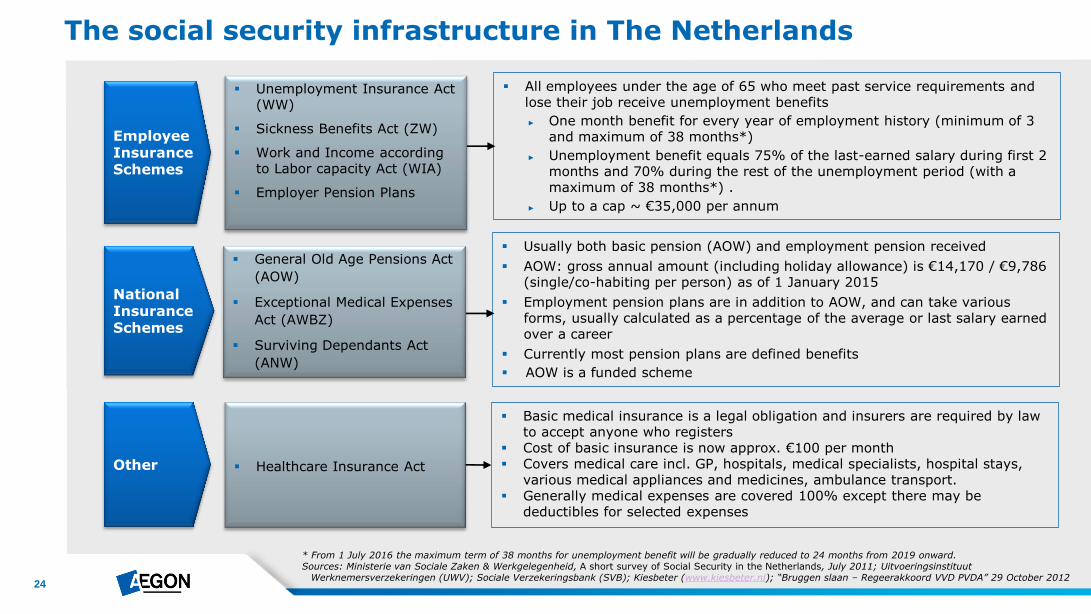
All employees under the age of 65 who meet past service requirements and lose their job receive unemployment benefits
► One month benefit for every year of employment history (minimum of 3 and maximum of 38 months*)
► Unemployment benefit equals 75% of the last-earned salary during first 2 months and 70% during the rest of the unemployment period (with a maximum of 38 months*) .
► Up to a cap ~ €35,000 per annum
National Insurance Schemes
General Old Age Pensions Act
(AOW)
Exceptional Medical Expenses
Act (AWBZ)
Surviving Dependants Act
(ANW)
Other
Healthcare Insurance Act
Basic medical insurance is a legal obligation and insurers are required by law to accept anyone who registers
Cost of basic insurance is now approx. €100 per month Covers medical care incl. GP, hospitals, medical specialists, hospital stays,
various medical appliances and medicines, ambulance transport. Generally medical expenses are covered 100% except there may be
deductibles for selected expenses
* From 1 July 2016 the maximum term of 38 months for unemployment benefit will be gradually reduced to 24 months from 2019 onward. Sources: Ministerie van Sociale Zaken & Werkgelegenheid, A short survey of Social Security in the Netherlands, July 2011; Uitvoeringsinstituut
Werknemersverzekeringen (UWV); Sociale Verzekeringsbank (SVB); Kiesbeter (www.kiesbeter.nl); “Bruggen slaan – Regeerakkoord VVD PVDA” 29 October 2012
Usually both basic pension (AOW) and employment pension received
AOW: gross annual amount (including holiday allowance) is €14,170 / €9,786 (single/co-habiting per person) as of 1 January 2015
Employment pension plans are in addition to AOW, and can take various forms, usually calculated as a percentage of the average or last salary earned over a career
Currently most pension plans are defined benefits
AOW is a funded scheme
25
Focus on foreclosure in the Netherlands 1
Foreclosure
Aegon’s collection procedures
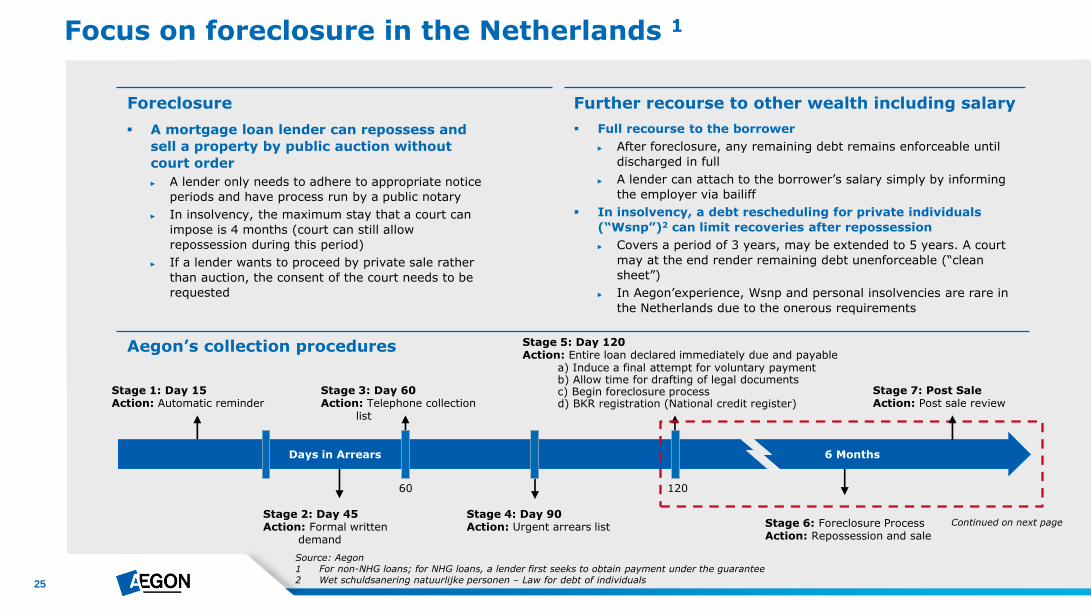
Stage 4: Day 90 Action: Urgent arrears list Stage 6: Foreclosure Process
Action: Repossession and sale
Stage 1: Day 15 Action: Automatic reminder
Stage 3: Day 60 Action: Telephone collection
list
Stage 5: Day 120 Action: Entire loan declared immediately due and payable a) Induce a final attempt for voluntary payment b) Allow time for drafting of legal documents c) Begin foreclosure process d) BKR registration (National credit register)
60 120
Days in Arrears 6 Months
Stage 2: Day 45 Action: Formal written
demand
A mortgage loan lender can repossess and
sell a property by public auction without
court order
► A lender only needs to adhere to appropriate notice
periods and have process run by a public notary
► In insolvency, the maximum stay that a court can
impose is 4 months (court can still allow
repossession during this period)
► If a lender wants to proceed by private sale rather
than auction, the consent of the court needs to be
requested
Full recourse to the borrower
► After foreclosure, any remaining debt remains enforceable until
discharged in full
► A lender can attach to the borrower’s salary simply by informing
the employer via bailiff
In insolvency, a debt rescheduling for private individuals
(“Wsnp”)2 can limit recoveries after repossession
► Covers a period of 3 years, may be extended to 5 years. A court
may at the end render remaining debt unenforceable (“clean
sheet”)
► In Aegon’experience, Wsnp and personal insolvencies are rare in
the Netherlands due to the onerous requirements
Further recourse to other wealth including salary
Source: Aegon 1 For non-NHG loans; for NHG loans, a lender first seeks to obtain payment under the guarantee 2 Wet schuldsanering natuurlijke personen – Law for debt of individuals
Stage 7: Post Sale Action: Post sale review
Continued on next page
26
Repossession & sale process in the Netherlands
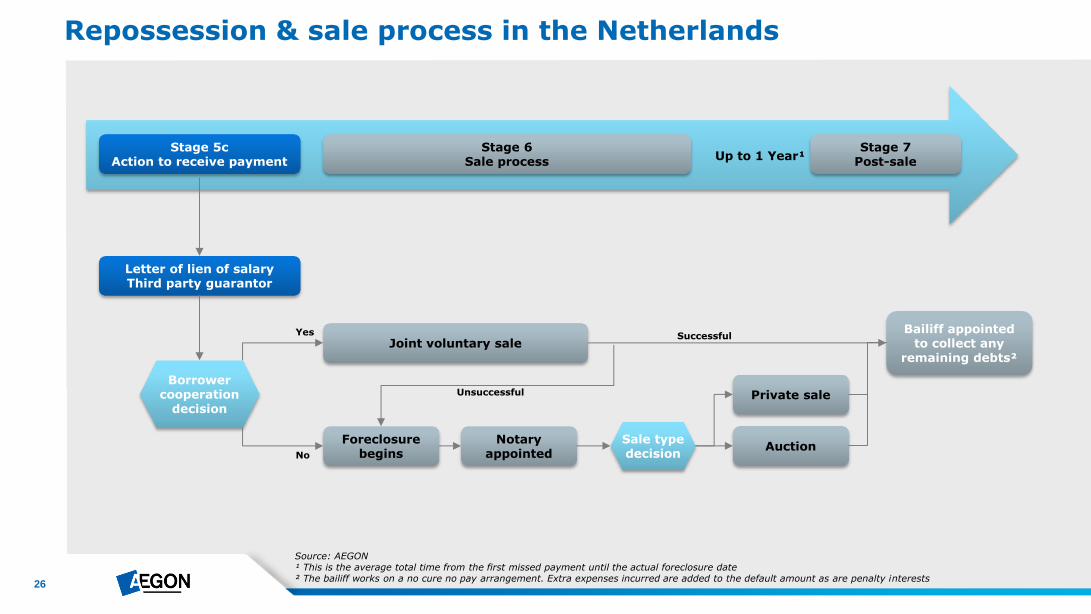
Source: AEGON ¹ This is the average total time from the first missed payment until the actual foreclosure date ² The bailiff works on a no cure no pay arrangement. Extra expenses incurred are added to the default amount as are penalty interests
Stage 5c Action to receive payment
Stage 6 Sale process
Stage 7 Post-sale Up to 1 Year¹
Letter of lien of salary Third party guarantor
Joint voluntary sale
Foreclosure begins
Notary appointed
Borrower cooperation
decision
Sale type decision
Auction
Private sale
Bailiff appointed to collect any
remaining debts²
Yes
No
Unsuccessful
Successful
27
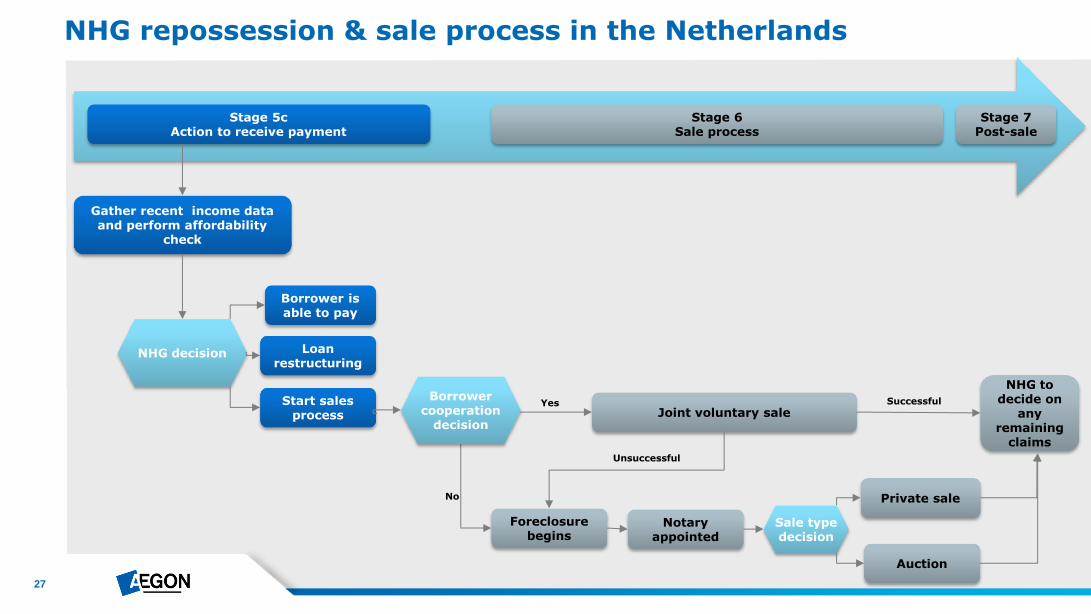
NHG repossession & sale process in the Netherlands
Stage 5c Action to receive payment
Stage 6 Sale process
Stage 7 Post-sale
Gather recent income data and perform affordability
check
Borrower is able to pay
NHG decision
Start sales process
Loan restructuring
Joint voluntary sale
Foreclosure begins
Notary appointed
Sale type decision
Auction
Private sale
Unsuccessful
Successful Borrower cooperation
decision
NHG to decide on
any remaining
claims
No
Yes
28
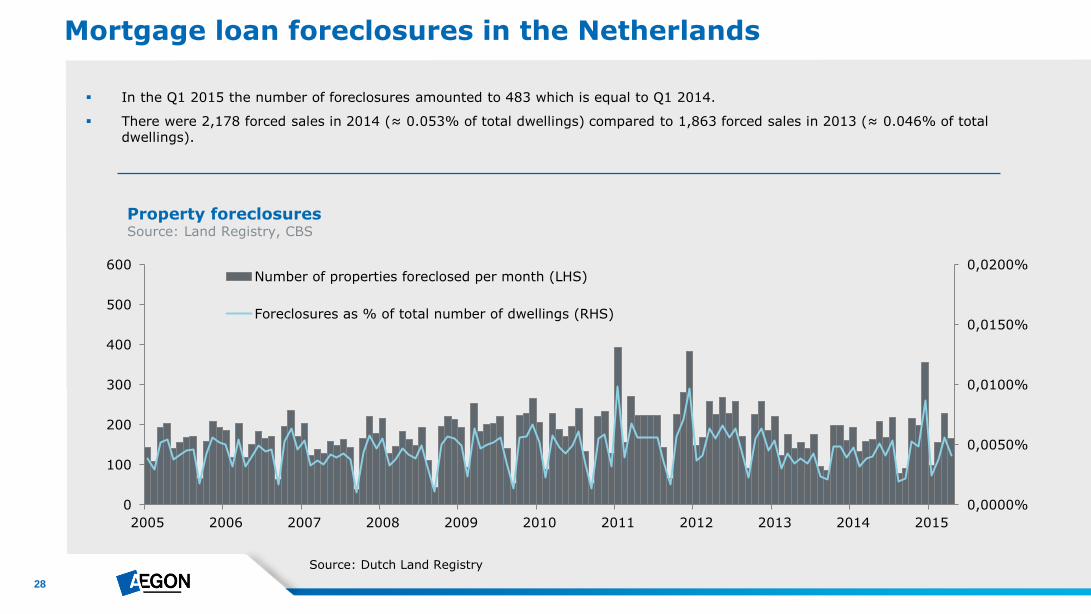
Property foreclosures Source: Land Registry, CBS
Mortgage loan foreclosures in the Netherlands
In the Q1 2015 the number of foreclosures amounted to 483 which is equal to Q1 2014.
There were 2,178 forced sales in 2014 (≈ 0.053% of total dwellings) compared to 1,863 forced sales in 2013 (≈ 0.046% of total dwellings).
Source: Dutch Land Registry
0,0000%
0,0050%
0,0100%
0,0150%
0,0200%
0
100
200
300
400
500
600
2005 2006 2007 2008 2009 2010 2011 2012 2013 2014 2015
Number of properties foreclosed per month (LHS)
Foreclosures as % of total number of dwellings (RHS)
29
Aegon Residential Mortgage Loan Origination, Underwriting & Servicing
30
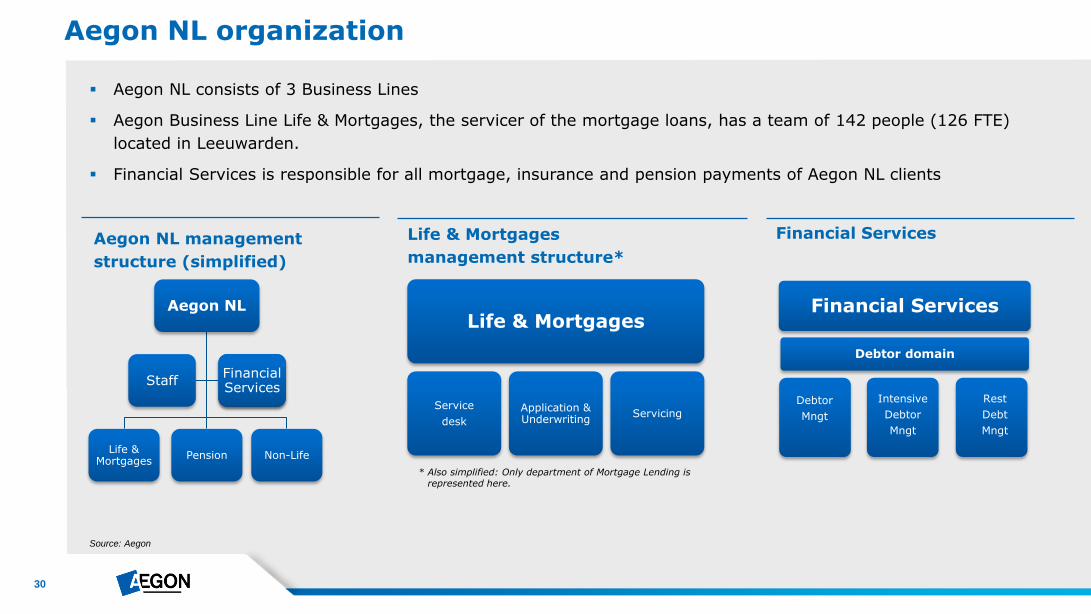
Aegon NL consists of 3 Business Lines
Aegon Business Line Life & Mortgages, the servicer of the mortgage loans, has a team of 142 people (126 FTE)
located in Leeuwarden.
Financial Services is responsible for all mortgage, insurance and pension payments of Aegon NL clients
Aegon NL organization
Source: Aegon
Aegon NL management
structure (simplified)
Life & Mortgages
management structure*
Aegon NL
Life & Mortgages
Pension Non-Life
Staff Financial Services
Life & Mortgages
Service
desk
Application & Underwriting
Servicing
* Also simplified: Only department of Mortgage Lending is represented here.
Financial Services
Financial Services
Debtor
Mngt
Intensive
Debtor
Mngt
Rest
Debt
Mngt
Debtor domain
31
All mortgage loans are originated by Aegon Hypotheken B.V. and serviced by Aegon Levensverzekering N.V.
► Aegon Hypotheken B.V. has taken over the origination from Aegon Levensverzekering N.V. in April 2011
► Both entities are 100% subsidiaries of Aegon Nederland N.V.
► The mortgage lending business is a powerful cross-selling tool for insurance products. With approx. 40% of all mortgage loans,
Aegon also sells an insurance product
All mortgage loans are sold through intermediaries
► Only professional regional and national parties who adhere to Aegon’s strict standards and requirements are used as
intermediaries
► All underwriting decisions are made by Aegon’s underwriting team based in Leeuwarden
► The advantage of using intermediaries is to increase the market range and use parties who have strong regional knowledge.
Aegon NL uses a wide range of intermediaries (self owned as well as other independent financial advisors). All underwriting
activities are performed by Aegon NL
► As of 1 January 2013, new legislation is in force. Unlike before, intermediaries are no longer allowed to receive commissions
from the underwriter, instead they will have to charge their fees directly to the client
► Aegon does not use the internet as an origination channel. Applications for the withdrawal of construction deposits can be done
online, other than that Aegon has no online payment services in use
Aegon NL mortgage lending organization
32
Aegon NL mortgage lending organization (cont’d)
The mortgage loans are widely distributed over the Netherlands and are also well diversified by borrower age
Due to its long history in secured funding, Aegon has good access to funding markets
The relatively long duration of its funding makes Aegon less vulnerable to refinancing risk
All mortgage related processes are periodically reviewed and are regularly audited
► Aegon uses the “Gap-model” as its framework for quality management, because its starting point is obligations &
expectations of external stakeholders amongst which are the customers
► Aegon has developed a Sox control framework which is regularly tested internally by Operational Risk Management and by
an external auditor
Aegon has defined three ‘lines of defense’ for monitoring risk management
► Process owners take primary responsibility for risk management of their designated processes
► Compliance and Risk Management has supervision on the management of risks at business unit level
► Internal Audit Netherlands (IAN) periodically tests compliance with the defined risk frameworks for Aegon NL
► All findings by IAN, and the risk associated to those findings, are being monitored in the BWise database
33
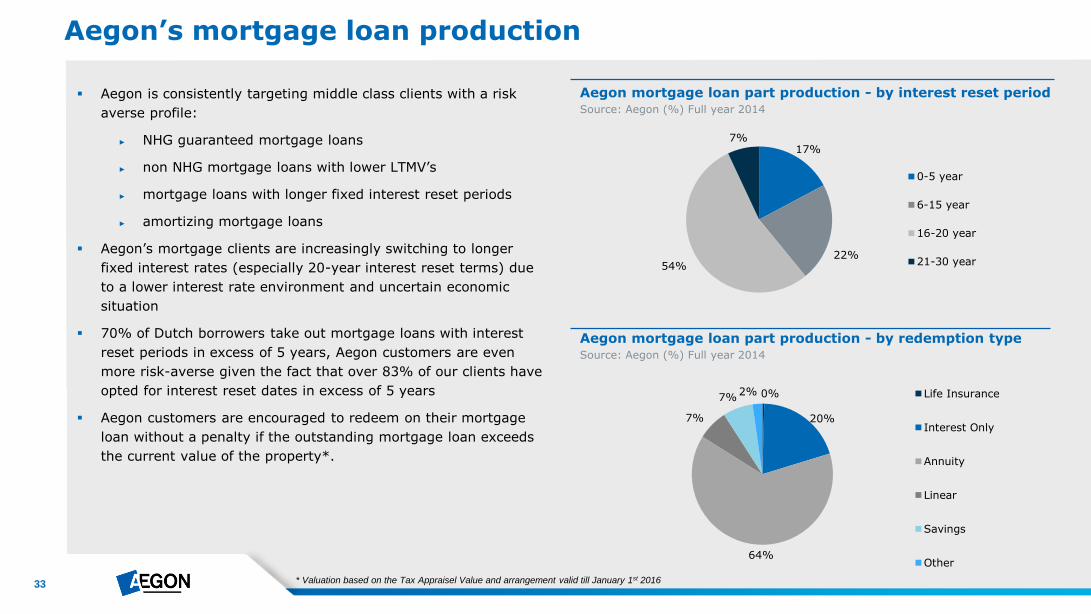
Aegon is consistently targeting middle class clients with a risk
averse profile:
► NHG guaranteed mortgage loans
► non NHG mortgage loans with lower LTMV’s
► mortgage loans with longer fixed interest reset periods
► amortizing mortgage loans
Aegon’s mortgage clients are increasingly switching to longer
fixed interest rates (especially 20-year interest reset terms) due
to a lower interest rate environment and uncertain economic
situation
70% of Dutch borrowers take out mortgage loans with interest
reset periods in excess of 5 years, Aegon customers are even
more risk-averse given the fact that over 83% of our clients have
opted for interest reset dates in excess of 5 years
Aegon customers are encouraged to redeem on their mortgage
loan without a penalty if the outstanding mortgage loan exceeds
the current value of the property*.
Aegon’s mortgage loan production
Aegon mortgage loan part production - by redemption type Source: Aegon (%) Full year 2014
Aegon mortgage loan part production - by interest reset period Source: Aegon (%) Full year 2014
17%
22% 54%
7%
0-5 year
6-15 year
16-20 year
21-30 year
0%
20%
64%
7%
7% 2% Life Insurance
Interest Only
Annuity
Linear
Savings
Other
* Valuation based on the Tax Appraisel Value and arrangement valid till January 1st 2016
34
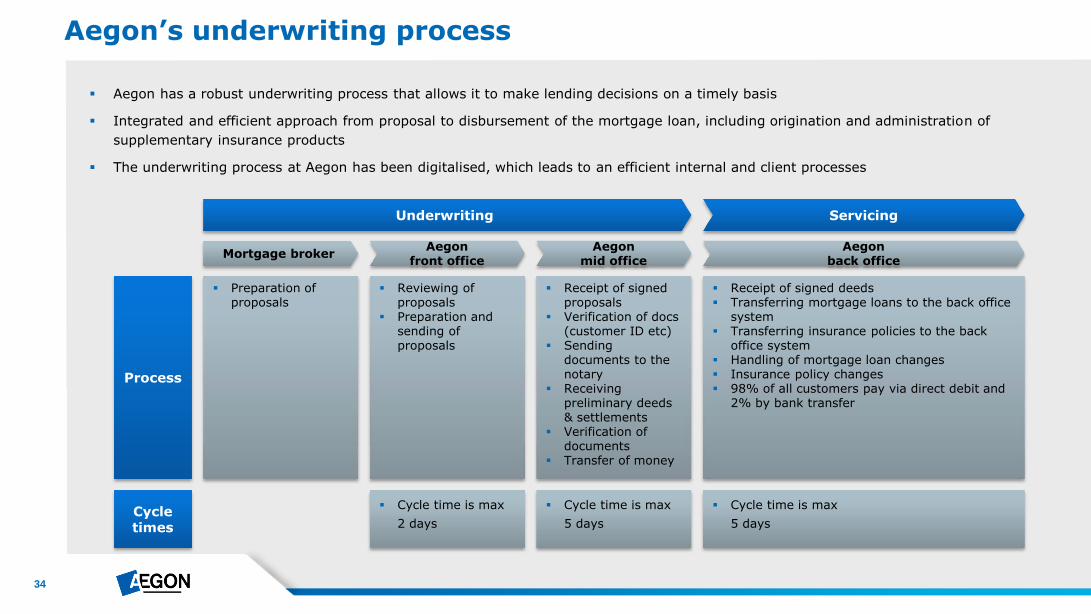
Aegon has a robust underwriting process that allows it to make lending decisions on a timely basis
Integrated and efficient approach from proposal to disbursement of the mortgage loan, including origination and administration of
supplementary insurance products
The underwriting process at Aegon has been digitalised, which leads to an efficient internal and client processes
Aegon’s underwriting process
Aegon front office
Mortgage broker Aegon
mid office Aegon
back office
Preparation of proposals
Reviewing of proposals
Preparation and sending of proposals
Receipt of signed proposals
Verification of docs (customer ID etc)
Sending documents to the notary
Receiving preliminary deeds & settlements
Verification of documents
Transfer of money
Receipt of signed deeds Transferring mortgage loans to the back office
system Transferring insurance policies to the back
office system Handling of mortgage loan changes Insurance policy changes 98% of all customers pay via direct debit and
2% by bank transfer
Cycle time is max
2 days
Cycle time is max
5 days
Cycle time is max
5 days
Process
Cycle times
Underwriting Servicing
35
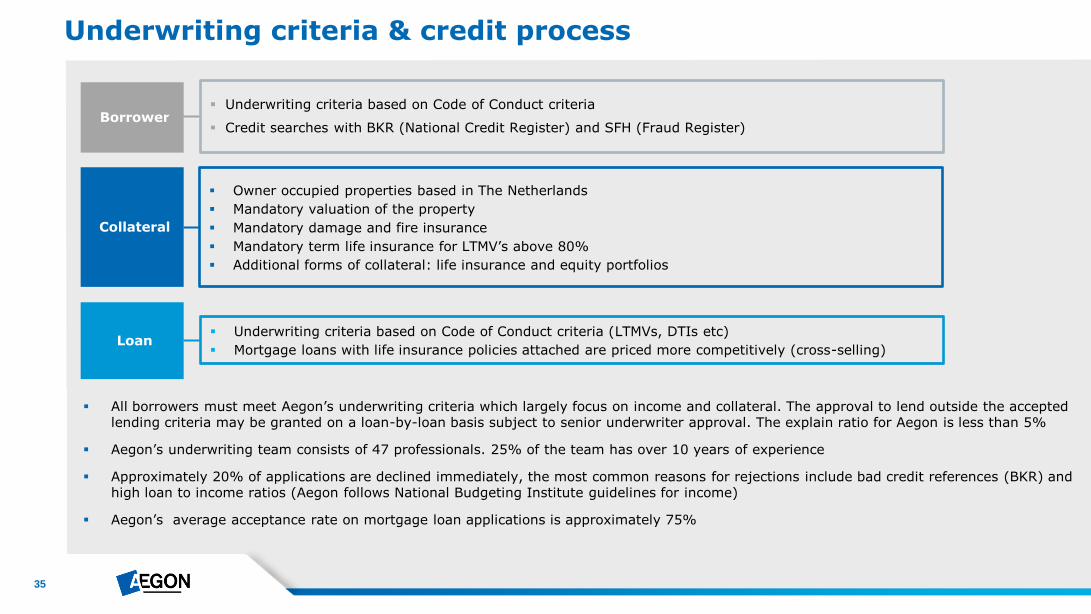
Underwriting criteria & credit process
Borrower Underwriting criteria based on Code of Conduct criteria
Credit searches with BKR (National Credit Register) and SFH (Fraud Register)
Collateral
Owner occupied properties based in The Netherlands
Mandatory valuation of the property
Mandatory damage and fire insurance
Mandatory term life insurance for LTMV’s above 80%
Additional forms of collateral: life insurance and equity portfolios
Underwriting criteria based on Code of Conduct criteria (LTMVs, DTIs etc)
Mortgage loans with life insurance policies attached are priced more competitively (cross-selling) Loan
All borrowers must meet Aegon’s underwriting criteria which largely focus on income and collateral. The approval to lend outside the accepted lending criteria may be granted on a loan-by-loan basis subject to senior underwriter approval. The explain ratio for Aegon is less than 5%
Aegon’s underwriting team consists of 47 professionals. 25% of the team has over 10 years of experience
Approximately 20% of applications are declined immediately, the most common reasons for rejections include bad credit references (BKR) and high loan to income ratios (Aegon follows National Budgeting Institute guidelines for income)
Aegon’s average acceptance rate on mortgage loan applications is approximately 75%
36
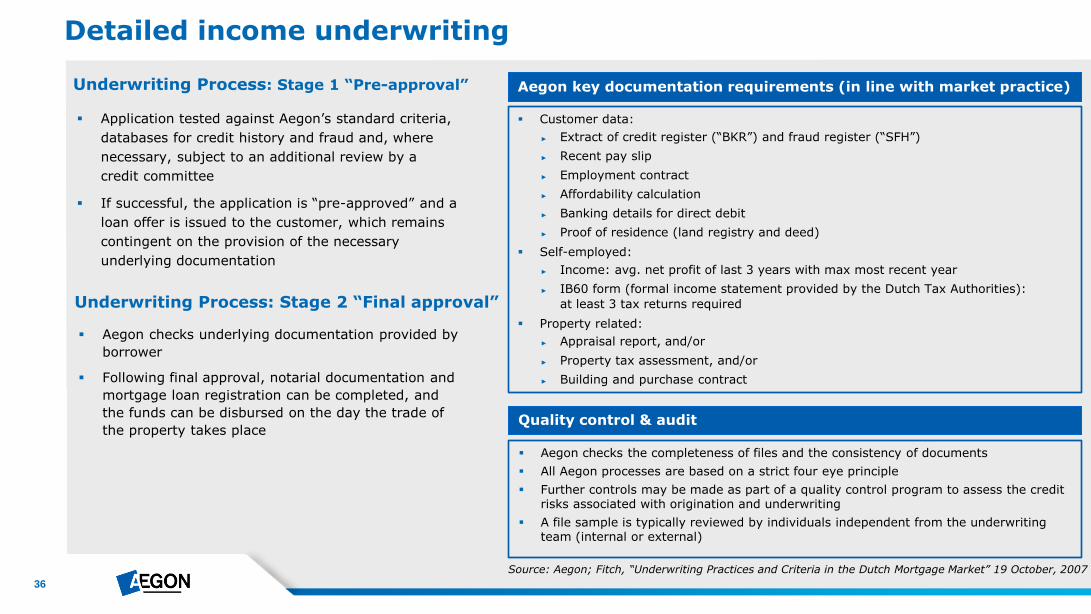
Detailed income underwriting
Application tested against Aegon’s standard criteria,
databases for credit history and fraud and, where
necessary, subject to an additional review by a
credit committee
If successful, the application is “pre-approved” and a
loan offer is issued to the customer, which remains
contingent on the provision of the necessary
underlying documentation
Underwriting Process: Stage 1 “Pre-approval”
Aegon checks underlying documentation provided by
borrower
Following final approval, notarial documentation and
mortgage loan registration can be completed, and
the funds can be disbursed on the day the trade of
the property takes place
Underwriting Process: Stage 2 “Final approval”
Customer data:
► Extract of credit register (“BKR”) and fraud register (“SFH”)
► Recent pay slip
► Employment contract
► Affordability calculation
► Banking details for direct debit
► Proof of residence (land registry and deed)
Self-employed:
► Income: avg. net profit of last 3 years with max most recent year
► IB60 form (formal income statement provided by the Dutch Tax Authorities):
at least 3 tax returns required
Property related:
► Appraisal report, and/or
► Property tax assessment, and/or
► Building and purchase contract
Aegon key documentation requirements (in line with market practice)
Aegon checks the completeness of files and the consistency of documents
All Aegon processes are based on a strict four eye principle
Further controls may be made as part of a quality control program to assess the credit risks associated with origination and underwriting
A file sample is typically reviewed by individuals independent from the underwriting team (internal or external)
Quality control & audit
Source: Aegon; Fitch, “Underwriting Practices and Criteria in the Dutch Mortgage Market” 19 October, 2007
37
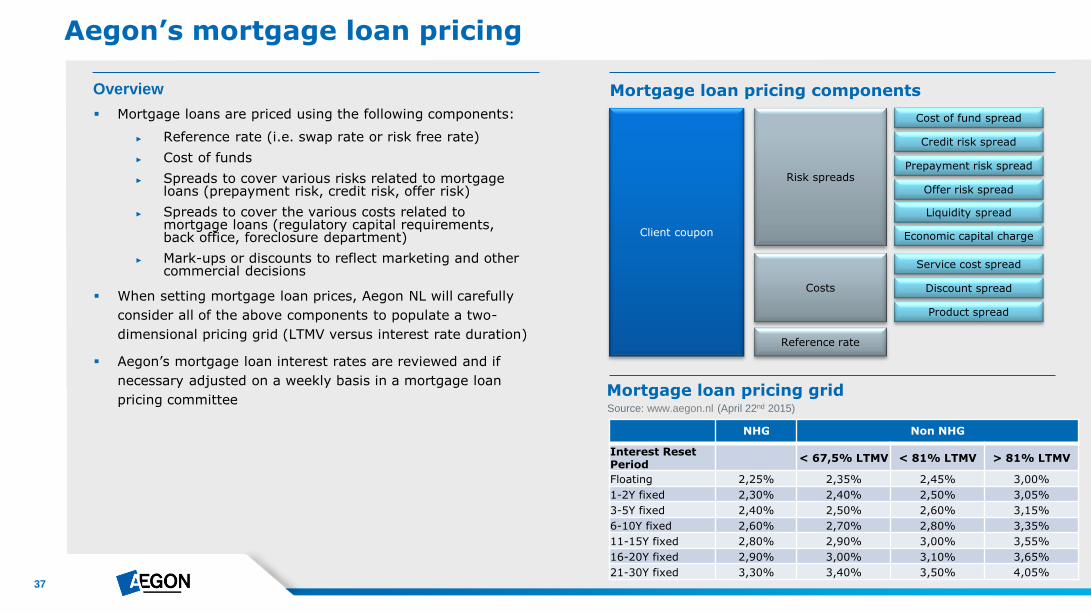
Mortgage loans are priced using the following components:
► Reference rate (i.e. swap rate or risk free rate)
► Cost of funds
► Spreads to cover various risks related to mortgage loans (prepayment risk, credit risk, offer risk)
► Spreads to cover the various costs related to mortgage loans (regulatory capital requirements, back office, foreclosure department)
► Mark-ups or discounts to reflect marketing and other commercial decisions
When setting mortgage loan prices, Aegon NL will carefully
consider all of the above components to populate a two-
dimensional pricing grid (LTMV versus interest rate duration)
Aegon’s mortgage loan interest rates are reviewed and if
necessary adjusted on a weekly basis in a mortgage loan
pricing committee
Aegon’s mortgage loan pricing
Mortgage loan pricing components
Client coupon
Risk spreads
Costs
Reference rate
Cost of fund spread
Credit risk spread
Discount spread
Service cost spread
Product spread
Prepayment risk spread
Offer risk spread
Liquidity spread
Economic capital charge
NHG Non NHG
Interest Reset Period
< 67,5% LTMV < 81% LTMV > 81% LTMV
Floating 2,25% 2,35% 2,45% 3,00%
1-2Y fixed 2,30% 2,40% 2,50% 3,05%
3-5Y fixed 2,40% 2,50% 2,60% 3,15%
6-10Y fixed 2,60% 2,70% 2,80% 3,35%
11-15Y fixed 2,80% 2,90% 3,00% 3,55%
16-20Y fixed 2,90% 3,00% 3,10% 3,65%
21-30Y fixed 3,30% 3,40% 3,50% 4,05%
Mortgage loan pricing grid Source: www.aegon.nl (April 22nd 2015)
Overview
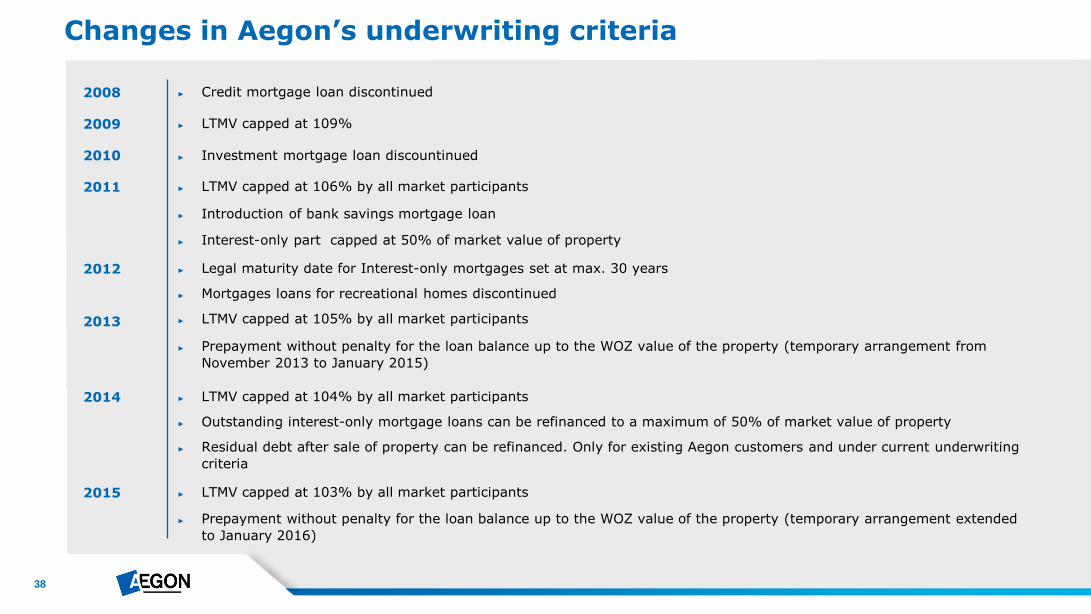
38
► Interest-only part capped at 50% of market value of property
► Introduction of bank savings mortgage loan
Changes in Aegon’s underwriting criteria
2008
2009
2010
2011
2012
2013
► Credit mortgage loan discontinued
► Investment mortgage loan discountinued
► LTMV capped at 109%
► LTMV capped at 106% by all market participants
► Prepayment without penalty for the loan balance up to the WOZ value of the property (temporary arrangement from
November 2013 to January 2015)
► Legal maturity date for Interest-only mortgages set at max. 30 years
► Mortgages loans for recreational homes discontinued
► LTMV capped at 105% by all market participants
2014 ► LTMV capped at 104% by all market participants
► Outstanding interest-only mortgage loans can be refinanced to a maximum of 50% of market value of property
► Residual debt after sale of property can be refinanced. Only for existing Aegon customers and under current underwriting
criteria
2015 ► LTMV capped at 103% by all market participants
► Prepayment without penalty for the loan balance up to the WOZ value of the property (temporary arrangement extended
to January 2016)
39
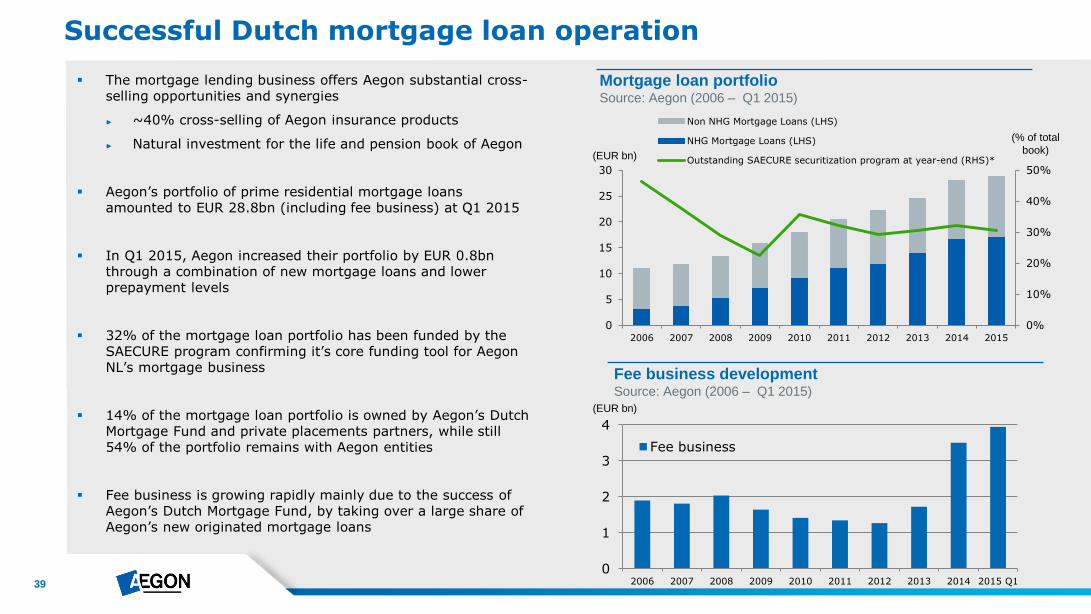
Mortgage loan portfolio Source: Aegon (2006 – Q1 2015)
Successful Dutch mortgage loan operation
(EUR bn)
(% of total
book)
The mortgage lending business offers Aegon substantial cross-selling opportunities and synergies
► ~40% cross-selling of Aegon insurance products
► Natural investment for the life and pension book of Aegon
Aegon’s portfolio of prime residential mortgage loans amounted to EUR 28.8bn (including fee business) at Q1 2015
In Q1 2015, Aegon increased their portfolio by EUR 0.8bn through a combination of new mortgage loans and lower prepayment levels
32% of the mortgage loan portfolio has been funded by the SAECURE program confirming it’s core funding tool for Aegon NL’s mortgage business
14% of the mortgage loan portfolio is owned by Aegon’s Dutch Mortgage Fund and private placements partners, while still 54% of the portfolio remains with Aegon entities
Fee business is growing rapidly mainly due to the success of Aegon’s Dutch Mortgage Fund, by taking over a large share of Aegon’s new originated mortgage loans
Fee business development Source: Aegon (2006 – Q1 2015)
0%
10%
20%
30%
40%
50%
0
5
10
15
20
25
30
2006 2007 2008 2009 2010 2011 2012 2013 2014 2015
Non NHG Mortgage Loans (LHS)
NHG Mortgage Loans (LHS)
Outstanding SAECURE securitization program at year-end (RHS)*(EUR bn)
0
1
2
3
4
2006 2007 2008 2009 2010 2011 2012 2013 2014 2015 Q1
Fee business

40
The Dutch RMBS Market in Perspective
41
28 bps
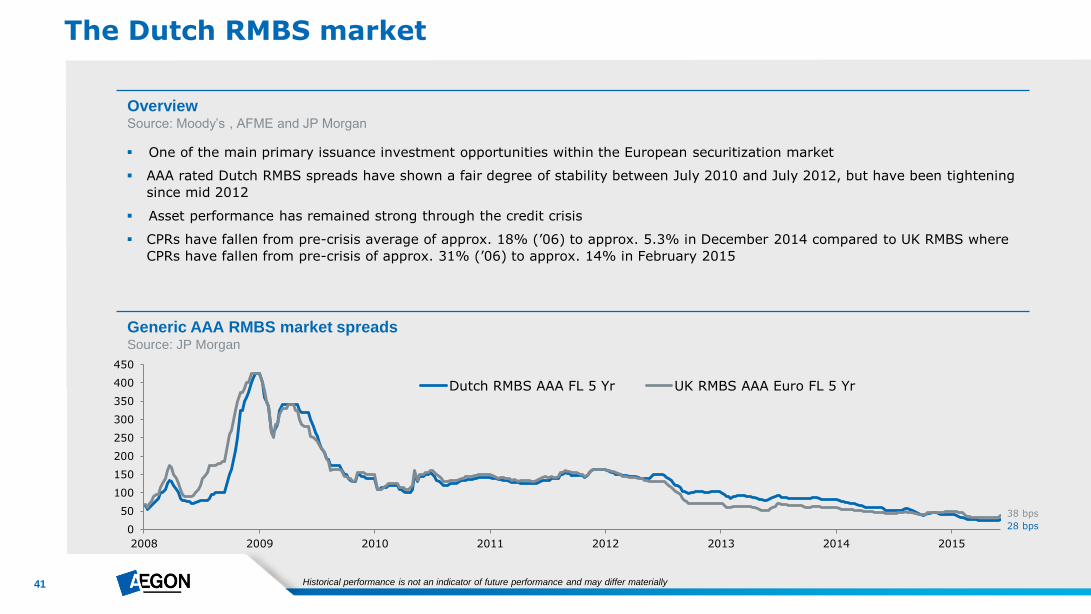
The Dutch RMBS market
Overview Source: Moody’s , AFME and JP Morgan
One of the main primary issuance investment opportunities within the European securitization market
AAA rated Dutch RMBS spreads have shown a fair degree of stability between July 2010 and July 2012, but have been tightening
since mid 2012
Asset performance has remained strong through the credit crisis
CPRs have fallen from pre-crisis average of approx. 18% (’06) to approx. 5.3% in December 2014 compared to UK RMBS where
CPRs have fallen from pre-crisis of approx. 31% (’06) to approx. 14% in February 2015
Generic AAA RMBS market spreads Source: JP Morgan
38 bps
Historical performance is not an indicator of future performance and may differ materially
0
50
100
150
200
250
300
350
400
450
2008 2009 2010 2011 2012 2013 2014 2015
Dutch RMBS AAA FL 5 Yr UK RMBS AAA Euro FL 5 Yr
42
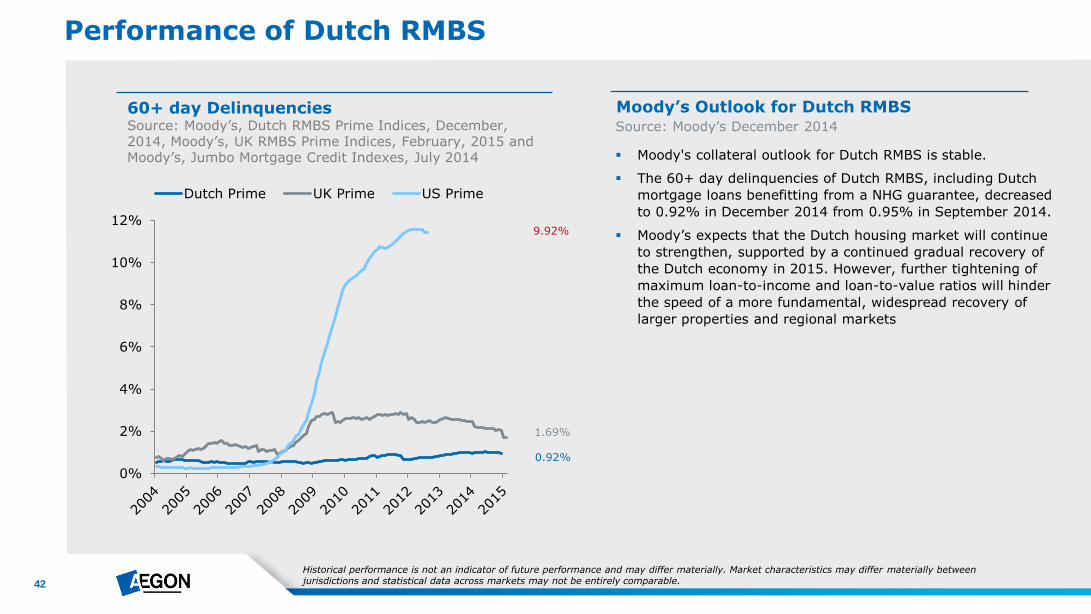
Performance of Dutch RMBS
60+ day Delinquencies Source: Moody’s, Dutch RMBS Prime Indices, December, 2014, Moody’s, UK RMBS Prime Indices, February, 2015 and Moody’s, Jumbo Mortgage Credit Indexes, July 2014
Moody’s Outlook for Dutch RMBS
Moody's collateral outlook for Dutch RMBS is stable.
The 60+ day delinquencies of Dutch RMBS, including Dutch
mortgage loans benefitting from a NHG guarantee, decreased
to 0.92% in December 2014 from 0.95% in September 2014.
Moody’s expects that the Dutch housing market will continue
to strengthen, supported by a continued gradual recovery of
the Dutch economy in 2015. However, further tightening of
maximum loan-to-income and loan-to-value ratios will hinder
the speed of a more fundamental, widespread recovery of
larger properties and regional markets
Source: Moody’s December 2014
0.92%
9.92%
1.69%
Historical performance is not an indicator of future performance and may differ materially. Market characteristics may differ materially between jurisdictions and statistical data across markets may not be entirely comparable.
0%
2%
4%
6%
8%
10%
12%
Dutch Prime UK Prime US Prime
43
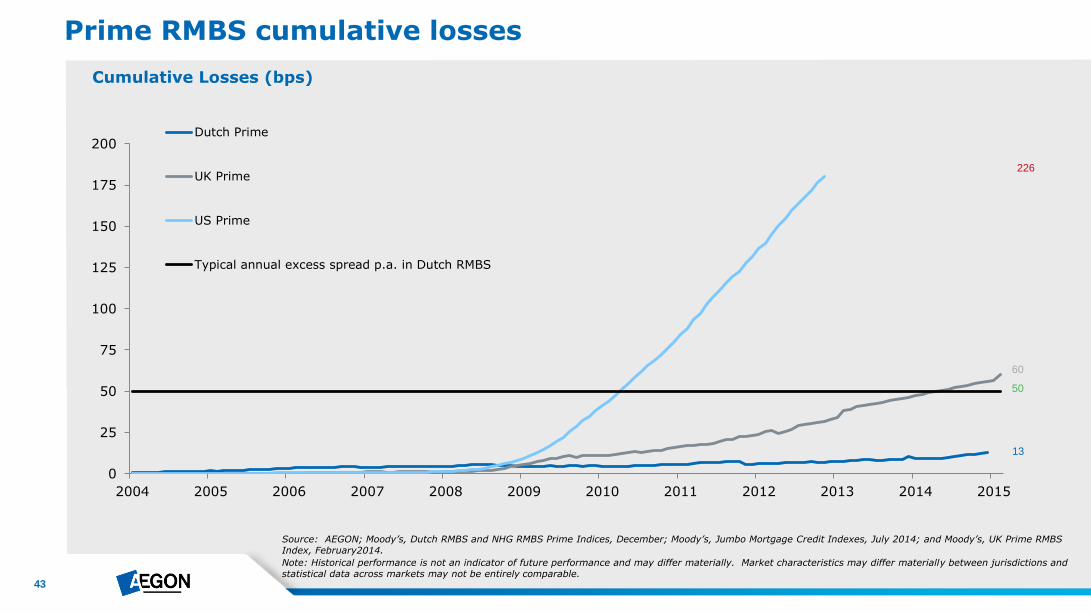
Prime RMBS cumulative losses
Source: AEGON; Moody’s, Dutch RMBS and NHG RMBS Prime Indices, December; Moody’s, Jumbo Mortgage Credit Indexes, July 2014; and Moody’s, UK Prime RMBS Index, February2014.
Note: Historical performance is not an indicator of future performance and may differ materially. Market characteristics may differ materially between jurisdictions and statistical data across markets may not be entirely comparable.
Cumulative Losses (bps)
50
226
13
60
0
25
50
75
100
125
150
175
200
2004 2005 2006 2007 2008 2009 2010 2011 2012 2013 2014 2015
Dutch Prime
UK Prime
US Prime
Typical annual excess spread p.a. in Dutch RMBS
44
Prepayment rates
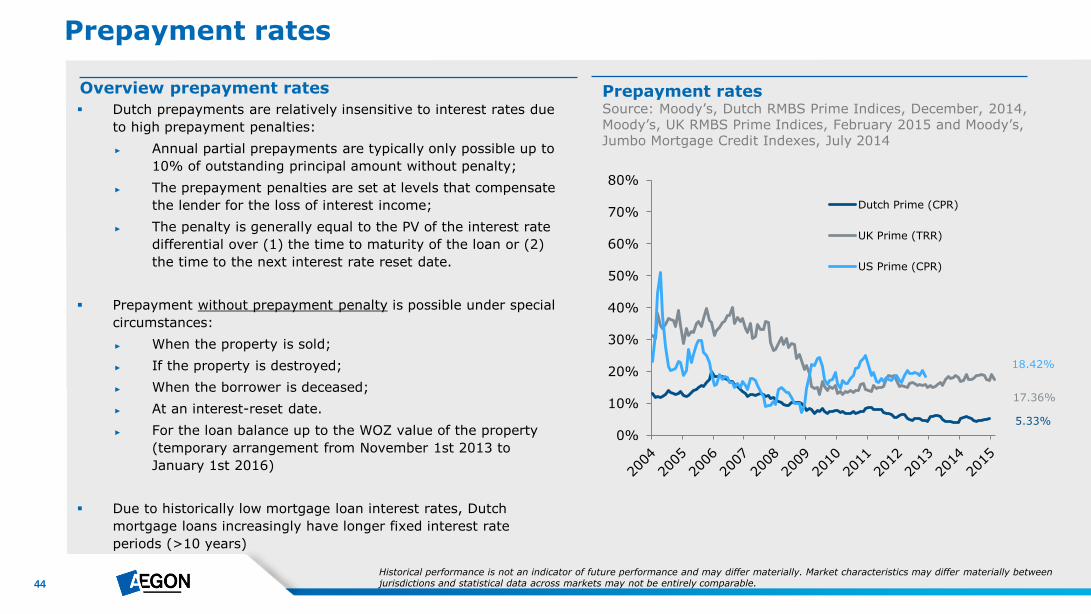
Prepayment rates Source: Moody’s, Dutch RMBS Prime Indices, December, 2014, Moody’s, UK RMBS Prime Indices, February 2015 and Moody’s, Jumbo Mortgage Credit Indexes, July 2014
18.42%
17.36%
5.33%
Historical performance is not an indicator of future performance and may differ materially. Market characteristics may differ materially between jurisdictions and statistical data across markets may not be entirely comparable.
Dutch prepayments are relatively insensitive to interest rates due
to high prepayment penalties:
► Annual partial prepayments are typically only possible up to
10% of outstanding principal amount without penalty;
► The prepayment penalties are set at levels that compensate
the lender for the loss of interest income;
► The penalty is generally equal to the PV of the interest rate
differential over (1) the time to maturity of the loan or (2)
the time to the next interest rate reset date.
Prepayment without prepayment penalty is possible under special
circumstances:
► When the property is sold;
► If the property is destroyed;
► When the borrower is deceased;
► At an interest-reset date.
► For the loan balance up to the WOZ value of the property
(temporary arrangement from November 1st 2013 to
January 1st 2016)
Due to historically low mortgage loan interest rates, Dutch
mortgage loans increasingly have longer fixed interest rate
periods (>10 years)
0%
10%
20%
30%
40%
50%
60%
70%
80%
Dutch Prime (CPR)
UK Prime (TRR)
US Prime (CPR)
Overview prepayment rates
45
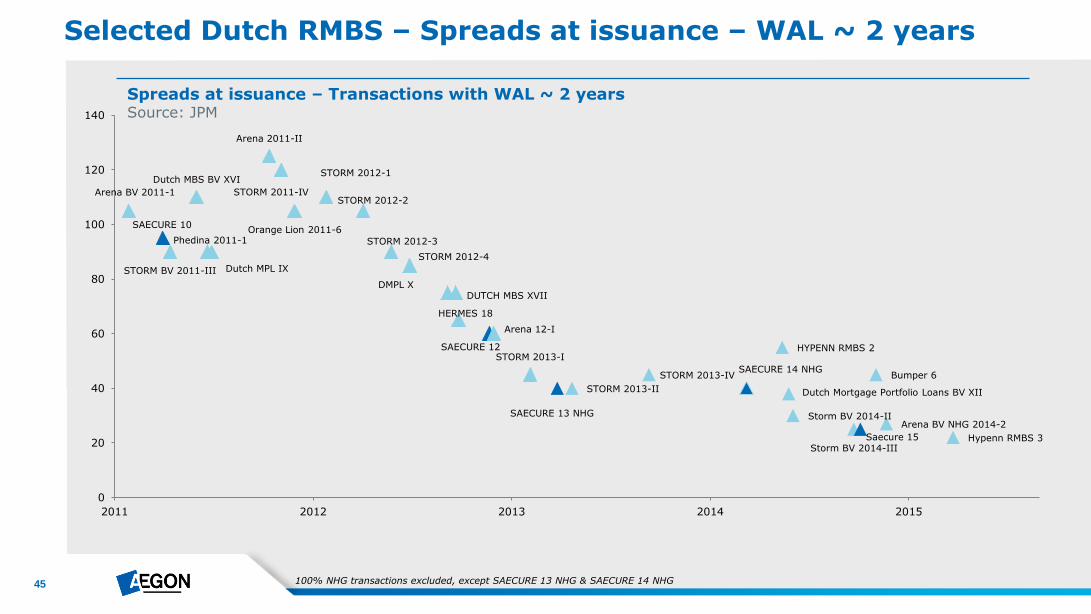
Selected Dutch RMBS – Spreads at issuance – WAL ~ 2 years
Spreads at issuance – Transactions with WAL ~ 2 years Source: JPM
100% NHG transactions excluded, except SAECURE 13 NHG & SAECURE 14 NHG
Arena BV 2011-1
SAECURE 10
STORM BV 2011-III
Dutch MBS BV XVI
Phedina 2011-1
Dutch MPL IX
Arena 2011-II
STORM 2011-IV
Orange Lion 2011-6
STORM 2012-1
STORM 2012-2
STORM 2012-3
DMPL X
STORM 2012-4
DUTCH MBS XVII
HERMES 18
SAECURE 12
Arena 12-I
STORM 2013-I
SAECURE 13 NHG
STORM 2013-II
STORM 2013-IV SAECURE 14 NHG
HYPENN RMBS 2
Dutch Mortgage Portfolio Loans BV XII
Storm BV 2014-II
Storm BV 2014-III Saecure 15
Bumper 6
Arena BV NHG 2014-2
Hypenn RMBS 3
0
20
40
60
80
100
120
140
2011 2012 2013 2014 2015
46
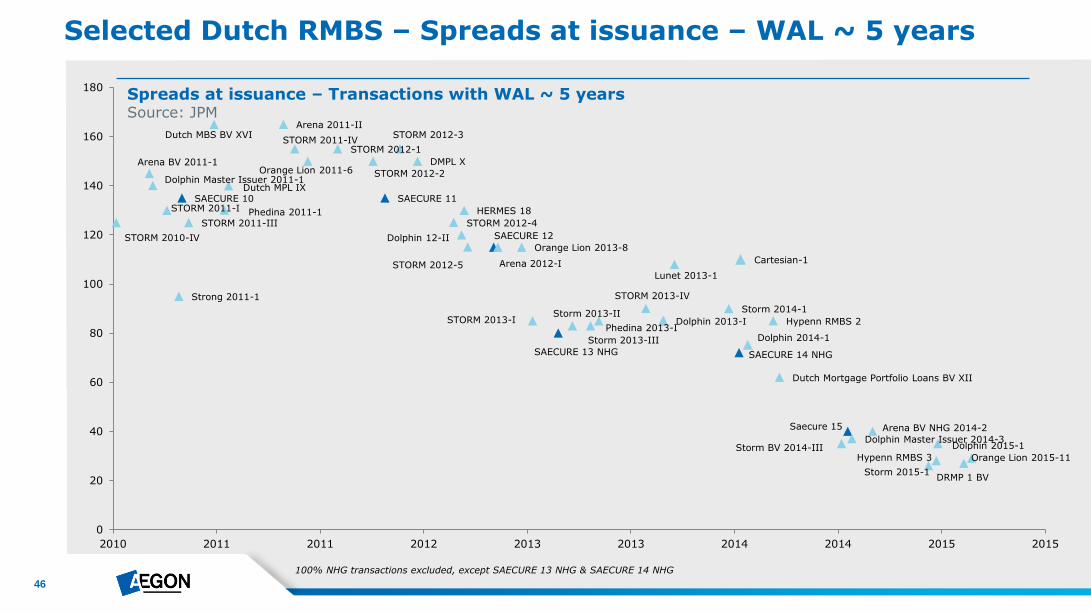
Selected Dutch RMBS – Spreads at issuance – WAL ~ 5 years
Spreads at issuance – Transactions with WAL ~ 5 years Source: JPM
100% NHG transactions excluded, except SAECURE 13 NHG & SAECURE 14 NHG
STORM 2010-IV
Arena BV 2011-1
Dolphin Master Issuer 2011-1
STORM 2011-I SAECURE 10
STORM 2011-III
Dutch MBS BV XVI
Phedina 2011-1
Dutch MPL IX
Arena 2011-II
STORM 2011-IV
Orange Lion 2011-6
STORM 2012-1
STORM 2012-2
SAECURE 11
STORM 2012-3
DMPL X
STORM 2012-4
Dolphin 12-II
HERMES 18
STORM 2012-5
SAECURE 12
Arena 2012-I
Orange Lion 2013-8
STORM 2013-I
SAECURE 13 NHG
Storm 2013-II
Storm 2013-III
STORM 2013-IV
Dolphin 2013-I Phedina 2013-I
Strong 2011-1
Storm 2014-1
Lunet 2013-1
SAECURE 14 NHG
Dolphin 2014-1
Cartesian-1
Hypenn RMBS 2
Storm 2015-1
Hypenn RMBS 3
Dolphin 2015-1
Dutch Mortgage Portfolio Loans BV XII
Storm BV 2014-III
Saecure 15
Dolphin Master Issuer 2014-3
Arena BV NHG 2014-2
DRMP 1 BV
Orange Lion 2015-11
0
20
40
60
80
100
120
140
160
180
2010 2011 2011 2012 2013 2013 2014 2014 2015 2015

47
The SAECURE Program
48
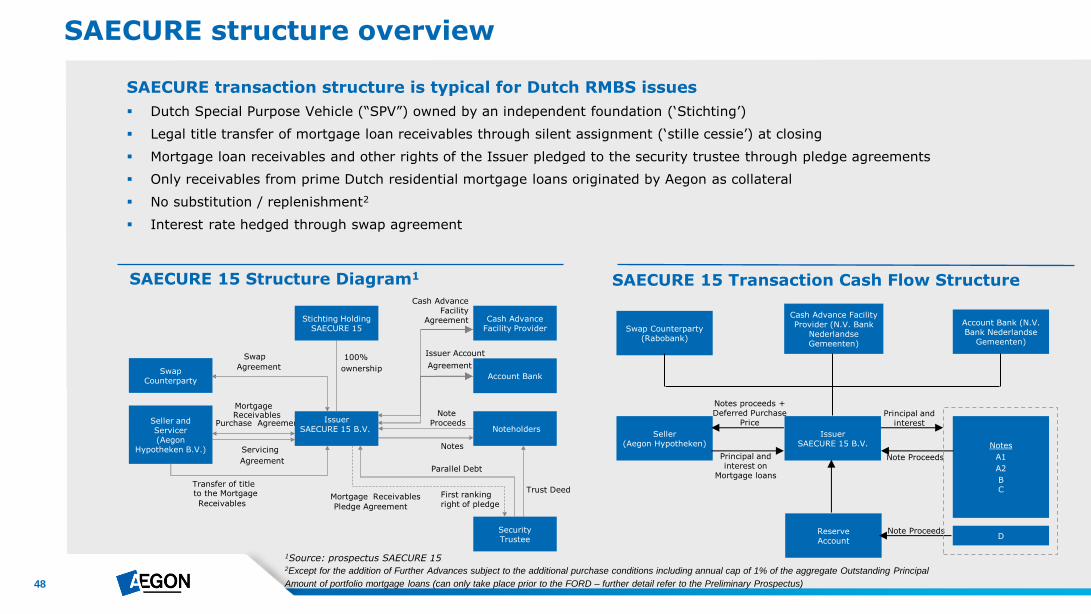
SAECURE 15 Structure Diagram1
SAECURE transaction structure is typical for Dutch RMBS issues
Dutch Special Purpose Vehicle (“SPV”) owned by an independent foundation (‘Stichting’)
Legal title transfer of mortgage loan receivables through silent assignment (‘stille cessie’) at closing
Mortgage loan receivables and other rights of the Issuer pledged to the security trustee through pledge agreements
Only receivables from prime Dutch residential mortgage loans originated by Aegon as collateral
No substitution / replenishment2
Interest rate hedged through swap agreement
SAECURE structure overview
SAECURE 15 Transaction Cash Flow Structure
Reserve Account
Notes
A1
A2
B C
Seller (Aegon Hypotheken)
Issuer SAECURE 15 B.V.
D
Swap Counterparty (Rabobank)
Account Bank (N.V. Bank Nederlandse
Gemeenten)
Cash Advance Facility Provider (N.V. Bank
Nederlandse Gemeenten)
Note Proceeds
Note Proceeds
Principal and interest
Principal and interest on
Mortgage loans
Notes proceeds + Deferred Purchase
Price
1Source: prospectus SAECURE 15 2Except for the addition of Further Advances subject to the additional purchase conditions including annual cap of 1% of the aggregate Outstanding Principal
Amount of portfolio mortgage loans (can only take place prior to the FORD – further detail refer to the Preliminary Prospectus)
Swap Counterparty
Stichting Holding SAECURE 15
Cash Advance Facility Provider
100%
ownership
Parallel Debt
Notes
Issuer Account
Agreement Swap
Agreement
Note Proceeds
Trust Deed
Mortgage Receivables
Purchase Agreement
Mortgage Receivables
Pledge Agreement
Servicing
Agreement
Security Trustee
Account Bank
Noteholders Issuer
SAECURE 15 B.V. Seller and Servicer (Aegon
Hypotheken B.V.)
Transfer of title to the Mortgage
Receivables
Cash Advance Facility
Agreement
First ranking right of pledge
49
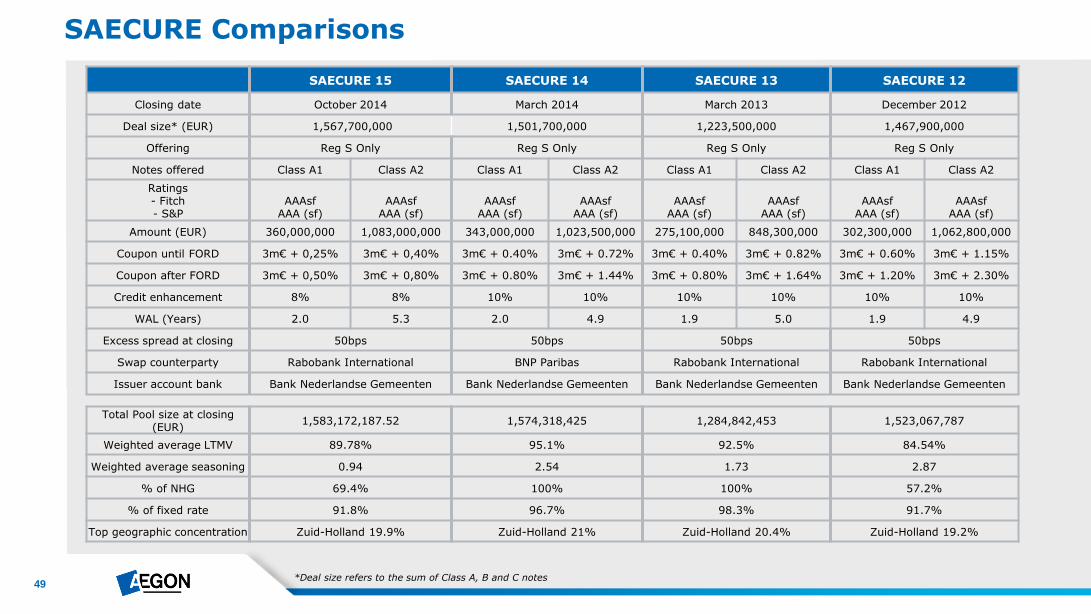
SAECURE Comparisons
SAECURE 15 SAECURE 14 SAECURE 13 SAECURE 12
Closing date October 2014 March 2014 March 2013 December 2012
Deal size* (EUR) 1,567,700,000 1,501,700,000 1,223,500,000 1,467,900,000
Offering Reg S Only Reg S Only Reg S Only Reg S Only
Notes offered Class A1 Class A2 Class A1 Class A2 Class A1 Class A2 Class A1 Class A2
Ratings - Fitch - S&P
AAAsf
AAA (sf)
AAAsf
AAA (sf)
AAAsf
AAA (sf)
AAAsf
AAA (sf)
AAAsf
AAA (sf)
AAAsf
AAA (sf)
AAAsf
AAA (sf)
AAAsf
AAA (sf)
Amount (EUR) 360,000,000 1,083,000,000 343,000,000 1,023,500,000 275,100,000 848,300,000 302,300,000 1,062,800,000
Coupon until FORD 3m€ + 0,25% 3m€ + 0,40% 3m€ + 0.40% 3m€ + 0.72% 3m€ + 0.40% 3m€ + 0.82% 3m€ + 0.60% 3m€ + 1.15%
Coupon after FORD 3m€ + 0,50% 3m€ + 0,80% 3m€ + 0.80% 3m€ + 1.44% 3m€ + 0.80% 3m€ + 1.64% 3m€ + 1.20% 3m€ + 2.30%
Credit enhancement 8% 8% 10% 10% 10% 10% 10% 10%
WAL (Years) 2.0 5.3 2.0 4.9 1.9 5.0 1.9 4.9
Excess spread at closing 50bps 50bps 50bps 50bps
Swap counterparty Rabobank International BNP Paribas Rabobank International Rabobank International
Issuer account bank Bank Nederlandse Gemeenten Bank Nederlandse Gemeenten Bank Nederlandse Gemeenten Bank Nederlandse Gemeenten
Total Pool size at closing (EUR)
1,583,172,187.52 1,574,318,425 1,284,842,453 1,523,067,787
Weighted average LTMV 89.78% 95.1% 92.5% 84.54%
Weighted average seasoning 0.94 2.54 1.73 2.87
% of NHG 69.4% 100% 100% 57.2%
% of fixed rate 91.8% 96.7% 98.3% 91.7%
Top geographic concentration Zuid-Holland 19.9% Zuid-Holland 21% Zuid-Holland 20.4% Zuid-Holland 19.2%
*Deal size refers to the sum of Class A, B and C notes
50
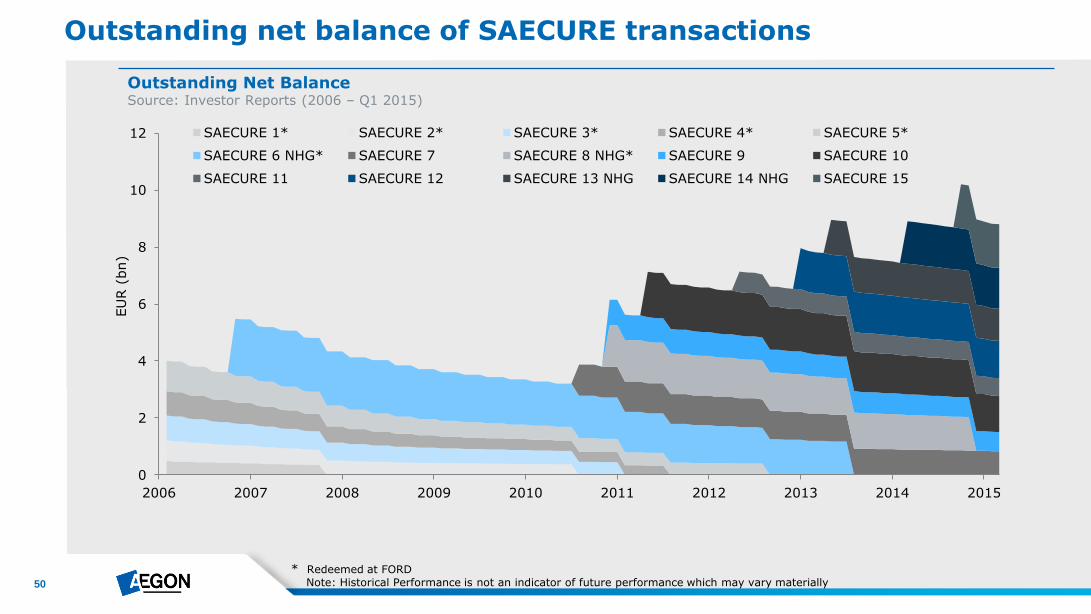
Outstanding net balance of SAECURE transactions
Outstanding Net Balance Source: Investor Reports (2006 – Q1 2015)
0
2
4
6
8
10
12
2006 2007 2008 2009 2010 2011 2012 2013 2014 2015
EU
R (
bn)
SAECURE 1* SAECURE 2* SAECURE 3* SAECURE 4* SAECURE 5*
SAECURE 6 NHG* SAECURE 7 SAECURE 8 NHG* SAECURE 9 SAECURE 10
SAECURE 11 SAECURE 12 SAECURE 13 NHG SAECURE 14 NHG SAECURE 15
* Redeemed at FORD
Note: Historical Performance is not an indicator of future performance which may vary materially
51
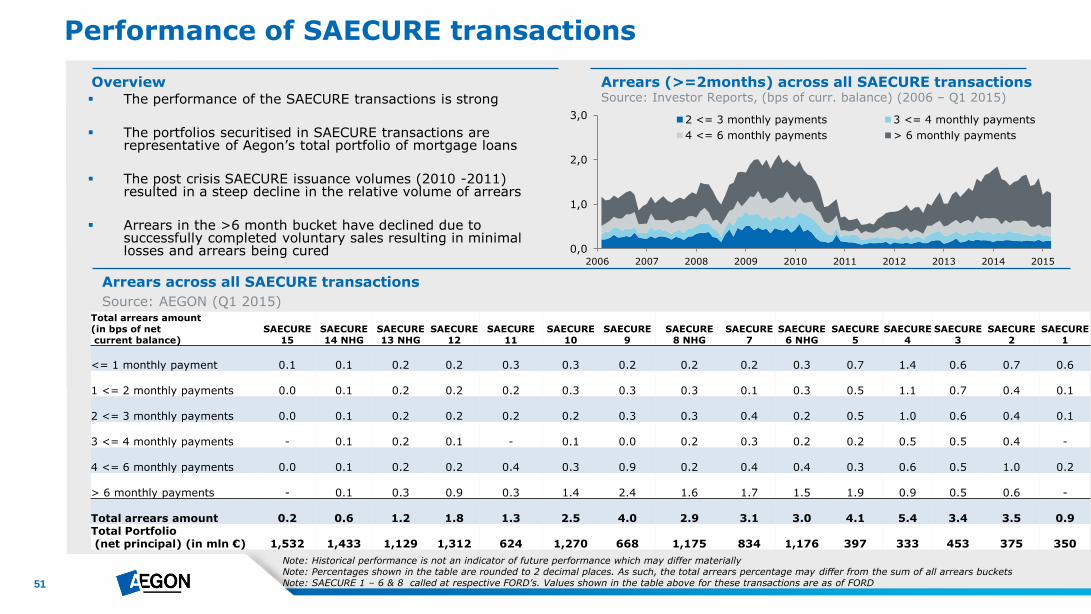
Performance of SAECURE transactions
Overview
Arrears across all SAECURE transactions
Source: AEGON (Q1 2015)
The performance of the SAECURE transactions is strong
The portfolios securitised in SAECURE transactions are representative of Aegon’s total portfolio of mortgage loans
The post crisis SAECURE issuance volumes (2010 -2011) resulted in a steep decline in the relative volume of arrears
Arrears in the >6 month bucket have declined due to successfully completed voluntary sales resulting in minimal losses and arrears being cured
Note: Historical performance is not an indicator of future performance which may differ materially Note: Percentages shown in the table are rounded to 2 decimal places. As such, the total arrears percentage may differ from the sum of all arrears buckets Note: SAECURE 1 – 6 & 8 called at respective FORD’s. Values shown in the table above for these transactions are as of FORD
Arrears (>=2months) across all SAECURE transactions Source: Investor Reports, (bps of curr. balance) (2006 – Q1 2015)
Total arrears amount (in bps of net current balance)
SAECURE 15
SAECURE 14 NHG
SAECURE 13 NHG
SAECURE 12
SAECURE 11
SAECURE 10
SAECURE 9
SAECURE 8 NHG
SAECURE 7
SAECURE 6 NHG
SAECURE 5
SAECURE 4
SAECURE 3
SAECURE 2
SAECURE 1
<= 1 monthly payment
0.1
0.1
0.2
0.2
0.3
0.3
0.2
0.2
0.2
0.3
0.7
1.4
0.6
0.7
0.6
1 <= 2 monthly payments
0.0
0.1
0.2
0.2
0.2
0.3
0.3
0.3
0.1
0.3
0.5
1.1
0.7
0.4
0.1
2 <= 3 monthly payments
0.0
0.1
0.2
0.2
0.2
0.2
0.3
0.3
0.4
0.2
0.5
1.0
0.6
0.4
0.1
3 <= 4 monthly payments -
0.1
0.2
0.1
-
0.1
0.0
0.2
0.3
0.2
0.2
0.5
0.5
0.4
-
4 <= 6 monthly payments
0.0
0.1
0.2
0.2
0.4
0.3
0.9
0.2
0.4
0.4
0.3
0.6
0.5
1.0
0.2
> 6 monthly payments -
0.1
0.3
0.9
0.3
1.4
2.4
1.6
1.7
1.5
1.9
0.9
0.5
0.6
-
Total arrears amount
0.2
0.6
1.2
1.8
1.3
2.5
4.0
2.9
3.1
3.0
4.1
5.4
3.4
3.5
0.9 Total Portfolio (net principal) (in mln €)
1,532
1,433
1,129
1,312
624
1,270
668
1,175
834
1,176
397
333
453
375
350
0,0
1,0
2,0
3,0
2006 2007 2008 2009 2010 2011 2012 2013 2014 2015
2 <= 3 monthly payments 3 <= 4 monthly payments
4 <= 6 monthly payments > 6 monthly payments
52
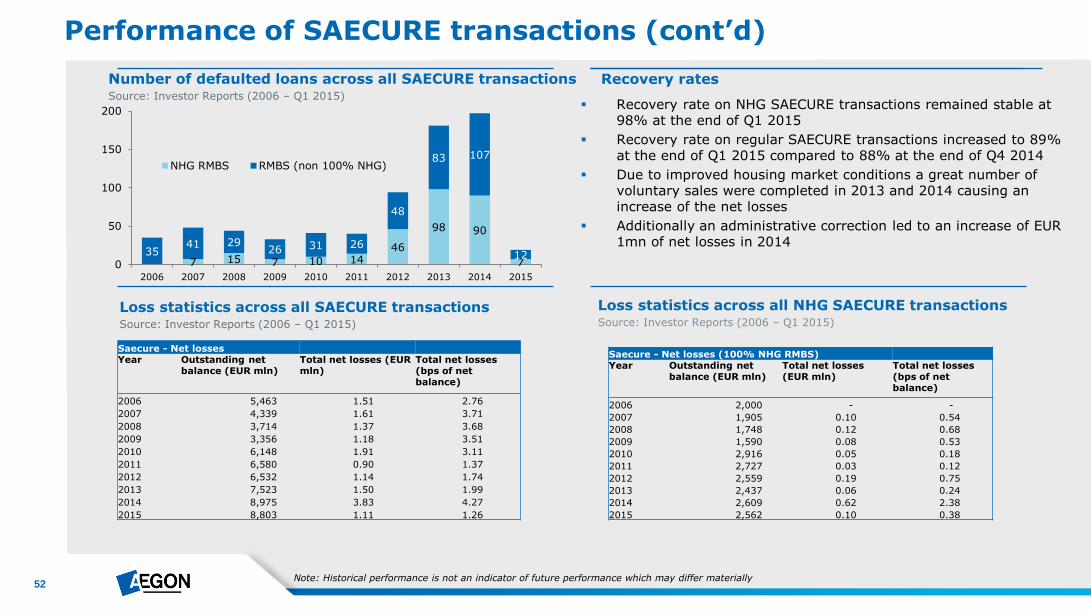
Performance of SAECURE transactions (cont’d)
Note: Historical performance is not an indicator of future performance which may differ materially
Recovery rates
Loss statistics across all SAECURE transactions Source: Investor Reports (2006 – Q1 2015)
Loss statistics across all NHG SAECURE transactions Source: Investor Reports (2006 – Q1 2015)
Number of defaulted loans across all SAECURE transactions Source: Investor Reports (2006 – Q1 2015)
Recovery rate on NHG SAECURE transactions remained stable at
98% at the end of Q1 2015
Recovery rate on regular SAECURE transactions increased to 89% at the end of Q1 2015 compared to 88% at the end of Q4 2014
Due to improved housing market conditions a great number of voluntary sales were completed in 2013 and 2014 causing an increase of the net losses
Additionally an administrative correction led to an increase of EUR 1mn of net losses in 2014
Saecure - Net losses Year Outstanding net
balance (EUR mln) Total net losses (EUR mln)
Total net losses (bps of net balance)
2006 5,463 1.51 2.76
2007 4,339 1.61 3.71
2008 3,714 1.37 3.68
2009 3,356 1.18 3.51
2010 6,148 1.91 3.11
2011 6,580 0.90 1.37
2012 6,532 1.14 1.74
2013 7,523 1.50 1.99
2014 8,975 3.83 4.27
2015 8,803 1.11 1.26
Saecure - Net losses (100% NHG RMBS) Year Outstanding net
balance (EUR mln) Total net losses (EUR mln)
Total net losses (bps of net balance)
2006 2,000 - -
2007 1,905 0.10 0.54
2008 1,748 0.12 0.68
2009 1,590 0.08 0.53
2010 2,916 0.05 0.18
2011 2,727 0.03 0.12
2012 2,559 0.19 0.75
2013 2,437 0.06 0.24
2014 2,609 0.62 2.38
2015 2,562 0.10 0.38
7 15 7 10 14 46
98 90
7 35
41 29 26 31 26
48
83 107
12 0
50
100
150
200
2006 2007 2008 2009 2010 2011 2012 2013 2014 2015
NHG RMBS RMBS (non 100% NHG)
WWW.AEGON.COM
For further questions please contact:
Ed Beije Maarten van Enschot Senior Vice President Corporate Treasury Manager Business Control & Pricing T: +31 70 344 8407 T: +31 58 244 3287 E: [email protected] E: [email protected]
Tom Hoefakker Niels Roek Vice President Corporate Treasury Manager Funding T: +31 70 344 4497 T: +31 58 244 3491 E: [email protected] E: [email protected]
For questions relating to Aegon please contact:
Aegon Investor Relations T: +31 70 344 8305 E: [email protected]