Embed Size (px)
Citation preview

FINANCIAL INTELLIGENCE FOR ENTREPRENEURS AND PROFESSIONALS
2 0 1 4
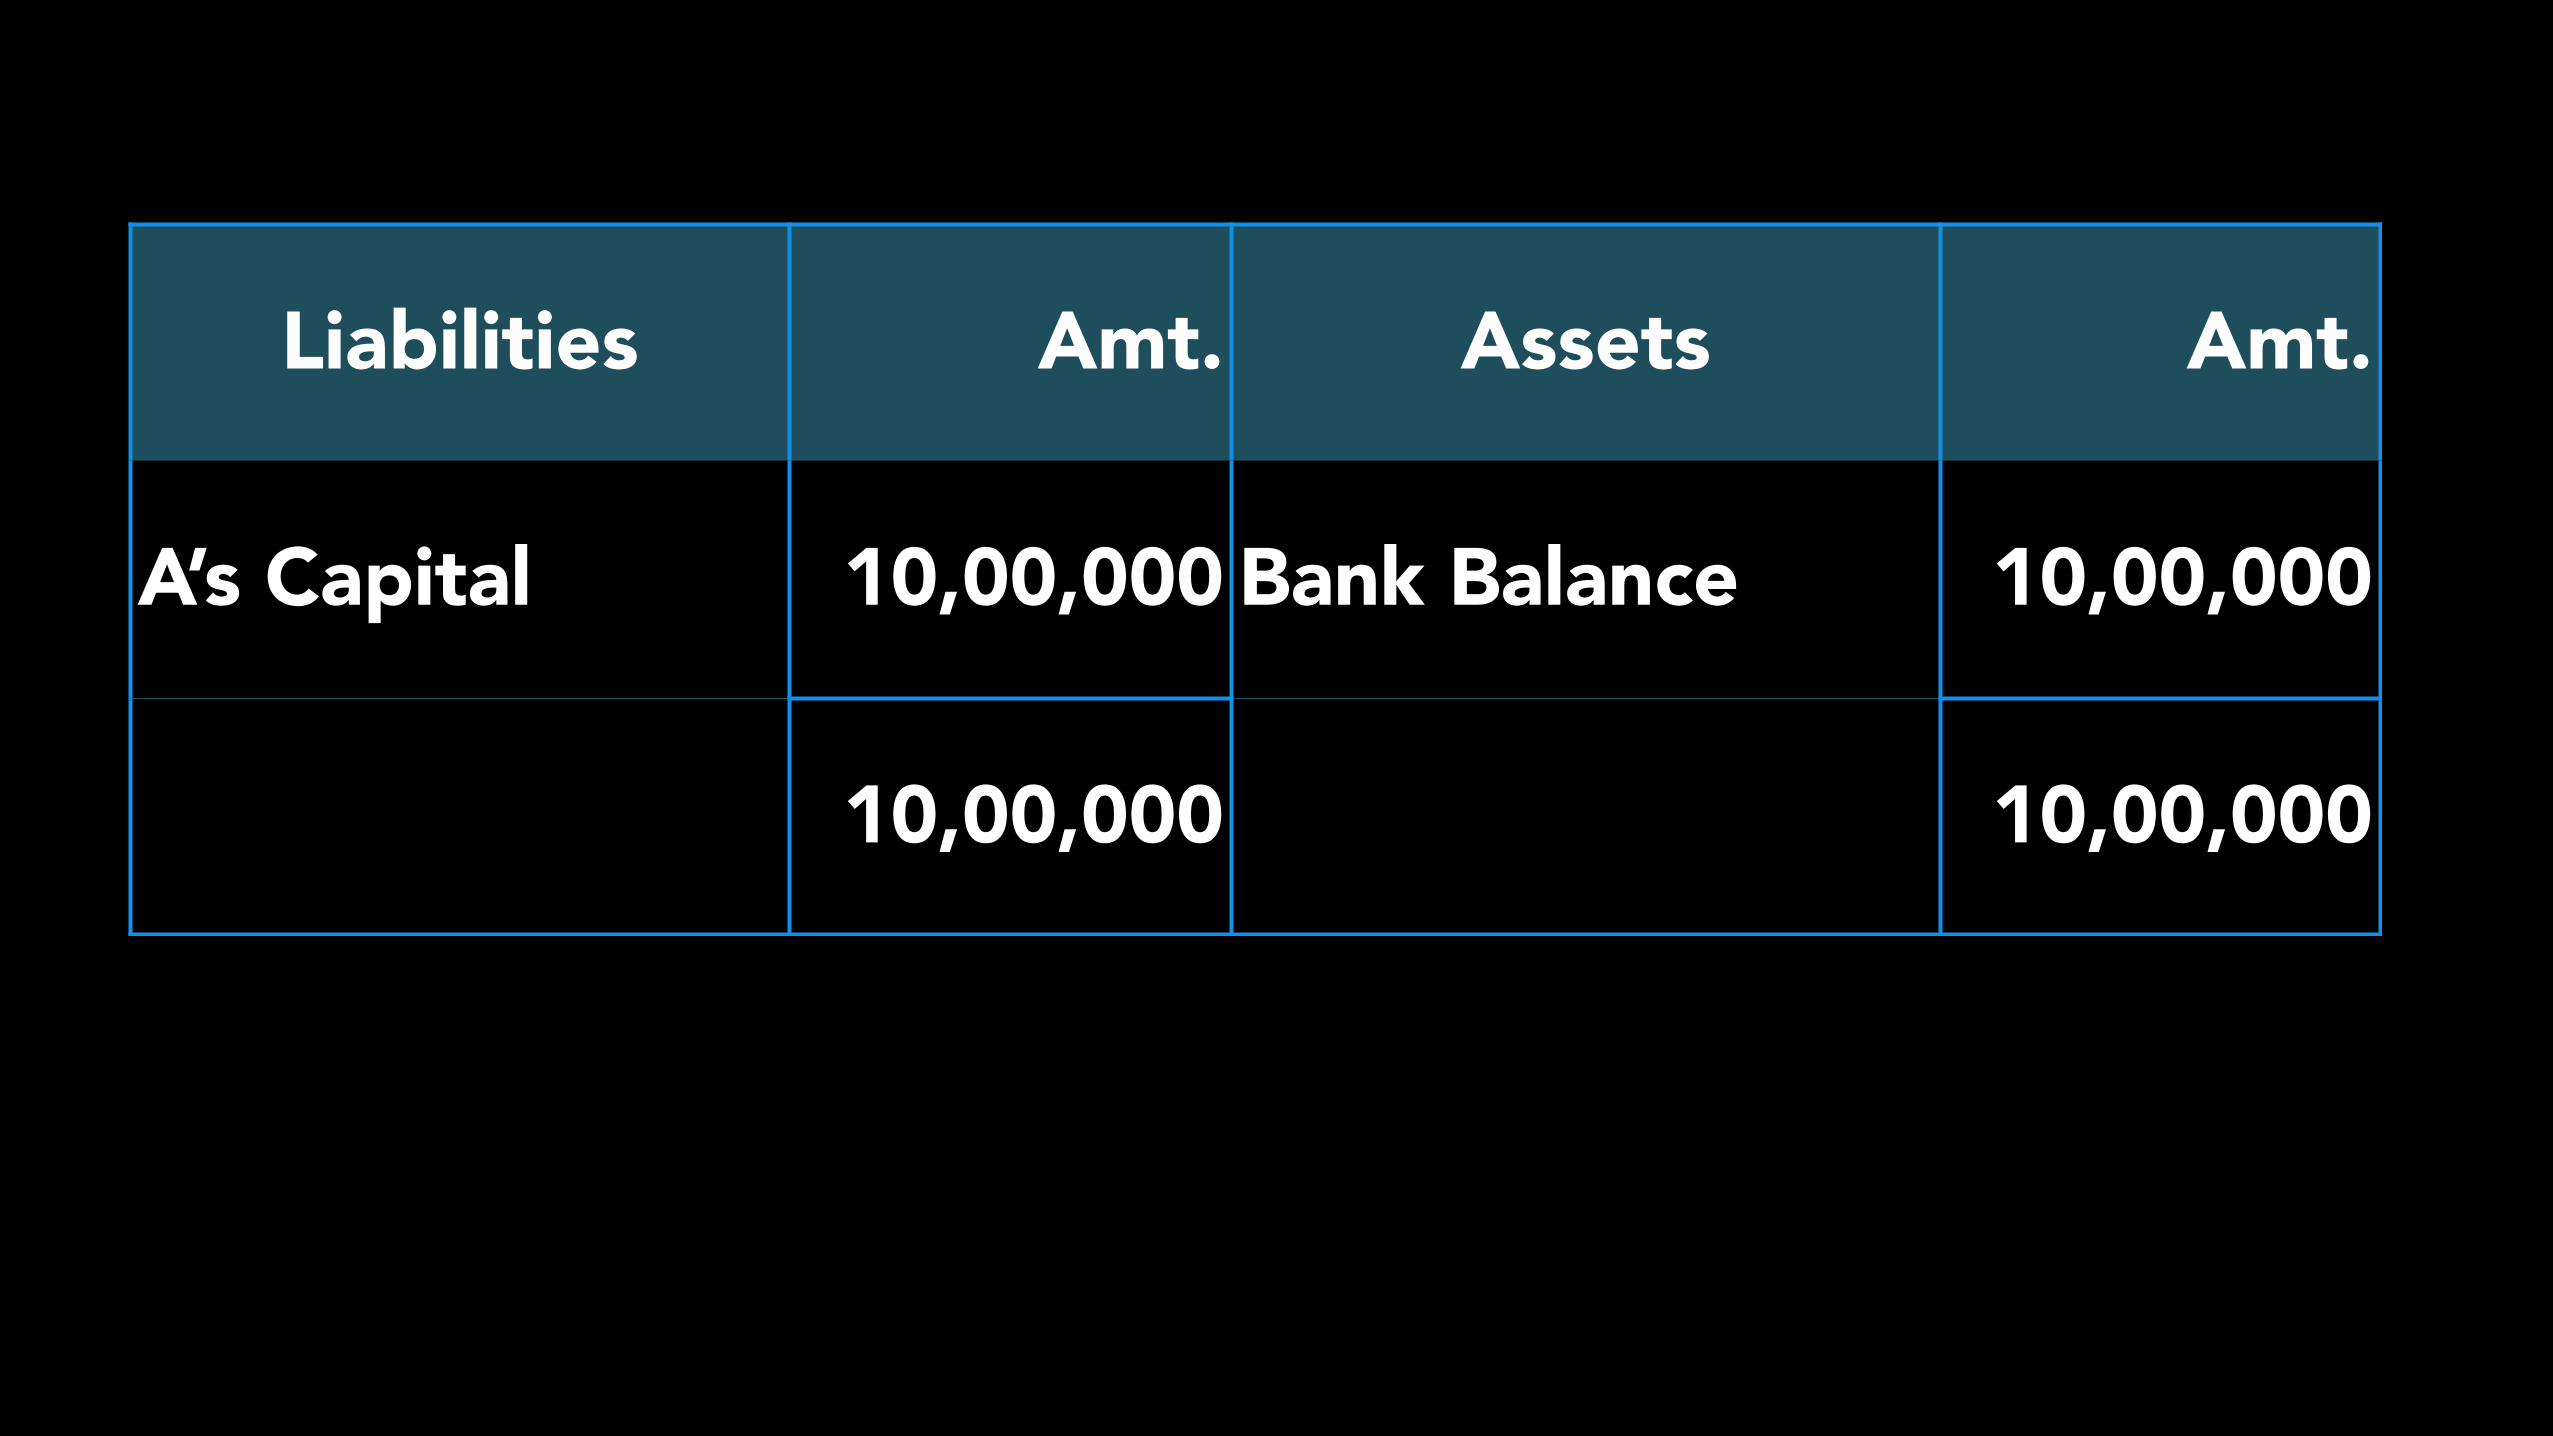
Liabilities Amt. Assets Amt.
A’s Capital 10,00,000 Bank Balance 10,00,000
10,00,000 10,00,000
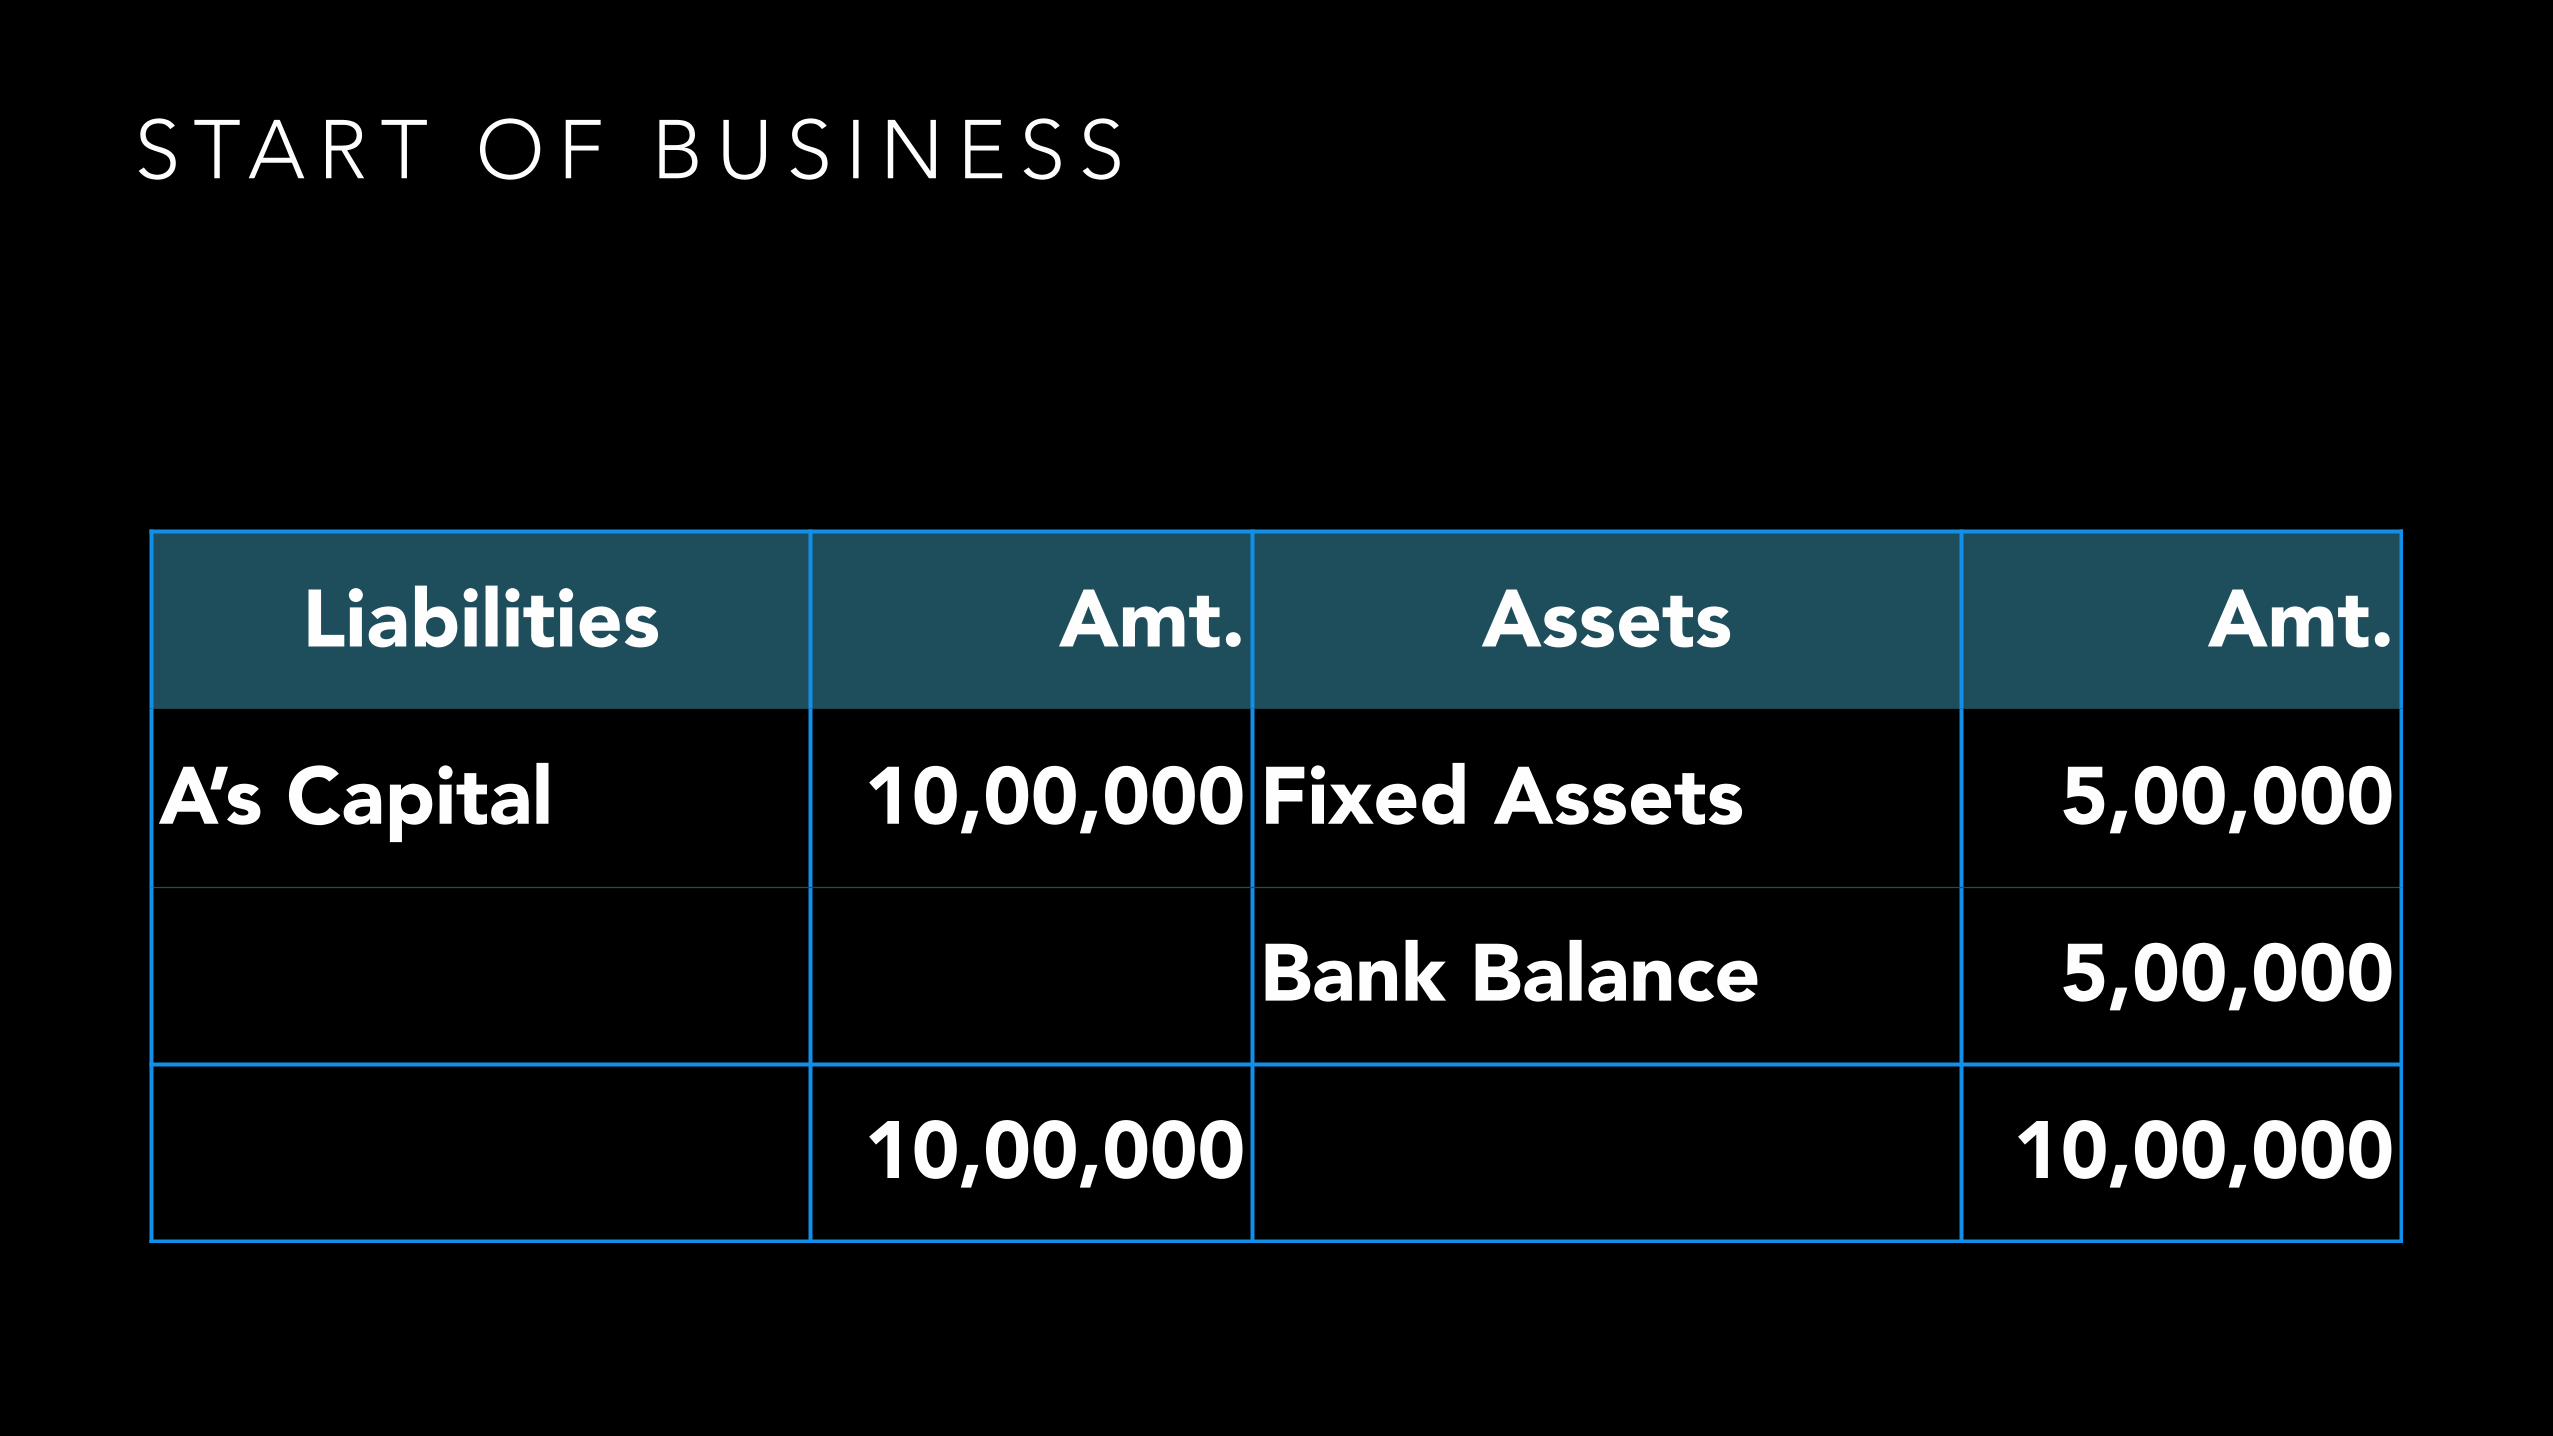
S TA R T O F B U S I N E S S
Liabilities Amt. Assets Amt.
A’s Capital 10,00,000 Fixed Assets 5,00,000
Bank Balance 5,00,000
10,00,000 10,00,000
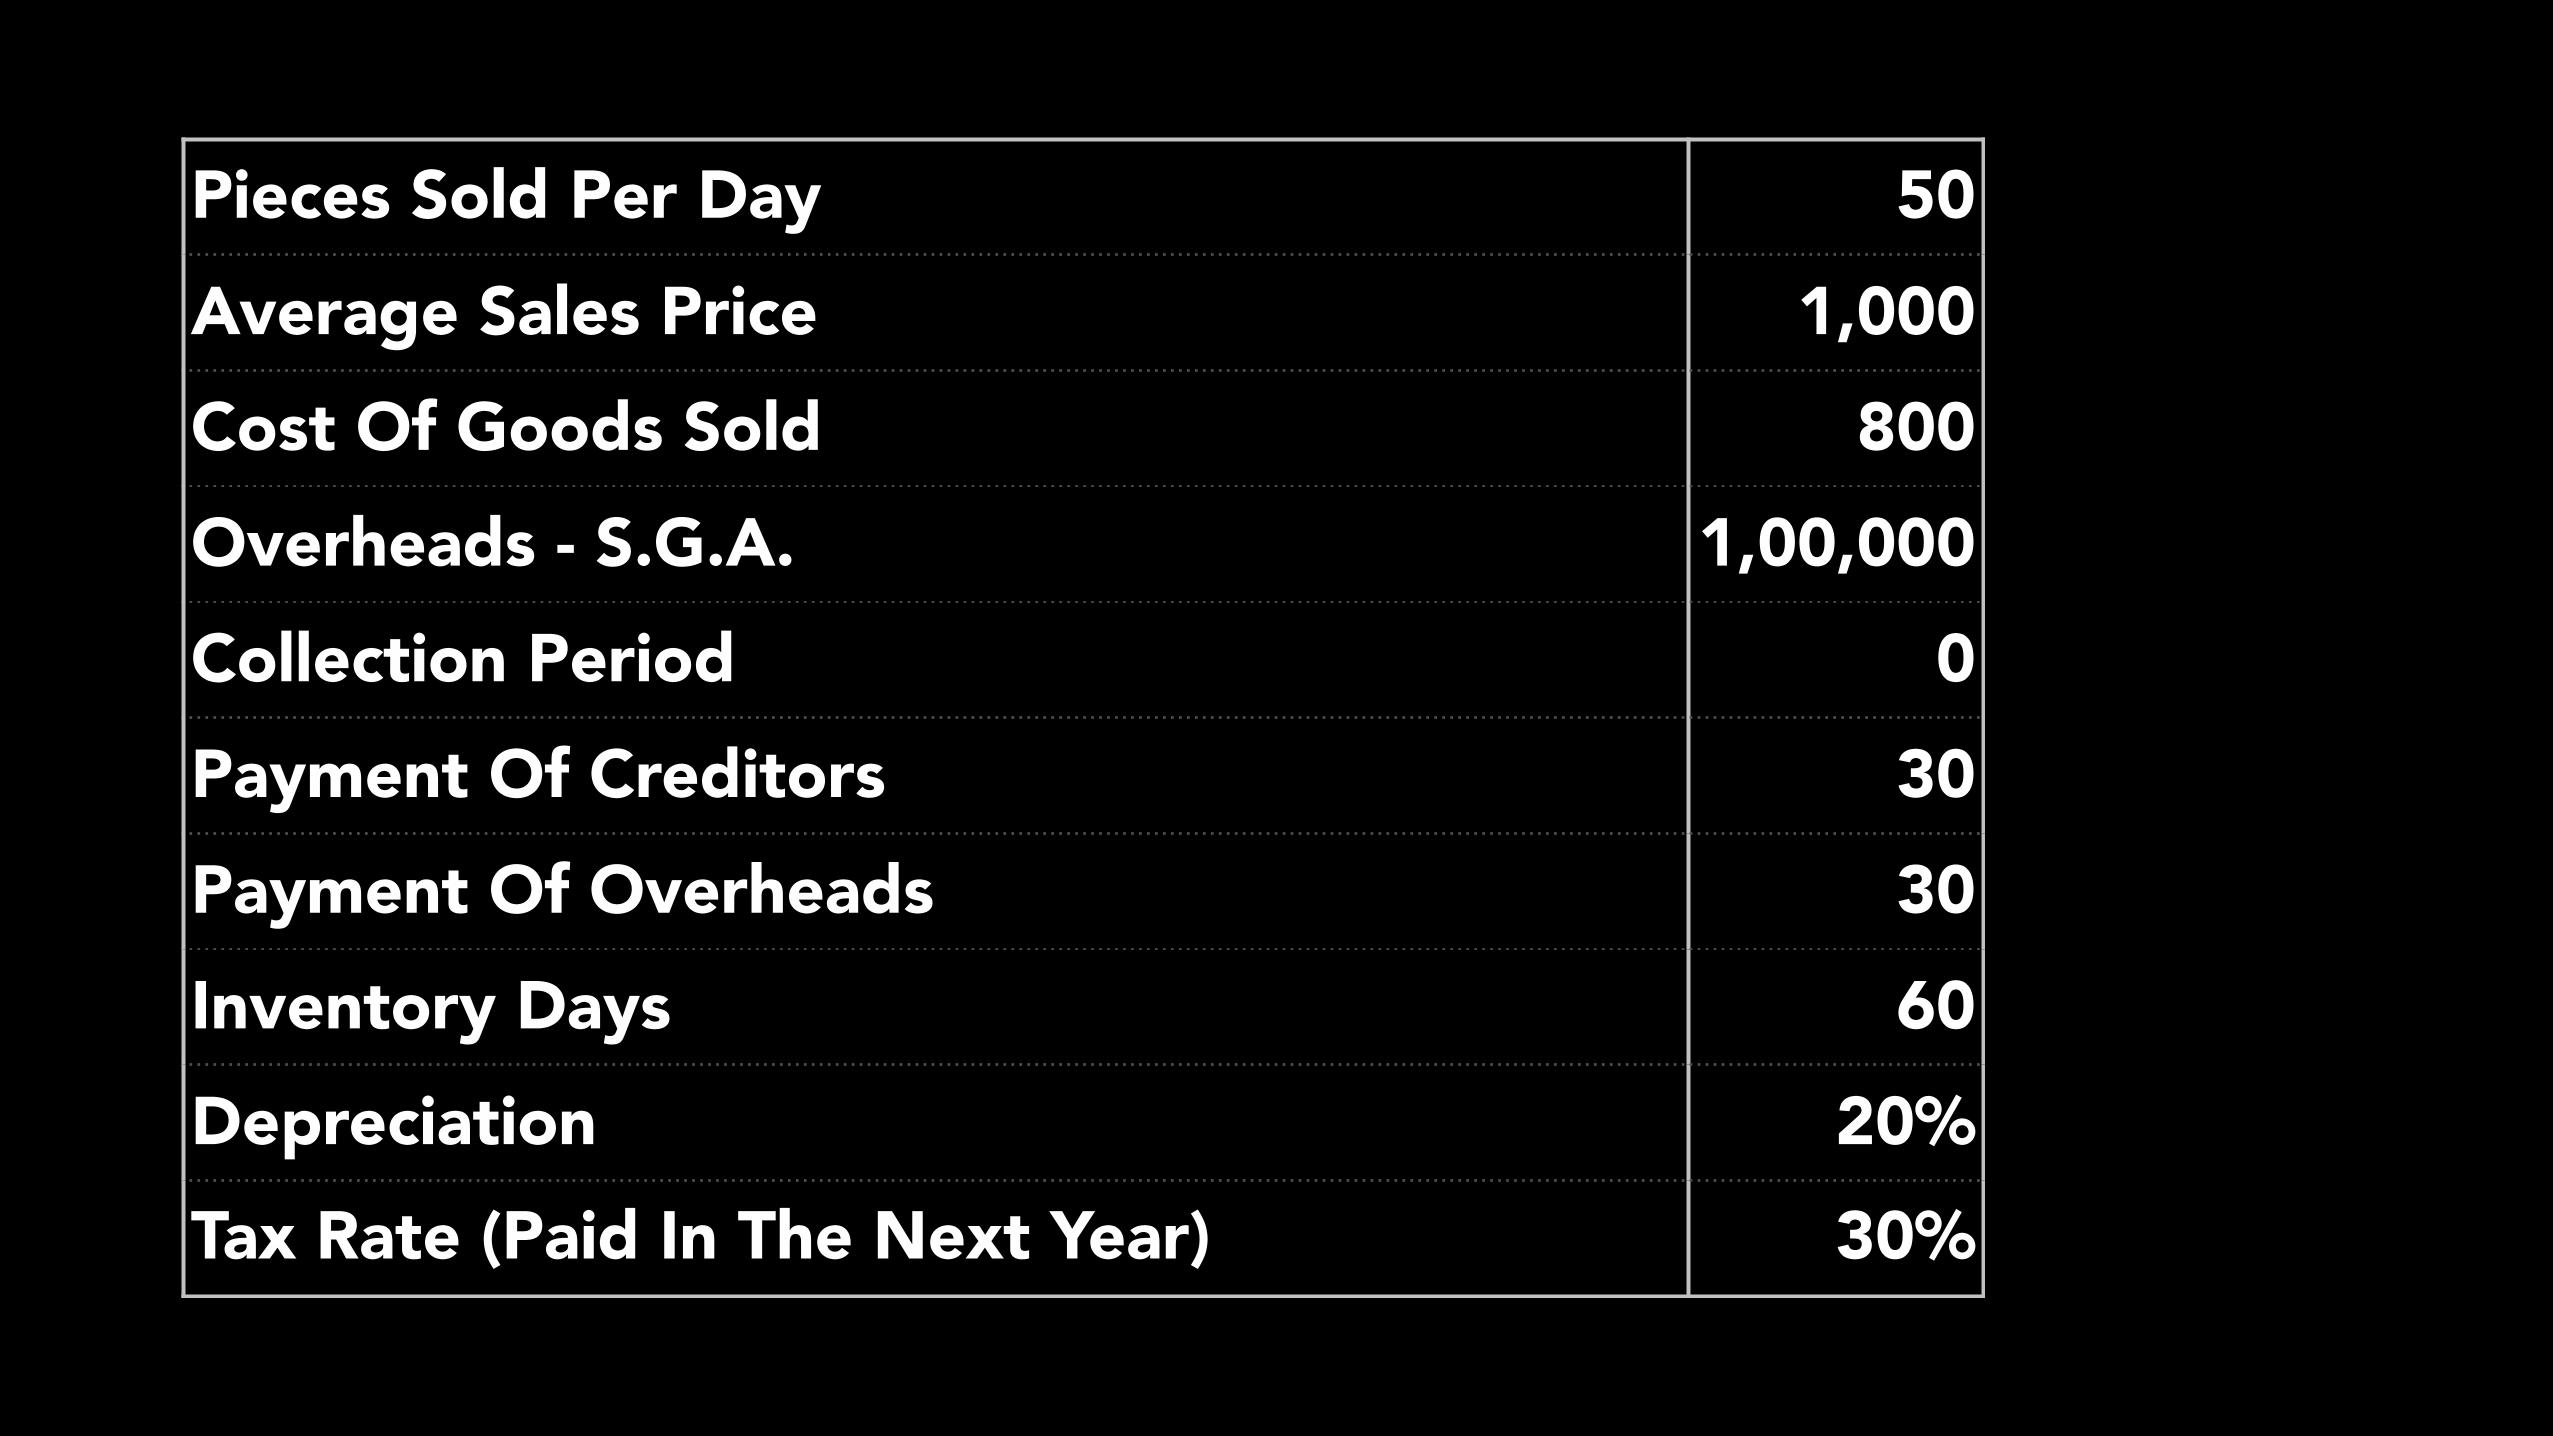
Pieces Sold Per Day 50Average Sales Price 1,000Cost Of Goods Sold 800Overheads - S.G.A. 1,00,000Collection Period 0Payment Of Creditors 30Payment Of Overheads 30Inventory Days 60Depreciation 20%Tax Rate (Paid In The Next Year) 30%
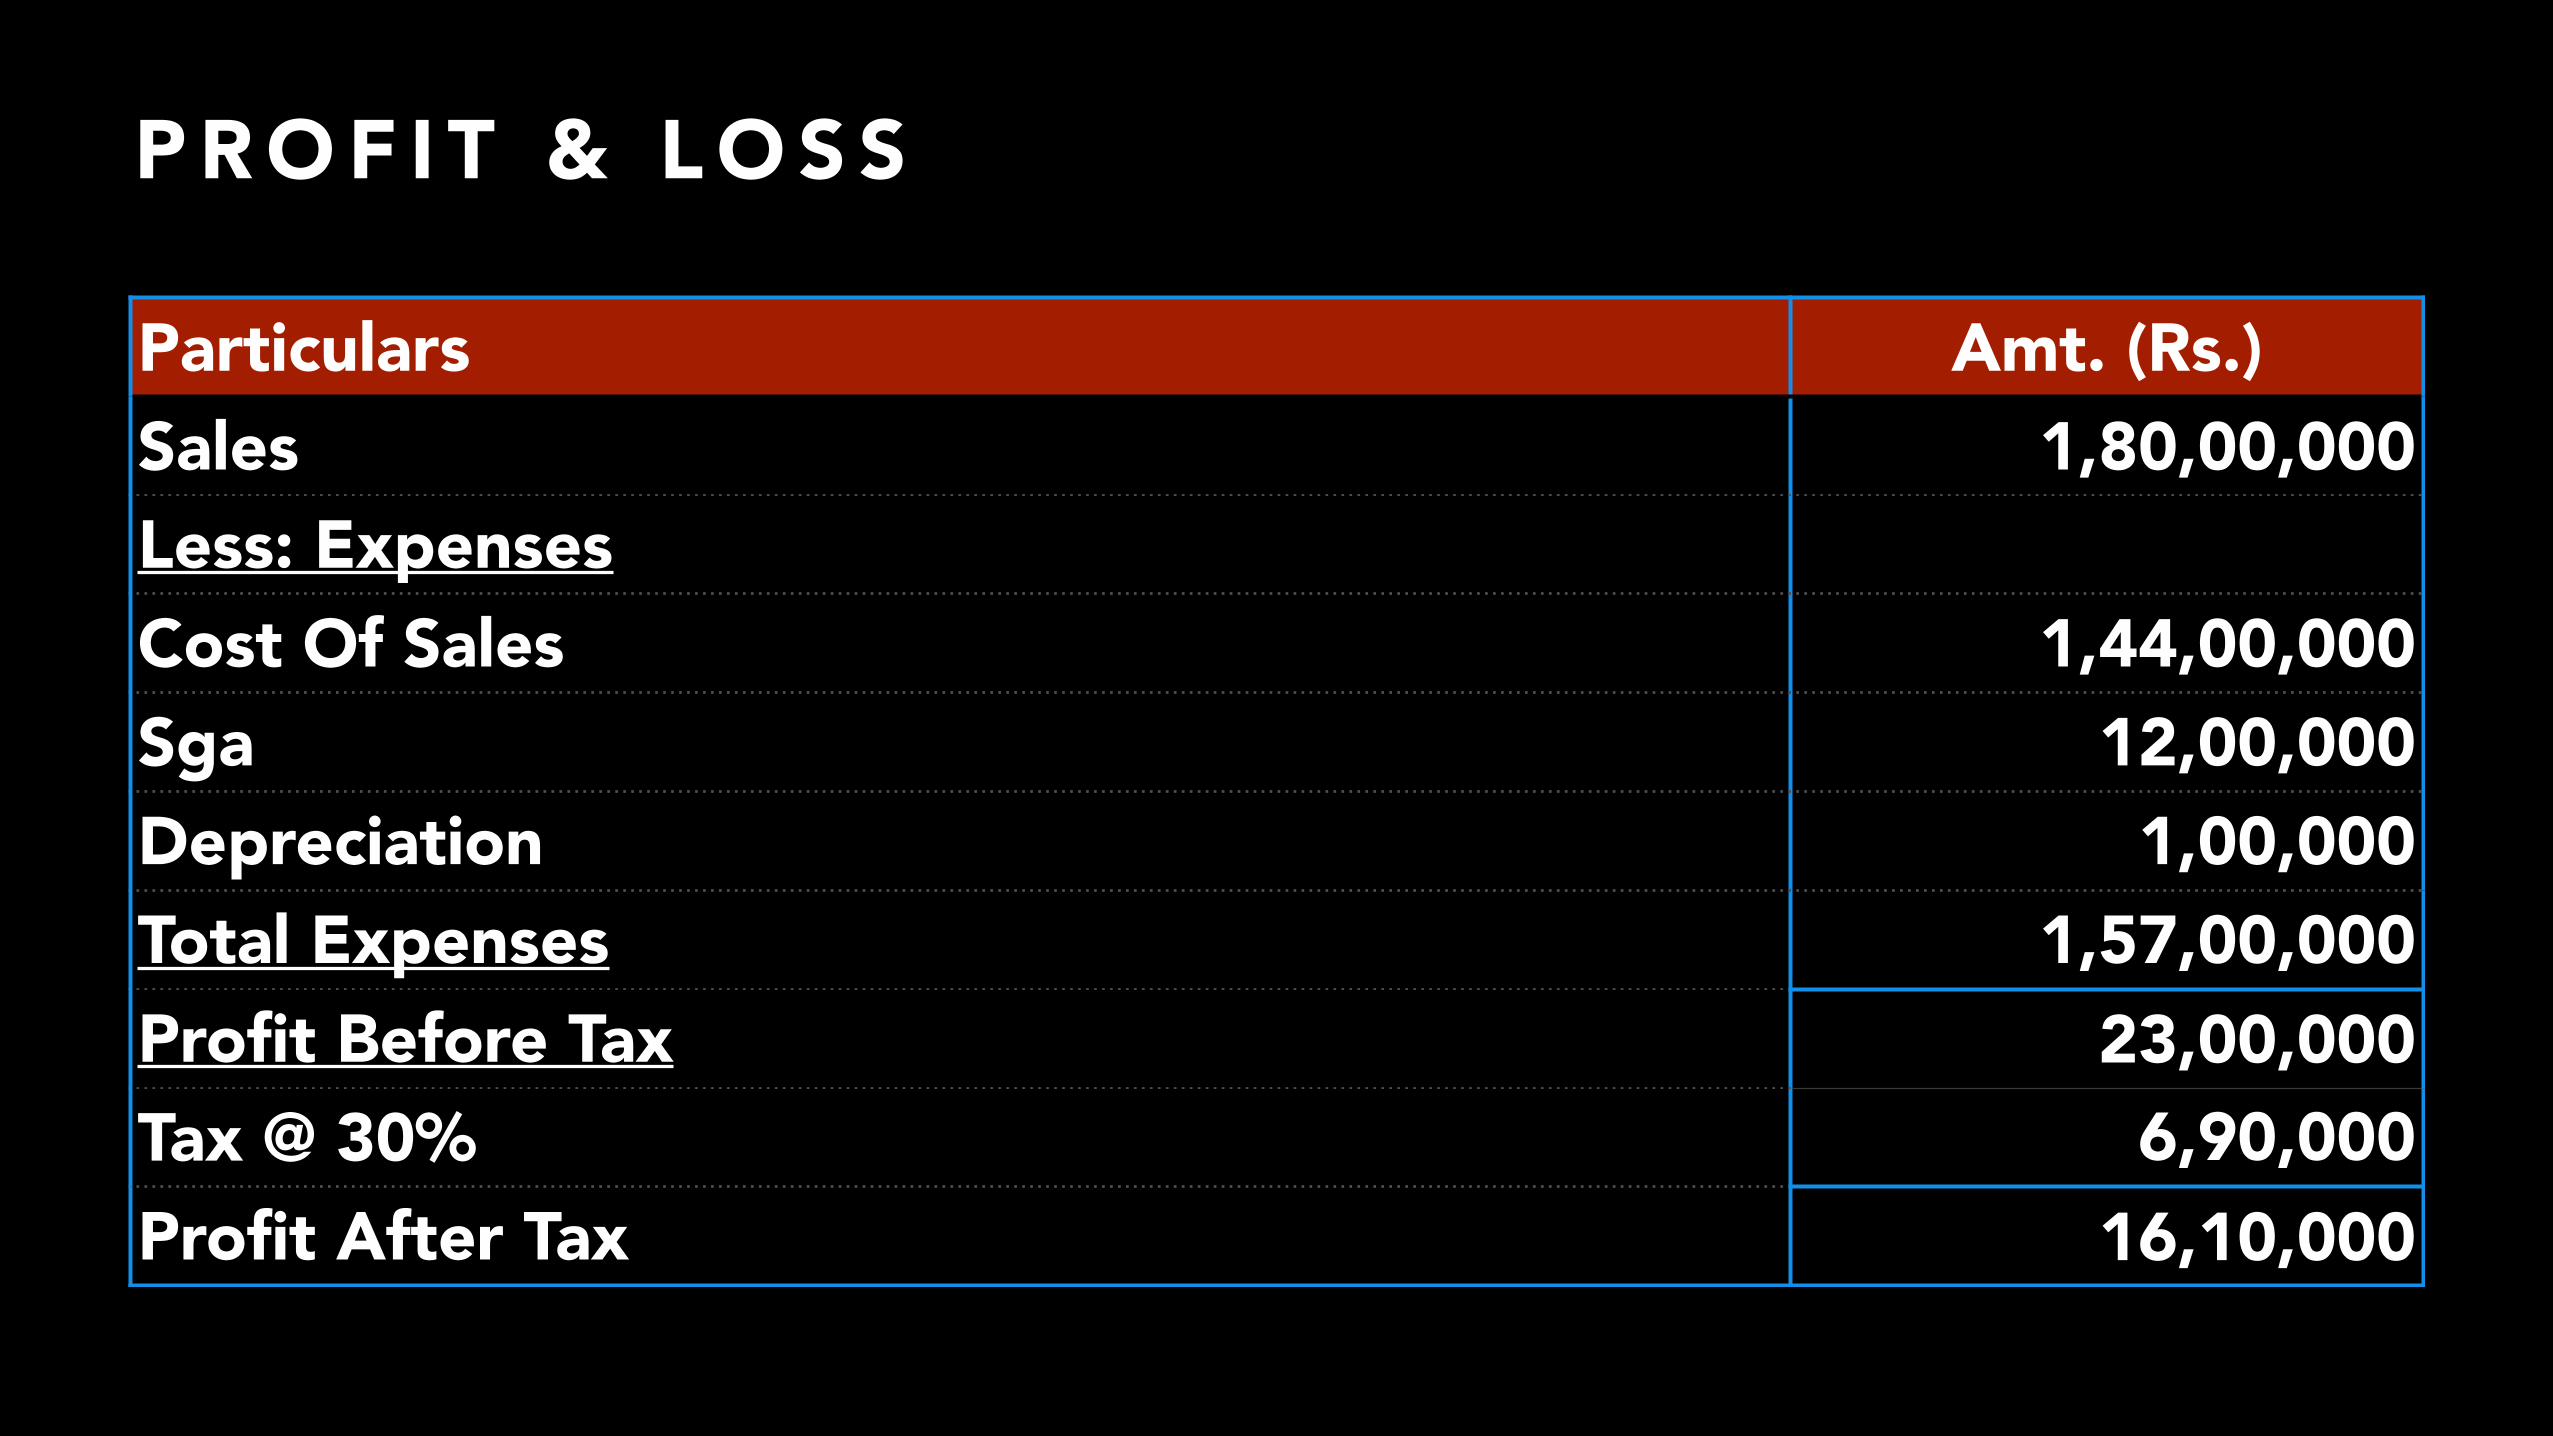
P R O F I T & L O S S
Particulars Amt. (Rs.)Sales 1,80,00,000Less: ExpensesCost Of Sales 1,44,00,000Sga 12,00,000Depreciation 1,00,000Total Expenses 1,57,00,000Profit Before Tax 23,00,000Tax @ 30% 6,90,000Profit After Tax 16,10,000
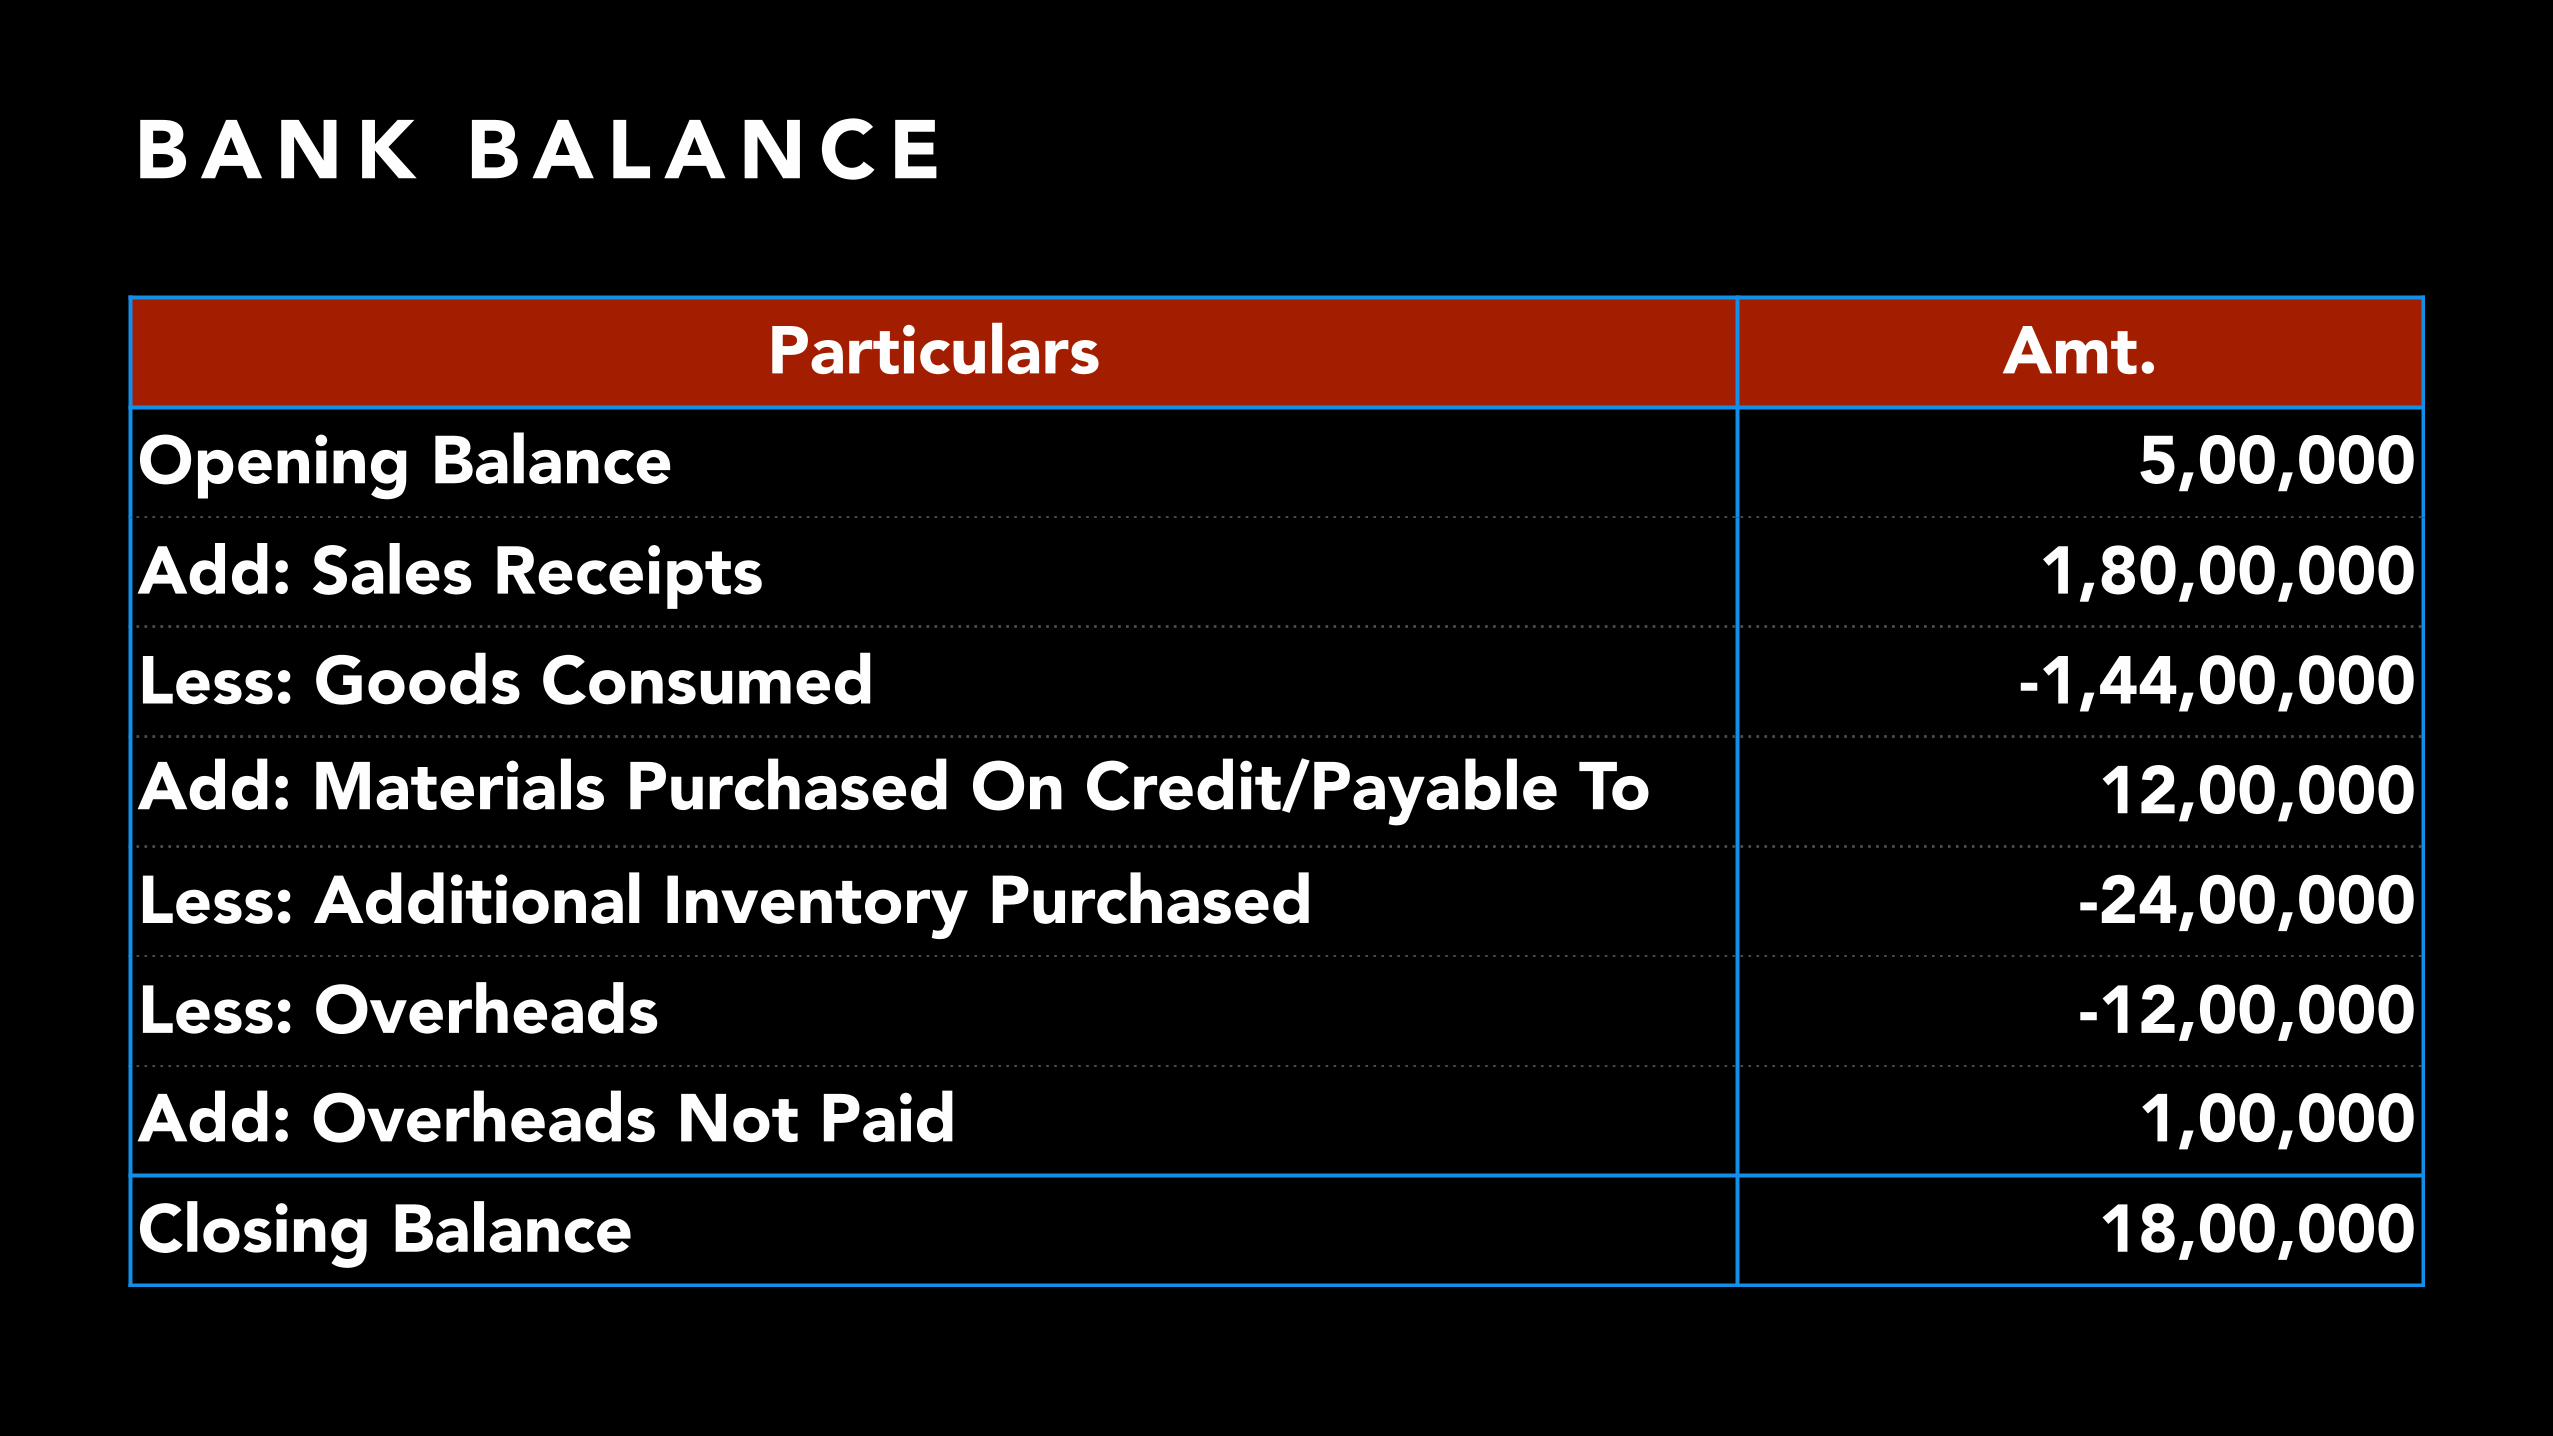
B A N K B A L A N C E
Particulars Amt.Opening Balance 5,00,000Add: Sales Receipts 1,80,00,000Less: Goods Consumed -1,44,00,000Add: Materials Purchased On Credit/Payable To Vendor
12,00,000Less: Additional Inventory Purchased -24,00,000Less: Overheads -12,00,000Add: Overheads Not Paid 1,00,000Closing Balance 18,00,000
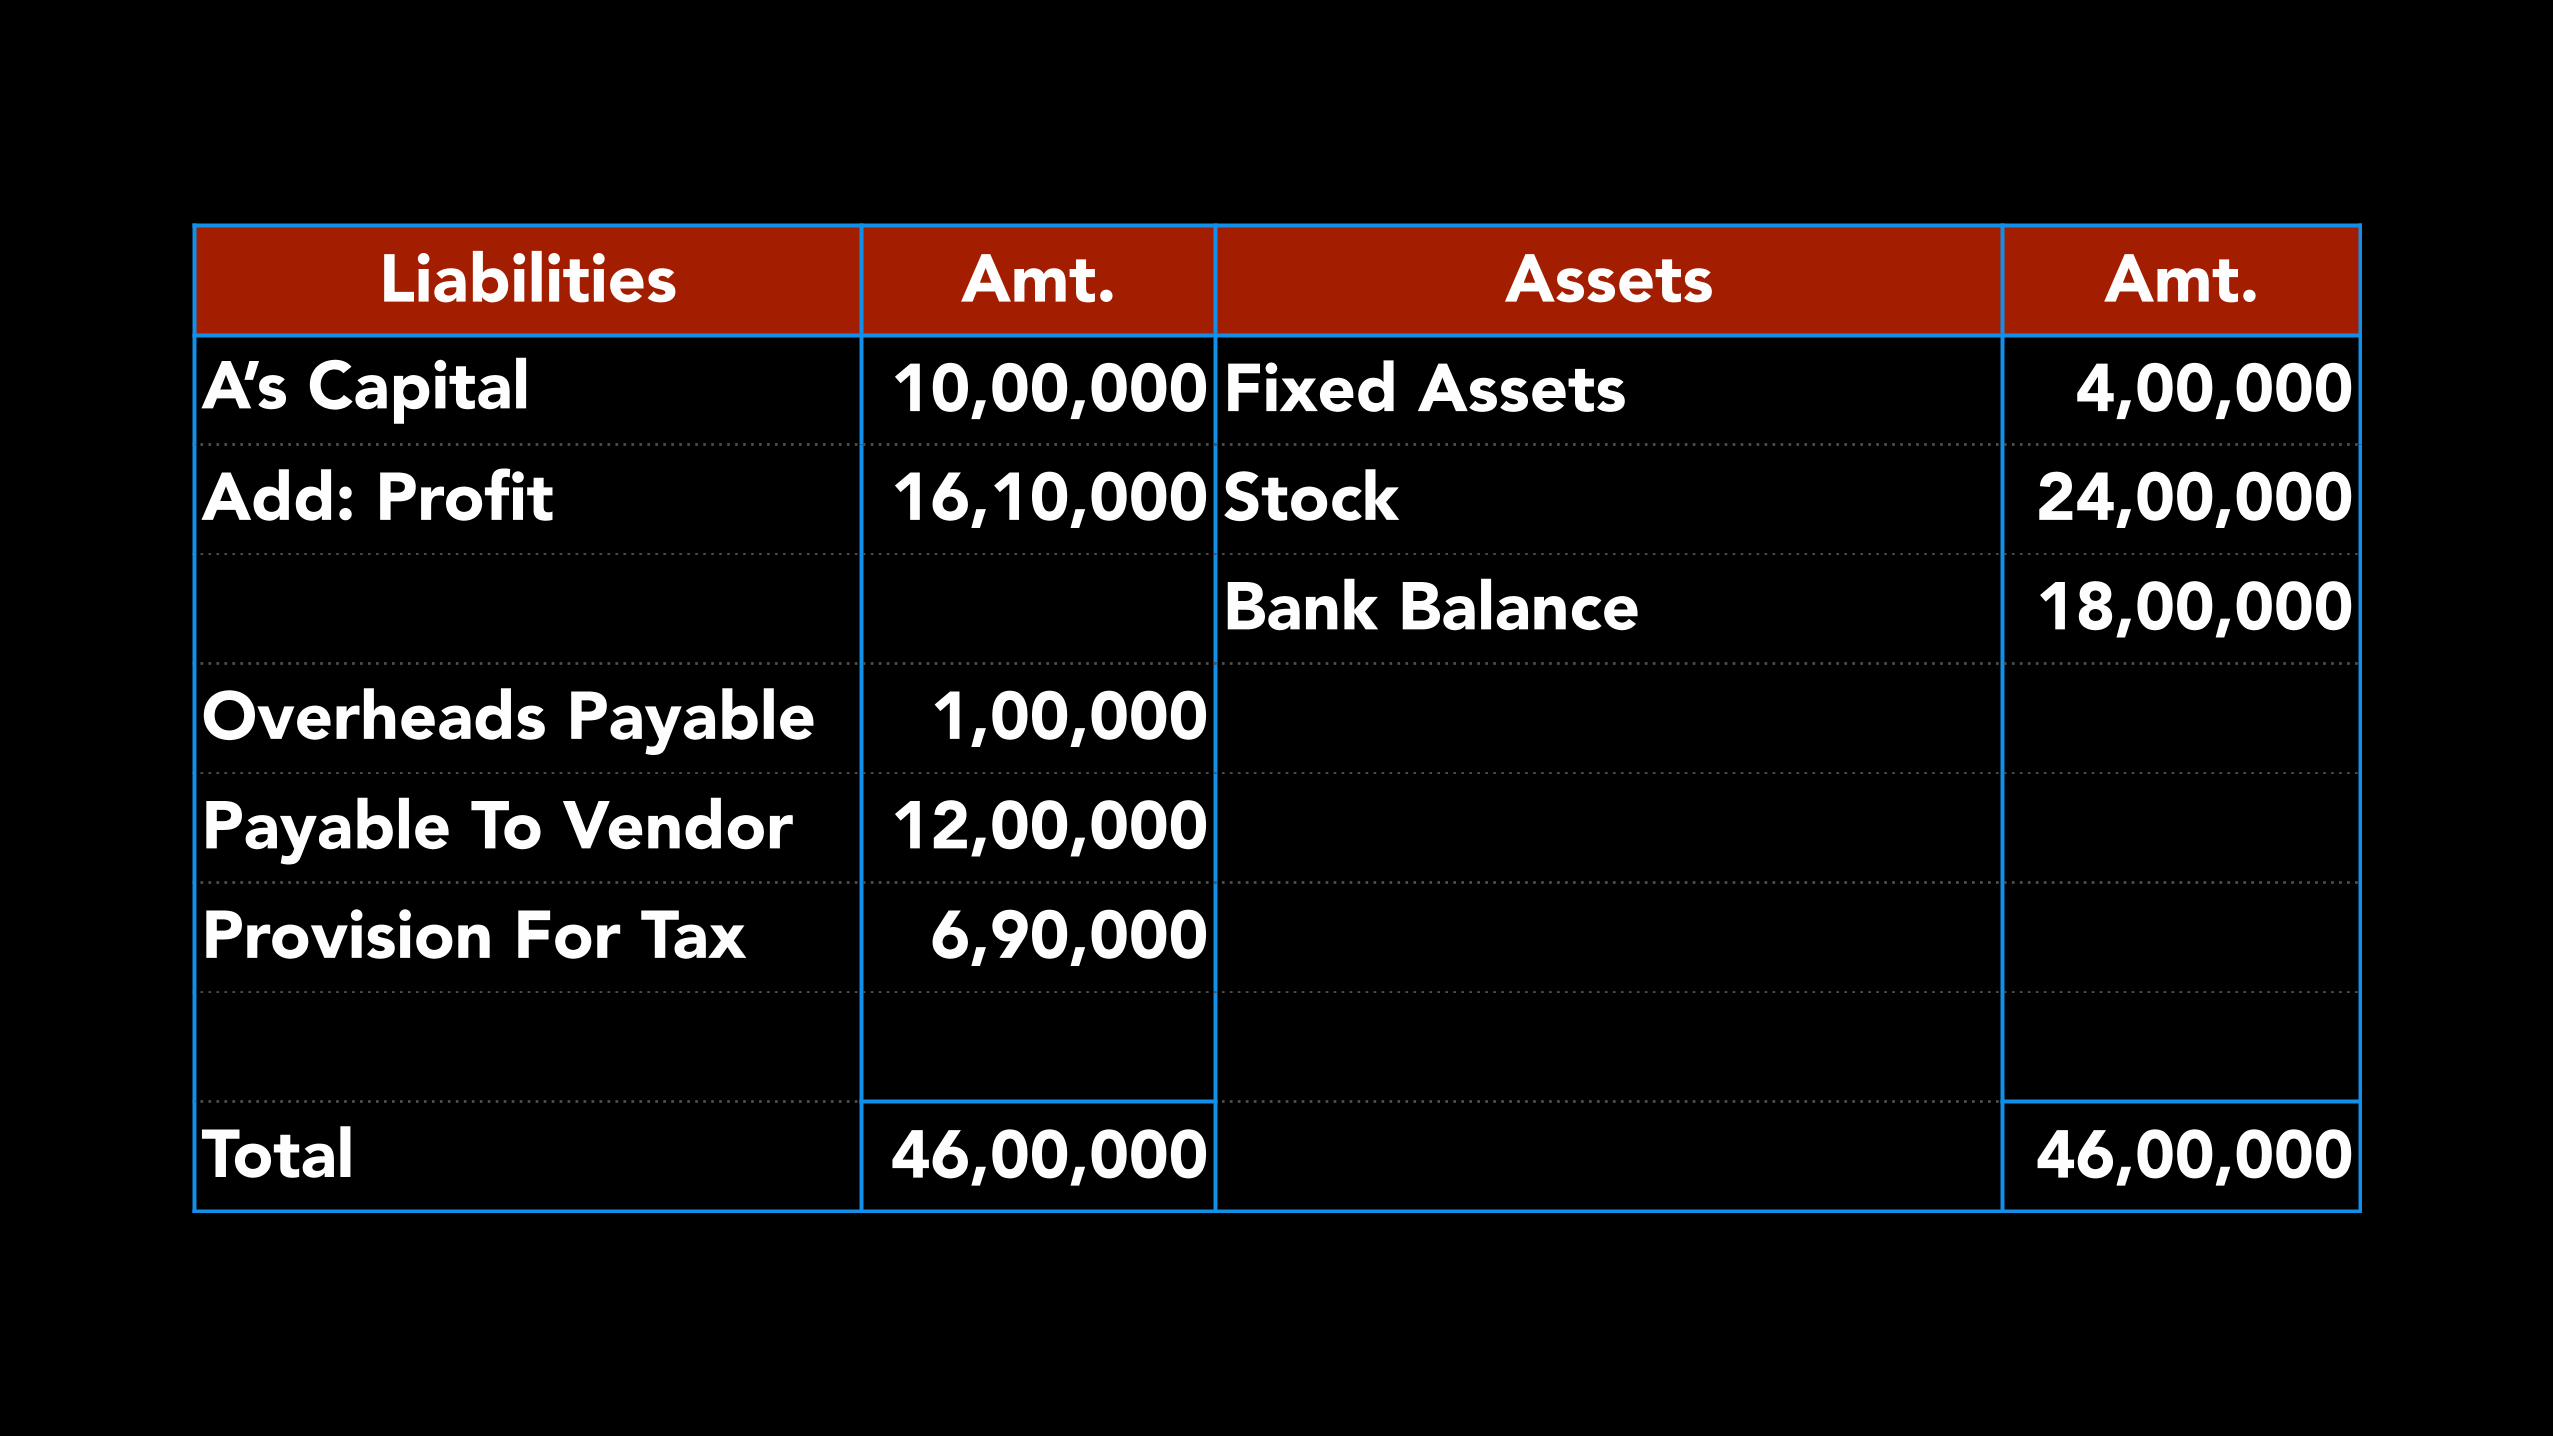
Liabilities Amt. Assets Amt.A’s Capital 10,00,000 Fixed Assets 4,00,000Add: Profit 16,10,000 Stock 24,00,000
Bank Balance 18,00,000Overheads Payable 1,00,000Payable To Vendor 12,00,000Provision For Tax 6,90,000
Total 46,00,000 46,00,000
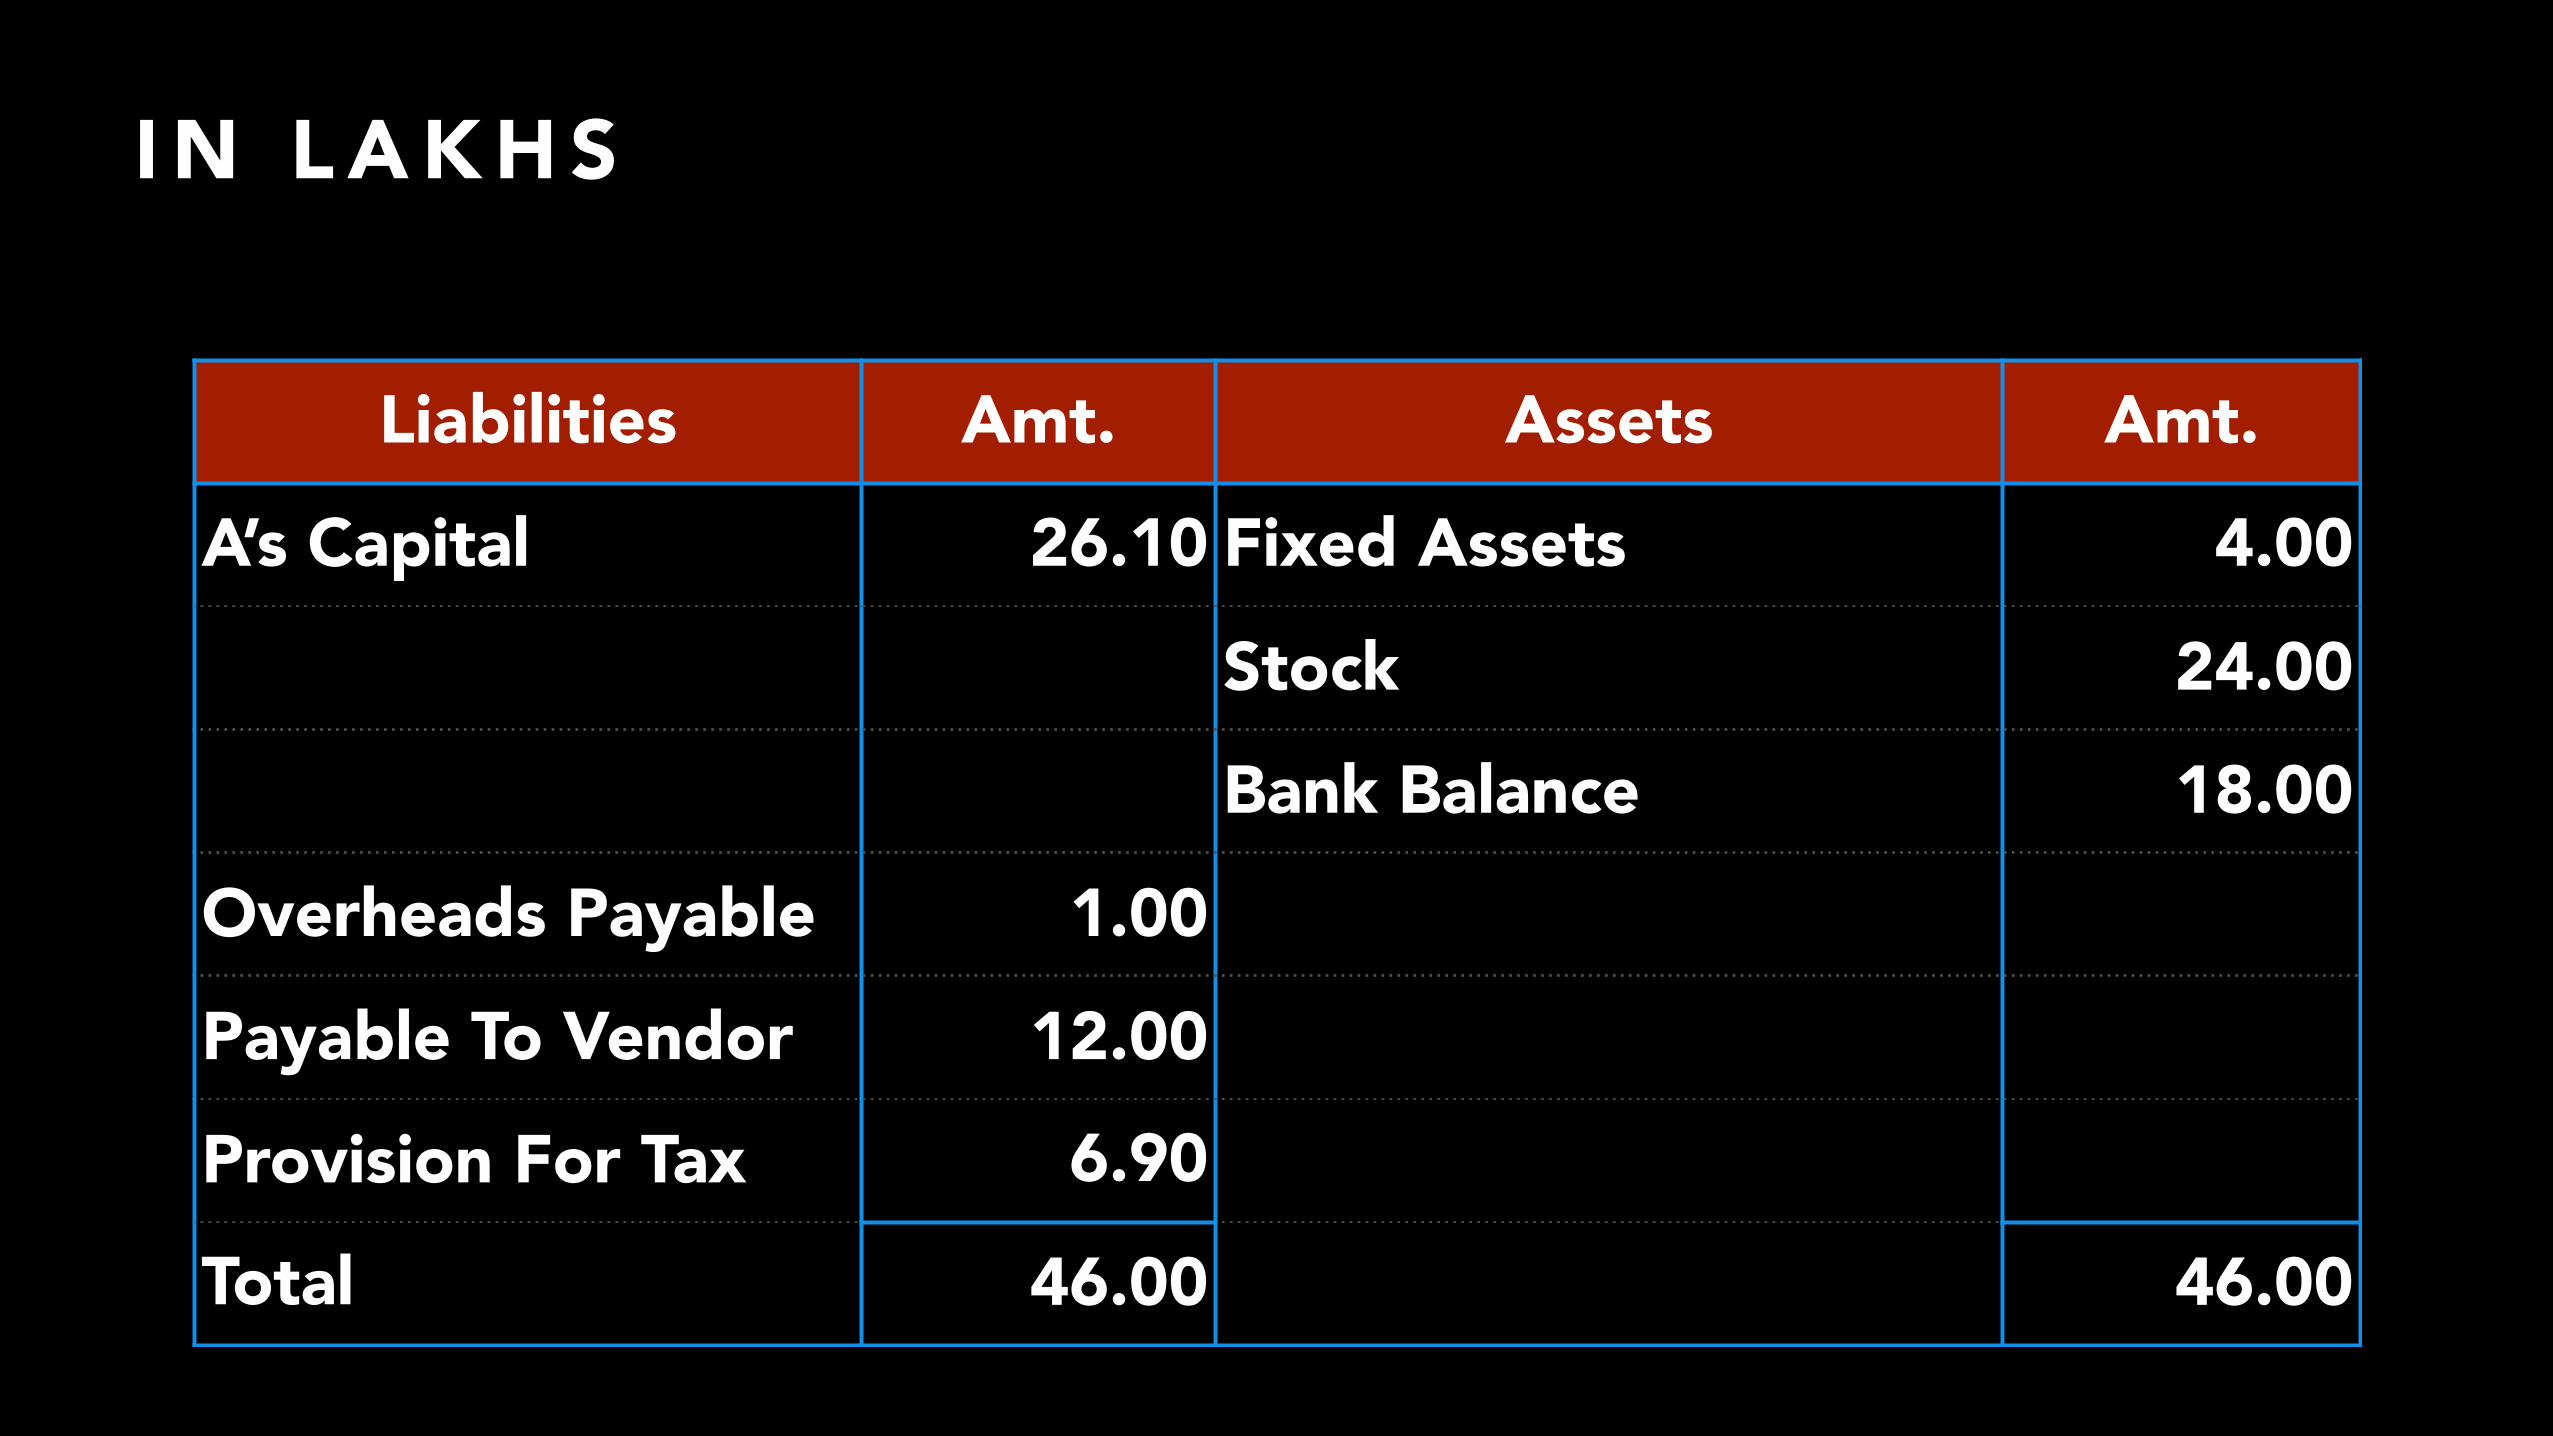
I N L A K H S
Liabilities Amt. Assets Amt.
A’s Capital 26.10 Fixed Assets 4.00
Stock 24.00
Bank Balance 18.00
Overheads Payable 1.00
Payable To Vendor 12.00
Provision For Tax 6.90
Total 46.00 46.00
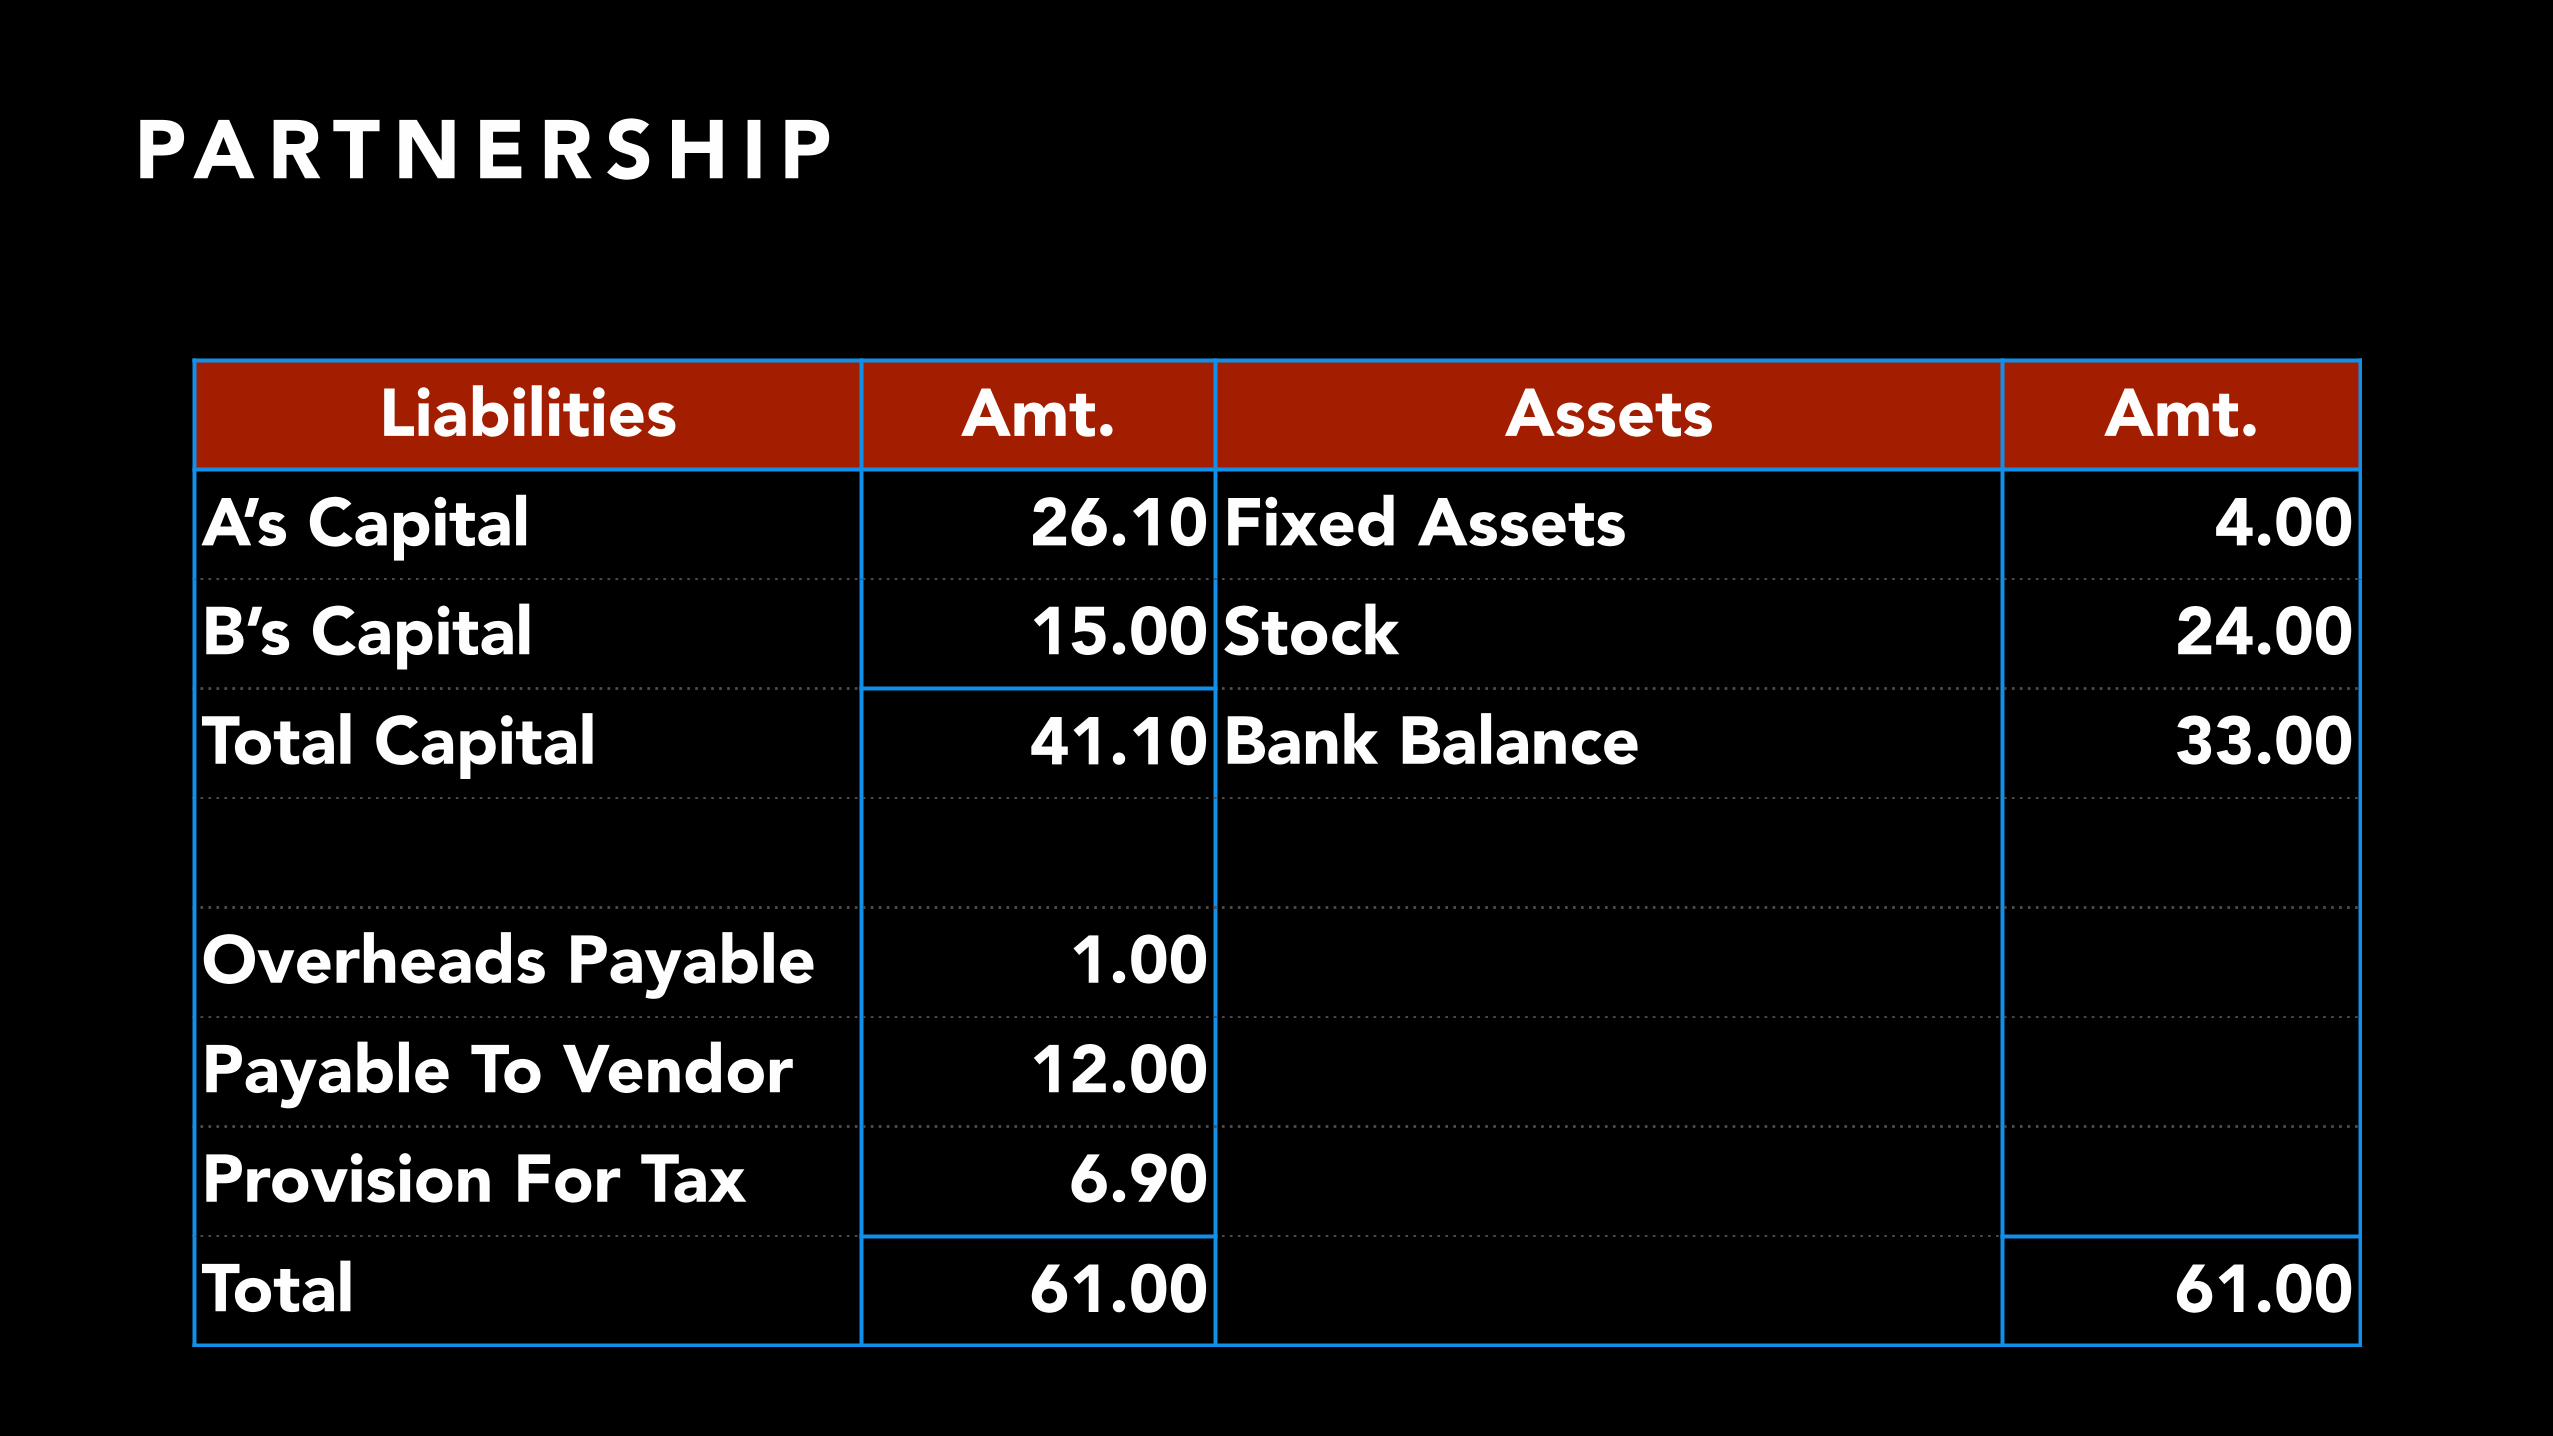
PA RT N E R S H I P
Liabilities Amt. Assets Amt.A’s Capital 26.10 Fixed Assets 4.00B’s Capital 15.00 Stock 24.00Total Capital 41.10 Bank Balance 33.00
Overheads Payable 1.00Payable To Vendor 12.00Provision For Tax 6.90Total 61.00 61.00
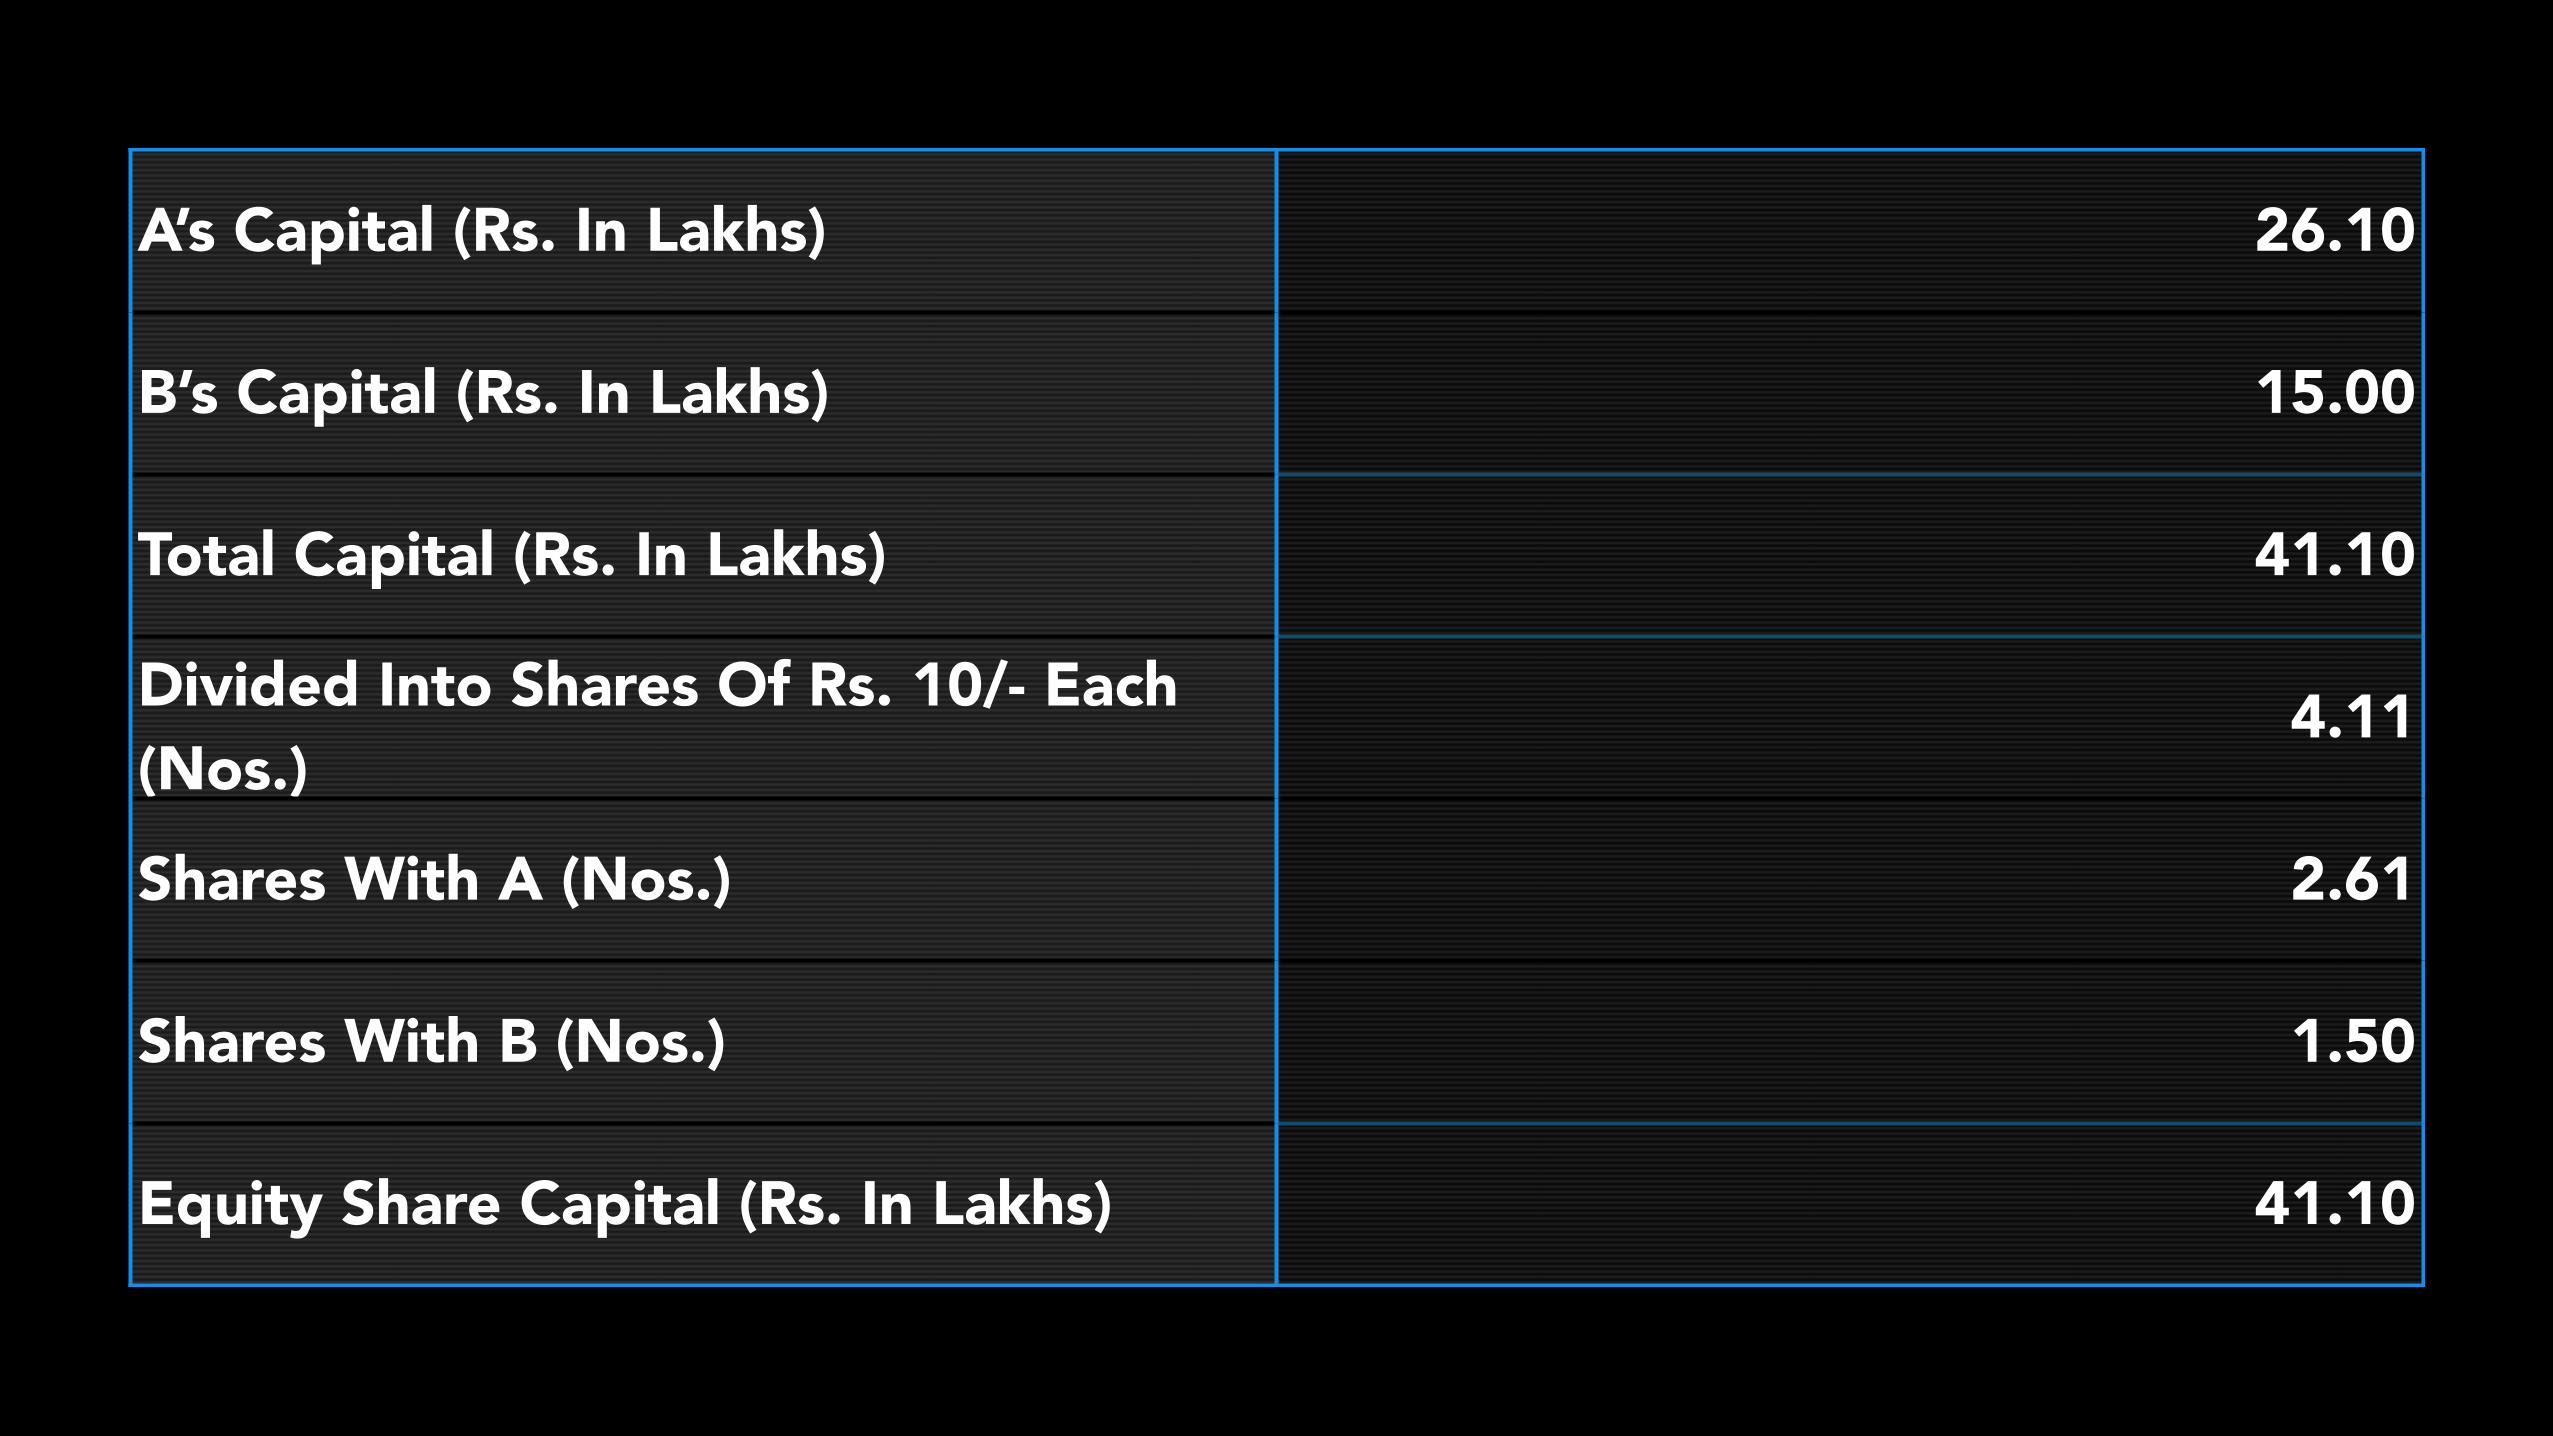
A’s Capital (Rs. In Lakhs) 26.10
B’s Capital (Rs. In Lakhs) 15.00
Total Capital (Rs. In Lakhs) 41.10
Divided Into Shares Of Rs. 10/- Each (Nos.)
4.11
Shares With A (Nos.) 2.61
Shares With B (Nos.) 1.50
Equity Share Capital (Rs. In Lakhs) 41.10
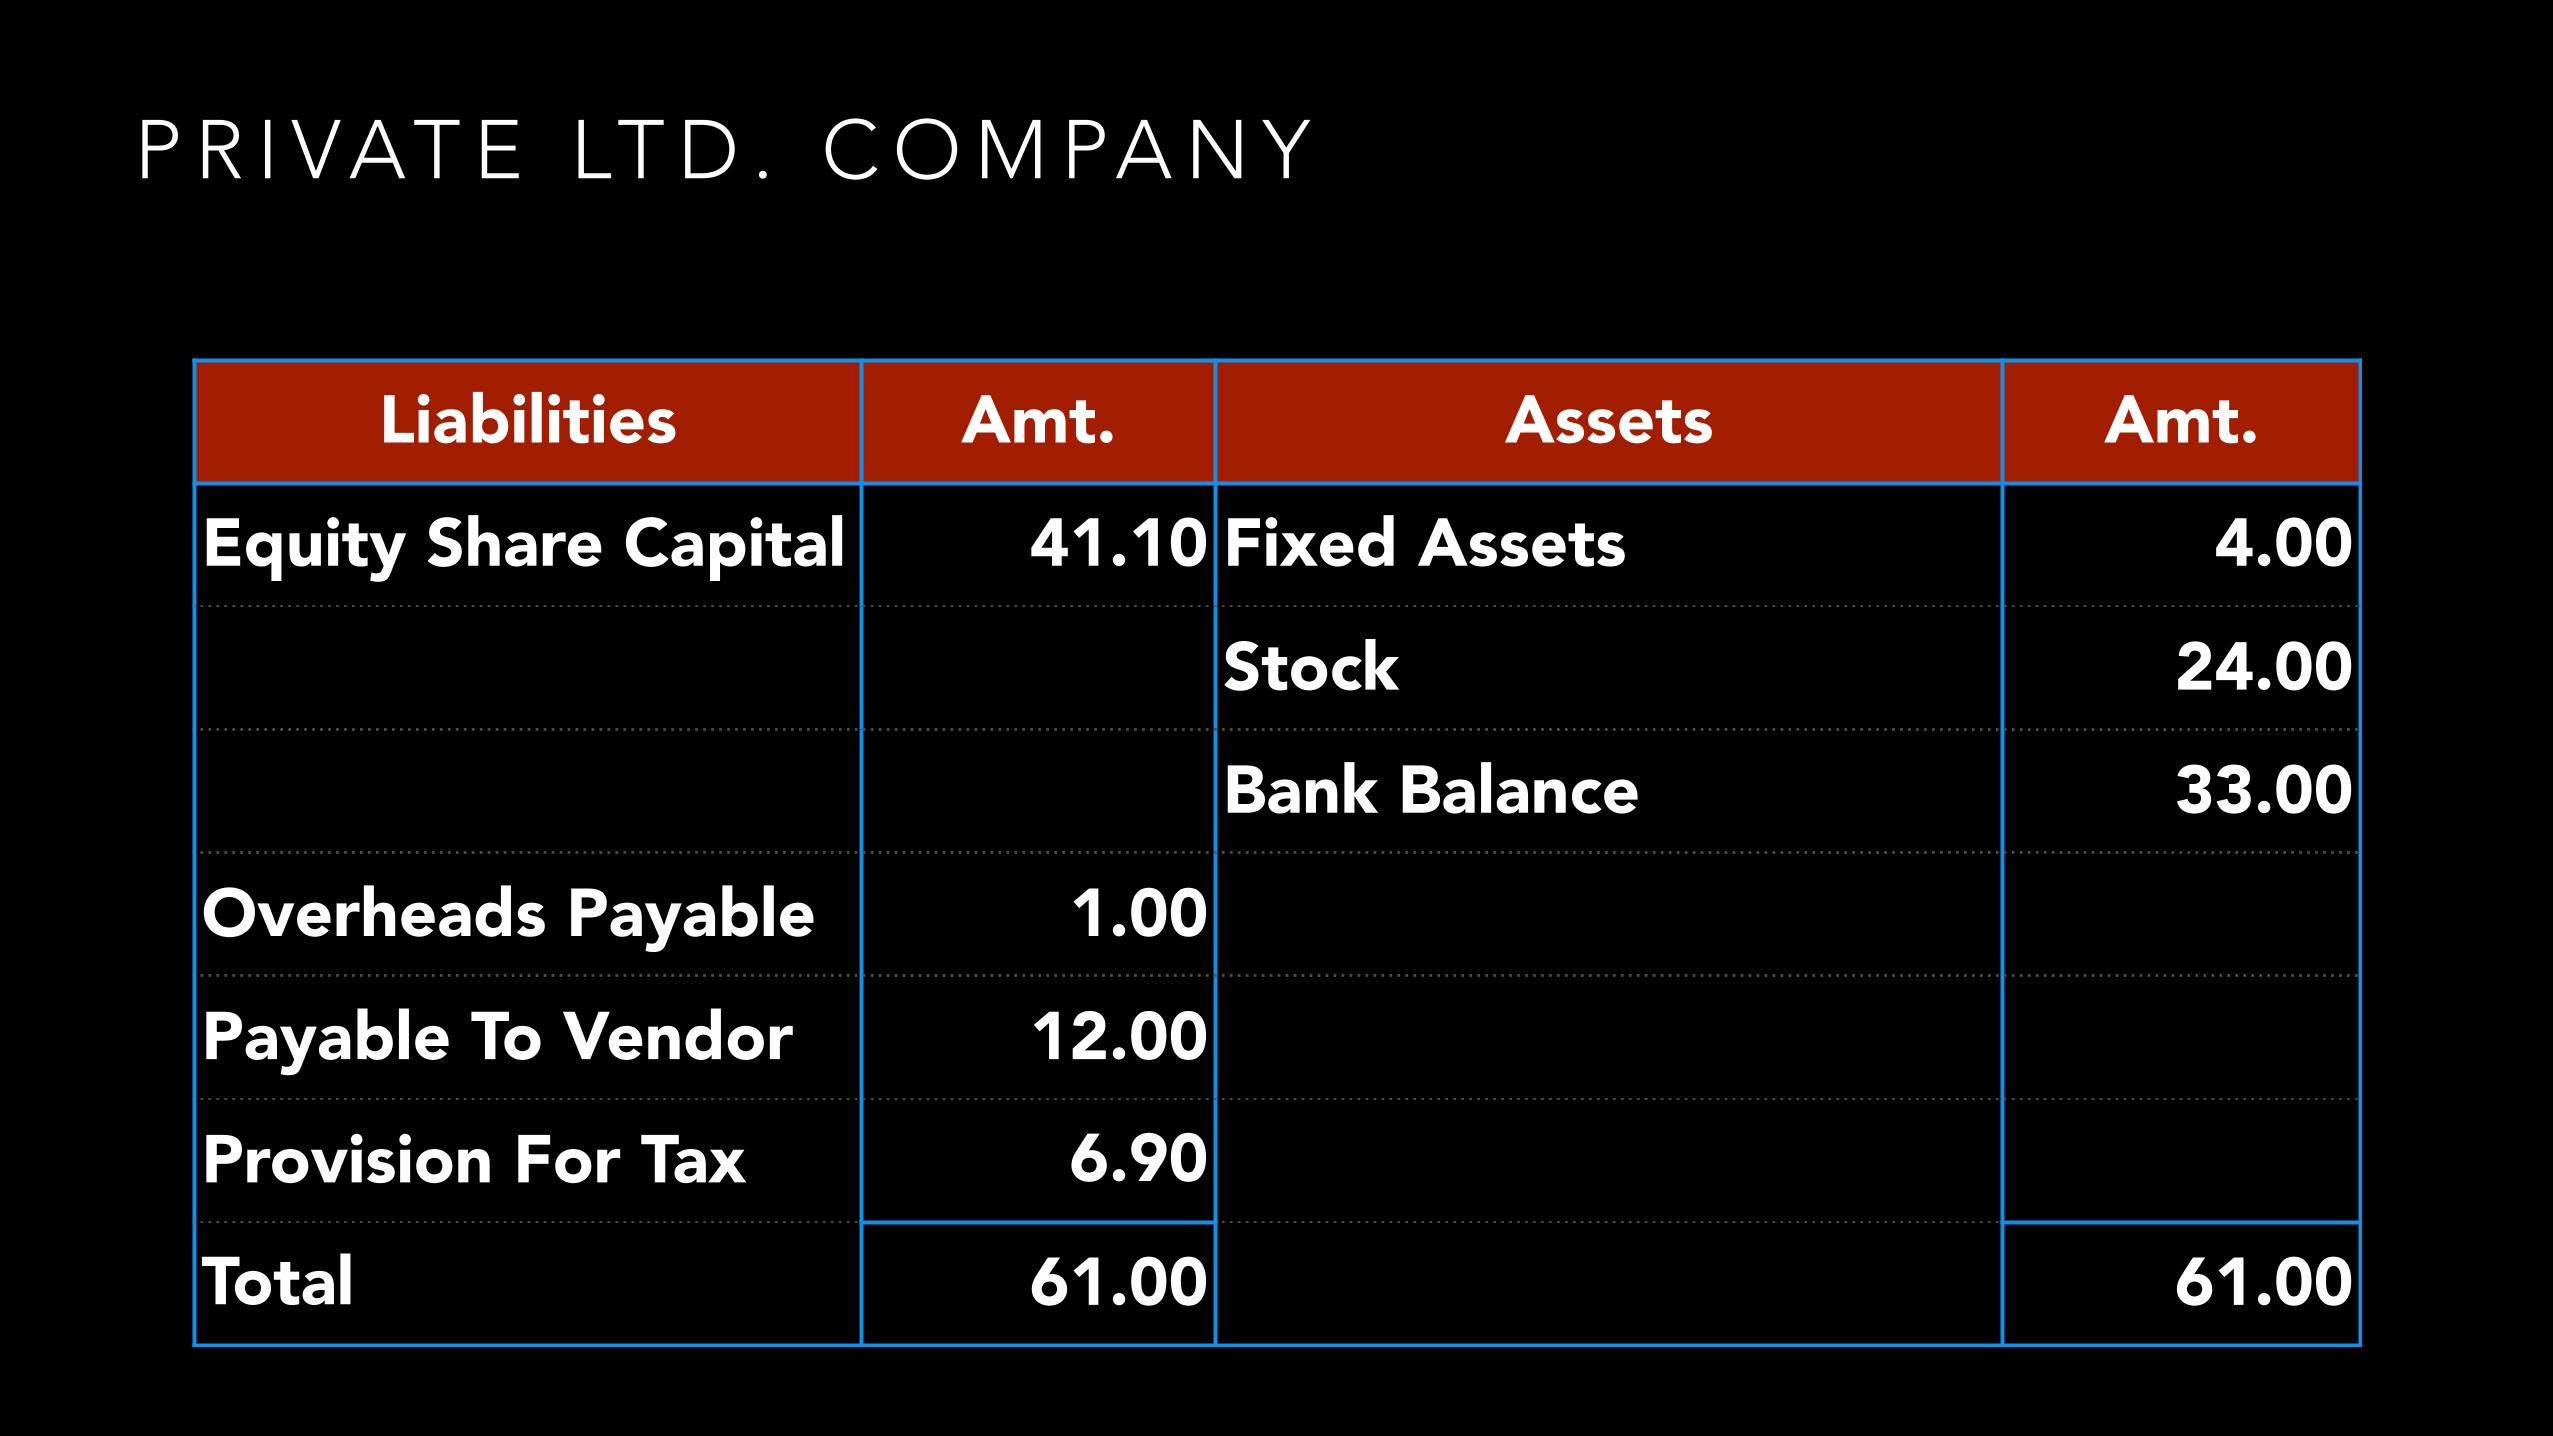
P R I VAT E LT D . C O M PA N Y
Liabilities Amt. Assets Amt.
Equity Share Capital 41.10 Fixed Assets 4.00
Stock 24.00
Bank Balance 33.00
Overheads Payable 1.00
Payable To Vendor 12.00
Provision For Tax 6.90
Total 61.00 61.00
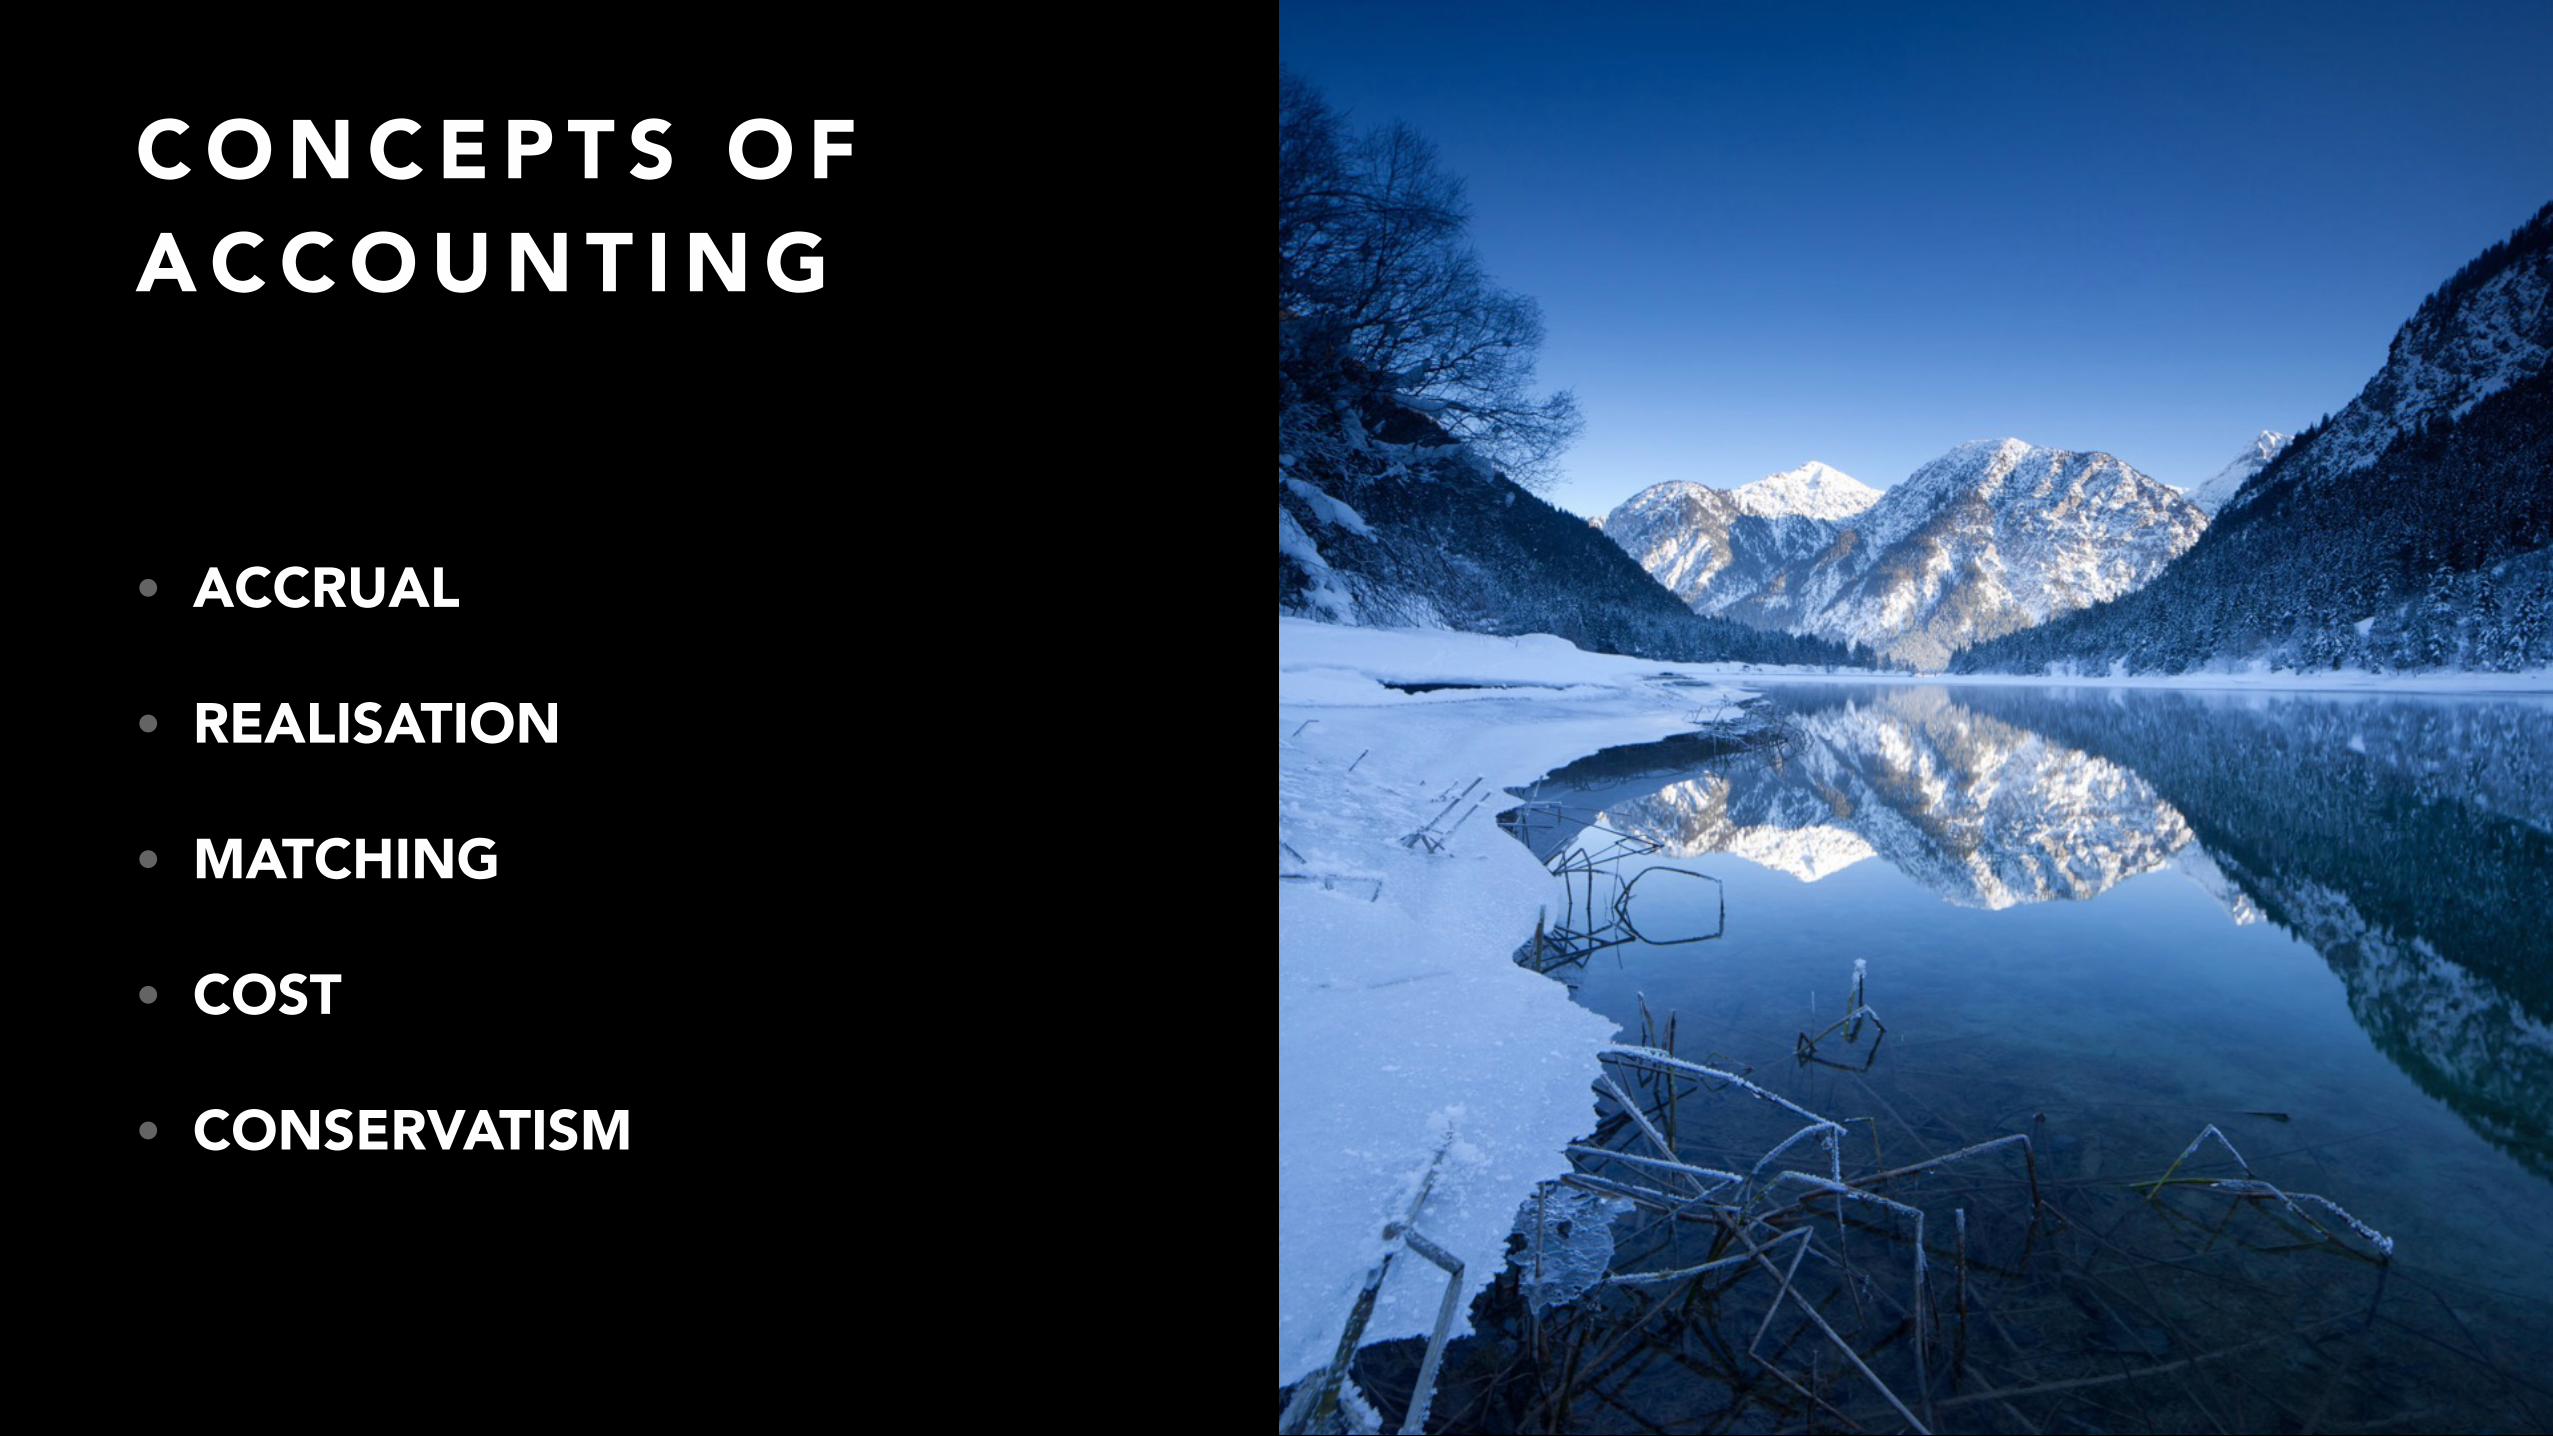
C O N C E P T S O F A C C O U N T I N G
• ACCRUAL
• REALISATION
• MATCHING
• COST
• CONSERVATISM
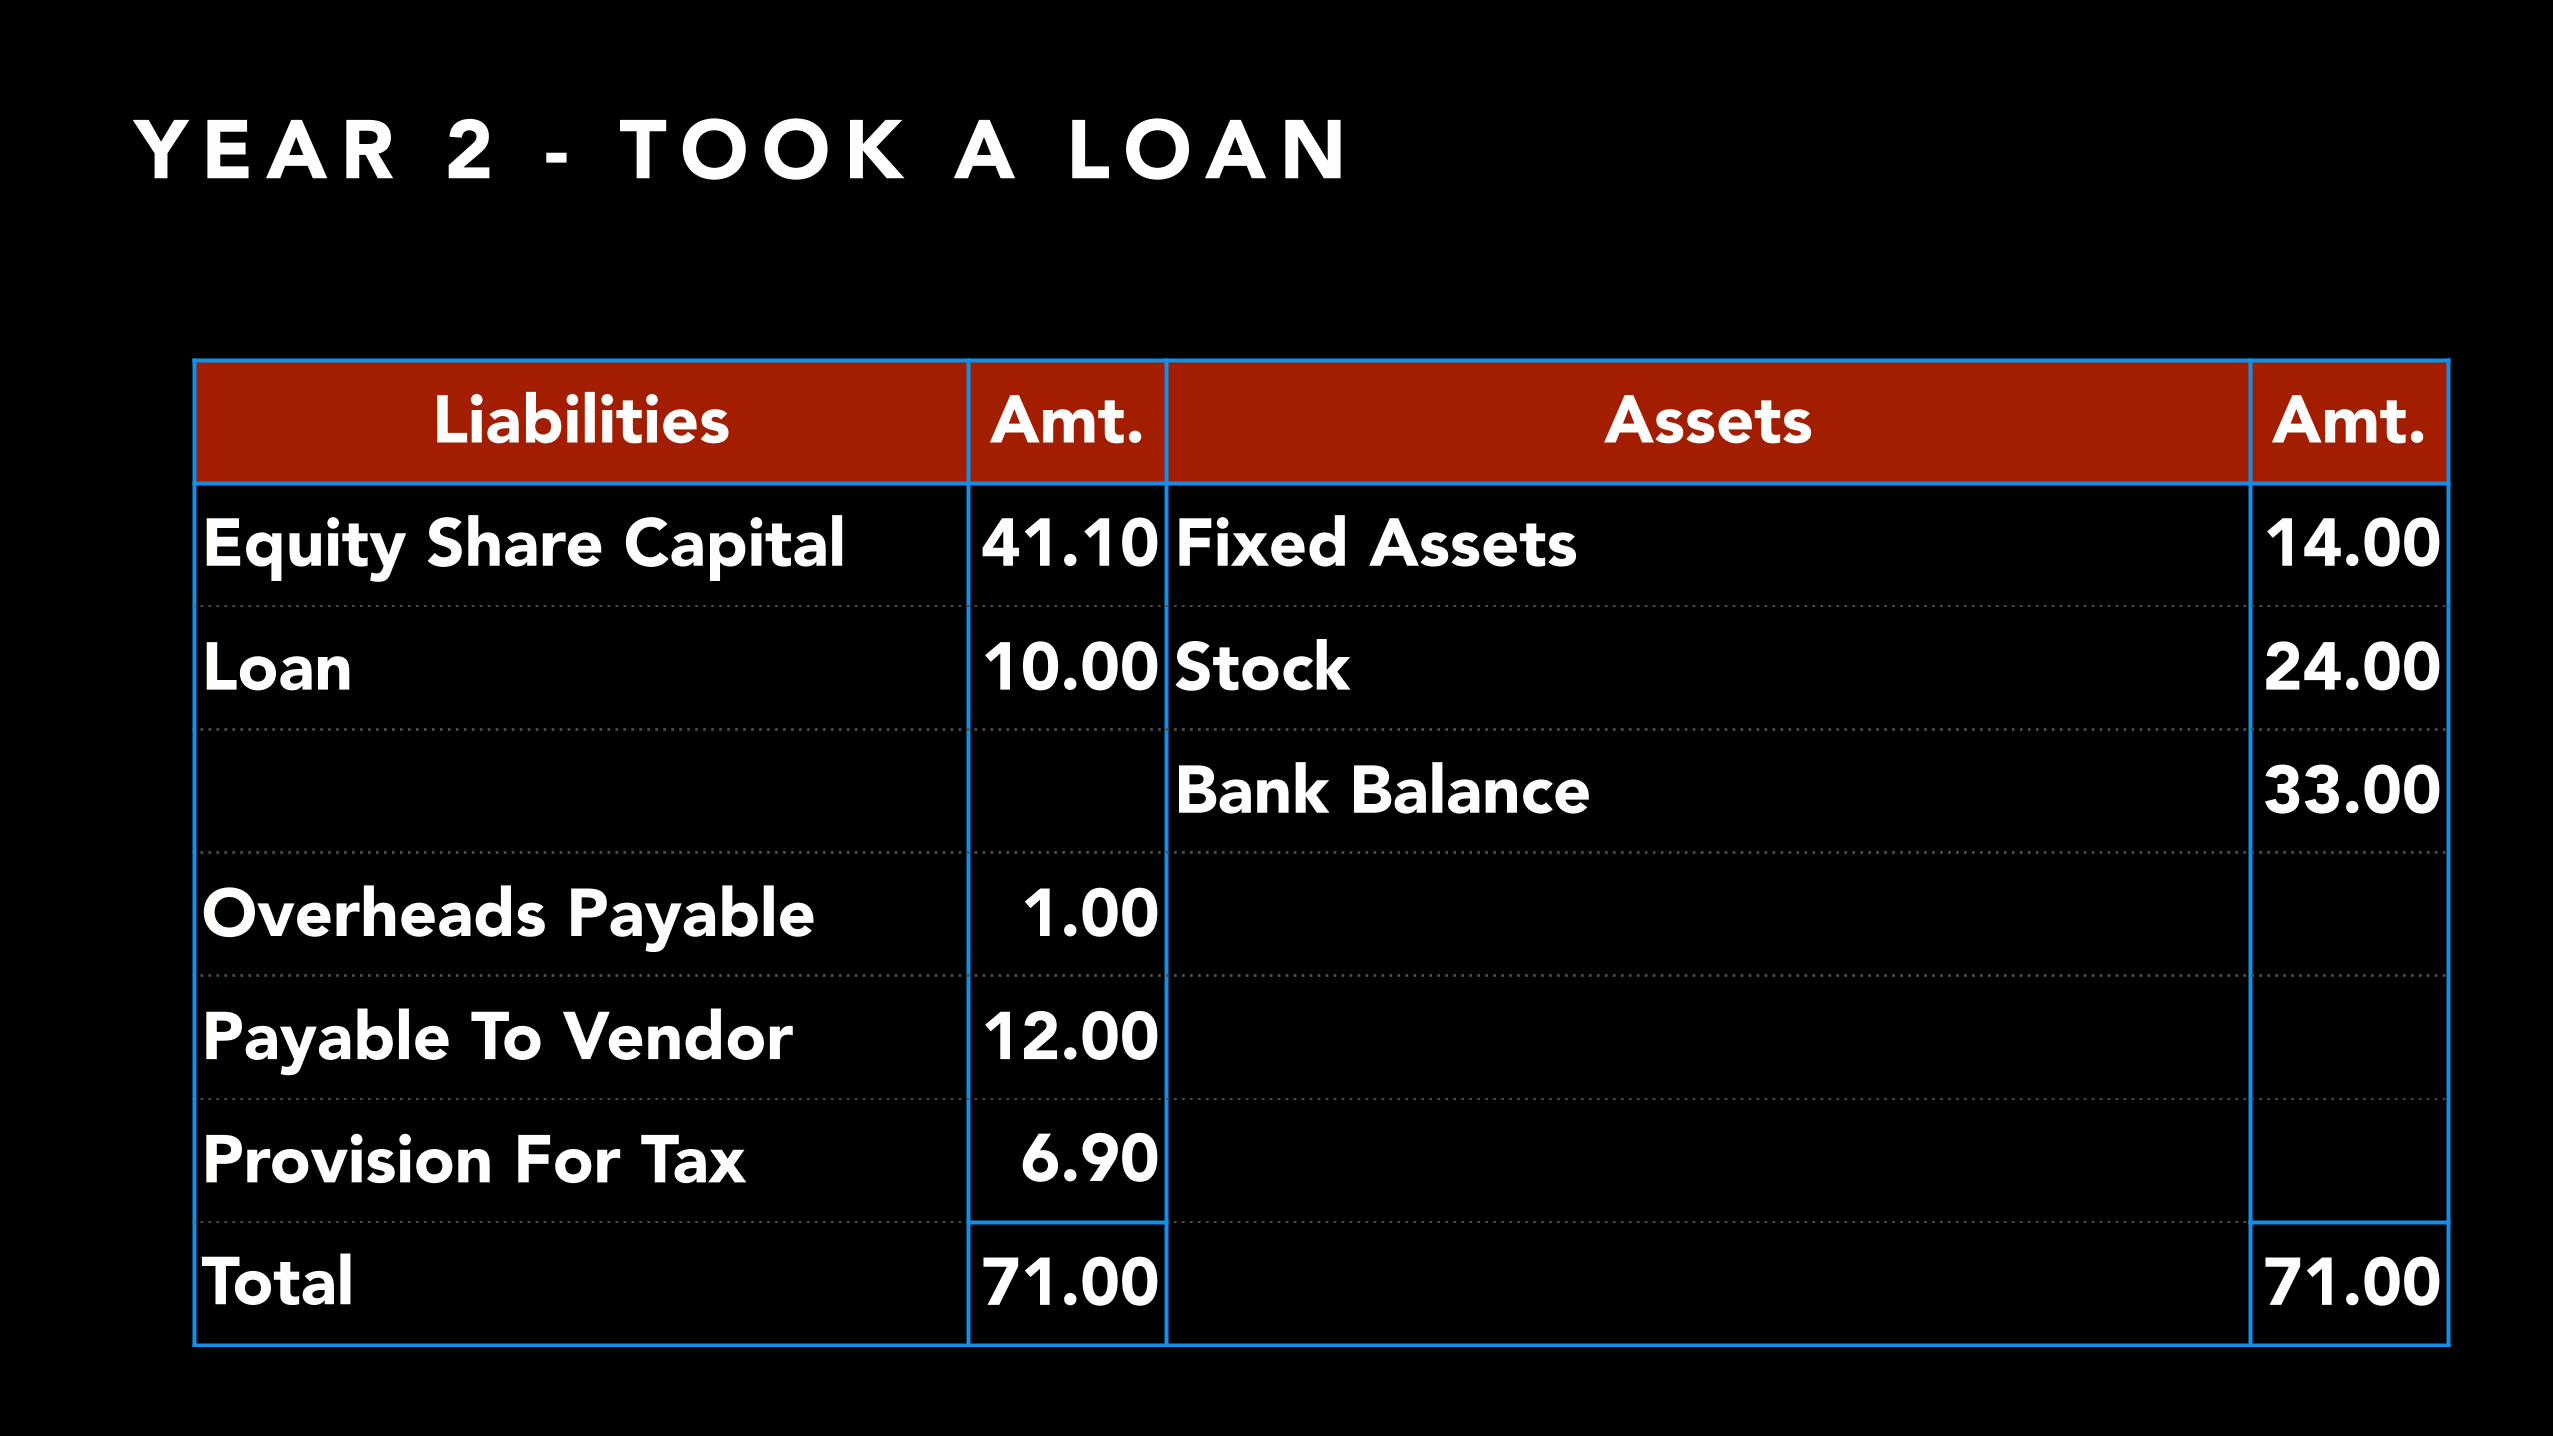
Y E A R 2 - T O O K A L O A N
Liabilities Amt. Assets Amt.
Equity Share Capital 41.10 Fixed Assets 14.00
Loan 10.00 Stock 24.00
Bank Balance 33.00
Overheads Payable 1.00
Payable To Vendor 12.00
Provision For Tax 6.90
Total 71.00 71.00
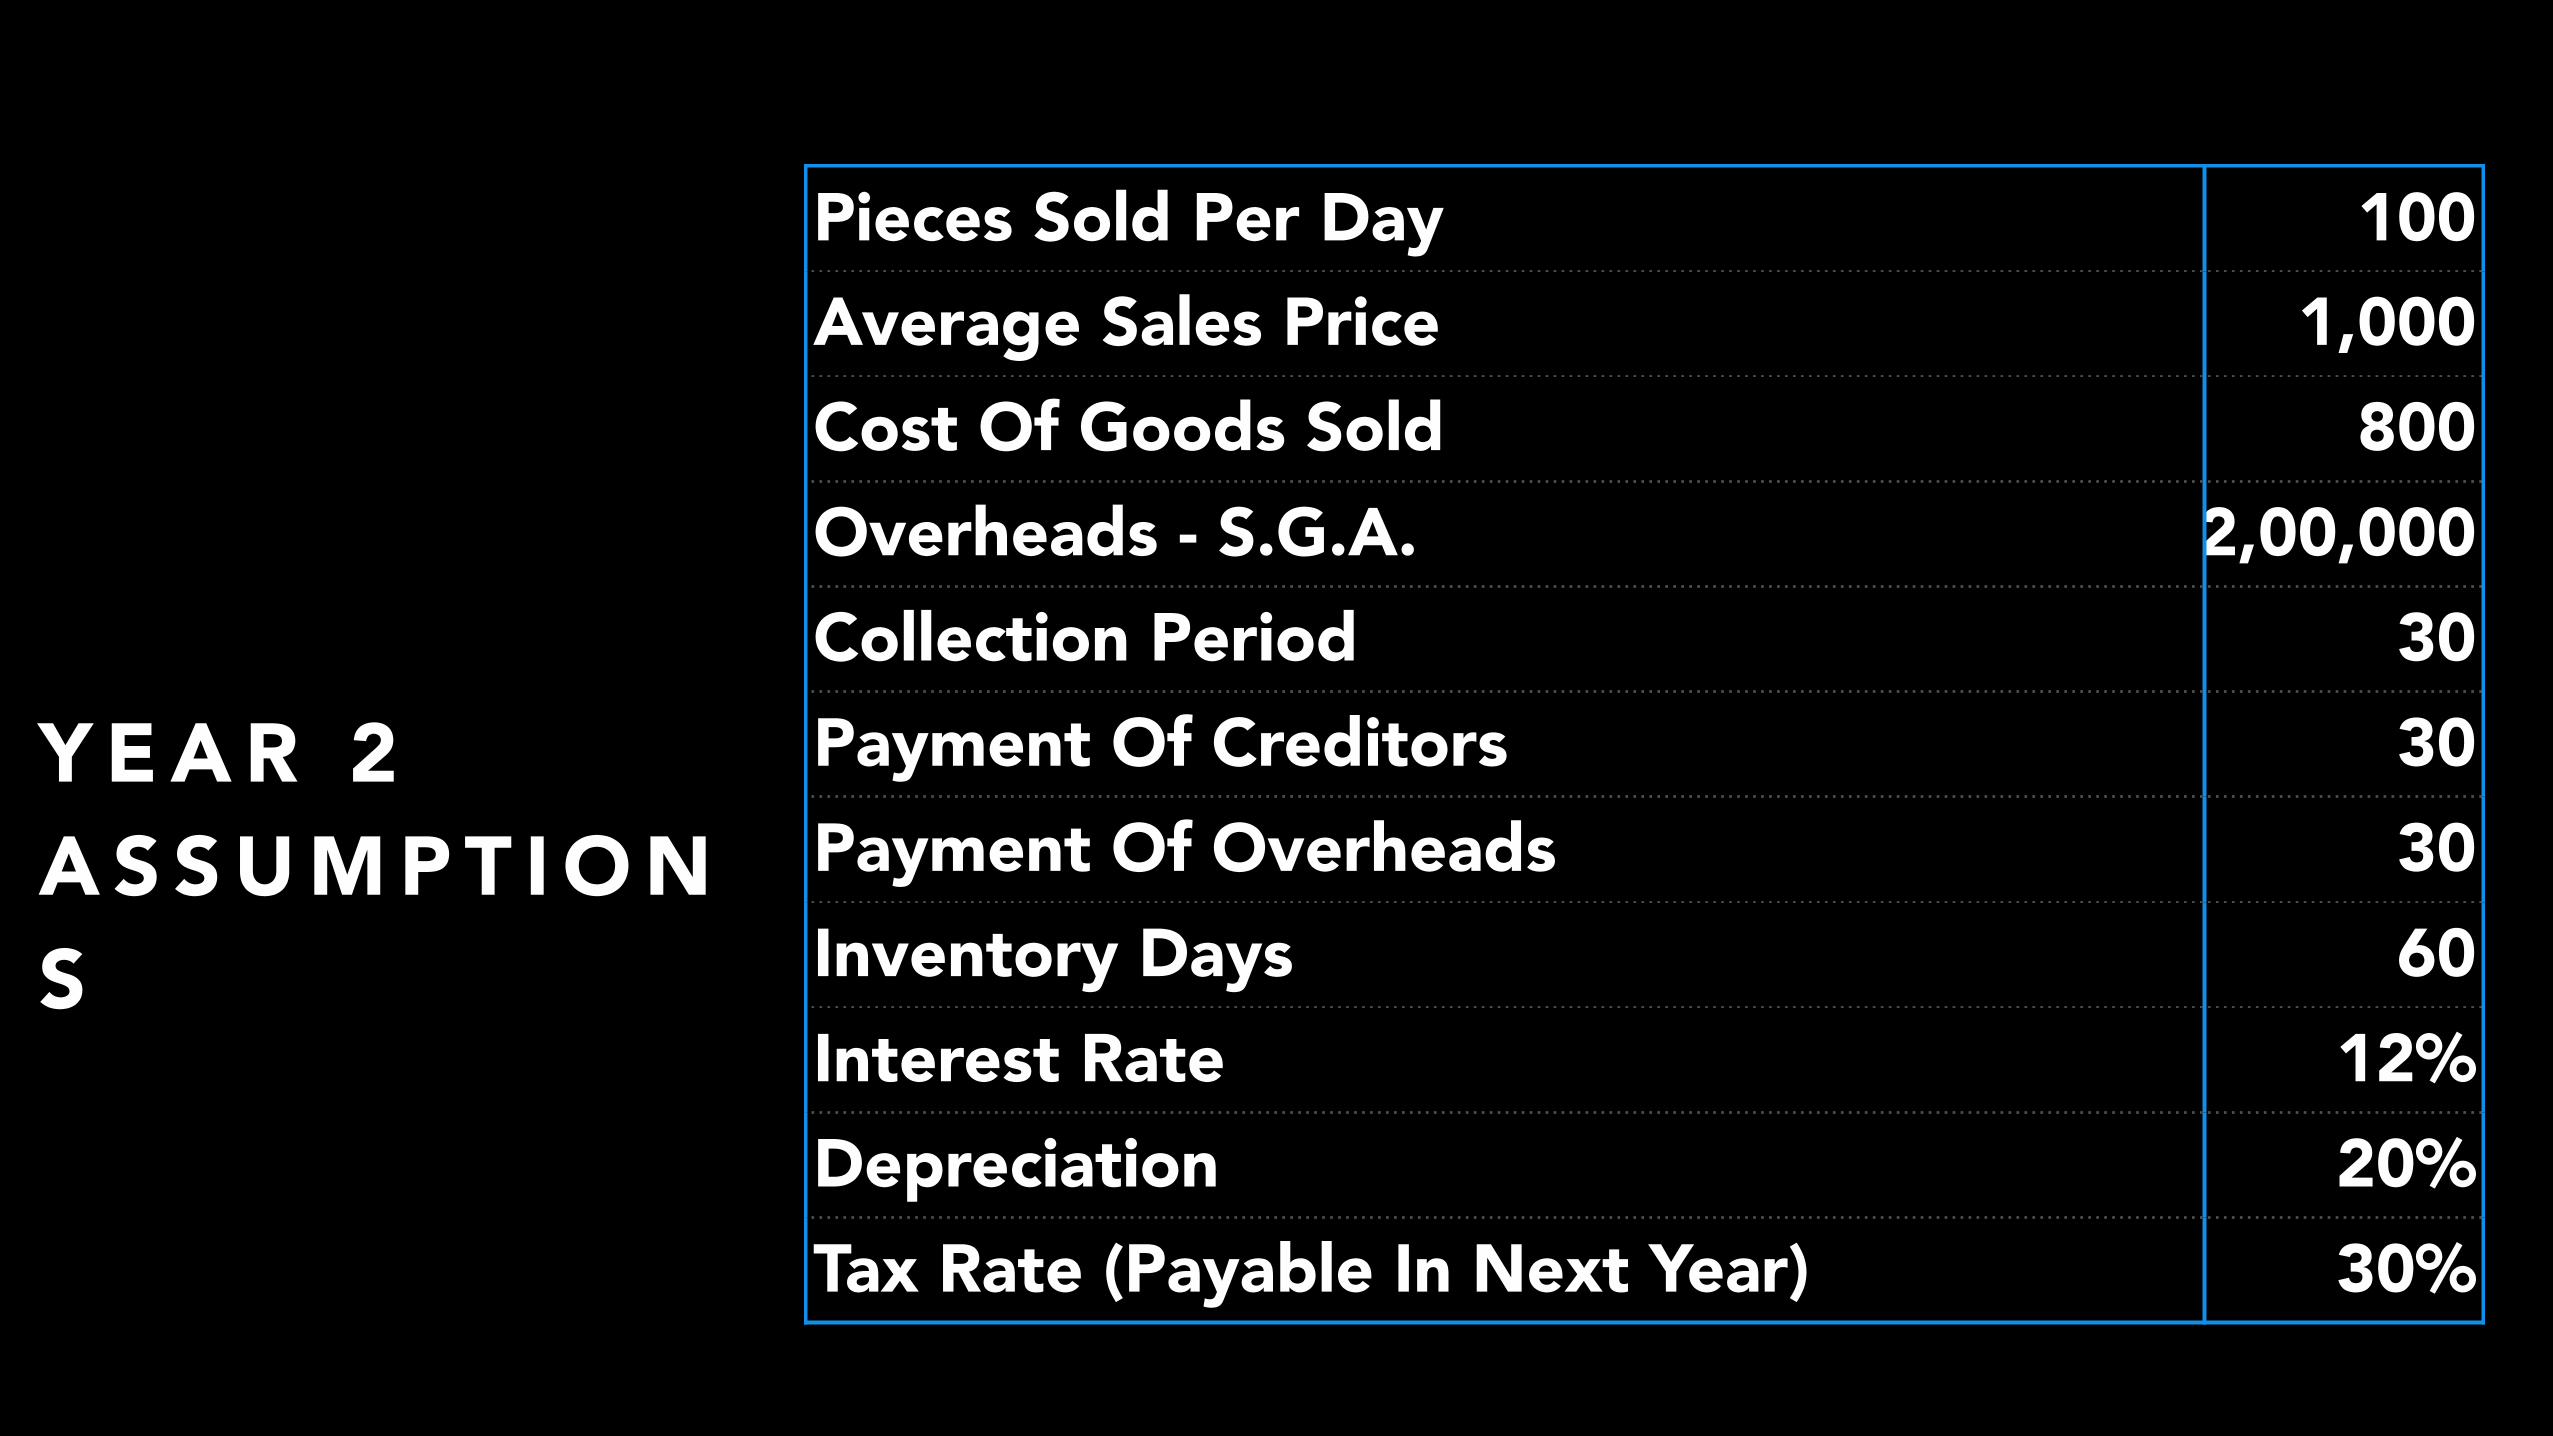
Y E A R 2 A S S U M P T I O NS
Pieces Sold Per Day 100Average Sales Price 1,000Cost Of Goods Sold 800Overheads - S.G.A. 2,00,000Collection Period 30Payment Of Creditors 30Payment Of Overheads 30Inventory Days 60Interest Rate 12%Depreciation 20%Tax Rate (Payable In Next Year) 30%
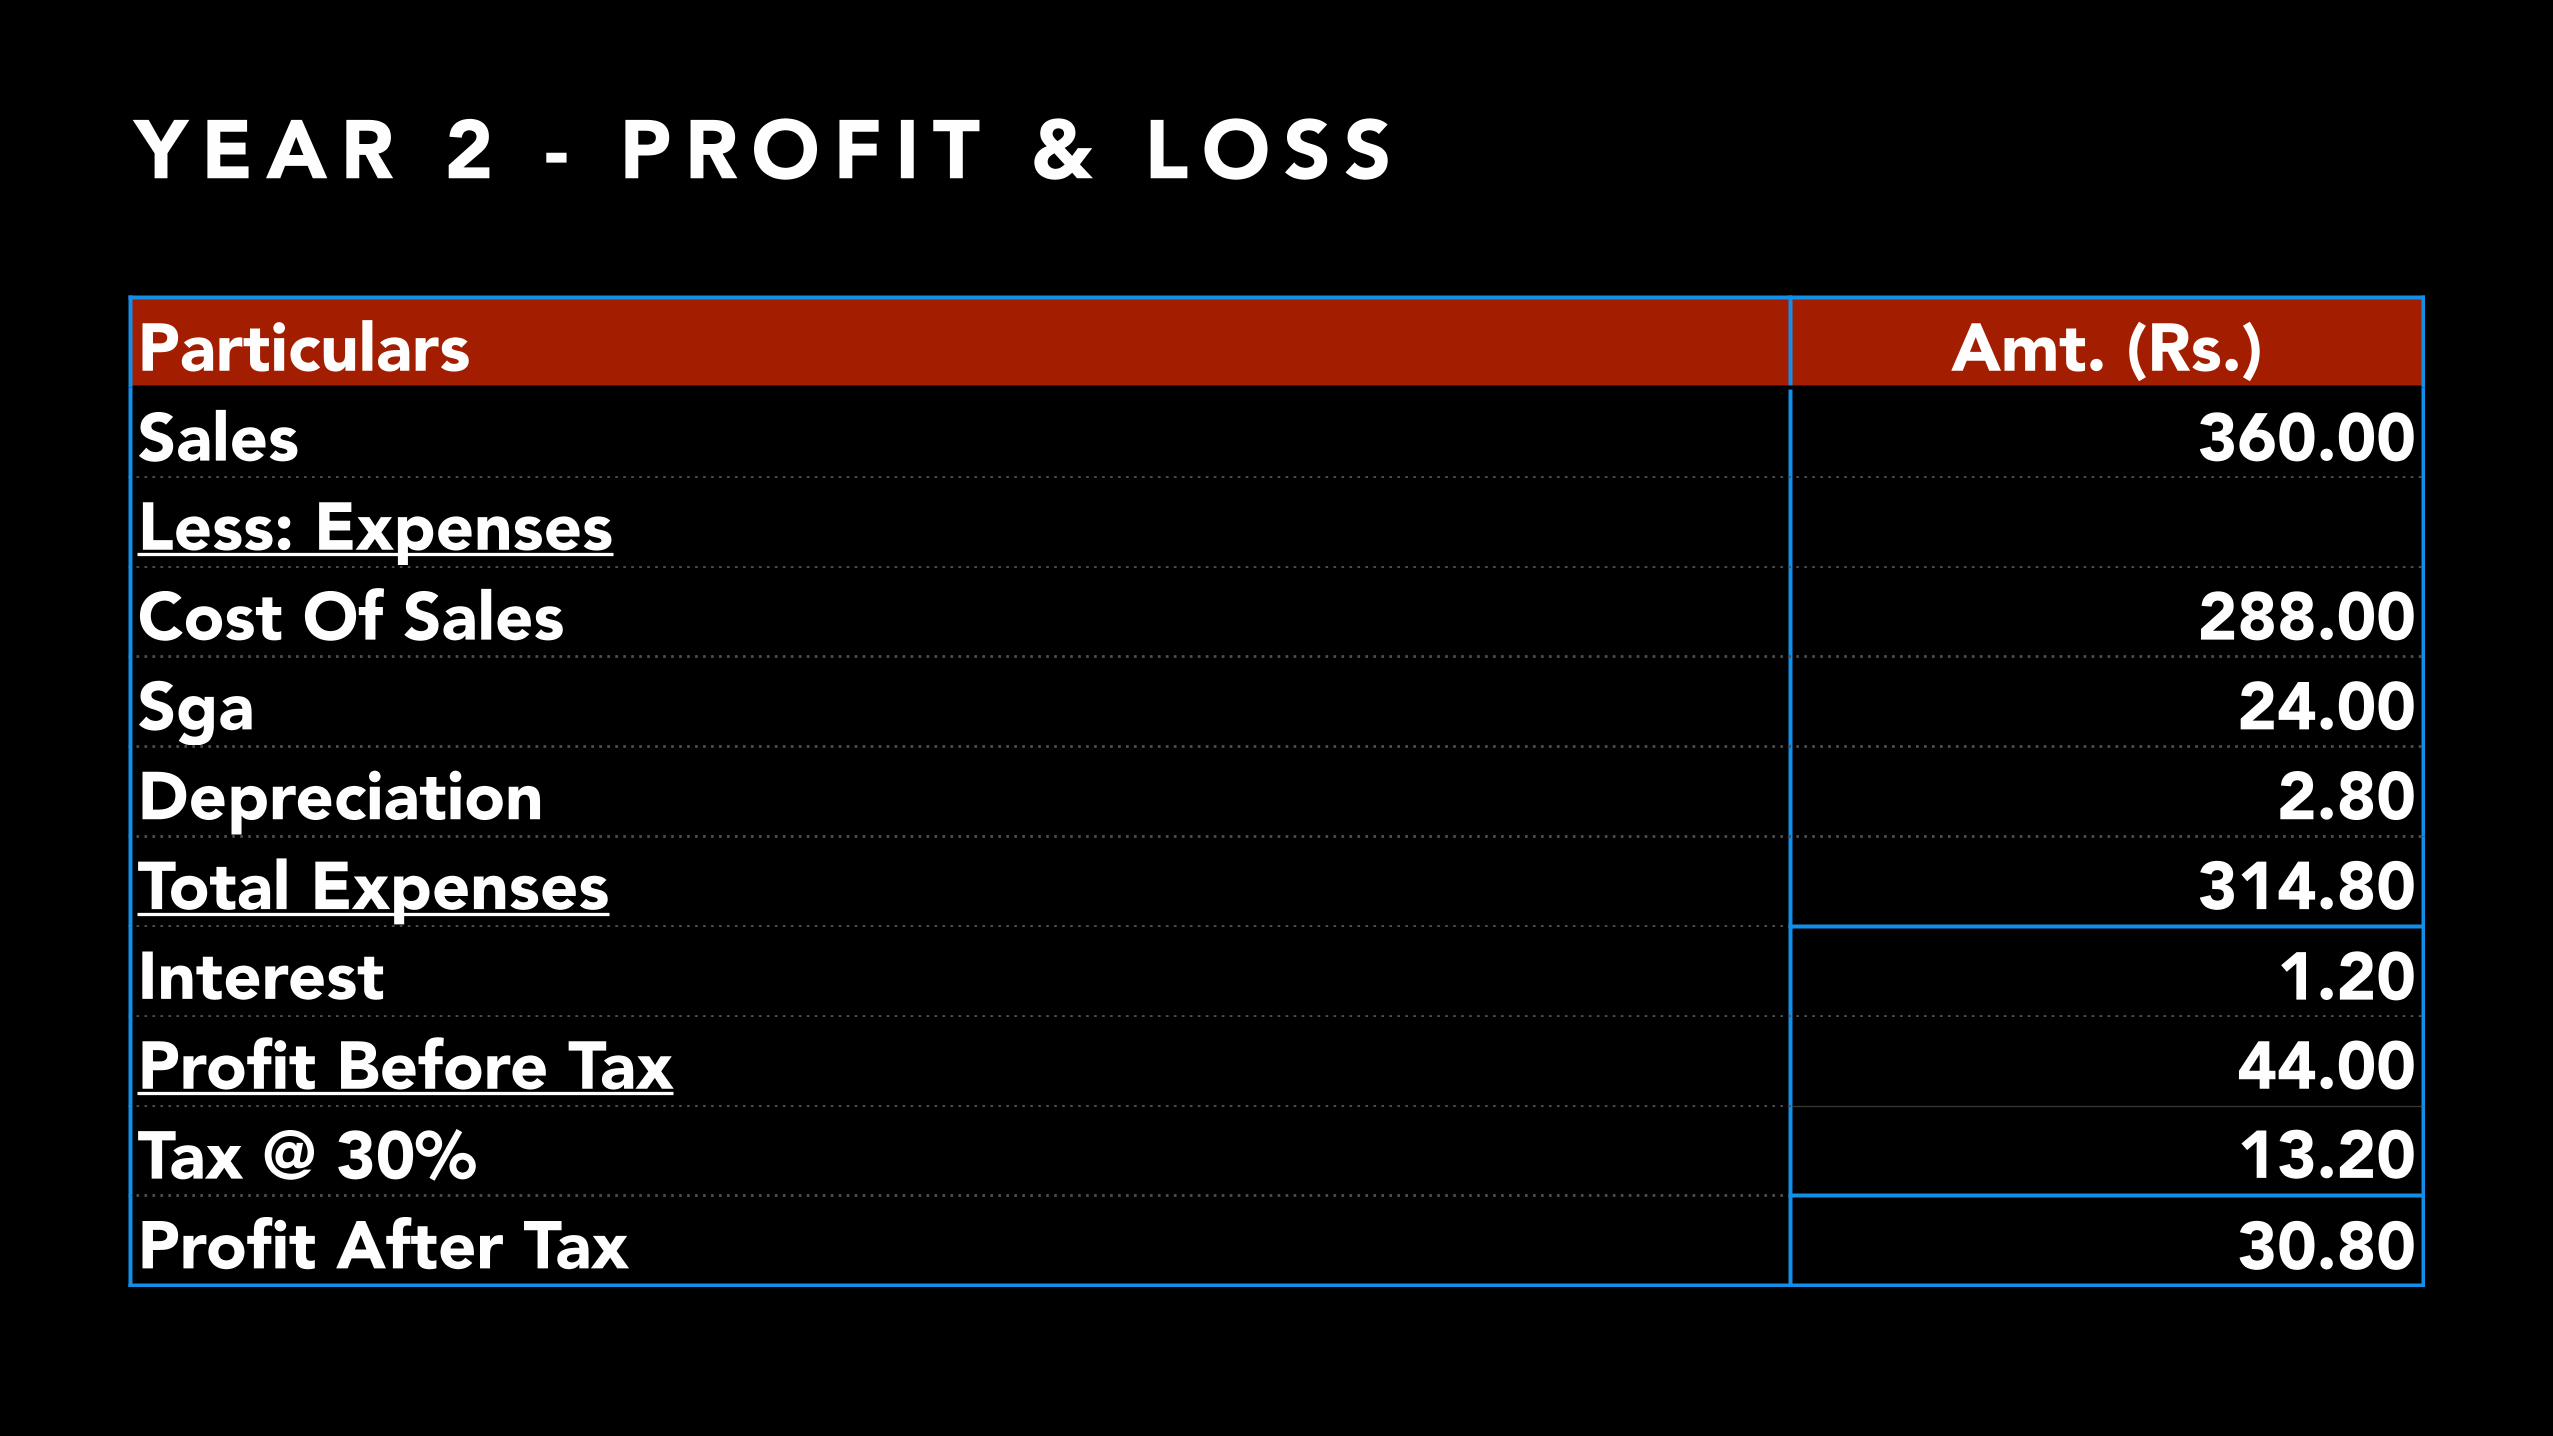
Y E A R 2 - P R O F I T & L O S S
Particulars Amt. (Rs.)Sales 360.00Less: ExpensesCost Of Sales 288.00Sga 24.00Depreciation 2.80Total Expenses 314.80Interest 1.20Profit Before Tax 44.00Tax @ 30% 13.20Profit After Tax 30.80
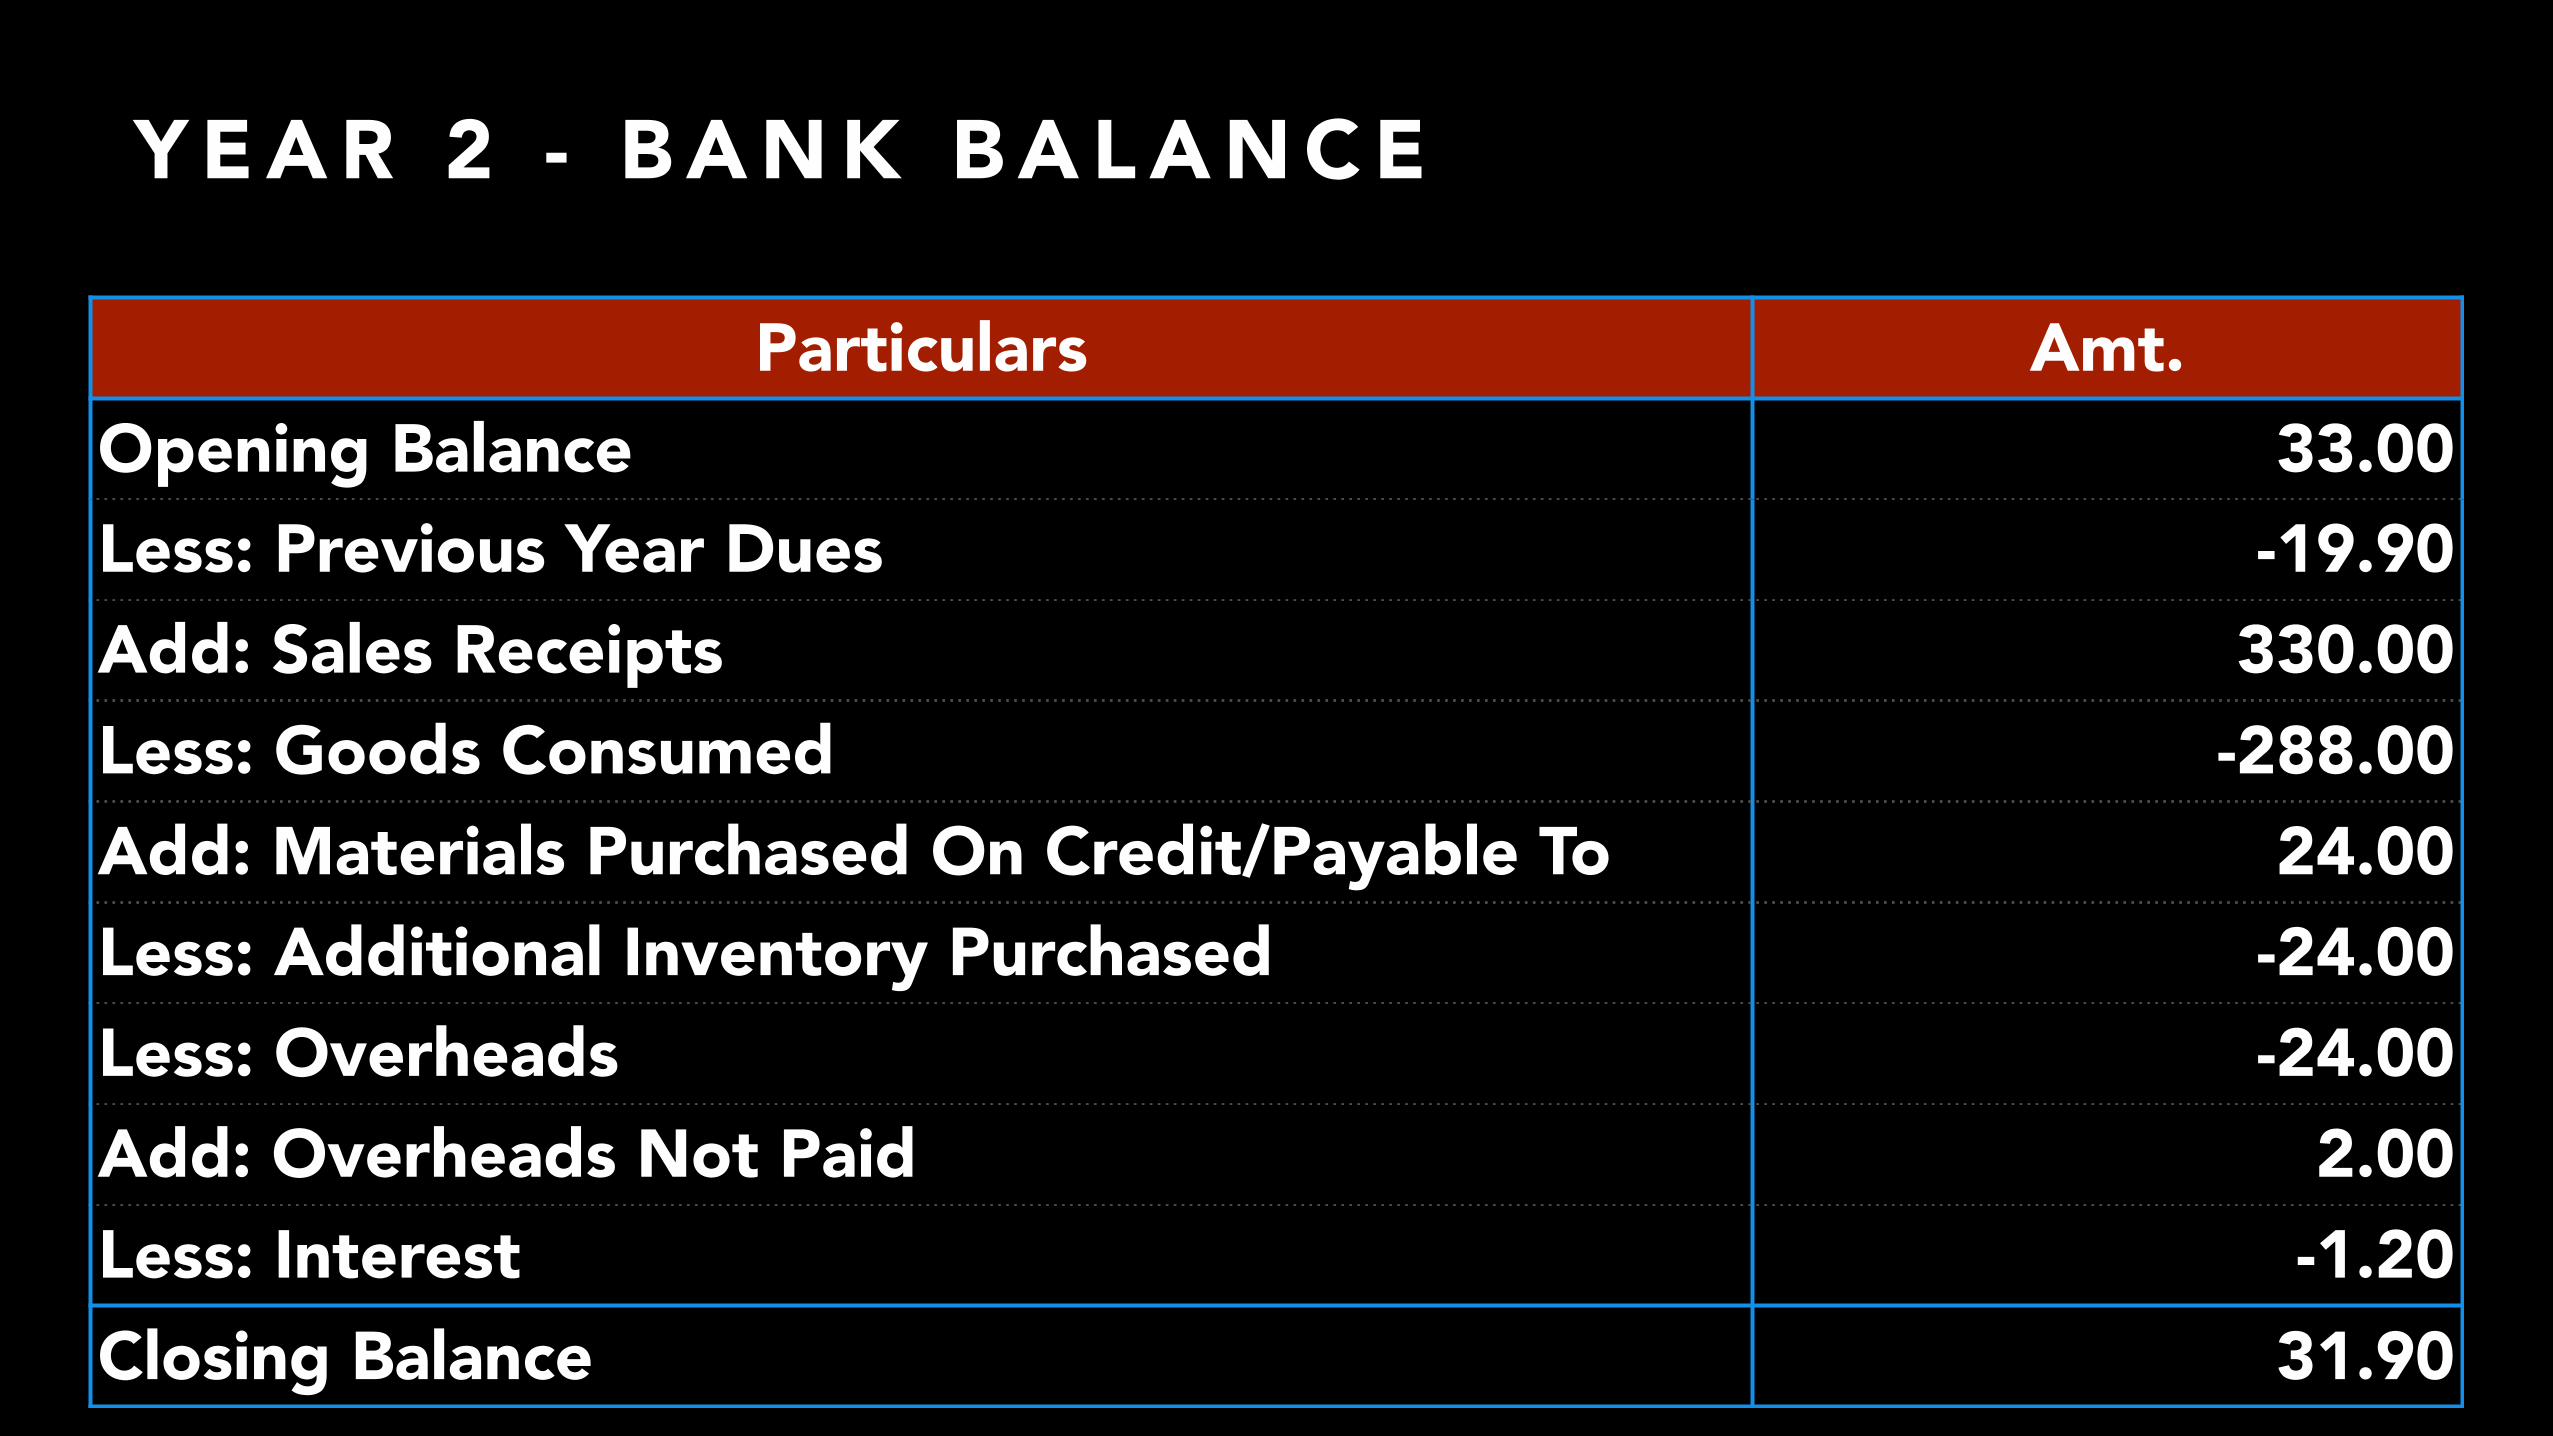
Y E A R 2 - B A N K B A L A N C E
Particulars Amt.Opening Balance 33.00Less: Previous Year Dues -19.90Add: Sales Receipts 330.00Less: Goods Consumed -288.00Add: Materials Purchased On Credit/Payable To Vendor
24.00Less: Additional Inventory Purchased -24.00Less: Overheads -24.00Add: Overheads Not Paid 2.00Less: Interest -1.20Closing Balance 31.90
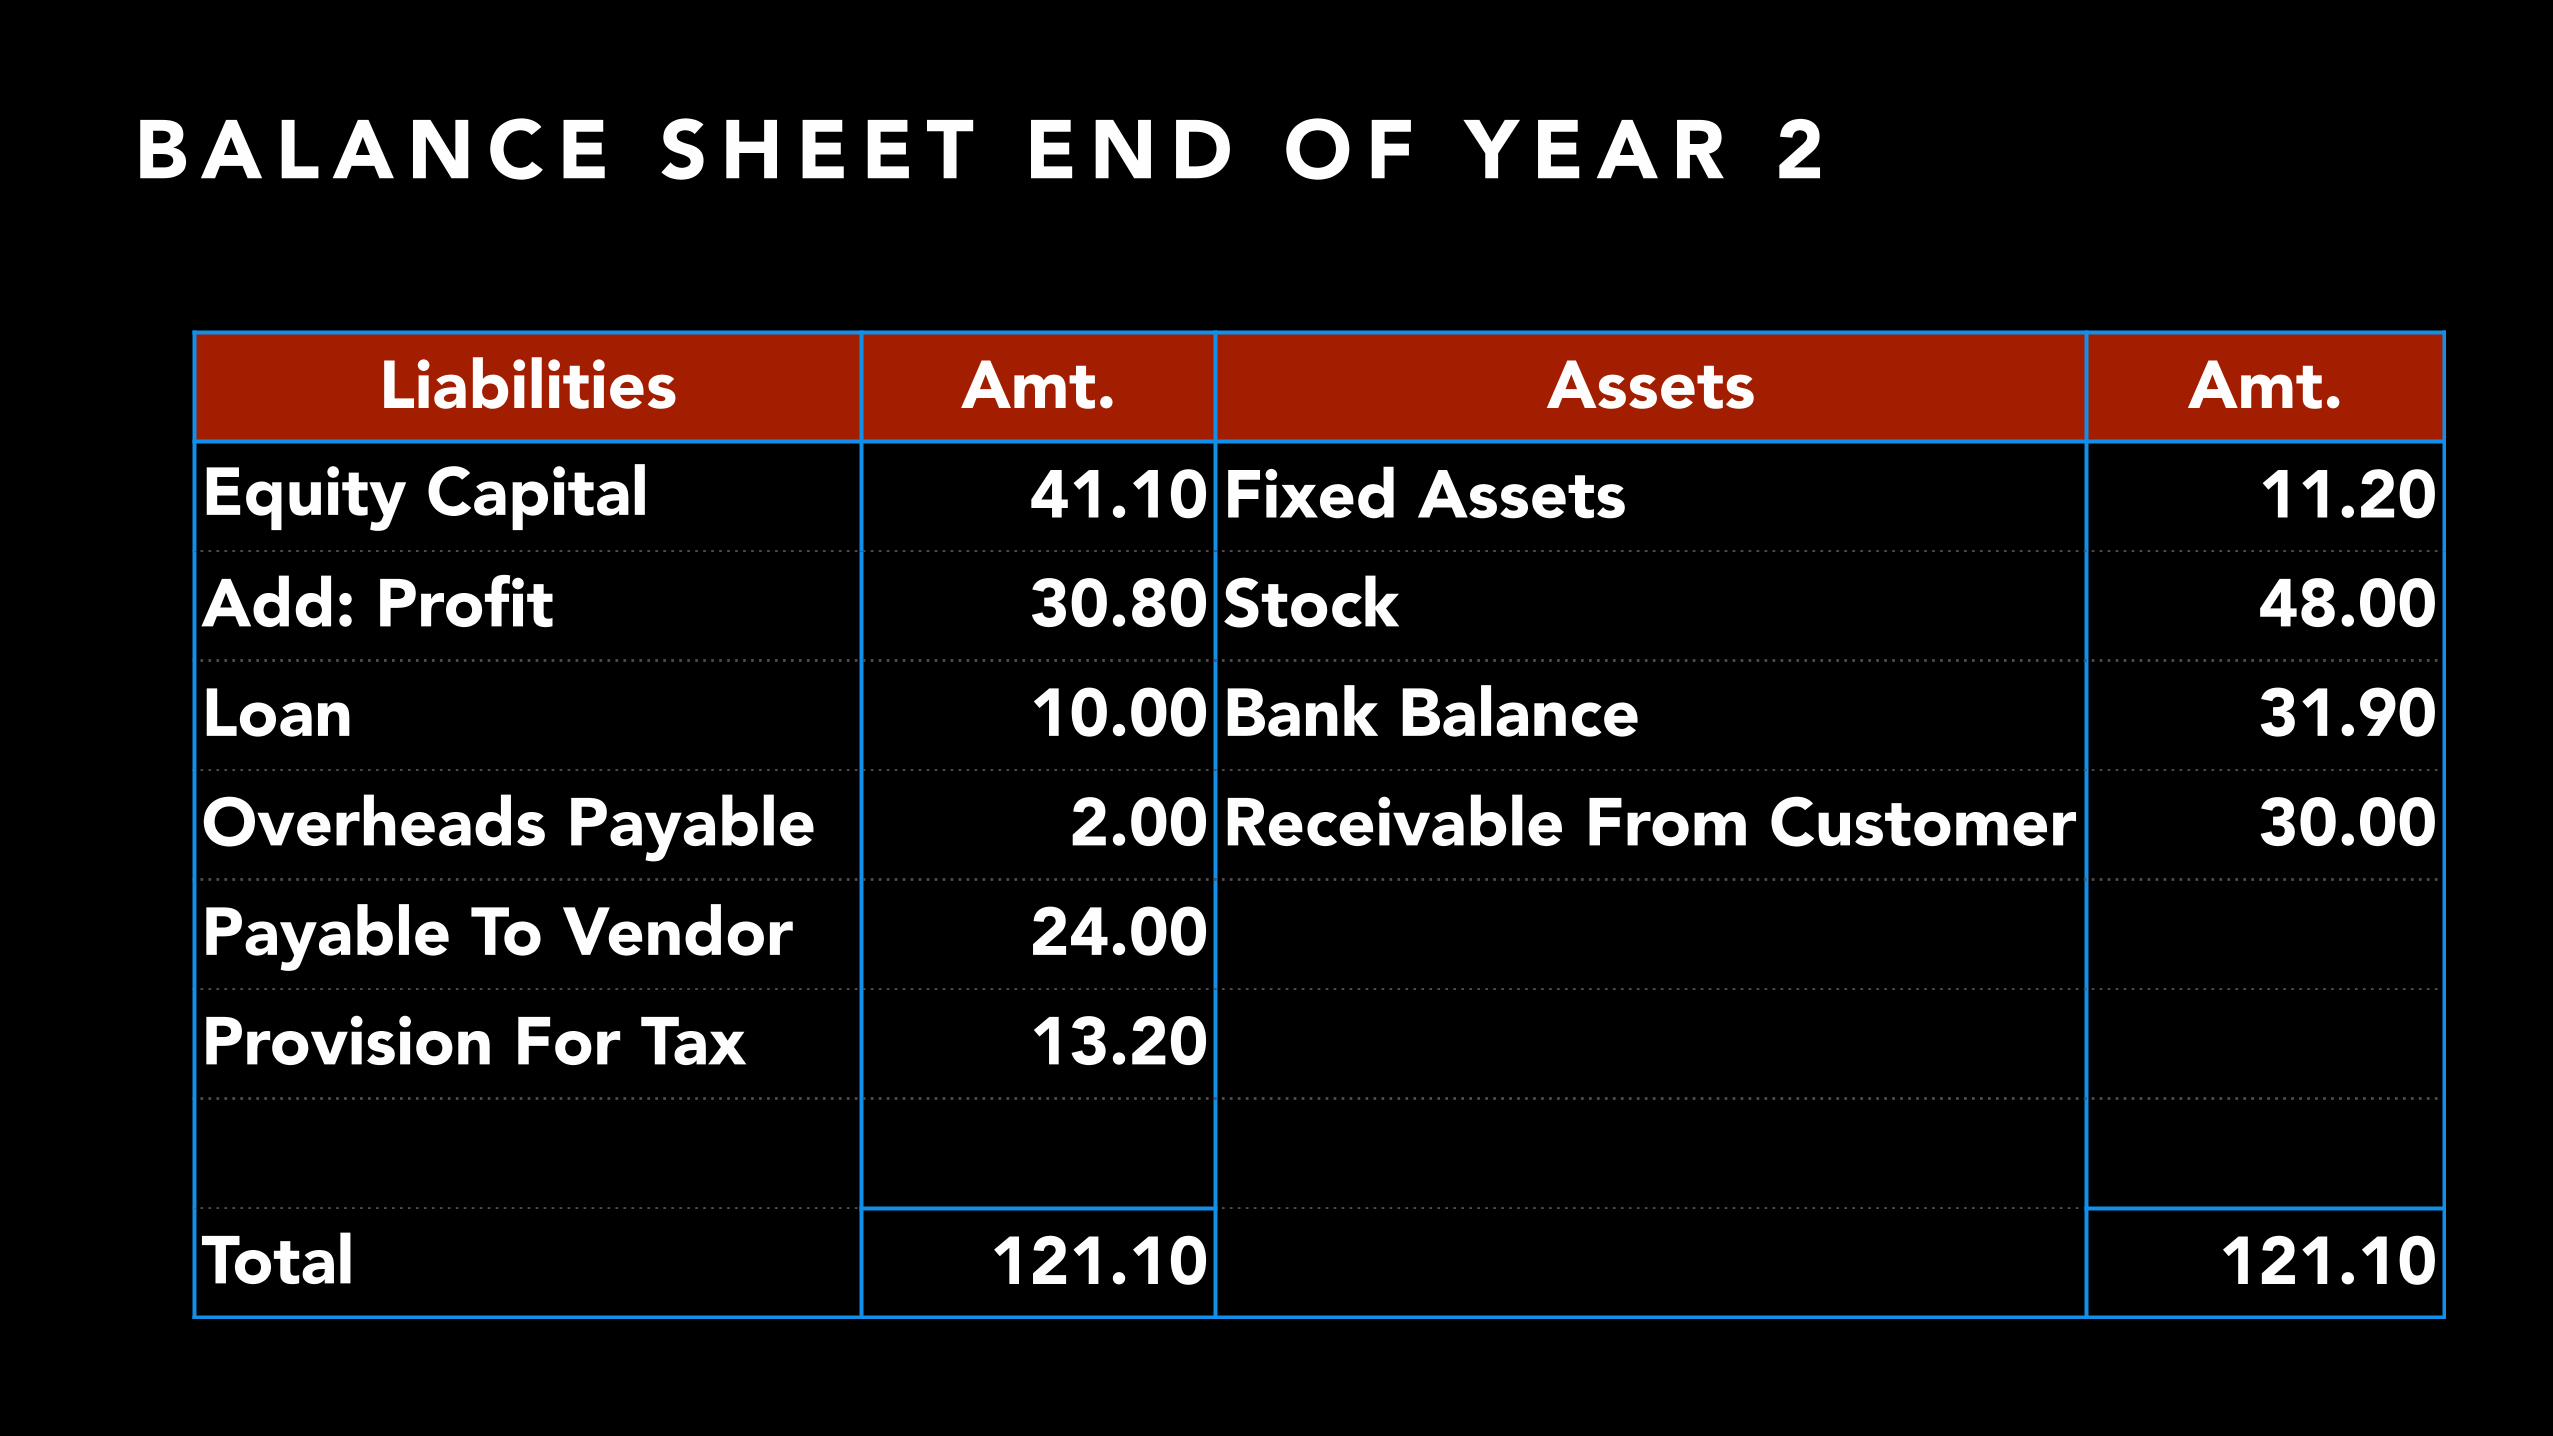
B A L A N C E S H E E T E N D O F Y E A R 2
Liabilities Amt. Assets Amt.Equity Capital 41.10 Fixed Assets 11.20Add: Profit 30.80 Stock 48.00Loan 10.00 Bank Balance 31.90Overheads Payable 2.00 Receivable From Customer 30.00Payable To Vendor 24.00Provision For Tax 13.20
Total 121.10 121.10
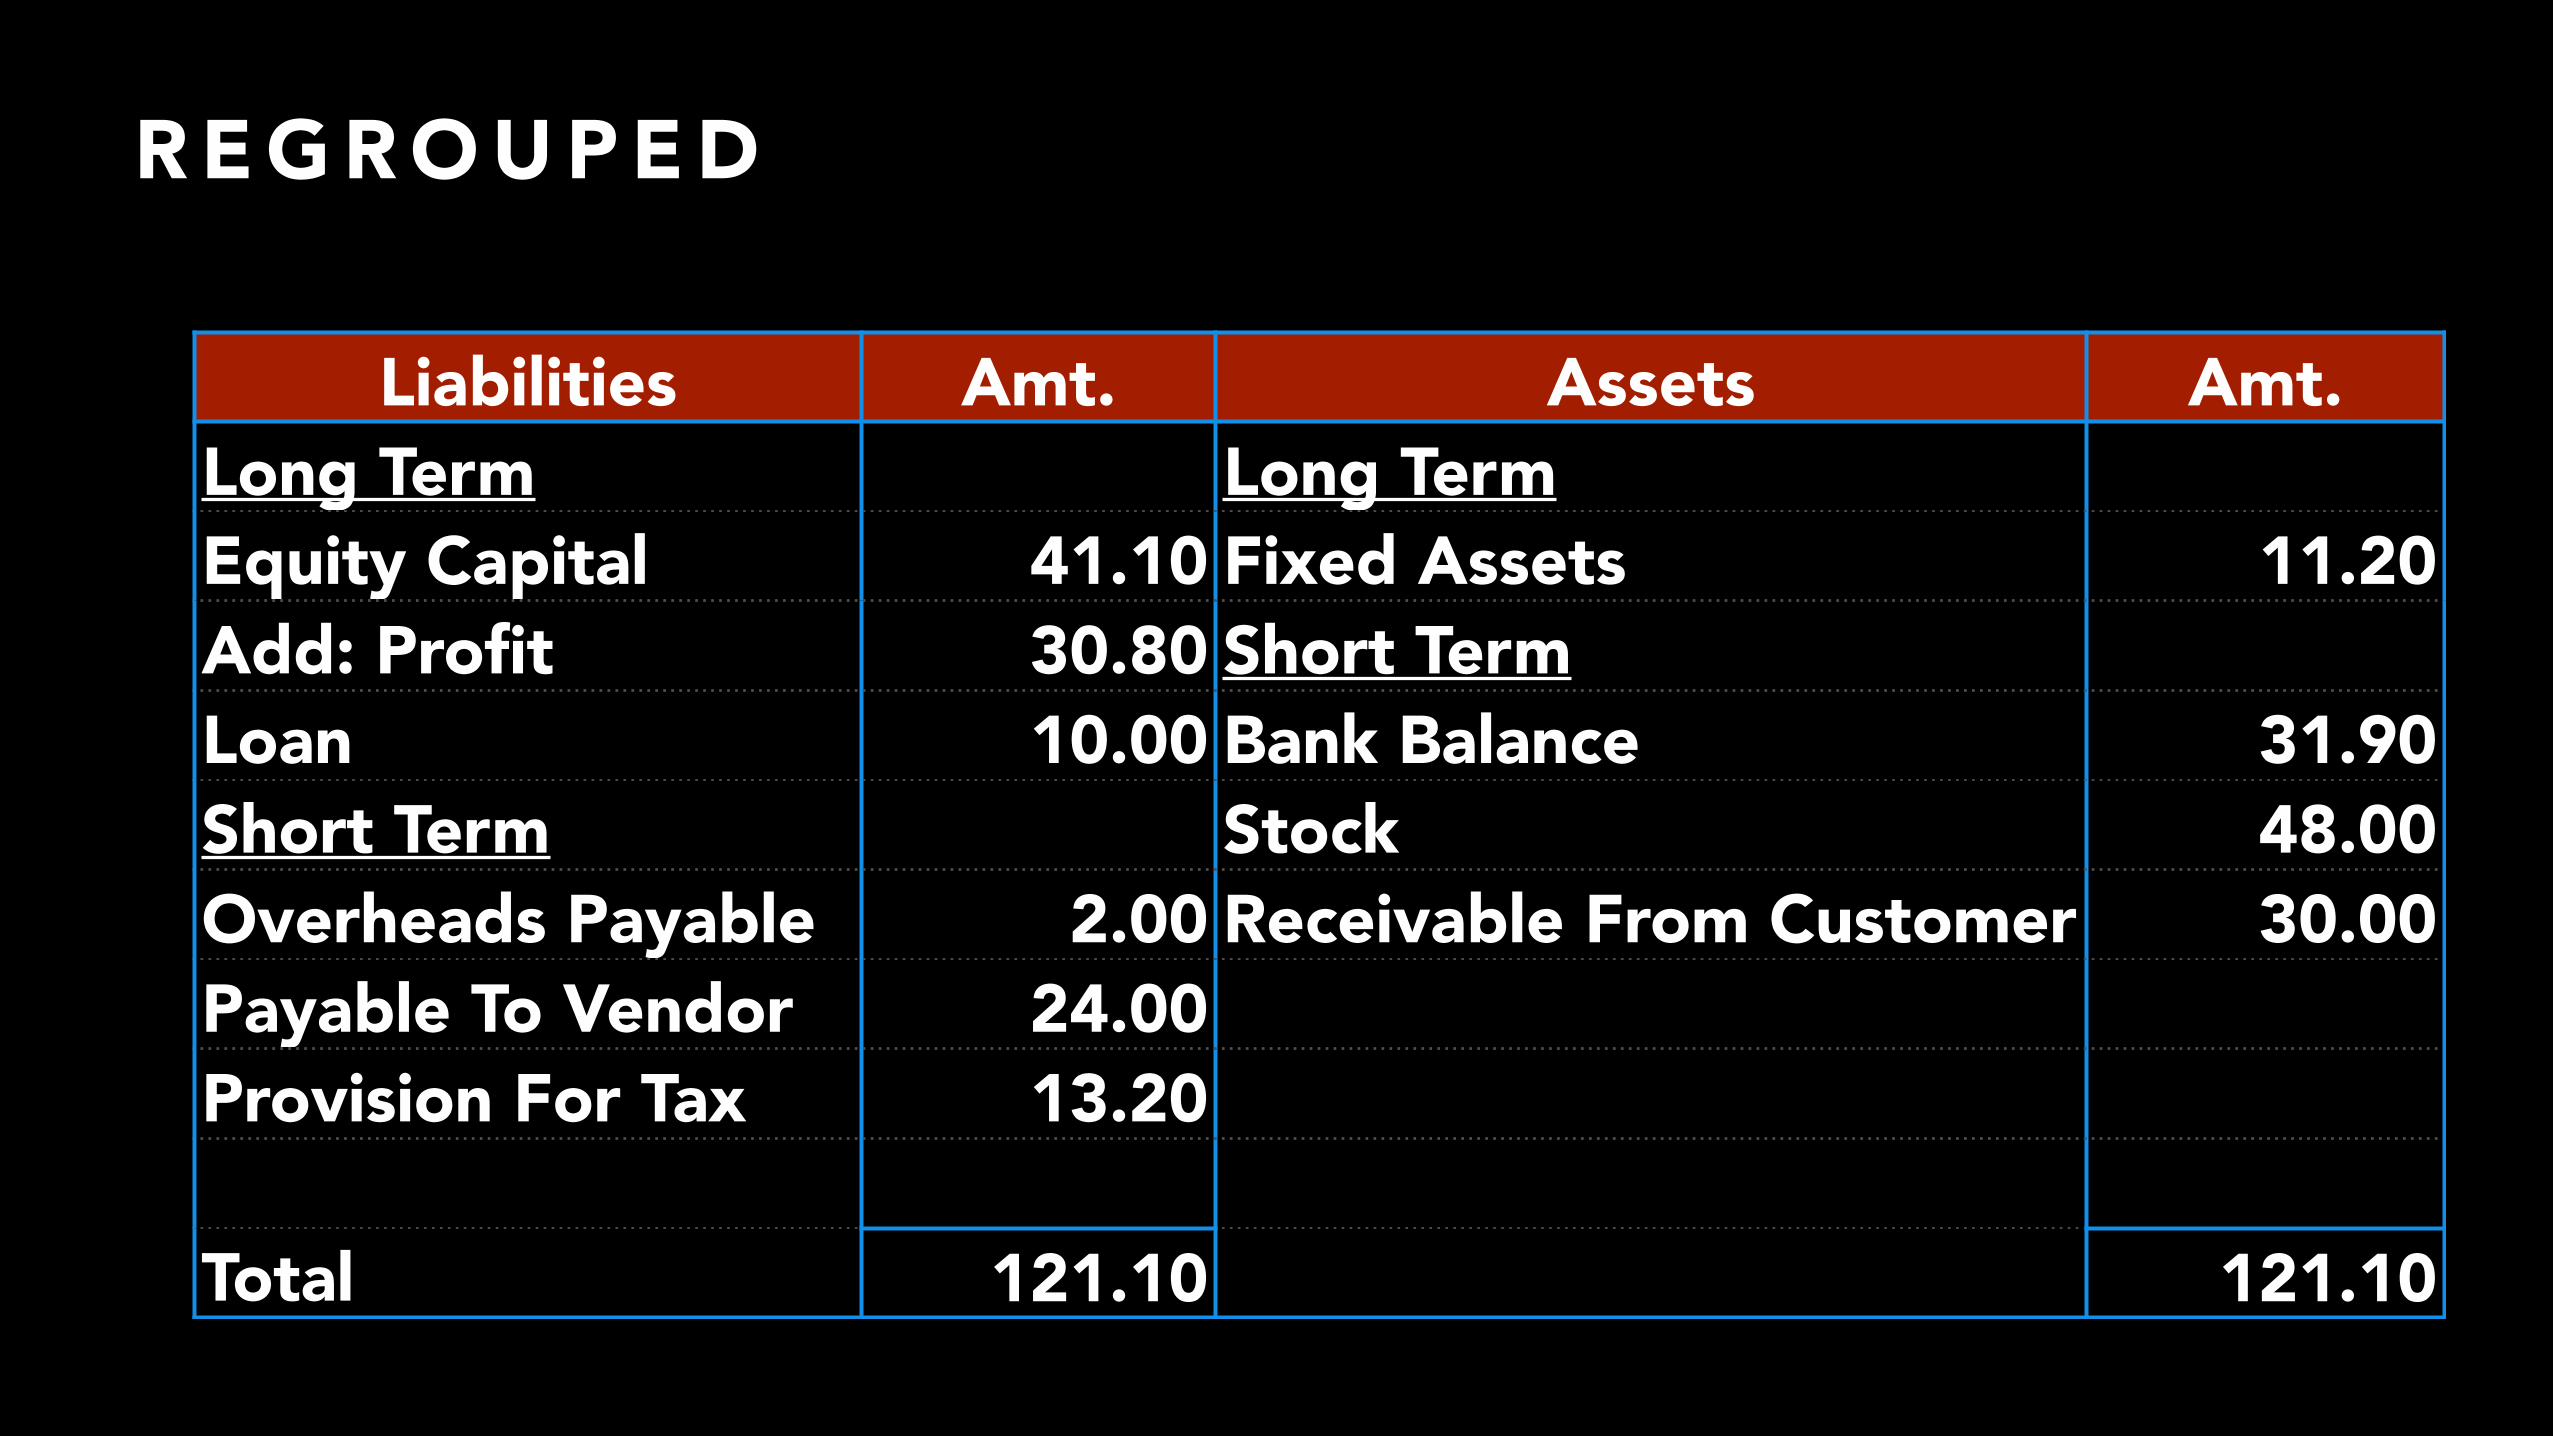
R E G R O U P E D
Liabilities Amt. Assets Amt.Long Term Long TermEquity Capital 41.10 Fixed Assets 11.20Add: Profit 30.80 Short Term Loan 10.00 Bank Balance 31.90Short Term Stock 48.00Overheads Payable 2.00 Receivable From Customer 30.00Payable To Vendor 24.00Provision For Tax 13.20
Total 121.10 121.10
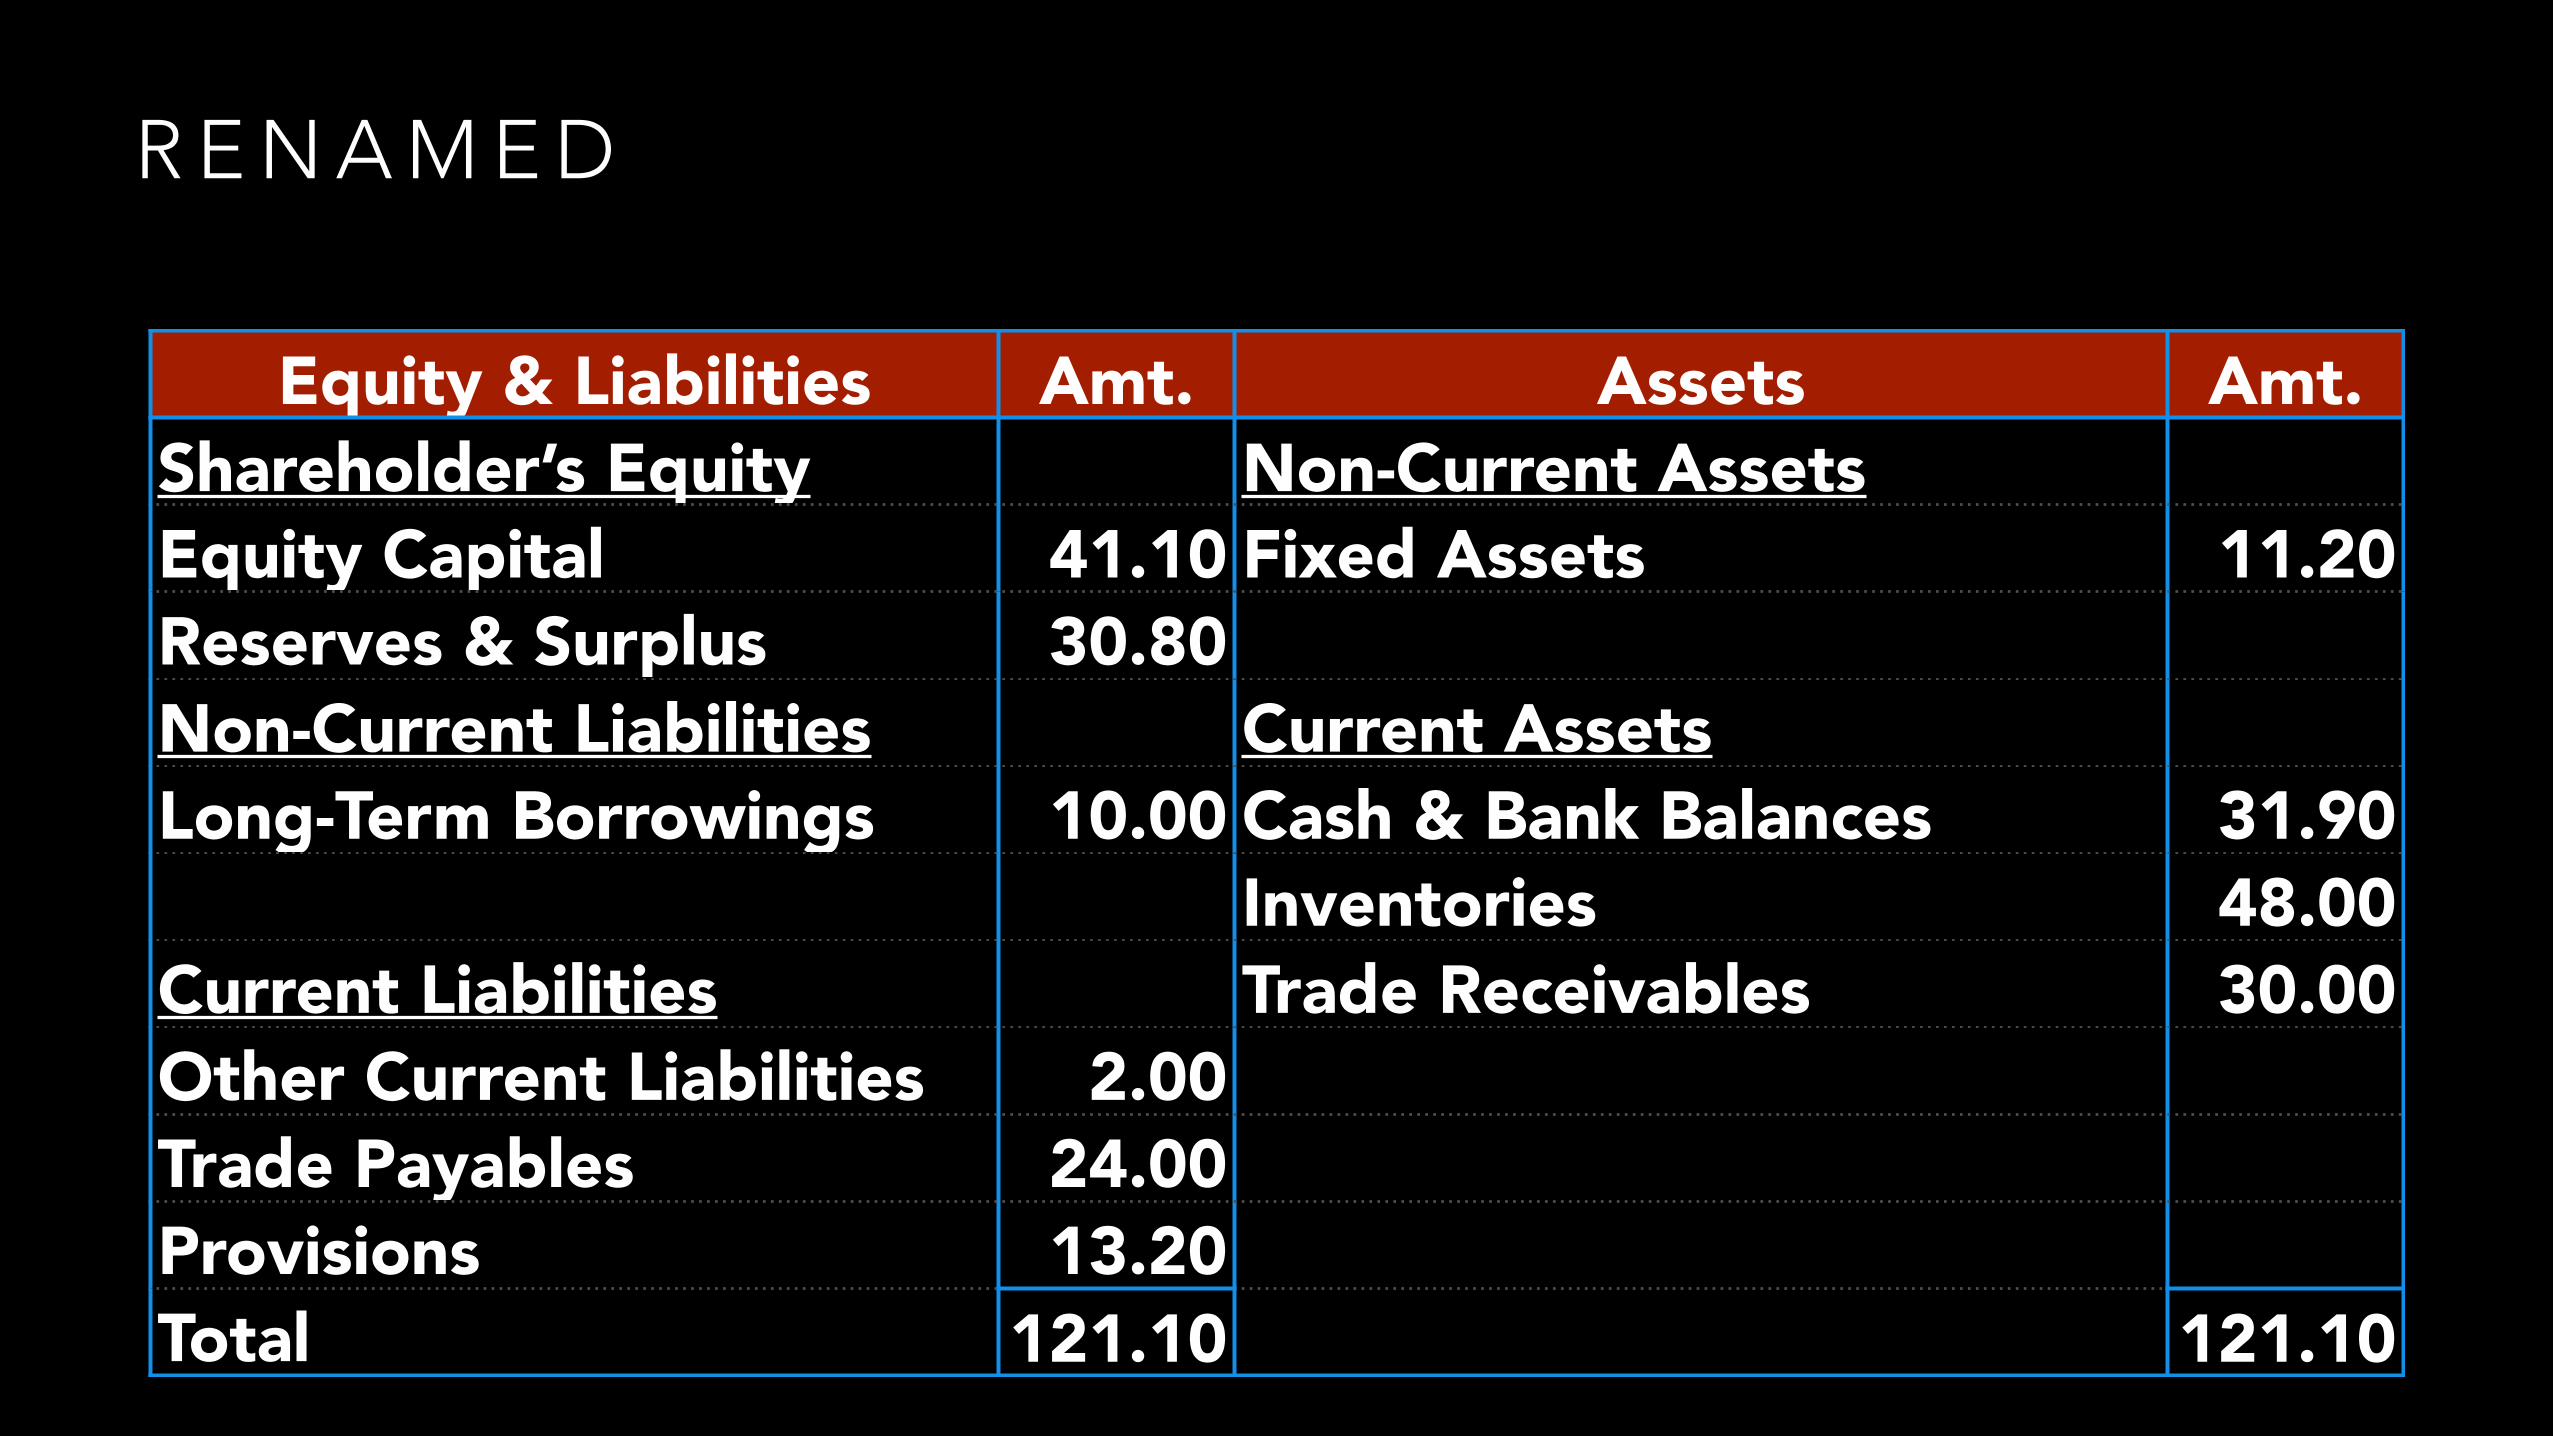
R E N A M E D
Equity & Liabilities Amt. Assets Amt.Shareholder’s Equity Non-Current AssetsEquity Capital 41.10 Fixed Assets 11.20Reserves & Surplus 30.80Non-Current Liabilities Current Assets Long-Term Borrowings 10.00 Cash & Bank Balances 31.90
Inventories 48.00Current Liabilities Trade Receivables 30.00Other Current Liabilities 2.00Trade Payables 24.00Provisions 13.20Total 121.10 121.10
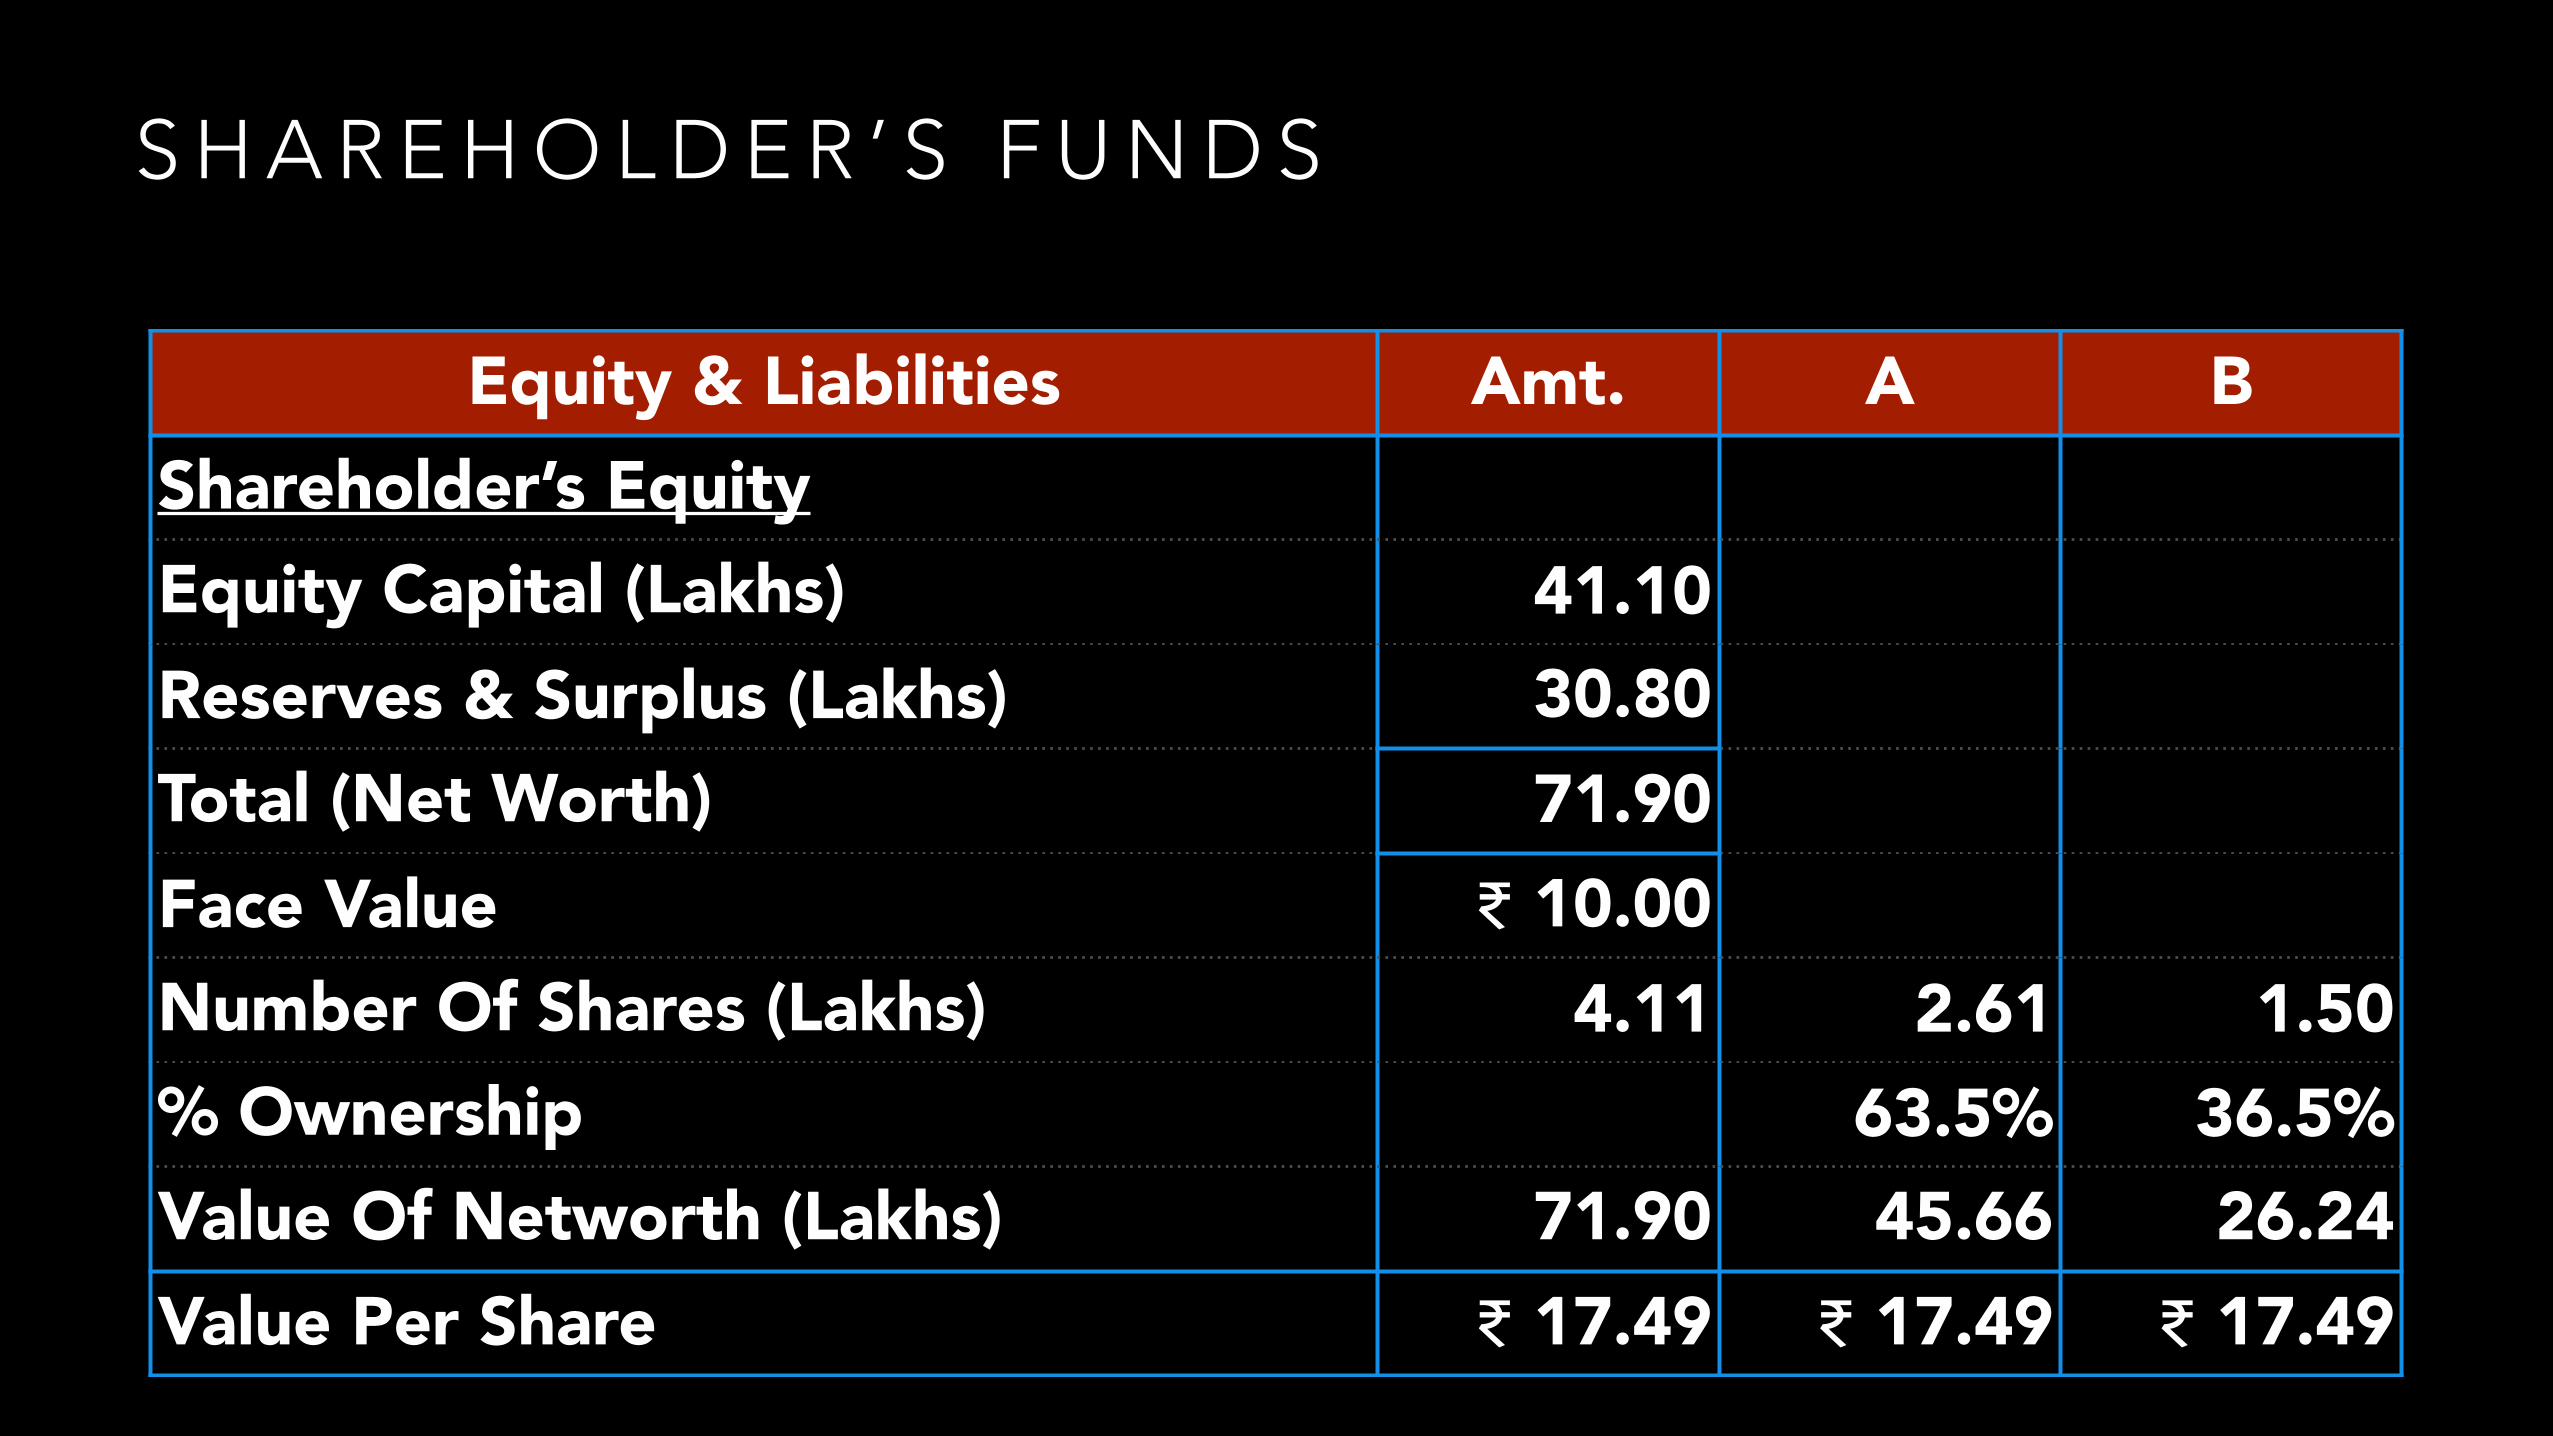
S H A R E H O L D E R ’ S F U N D S
Equity & Liabilities Amt. A BShareholder’s EquityEquity Capital (Lakhs) 41.10Reserves & Surplus (Lakhs) 30.80Total (Net Worth) 71.90Face Value ₹ 10.00Number Of Shares (Lakhs) 4.11 2.61 1.50% Ownership 63.5% 36.5%Value Of Networth (Lakhs) 71.90 45.66 26.24Value Per Share ₹ 17.49 ₹ 17.49 ₹ 17.49
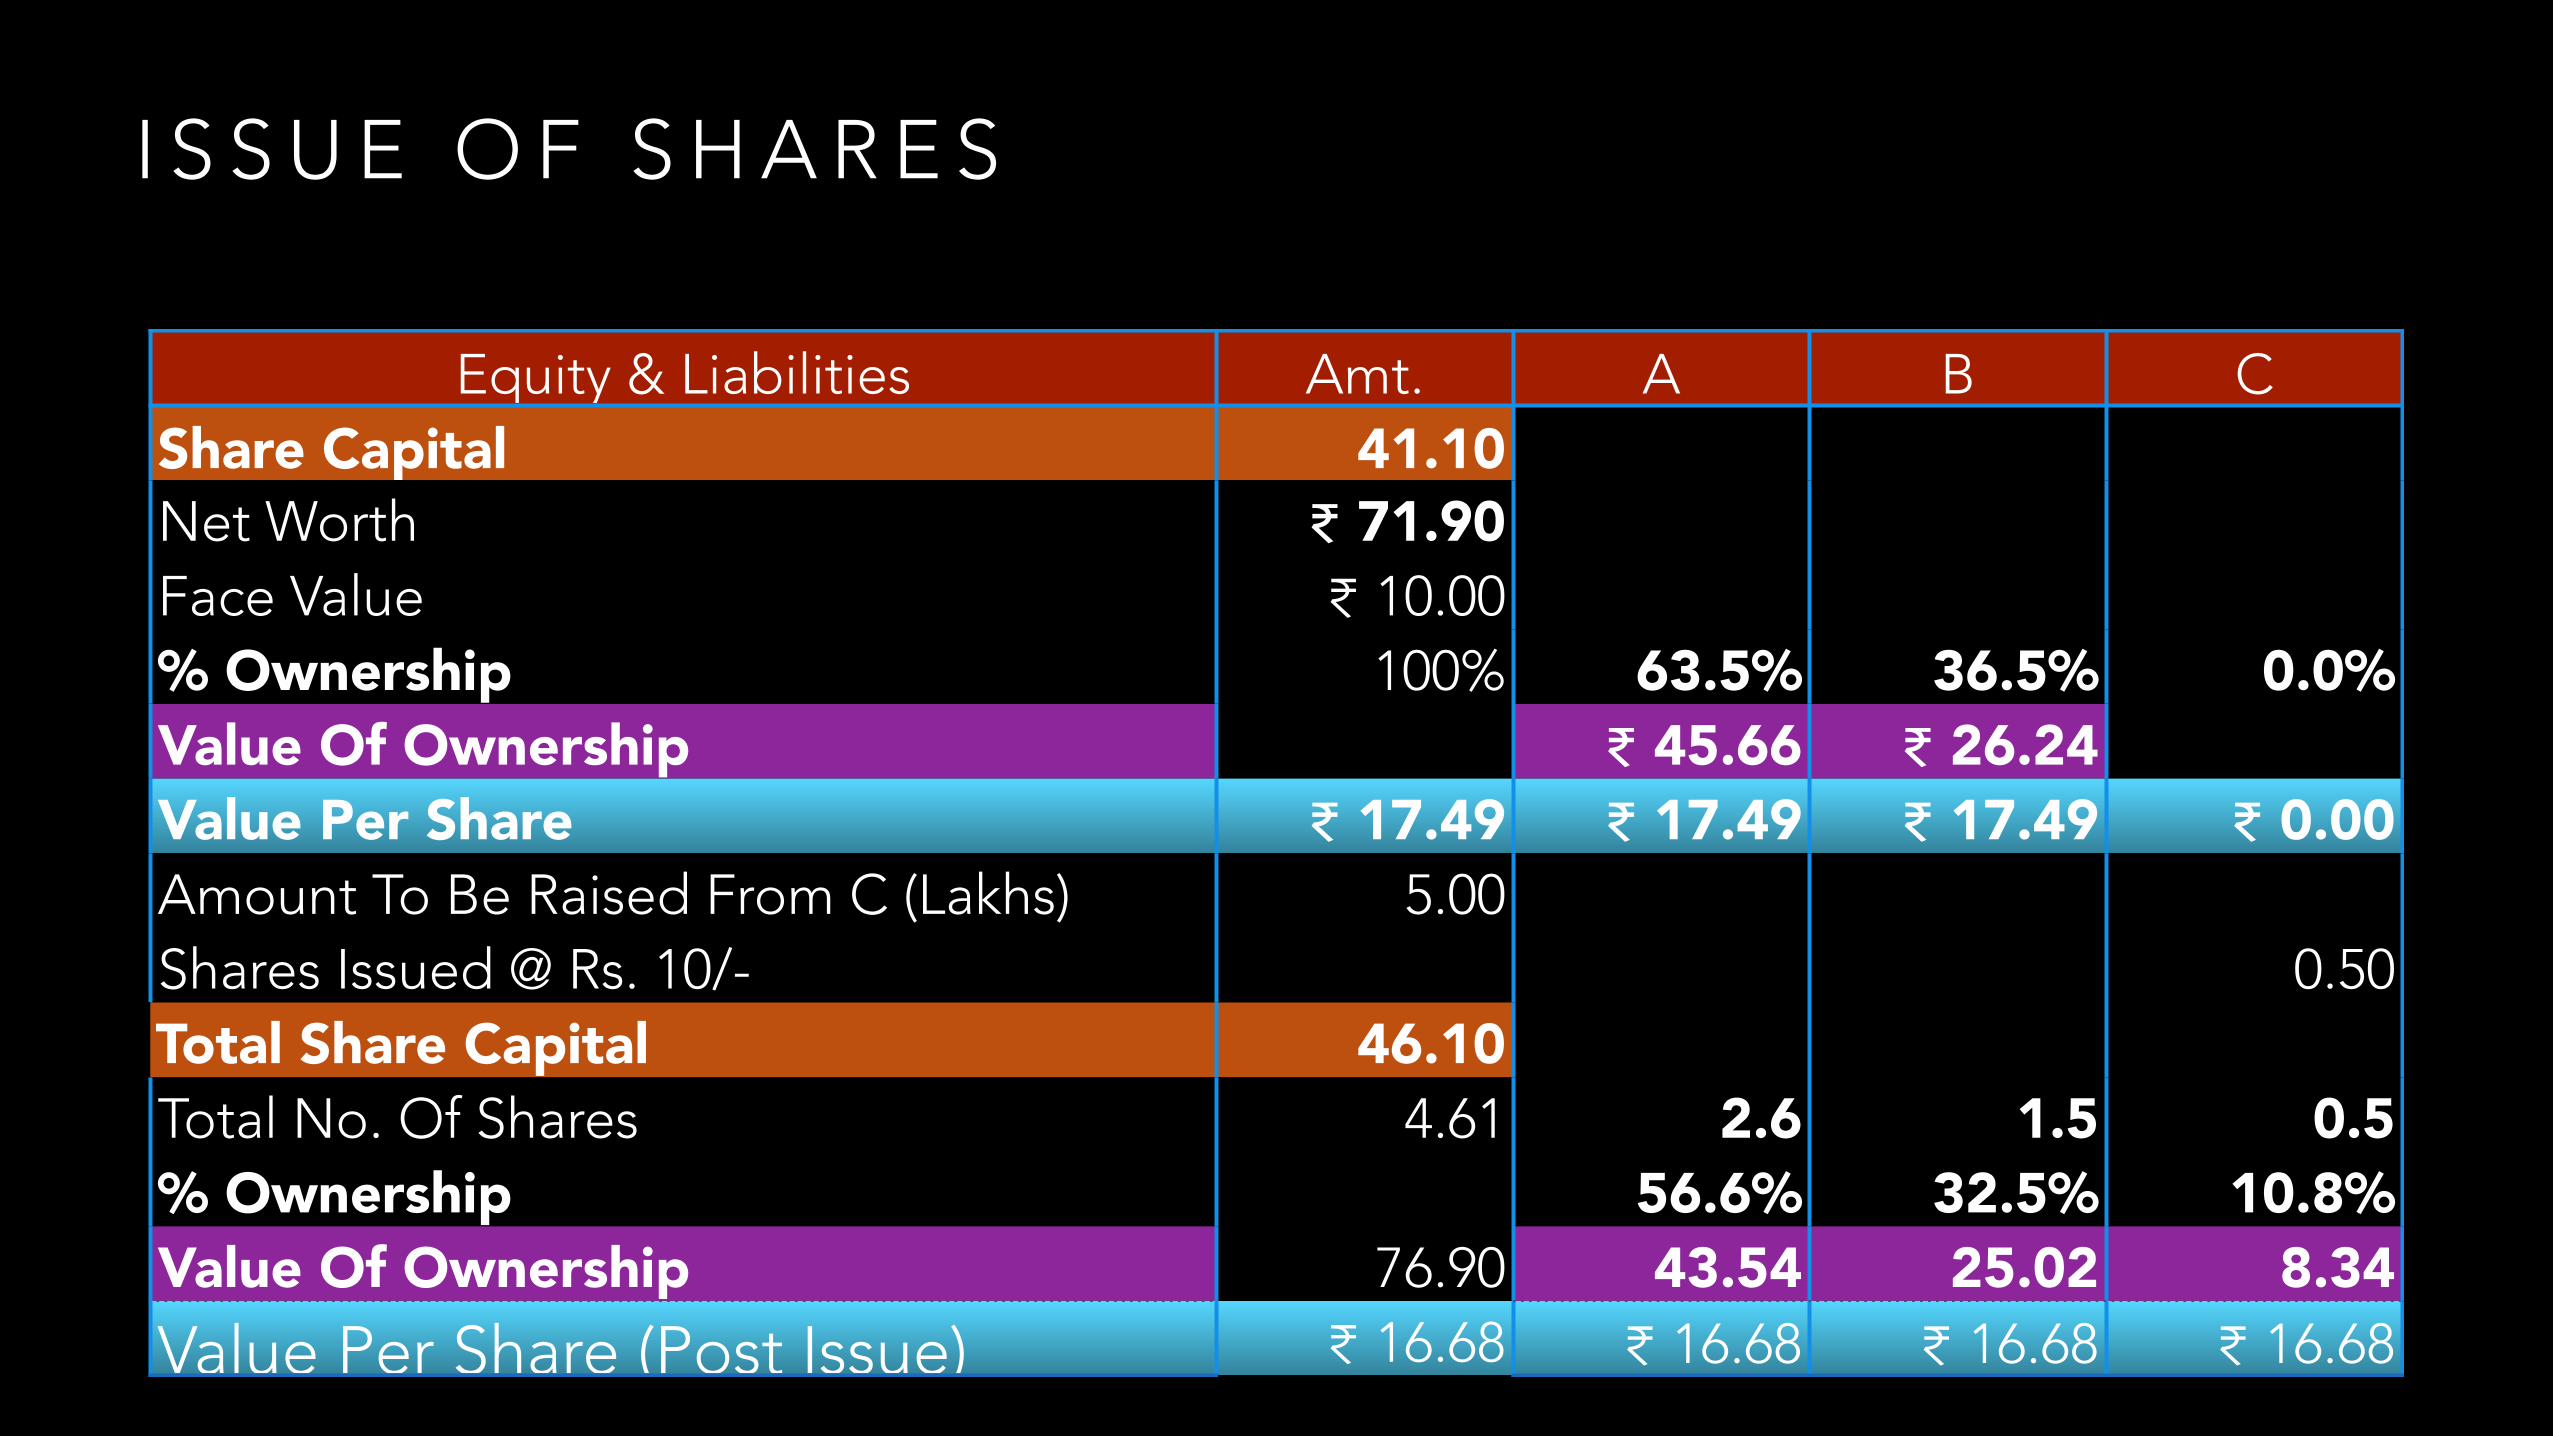
I S S U E O F S H A R E S
Equity & Liabilities Amt. A B CShare Capital 41.10Net Worth ₹ 71.90Face Value ₹ 10.00% Ownership 100% 63.5% 36.5% 0.0%Value Of Ownership ₹ 45.66 ₹ 26.24Value Per Share ₹ 17.49 ₹ 17.49 ₹ 17.49 ₹ 0.00Amount To Be Raised From C (Lakhs) 5.00Shares Issued @ Rs. 10/- 0.50Total Share Capital 46.10Total No. Of Shares 4.61 2.6 1.5 0.5% Ownership 56.6% 32.5% 10.8%Value Of Ownership 76.90 43.54 25.02 8.34Value Per Share (Post Issue) ₹ 16.68 ₹ 16.68 ₹ 16.68 ₹ 16.68
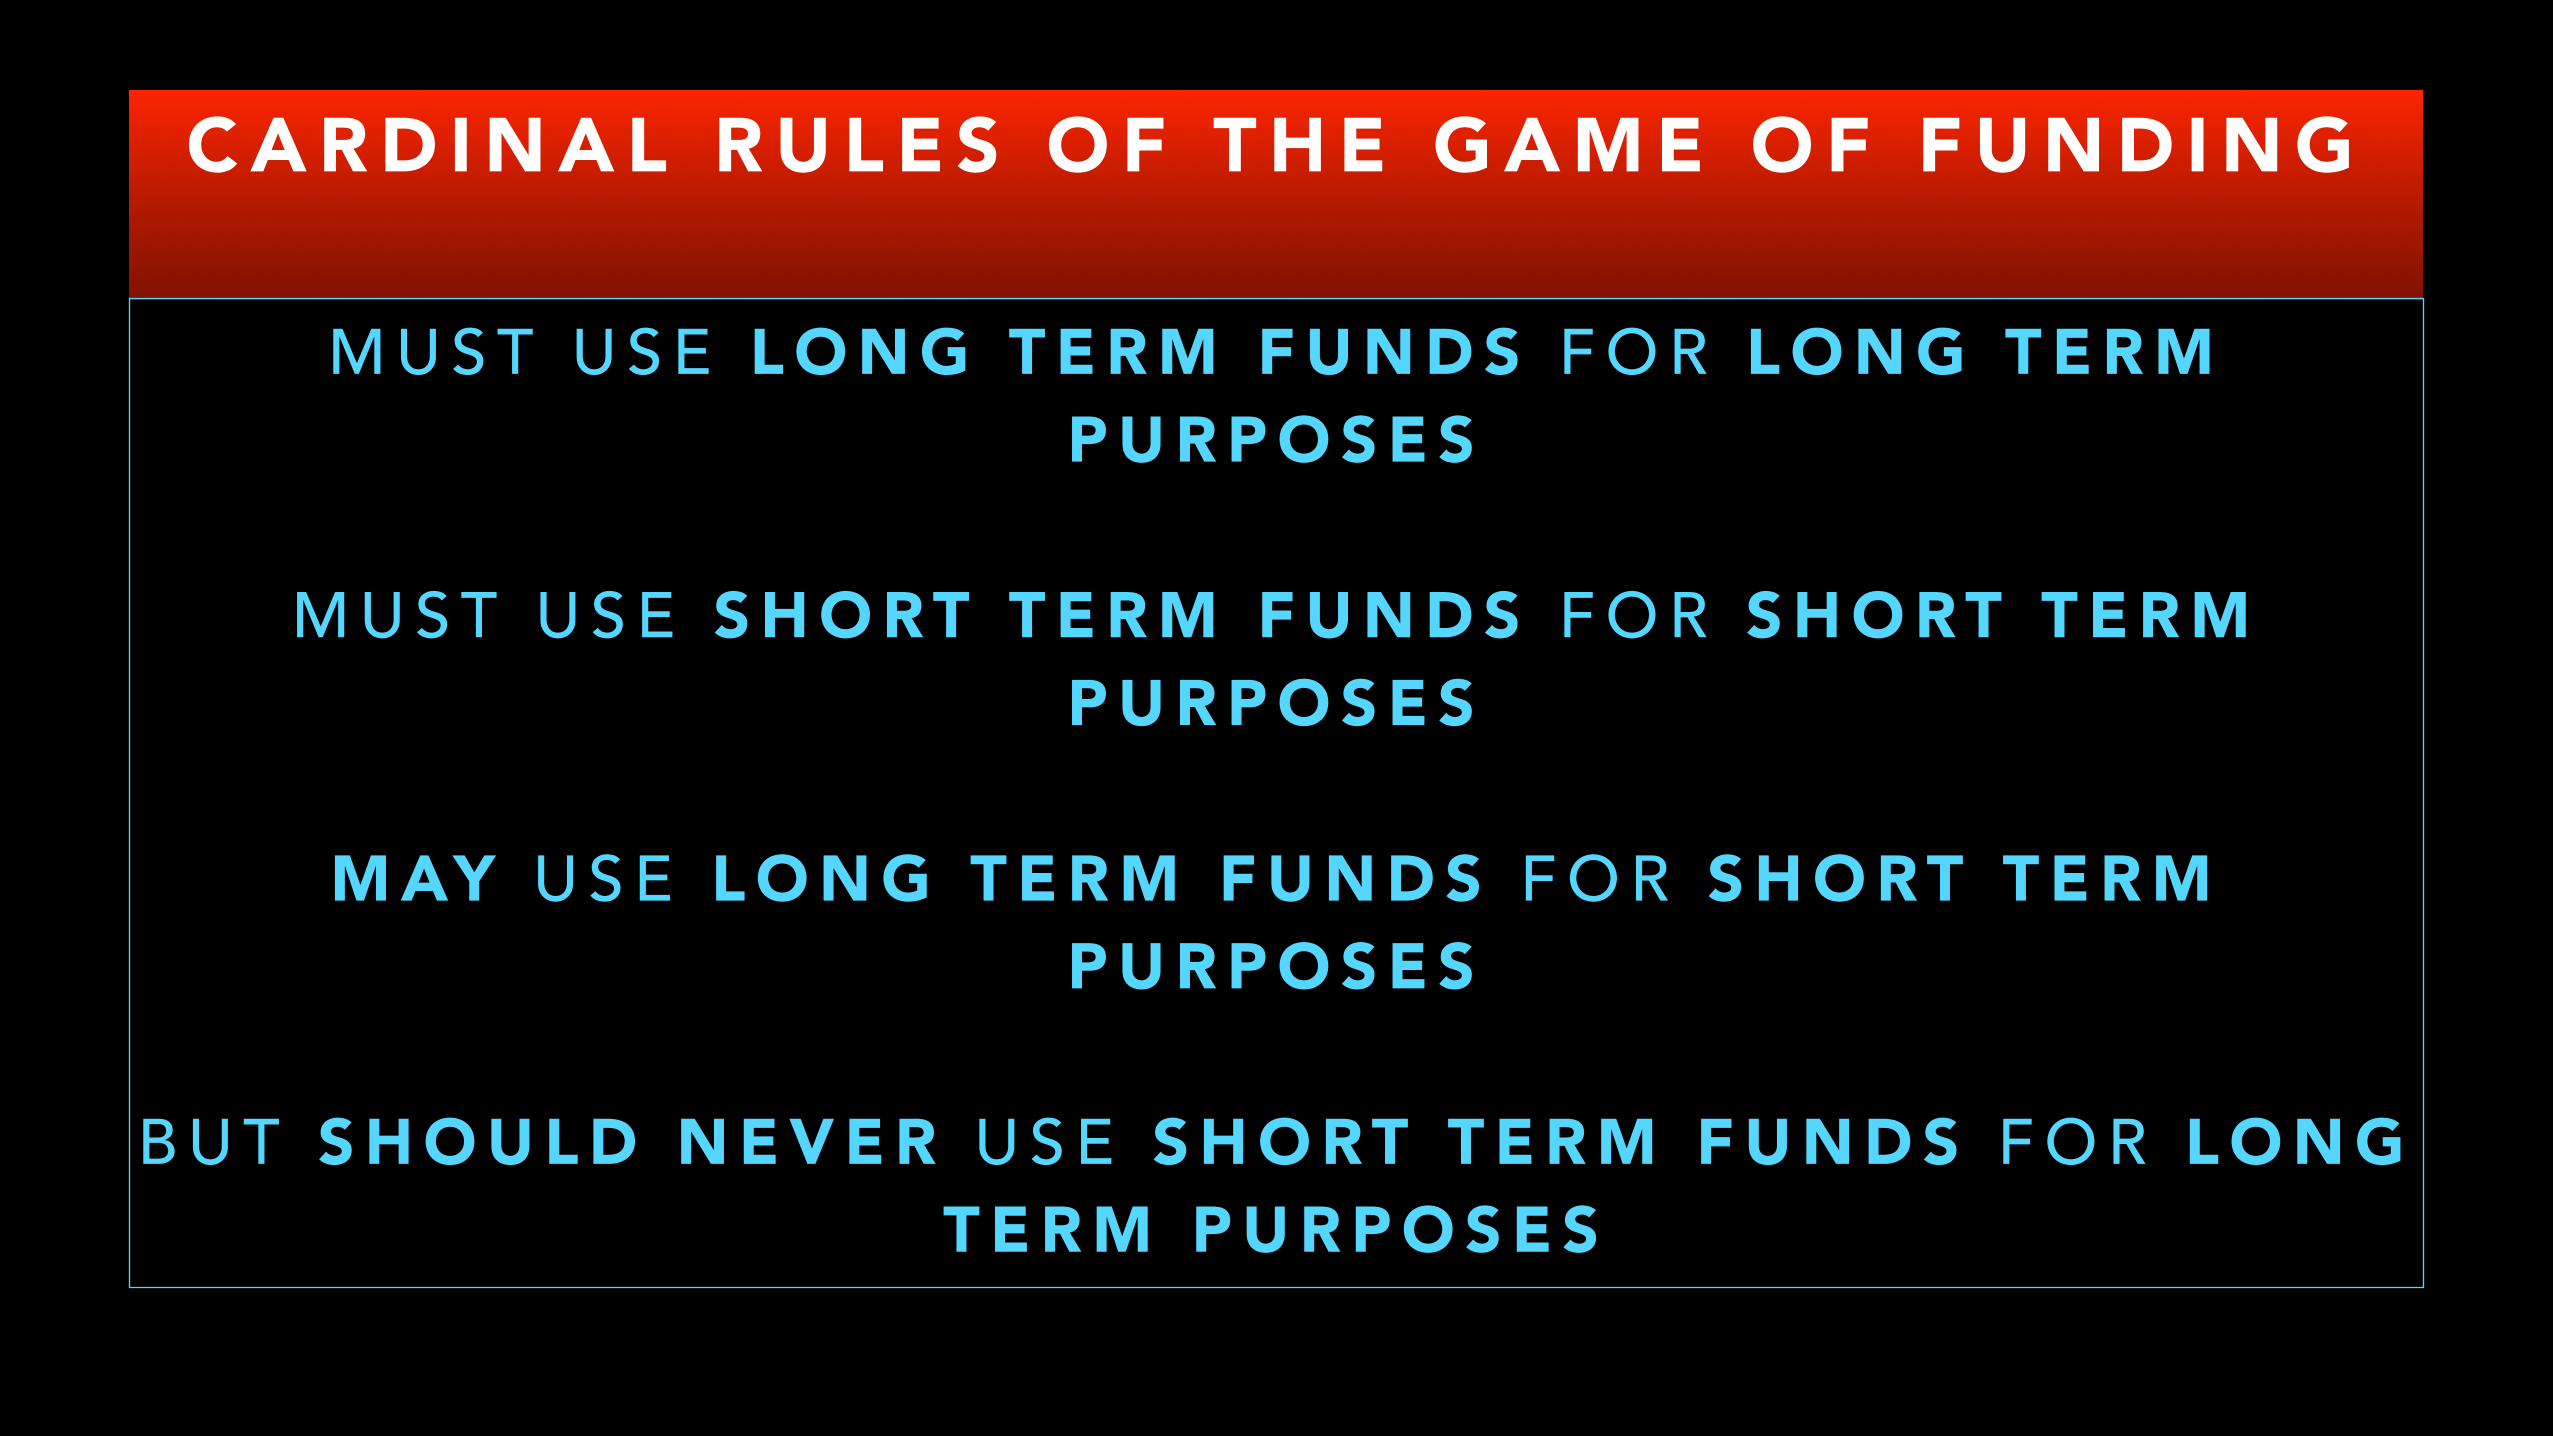
C A R D I N A L R U L E S O F T H E G A M E O F F U N D I N G
M U S T U S E L O N G T E R M F U N D S F O R L O N G T E R M P U R P O S E S
!
M U S T U S E S H O RT T E R M F U N D S F O R S H O RT T E R M P U R P O S E S
!
M AY U S E L O N G T E R M F U N D S F O R S H O RT T E R M P U R P O S E S
!
B U T S H O U L D N E V E R U S E S H O RT T E R M F U N D S F O R L O N G T E R M P U R P O S E S
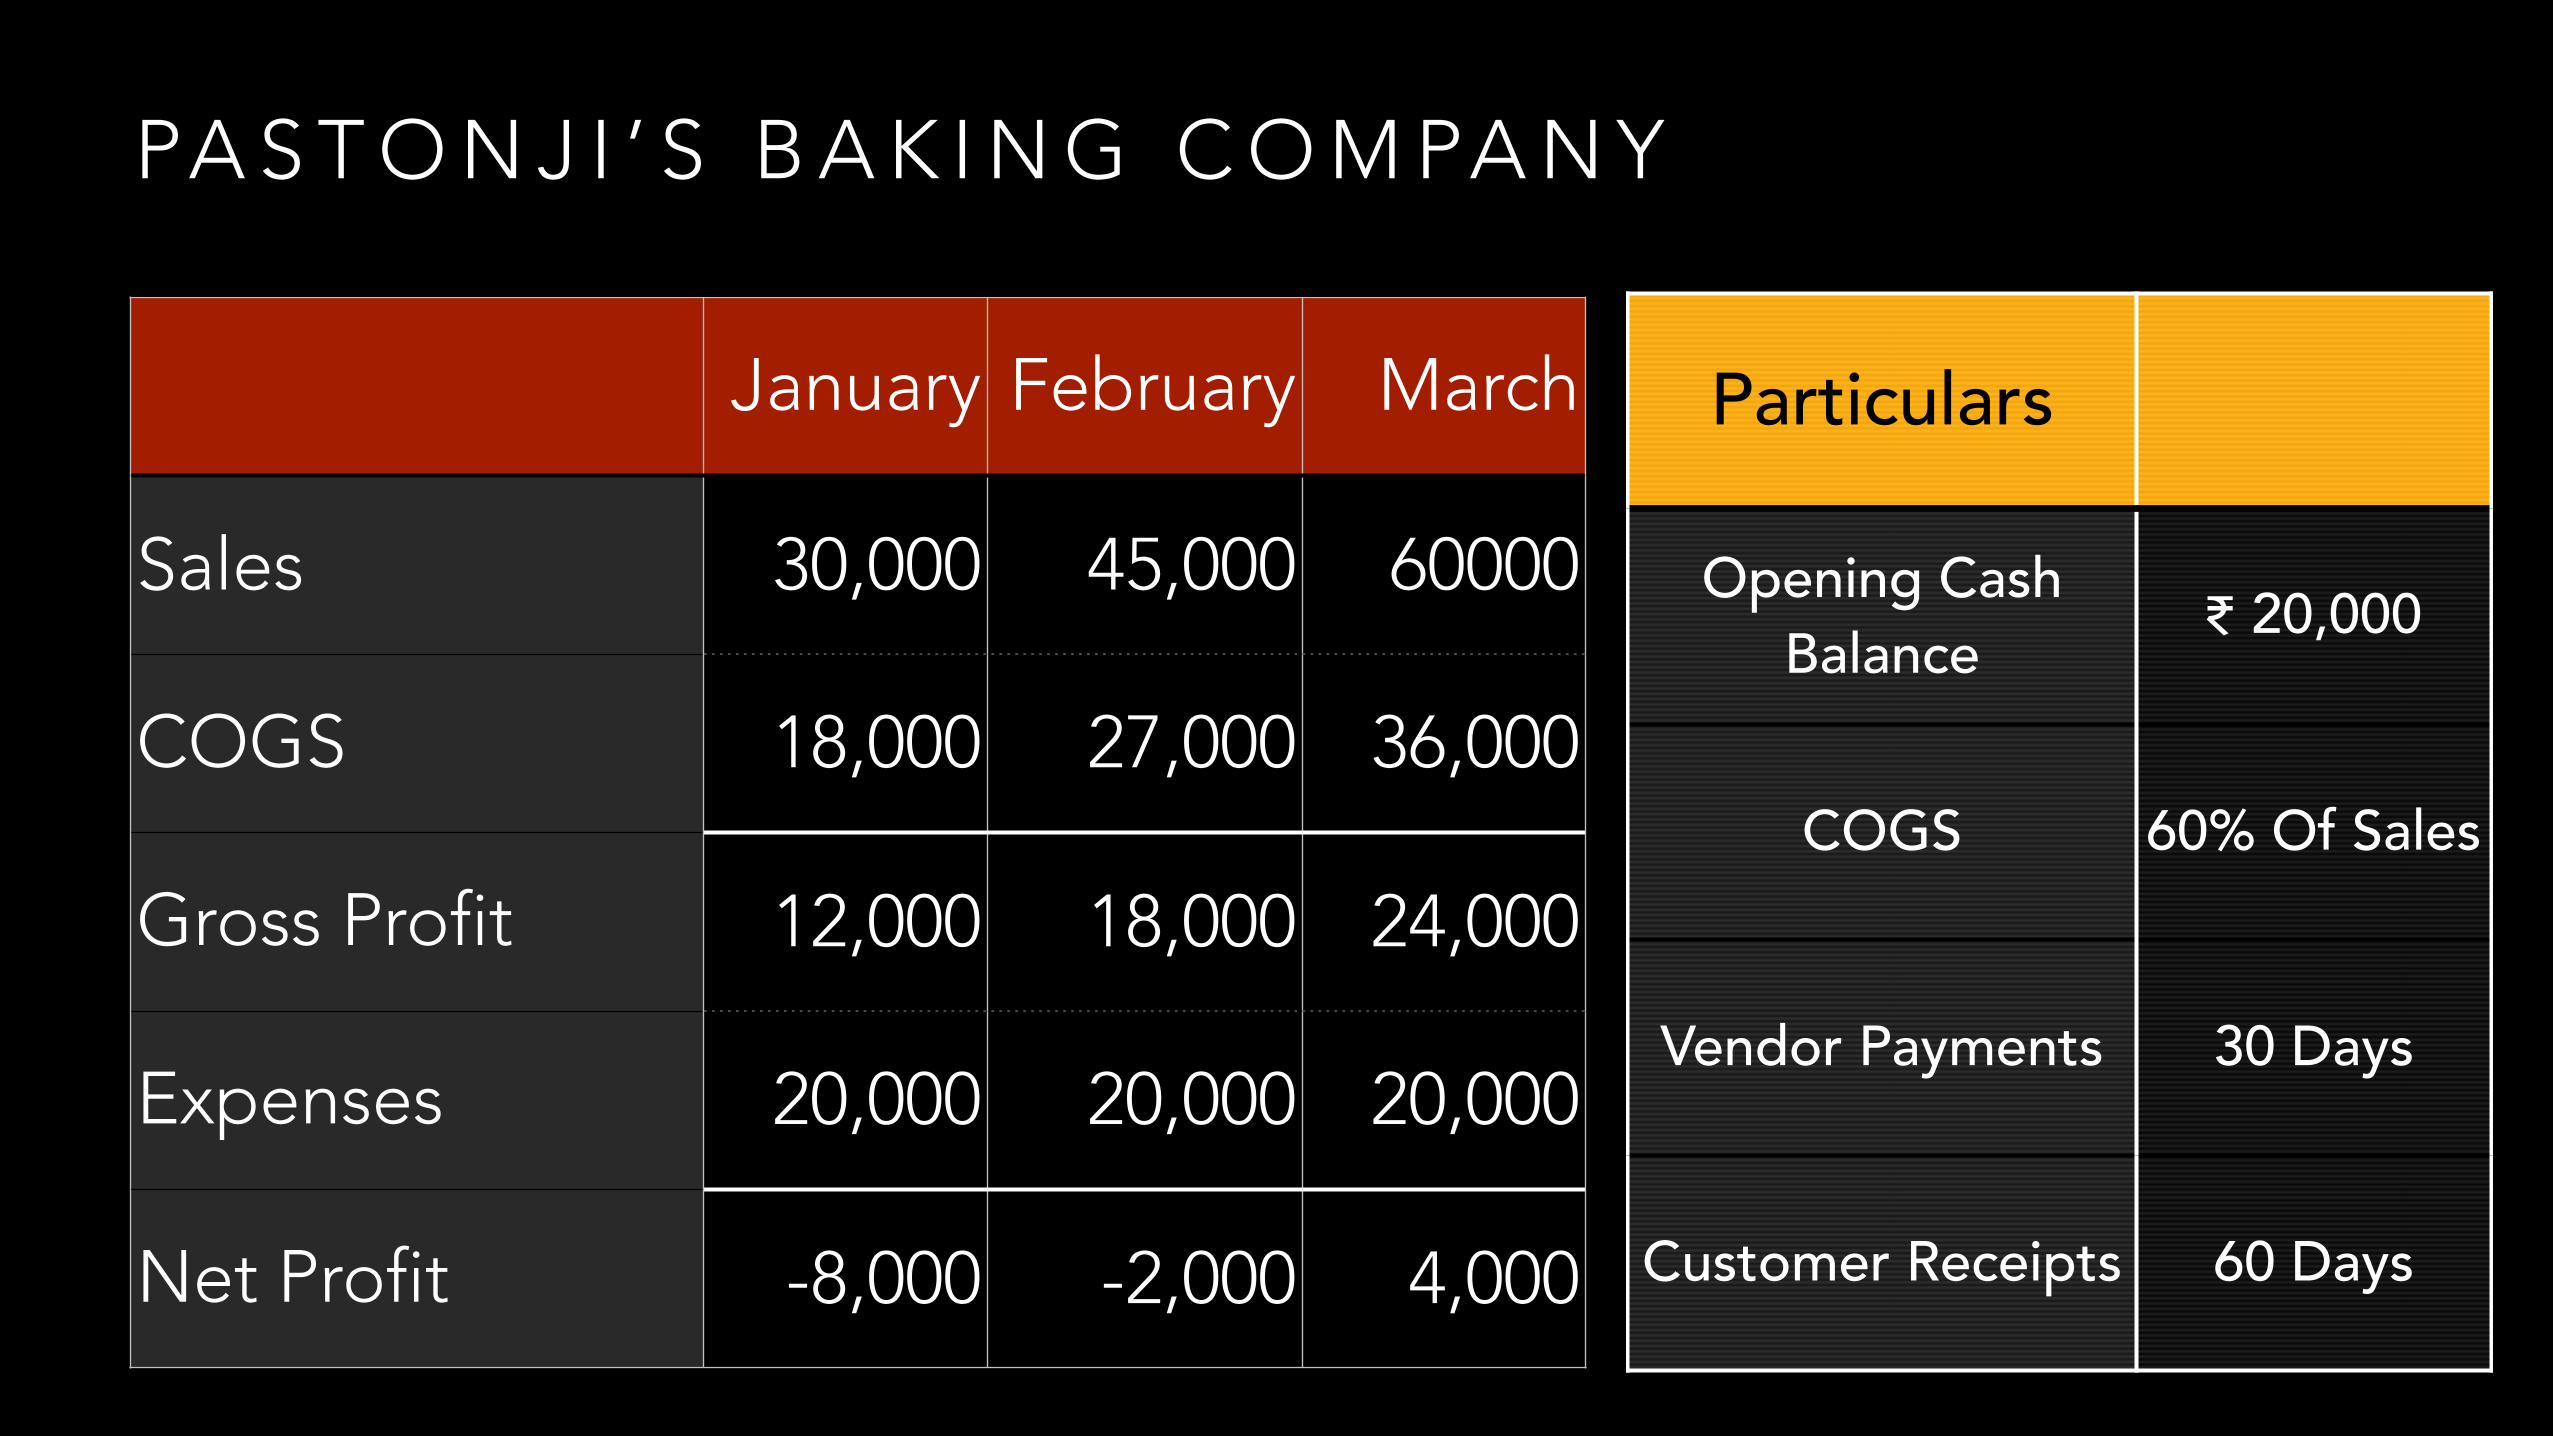
PA S T O N J I ’ S B A K I N G C O M PA N Y
January February March
Sales 30,000 45,000 60000
COGS 18,000 27,000 36,000
Gross Profit 12,000 18,000 24,000
Expenses 20,000 20,000 20,000
Net Profit -8,000 -2,000 4,000
Particulars
Opening Cash Balance ₹ 20,000
COGS 60% Of Sales
Vendor Payments 30 Days
Customer Receipts 60 Days
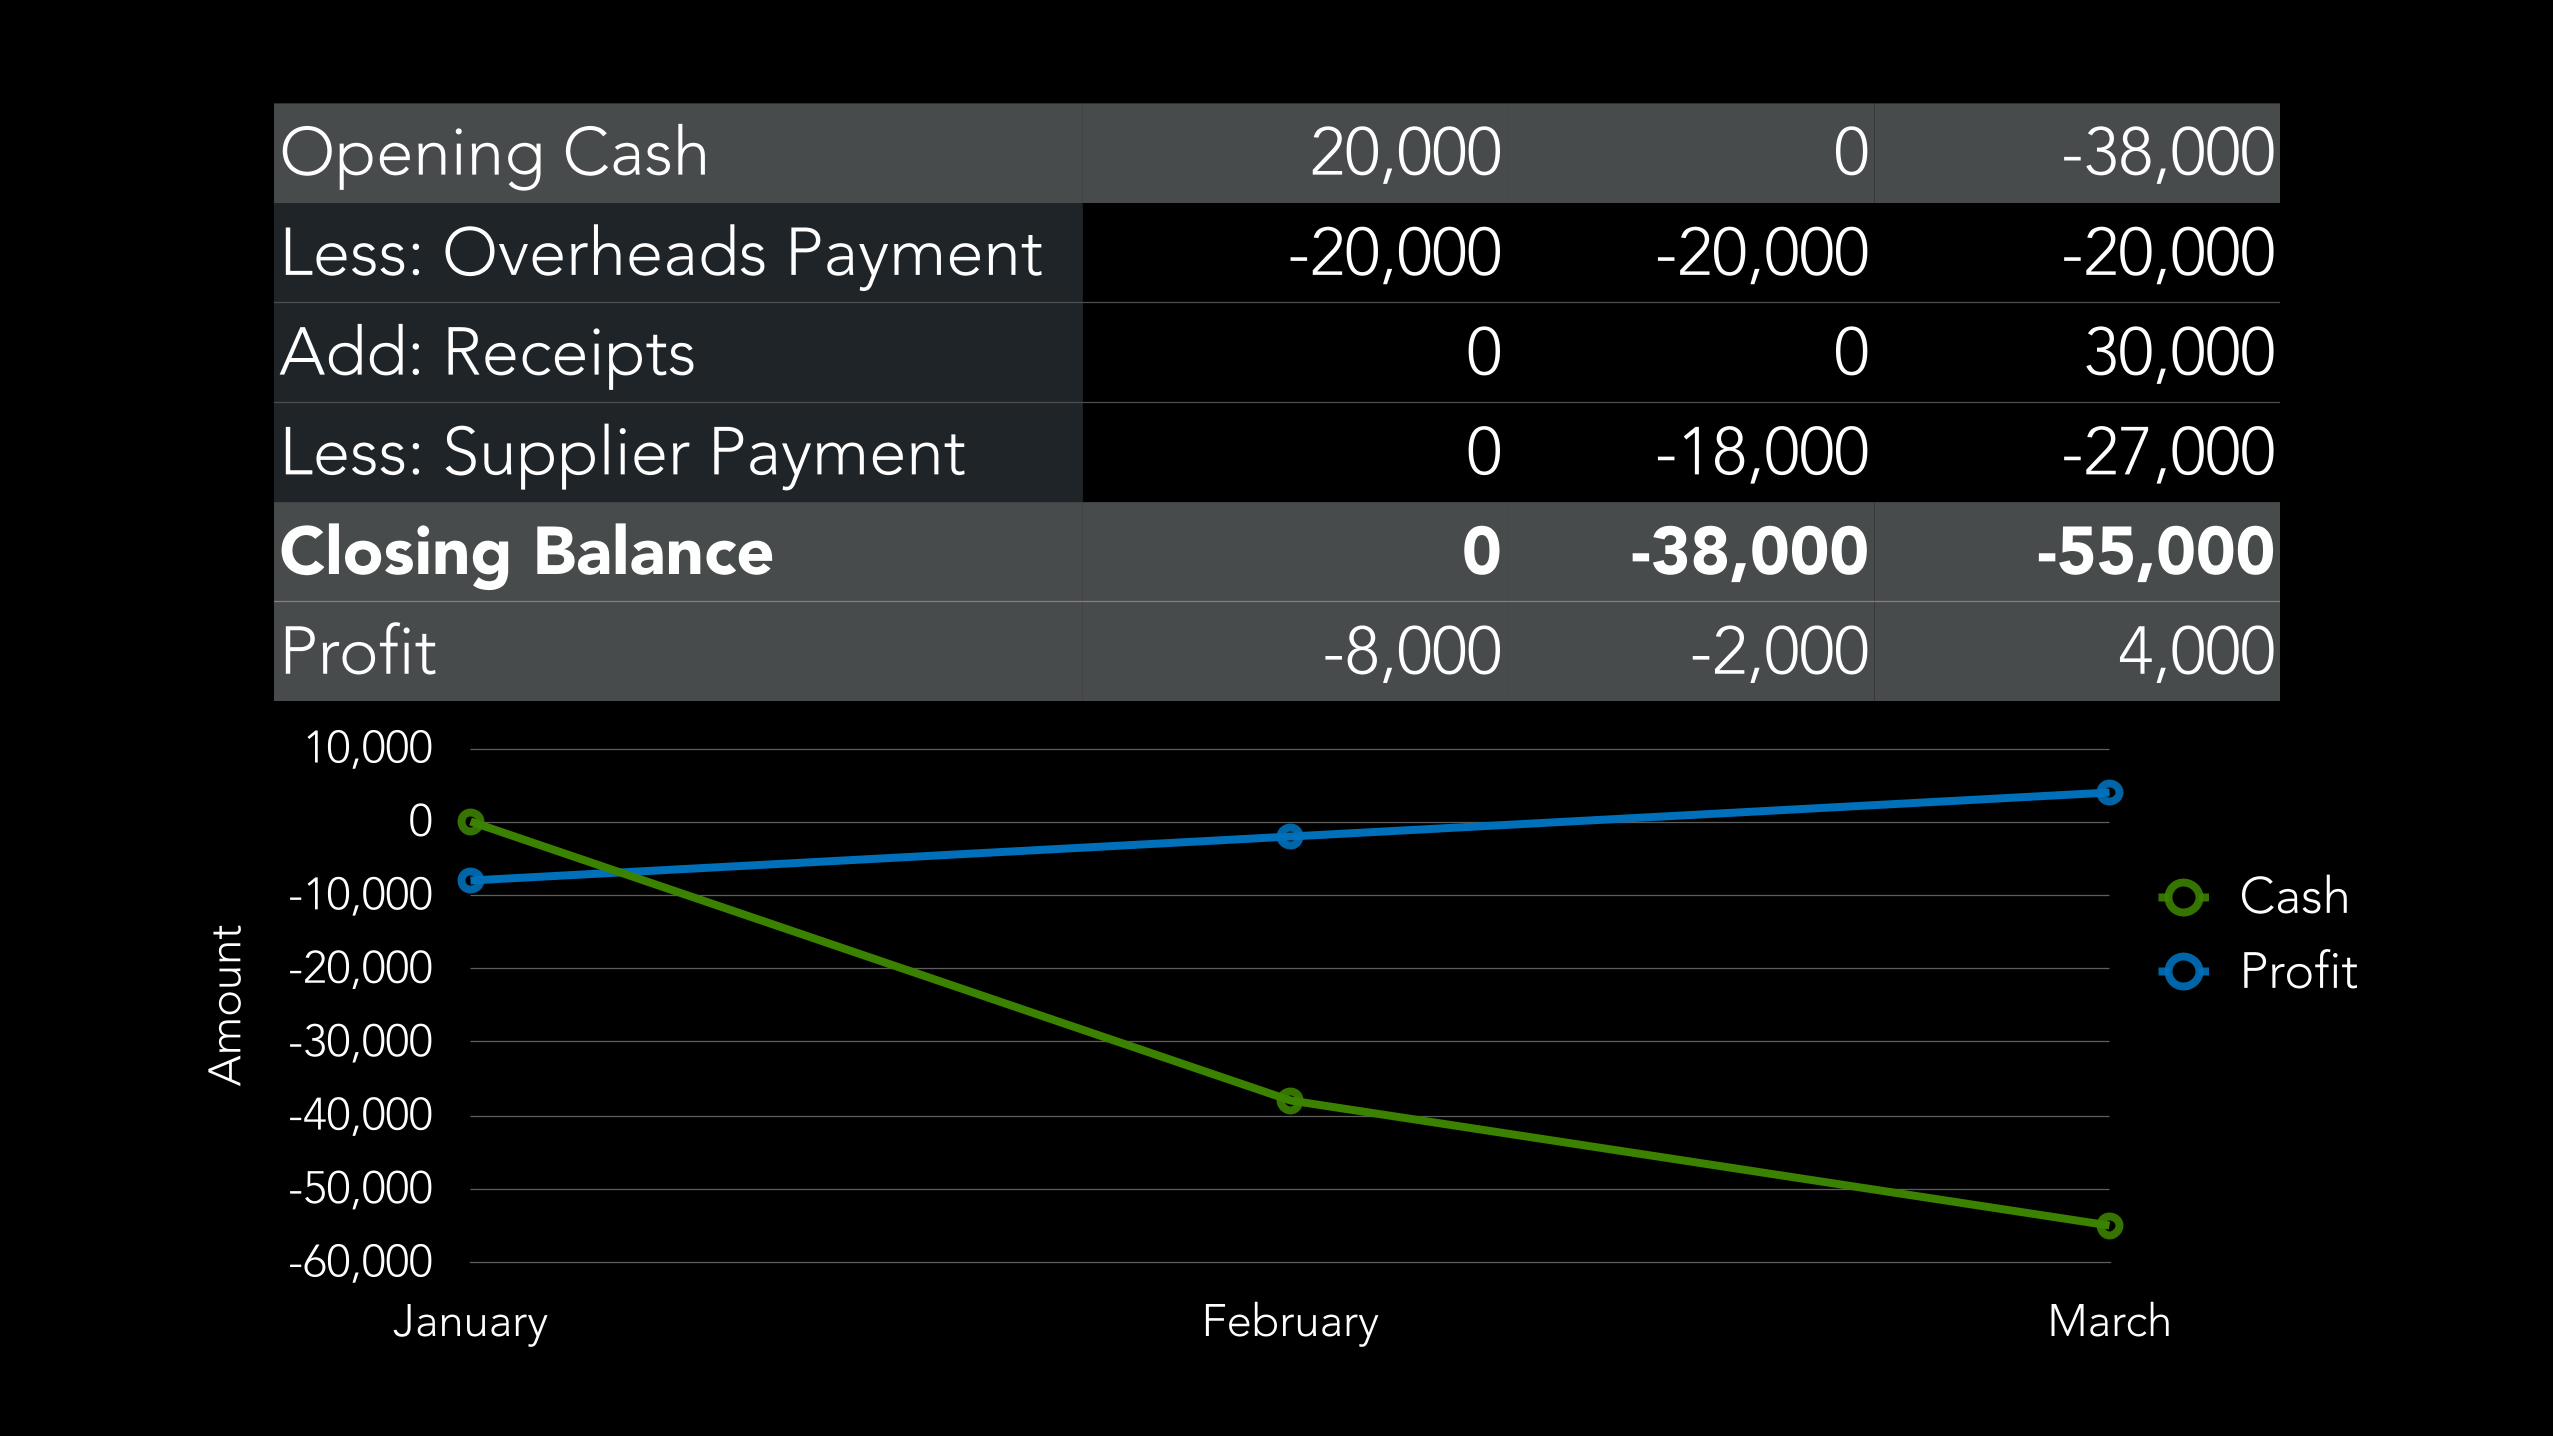
Opening Cash 20,000 0 -38,000
Less: Overheads Payment -20,000 -20,000 -20,000
Add: Receipts 0 0 30,000
Less: Supplier Payment 0 -18,000 -27,000
Closing Balance 0 -38,000 -55,000Profit -8,000 -2,000 4,000
Am
oun
t
-60,000
-50,000
-40,000
-30,000
-20,000
-10,000
0
10,000
January February March
Cash
Profit
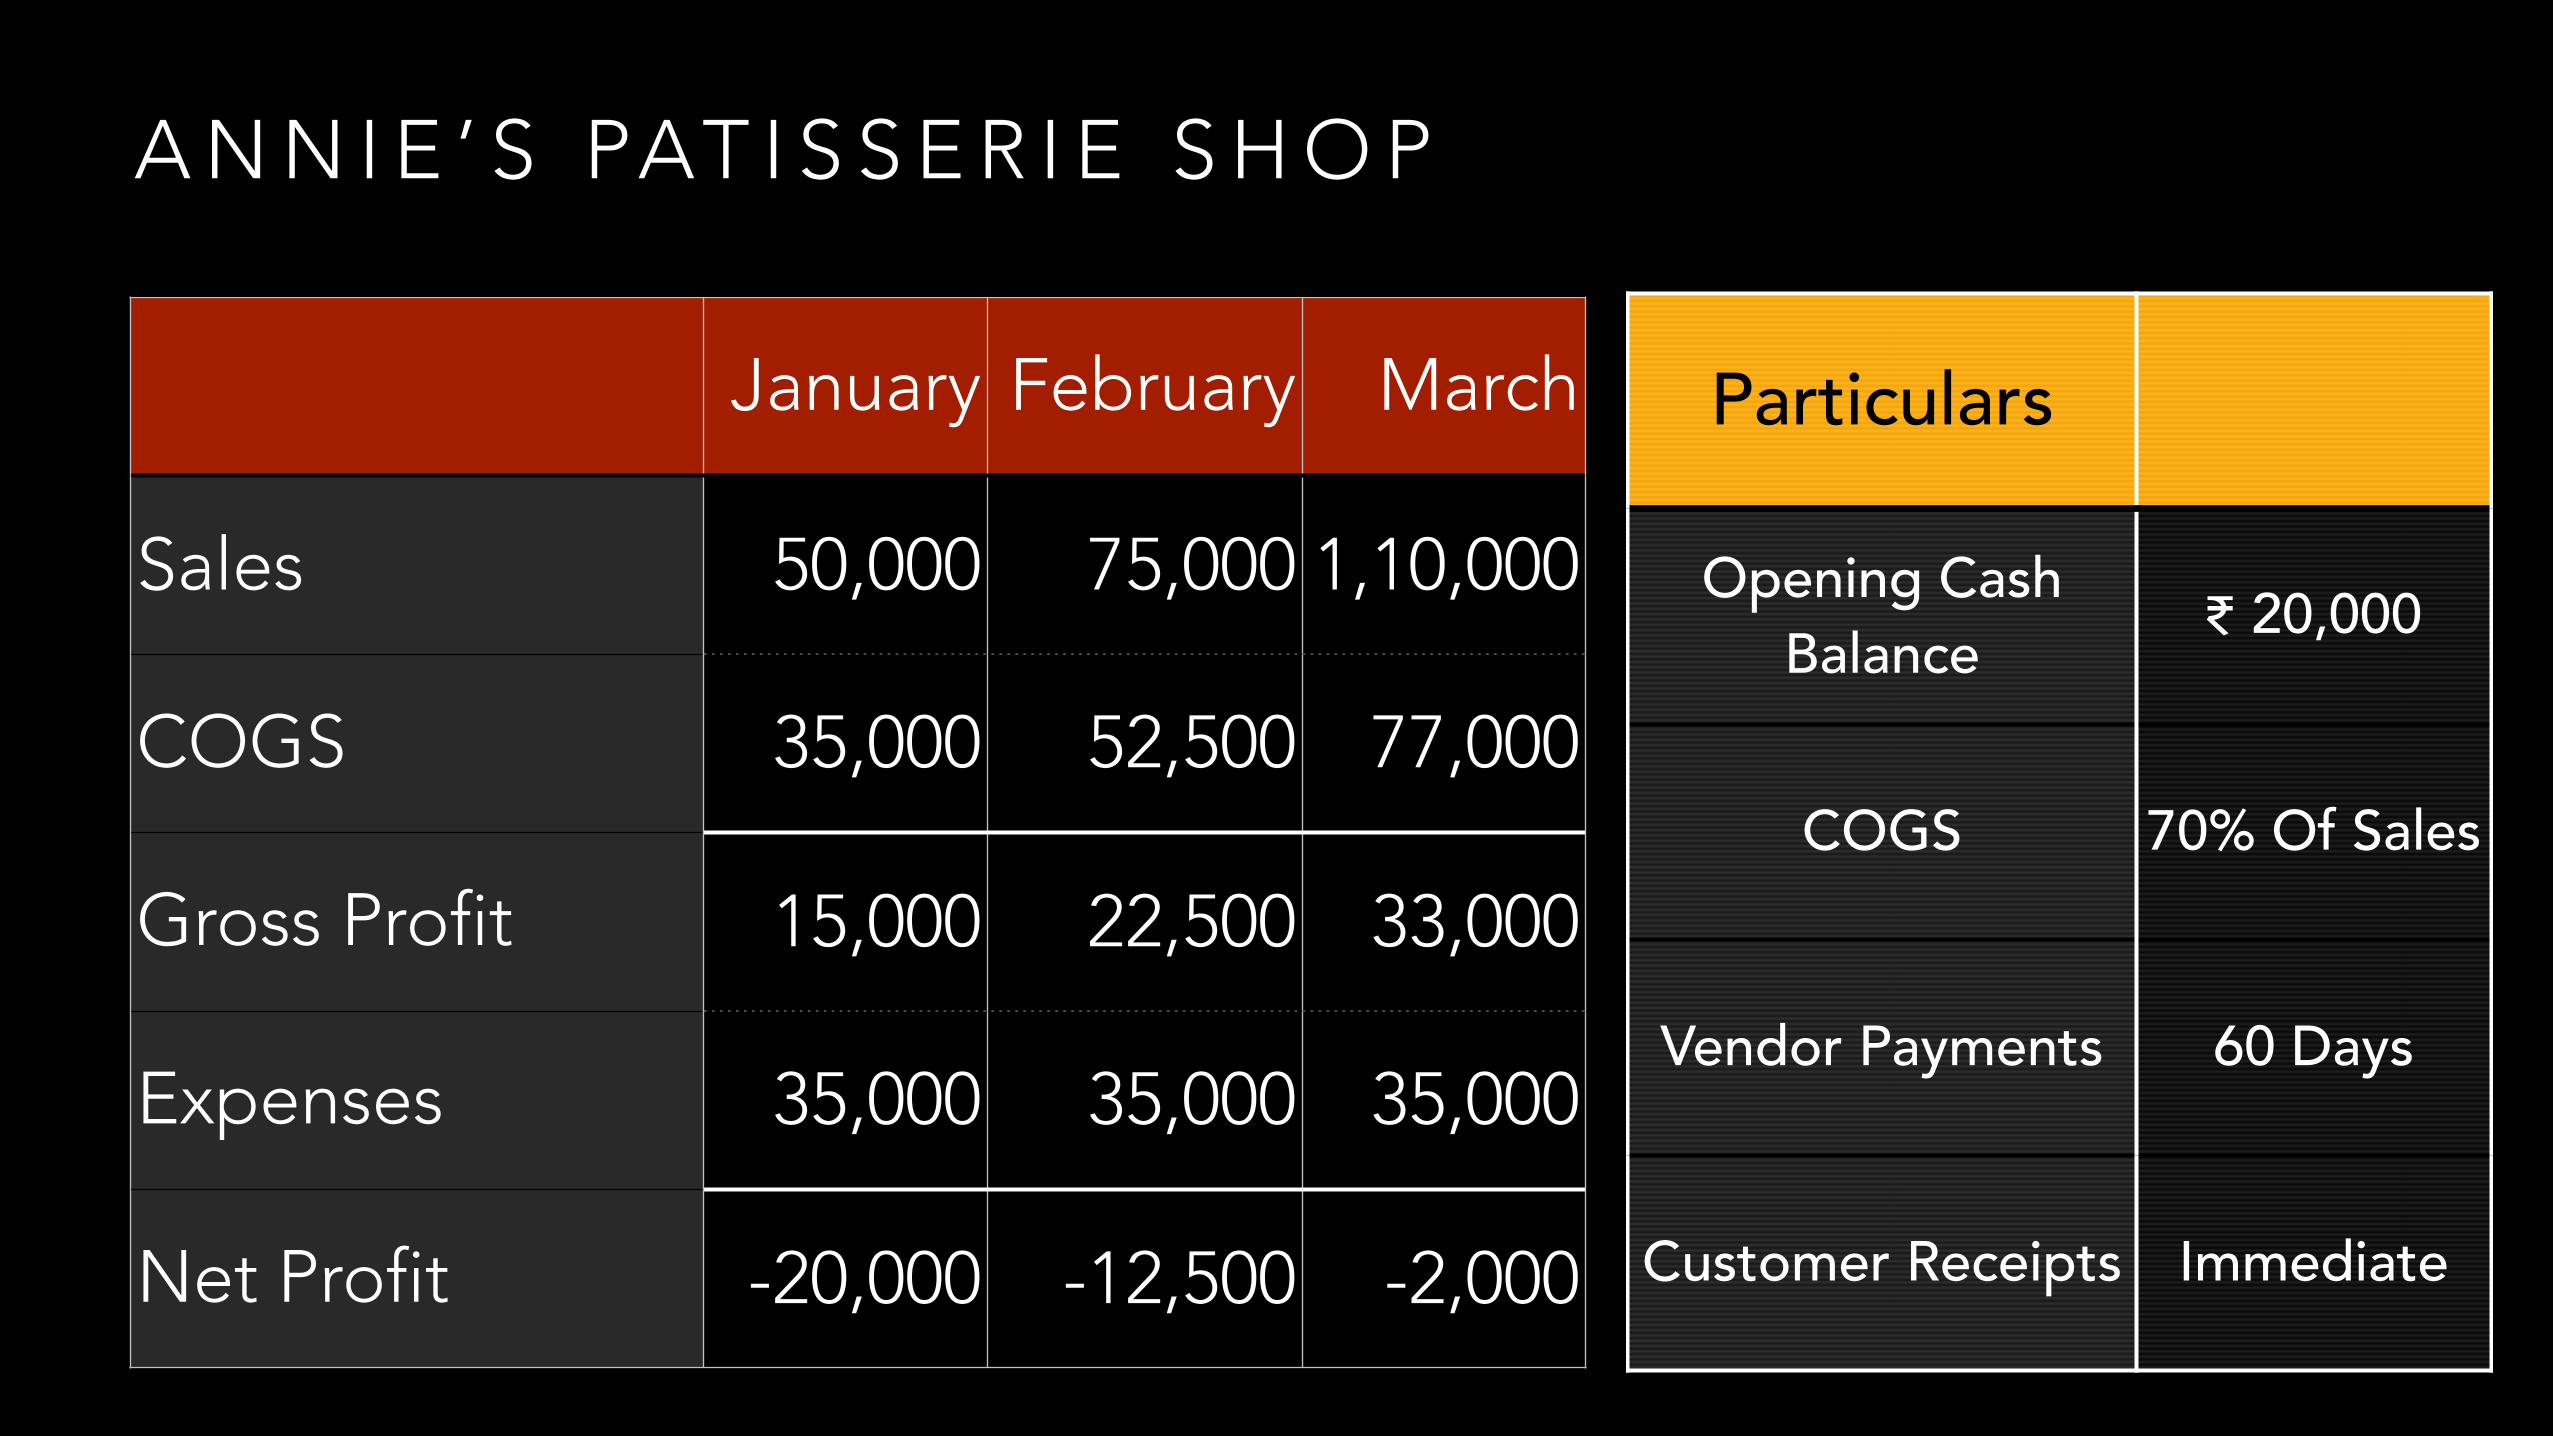
A N N I E ’ S PAT I S S E R I E S H O P
January February March
Sales 50,000 75,000 1,10,000
COGS 35,000 52,500 77,000
Gross Profit 15,000 22,500 33,000
Expenses 35,000 35,000 35,000
Net Profit -20,000 -12,500 -2,000
Particulars
Opening Cash Balance ₹ 20,000
COGS 70% Of Sales
Vendor Payments 60 Days
Customer Receipts Immediate
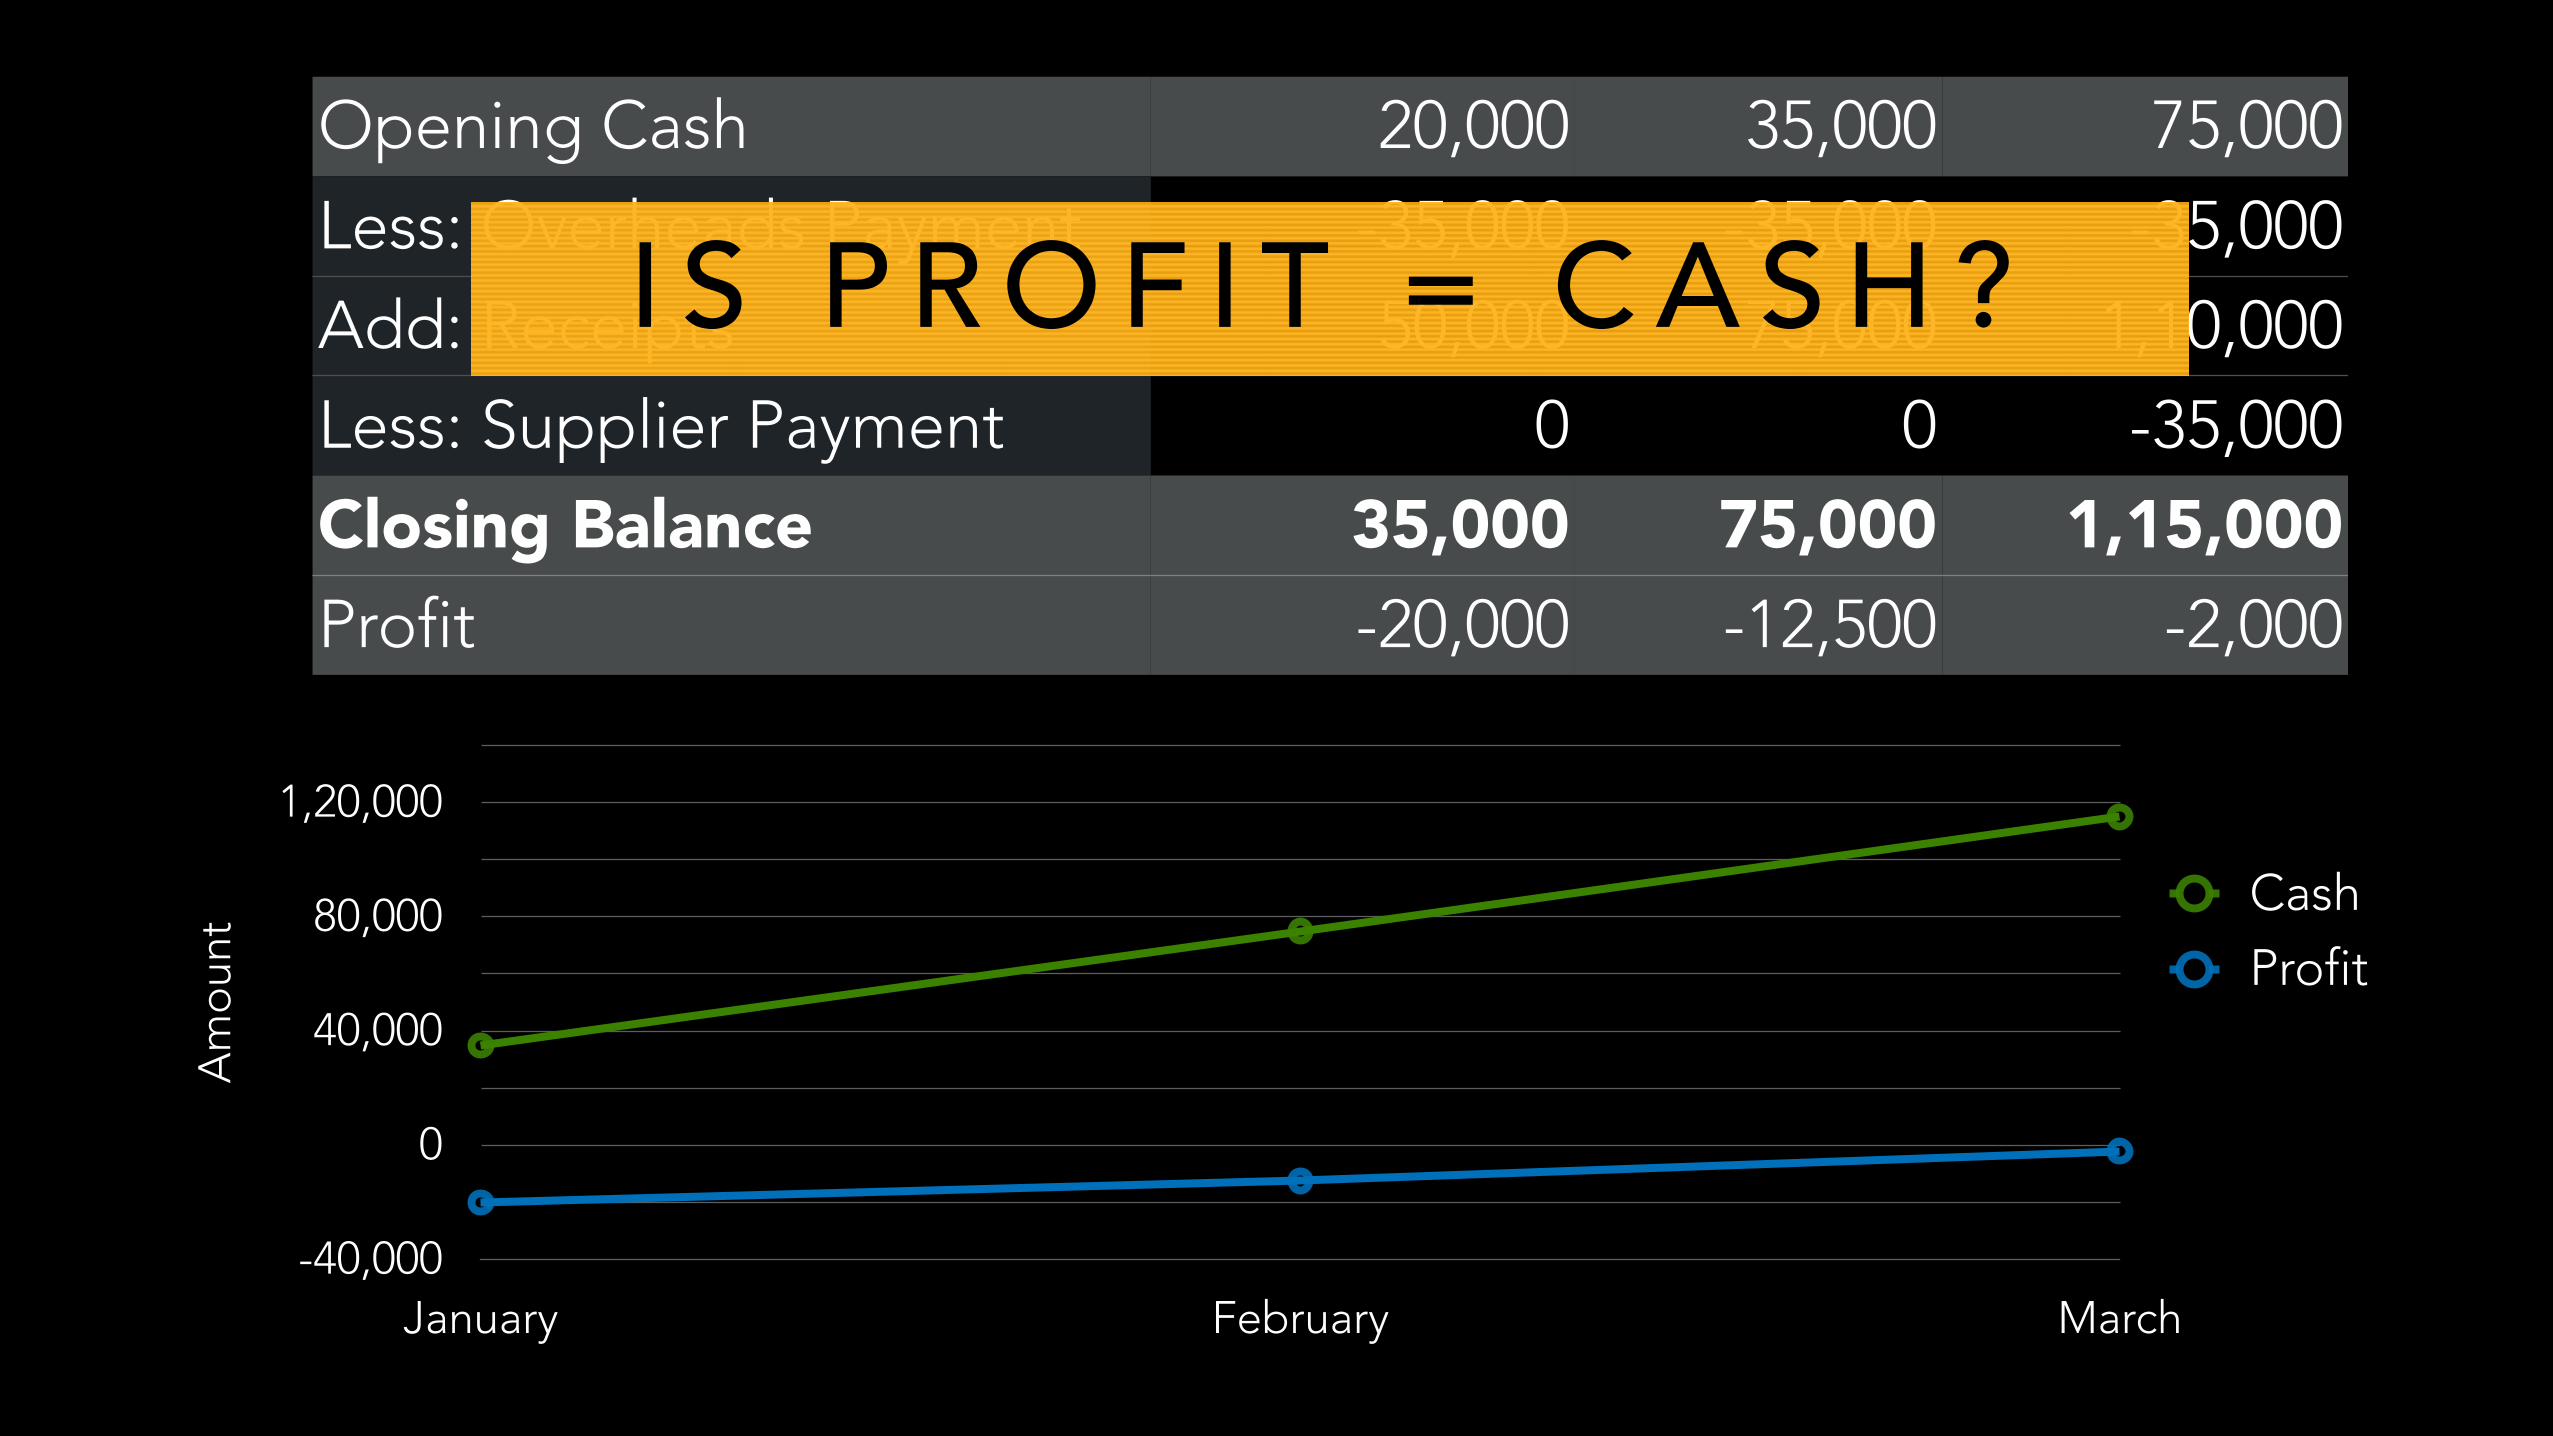
Opening Cash 20,000 35,000 75,000
Less: Overheads Payment -35,000 -35,000 -35,000
Add: Receipts 50,000 75,000 1,10,000
Less: Supplier Payment 0 0 -35,000
Closing Balance 35,000 75,000 1,15,000Profit -20,000 -12,500 -2,000
Am
oun
t
-40,000
0
40,000
80,000
1,20,000
January February March
Cash
Profit
I S P R O F I T = C A S H ?
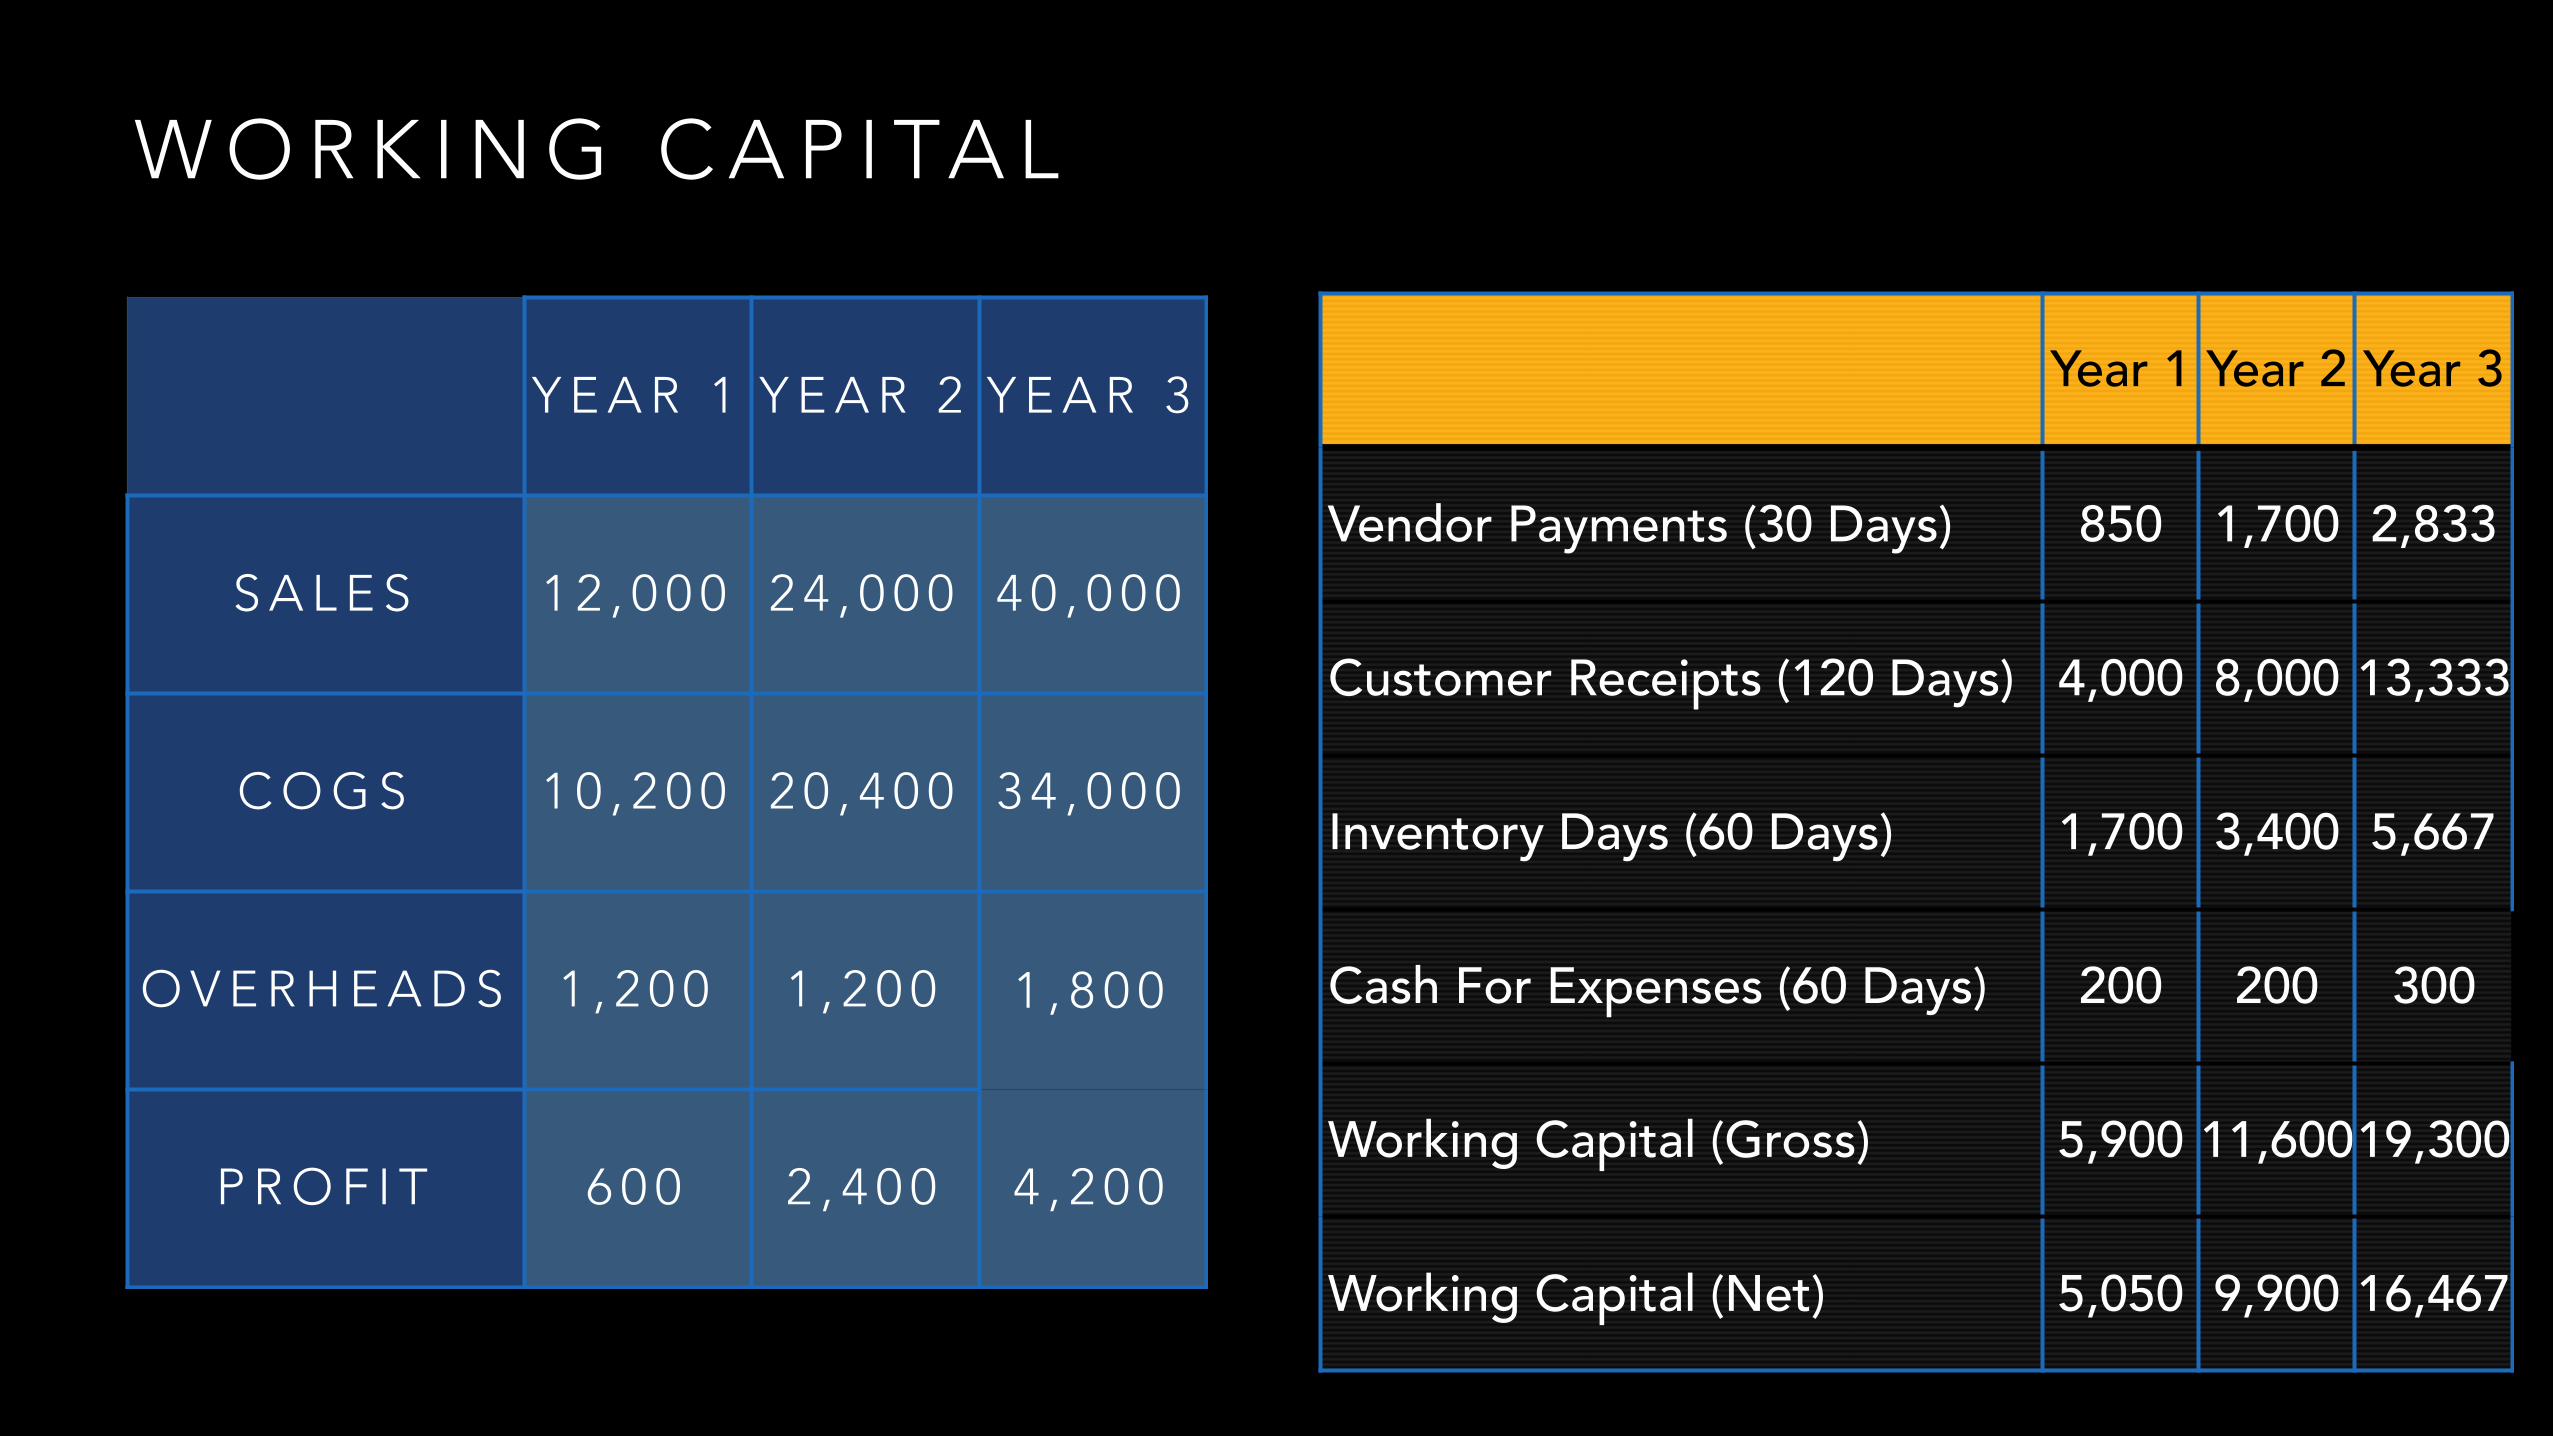
W O R K I N G C A P I TA L
Y E A R 1 Y E A R 2 Y E A R 3
S A L E S 1 2 , 0 0 0 2 4 , 0 0 0 4 0 , 0 0 0
C O G S 1 0 , 2 0 0 2 0 , 4 0 0 3 4 , 0 0 0
O V E R H E A D S 1 , 2 0 0 1 , 2 0 0 1 , 8 0 0
P R O F I T 6 0 0 2 , 4 0 0 4 , 2 0 0
Year 1 Year 2 Year 3
Vendor Payments (30 Days) 850 1,700 2,833
Customer Receipts (120 Days) 4,000 8,000 13,333
Inventory Days (60 Days) 1,700 3,400 5,667
Cash For Expenses (60 Days) 200 200 300
Working Capital (Gross) 5,900 11,60019,300
Working Capital (Net) 5,050 9,900 16,467
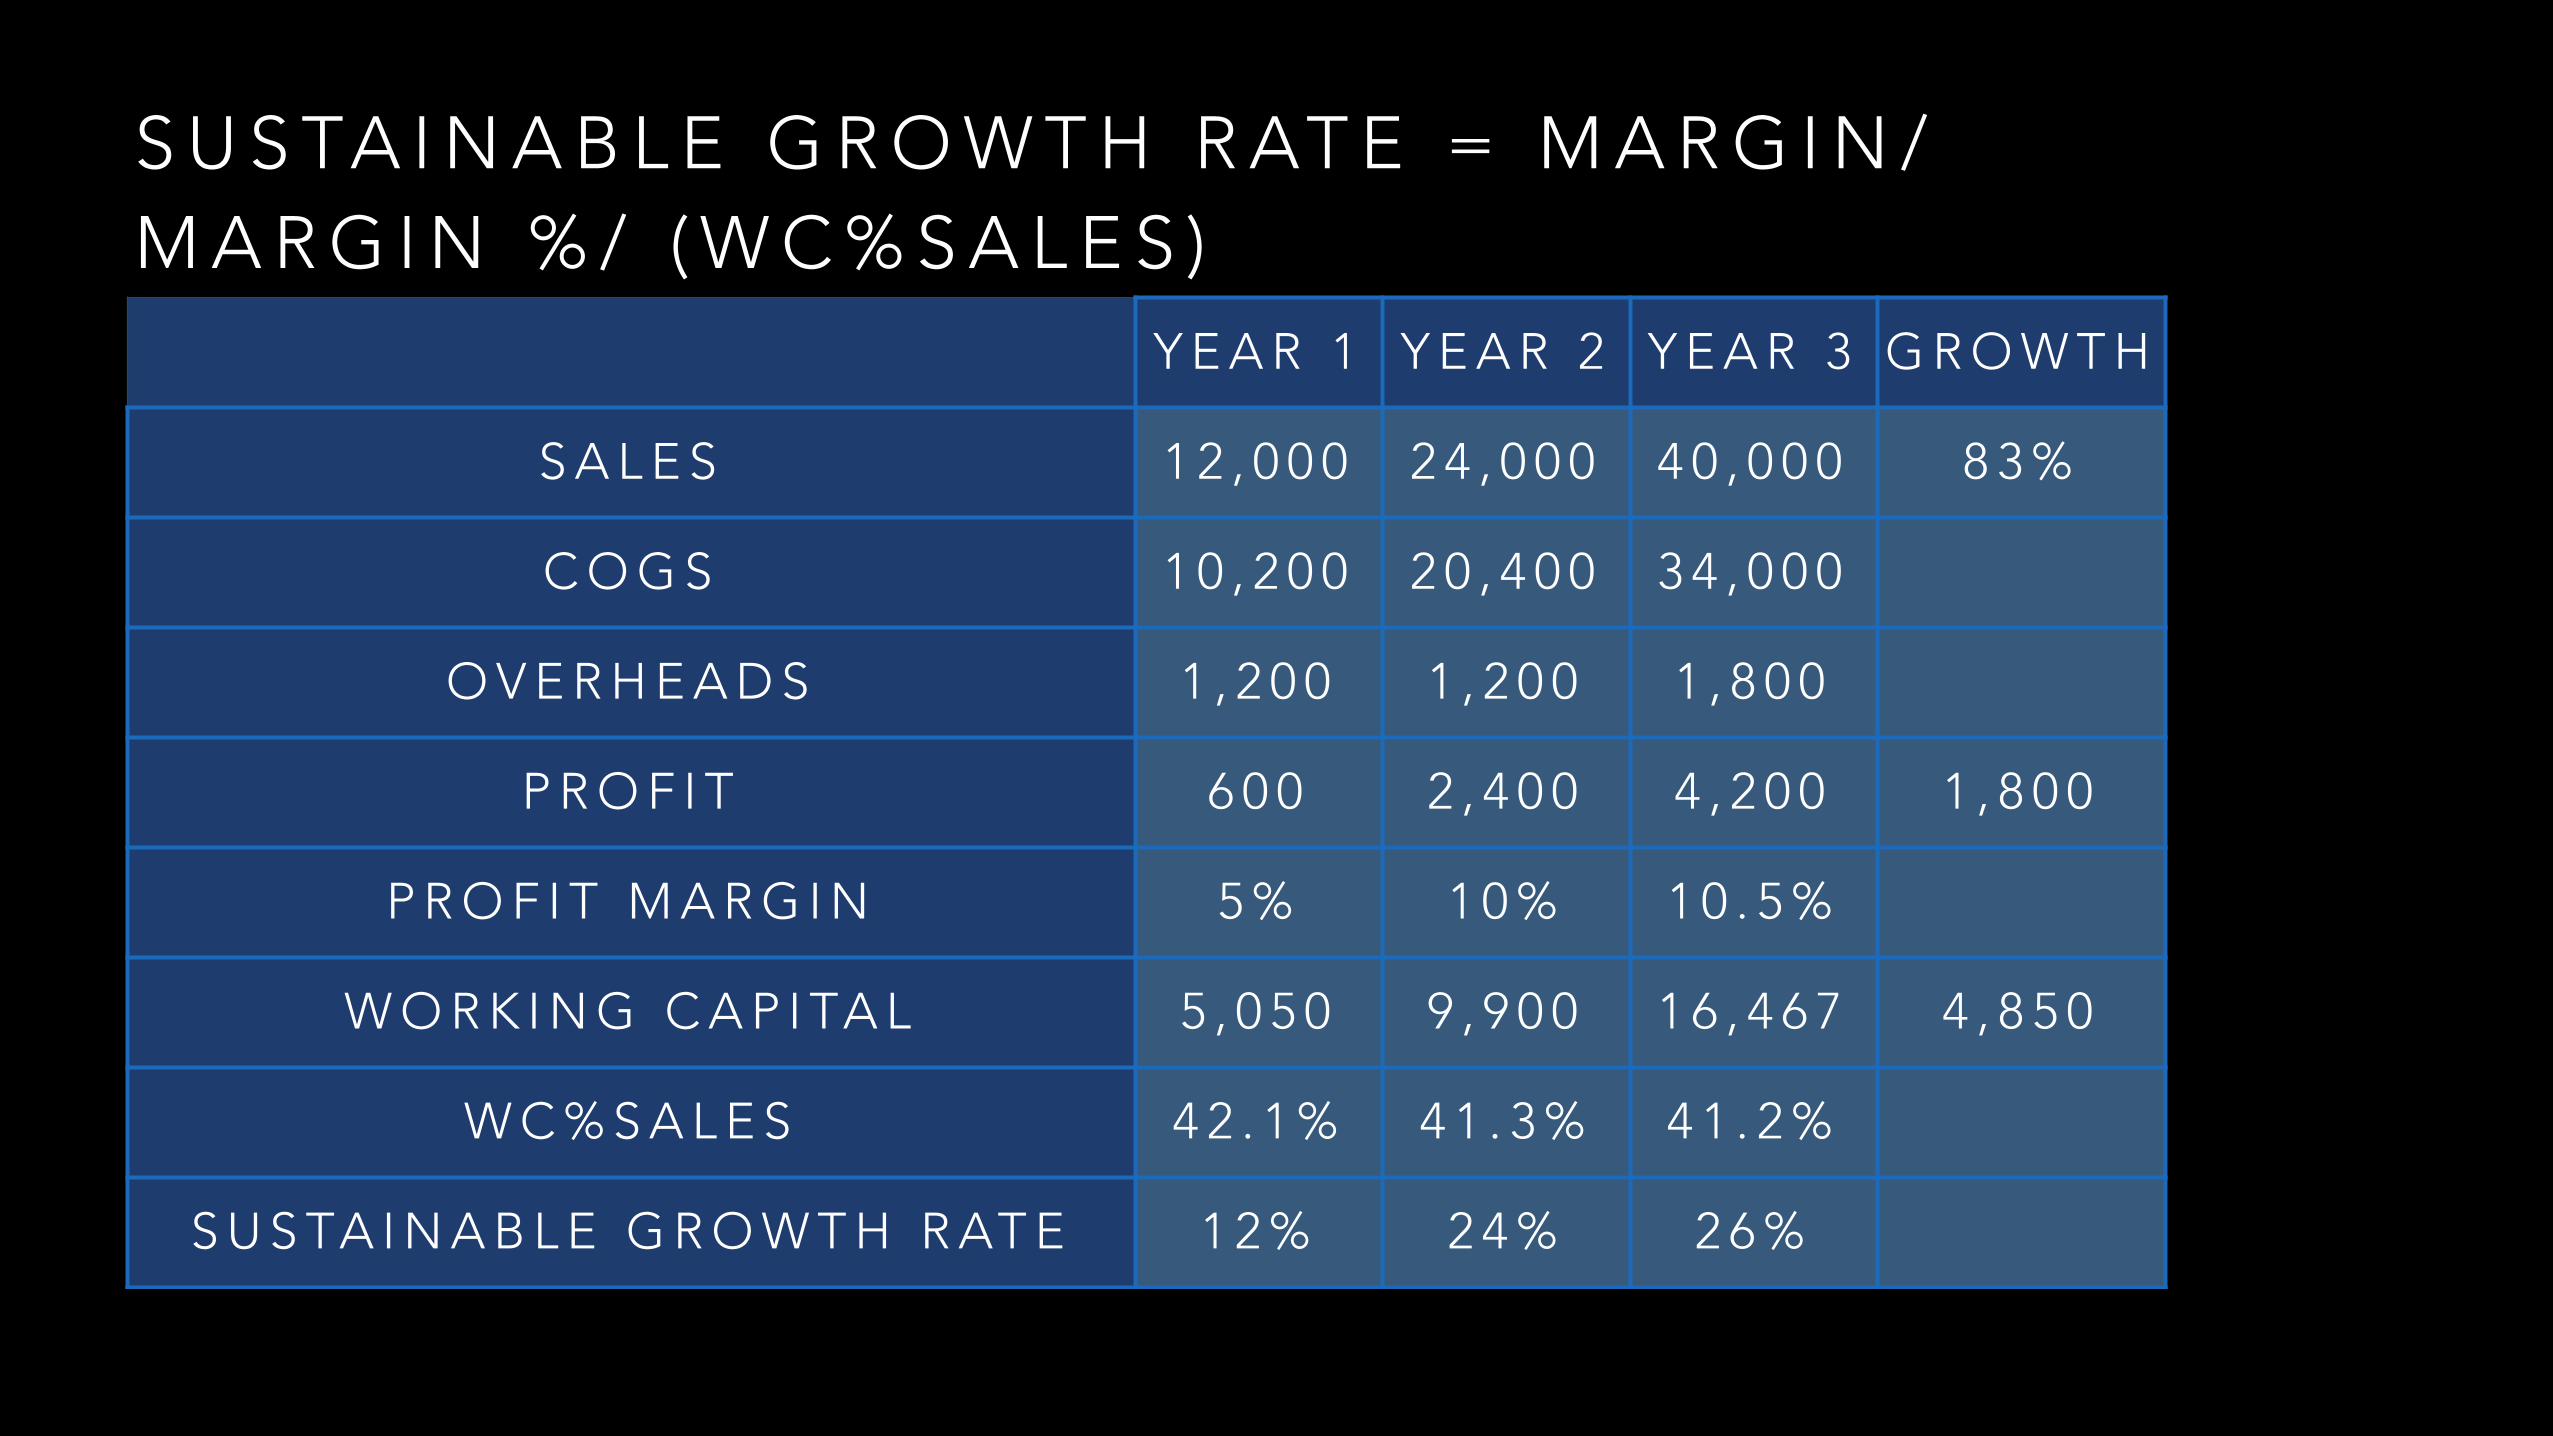
S U S TA I N A B L E G R O W T H R AT E = M A R G I N / M A R G I N % / ( W C % S A L E S )
Y E A R 1 Y E A R 2 Y E A R 3 G R O W T H
S A L E S 1 2 , 0 0 0 2 4 , 0 0 0 4 0 , 0 0 0 8 3 %
C O G S 1 0 , 2 0 0 2 0 , 4 0 0 3 4 , 0 0 0
O V E R H E A D S 1 , 2 0 0 1 , 2 0 0 1 , 8 0 0
P R O F I T 6 0 0 2 , 4 0 0 4 , 2 0 0 1 , 8 0 0
P R O F I T M A R G I N 5 % 1 0 % 1 0 . 5 %
W O R K I N G C A P I TA L 5 , 0 5 0 9 , 9 0 0 1 6 , 4 6 7 4 , 8 5 0
W C % S A L E S 4 2 . 1 % 4 1 . 3 % 4 1 . 2 %
S U S TA I N A B L E G R O W T H R AT E 1 2 % 2 4 % 2 6 %