Embed Size (px)
Citation preview

Groups of Claimants who will be asking a share of Revenue
• Employees, the vendors, the landlord, the u<lity suppliers, the printer, the sta<oner, the travel agent and so on. This group represents Opera<ng Expenses
• Shareholders or owners • Government • Lenders
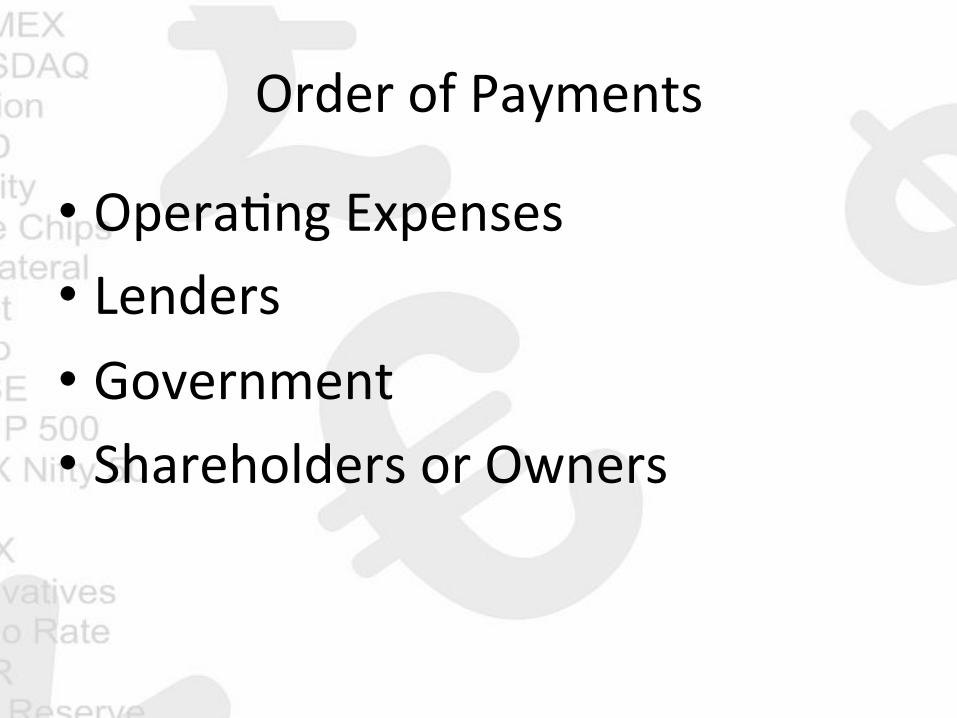
Order of Payments
• Opera0ng Expenses • Lenders • Government • Shareholders or Owners
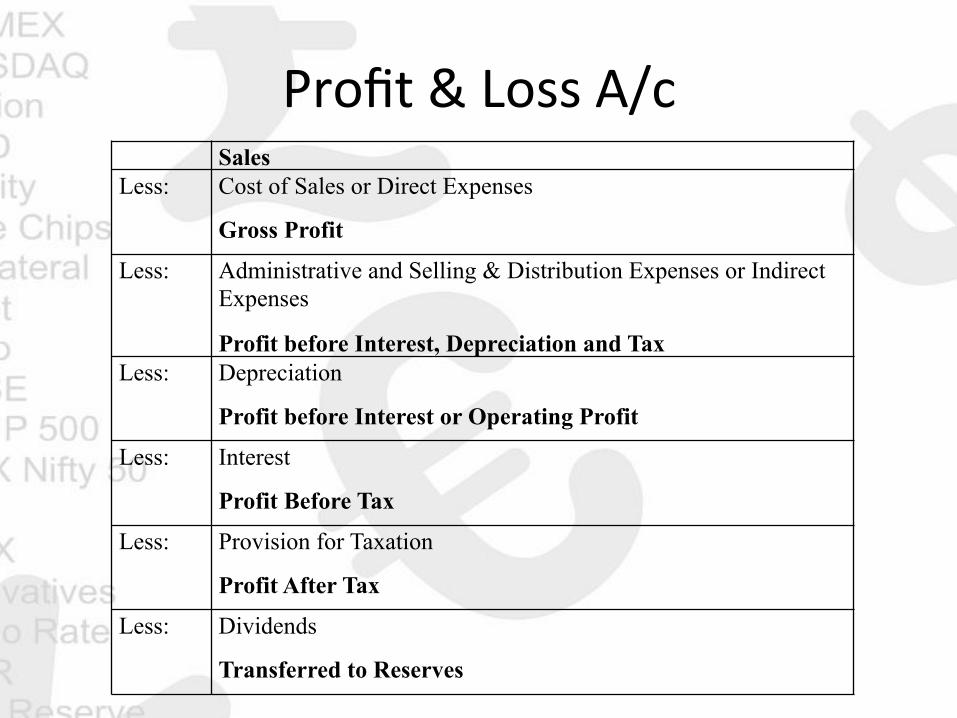
Profit & Loss A/c Sales
Less: Cost of Sales or Direct Expenses
Gross Profit
Less: Administrative and Selling & Distribution Expenses or Indirect Expenses
Profit before Interest, Depreciation and Tax Less: Depreciation
Profit before Interest or Operating Profit
Less: Interest
Profit Before Tax
Less: Provision for Taxation
Profit After Tax
Less: Dividends
Transferred to Reserves

Journey of a Business Idea
Capital
Money
Infrastructure Investment Operating Cycle
Cash
Raw Materials Sales
Debtors Creditors
Other Expenses

WORKING CAPITAL
• GROSS WORKING CAPITAL • NET WORKING CAPITAL • CURRENT ASSETS FUNDED BY CURRENT LIABILITIES
• CURRENT ASSETS INCREASE REQUIREMENT OF CASH
• CURRENT LIABILITIES DECREASE REQUIREMENT OF CASH
• CHEAPEST SOURCE OF FUND -‐ Creditors

CASH
BILLS PAYABLE/ CREDITORS
RAW MATERIALS
FINISHED GOODS
OTHER EXPENSES
BILLS RECEIVABLES/ DEBTORS
Purchase of Raw Materials
Produc0on
Collec0on
Credit Sales
OPERATING CYCLE
The Profit that never Was!
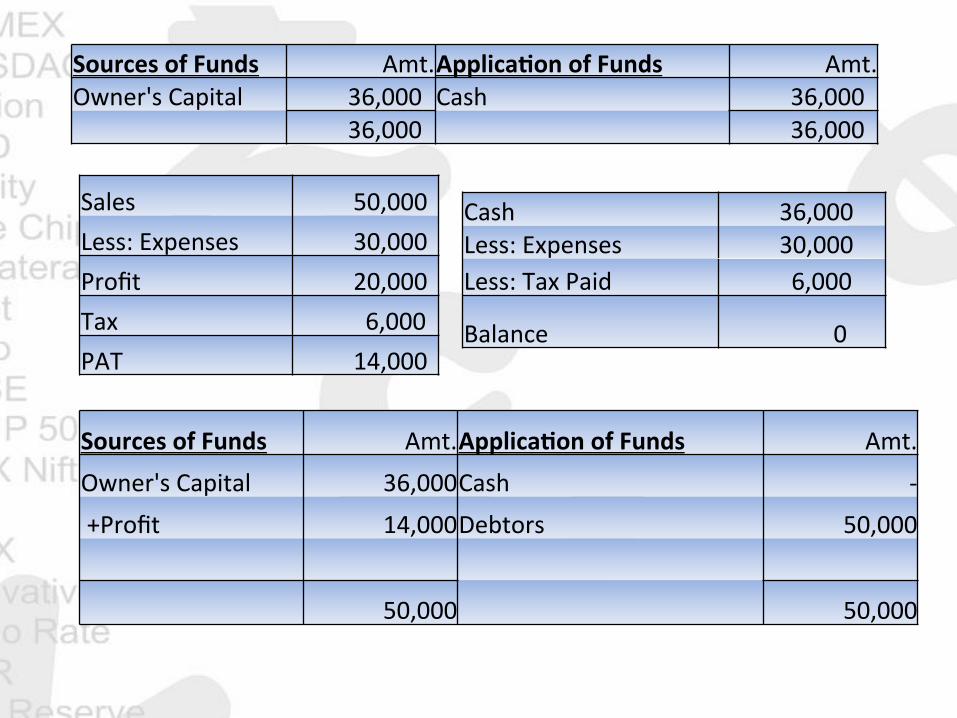
Sales 50,000 Less: Expenses 30,000 Profit 20,000 Tax 6,000 PAT 14,000
Sources of Funds Amt. Applica<on of Funds Amt. Owner's Capital 36,000 Cash 36,000 36,000 36,000
Cash 36,000 Less: Expenses 30,000 Less: Tax Paid 6,000
Balance 0
Sources of Funds Amt. Applica<on of Funds Amt. Owner's Capital 36,000 Cash -‐ +Profit 14,000 Debtors 50,000
50,000 50,000

Case Study on Bad Inventory Management
Hindi Movie – Manufacturing Collars
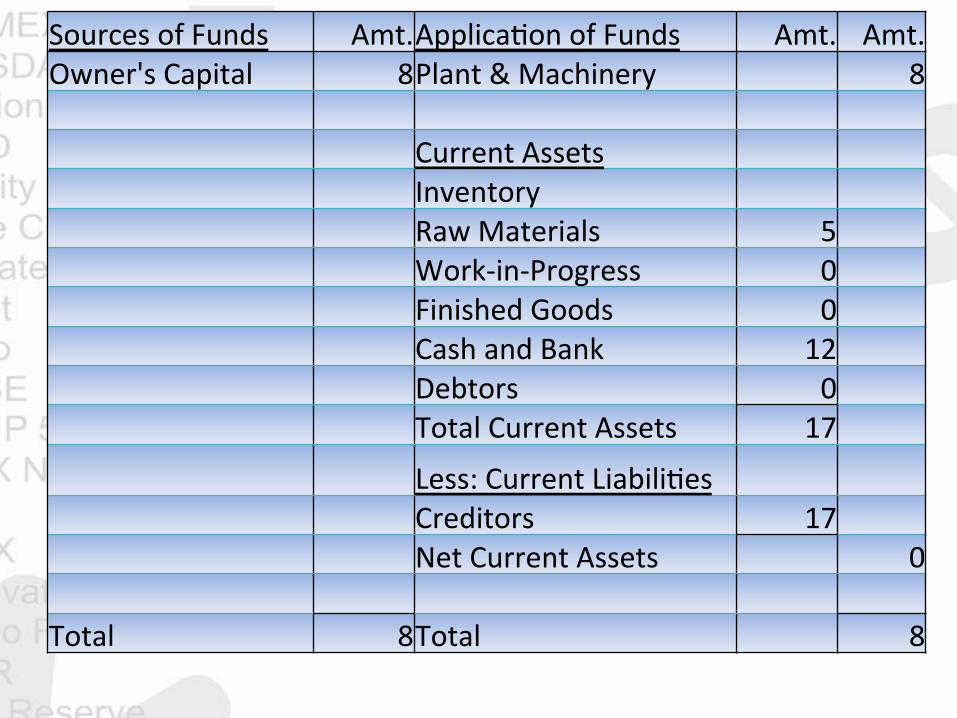
Sources of Funds Amt. Applica0on of Funds Amt. Amt. Owner's Capital 8 Plant & Machinery 8 Current Assets Inventory Raw Materials 5 Work-‐in-‐Progress 0 Finished Goods 0 Cash and Bank 12 Debtors 0 Total Current Assets 17
Less: Current Liabili0es Creditors 17 Net Current Assets 0 Total 8 Total 8

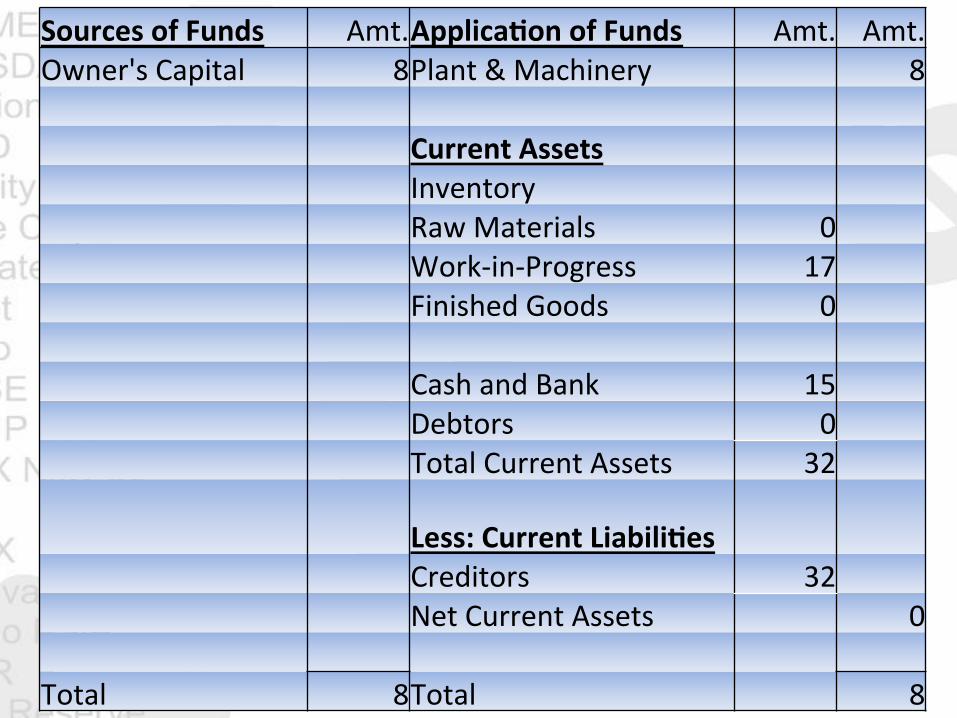
Sources of Funds Amt. Applica<on of Funds Amt. Amt. Owner's Capital 8 Plant & Machinery 8 Current Assets Inventory Raw Materials 0 Work-‐in-‐Progress 17 Finished Goods 0 Cash and Bank 0 Debtors 0 Total Current Assets 17 Less: Current Liabili<es Creditors 17 Net Current Assets 0 Total 8 Total 8
Sources of Funds Amt. Applica<on of Funds Amt. Amt. Owner's Capital 8 Plant & Machinery 8 Current Assets Inventory Raw Materials 0 Work-‐in-‐Progress 17 Finished Goods 0 Cash and Bank 15 Debtors 0 Total Current Assets 32
Less: Current Liabili<es Creditors 32 Net Current Assets 0 Total 8 Total 8

Cash Conversion Cycle
Inventory Period Collec<on Period
Payment Period Cash Conversion Cycle
Raw Materials Purchased Sales Cash Received From Customer
Start of Credit Period Payment Made to Vendor

Prac0cal Applica0ons – Accounts Receivables
• How Sa0sfied is your Customer? – Are you selling to Customers who pay bills on 0me? – Do you have Customer In0macy to talk about Payment Terms?
– Do you provide Excellent Customer Service so as to enable your Customers to pay on 0me?
– Is the product free of defects? – Are invoices accurate? – Does the mailroom send invoices on a 0mely basis? – Is the recep0onist helpful?

Prac0cal Applica0ons
• Inventory – Engineering – do you request special products all the 0me?
– Opera0ons – Are you fond of keeping lots of Stock? • Expenses – Do you defer Expenses? – Do you consider Timing of Cash Flows when purchasing?
• Giving Credit – Do you give credit to poten0al customers too easily? – Do you withhold credit when you should give it?
Mistakes
• Focus on Profits only • Rewarding the sales force for growth alone • Applying Current and Quick Ra0os • Benchmarking Compe0tors

Working Capital Management
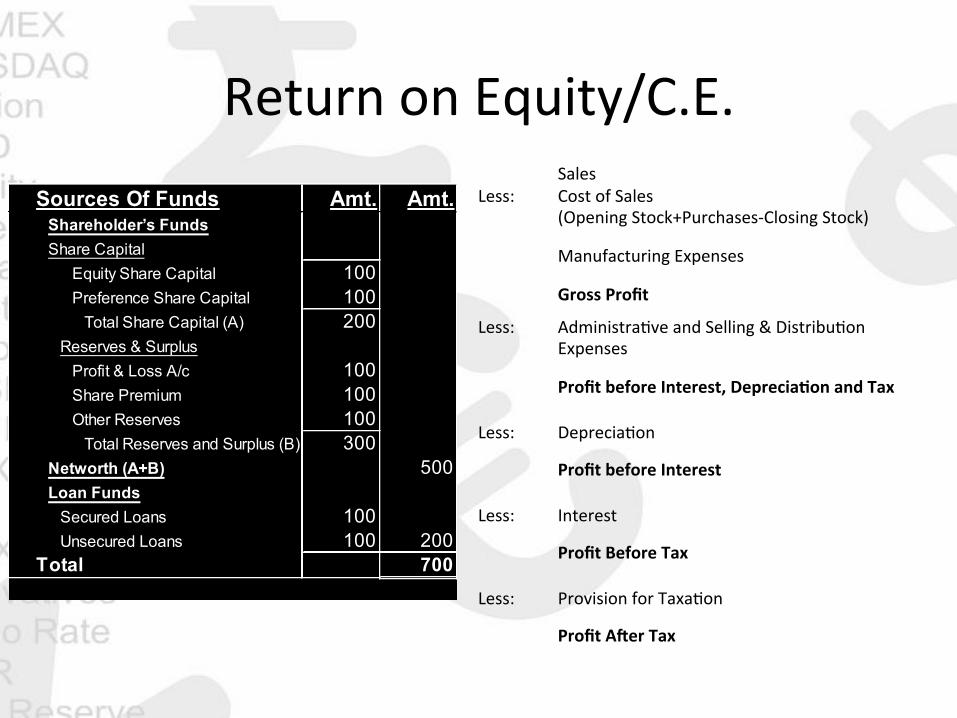
Return on Equity/C.E. Sources Of Funds Amt. Amt.
Shareholder’s FundsShare Capital
Equity Share Capital 100Preference Share Capital 100
Total Share Capital (A) 200Reserves & Surplus
Profit & Loss A/c 100Share Premium 100Other Reserves 100
Total Reserves and Surplus (B) 300Networth (A+B) 500Loan Funds
Secured Loans 100Unsecured Loans 100 200
Total 700Application Of Funds
Sales Less: Cost of Sales
(Opening Stock+Purchases-‐Closing Stock)
Manufacturing Expenses
Gross Profit
Less: Administra0ve and Selling & Distribu0on Expenses
Profit before Interest, Deprecia<on and Tax
Less: Deprecia0on
Profit before Interest
Less: Interest
Profit Before Tax
Less: Provision for Taxa0on
Profit ANer Tax

Equity (Shares of Rs. 10/-‐ Each) 100,000 1,900,000
Debt 1,900,000 100,000 Total Capital Employed 2,000,000 2,000,000 Sales 5,000,000 5,000,000 Less: Opera0ng Expenses 90% 4,500,000 4,500,000
Opera0ng Profit (PBIT) 10% 500,000 500,000
Less: Interest 15% 285,000 15,000
PBT 215,000 485,000
Tax 30% 64,500 145,500
PAT 150,500 339,500 Return on Equity 151% 18% Return on Capital Employed 25% 25%
Earnings Per Share (Rs.) 15.05 1.79
Trading on Equity

Trading on Equity Equity (Shares of Rs. 10/-‐ Each) 100,000 1,900,000 Debt 1,900,000 100,000 Total Capital Employed 2,000,000 2,000,000 Sales 5,000,000 5,000,000 Less: Opera0ng Expenses 94% 4,700,000 4,700,000 Opera0ng Profit (PBIT) 6% 300,000 300,000 Less: Interest 15% 285,000 15,000 PBT 15,000 285,000 Tax 30% 4,500 85,500 PAT 10,500 199,500 Return on Equity 11% 11% Return on Capital Employed 15% 15% Earnings Per Share (Rs.) 1.05 1.05
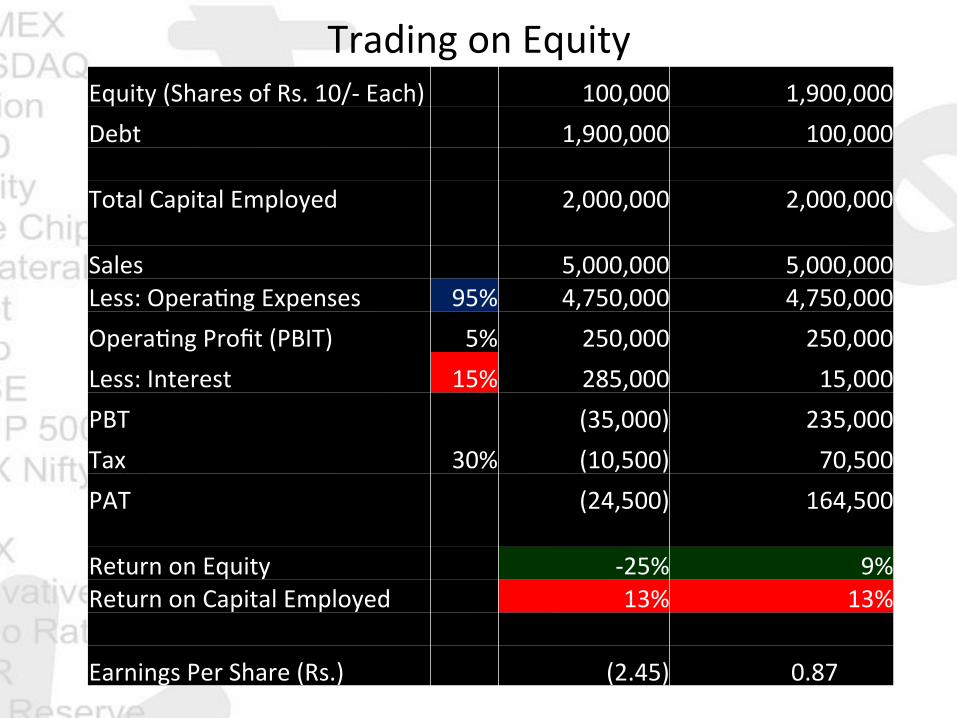
Trading on Equity Equity (Shares of Rs. 10/-‐ Each) 100,000 1,900,000 Debt 1,900,000 100,000 Total Capital Employed 2,000,000 2,000,000 Sales 5,000,000 5,000,000 Less: Opera0ng Expenses 95% 4,750,000 4,750,000 Opera0ng Profit (PBIT) 5% 250,000 250,000 Less: Interest 15% 285,000 15,000 PBT (35,000) 235,000 Tax 30% (10,500) 70,500 PAT (24,500) 164,500 Return on Equity -‐25% 9% Return on Capital Employed 13% 13% Earnings Per Share (Rs.) (2.45) 0.87