Embed Size (px)
Citation preview
Forecasts and Stress Scenarios of Used-Car PricesPEDRO CASTRO, SENIOR ECONOMIST, CREDIT ANALYTICS
TONY HUGHES, MANAGING DIRECTOR, HEAD OF SPECIALIZED MODELING
ZHOU LIU, DIRECTOR, CREDIT ANALYTICS ECONOMIC OUTLOOK CONFERENCE, MAY 2015
22
Used-Car Price Landscape
» Kelley Blue Book and others provide current estimates of used-car
market value but they do not provide forecasts and scenarios.
» Many providers produce subjective assessments of future car values.
ALG combines model-driven projections with subjective overlay.
» Stress-testing has revealed a need for wholly model-driven
projections. Rigorous back-testing and complete documentation are
also mandatory.
» Many applications suggest that purely quantitative approaches
compete very favorably with subjective assessments. Models users’
own subjective overlay can be applied to a “clean canvas.”
33
Introducing: AutoCycle™
Moody’s Analytics AutoCycle™ solution offers a quantitative, consistent,
and documented methodology for incorporating economic factors into car
price forecasts.
» Forecasts are driven by macro factors (supply and demand drivers of
vehicle value in different categories).
» Account for mileage and age; some variations in trim levels.
» We can project both existing and future model years (i.e. 2016 Jeeps).
Phase 1 Complete Complete demo based on models developed for existing clients. These are portfolio-level models
geared to stress-testing lease portfolios of popular car brands.
Phase 2 Apr 2015 More general models developed to cover the full range of cars and trims at a highly granular level.
These models are also geared to portfolio-level analysis.
Phase 3 Jun 2015 VIN-level models, calibrated to the portfolio-level projections, that allow us to consistently capture
individual vehicle characteristics (such as extreme mileage or premium trim packages).
44
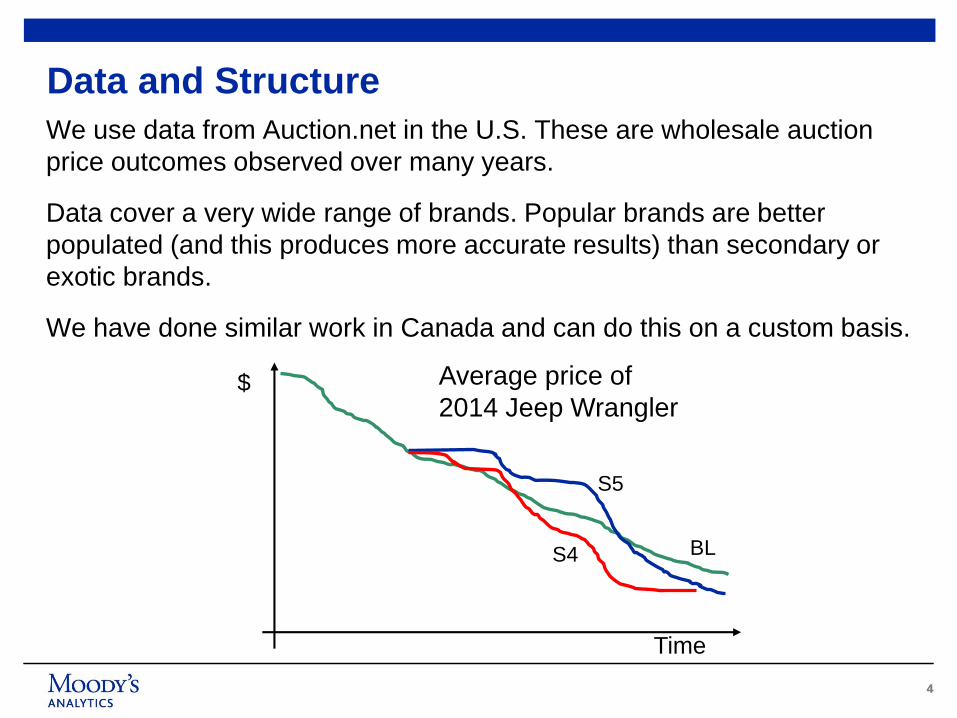
Data and Structure
We use data from Auction.net in the U.S. These are wholesale auction
price outcomes observed over many years.
Data cover a very wide range of brands. Popular brands are better
populated (and this produces more accurate results) than secondary or
exotic brands.
We have done similar work in Canada and can do this on a custom basis.
S5
BLS4
$
Time
Average price of
2014 Jeep Wrangler
55
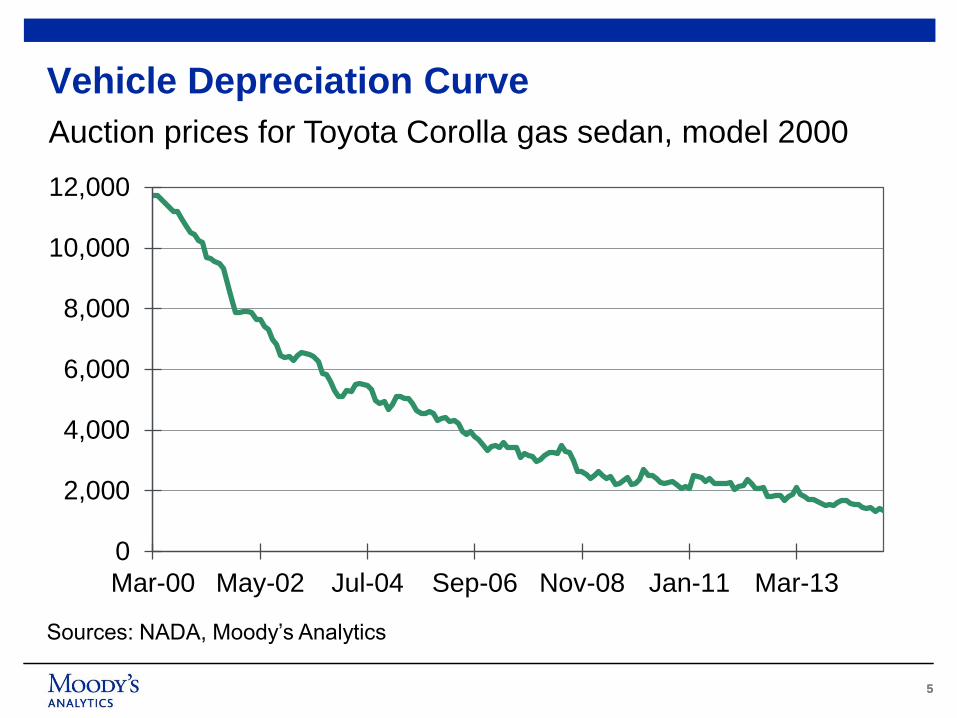
0
2,000
4,000
6,000
8,000
10,000
12,000
Mar-00 May-02 Jul-04 Sep-06 Nov-08 Jan-11 Mar-13
Vehicle Depreciation Curve
Auction prices for Toyota Corolla gas sedan, model 2000
Sources: NADA, Moody’s Analytics
66
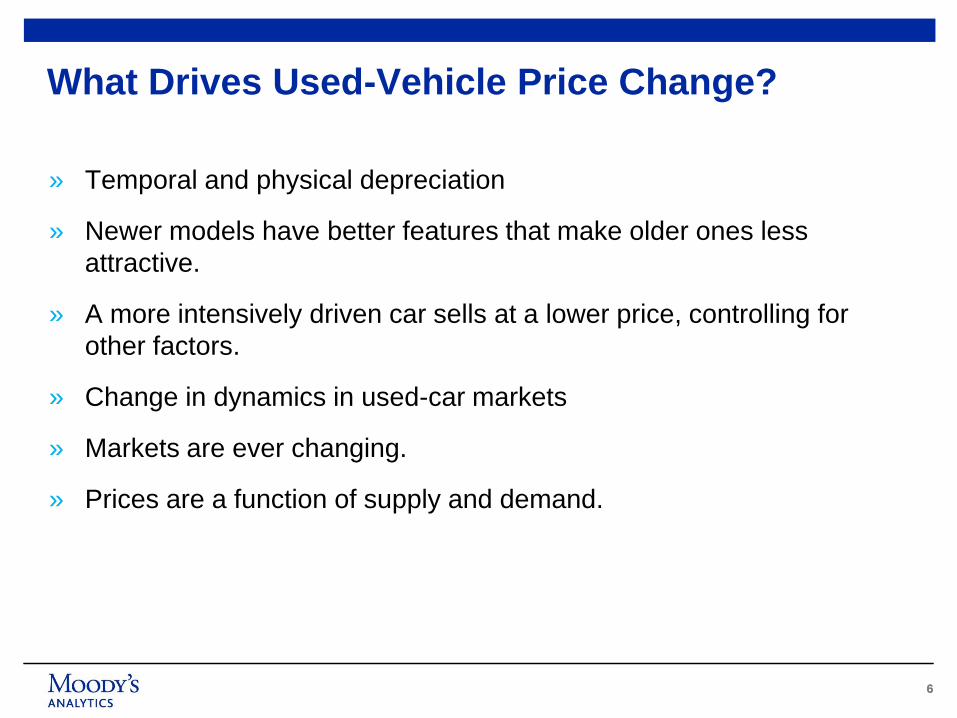
» Temporal and physical depreciation
» Newer models have better features that make older ones less
attractive.
» A more intensively driven car sells at a lower price, controlling for
other factors.
» Change in dynamics in used-car markets
» Markets are ever changing.
» Prices are a function of supply and demand.
What Drives Used-Vehicle Price Change?
77
» Auto markets condition
» Consumer demand condition
» Interest rates
» Gas prices
What Explains Dynamics Change in Used-Car Markets?
88
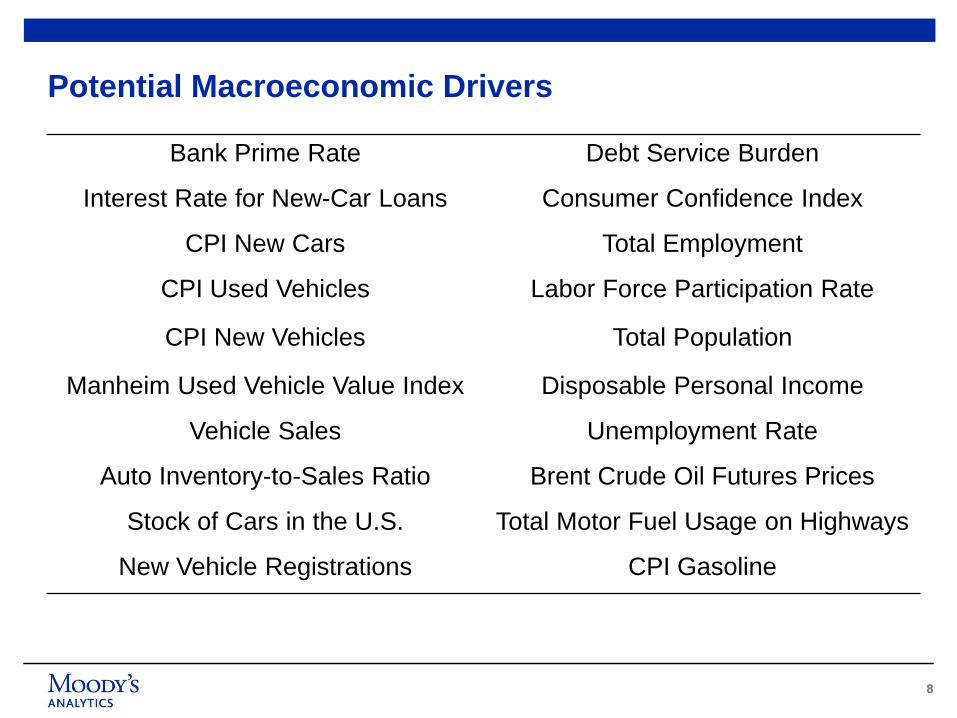
Bank Prime Rate Debt Service Burden
Interest Rate for New-Car Loans Consumer Confidence Index
CPI New Cars Total Employment
CPI Used Vehicles Labor Force Participation Rate
CPI New Vehicles Total Population
Manheim Used Vehicle Value Index Disposable Personal Income
Vehicle Sales Unemployment Rate
Auto Inventory-to-Sales Ratio Brent Crude Oil Futures Prices
Stock of Cars in the U.S. Total Motor Fuel Usage on Highways
New Vehicle Registrations CPI Gasoline
Potential Macroeconomic Drivers
99
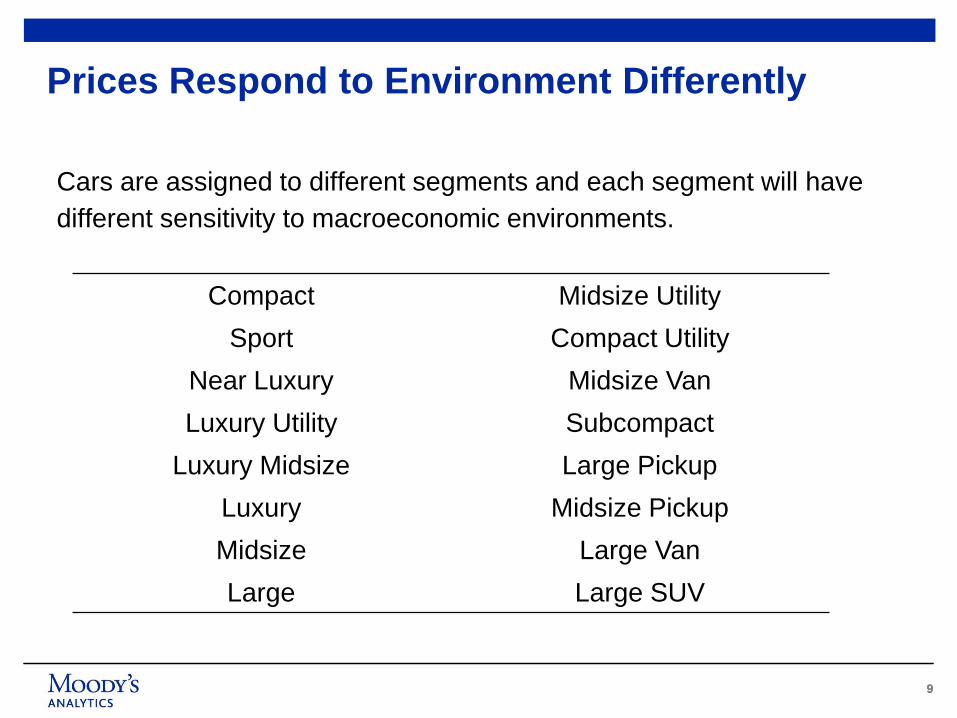
Cars are assigned to different segments and each segment will have
different sensitivity to macroeconomic environments.
Prices Respond to Environment Differently
Compact Midsize Utility
Sport Compact Utility
Near Luxury Midsize Van
Luxury Utility Subcompact
Luxury Midsize Large Pickup
Luxury Midsize Pickup
Midsize Large Van
Large Large SUV
1010
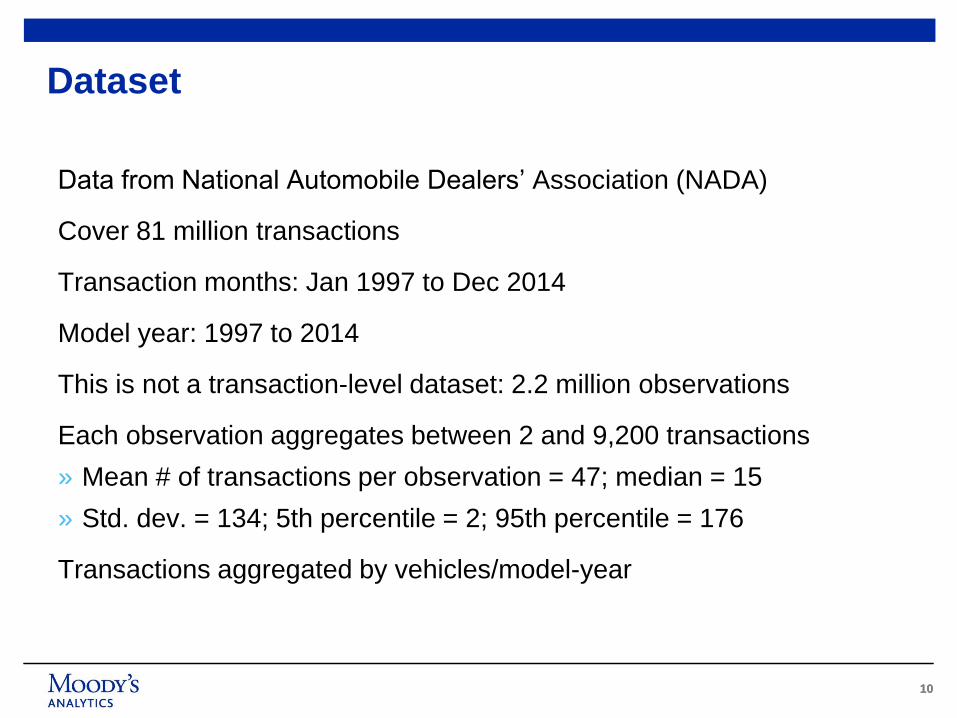
Dataset
Data from National Automobile Dealers’ Association (NADA)
Cover 81 million transactions
Transaction months: Jan 1997 to Dec 2014
Model year: 1997 to 2014
This is not a transaction-level dataset: 2.2 million observations
Each observation aggregates between 2 and 9,200 transactions
» Mean # of transactions per observation = 47; median = 15
» Std. dev. = 134; 5th percentile = 2; 95th percentile = 176
Transactions aggregated by vehicles/model-year
1111
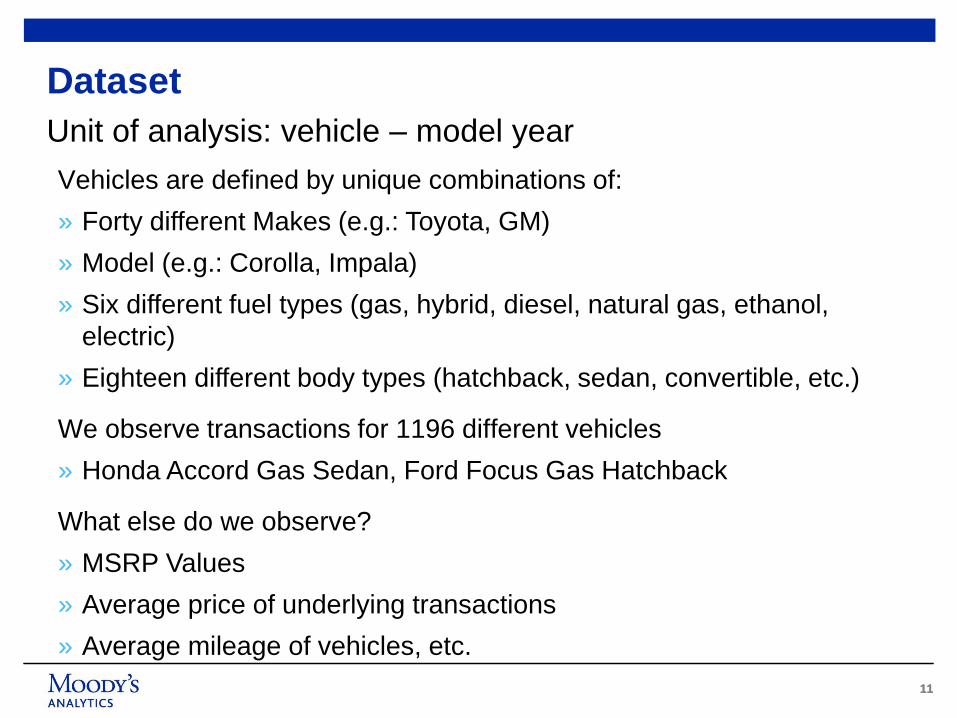
Dataset
Unit of analysis: vehicle – model year
Vehicles are defined by unique combinations of:
» Forty different Makes (e.g.: Toyota, GM)
» Model (e.g.: Corolla, Impala)
» Six different fuel types (gas, hybrid, diesel, natural gas, ethanol,
electric)
» Eighteen different body types (hatchback, sedan, convertible, etc.)
We observe transactions for 1196 different vehicles
» Honda Accord Gas Sedan, Ford Focus Gas Hatchback
What else do we observe?
» MSRP Values
» Average price of underlying transactions
» Average mileage of vehicles, etc.
1212
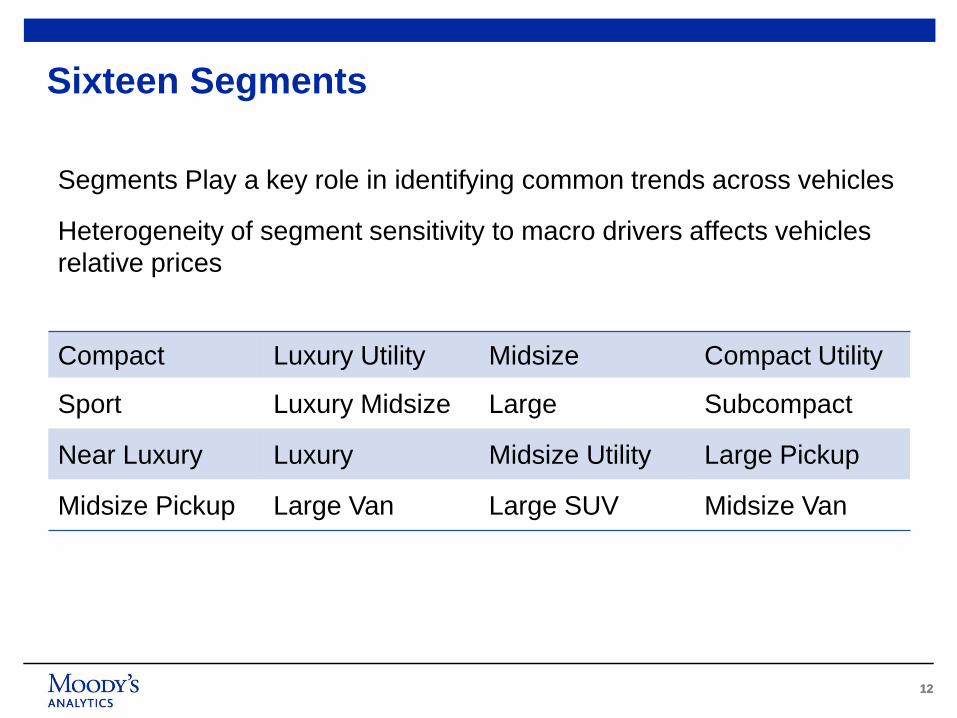
Compact Luxury Utility Midsize Compact Utility
Sport Luxury Midsize Large Subcompact
Near Luxury Luxury Midsize Utility Large Pickup
Midsize Pickup Large Van Large SUV Midsize Van
Sixteen Segments
Segments Play a key role in identifying common trends across vehicles
Heterogeneity of segment sensitivity to macro drivers affects vehicles
relative prices

1313
0.0
0.1
0.2
0.3
0.4
0.5
0.6
0.7
Jan-01 Jan-03 Jan-05 Jan-07 Jan-09 Jan-11 Jan-13
Spliced Fitted
Forecast: Price to MSRP
Ford Taurus gas sedan 2001
Source: Moody’s Analytics
1414
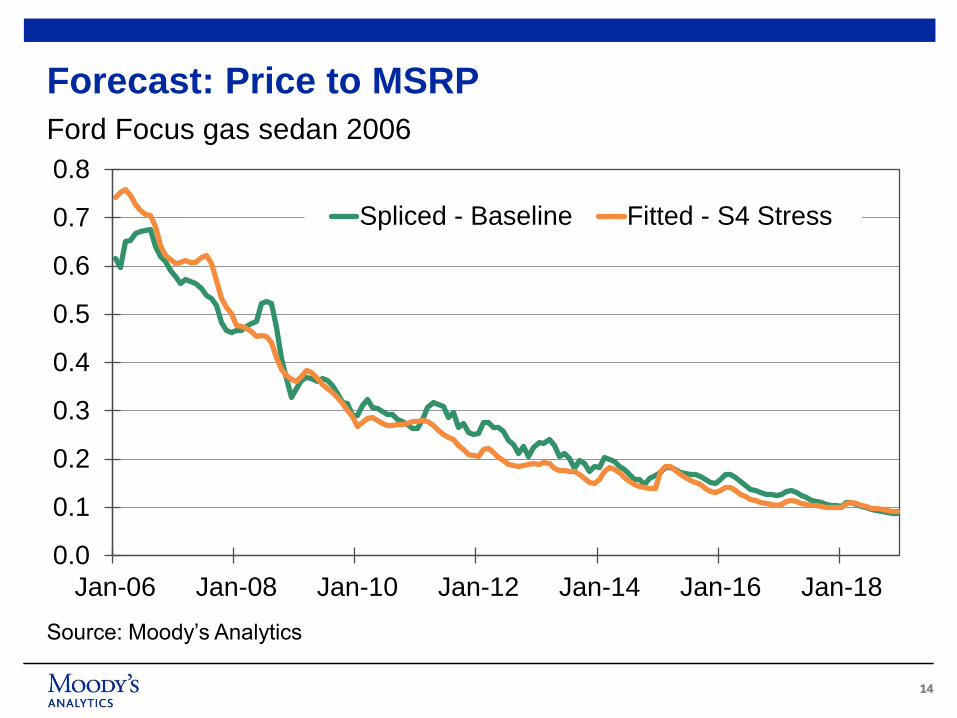
0.0
0.1
0.2
0.3
0.4
0.5
0.6
0.7
0.8
Jan-06 Jan-08 Jan-10 Jan-12 Jan-14 Jan-16 Jan-18
Spliced - Baseline Fitted - S4 Stress
Forecast: Price to MSRP
Ford Focus gas sedan 2006
Source: Moody’s Analytics
1515
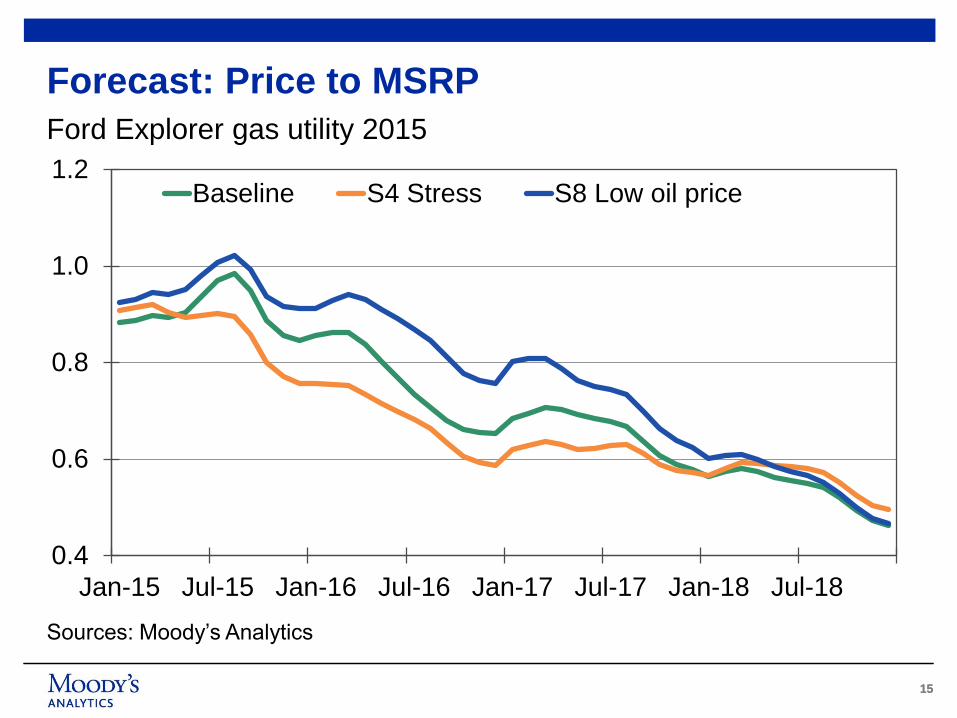
0.4
0.6
0.8
1.0
1.2
Jan-15 Jul-15 Jan-16 Jul-16 Jan-17 Jul-17 Jan-18 Jul-18
Baseline S4 Stress S8 Low oil price
Forecast: Price to MSRP
Ford Explorer gas utility 2015
Sources: Moody’s Analytics

1616
0.4
0.5
0.6
0.7
0.8
0.9
1.0
Jan-15 Jul-15 Jan-16 Jul-16 Jan-17 Jul-17 Jan-18 Jul-18
Baseline S4 Stress S8 Low oil price
Forecast: Price to MSRP
Toyota Camry gas sedan 2015
Source: Moody’s Analytics
1717
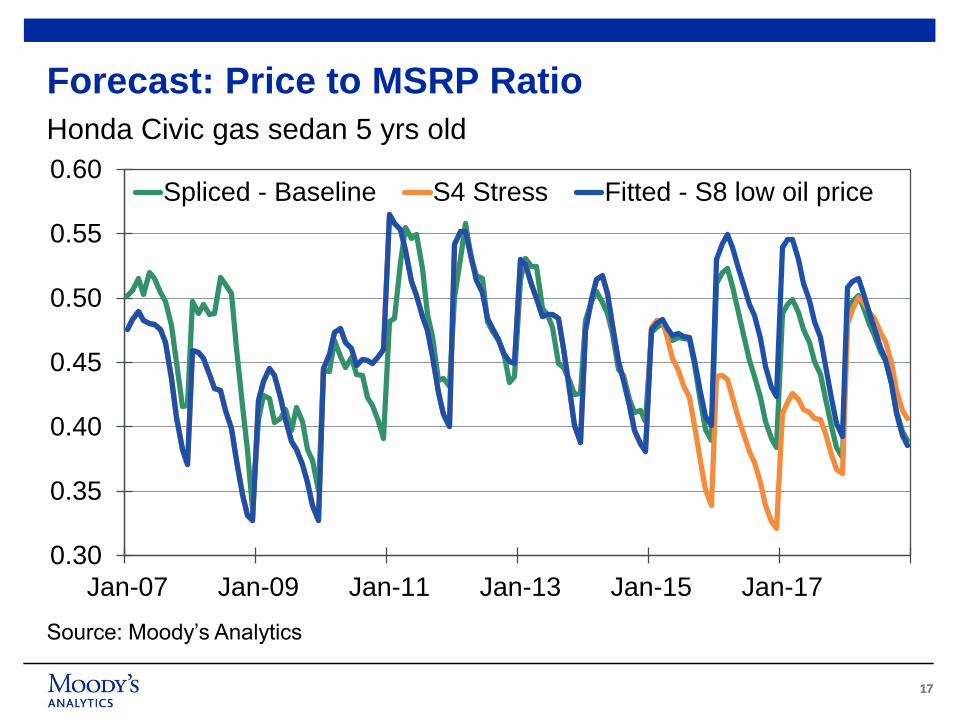
0.30
0.35
0.40
0.45
0.50
0.55
0.60
Jan-07 Jan-09 Jan-11 Jan-13 Jan-15 Jan-17
Spliced - Baseline S4 Stress Fitted - S8 low oil price
Forecast: Price to MSRP Ratio
Honda Civic gas sedan 5 yrs old
Source: Moody’s Analytics
1818
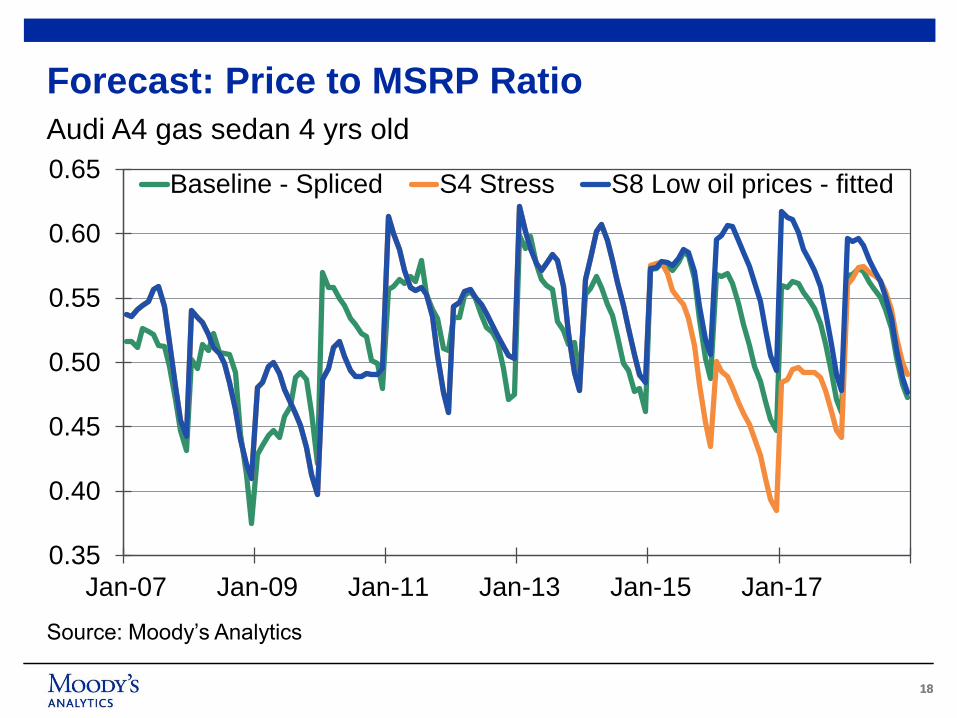
0.35
0.40
0.45
0.50
0.55
0.60
0.65
Jan-07 Jan-09 Jan-11 Jan-13 Jan-15 Jan-17
Baseline - Spliced S4 Stress S8 Low oil prices - fitted
Forecast: Price to MSRP Ratio
Audi A4 gas sedan 4 yrs old
Source: Moody’s Analytics
1919
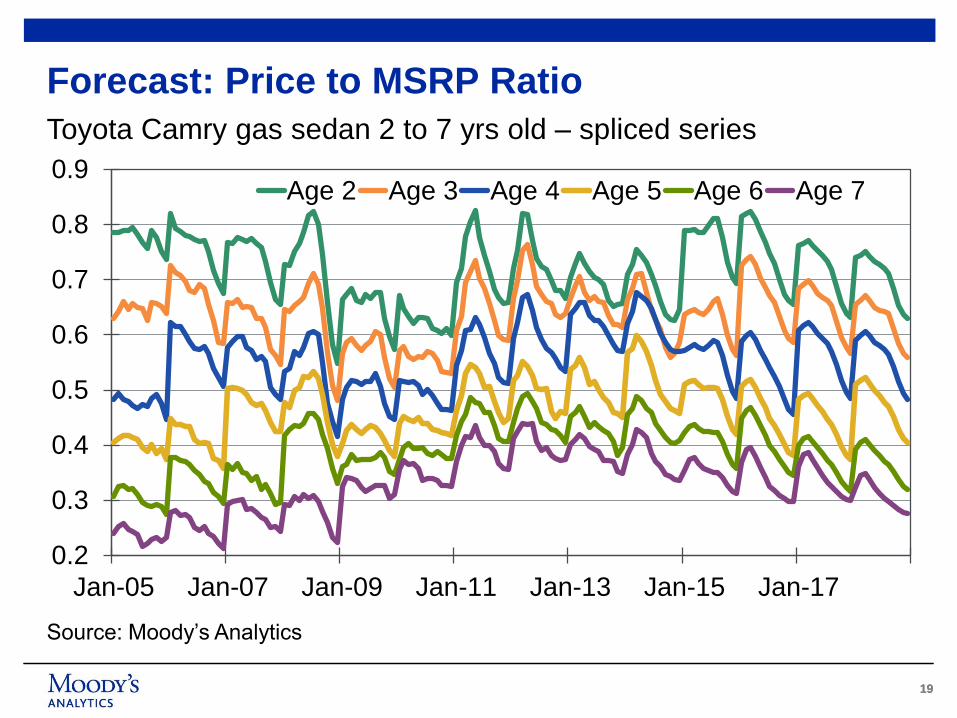
0.2
0.3
0.4
0.5
0.6
0.7
0.8
0.9
Jan-05 Jan-07 Jan-09 Jan-11 Jan-13 Jan-15 Jan-17
Age 2 Age 3 Age 4 Age 5 Age 6 Age 7
Forecast: Price to MSRP Ratio
Toyota Camry gas sedan 2 to 7 yrs old – spliced series
Source: Moody’s Analytics
www.economy.com
United States
121 North Walnut Street
Suite 500
West Chester PA 19380
+1.610.235.5299
Australia
Level 11
1 O'Connell Street
Sydney, NSW, 2000
Australia
+61.2.9270.8111
United Kingdom
One Canada Square
Canary Wharf
London E14 5FA
+44.20.7772.5454
Prague
Washingtonova 17
110 00 Prague 1
Czech Republic
+420.22.422.2929
2121
© 2015 Moody’s Analytics, Inc. and/or its licensors and affiliates (collectively, “MOODY’S”). All rights reserved. ALL INFORMATION CONTAINED HEREIN IS
PROTECTED BY COPYRIGHT LAW AND NONE OF SUCH INFORMATION MAY BE COPIED OR OTHERWISE REPRODUCED, REPACKAGED, FURTHER
TRANSMITTED, TRANSFERRED, DISSEMINATED, REDISTRIBUTED OR RESOLD, OR STORED FOR SUBSEQUENT USE FOR ANY SUCH PURPOSE, IN
WHOLE OR IN PART, IN ANY FORM OR MANNER OR BY ANY MEANS WHATSOEVER, BY ANY PERSON WITHOUT MOODY’S PRIOR WRITTEN CONSENT.
All information contained herein is obtained by MOODY’S from sources believed by it to be accurate and reliable. Because of the possibility of human or
mechanical error as well as other factors, however, all information contained herein is provided “AS IS” without warranty of any kind. Under no circumstances shall
MOODY’S have any liability to any person or entity for (a) any loss or damage in whole or in part caused by, resulting from, or relating to, any error (negligent or
otherwise) or other circumstance or contingency within or outside the control of MOODY’S or any of its directors, officers, employees or agents in connection with
the procurement, collection, compilation, analysis, interpretation, communication, publication or delivery of any such information, or (b) any direct, indirect, special,
consequential, compensatory or incidental damages whatsoever (including without limitation, lost profits), even if MOODY’S is advised in advance of the possibility
of such damages, resulting from the use of or inability to use, any such information. The ratings, financial reporting analysis, projections, and other observations, if
any, constituting part of the information contained herein are, and must be construed solely as, statements of opinion and not statements of fact or
recommendations to purchase, sell or hold any securities. NO WARRANTY, EXPRESS OR IMPLIED, AS TO THE ACCURACY, TIMELINESS, COMPLETENESS,
MERCHANTABILITY OR FITNESS FOR ANY PARTICULAR PURPOSE OF ANY SUCH RATING OR OTHER OPINION OR INFORMATION IS GIVEN OR MADE
BY MOODY’S IN ANY FORM OR MANNER WHATSOEVER. Each rating or other opinion must be weighed solely as one factor in any investment decision made
by or on behalf of any user of the information contained herein, and each such user must accordingly make its own study and evaluation of each security and of
each issuer and guarantor of, and each provider of credit support for, each security that it may consider purchasing, holding, or selling.