Embed Size (px)
Citation preview
Bank Vozrozhdenie Promising SME and retail local franchise
Investor presentation October, 2013

2
This page is intentionally left blank
3
Agenda
Key facts Business model Business overview Recent IFRS results Investment summary
4
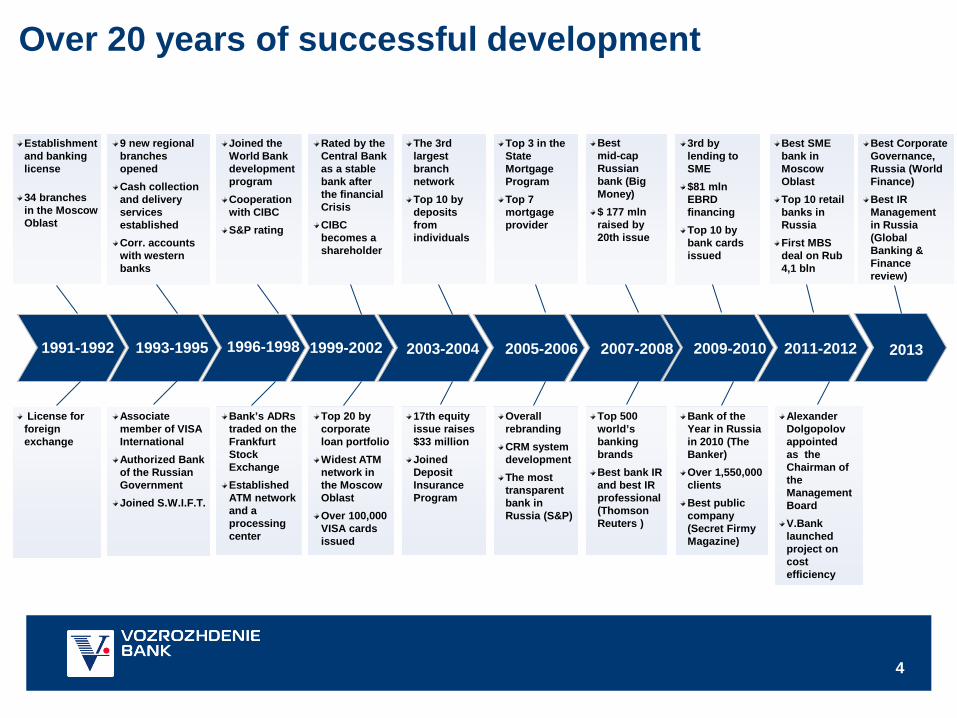
Over 20 years of successful development
1991-1992 1993-1995
Establishment and banking license
34 branches in the Moscow Oblast
1996-1998 2003-2004 1999-2002 2005-2006 2007-2008 2009-2010 2011-2012
9 new regional branches opened Cash collection and delivery services established Corr. accounts with western banks
License for foreign exchange
Associate member of VISA International Authorized Bank of the Russian Government Joined S.W.I.F.T.
Joined the World Bank development program Cooperation with CIBC S&P rating
Rated by the Central Bank as a stable bank after the financial Crisis CIBC becomes a shareholder
The 3rd largest branch network Top 10 by deposits from individuals
Top 3 in the State Mortgage Program Top 7 mortgage provider
Best mid-cap Russian bank (Big Money) $ 177 mln raised by 20th issue
3rd by lending to SME $81 mln EBRD financing Top 10 by bank cards issued
Best SME bank in Moscow Oblast Top 10 retail banks in Russia First MBS deal on Rub 4,1 bln
Bank’s ADRs traded on the Frankfurt Stock Exchange Established ATM network and a processing center
Top 20 by corporate loan portfolio Widest ATM network in the Moscow Oblast Over 100,000 VISA cards issued
17th equity issue raises $33 million Joined Deposit Insurance Program
Overall rebranding CRM system development The most transparent bank in Russia (S&P)
Top 500 world’s banking brands Best bank IR and best IR professional (Thomson Reuters )
Bank of the Year in Russia in 2010 (The Banker) Over 1,550,000 clients Best public company (Secret Firmy Magazine)
Alexander Dolgopolov appointed as the Chairman of the Management Board V.Bank launched project on cost efficiency
2013
Best Corporate Governance, Russia (World Finance) Best IR Management in Russia (Global Banking & Finance review)
5
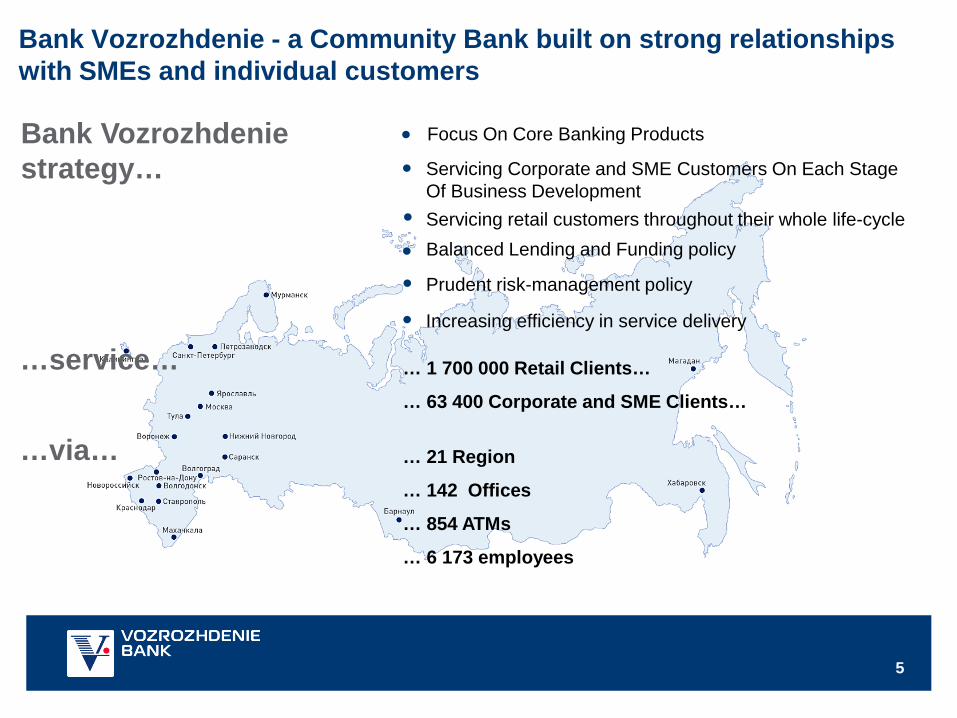
Prudent risk-management policy
Balanced Lending and Funding policy Servicing retail customers throughout their whole life-cycle
Servicing Corporate and SME Customers On Each Stage Of Business Development
Bank Vozrozhdenie strategy…
… 1 700 000 Retail Clients…
… 63 400 Corporate and SME Clients…
… 21 Region
… 142 Offices
… 854 ATMs
… 6 173 employees
Focus On Core Banking Products
…service…
…via…
Increasing efficiency in service delivery
Bank Vozrozhdenie - a Community Bank built on strong relationships with SMEs and individual customers
6
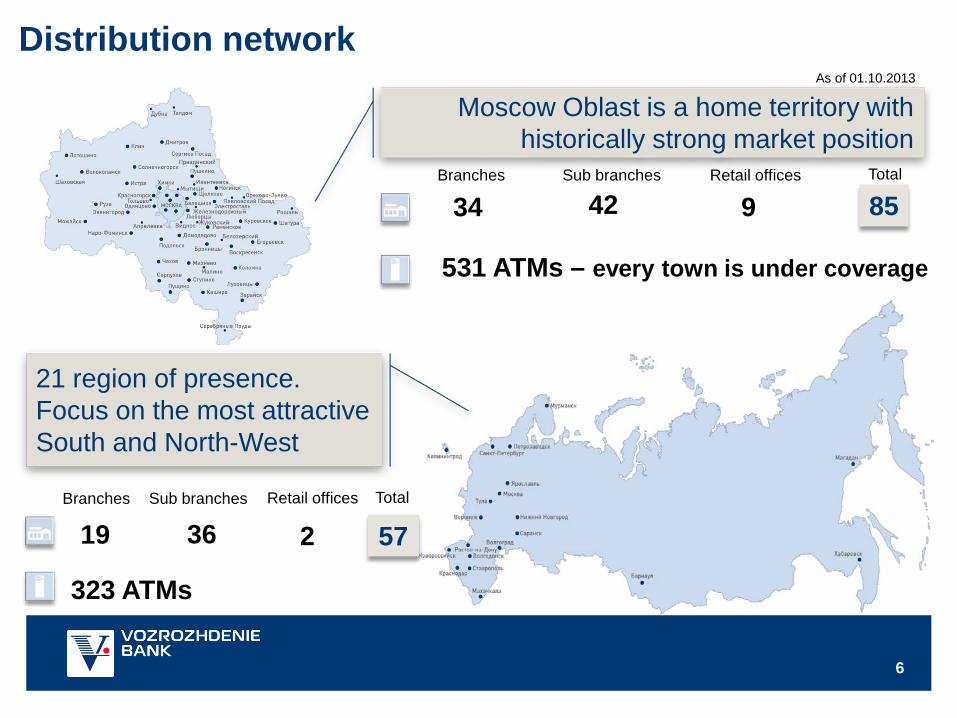
Moscow Oblast is a home territory with historically strong market position
21 region of presence. Focus on the most attractive South and North-West
Branches Sub branches Retail offices
34 42 9 85 Total
As of 01.10.2013
531 ATMs – every town is under coverage
19 36 2 57 Total
323 ATMs
Retail offices Branches Sub branches
Distribution network
7
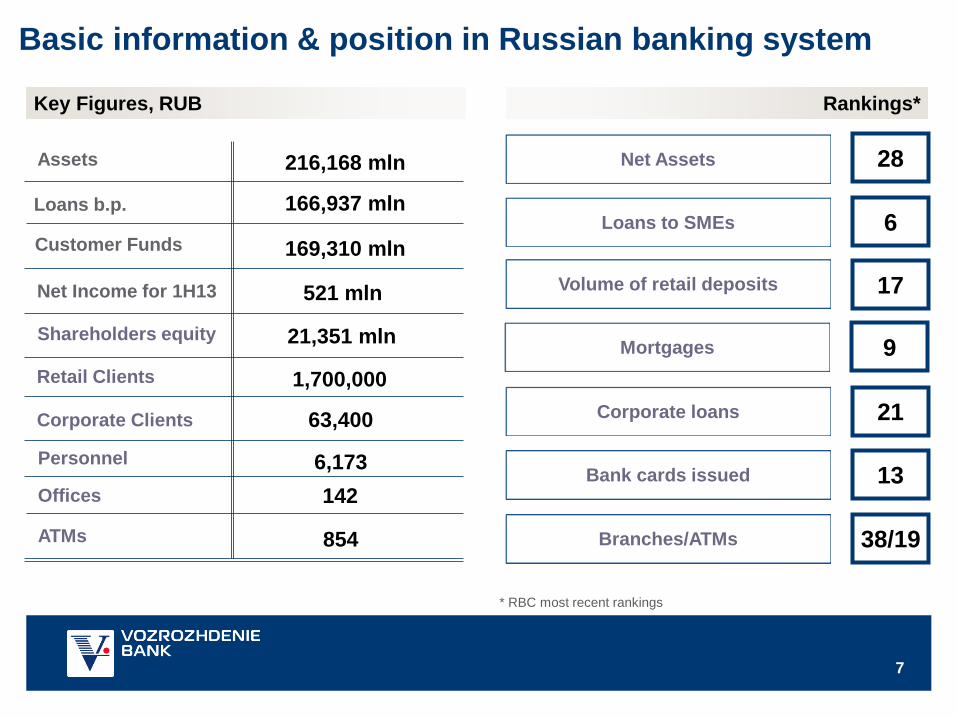
* RBC most recent rankings
Key Figures, RUB
Assets
Loans b.p.
Customer Funds
Net Income for 1H13
Shareholders equity
Retail Clients
Corporate Clients
Personnel
Offices
ATMs
216,168 mln
166,937 mln
169,310 mln
521 mln
21,351 mln
1,700,000
63,400
6,173 142
854
Loans to SMEs 6
17
38/19
28
13
Volume of retail deposits
Branches/ATMs
Net Assets
Bank cards issued
Rankings*
Corporate loans 21
Mortgages 9
Basic information & position in Russian banking system
8
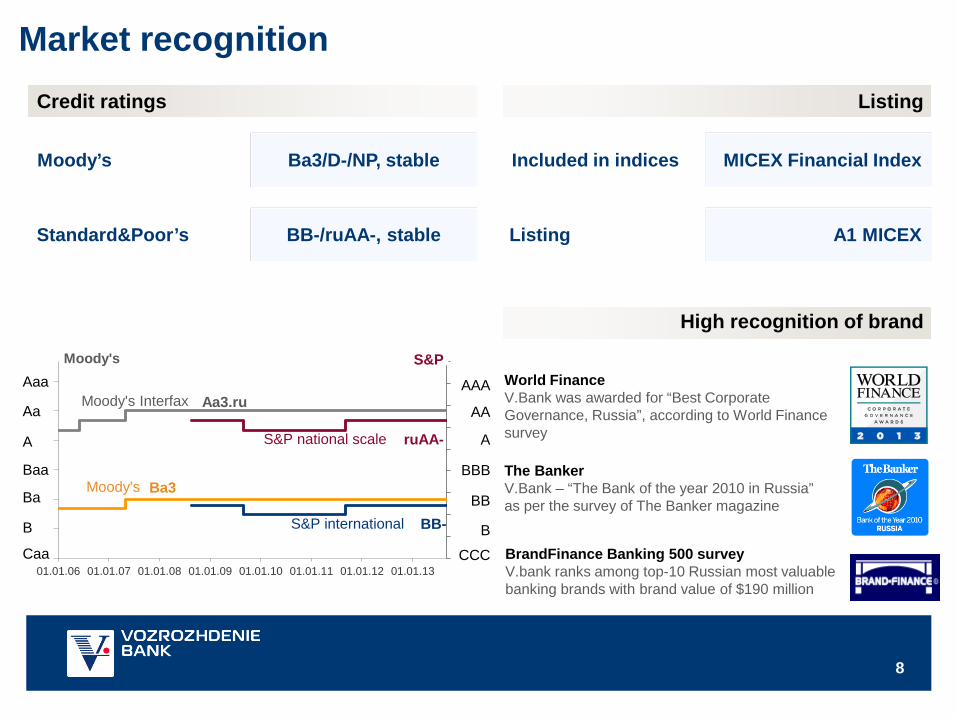
Ba3/D-/NP, stable
BB-/ruAA-, stable
MICEX Financial Index
A1 MICEX
Moody’s
Standard&Poor’s
Included in indices
Listing
BrandFinance Banking 500 survey V.bank ranks among top-10 Russian most valuable banking brands with brand value of $190 million
The Banker V.Bank – “The Bank of the year 2010 in Russia” as per the survey of The Banker magazine
Market recognition Credit ratings Listing
High recognition of brand
World Finance V.Bank was awarded for “Best Corporate Governance, Russia”, according to World Finance survey
051015202530354045
7
10
13
16
19
22
25
01.01.06 01.01.07 01.01.08 01.01.09 01.01.10 01.01.11 01.01.12 01.01.13
S&P
S&P international BB-
Ba3 Moody's
Moody's Interfax
Moody's Aaa
Aa
A
Baa
Ba
B
Caa
S&P national scale ruAA-
AAA
AA
A
BBB
BB
B
CCC
Aa3.ru

9
Business model
10
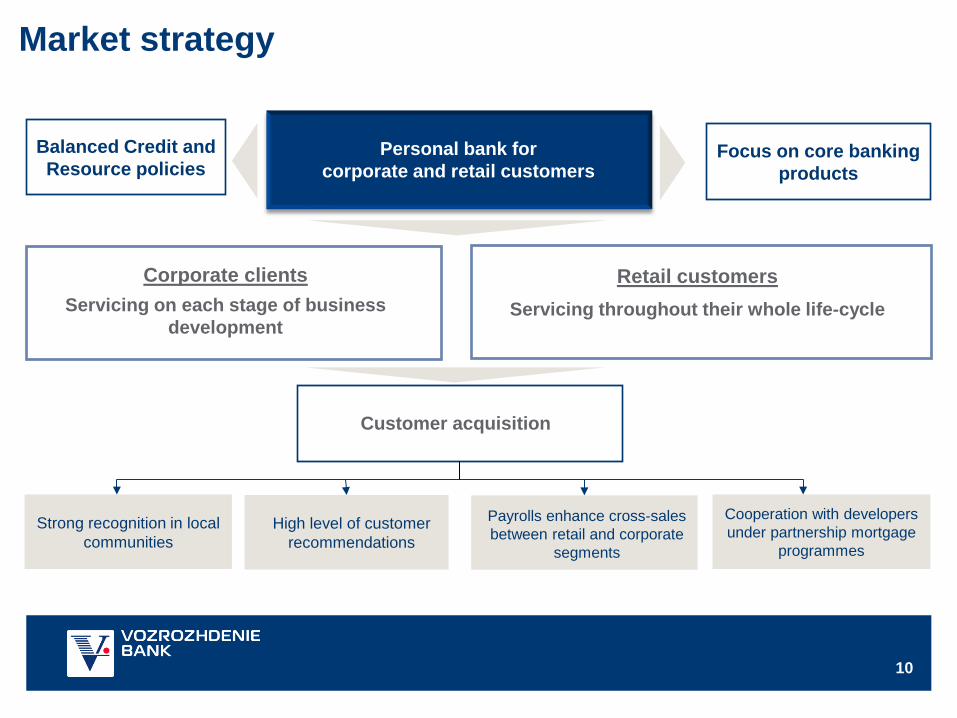
Personal bank for corporate and retail customers
Retail customers Servicing throughout their whole life-cycle
Corporate clients Servicing on each stage of business
development
Focus on core banking products
Balanced Credit and Resource policies
Cooperation with developers under partnership mortgage
programmes
Customer acquisition
Strong recognition in local communities
Market strategy
High level of customer recommendations
Payrolls enhance cross-sales between retail and corporate
segments
11
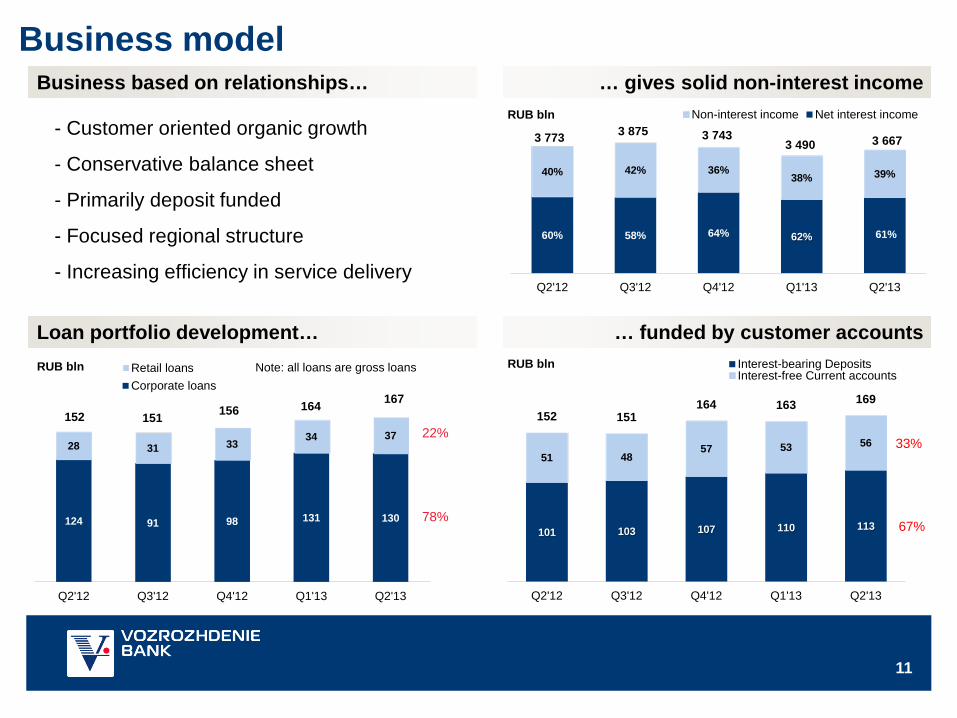
60% 58% 64% 62% 61%
40% 42% 36% 38% 39%
3 773 3 875 3 743 3 490 3 667
Q2'12 Q3'12 Q4'12 Q1'13 Q2'13
Non-interest income Net interest income
124 91 98 131 130
28 31 33 34 37 152 151 156 164 167
Q2'12 Q3'12 Q4'12 Q1'13 Q2'13
Retail loansCorporate loans
- Customer oriented organic growth
- Conservative balance sheet
- Primarily deposit funded
- Focused regional structure
- Increasing efficiency in service delivery
Note: all loans are gross loans
RUB bln
RUB bln
22%
78%
RUB bln
33%
67%
Business model Business based on relationships… … gives solid non-interest income
Loan portfolio development… … funded by customer accounts
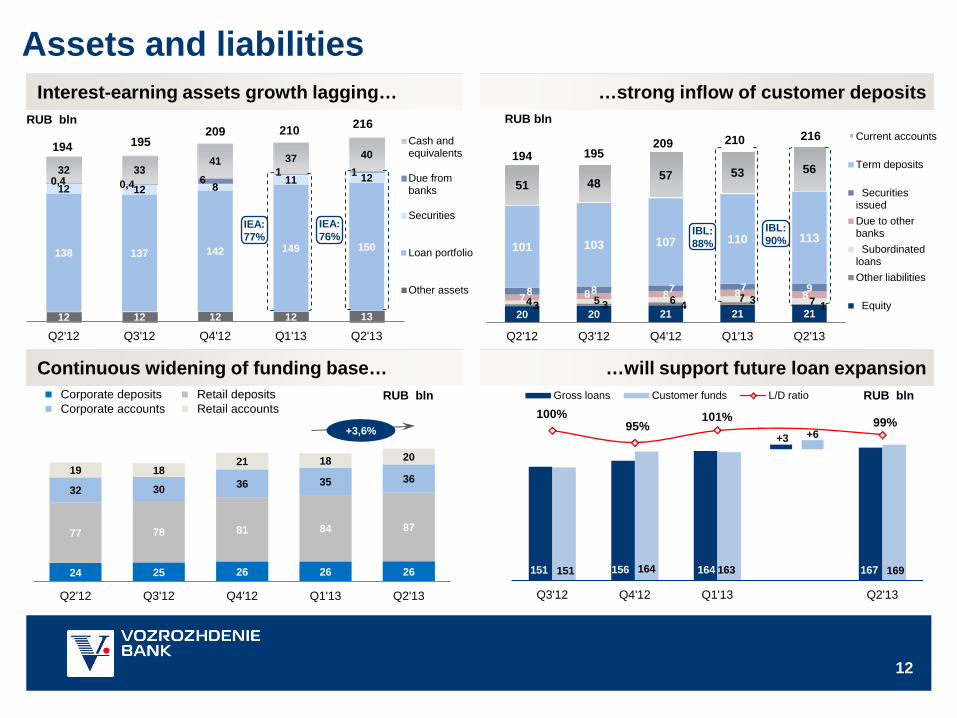
101 103 107 110 113
51 48 57 53 56
152 151 164 163 169
Q2'12 Q3'12 Q4'12 Q1'13 Q2'13
Interest-bearing DepositsInterest-free Current accounts
12
12 12 12 12 13
138 137 142 149 150
12 12 8 11 12 0,4 0,4 6 1 1 32 33
41 37 40 194 195 209 210 216
Q2'12 Q3'12 Q4'12 Q1'13 Q2'13
Cash andequivalents
Due frombanks
Securities
Loan portfolio
Other assets
Assets and liabilities
RUB bln
Interest-earning assets growth lagging… …strong inflow of customer deposits RUB bln
RUB bln
Continuous widening of funding base… …will support future loan expansion
151 156 164 167 151 164 163 169
100% 95%
101% 99%
Q3'12 Q4'12 Q1'13 Q2'13
Gross loans Customer funds L/D ratio
24 25 26 26 26
77 78 81 84 87
32 30 36 35 36 19 18
21 18 20
Q2'12 Q3'12 Q4'12 Q1'13 Q2'13
Corporate deposits Retail deposits Corporate accounts Retail accounts
RUB bln
+3,6% +3 +6
20 20 21 21 21 3 3 4 3 1 4 5 6 7 7 7 8 8 8 8 8 8 7 7 9
101 103 107 110 113
51 48 57 53 56 194 195
209 210 216
Q2'12 Q3'12 Q4'12 Q1'13 Q2'13
Current accounts
Term deposits
SecuritiesissuedDue to otherbanks SubordinatedloansOther liabilities
Equity
IEA: 76%
IEA: 77%
IBL: 90%
IBL: 88%
13
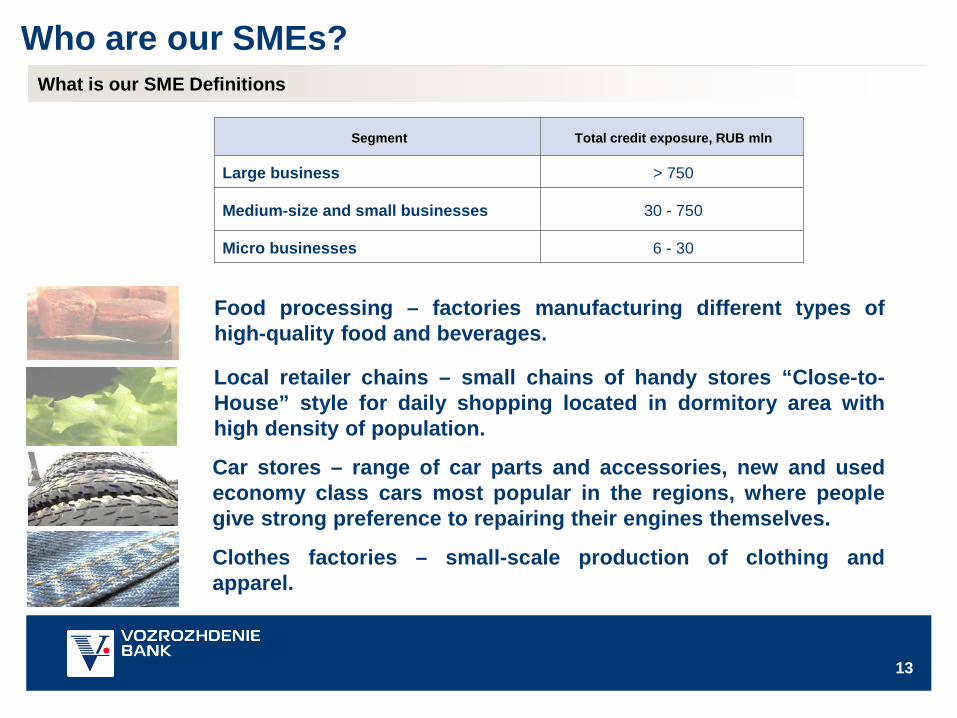
Segment Total credit exposure, RUB mln
Large business > 750
Medium-size and small businesses 30 - 750
Micro businesses 6 - 30
Food processing – factories manufacturing different types of high-quality food and beverages.
Car stores – range of car parts and accessories, new and used economy class cars most popular in the regions, where people give strong preference to repairing their engines themselves.
Clothes factories – small-scale production of clothing and apparel.
Local retailer chains – small chains of handy stores “Close-to-House” style for daily shopping located in dormitory area with high density of population.
Who are our SMEs? What is our SME Definitions
14
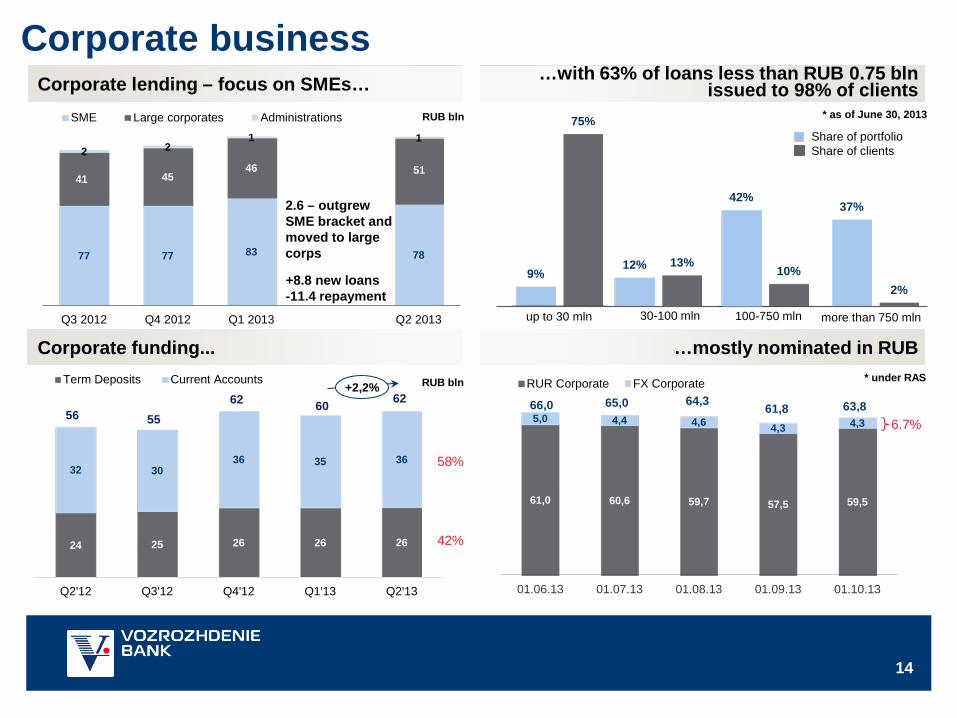
61,0 60,6 59,7 57,5 59,5
5,0 4,4 4,6 4,3 4,3 66,0 65,0 64,3 61,8 63,8
01.06.13 01.07.13 01.08.13 01.09.13 01.10.13
RUR Corporate FX Corporate
37%
2%
12% 13% 9%
75%
0%
10%
20%
30%
40%
50%
60%
70%
80%
up to 30 mln 30-100 mln 100-750 mln more than 750 mln
RUB bln * as of June 30, 2013
Share of portfolio Share of clients
42%
10%
6.7%
24 25 26 26 26
32 30 36 35 36
56 55 62 60 62
Q2'12 Q3'12 Q4'12 Q1'13 Q2'13
Term Deposits Current Accounts +2,2% RUB bln
58%
42%
* under RAS
Corporate business Corporate lending – focus on SMEs… …with 63% of loans less than RUB 0.75 bln
issued to 98% of clients
Corporate funding... …mostly nominated in RUB
78 83 77 77
51 46 45 41
1 1 2 2
Q2 2013Q1 2013Q4 2012Q3 2012
SME Large corporates Administrations
2.6 – outgrew SME bracket and moved to large corps
+8.8 new loans -11.4 repayment
15
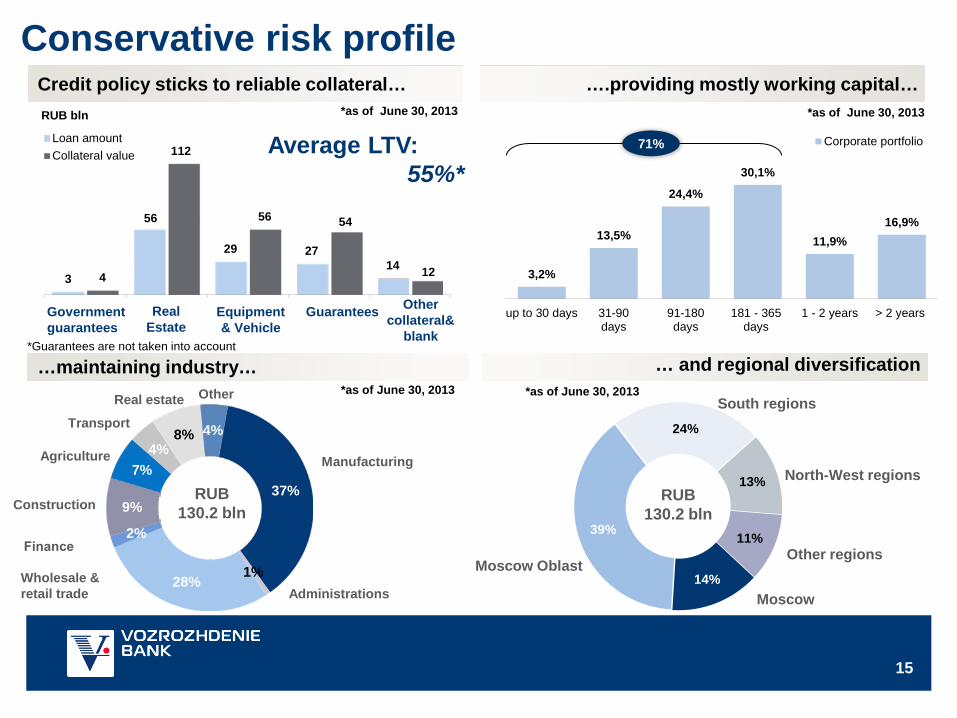
3,2%
13,5%
24,4%
30,1%
11,9% 16,9%
up to 30 days 31-90days
91-180days
181 - 365days
1 - 2 years > 2 years
Corporate portfolio
3
56
29 27 14
4
112
56 54
12
Loan amountCollateral value
Real Estate
Government guarantees
Equipment & Vehicle
Guarantees Other collateral&
blank
RUB bln
71%
*Guarantees are not taken into account
*as of June 30, 2013
… and regional diversification …maintaining industry…
Conservative risk profile Credit policy sticks to reliable collateral… ….providing mostly working capital…
Average LTV: 55%*
37%
1% 28%
2%
9%
7% 4%
8% 4%
Construction
Manufacturing Agriculture
Wholesale & retail trade Administrations
Other
Transport
Real estate
RUB 130.2 bln
*as of June 30, 2013
*as of June 30, 2013
14%
39%
24%
13%
11%
Moscow Oblast
Moscow
Other regions
South regions
North-West regions RUB
130.2 bln
*as of June 30, 2013
16
Retail lending – promising segment
5
10
15
20
25
01.07.10 01.01.11 01.07.11 01.01.12 01.07.12 01.01.13 01.07.13
Consumer loans, RUBMortgages, RUBCredit cards, RUB
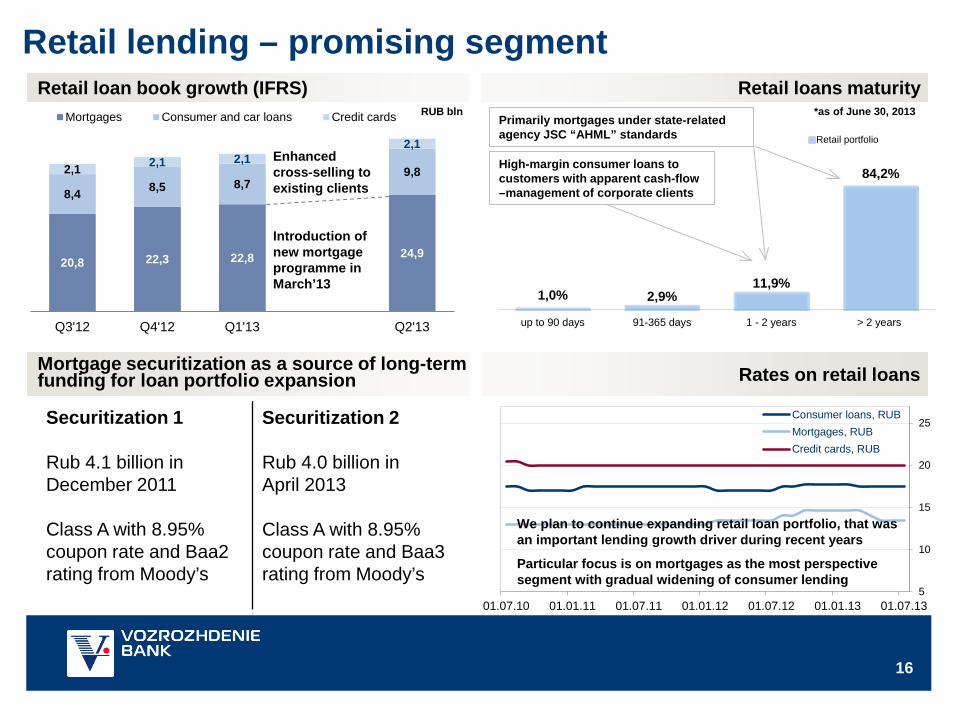
1,0% 2,9% 11,9%
84,2%
up to 90 days 91-365 days 1 - 2 years > 2 years
Retail portfolio
RUB bln
High-margin consumer loans to customers with apparent cash-flow –management of corporate clients
Primarily mortgages under state-related agency JSC “AHML” standards
We plan to continue expanding retail loan portfolio, that was an important lending growth driver during recent years
Particular focus is on mortgages as the most perspective segment with gradual widening of consumer lending
*as of June 30, 2013
Retail loans maturity Retail loan book growth (IFRS)
Rates on retail loans Mortgage securitization as a source of long-term funding for loan portfolio expansion
20,8 22,3 22,8 24,9
8,4 8,5 8,7 9,8 2,1 2,1 2,1 2,1
Q3'12 Q4'12 Q1'13 Q2'13
Mortgages Consumer and car loans Credit cards
Enhanced cross-selling to existing clients Introduction of new mortgage programme in March’13
Securitization 1 Rub 4.1 billion in December 2011 Class A with 8.95% coupon rate and Baa2 rating from Moody’s
Securitization 2 Rub 4.0 billion in April 2013 Class A with 8.95% coupon rate and Baa3 rating from Moody’s
17
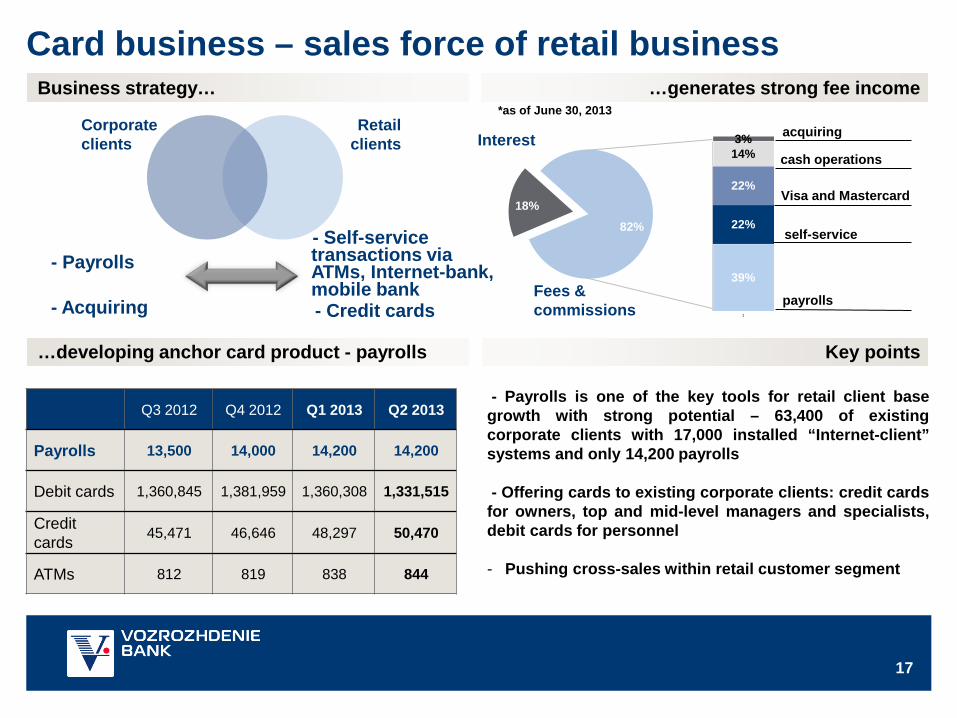
acquiring
Visa and Mastercard
self-service
Card business – sales force of retail business
Q3 2012 Q4 2012 Q1 2013 Q2 2013
Payrolls 13,500 14,000 14,200 14,200
Debit cards 1,360,845 1,381,959 1,360,308 1,331,515
Credit cards 45,471 46,646 48,297 50,470
ATMs 812 819 838 844
Corporate clients
Retail clients
- Payrolls
- Acquiring
- Self-service transactions via ATMs, Internet-bank, mobile bank - Credit cards
70% 18%
82%
Interest
Fees & commissions
- Payrolls is one of the key tools for retail client base growth with strong potential – 63,400 of existing corporate clients with 17,000 installed “Internet-client” systems and only 14,200 payrolls - Offering cards to existing corporate clients: credit cards for owners, top and mid-level managers and specialists, debit cards for personnel - Pushing cross-sales within retail customer segment
39%
22%
22%
14% 3%
1
cash operations
payrolls
Key points …developing anchor card product - payrolls
…generates strong fee income Business strategy… *as of June 30, 2013

18
Risk management
19
Sound position on capital, liquidity and market risks
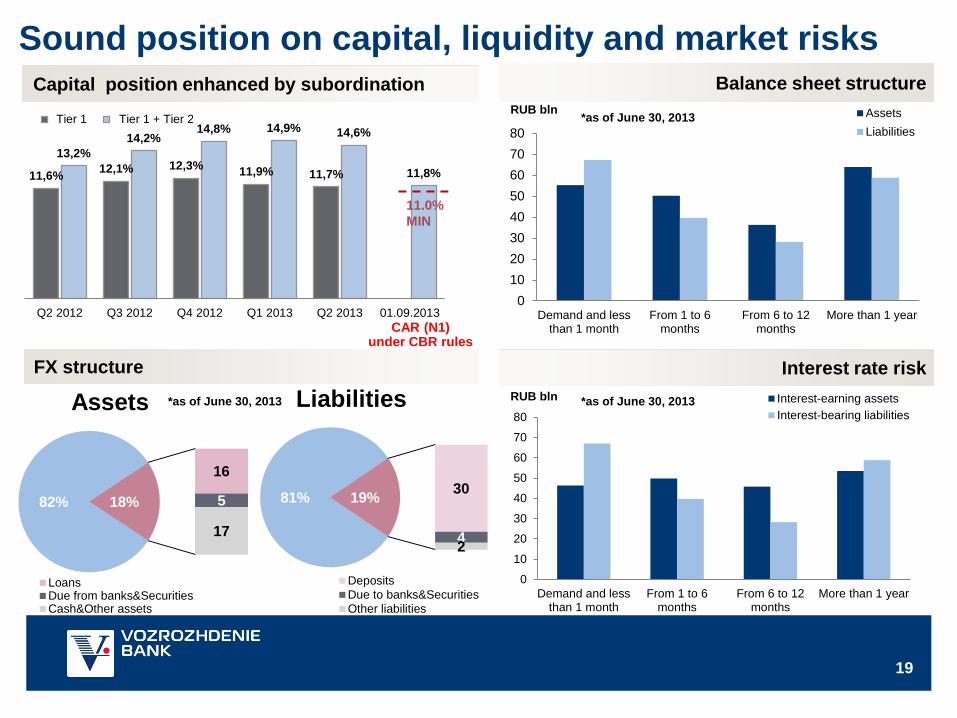
11,6% 12,1% 12,3% 11,9% 11,7%
13,2% 14,2%
14,8% 14,9% 14,6%
11,8%
Q2 2012 Q3 2012 Q4 2012 Q1 2013 Q2 2013 01.09.2013
Tier 1 Tier 1 + Tier 2
CAR (N1) under CBR rules
11.0% MIN
Capital position enhanced by subordination
FX structure
Balance sheet structure
Interest rate risk
01020304050607080
Demand and lessthan 1 month
From 1 to 6months
From 6 to 12months
More than 1 year
AssetsLiabilities
RUB bln
0
10
20
30
40
50
60
70
80
Demand and lessthan 1 month
From 1 to 6months
From 6 to 12months
More than 1 year
Interest-earning assetsInterest-bearing liabilities
RUB bln
82%
16
5
17
18%
Assets
LoansDue from banks&SecuritiesCash&Other assets
81% 30
4 2
19%
Liabilities
DepositsDue to banks&SecuritiesOther liabilities
*as of June 30, 2013
*as of June 30, 2013 *as of June 30, 2013
20
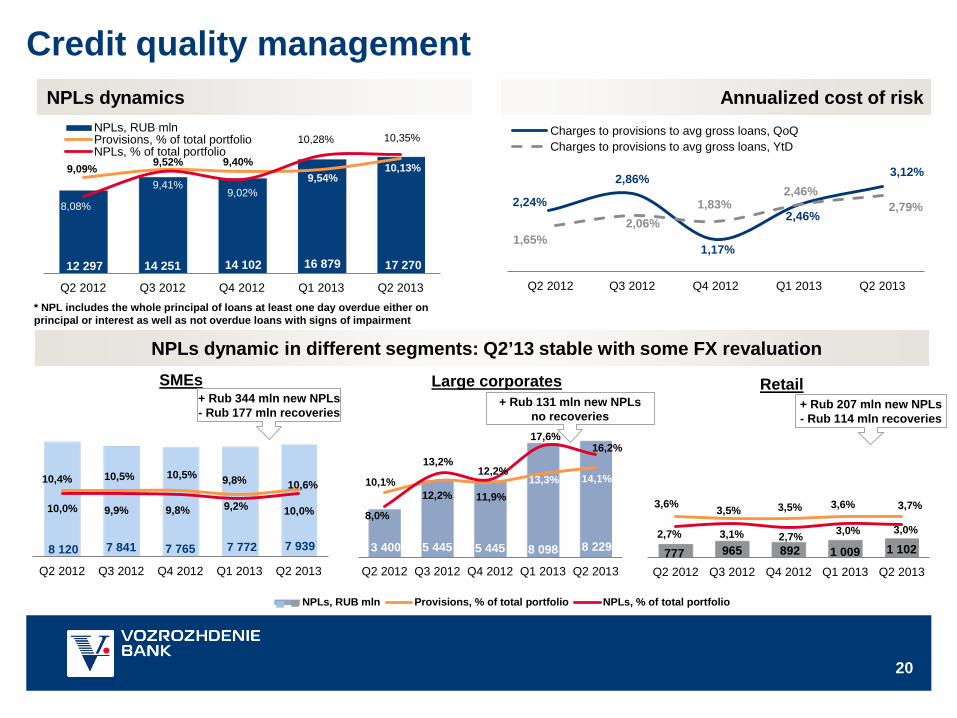
3 400 5 445 5 445 8 098 8 229
10,1% 12,2% 11,9%
13,3% 14,1%
8,0%
13,2% 12,2%
17,6% 16,2%
Q2 2012 Q3 2012 Q4 2012 Q1 2013 Q2 2013
Large corporates
NPLs, RUB mln Provisions, % of total portfolio NPLs, % of total portfolio
8 120 7 841 7 765 7 772 7 939
10,4% 10,5% 10,5% 9,8% 10,6%
10,0% 9,9% 9,8% 9,2% 10,0%
Q2 2012 Q3 2012 Q4 2012 Q1 2013 Q2 2013
SMEs
777 965 892 1 009 1 102
3,6% 3,5% 3,5% 3,6% 3,7%
2,7% 3,1% 2,7% 3,0% 3,0%
Q2 2012 Q3 2012 Q4 2012 Q1 2013 Q2 2013
Retail
Credit quality management
15
* NPL includes the whole principal of loans at least one day overdue either on principal or interest as well as not overdue loans with signs of impairment
3,12%
2,46%
1,17%
2,86%
2,24% 2,79% 2,46%
1,83% 2,06%
1,65%
Q2 2013Q1 2013Q4 2012Q3 2012 Q2 2012
Charges to provisions to avg gross loans, QoQCharges to provisions to avg gross loans, YtD
+ Rub 344 mln new NPLs - Rub 177 mln recoveries
+ Rub 207 mln new NPLs - Rub 114 mln recoveries
12 297 14 251 14 102 16 879 17 270
9,09% 9,52% 9,40% 9,54%
10,13%
8,08%
9,41% 9,02%
10,28% 10,35%
Q2 2012 Q3 2012 Q4 2012 Q1 2013 Q2 2013
NPLs, RUB mlnProvisions, % of total portfolioNPLs, % of total portfolio
*
+ Rub 131 mln new NPLs no recoveries
NPLs dynamic in different segments: Q2’13 stable with some FX revaluation
Annualized cost of risk NPLs dynamics
21
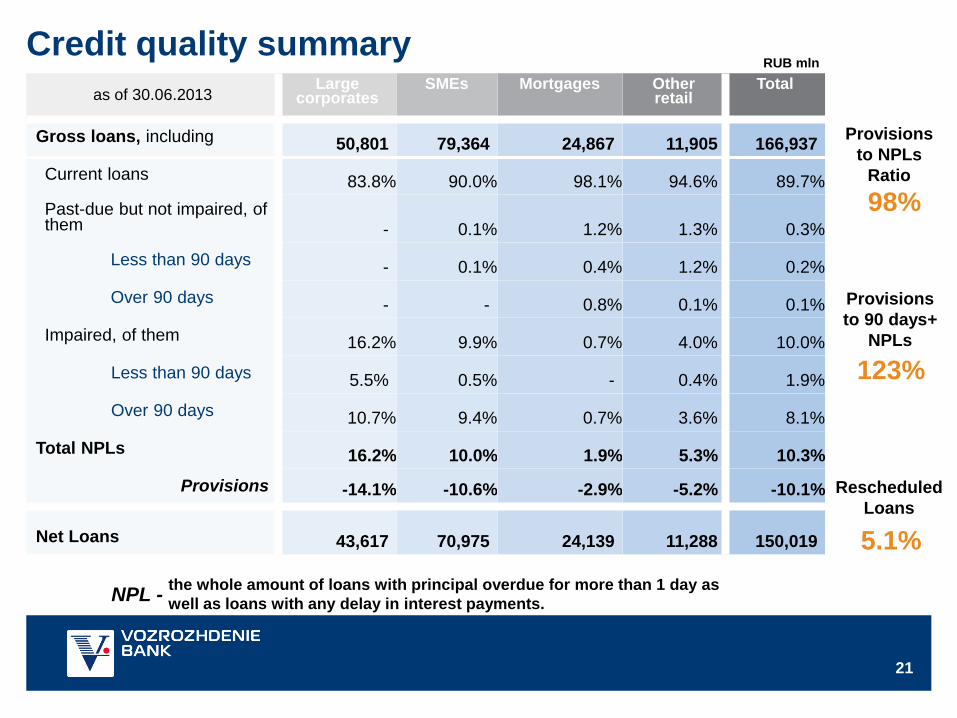
Credit quality summary as of 30.06.2013
Large corporates
SMEs Mortgages Other retail
Total
Gross loans, including 50,801 79,364 24,867 11,905 166,937
Current loans 83.8% 90.0% 98.1% 94.6% 89.7% Past-due but not impaired, of them - 0.1% 1.2% 1.3% 0.3%
Less than 90 days - 0.1% 0.4% 1.2% 0.2%
Over 90 days - - 0.8% 0.1% 0.1%
Impaired, of them 16.2% 9.9% 0.7% 4.0% 10.0%
Less than 90 days 5.5% 0.5% - 0.4% 1.9%
Over 90 days 10.7% 9.4% 0.7% 3.6% 8.1%
Total NPLs 16.2% 10.0% 1.9% 5.3% 10.3%
Provisions -14.1% -10.6% -2.9% -5.2% -10.1%
Net Loans 43,617 70,975 24,139 11,288 150,019
Provisions to NPLs
Ratio
NPL -
98%
Rescheduled Loans
5.1% the whole amount of loans with principal overdue for more than 1 day as well as loans with any delay in interest payments.
Provisions to 90 days+
NPLs
123%
RUB mln
22
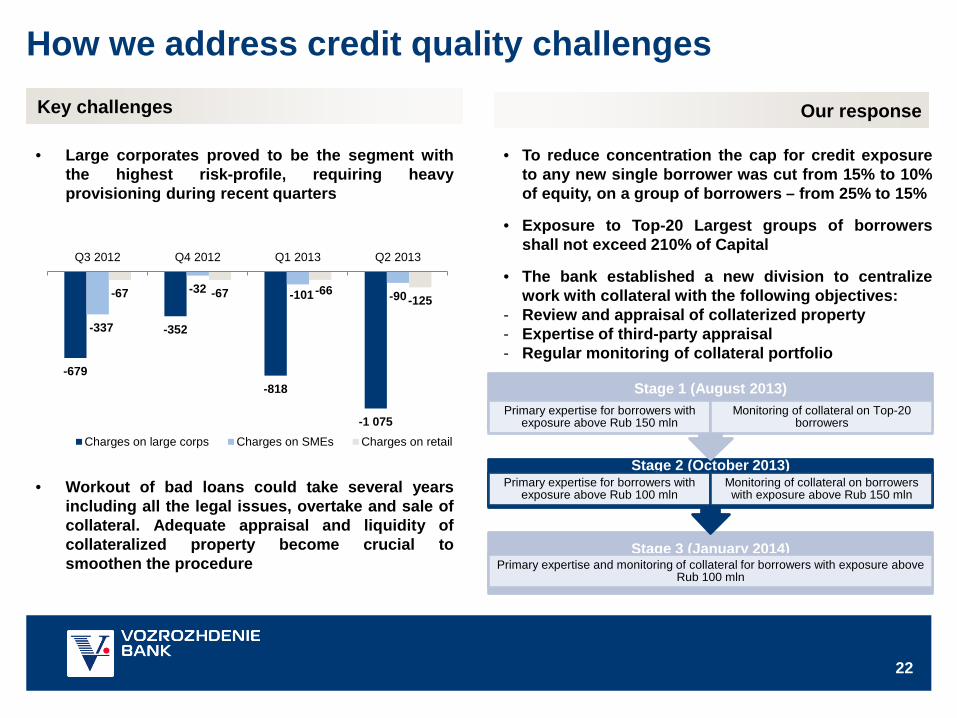
How we address credit quality challenges
-679
-352
-818
-1 075
-337
-32 -101 -90 -67 -67 -66 -125
Q3 2012 Q4 2012 Q1 2013 Q2 2013
Charges on large corps Charges on SMEs Charges on retail
Key challenges
• To reduce concentration the cap for credit exposure to any new single borrower was cut from 15% to 10% of equity, on a group of borrowers – from 25% to 15%
• Exposure to Top-20 Largest groups of borrowers shall not exceed 210% of Capital
• The bank established a new division to centralize work with collateral with the following objectives:
- Review and appraisal of collaterized property - Expertise of third-party appraisal - Regular monitoring of collateral portfolio
Our response
• Large corporates proved to be the segment with the highest risk-profile, requiring heavy provisioning during recent quarters
• Workout of bad loans could take several years including all the legal issues, overtake and sale of collateral. Adequate appraisal and liquidity of collateralized property become crucial to smoothen the procedure
Stage 3 (January 2014) Primary expertise and monitoring of collateral for borrowers with exposure above
Rub 100 mln
Stage 2 (October 2013) Primary expertise for borrowers with
exposure above Rub 100 mln Monitoring of collateral on borrowers with exposure above Rub 150 mln
Stage 1 (August 2013) Primary expertise for borrowers with
exposure above Rub 150 mln Monitoring of collateral on Top-20
borrowers
23
Recent IFRS results
24
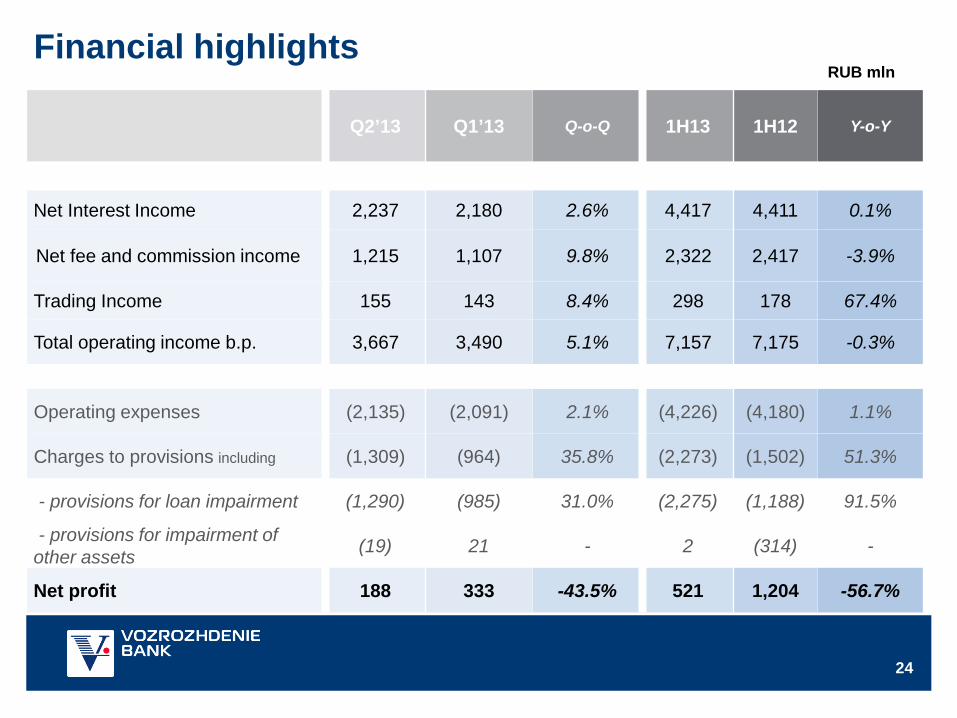
Financial highlights
Q2’13 Q1’13 Q-o-Q 1H13 1H12 Y-o-Y
Net Interest Income 2,237 2,180 2.6% 4,417 4,411 0.1%
Net fee and commission income 1,215 1,107 9.8% 2,322 2,417 -3.9%
Trading Income 155 143 8.4% 298 178 67.4%
Total operating income b.p. 3,667 3,490 5.1% 7,157 7,175 -0.3%
Operating expenses (2,135) (2,091) 2.1% (4,226) (4,180) 1.1%
Charges to provisions including (1,309) (964) 35.8% (2,273) (1,502) 51.3%
- provisions for loan impairment (1,290) (985) 31.0% (2,275) (1,188) 91.5%
- provisions for impairment of other assets (19) 21 - 2 (314) -
Net profit 188 333 -43.5% 521 1,204 -56.7%
RUB mln
25
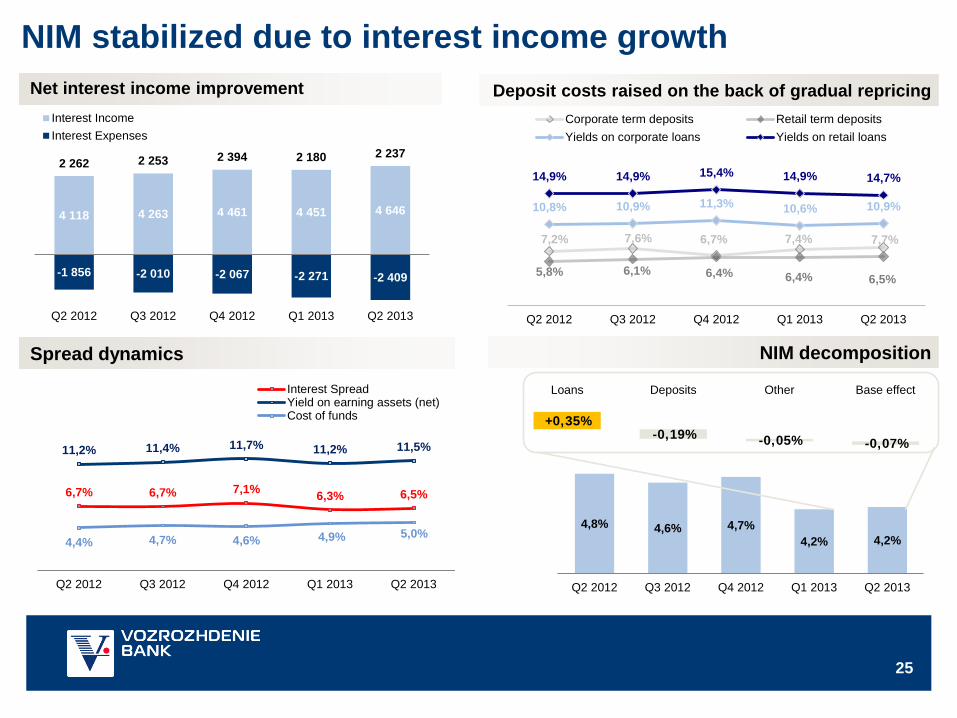
7,2% 7,6% 6,7% 7,4% 7,7%
5,8% 6,1% 6,4% 6,4% 6,5%
10,8% 10,9% 11,3% 10,6% 10,9%
14,9% 14,9% 15,4% 14,9% 14,7%
Q2 2012 Q3 2012 Q4 2012 Q1 2013 Q2 2013
Corporate term deposits Retail term depositsYields on corporate loans Yields on retail loans
NIM stabilized due to interest income growth Net interest income improvement Deposit costs raised on the back of gradual repricing
NIM decomposition Spread dynamics
6,7% 6,7% 7,1% 6,3% 6,5%
11,2% 11,4% 11,7% 11,2% 11,5%
4,4% 4,7% 4,6% 4,9% 5,0%
Q2 2012 Q3 2012 Q4 2012 Q1 2013 Q2 2013
Interest SpreadYield on earning assets (net)Cost of funds +0,35%
-0,19% -0,05% -0,07%
Loans Deposits Other Base effect
4,8% 4,6% 4,7% 4,2% 4,2%
Q2 2012 Q3 2012 Q4 2012 Q1 2013 Q2 2013
4 118 4 263 4 461 4 451 4 646
-1 856 -2 010 -2 067 -2 271 -2 409
2 262 2 253 2 394 2 180 2 237
Q2 2012 Q3 2012 Q4 2012 Q1 2013 Q2 2013
Interest IncomeInterest Expenses
26
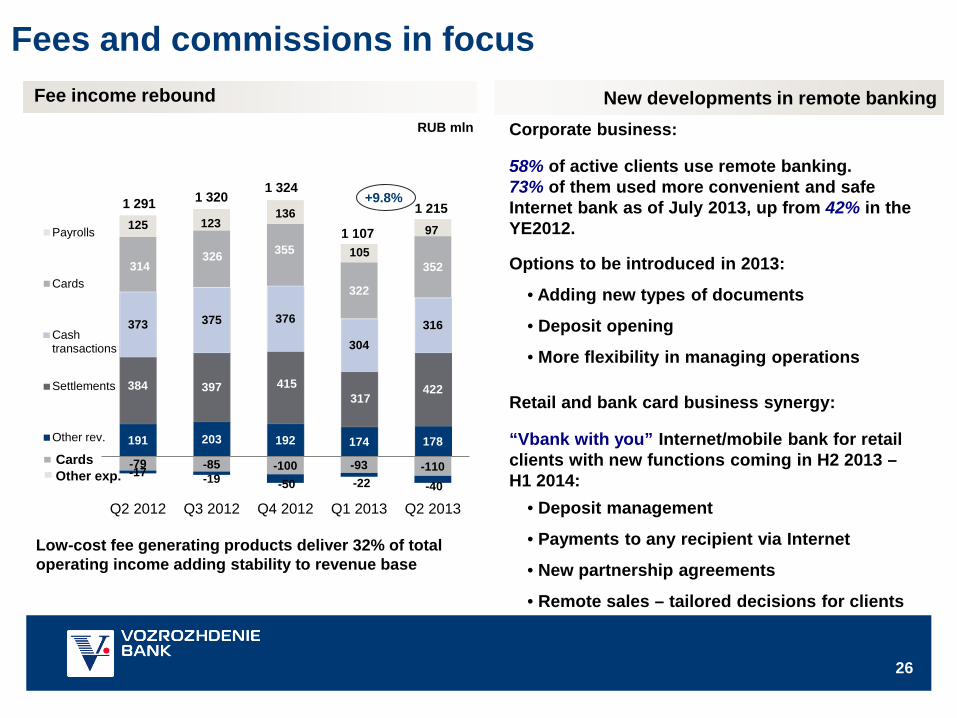
Fees and commissions in focus New developments in remote banking
-79 -85 -100 -93 -110 -17 -19 -50 -22 -40
191 203 192 174 178
384 397 415 317
422
373 375 376
304 316
314 326 355
322
352
125 123 136
105
97
1 291 1 320 1 324
1 107
1 215
Q2 2012 Q3 2012 Q4 2012 Q1 2013 Q2 2013
Payrolls
Cards
Cashtransactions
Settlements
Other rev.
RUB mln
Low-cost fee generating products deliver 32% of total operating income adding stability to revenue base
Cards Other exp.
+9.8%
Fee income rebound
Corporate business:
58% of active clients use remote banking. 73% of them used more convenient and safe Internet bank as of July 2013, up from 42% in the YE2012.
Options to be introduced in 2013:
• Adding new types of documents
• Deposit opening
• More flexibility in managing operations Retail and bank card business synergy:
“Vbank with you” Internet/mobile bank for retail clients with new functions coming in H2 2013 – H1 2014:
• Deposit management
• Payments to any recipient via Internet
• New partnership agreements
• Remote sales – tailored decisions for clients
27
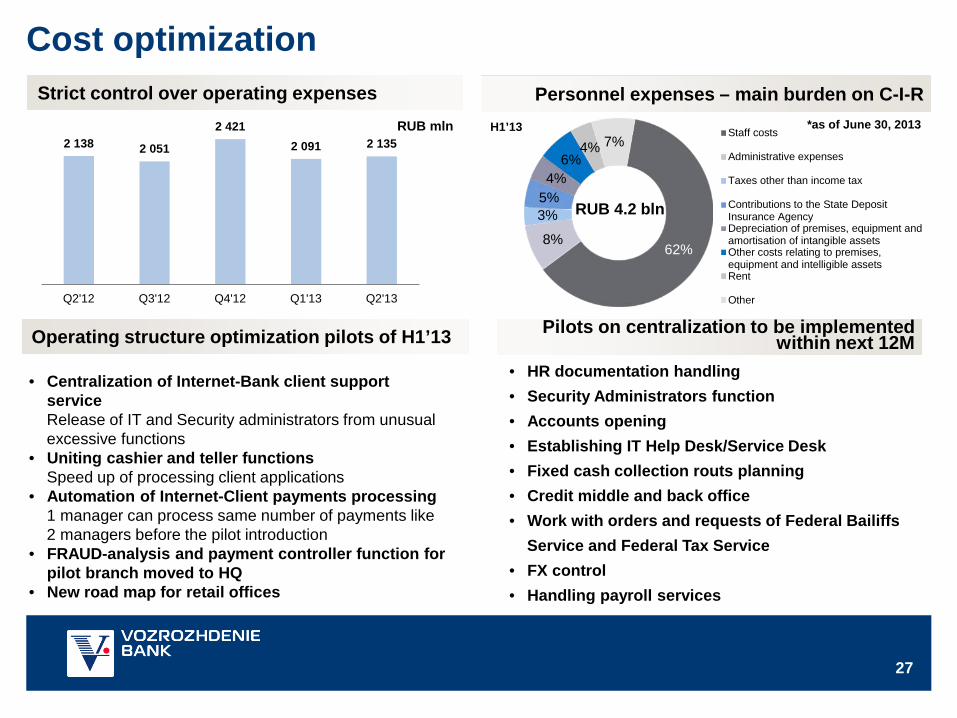
2 138 2 051
2 421 2 091 2 135
Q2'12 Q3'12 Q4'12 Q1'13 Q2'13
62% 8%
3% 5% 4%
6% 4% 7%
Staff costs
Administrative expenses
Taxes other than income tax
Contributions to the State DepositInsurance AgencyDepreciation of premises, equipment andamortisation of intangible assetsOther costs relating to premises,equipment and intelligible assetsRent
Other
Cost optimization Personnel expenses – main burden on C-I-R Strict control over operating expenses
RUB mln
• Centralization of Internet-Bank client support service
Release of IT and Security administrators from unusual excessive functions • Uniting cashier and teller functions Speed up of processing client applications • Automation of Internet-Client payments processing 1 manager can process same number of payments like 2 managers before the pilot introduction • FRAUD-analysis and payment controller function for
pilot branch moved to HQ • New road map for retail offices
• HR documentation handling • Security Administrators function • Accounts opening • Establishing IT Help Desk/Service Desk • Fixed cash collection routs planning • Credit middle and back office • Work with orders and requests of Federal Bailiffs Service and Federal Tax Service • FX control • Handling payroll services
RUB 4.2 bln
Operating structure optimization pilots of H1’13
H1’13
Pilots on centralization to be implemented within next 12M
*as of June 30, 2013
28
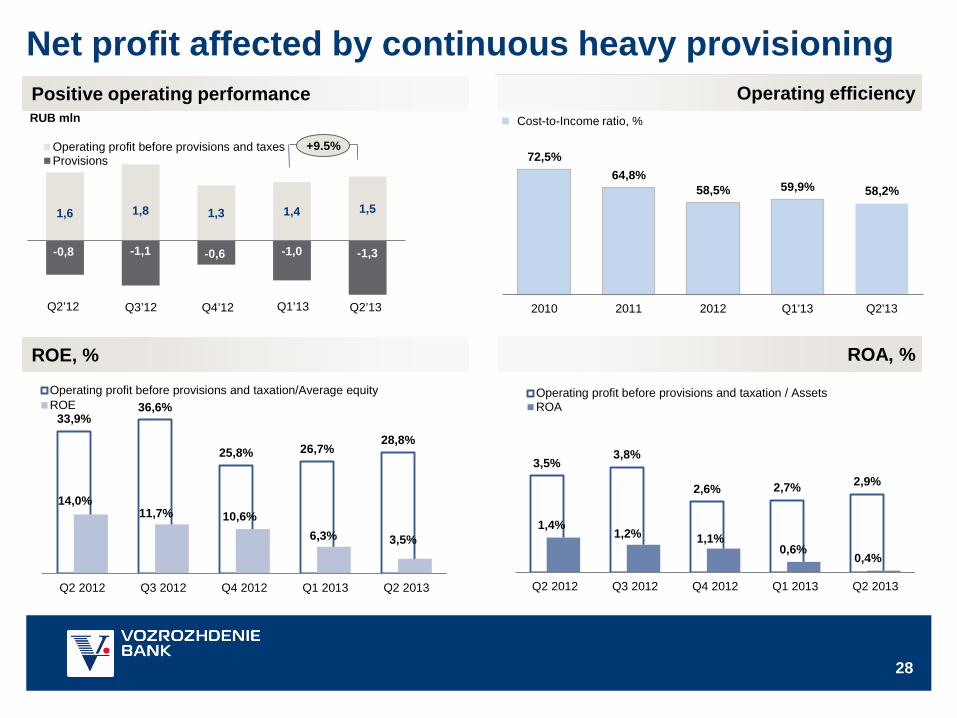
Net profit affected by continuous heavy provisioning
-0,8 -1,1 -0,6 -1,0 -1,3
1,6 1,8 1,3 1,4 1,5
Operating profit before provisions and taxesProvisions
Q2’13 Q1’13 Q2’12 Q3’12
+9.5%
Q4’12
33,9% 36,6%
25,8% 26,7% 28,8%
14,0% 11,7% 10,6%
6,3% 3,5%
Q2 2012 Q3 2012 Q4 2012 Q1 2013 Q2 2013
Operating profit before provisions and taxation/Average equityROE
3,5% 3,8%
2,6% 2,7% 2,9%
1,4% 1,2% 1,1%
0,6% 0,4%
Q2 2012 Q3 2012 Q4 2012 Q1 2013 Q2 2013
Operating profit before provisions and taxation / AssetsROA
Operating efficiency Positive operating performance
ROA, % ROE, %
72,5% 64,8%
58,5% 59,9% 58,2%
2010 2011 2012 Q1'13 Q2'13
RUB mln Cost-to-Income ratio, %
29
Capital & Governance
30
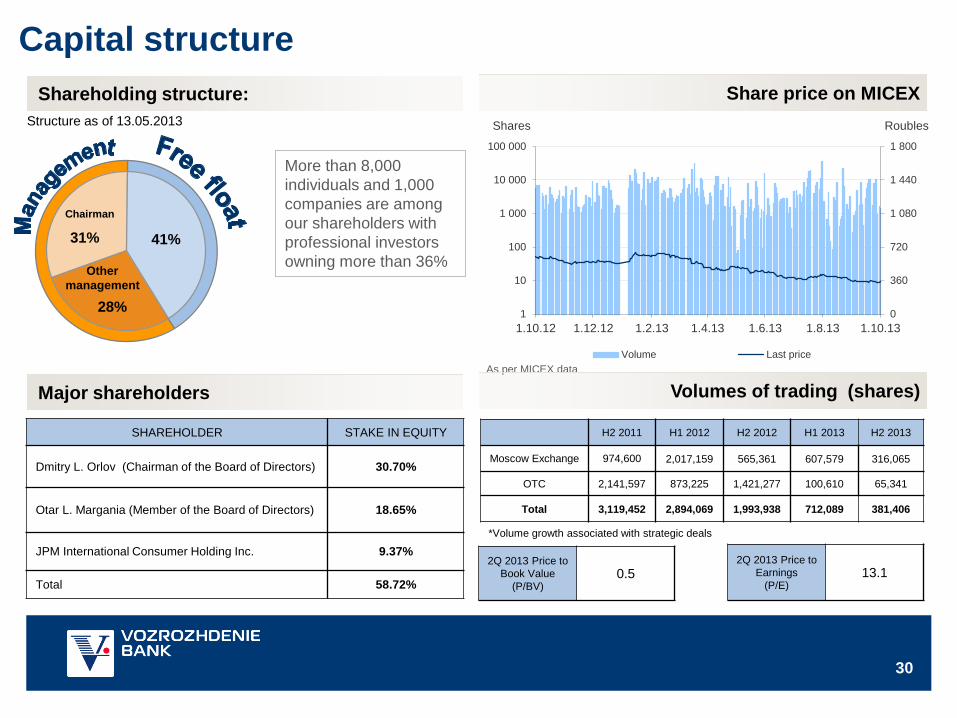
28%
31% 41%
SHAREHOLDER STAKE IN EQUITY
Dmitry L. Orlov (Chairman of the Board of Directors) 30.70%
Otar L. Margania (Member of the Board of Directors) 18.65%
JPM International Consumer Holding Inc. 9.37%
Total 58.72%
As per MICEX data
H2 2011 H1 2012 H2 2012 H1 2013 H2 2013
Moscow Exchange 974,600 2,017,159 565,361 607,579 316,065
OTC 2,141,597 873,225 1,421,277 100,610 65,341
Total 3,119,452 2,894,069 1,993,938 712,089 381,406
Chairman
Other management
Structure as of 13.05.2013
More than 8,000 individuals and 1,000 companies are among our shareholders with professional investors owning more than 36%
*Volume growth associated with strategic deals
Capital structure Share price on MICEX Shareholding structure:
Volumes of trading (shares) Major shareholders
0
360
720
1 080
1 440
1 800
1
10
100
1 000
10 000
100 000
1.10.12 1.12.12 1.2.13 1.4.13 1.6.13 1.8.13 1.10.13
Roubles Shares
Volume Last price
2Q 2013 Price to Book Value
(P/BV) 0.5
2Q 2013 Price to Earnings
(P/E) 13.1
31
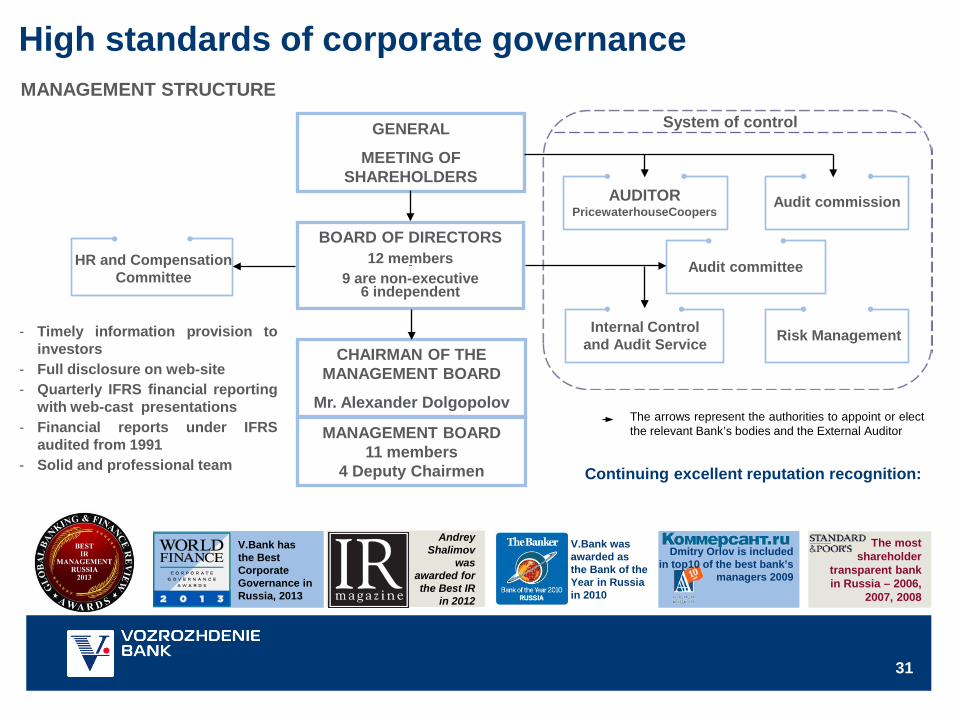
V.Bank was awarded as the Bank of the Year in Russia in 2010
Andrey Shalimov
was awarded for the Best IR
in 2012
CHAIRMAN OF THE MANAGEMENT BOARD
Mr. Alexander Dolgopolov
GENERAL
MEETING OF SHAREHOLDERS
BOARD OF DIRECTORS 12 members
9 are non-executive 6 independent
System of control
- Timely information provision to investors
- Full disclosure on web-site - Quarterly IFRS financial reporting
with web-cast presentations - Financial reports under IFRS
audited from 1991 - Solid and professional team
The most shareholder
transparent bank in Russia – 2006,
2007, 2008
Dmitry Orlov is included in top10 of the best bank’s
managers 2009
HR and Compensation Committee
Continuing excellent reputation recognition:
AUDITOR PricewaterhouseCoopers
Audit commission
Audit committee
Internal Control and Audit Service Risk Management
MANAGEMENT STRUCTURE
MANAGEMENT BOARD 11 members
4 Deputy Chairmen
The arrows represent the authorities to appoint or elect the relevant Bank’s bodies and the External Auditor
High standards of corporate governance
V.Bank has the Best Corporate Governance in Russia, 2013
32
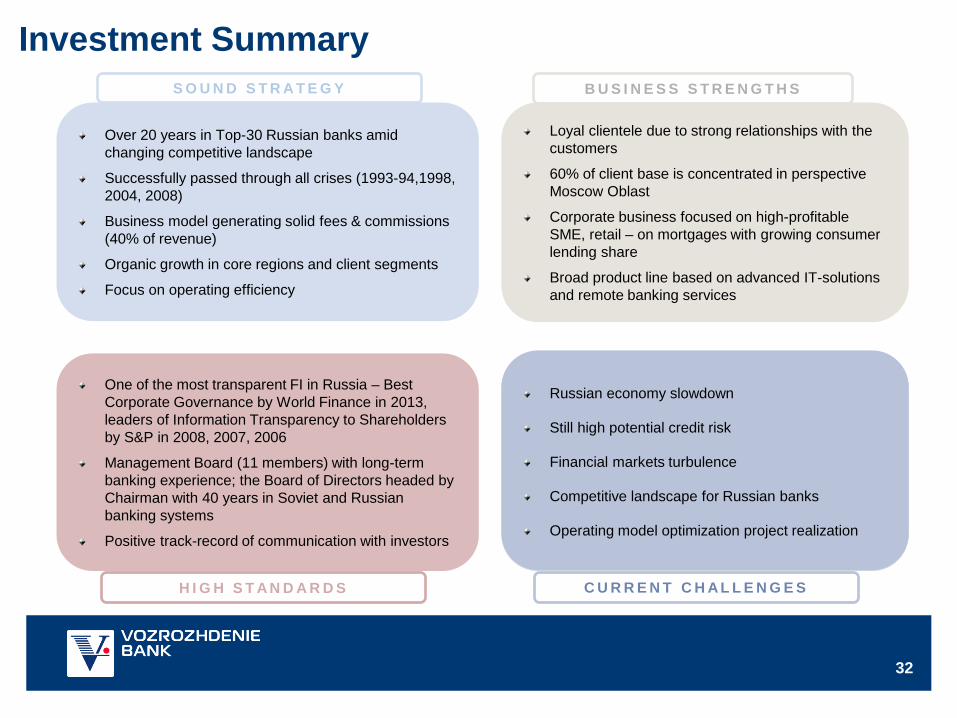
Over 20 years in Top-30 Russian banks amid changing competitive landscape
Successfully passed through all crises (1993-94,1998, 2004, 2008)
Business model generating solid fees & commissions (40% of revenue)
Organic growth in core regions and client segments
Focus on operating efficiency
One of the most transparent FI in Russia – Best Corporate Governance by World Finance in 2013, leaders of Information Transparency to Shareholders by S&P in 2008, 2007, 2006
Management Board (11 members) with long-term banking experience; the Board of Directors headed by Chairman with 40 years in Soviet and Russian banking systems
Positive track-record of communication with investors
Loyal clientele due to strong relationships with the customers
60% of client base is concentrated in perspective Moscow Oblast
Corporate business focused on high-profitable SME, retail – on mortgages with growing consumer lending share
Broad product line based on advanced IT-solutions and remote banking services
S O U N D S T R A T E G Y B U S I N E S S S T R E N G T H S
C U R R E N T C H A L L E N G E S H I G H S T A N D A R D S
Ongoing pressure on lending rates driven by state banks
Limited demand from key client sector – SME
Still high potential credit risk
Russian economy slowdown
Still high potential credit risk
Financial markets turbulence
Competitive landscape for Russian banks
Operating model optimization project realization
Investment Summary
33
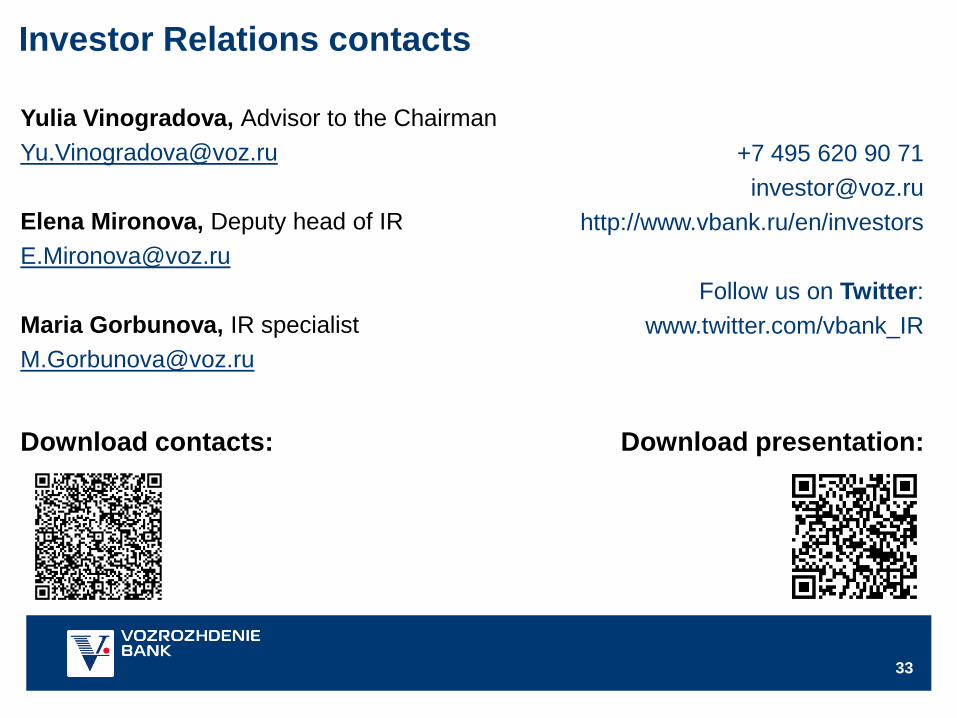
+7 495 620 90 71 [email protected]
http://www.vbank.ru/en/investors
Follow us on Twitter: www.twitter.com/vbank_IR
Investor Relations contacts
Yulia Vinogradova, Advisor to the Chairman [email protected] Elena Mironova, Deputy head of IR [email protected] Maria Gorbunova, IR specialist [email protected]
Download presentation: Download contacts:
34
Some of the information in this presentation may contain projections or other forward-looking statements regarding future events or the future financial performance of Bank Vozrozhdenie (the Bank). Such forward-looking statements are based on numerous assumptions regarding the Bank’s present and future business strategies and the environment in which the Bank will operate in the future. The Bank cautions you that these statements are not guarantees of future performance and involve risks, uncertainties and other important factors that we cannot predict with certainty. Accordingly, our actual outcomes and results may differ materially from what we have expressed or forecasted in the forward-looking statements. These forward-looking statements speak only as at the date of this presentation and are subject to change without notice. We do not intend to update these statements to make them conform with actual results. The Bank is not responsible for statements and forward-looking statements including the following information: - assessment of the Bank’s future operating and financial results as well as forecasts of the present value of future cash flows and related factors; - economic outlook and industry trends; - the Bank’s anticipated capital expenditures and plans relating to expansion of the Bank’s network and development of the new services; - the Bank’s expectations as to its position on the financial market and plans on development of the market segments within which the Bank operates; - the Bank’s expectations as to regulatory changes and assessment of impact of regulatory initiatives on the Bank’s activity. Such forward-looking statements are subject to risks, uncertainties and other factors, which could cause actual results to differ materially from those expressed or implied by these forward-looking statements. These risks, uncertainties and other factors include: - risks relating to changes in political, economic and social conditions in Russia as well as changes in global economic conditions; - risks related to Russian legislation, regulation and taxation; - risks relating to the Bank’s activity, including the achievement of the anticipated results, levels of profitability and growth, ability to create and meet demand for the Bank’s services including their promotion, and the ability of the Bank to remain competitive. Many of these factors are beyond the Bank’s ability to control and predict. Given these and other uncertainties the Bank cautions not to place undue reliance on any of the forward-looking statements contained herein or otherwise. The Bank does not undertake any obligations to release publicly any revisions to these forward-looking statements to reflect events or circumstances after the date hereof or to reflect the occurrence of unanticipated events, except as may be required under applicable laws.
Disclaimer