Embed Size (px)
DESCRIPTION
This document is for private circulation and information purposes only and should not be regarded as an investment, taxation or legal advice. Investors should seek financial advice regarding the appropriateness of investing in any securities or investment strategies discussed or recommended in this publication and should under-stand that statements regarding future prospects may not be realized. In no circumstances it be used or considered as an offer to sale or a solicitation of any offer to buy or sell the securities mentioned in it. We and our affiliates, officers, directors and employees including persons involved in the preparation or issuance of this material may: (a) from time to time, have long or short positions in, and buy or sell the securities thereof, of company(ies) mentioned herein or (b) be engaged in any other transaction involving such securities and earn brokerage or other compensation or act as a market maker in the financial instruments of the company(ies) dis-cussed herein or act as an advisor or lender or borrower to such company or have other potential conflict of interest with respect to any recommendation and re-lated information and opinions. The information contained in this publication may have been taken from trade and statistical services and other sources, which we believe are reliable. We does not guarantee that such information is accurate or complete and it should not be relied upon as such. Any opinion ex-pressed reflects judgments at this date and are subject to change without notice. Caution: Risk of loss in trading & investment can be substantial. You should carefully consider whether trading & investment is appropriate for you in light of your experience, objectives, financial resources and other relevant circumstances.
Citation preview
Date - 25th Sep 2013Date - 25th Sep 2013Date - 25 Sep 2013
Jammu & Kashmir Bank Ltd - BUYJammu & Kashmir Bank Ltd - BUYJammu & Kashmir Bank Ltd - BUYJammu & Kashmir Bank Ltd - BUYJammu & Kashmir Bank Ltd - BUYCMP - INR 1101.00 TP - INR 1453.00 Risk CMP - INR 1101.00 TP - INR 1453.00 Risk CMP - INR 1101.00 TP - INR 1453.00 Risk
TH - 12 to 15 Months Up Side - 32.12 % Return TH - 12 to 15 Months Up Side - 32.12 % Return TH - 12 to 15 Months Up Side - 32.12 % Return TH - 12 to 15 Months Up Side - 32.12 % Return
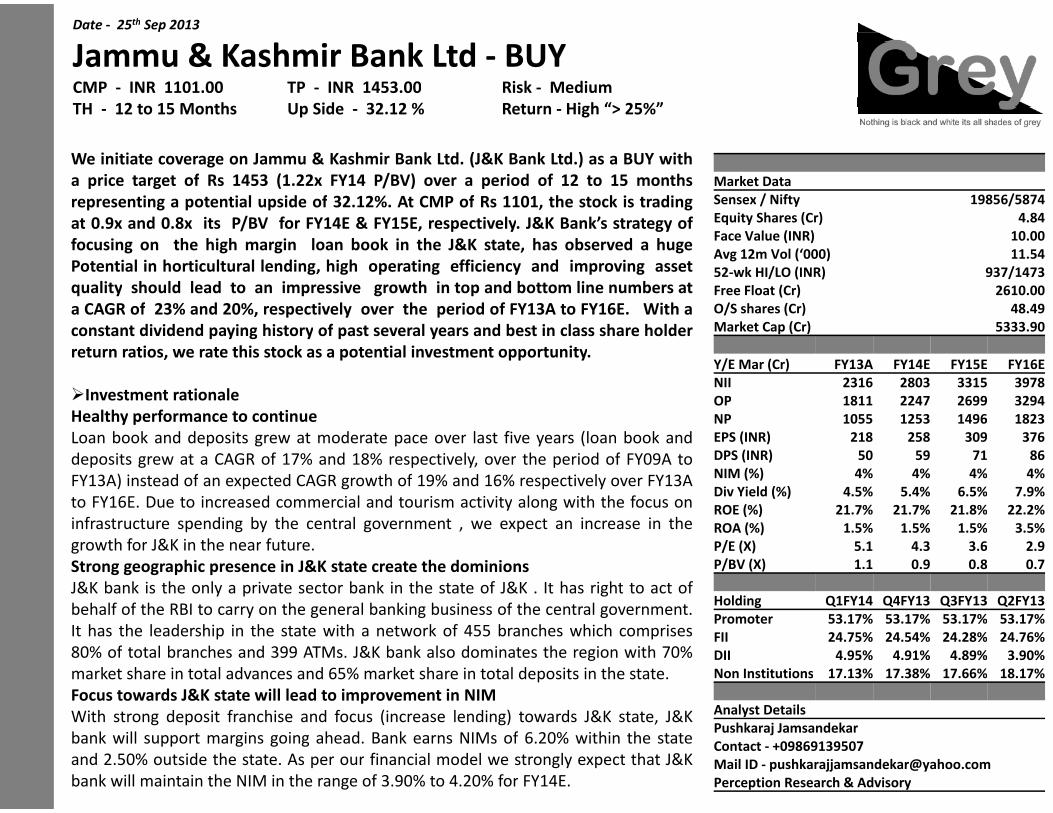
We initiate coverage on Jammu & Kashmir Bank Ltd. (J&K BankWe initiate coverage on Jammu & Kashmir Bank Ltd. (J&K BankWe initiate coverage on Jammu & Kashmir Bank Ltd. (J&K Bank
a price target of Rs 1453 (1.22x FY14 P/BV) over a perioda price target of Rs 1453 (1.22x FY14 P/BV) over a perioda price target of Rs 1453 (1.22x FY14 P/BV) over a period
representing a potential upside of 32.12%. At CMP of Rs 1101representing a potential upside of 32.12%. At CMP of Rs 1101representing a potential upside of 32.12%. At CMP of Rs 1101representing a potential upside of 32.12%. At CMP of Rs 1101
at 0.9x and 0.8x its P/BV for FY14E & FY15E, respectively. J&Kat 0.9x and 0.8x its P/BV for FY14E & FY15E, respectively. J&Kat 0.9x and 0.8x its P/BV for FY14E & FY15E, respectively. J&K
focusing on the high margin loan book in the J&K state,focusing on the high margin loan book in the J&K state,focusing on the high margin loan book in the J&K state,
Potential in horticultural lending, high operating efficiencyPotential in horticultural lending, high operating efficiencyPotential in horticultural lending, high operating efficiencyPotential in horticultural lending, high operating efficiency
quality should lead to an impressive growth in top and bottomquality should lead to an impressive growth in top and bottomquality should lead to an impressive growth in top and bottom
a CAGR of 23% and 20%, respectively over the period of FYa CAGR of 23% and 20%, respectively over the period of FYa CAGR of 23% and 20%, respectively over the period of FY
constant dividend paying history of past several years and bestconstant dividend paying history of past several years and bestconstant dividend paying history of past several years and best
return ratios, we rate this stock as a potential investment opportunity
constant dividend paying history of past several years and best
return ratios, we rate this stock as a potential investment opportunityreturn ratios, we rate this stock as a potential investment opportunityreturn ratios, we rate this stock as a potential investment opportunity
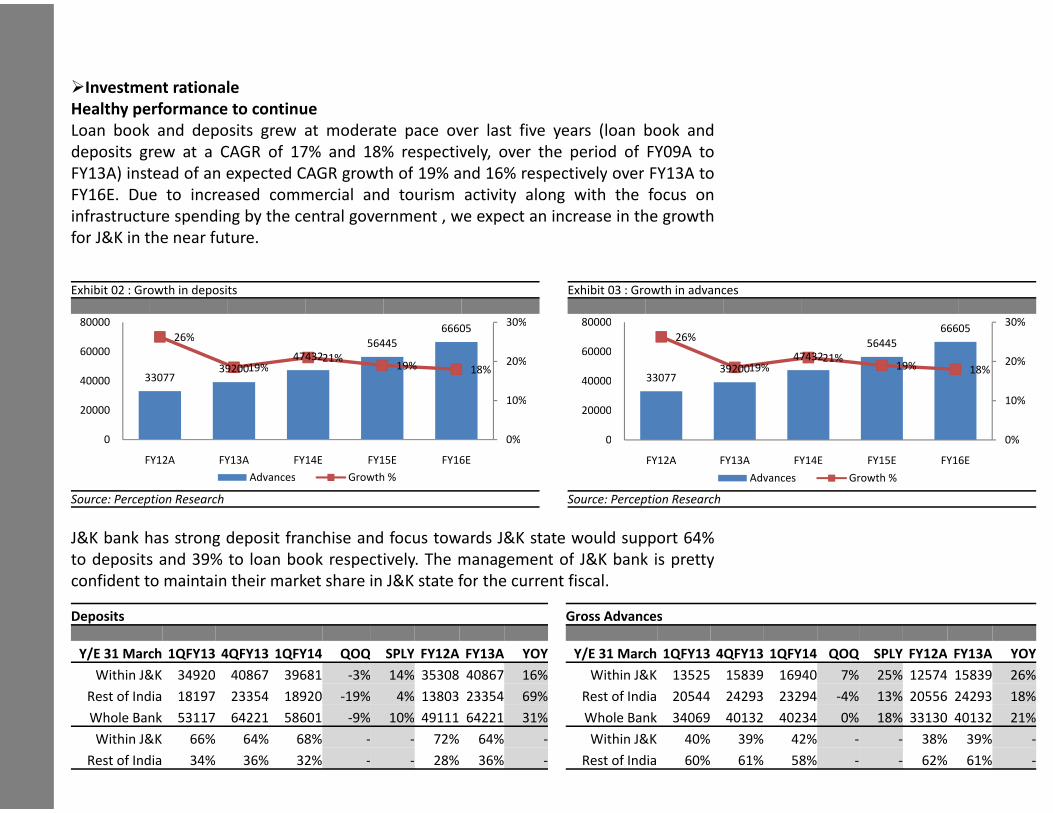
�Investment rationale�Investment rationale�Investment rationale
Healthy performance to continueHealthy performance to continueHealthy performance to continueHealthy performance to continue
Loan book and deposits grew at moderate pace over last fiveLoan book and deposits grew at moderate pace over last fiveLoan book and deposits grew at moderate pace over last five
deposits grew at a CAGR of 17% and 18% respectively, over thedeposits grew at a CAGR of 17% and 18% respectively, over thedeposits grew at a CAGR of 17% and 18% respectively, over the
FY13A) instead of an expected CAGR growth of 19% and 16% respectivelyFY13A) instead of an expected CAGR growth of 19% and 16% respectivelyFY13A) instead of an expected CAGR growth of 19% and 16% respectivelyFY13A) instead of an expected CAGR growth of 19% and 16% respectively
to FY16E. Due to increased commercial and tourism activity alongto FY16E. Due to increased commercial and tourism activity alongto FY16E. Due to increased commercial and tourism activity along
infrastructure spending by the central government , we expectinfrastructure spending by the central government , we expectinfrastructure spending by the central government , we expect
growth for J&K in the near future.growth for J&K in the near future.growth for J&K in the near future.
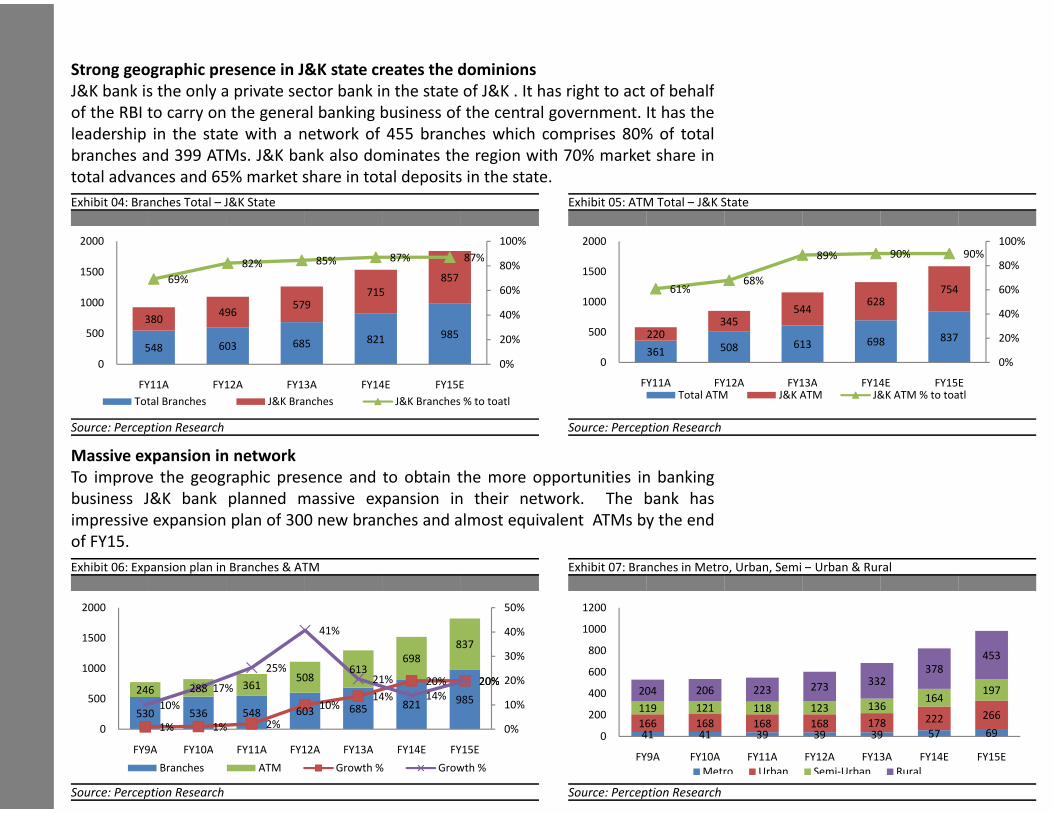
Strong geographic presence in J&K state create the dominionsStrong geographic presence in J&K state create the dominionsStrong geographic presence in J&K state create the dominionsStrong geographic presence in J&K state create the dominions
J&K bank is the only a private sector bank in the state of J&KJ&K bank is the only a private sector bank in the state of J&KJ&K bank is the only a private sector bank in the state of J&K
behalf of the RBI to carry on the general banking business of thebehalf of the RBI to carry on the general banking business of thebehalf of the RBI to carry on the general banking business of the
It has the leadership in the state with a network of 455 branchesIt has the leadership in the state with a network of 455 branchesIt has the leadership in the state with a network of 455 branchesIt has the leadership in the state with a network of 455 branches
80% of total branches and 399 ATMs. J&K bank also dominates80% of total branches and 399 ATMs. J&K bank also dominates80% of total branches and 399 ATMs. J&K bank also dominates
market share in total advances and 65% market share in total depositsmarket share in total advances and 65% market share in total depositsmarket share in total advances and 65% market share in total deposits
Focus towards J&K state will lead to improvement in NIMFocus towards J&K state will lead to improvement in NIMFocus towards J&K state will lead to improvement in NIMFocus towards J&K state will lead to improvement in NIM
With strong deposit franchise and focus (increase lending) towardsWith strong deposit franchise and focus (increase lending) towardsWith strong deposit franchise and focus (increase lending) towards
bank will support margins going ahead. Bank earns NIMs of 6bank will support margins going ahead. Bank earns NIMs of 6bank will support margins going ahead. Bank earns NIMs of 6
and 2.50% outside the state. As per our financial model we stronglyand 2.50% outside the state. As per our financial model we stronglyand 2.50% outside the state. As per our financial model we strongly
bank will maintain the NIM in the range of 3.90% to 4.20% for FYbank will maintain the NIM in the range of 3.90% to 4.20% for FYbank will maintain the NIM in the range of 3.90% to 4.20% for FYbank will maintain the NIM in the range of 3.90% to 4.20% for FY
BUYBUYBUYBUYBUYRisk - MediumRisk - MediumRisk - Medium
Return - High “> 25%” Return - High “> 25%” Return - High “> 25%” Return - High “> 25%”
Bank Ltd.) as a BUY withBank Ltd.) as a BUY withBank Ltd.) as a BUY with
period of 12 to 15 months Market Dataperiod of 12 to 15 months Market Dataperiod of 12 to 15 months
1101, the stock is trading
Market Data
Sensex / Nifty 19856/58741101, the stock is trading Sensex / Nifty 19856/58741101, the stock is trading Sensex / Nifty 19856/5874
Equity Shares (Cr) 4.841101, the stock is trading
J&K Bank’s strategy of Equity Shares (Cr) 4.84J&K Bank’s strategy of Equity Shares (Cr) 4.84
Face Value (INR) 10.00J&K Bank’s strategy of
has observed a hugeFace Value (INR) 10.00
has observed a hugeFace Value (INR) 10.00
Avg 12m Vol (‘000) 11.54has observed a huge
and improving assetAvg 12m Vol (‘000) 11.54
and improving assetAvg 12m Vol (‘000) 11.54
52-wk HI/LO (INR) 937/1473and improving asset 52-wk HI/LO (INR) 937/1473and improving asset
bottom line numbers at52-wk HI/LO (INR) 937/1473
Free Float (Cr) 2610.00bottom line numbers at Free Float (Cr) 2610.00bottom line numbers at
FY13A to FY16E. With aFree Float (Cr) 2610.00
O/S shares (Cr) 48.49FY13A to FY16E. With a O/S shares (Cr) 48.49FY13A to FY16E. With a
best in class share holder
O/S shares (Cr) 48.49
Market Cap (Cr) 5333.90best in class share holder Market Cap (Cr) 5333.90best in class share holder
opportunity.
Market Cap (Cr) 5333.90best in class share holder
opportunity.opportunity.Y/E Mar (Cr) FY13A FY14E FY15E FY16E
opportunity.Y/E Mar (Cr) FY13A FY14E FY15E FY16EY/E Mar (Cr) FY13A FY14E FY15E FY16E
NII 2316 2803 3315 3978NII 2316 2803 3315 3978NII 2316 2803 3315 3978
OP 1811 2247 2699 3294OP 1811 2247 2699 3294OP 1811 2247 2699 3294
NP 1055 1253 1496 1823NP 1055 1253 1496 1823
five years (loan book andNP 1055 1253 1496 1823
EPS (INR) 218 258 309 376five years (loan book and EPS (INR) 218 258 309 376five years (loan book and
the period of FY09A to
EPS (INR) 218 258 309 376
DPS (INR) 50 59 71 86the period of FY09A to DPS (INR) 50 59 71 86the period of FY09A to
respectively over FY13A
DPS (INR) 50 59 71 86
NIM (%) 4% 4% 4% 4%respectively over FY13A
NIM (%) 4% 4% 4% 4%respectively over FY13A
NIM (%) 4% 4% 4% 4%
Div Yield (%) 4.5% 5.4% 6.5% 7.9%respectively over FY13A
along with the focus onDiv Yield (%) 4.5% 5.4% 6.5% 7.9%
along with the focus onDiv Yield (%) 4.5% 5.4% 6.5% 7.9%
ROE (%) 21.7% 21.7% 21.8% 22.2%along with the focus on
expect an increase in theROE (%) 21.7% 21.7% 21.8% 22.2%
expect an increase in theROE (%) 21.7% 21.7% 21.8% 22.2%
ROA (%) 1.5% 1.5% 1.5% 3.5%expect an increase in the ROA (%) 1.5% 1.5% 1.5% 3.5%
P/E (X) 5.1 4.3 3.6 2.9P/E (X) 5.1 4.3 3.6 2.9
dominions
P/E (X) 5.1 4.3 3.6 2.9
P/BV (X) 1.1 0.9 0.8 0.7dominions P/BV (X) 1.1 0.9 0.8 0.7dominions P/BV (X) 1.1 0.9 0.8 0.7dominions
J&K . It has right to act ofJ&K . It has right to act ofHolding Q1FY14 Q4FY13 Q3FY13 Q2FY13
J&K . It has right to act of
the central government.Holding Q1FY14 Q4FY13 Q3FY13 Q2FY13
the central government.Holding Q1FY14 Q4FY13 Q3FY13 Q2FY13
Promoter 53.17% 53.17% 53.17% 53.17%the central government.
branches which comprisesPromoter 53.17% 53.17% 53.17% 53.17%
branches which comprisesPromoter 53.17% 53.17% 53.17% 53.17%
FII 24.75% 24.54% 24.28% 24.76%branches which comprises FII 24.75% 24.54% 24.28% 24.76%branches which comprises
dominates the region with 70%FII 24.75% 24.54% 24.28% 24.76%
DII 4.95% 4.91% 4.89% 3.90%dominates the region with 70% DII 4.95% 4.91% 4.89% 3.90%dominates the region with 70%
deposits in the state.DII 4.95% 4.91% 4.89% 3.90%
Non Institutions 17.13% 17.38% 17.66% 18.17%deposits in the state. Non Institutions 17.13% 17.38% 17.66% 18.17%deposits in the state. Non Institutions 17.13% 17.38% 17.66% 18.17%
Analyst Detailstowards J&K state, J&K Analyst Detailstowards J&K state, J&K Analyst Details
Pushkaraj Jamsandekartowards J&K state, J&K
6.20% within the statePushkaraj Jamsandekar
6.20% within the statePushkaraj Jamsandekar
Contact - +098691395076.20% within the state
strongly expect that J&KContact - +09869139507
strongly expect that J&KContact - +09869139507
Mail ID - [email protected] expect that J&K
FY14E.Mail ID - [email protected]
FY14E.Mail ID - [email protected]
Perception Research & AdvisoryFY14E. Perception Research & AdvisoryFY14E. Perception Research & Advisory
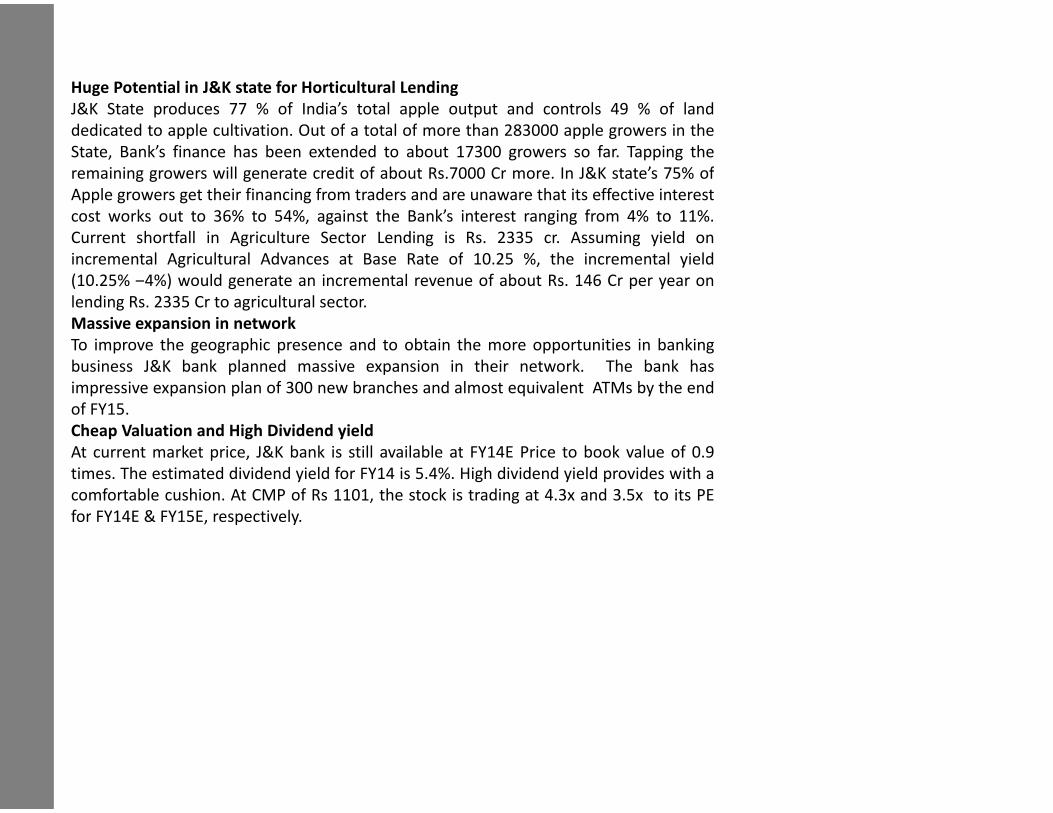
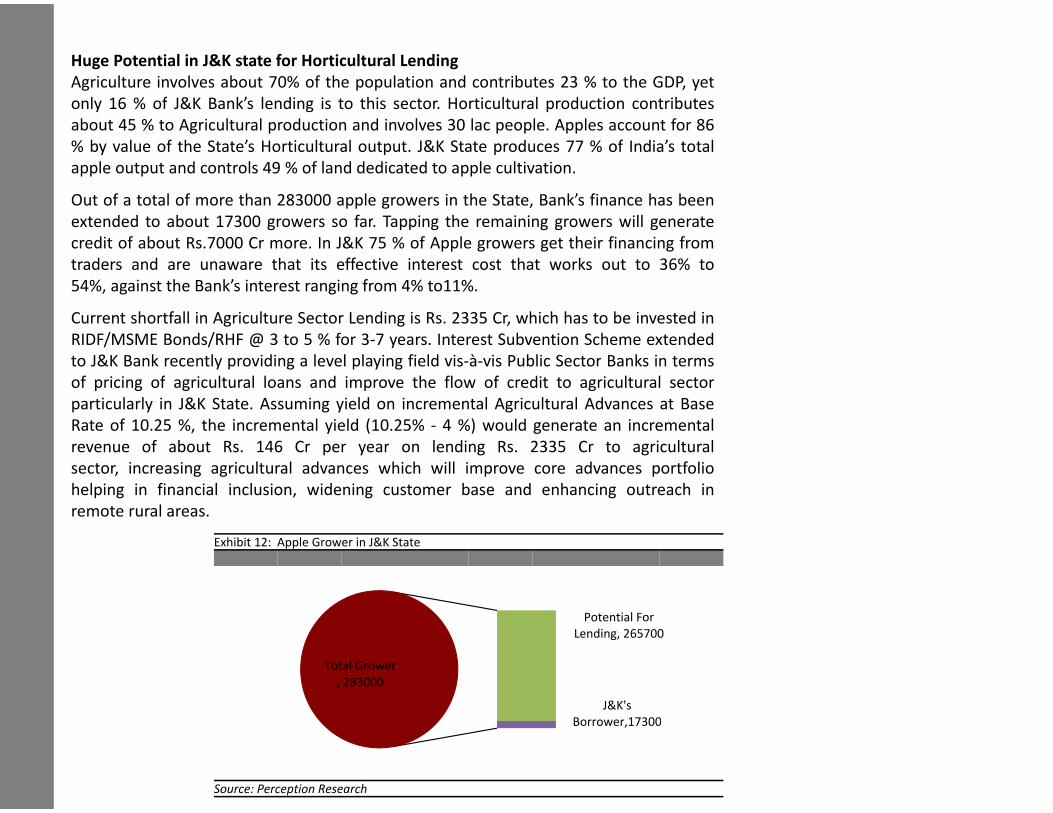
Huge Potential in J&K state for Horticultural LendingHuge Potential in J&K state for Horticultural LendingHuge Potential in J&K state for Horticultural Lending
J&K State produces 77 % of India’s total apple output andJ&K State produces 77 % of India’s total apple output andJ&K State produces 77 % of India’s total apple output andJ&K State produces 77 % of India’s total apple output and
dedicated to apple cultivation. Out of a total of more than 283000dedicated to apple cultivation. Out of a total of more than 283000dedicated to apple cultivation. Out of a total of more than 283000
State, Bank’s finance has been extended to about 17300 growersState, Bank’s finance has been extended to about 17300 growersState, Bank’s finance has been extended to about 17300 growers
remaining growers will generate credit of about Rs.7000 Cr moreremaining growers will generate credit of about Rs.7000 Cr moreremaining growers will generate credit of about Rs.7000 Cr moreremaining growers will generate credit of about Rs.7000 Cr more
Apple growers get their financing from traders and are unawareApple growers get their financing from traders and are unawareApple growers get their financing from traders and are unaware
cost works out to 36% to 54%, against the Bank’s interest rangingcost works out to 36% to 54%, against the Bank’s interest rangingcost works out to 36% to 54%, against the Bank’s interest ranging
Current shortfall in Agriculture Sector Lending is Rs. 2335Current shortfall in Agriculture Sector Lending is Rs. 2335Current shortfall in Agriculture Sector Lending is Rs. 2335Current shortfall in Agriculture Sector Lending is Rs. 2335
incremental Agricultural Advances at Base Rate of 10.25 %incremental Agricultural Advances at Base Rate of 10.25 %incremental Agricultural Advances at Base Rate of 10.25 %
(10.25% –4%) would generate an incremental revenue of about(10.25% –4%) would generate an incremental revenue of about(10.25% –4%) would generate an incremental revenue of about
lending Rs. 2335 Cr to agricultural sector.lending Rs. 2335 Cr to agricultural sector.lending Rs. 2335 Cr to agricultural sector.
Massive expansion in networkMassive expansion in networkMassive expansion in networkMassive expansion in network
To improve the geographic presence and to obtain the moreTo improve the geographic presence and to obtain the moreTo improve the geographic presence and to obtain the more
business J&K bank planned massive expansion in their networkbusiness J&K bank planned massive expansion in their networkbusiness J&K bank planned massive expansion in their network
impressive expansion plan of 300 new branches and almost equivalentimpressive expansion plan of 300 new branches and almost equivalentimpressive expansion plan of 300 new branches and almost equivalentimpressive expansion plan of 300 new branches and almost equivalent
of FY15.of FY15.of FY15.
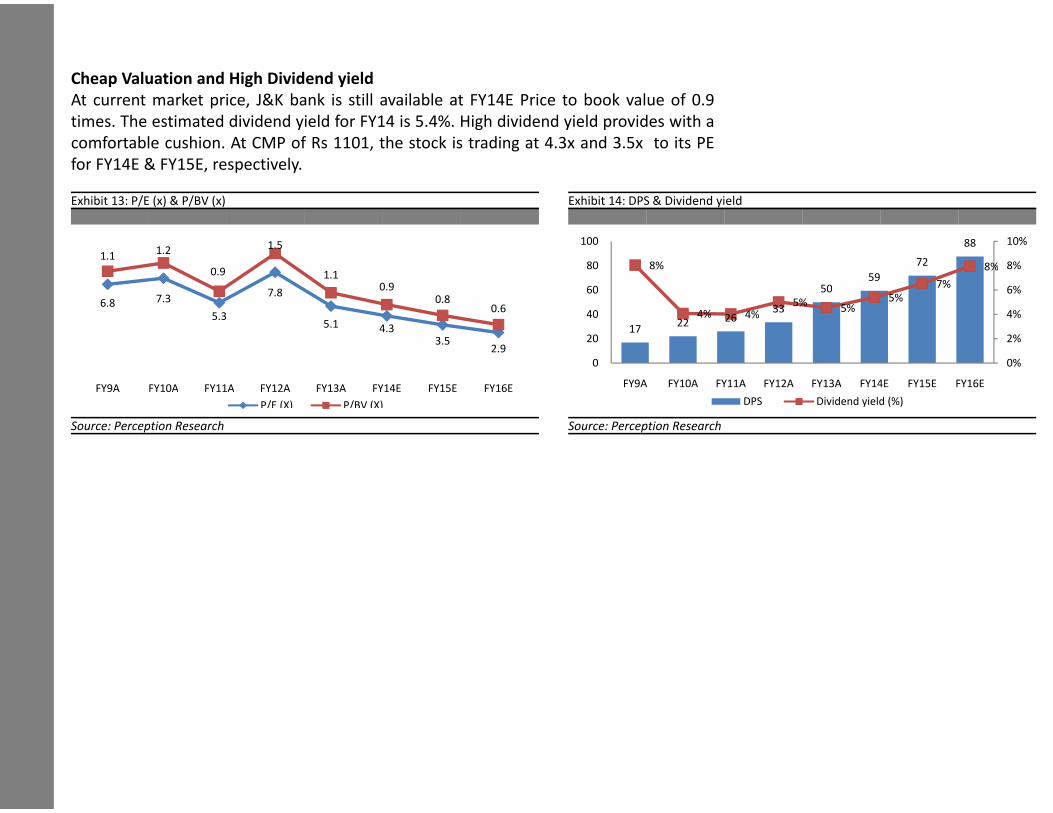
Cheap Valuation and High Dividend yieldCheap Valuation and High Dividend yieldCheap Valuation and High Dividend yield
At current market price, J&K bank is still available at FY14E PriceAt current market price, J&K bank is still available at FY14E PriceAt current market price, J&K bank is still available at FY14E Price
times. The estimated dividend yield for FY14 is 5.4%. High dividend
At current market price, J&K bank is still available at FY14E Price
times. The estimated dividend yield for FY14 is 5.4%. High dividendtimes. The estimated dividend yield for FY14 is 5.4%. High dividendtimes. The estimated dividend yield for FY14 is 5.4%. High dividend
comfortable cushion. At CMP of Rs 1101, the stock is trading atcomfortable cushion. At CMP of Rs 1101, the stock is trading atcomfortable cushion. At CMP of Rs 1101, the stock is trading at
for FY14E & FY15E, respectively.for FY14E & FY15E, respectively.for FY14E & FY15E, respectively.
and controls 49 % of landand controls 49 % of landand controls 49 % of landand controls 49 % of land
283000 apple growers in the283000 apple growers in the283000 apple growers in the
growers so far. Tapping thegrowers so far. Tapping thegrowers so far. Tapping the
more. In J&K state’s 75% ofmore. In J&K state’s 75% ofmore. In J&K state’s 75% ofmore. In J&K state’s 75% of
unaware that its effective interestunaware that its effective interestunaware that its effective interest
ranging from 4% to 11%.ranging from 4% to 11%.ranging from 4% to 11%.
2335 cr. Assuming yield on2335 cr. Assuming yield on2335 cr. Assuming yield on2335 cr. Assuming yield on
%, the incremental yield%, the incremental yield%, the incremental yield
about Rs. 146 Cr per year onabout Rs. 146 Cr per year onabout Rs. 146 Cr per year on
opportunities in bankingopportunities in bankingopportunities in banking
network. The bank hasnetwork. The bank hasnetwork. The bank has
equivalent ATMs by the endequivalent ATMs by the endequivalent ATMs by the endequivalent ATMs by the end
Price to book value of 0.9Price to book value of 0.9Price to book value of 0.9
dividend yield provides with a
Price to book value of 0.9
dividend yield provides with adividend yield provides with adividend yield provides with a
at 4.3x and 3.5x to its PEat 4.3x and 3.5x to its PEat 4.3x and 3.5x to its PE
�Concerns�Concerns�Concerns
Change in political environmentChange in political environmentChange in political environmentChange in political environment
Instable geopolitical uncertainty in the J&K State would hamperInstable geopolitical uncertainty in the J&K State would hamperInstable geopolitical uncertainty in the J&K State would hamper
sentiment.sentiment.sentiment.
Rupee depreciationRupee depreciationRupee depreciationRupee depreciation
The rupee has depreciated about 25 % this year and touchedThe rupee has depreciated about 25 % this year and touchedThe rupee has depreciated about 25 % this year and touched
lower rupee value is the major concern for Indian economiclower rupee value is the major concern for Indian economiclower rupee value is the major concern for Indian economic
adverse impact on Indian banking sector.adverse impact on Indian banking sector.adverse impact on Indian banking sector.adverse impact on Indian banking sector.
Higher inflation rateHigher inflation rateHigher inflation rate
Higher inflation rate is another major concern in India. Bank lendingHigher inflation rate is another major concern in India. Bank lendingHigher inflation rate is another major concern in India. Bank lending
an inverse relation, observing the past trend it was absolutelyan inverse relation, observing the past trend it was absolutelyan inverse relation, observing the past trend it was absolutely
inflation rate moves up it starts pulling down the bank lending rateinflation rate moves up it starts pulling down the bank lending rateinflation rate moves up it starts pulling down the bank lending rateinflation rate moves up it starts pulling down the bank lending rate
Negative investor sentimentNegative investor sentimentNegative investor sentiment
Higher inflation rate, unexpected rupee depreciation, lowerHigher inflation rate, unexpected rupee depreciation, lowerHigher inflation rate, unexpected rupee depreciation, lower
uncertainty in political environment may hamper investor (FII &uncertainty in political environment may hamper investor (FII &uncertainty in political environment may hamper investor (FII &uncertainty in political environment may hamper investor (FII &
Low GDP growth or below expectationLow GDP growth or below expectationLow GDP growth or below expectation
For the current fiscal, India is targeting 4 to 5 percent GDP growthFor the current fiscal, India is targeting 4 to 5 percent GDP growthFor the current fiscal, India is targeting 4 to 5 percent GDP growth
negatively impact on Indian banking sector.negatively impact on Indian banking sector.negatively impact on Indian banking sector.negatively impact on Indian banking sector.
hamper the overall businesshamper the overall businesshamper the overall business
touched a record low of 68.80.touched a record low of 68.80.touched a record low of 68.80.
economic growth, along with aneconomic growth, along with aneconomic growth, along with an
lending and inflation havelending and inflation havelending and inflation have
absolutely clear that once theabsolutely clear that once theabsolutely clear that once the
rate.rate.rate.rate.
lower capital expenditure andlower capital expenditure andlower capital expenditure and
& DII) sentiment.& DII) sentiment.& DII) sentiment.& DII) sentiment.
growth. Lower in GDP maygrowth. Lower in GDP maygrowth. Lower in GDP may
�Company background�Company background�Company background
The Bank, incorporated in 1938, as a universal bank in JammuThe Bank, incorporated in 1938, as a universal bank in JammuThe Bank, incorporated in 1938, as a universal bank in JammuThe Bank, incorporated in 1938, as a universal bank in Jammu
specialized bank in the rest of the country. It is also thespecialized bank in the rest of the country. It is also thespecialized bank in the rest of the country. It is also the
designated as RBI’s agent for banking business, and carries outdesignated as RBI’s agent for banking business, and carries outdesignated as RBI’s agent for banking business, and carries out
the Central Government, besides collecting central taxes for CBDTthe Central Government, besides collecting central taxes for CBDTthe Central Government, besides collecting central taxes for CBDTthe Central Government, besides collecting central taxes for CBDT
two-legged business model whereby it seeks to increase lendingtwo-legged business model whereby it seeks to increase lendingtwo-legged business model whereby it seeks to increase lending
results in higher margins despite modest volumes, and at theresults in higher margins despite modest volumes, and at theresults in higher margins despite modest volumes, and at the
capture niche lending opportunities on a pan-India basis to buildcapture niche lending opportunities on a pan-India basis to buildcapture niche lending opportunities on a pan-India basis to buildcapture niche lending opportunities on a pan-India basis to build
margins.margins.margins.
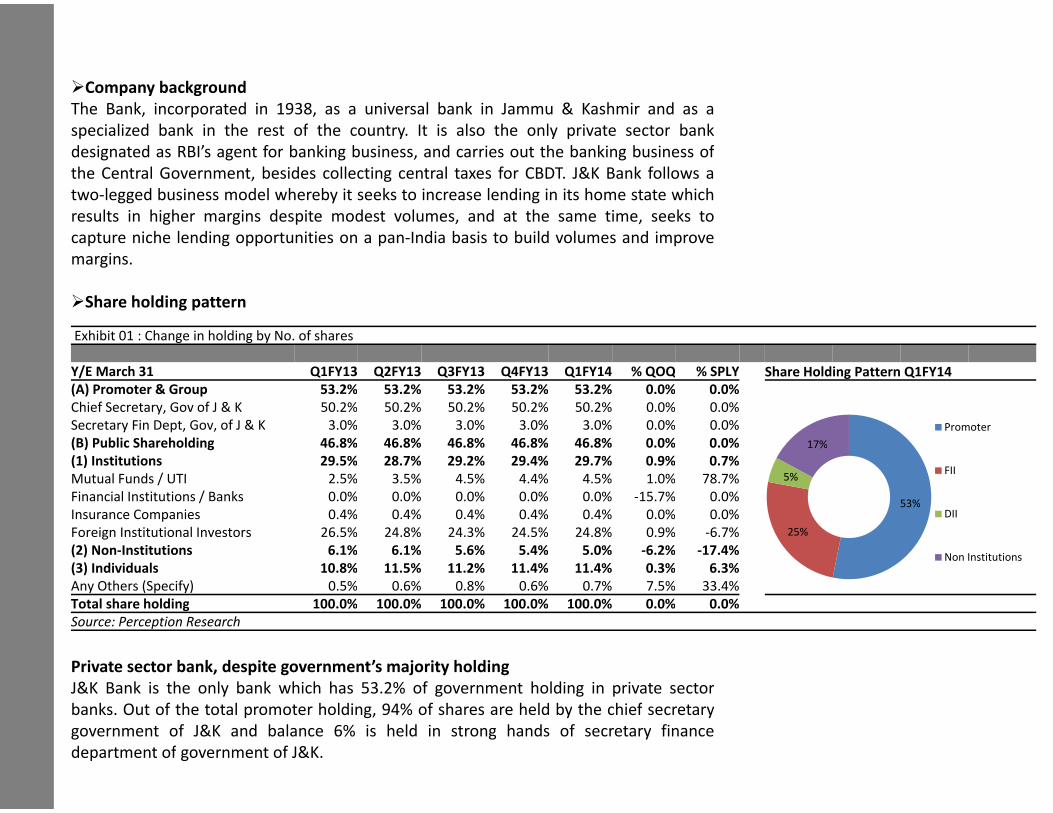
�Share holding pattern�Share holding pattern�Share holding pattern
Exhibit 01 : Change in holding by No. of sharesExhibit 01 : Change in holding by No. of sharesExhibit 01 : Change in holding by No. of shares
Y/E March 31 Q1FY13 Q2FY13 Q3FY13 Q4FY13Y/E March 31 Q1FY13 Q2FY13 Q3FY13 Q4FY13Y/E March 31 Q1FY13 Q2FY13 Q3FY13 Q4FY13
(A) Promoter & Group 53.2% 53.2% 53.2% 53.2%(A) Promoter & Group 53.2% 53.2% 53.2% 53.2%(A) Promoter & Group 53.2% 53.2% 53.2% 53.2%
Chief Secretary, Gov of J & K 50.2% 50.2% 50.2% 50.2%Chief Secretary, Gov of J & K 50.2% 50.2% 50.2% 50.2%Chief Secretary, Gov of J & K 50.2% 50.2% 50.2% 50.2%
Secretary Fin Dept, Gov, of J & K 3.0% 3.0% 3.0% 3.0%Secretary Fin Dept, Gov, of J & K 3.0% 3.0% 3.0% 3.0%
(B) Public Shareholding 46.8% 46.8% 46.8% 46.8%(B) Public Shareholding 46.8% 46.8% 46.8% 46.8%(B) Public Shareholding 46.8% 46.8% 46.8% 46.8%
(1) Institutions 29.5% 28.7% 29.2% 29.4%(1) Institutions 29.5% 28.7% 29.2% 29.4%(1) Institutions 29.5% 28.7% 29.2% 29.4%
Mutual Funds / UTI 2.5% 3.5% 4.5% 4.4%Mutual Funds / UTI 2.5% 3.5% 4.5% 4.4%Mutual Funds / UTI 2.5% 3.5% 4.5% 4.4%
Financial Institutions / Banks 0.0% 0.0% 0.0% 0.0%Financial Institutions / Banks 0.0% 0.0% 0.0% 0.0%Financial Institutions / Banks 0.0% 0.0% 0.0% 0.0%
Insurance Companies 0.4% 0.4% 0.4% 0.4%Insurance Companies 0.4% 0.4% 0.4% 0.4%Insurance Companies 0.4% 0.4% 0.4% 0.4%
Foreign Institutional Investors 26.5% 24.8% 24.3% 24.5%Foreign Institutional Investors 26.5% 24.8% 24.3% 24.5%Foreign Institutional Investors 26.5% 24.8% 24.3% 24.5%
(2) Non-Institutions 6.1% 6.1% 5.6% 5.4%(2) Non-Institutions 6.1% 6.1% 5.6% 5.4%(2) Non-Institutions 6.1% 6.1% 5.6% 5.4%
(3) Individuals 10.8% 11.5% 11.2% 11.4%(3) Individuals 10.8% 11.5% 11.2% 11.4%(3) Individuals 10.8% 11.5% 11.2% 11.4%
Any Others (Specify) 0.5% 0.6% 0.8% 0.6%Any Others (Specify) 0.5% 0.6% 0.8% 0.6%Any Others (Specify) 0.5% 0.6% 0.8% 0.6%
Total share holding 100.0% 100.0% 100.0% 100.0%Total share holding 100.0% 100.0% 100.0% 100.0%Total share holding 100.0% 100.0% 100.0% 100.0%
Source: Perception ResearchSource: Perception ResearchSource: Perception Research
Private sector bank, despite government’s majority holding Private sector bank, despite government’s majority holding Private sector bank, despite government’s majority holding
J&K Bank is the only bank which has 53.2% of governmentJ&K Bank is the only bank which has 53.2% of governmentJ&K Bank is the only bank which has 53.2% of governmentJ&K Bank is the only bank which has 53.2% of government
banks. Out of the total promoter holding, 94% of shares are heldbanks. Out of the total promoter holding, 94% of shares are heldbanks. Out of the total promoter holding, 94% of shares are held
government of J&K and balance 6% is held in strong handsgovernment of J&K and balance 6% is held in strong handsgovernment of J&K and balance 6% is held in strong hands
department of government of J&K.department of government of J&K.department of government of J&K.department of government of J&K.
Jammu & Kashmir and as aJammu & Kashmir and as aJammu & Kashmir and as aJammu & Kashmir and as a
only private sector bankonly private sector bankonly private sector bank
out the banking business ofout the banking business ofout the banking business of
CBDT. J&K Bank follows aCBDT. J&K Bank follows aCBDT. J&K Bank follows aCBDT. J&K Bank follows a
lending in its home state whichlending in its home state whichlending in its home state which
the same time, seeks tothe same time, seeks tothe same time, seeks to
build volumes and improvebuild volumes and improvebuild volumes and improvebuild volumes and improve
Q4FY13 Q1FY14 % QOQ % SPLY Share Holding Pattern Q1FY14Q4FY13 Q1FY14 % QOQ % SPLY Share Holding Pattern Q1FY14Q4FY13 Q1FY14 % QOQ % SPLY Share Holding Pattern Q1FY14
53.2% 53.2% 0.0% 0.0%53.2% 53.2% 0.0% 0.0%53.2% 53.2% 0.0% 0.0%
50.2% 50.2% 0.0% 0.0%50.2% 50.2% 0.0% 0.0%50.2% 50.2% 0.0% 0.0%
3.0% 3.0% 0.0% 0.0% Promoter3.0% 3.0% 0.0% 0.0%
46.8% 46.8% 0.0% 0.0%
Promoter
46.8% 46.8% 0.0% 0.0% 17%46.8% 46.8% 0.0% 0.0%
29.4% 29.7% 0.9% 0.7%
17%
29.4% 29.7% 0.9% 0.7%29.4% 29.7% 0.9% 0.7%
4.4% 4.5% 1.0% 78.7% 5%FII
4.4% 4.5% 1.0% 78.7% 5%FII
4.4% 4.5% 1.0% 78.7%
0.0% 0.0% -15.7% 0.0%
5%
0.0% 0.0% -15.7% 0.0%53%
0.0% 0.0% -15.7% 0.0%
0.4% 0.4% 0.0% 0.0%53%
DII0.4% 0.4% 0.0% 0.0%53%
DII0.4% 0.4% 0.0% 0.0%
24.5% 24.8% 0.9% -6.7% 25%
DII
24.5% 24.8% 0.9% -6.7% 25%24.5% 24.8% 0.9% -6.7%
5.4% 5.0% -6.2% -17.4%
25%
5.4% 5.0% -6.2% -17.4%Non Institutions
5.4% 5.0% -6.2% -17.4%
11.4% 11.4% 0.3% 6.3%Non Institutions
11.4% 11.4% 0.3% 6.3%11.4% 11.4% 0.3% 6.3%
0.6% 0.7% 7.5% 33.4%0.6% 0.7% 7.5% 33.4%0.6% 0.7% 7.5% 33.4%
100.0% 100.0% 0.0% 0.0%100.0% 100.0% 0.0% 0.0%100.0% 100.0% 0.0% 0.0%
holding in private sectorholding in private sectorholding in private sectorholding in private sector
held by the chief secretaryheld by the chief secretaryheld by the chief secretary
hands of secretary financehands of secretary financehands of secretary finance
�Investment rationale�Investment rationale�Investment rationale
Healthy performance to continueHealthy performance to continueHealthy performance to continueHealthy performance to continue
Loan book and deposits grew at moderate pace over last fiveLoan book and deposits grew at moderate pace over last fiveLoan book and deposits grew at moderate pace over last five
deposits grew at a CAGR of 17% and 18% respectively, overdeposits grew at a CAGR of 17% and 18% respectively, overdeposits grew at a CAGR of 17% and 18% respectively, over
FY13A) instead of an expected CAGR growth of 19% and 16% respectivelyFY13A) instead of an expected CAGR growth of 19% and 16% respectivelyFY13A) instead of an expected CAGR growth of 19% and 16% respectivelyFY13A) instead of an expected CAGR growth of 19% and 16% respectively
FY16E. Due to increased commercial and tourism activity alongFY16E. Due to increased commercial and tourism activity alongFY16E. Due to increased commercial and tourism activity along
infrastructure spending by the central government , we expectinfrastructure spending by the central government , we expectinfrastructure spending by the central government , we expect
for J&K in the near future.for J&K in the near future.for J&K in the near future.for J&K in the near future.
Exhibit 02 : Growth in depositsExhibit 02 : Growth in depositsExhibit 02 : Growth in deposits
6660530%80000
6660526%
30%80000
56445
6660526%
4743256445
26%
60000 4743256445
21%19% 20%
60000
3920047432
19%21%
19% 18%20%
330773920019% 19% 18%
40000 3307740000
10%
40000
10%20000
10%2000020000
0%0 0%0 0%0
FY12A FY13A FY14E FY15E FY16EFY12A FY13A FY14E FY15E FY16EFY12A FY13A FY14E FY15E FY16E
Advances Growth %Advances Growth %Advances Growth %
Source: Perception ResearchSource: Perception Research
J&K bank has strong deposit franchise and focus towards J&KJ&K bank has strong deposit franchise and focus towards J&KJ&K bank has strong deposit franchise and focus towards J&KJ&K bank has strong deposit franchise and focus towards J&K
to deposits and 39% to loan book respectively. The managementto deposits and 39% to loan book respectively. The managementto deposits and 39% to loan book respectively. The management
confident to maintain their market share in J&K state for the currentconfident to maintain their market share in J&K state for the currentconfident to maintain their market share in J&K state for the current
Deposits Deposits Deposits
Y/E 31 March 1QFY13 4QFY13 1QFY14 QOQ SPLY FY12A FY13A YOYY/E 31 March 1QFY13 4QFY13 1QFY14 QOQ SPLY FY12A FY13A YOYY/E 31 March 1QFY13 4QFY13 1QFY14 QOQ SPLY FY12A FY13A YOY
Within J&K 34920 40867 39681 -3% 14% 35308 40867 16%Within J&K 34920 40867 39681 -3% 14% 35308 40867 16%Within J&K 34920 40867 39681 -3% 14% 35308 40867 16%
Rest of India 18197 23354 18920 -19% 4% 13803 23354 69%Rest of India 18197 23354 18920 -19% 4% 13803 23354 69%Rest of India 18197 23354 18920 -19% 4% 13803 23354 69%
Whole Bank 53117 64221 58601 -9% 10% 49111 64221 31%Whole Bank 53117 64221 58601 -9% 10% 49111 64221 31%Whole Bank 53117 64221 58601 -9% 10% 49111 64221 31%
Within J&K 66% 64% 68% - - 72% 64%Within J&K 66% 64% 68% - - 72% 64%Within J&K 66% 64% 68% - - 72% 64%
Rest of India 34% 36% 32% - - 28% 36%Rest of India 34% 36% 32% - - 28% 36%Rest of India 34% 36% 32% - - 28% 36%
five years (loan book andfive years (loan book andfive years (loan book and
over the period of FY09A toover the period of FY09A toover the period of FY09A to
respectively over FY13A torespectively over FY13A torespectively over FY13A torespectively over FY13A to
along with the focus onalong with the focus onalong with the focus on
an increase in the growthan increase in the growthan increase in the growth
Exhibit 03 : Growth in advancesExhibit 03 : Growth in advancesExhibit 03 : Growth in advances
6660530%80000
6660526%
30%80000
56445
6660526%
4743256445
26%
60000 4743256445
21%19% 20%
60000
3920047432
19%21%
19% 18%20%
330773920019% 19% 18%
40000 3307740000
10%
40000
10%20000
10%2000020000
0%0 0%0 0%0
FY12A FY13A FY14E FY15E FY16EFY12A FY13A FY14E FY15E FY16EFY12A FY13A FY14E FY15E FY16E
Advances Growth %Advances Growth %Advances Growth %
Source: Perception ResearchSource: Perception Research
state would support 64%state would support 64%state would support 64%state would support 64%
management of J&K bank is prettymanagement of J&K bank is prettymanagement of J&K bank is pretty
current fiscal.current fiscal.current fiscal.
Gross AdvancesGross AdvancesGross Advances
YOY Y/E 31 March 1QFY13 4QFY13 1QFY14 QOQ SPLY FY12A FY13A YOYYOY Y/E 31 March 1QFY13 4QFY13 1QFY14 QOQ SPLY FY12A FY13A YOYYOY Y/E 31 March 1QFY13 4QFY13 1QFY14 QOQ SPLY FY12A FY13A YOY
16% Within J&K 13525 15839 16940 7% 25% 12574 15839 26%16% Within J&K 13525 15839 16940 7% 25% 12574 15839 26%16% Within J&K 13525 15839 16940 7% 25% 12574 15839 26%
69% Rest of India 20544 24293 23294 -4% 13% 20556 24293 18%69% Rest of India 20544 24293 23294 -4% 13% 20556 24293 18%69% Rest of India 20544 24293 23294 -4% 13% 20556 24293 18%
31% Whole Bank 34069 40132 40234 0% 18% 33130 40132 21%31% Whole Bank 34069 40132 40234 0% 18% 33130 40132 21%31% Whole Bank 34069 40132 40234 0% 18% 33130 40132 21%
- Within J&K 40% 39% 42% - - 38% 39% -- Within J&K 40% 39% 42% - - 38% 39% -- Within J&K 40% 39% 42% - - 38% 39% -
- Rest of India 60% 61% 58% - - 62% 61% -- Rest of India 60% 61% 58% - - 62% 61% -- Rest of India 60% 61% 58% - - 62% 61% -
Strong geographic presence in J&K state creates the dominionsStrong geographic presence in J&K state creates the dominionsStrong geographic presence in J&K state creates the dominionsStrong geographic presence in J&K state creates the dominions
J&K bank is the only a private sector bank in the state of J&K . ItJ&K bank is the only a private sector bank in the state of J&K . ItJ&K bank is the only a private sector bank in the state of J&K . It
of the RBI to carry on the general banking business of the centralof the RBI to carry on the general banking business of the centralof the RBI to carry on the general banking business of the central
leadership in the state with a network of 455 branches whichleadership in the state with a network of 455 branches whichleadership in the state with a network of 455 branches which
branches and 399 ATMs. J&K bank also dominates the region withbranches and 399 ATMs. J&K bank also dominates the region withbranches and 399 ATMs. J&K bank also dominates the region withbranches and 399 ATMs. J&K bank also dominates the region with
total advances and 65% market share in total deposits in the statetotal advances and 65% market share in total deposits in the statetotal advances and 65% market share in total deposits in the state
Exhibit 04: Branches Total – J&K StateExhibit 04: Branches Total – J&K State
100%2000 100%2000
82% 85% 87% 87%
100%2000
82% 85% 87% 87%80%
150085769%
82% 85% 80%1500
715
85769%60%
1500
71569%
60%
579715 60%
1000
380496
57940%
1000
380496 40%
985
380
500
548 603 685 821 985 20%500
548 603 685 821 985 20%548 603 685
0%0 0%0 0%0
FY11A FY12A FY13A FY14E FY15EFY11A FY12A FY13A FY14E FY15EFY11A FY12A FY13A FY14E FY15E
Total Branches J&K Branches J&K Branches % to toatlTotal Branches J&K Branches J&K Branches % to toatlTotal Branches J&K Branches J&K Branches % to toatl
Source: Perception ResearchSource: Perception ResearchSource: Perception Research
Massive expansion in networkMassive expansion in networkMassive expansion in network
To improve the geographic presence and to obtain the moreTo improve the geographic presence and to obtain the moreTo improve the geographic presence and to obtain the more
business J&K bank planned massive expansion in their networkbusiness J&K bank planned massive expansion in their networkbusiness J&K bank planned massive expansion in their network
impressive expansion plan of 300 new branches and almost equivalentimpressive expansion plan of 300 new branches and almost equivalentimpressive expansion plan of 300 new branches and almost equivalentimpressive expansion plan of 300 new branches and almost equivalent
of FY15.of FY15.of FY15.
Exhibit 06: Expansion plan in Branches & ATMExhibit 06: Expansion plan in Branches & ATMExhibit 06: Expansion plan in Branches & ATM
50%2000 50%2000 50%2000
41% 40%1500
837
41% 40%1500
83730%
1500
698
83730%
613698
25%30%
1000508
61320% 20%
25%21% 20% 20%
1000
246 288 361508 20% 20%
17%21% 20% 20%
985246 288 361
14%
20% 20%17%
21%
14%
20% 20%
500603 685 821 985
246
10%14%
10%14%
10%500
530 536 548 603 685 821 98510%10% 10%
500
530 536 548 603 685
1% 1% 2% 0%0 1% 1% 2% 0%0 1% 1% 0%0
FY9A FY10A FY11A FY12A FY13A FY14E FY15EFY9A FY10A FY11A FY12A FY13A FY14E FY15EFY9A FY10A FY11A FY12A FY13A FY14E FY15E
Branches ATM Growth % Growth %Branches ATM Growth % Growth %Branches ATM Growth % Growth %
Source: Perception ResearchSource: Perception ResearchSource: Perception Research
dominionsdominionsdominionsdominions
It has right to act of behalfIt has right to act of behalfIt has right to act of behalf
central government. It has thecentral government. It has thecentral government. It has the
which comprises 80% of totalwhich comprises 80% of totalwhich comprises 80% of total
with 70% market share inwith 70% market share inwith 70% market share inwith 70% market share in
state.state.state.
Exhibit 05: ATM Total – J&K StateExhibit 05: ATM Total – J&K State
100%200090% 90%
100%2000
89% 90% 90%100%2000
89% 90% 90%80%
150068%
80%1500
75461%68%
60%
1500
62875461%
68%60%
1000544
62875461% 60%
1000544
62840%
1000
345544 40%
837220345
20%500
508 613 698 837220 20%500
361 508 613 698 837220 20%
361 508 613
0%0 0%0 0%0
FY11A FY12A FY13A FY14E FY15EFY11A FY12A FY13A FY14E FY15ETotal ATM J&K ATM J&K ATM % to toatl
FY11A FY12A FY13A FY14E FY15ETotal ATM J&K ATM J&K ATM % to toatlTotal ATM J&K ATM J&K ATM % to toatl
Source: Perception ResearchSource: Perception ResearchSource: Perception Research
opportunities in bankingopportunities in bankingopportunities in banking
network. The bank hasnetwork. The bank hasnetwork. The bank has
equivalent ATMs by the endequivalent ATMs by the endequivalent ATMs by the endequivalent ATMs by the end
Exhibit 07: Branches in Metro, Urban, Semi – Urban & RuralExhibit 07: Branches in Metro, Urban, Semi – Urban & RuralExhibit 07: Branches in Metro, Urban, Semi – Urban & Rural
120012001200
10001000
453800 453800
378
453
600332
378600
197204 206 223 273332
400
600
164197204 206 223 273
332400
119 121 118 123 136164
197204 206 223400
222 266119 121 118 123 136
164
200166 168 168 168 178 222 266119 121 118 123
200
41 41 39 39 39 57 69166 168 168 168 178 222
0 41 41 39 39 39 57 6900
FY9A FY10A FY11A FY12A FY13A FY14E FY15EFY9A FY10A FY11A FY12A FY13A FY14E FY15EFY9A FY10A FY11A FY12A FY13A FY14E FY15E
Metro Urban Semi-Urban RuralMetro Urban Semi-Urban Rural
Source: Perception ResearchSource: Perception ResearchSource: Perception Research

Focus towards J&K state will lead to improvement in NIMFocus towards J&K state will lead to improvement in NIMFocus towards J&K state will lead to improvement in NIMFocus towards J&K state will lead to improvement in NIM
With strong deposit franchise and focus (increase lending) towardsWith strong deposit franchise and focus (increase lending) towardsWith strong deposit franchise and focus (increase lending) towards
support margins going ahead. Bank earns NIMs of 6.20% withinsupport margins going ahead. Bank earns NIMs of 6.20% withinsupport margins going ahead. Bank earns NIMs of 6.20% within
outside the state. We expected NIM to sustain at current levelsoutside the state. We expected NIM to sustain at current levelsoutside the state. We expected NIM to sustain at current levels
the range of 61 to 65 percent, going ahead, and credit growththe range of 61 to 65 percent, going ahead, and credit growththe range of 61 to 65 percent, going ahead, and credit growththe range of 61 to 65 percent, going ahead, and credit growth
portfolio) is expected to grow at a faster pace. J&K Bank hasportfolio) is expected to grow at a faster pace. J&K Bank hasportfolio) is expected to grow at a faster pace. J&K Bank has
FY13, which we expect to improve to 63% in FY14E andFY13, which we expect to improve to 63% in FY14E andFY13, which we expect to improve to 63% in FY14E and
management has guided credit growth (22-25%) will outpacemanagement has guided credit growth (22-25%) will outpacemanagement has guided credit growth (22-25%) will outpacemanagement has guided credit growth (22-25%) will outpace
We have factored in 21% credit growth and 16.5% deposit growthWe have factored in 21% credit growth and 16.5% deposit growthWe have factored in 21% credit growth and 16.5% deposit growth
Exhibit 08:Loan Book - J&K stats and Rest of IndiaExhibit 08:Loan Book - J&K stats and Rest of IndiaExhibit 08:Loan Book - J&K stats and Rest of India
30%80000
26%
30%80000
26% 25%23%
26%23% 23%
25%60000 23% 23% 23%
21% 20%60000
3862021%
18% 18%20%
332983862018% 18%
16% 16% 15%
20%
4000028701
3329813%
16% 16% 15%40000
2429328701
3329813%
10%
15%40000
2055624293
2870113%10%
2000029135
2055624293 10%
20000
19536 24113 2913520556
5%20000
12574 15839 19536 24113 29135 5%12574 15839 19536
0%0 0%0
FY12A FY13A FY14E FY15E FY16EFY12A FY13A FY14E FY15E FY16E
J&K State Rest of India Growth (%) Growth (%)J&K State Rest of India Growth (%) Growth (%)J&K State Rest of India Growth (%) Growth (%)
Source: Perception ResearchSource: Perception Research
Exhibit 10:NIM - J&K stateExhibit 10:NIM - J&K stateExhibit 10:NIM - J&K state
FY15E, 6.2% FY16E, 6.2%FY15E, 6.2% FY16E, 6.2%
FY13A, 6.2%
FY15E, 6.2% FY16E, 6.2%
FY13A, 6.2%FY13A, 6.2%
FY14E, 6.1%FY14E, 6.1%FY14E, 6.1%
FY12A, 6.0%FY12A, 6.0%FY12A, 6.0%
0 1 2 3 4 5 60 1 2 3 4 5 6
Source: Perception ResearchSource: Perception ResearchSource: Perception Research
towards J&K state wouldtowards J&K state wouldtowards J&K state would
within the state and 2.5%within the state and 2.5%within the state and 2.5%
levels of 4%+ as its CD ratio inlevels of 4%+ as its CD ratio inlevels of 4%+ as its CD ratio in
growth with J&K (higher yieldinggrowth with J&K (higher yieldinggrowth with J&K (higher yieldinggrowth with J&K (higher yielding
has a CD ratio of 61% as onhas a CD ratio of 61% as onhas a CD ratio of 61% as on
64% in FY15E. Even the64% in FY15E. Even the64% in FY15E. Even the
deposit growth (17-18%).deposit growth (17-18%).deposit growth (17-18%).deposit growth (17-18%).
growth in FY14E.growth in FY14E.growth in FY14E.
Exhibit 09: Deposits - J&K stats and Rest of IndiaExhibit 09: Deposits - J&K stats and Rest of IndiaExhibit 09: Deposits - J&K stats and Rest of India
80%120000
69%
80%120000
69%100000 69%60%
100000
4109760%
8000034865
4109780000
2843034865
41097
40%60000
80000
2335428430
3486540%60000
1380323354
28430 40%
40000
60000
5913913803
23354
24% 22% 23% 20%40000
40867 46387 52297 5913913803
16% 14%
24% 22% 23%18% 20%
20000
40000
35308 40867 46387 52297 5913912%
16% 14% 13% 13%22% 23%
18% 20%20000 35308 40867 4638712%
16% 14% 13% 13%20000
0%0 0%0
FY12A FY13A FY14E FY15E FY16EFY12A FY13A FY14E FY15E FY16E
J&K State Rest of India Growth (%) Growth (%)J&K State Rest of India Growth (%) Growth (%)J&K State Rest of India Growth (%) Growth (%)
Source: Perception ResearchSource: Perception Research
Exhibit 11:NIM - Rest of IndiaExhibit 11:NIM - Rest of IndiaExhibit 11:NIM - Rest of India
FY15E, 2.6%FY15E, 2.6%FY16E, 2.6%
FY15E, 2.6%FY16E, 2.6%FY16E, 2.6%
FY13A, 2.6%FY13A, 2.6%
FY12A, 2.5% FY14E, 2.5%FY12A, 2.5% FY14E, 2.5%FY12A, 2.5% FY14E, 2.5%
0 1 2 3 4 5 60 1 2 3 4 5 60 1 2 3 4 5 6
Source: Perception ResearchSource: Perception ResearchSource: Perception Research
Huge Potential in J&K state for Horticultural LendingHuge Potential in J&K state for Horticultural LendingHuge Potential in J&K state for Horticultural LendingHuge Potential in J&K state for Horticultural Lending
Agriculture involves about 70% of the population and contributesAgriculture involves about 70% of the population and contributesAgriculture involves about 70% of the population and contributes
only 16 % of J&K Bank’s lending is to this sector. Horticulturalonly 16 % of J&K Bank’s lending is to this sector. Horticulturalonly 16 % of J&K Bank’s lending is to this sector. Horticultural
about 45 % to Agricultural production and involves 30 lac peopleabout 45 % to Agricultural production and involves 30 lac peopleabout 45 % to Agricultural production and involves 30 lac people
% by value of the State’s Horticultural output. J&K State produces% by value of the State’s Horticultural output. J&K State produces% by value of the State’s Horticultural output. J&K State produces% by value of the State’s Horticultural output. J&K State produces
apple output and controls 49 % of land dedicated to apple cultivationapple output and controls 49 % of land dedicated to apple cultivationapple output and controls 49 % of land dedicated to apple cultivation
Out of a total of more than 283000 apple growers in the State,Out of a total of more than 283000 apple growers in the State,Out of a total of more than 283000 apple growers in the State,
extended to about 17300 growers so far. Tapping the remaining
Out of a total of more than 283000 apple growers in the State,
extended to about 17300 growers so far. Tapping the remainingextended to about 17300 growers so far. Tapping the remainingextended to about 17300 growers so far. Tapping the remaining
credit of about Rs.7000 Cr more. In J&K 75 % of Apple growerscredit of about Rs.7000 Cr more. In J&K 75 % of Apple growerscredit of about Rs.7000 Cr more. In J&K 75 % of Apple growers
traders and are unaware that its effective interest cost thattraders and are unaware that its effective interest cost thattraders and are unaware that its effective interest cost that
54%, against the Bank’s interest ranging from 4% to11%.54%, against the Bank’s interest ranging from 4% to11%.54%, against the Bank’s interest ranging from 4% to11%.54%, against the Bank’s interest ranging from 4% to11%.
Current shortfall in Agriculture Sector Lending is Rs. 2335 Cr, whichCurrent shortfall in Agriculture Sector Lending is Rs. 2335 Cr, whichCurrent shortfall in Agriculture Sector Lending is Rs. 2335 Cr, which
RIDF/MSME Bonds/RHF @ 3 to 5 % for 3-7 years. Interest SubventionRIDF/MSME Bonds/RHF @ 3 to 5 % for 3-7 years. Interest SubventionRIDF/MSME Bonds/RHF @ 3 to 5 % for 3-7 years. Interest Subvention
to J&K Bank recently providing a level playing field vis-à-vis Publicto J&K Bank recently providing a level playing field vis-à-vis Publicto J&K Bank recently providing a level playing field vis-à-vis Publicto J&K Bank recently providing a level playing field vis-à-vis Public
of pricing of agricultural loans and improve the flow of creditof pricing of agricultural loans and improve the flow of creditof pricing of agricultural loans and improve the flow of credit
particularly in J&K State. Assuming yield on incremental Agriculturalparticularly in J&K State. Assuming yield on incremental Agriculturalparticularly in J&K State. Assuming yield on incremental Agricultural
Rate of 10.25 %, the incremental yield (10.25% - 4 %) wouldRate of 10.25 %, the incremental yield (10.25% - 4 %) wouldRate of 10.25 %, the incremental yield (10.25% - 4 %) wouldRate of 10.25 %, the incremental yield (10.25% - 4 %) would
revenue of about Rs. 146 Cr per year on lending Rs.revenue of about Rs. 146 Cr per year on lending Rs.revenue of about Rs. 146 Cr per year on lending Rs.
sector, increasing agricultural advances which will improvesector, increasing agricultural advances which will improvesector, increasing agricultural advances which will improve
helping in financial inclusion, widening customer base andhelping in financial inclusion, widening customer base andhelping in financial inclusion, widening customer base andhelping in financial inclusion, widening customer base and
remote rural areas.remote rural areas.remote rural areas.
Exhibit 12: Apple Grower in J&K StateExhibit 12: Apple Grower in J&K StateExhibit 12: Apple Grower in J&K State
Total Grower Total Grower Total Grower
, 283000, 283000, 283000
Source: Perception ResearchSource: Perception Research
contributes 23 % to the GDP, yetcontributes 23 % to the GDP, yetcontributes 23 % to the GDP, yet
Horticultural production contributesHorticultural production contributesHorticultural production contributes
people. Apples account for 86people. Apples account for 86people. Apples account for 86
produces 77 % of India’s totalproduces 77 % of India’s totalproduces 77 % of India’s totalproduces 77 % of India’s total
cultivation.cultivation.cultivation.
State, Bank’s finance has beenState, Bank’s finance has beenState, Bank’s finance has been
remaining growers will generate
State, Bank’s finance has been
remaining growers will generateremaining growers will generateremaining growers will generate
growers get their financing fromgrowers get their financing fromgrowers get their financing from
that works out to 36% tothat works out to 36% tothat works out to 36% to
which has to be invested inwhich has to be invested inwhich has to be invested in
Subvention Scheme extendedSubvention Scheme extendedSubvention Scheme extended
Public Sector Banks in termsPublic Sector Banks in termsPublic Sector Banks in termsPublic Sector Banks in terms
credit to agricultural sectorcredit to agricultural sectorcredit to agricultural sector
Agricultural Advances at BaseAgricultural Advances at BaseAgricultural Advances at Base
would generate an incrementalwould generate an incrementalwould generate an incrementalwould generate an incremental
2335 Cr to agricultural2335 Cr to agricultural2335 Cr to agricultural
core advances portfoliocore advances portfoliocore advances portfolio
and enhancing outreach inand enhancing outreach inand enhancing outreach inand enhancing outreach in
Potential For Potential For Potential For
Lending, 265700Lending, 265700Lending, 265700
J&K's J&K's
Borrower,17300Borrower,17300Borrower,17300
Cheap Valuation and High Dividend yieldCheap Valuation and High Dividend yieldCheap Valuation and High Dividend yield
At current market price, J&K bank is still available at FY14E Price
Cheap Valuation and High Dividend yield
At current market price, J&K bank is still available at FY14E PriceAt current market price, J&K bank is still available at FY14E PriceAt current market price, J&K bank is still available at FY14E Price
times. The estimated dividend yield for FY14 is 5.4%. High dividendtimes. The estimated dividend yield for FY14 is 5.4%. High dividendtimes. The estimated dividend yield for FY14 is 5.4%. High dividend
comfortable cushion. At CMP of Rs 1101, the stock is trading atcomfortable cushion. At CMP of Rs 1101, the stock is trading atcomfortable cushion. At CMP of Rs 1101, the stock is trading at
for FY14E & FY15E, respectively.for FY14E & FY15E, respectively.for FY14E & FY15E, respectively.for FY14E & FY15E, respectively.
Exhibit 13: P/E (x) & P/BV (x) Exhibit 13: P/E (x) & P/BV (x)
1.51.2 1.51.1
1.2 1.51.1
1.2
0.90.9 1.10.9 1.10.9
7.37.8
0.90.86.8 7.3
7.80.8
0.66.8 7.3
5.3
0.80.6
5.35.1 4.3
0.65.3
5.1 4.34.33.53.5
2.92.9
FY9A FY10A FY11A FY12A FY13A FY14E FY15E FY16EFY9A FY10A FY11A FY12A FY13A FY14E FY15E FY16E
P/E (X) P/BV (X)P/E (X) P/BV (X)
Source: Perception ResearchSource: Perception Research
Price to book value of 0.9Price to book value of 0.9Price to book value of 0.9Price to book value of 0.9
dividend yield provides with adividend yield provides with adividend yield provides with a
at 4.3x and 3.5x to its PEat 4.3x and 3.5x to its PEat 4.3x and 3.5x to its PE
Exhibit 14: DPS & Dividend yieldExhibit 14: DPS & Dividend yield
88 10%100 88 10%100
72
88 10%100
728% 8% 8%8059
728% 8% 8%80
5059
7%6%60 50
5%
7%6%60
33
50
5%5%
5%6%60
26334% 4%
5%5%
5%
4%40
1722 26
334% 4%5%
4%40
1722 26
2%2017
2%20 2%20
0%0 0%0 0%0
FY9A FY10A FY11A FY12A FY13A FY14E FY15E FY16EFY9A FY10A FY11A FY12A FY13A FY14E FY15E FY16EFY9A FY10A FY11A FY12A FY13A FY14E FY15E FY16E
DPS Dividend yield (%)DPS Dividend yield (%)DPS Dividend yield (%)
Source: Perception ResearchSource: Perception Research
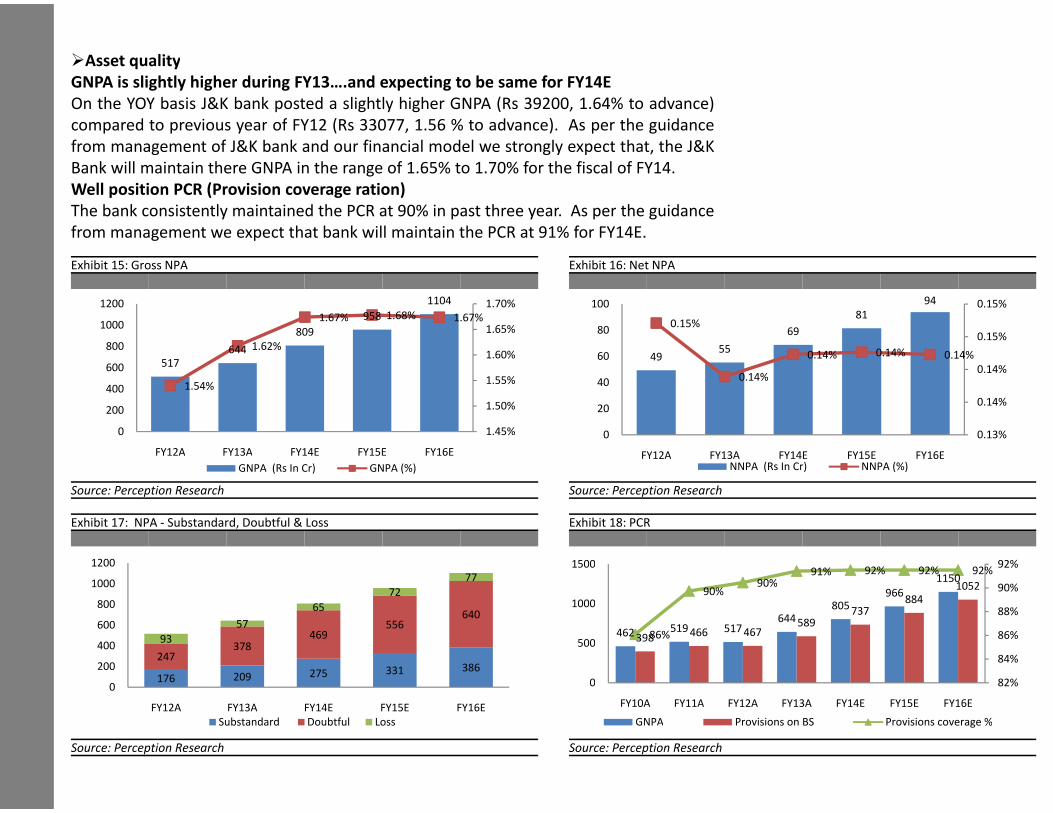
�Asset quality�Asset quality�Asset qualityAsset quality
GNPA is slightly higher during FY13….and expecting to be sameGNPA is slightly higher during FY13….and expecting to be sameGNPA is slightly higher during FY13….and expecting to be same
On the YOY basis J&K bank posted a slightly higher GNPA (Rs 39200On the YOY basis J&K bank posted a slightly higher GNPA (Rs 39200On the YOY basis J&K bank posted a slightly higher GNPA (Rs 39200
compared to previous year of FY12 (Rs 33077, 1.56 % to advance)compared to previous year of FY12 (Rs 33077, 1.56 % to advance)compared to previous year of FY12 (Rs 33077, 1.56 % to advance)
from management of J&K bank and our financial model we stronglyfrom management of J&K bank and our financial model we stronglyfrom management of J&K bank and our financial model we stronglyfrom management of J&K bank and our financial model we strongly
Bank will maintain there GNPA in the range of 1.65% to 1.70% forBank will maintain there GNPA in the range of 1.65% to 1.70% forBank will maintain there GNPA in the range of 1.65% to 1.70% for
Well position PCR (Provision coverage ration)Well position PCR (Provision coverage ration)Well position PCR (Provision coverage ration)
The bank consistently maintained the PCR at 90% in past threeThe bank consistently maintained the PCR at 90% in past threeThe bank consistently maintained the PCR at 90% in past threeThe bank consistently maintained the PCR at 90% in past three
from management we expect that bank will maintain the PCR atfrom management we expect that bank will maintain the PCR atfrom management we expect that bank will maintain the PCR at
Exhibit 15: Gross NPAExhibit 15: Gross NPAExhibit 15: Gross NPA
11041104 1.70%1200958
1104
1.67% 1.68% 1.67%
1.70%12009581.67% 1.68% 1.67%
1.65%1000809
9581.67% 1.68% 1.67%1.65%1000
809
1.62%
1.65%
800
1000
644 1.62%1.60%
800
517
644 1.62%1.60%
800
5171.60%
600 517
1.55%600
1.54%1.55%
400 1.54%400
1.50%200 1.50%200
1.45%0
200
1.45%0 1.45%0
FY12A FY13A FY14E FY15E FY16EFY12A FY13A FY14E FY15E FY16E
GNPA (Rs In Cr) GNPA (%)GNPA (Rs In Cr) GNPA (%)GNPA (Rs In Cr) GNPA (%)
Source: Perception ResearchSource: Perception Research
Exhibit 17: NPA - Substandard, Doubtful & LossExhibit 17: NPA - Substandard, Doubtful & LossExhibit 17: NPA - Substandard, Doubtful & Loss
12001200
77
1200
771000
72
771000
65
72800
64065800
556640
57
65
600469
556640
57600
378469
556
93
57
400
600
37846993
400247
378400
275 331 386247
200176 209 275 331 386200176 209 275 331
00
FY12A FY13A FY14E FY15E FY16EFY12A FY13A FY14E FY15E FY16EFY12A FY13A FY14E FY15E FY16E
Substandard Doubtful LossSubstandard Doubtful Loss
Source: Perception ResearchSource: Perception ResearchSource: Perception Research
same for FY14Esame for FY14Esame for FY14E
39200, 1.64% to advance)39200, 1.64% to advance)39200, 1.64% to advance)
advance). As per the guidanceadvance). As per the guidanceadvance). As per the guidance
strongly expect that, the J&Kstrongly expect that, the J&Kstrongly expect that, the J&Kstrongly expect that, the J&K
for the fiscal of FY14.for the fiscal of FY14.for the fiscal of FY14.
year. As per the guidanceyear. As per the guidanceyear. As per the guidanceyear. As per the guidance
at 91% for FY14E.at 91% for FY14E.at 91% for FY14E.
Exhibit 16: Net NPAExhibit 16: Net NPAExhibit 16: Net NPA
9494 0.15%10081
94 0.15%10081
0.15%69
0.15%0.15%
80 69 0.15%80
4955
0.14% 0.14% 0.14%
0.15%
60 4955
0.14% 0.14% 0.14%60 49 0.14% 0.14%
0.14%60
0.14%0.14%
40 0.14%40
0.14%
40
0.14%20
0.14%20
0.13%0 0.13%0
FY12A FY13A FY14E FY15E FY16EFY12A FY13A FY14E FY15E FY16ENNPA (Rs In Cr) NNPA (%)NNPA (Rs In Cr) NNPA (%)NNPA (Rs In Cr) NNPA (%)
Source: Perception ResearchSource: Perception Research
Exhibit 18: PCRExhibit 18: PCRExhibit 18: PCR
91% 92% 92% 92%92%1500
115091% 92% 92% 92%
92%1500
1150105290%
91% 92% 92% 92%
90%966
1150
8841052
90%90% 90%
805966
8841052
90% 90%
1000
644805
737884
88%1000
519 517644
805
589737 88%
462 519 517644
398466 467
58986% 86%462 519 517
398466 46786% 86%
500462 39886% 86%
500
84%
500
84%
82%0 82%0 82%0
FY10A FY11A FY12A FY13A FY14E FY15E FY16EFY10A FY11A FY12A FY13A FY14E FY15E FY16E
GNPA Provisions on BS Provisions coverage %GNPA Provisions on BS Provisions coverage %GNPA Provisions on BS Provisions coverage %
Source: Perception ResearchSource: Perception ResearchSource: Perception Research
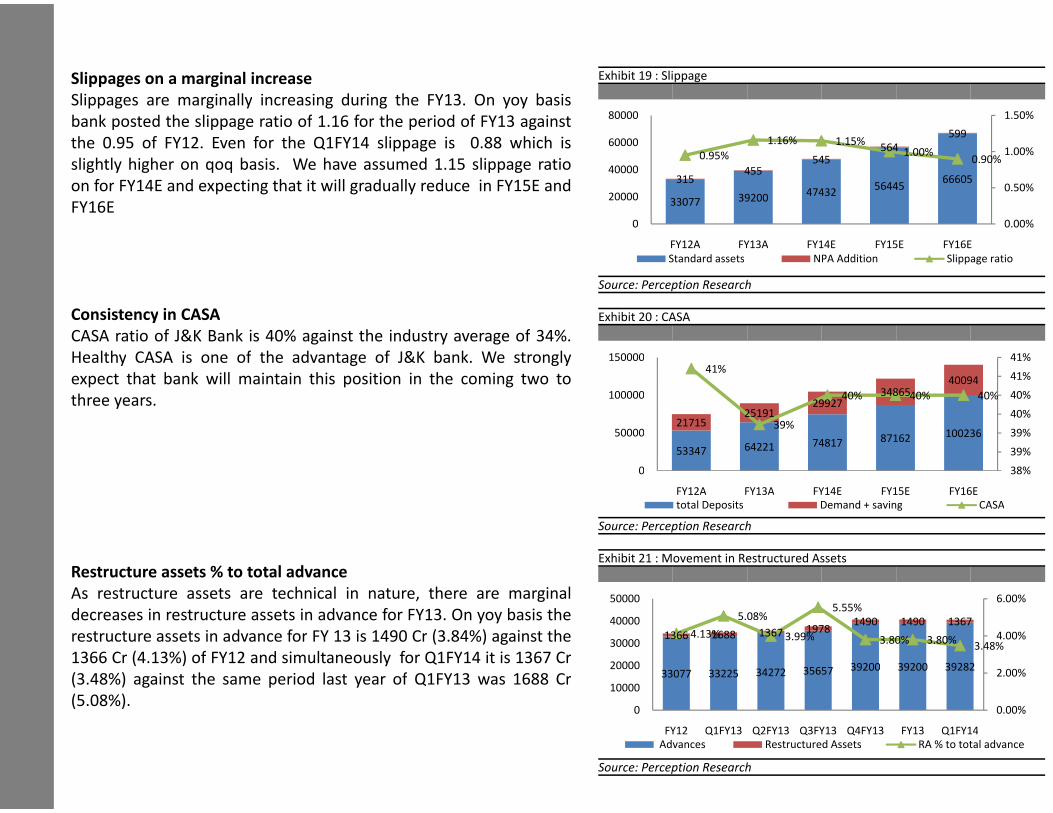
Slippages on a marginal increaseSlippages on a marginal increaseSlippages on a marginal increase
Slippages are marginally increasing during the FY13. On yoy
Slippages on a marginal increase
Slippages are marginally increasing during the FY13. On yoySlippages are marginally increasing during the FY13. On yoySlippages are marginally increasing during the FY13. On yoy
bank posted the slippage ratio of 1.16 for the period of FY13 againstbank posted the slippage ratio of 1.16 for the period of FY13 againstbank posted the slippage ratio of 1.16 for the period of FY13 against
the 0.95 of FY12. Even for the Q1FY14 slippage is 0.88 whichthe 0.95 of FY12. Even for the Q1FY14 slippage is 0.88 whichthe 0.95 of FY12. Even for the Q1FY14 slippage is 0.88 which
slightly higher on qoq basis. We have assumed 1.15 slippageslightly higher on qoq basis. We have assumed 1.15 slippageslightly higher on qoq basis. We have assumed 1.15 slippageslightly higher on qoq basis. We have assumed 1.15 slippage
on for FY14E and expecting that it will gradually reduce in FY15on for FY14E and expecting that it will gradually reduce in FY15on for FY14E and expecting that it will gradually reduce in FY15
FY16EFY16EFY16E
Consistency in CASAConsistency in CASAConsistency in CASAConsistency in CASA
CASA ratio of J&K Bank is 40% against the industry average ofCASA ratio of J&K Bank is 40% against the industry average ofCASA ratio of J&K Bank is 40% against the industry average of
Healthy CASA is one of the advantage of J&K bank. We stronglyHealthy CASA is one of the advantage of J&K bank. We stronglyHealthy CASA is one of the advantage of J&K bank. We strongly
expect that bank will maintain this position in the coming twoexpect that bank will maintain this position in the coming twoexpect that bank will maintain this position in the coming twoexpect that bank will maintain this position in the coming two
three years.three years.three years.
Restructure assets % to total advanceRestructure assets % to total advanceRestructure assets % to total advance
As restructure assets are technical in nature, there are marginalAs restructure assets are technical in nature, there are marginalAs restructure assets are technical in nature, there are marginalAs restructure assets are technical in nature, there are marginal
decreases in restructure assets in advance for FY13. On yoy basisdecreases in restructure assets in advance for FY13. On yoy basisdecreases in restructure assets in advance for FY13. On yoy basis
restructure assets in advance for FY 13 is 1490 Cr (3.84%) againstrestructure assets in advance for FY 13 is 1490 Cr (3.84%) againstrestructure assets in advance for FY 13 is 1490 Cr (3.84%) against
1366 Cr (4.13%) of FY12 and simultaneously for Q1FY14 it is 13671366 Cr (4.13%) of FY12 and simultaneously for Q1FY14 it is 13671366 Cr (4.13%) of FY12 and simultaneously for Q1FY14 it is 1367
(3.48%) against the same period last year of Q1FY13 was 1688
1366 Cr (4.13%) of FY12 and simultaneously for Q1FY14 it is 1367
(3.48%) against the same period last year of Q1FY13 was 1688(3.48%) against the same period last year of Q1FY13 was 1688(3.48%) against the same period last year of Q1FY13 was 1688
(5.08%).(5.08%).(5.08%).
Exhibit 19 : SlippageExhibit 19 : Slippage
yoy basis
Exhibit 19 : Slippage
yoy basisyoy basisyoy basis
against 1.50%80000against599
1.50%80000against
which is599
1.16% 1.15%60000which is 564
5991.16% 1.15%
1.00% 1.00%60000which is
slippage ratio 545564
0.95%
1.16% 1.15%1.00%
0.90%1.00%
60000
slippage ratio 455545
5640.95% 1.00%
0.90%1.00%
40000slippage ratio66605315
455545 0.90%
40000slippage ratio
15E and 5644566605315
455
0.50%
40000
15E and39200
4743256445
666053150.50%
2000015E and
33077 3920047432
56445 0.50%20000
33077 3920020000
0.00%0 0.00%0 0.00%0
FY12A FY13A FY14E FY15E FY16EFY12A FY13A FY14E FY15E FY16EFY12A FY13A FY14E FY15E FY16E
Standard assets NPA Addition Slippage ratioStandard assets NPA Addition Slippage ratio
Source: Perception ResearchSource: Perception Research
Exhibit 20 : CASAExhibit 20 : CASA
of 34%.
Exhibit 20 : CASA
of 34%.of 34%.
strongly 41%150000strongly 41%150000strongly
two to41%
41%
41%150000
two to 4009441%
41%two to34865
40094
40%
41%
100000
two to
299273486540% 40% 40% 40%100000
2519129927
3486540% 40% 40% 40%100000
2171525191
2992740%
2171525191
39%40%
87162 10023621715 39%
39%50000
53347 64221 74817 87162 100236 39%50000
53347 64221 74817 87162
39%53347 64221 39%
38%0 38%0
FY12A FY13A FY14E FY15E FY16EFY12A FY13A FY14E FY15E FY16E
total Deposits Demand + saving CASAtotal Deposits Demand + saving CASA
Source: Perception Research
total Deposits Demand + saving CASA
Source: Perception ResearchSource: Perception Research
Exhibit 21 : Movement in Restructured Assets Exhibit 21 : Movement in Restructured Assets Exhibit 21 : Movement in Restructured Assets
marginalmarginal 6.00%50000marginal5.55%
6.00%50000marginal
basis the 5.08%5.55%
6.00%50000
basis the 1490 1490 13675.08%5.55%
40000basis the
against the 1366 1688 1367 19781490 1490 1367
4.13%
5.08%
3.99% 4.00%
40000
against the 1366 1688 1367 19784.13% 3.99% 3.80% 3.80%3.48%
4.00%30000against the
1367 Cr
1366 1688 13674.13% 3.99% 3.80% 3.80%3.48%
4.00%30000
1367 Cr3.48%
20000
30000
1367 Cr
1688 Cr 33077 33225 34272 35657 39200 39200 392822.00%
200001367 Cr
1688 Cr 33077 33225 34272 35657 39200 39200 392822.00%
20000
1688 Cr 33077 33225 34272 35657 2.00%
100001688 Cr
10000
0.00%0 0.00%0 0.00%0
FY12 Q1FY13 Q2FY13 Q3FY13 Q4FY13 FY13 Q1FY14FY12 Q1FY13 Q2FY13 Q3FY13 Q4FY13 FY13 Q1FY14FY12 Q1FY13 Q2FY13 Q3FY13 Q4FY13 FY13 Q1FY14
Advances Restructured Assets RA % to total advanceAdvances Restructured Assets RA % to total advance
Source: Perception ResearchSource: Perception ResearchSource: Perception Research
Capital adequacyCapital adequacyCapital adequacy
The bank is well capitalized with total capital adequacy ratio
Capital adequacy
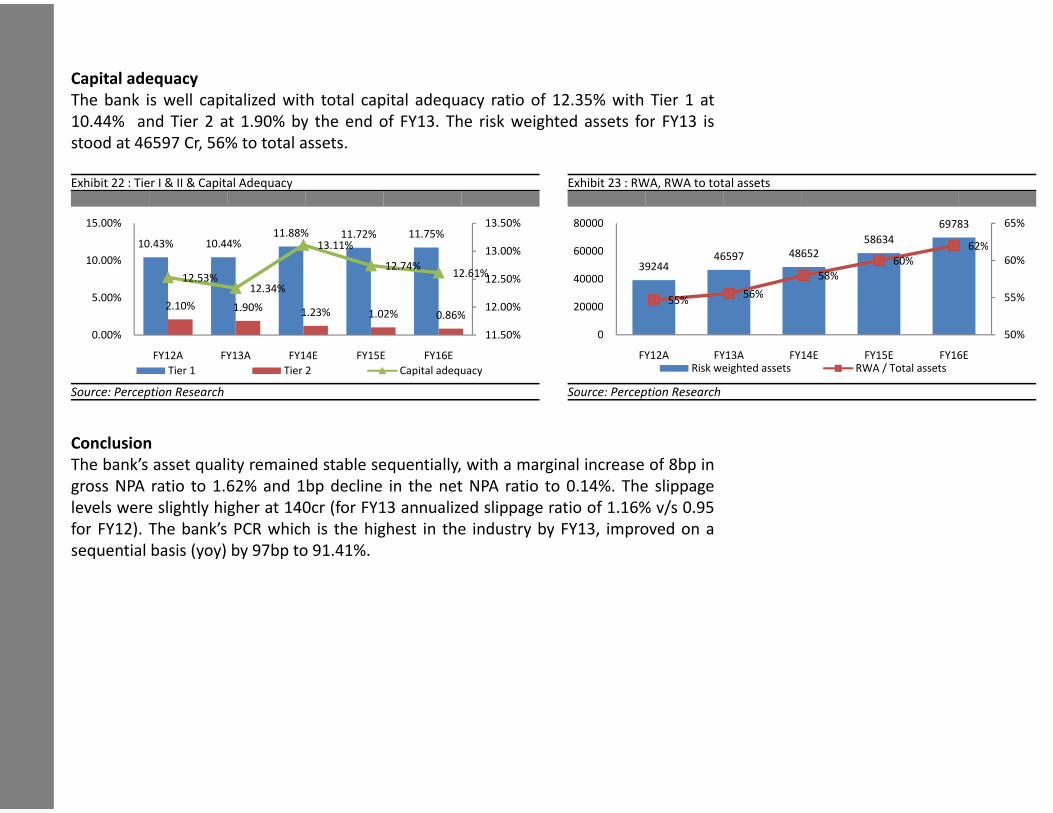
The bank is well capitalized with total capital adequacy ratioThe bank is well capitalized with total capital adequacy ratioThe bank is well capitalized with total capital adequacy ratio
10.44% and Tier 2 at 1.90% by the end of FY13. The risk weighted10.44% and Tier 2 at 1.90% by the end of FY13. The risk weighted10.44% and Tier 2 at 1.90% by the end of FY13. The risk weighted
stood at 46597 Cr, 56% to total assets.stood at 46597 Cr, 56% to total assets.stood at 46597 Cr, 56% to total assets.
Exhibit 22 : Tier I & II & Capital AdequacyExhibit 22 : Tier I & II & Capital Adequacy
13.50%15.00%11.88% 11.72% 11.75%
13.50%15.00%
10.43% 10.44%11.88% 11.72% 11.75%
13.11%
13.50%15.00%
10.43% 10.44%11.88% 11.72% 11.75%
13.11%13.00%
10.43% 10.44% 13.11%13.00%
10.00%12.74%
12.61%
13.00%10.00%
12.53%12.74%
12.61%12.50%
10.00%
12.53%12.34%
12.61%12.50%12.53%
12.34%12.50%
5.00%2.10% 1.90%
12.34%
12.00%5.00%
2.10% 1.90% 1.23% 1.02% 0.86%12.00%
5.00%1.90% 1.23% 1.02% 0.86%
12.00%
11.50%0.00% 11.50%0.00% 11.50%0.00%
FY12A FY13A FY14E FY15E FY16EFY12A FY13A FY14E FY15E FY16EFY12A FY13A FY14E FY15E FY16E
Tier 1 Tier 2 Capital adequacyTier 1 Tier 2 Capital adequacy
Source: Perception ResearchSource: Perception ResearchSource: Perception Research
ConclusionConclusionConclusionConclusion
The bank’s asset quality remained stable sequentially, with a marginalThe bank’s asset quality remained stable sequentially, with a marginalThe bank’s asset quality remained stable sequentially, with a marginal
gross NPA ratio to 1.62% and 1bp decline in the net NPA ratiogross NPA ratio to 1.62% and 1bp decline in the net NPA ratiogross NPA ratio to 1.62% and 1bp decline in the net NPA ratio
levels were slightly higher at 140cr (for FY13 annualized slippagelevels were slightly higher at 140cr (for FY13 annualized slippagelevels were slightly higher at 140cr (for FY13 annualized slippage
for FY12). The bank’s PCR which is the highest in the industryfor FY12). The bank’s PCR which is the highest in the industryfor FY12). The bank’s PCR which is the highest in the industryfor FY12). The bank’s PCR which is the highest in the industry
sequential basis (yoy) by 97bp to 91.41%.sequential basis (yoy) by 97bp to 91.41%.sequential basis (yoy) by 97bp to 91.41%.
of 12.35% with Tier 1 atof 12.35% with Tier 1 atof 12.35% with Tier 1 atof 12.35% with Tier 1 at
weighted assets for FY13 isweighted assets for FY13 isweighted assets for FY13 is
Exhibit 23 : RWA, RWA to total assetsExhibit 23 : RWA, RWA to total assets
69783 65%80000 69783 65%80000
58634
69783 65%80000
48652
5863462%60000
46597 4865260%
62%
60%60000
3924446597 48652
60% 60%60000
3924458%
60% 60%
40000 58%40000
55%56% 55%
40000
55%56% 55%
2000055% 55%
2000020000
50%0 50%0 50%0
FY12A FY13A FY14E FY15E FY16EFY12A FY13A FY14E FY15E FY16EFY12A FY13A FY14E FY15E FY16ERisk weighted assets RWA / Total assetsRisk weighted assets RWA / Total assets
Source: Perception ResearchSource: Perception ResearchSource: Perception Research
marginal increase of 8bp inmarginal increase of 8bp inmarginal increase of 8bp in
ratio to 0.14%. The slippageratio to 0.14%. The slippageratio to 0.14%. The slippage
slippage ratio of 1.16% v/s 0.95slippage ratio of 1.16% v/s 0.95slippage ratio of 1.16% v/s 0.95
industry by FY13, improved on aindustry by FY13, improved on aindustry by FY13, improved on aindustry by FY13, improved on a
�J&K State Economy�J&K State Economy�J&K State Economy
GDP Size and GrowthGDP Size and GrowthGDP Size and GrowthGDP Size and Growth
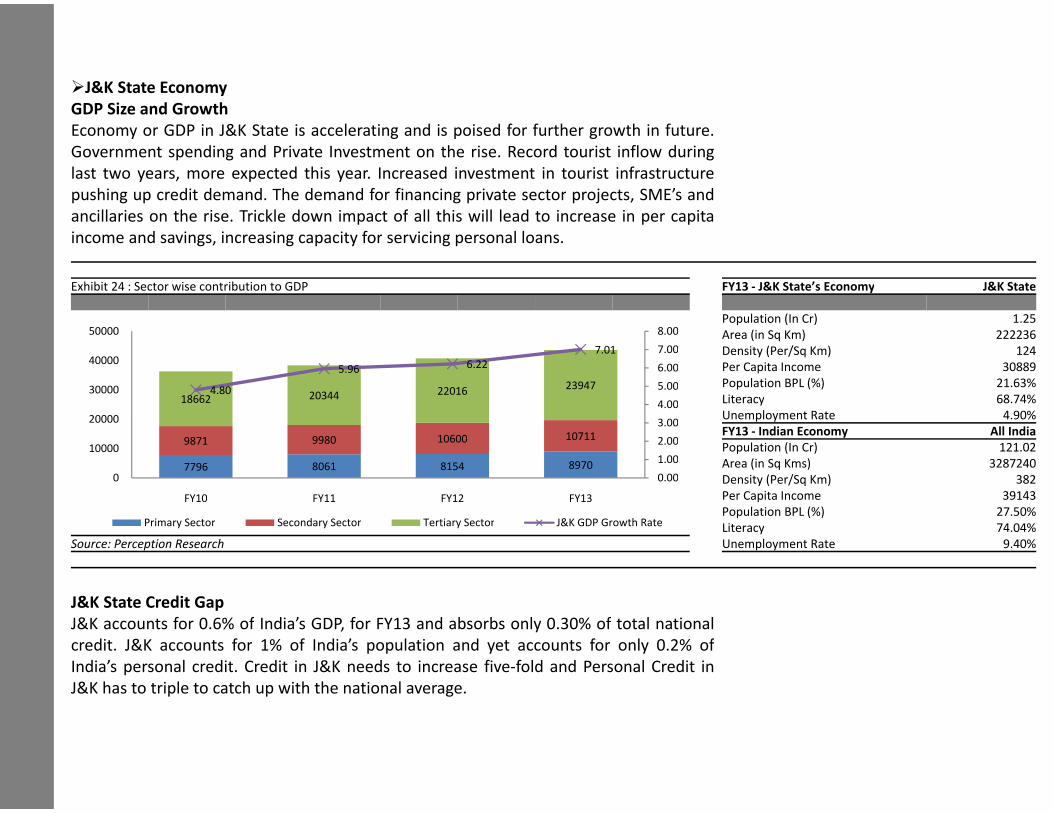
Economy or GDP in J&K State is accelerating and is poised forEconomy or GDP in J&K State is accelerating and is poised forEconomy or GDP in J&K State is accelerating and is poised for
Government spending and Private Investment on the rise. RecordGovernment spending and Private Investment on the rise. RecordGovernment spending and Private Investment on the rise. Record
last two years, more expected this year. Increased investmentlast two years, more expected this year. Increased investmentlast two years, more expected this year. Increased investmentlast two years, more expected this year. Increased investment
pushing up credit demand. The demand for financing private sectorpushing up credit demand. The demand for financing private sectorpushing up credit demand. The demand for financing private sector
ancillaries on the rise. Trickle down impact of all this will leadancillaries on the rise. Trickle down impact of all this will leadancillaries on the rise. Trickle down impact of all this will lead
income and savings, increasing capacity for servicing personal loansincome and savings, increasing capacity for servicing personal loansincome and savings, increasing capacity for servicing personal loansincome and savings, increasing capacity for servicing personal loans
Exhibit 24 : Sector wise contribution to GDPExhibit 24 : Sector wise contribution to GDPExhibit 24 : Sector wise contribution to GDP
5000050000
6.22400005.96 6.22400005.96 6.22
220164.803000018662 20344 220164.803000018662 20344 220164.80
2000020000
9871 9980 10600
20000
9871 9980 1060010000
9871 9980 1060010000
7796 8061 8154
10000
7796 8061 81540
7796 8061 815400
FY10 FY11 FY12FY10 FY11 FY12
Primary Sector Secondary Sector Tertiary SectorPrimary Sector Secondary Sector Tertiary Sector
Source: Perception Research
Primary Sector Secondary Sector Tertiary Sector
Source: Perception ResearchSource: Perception Research
J&K State Credit GapJ&K State Credit GapJ&K State Credit GapJ&K State Credit Gap
J&K accounts for 0.6% of India’s GDP, for FY13 and absorbs onlyJ&K accounts for 0.6% of India’s GDP, for FY13 and absorbs onlyJ&K accounts for 0.6% of India’s GDP, for FY13 and absorbs only
credit. J&K accounts for 1% of India’s population and yet accountscredit. J&K accounts for 1% of India’s population and yet accountscredit. J&K accounts for 1% of India’s population and yet accounts
India’s personal credit. Credit in J&K needs to increase five-foldIndia’s personal credit. Credit in J&K needs to increase five-foldIndia’s personal credit. Credit in J&K needs to increase five-fold
J&K has to triple to catch up with the national average.J&K has to triple to catch up with the national average.J&K has to triple to catch up with the national average.J&K has to triple to catch up with the national average.
for further growth in future.for further growth in future.for further growth in future.
Record tourist inflow duringRecord tourist inflow duringRecord tourist inflow during
investment in tourist infrastructureinvestment in tourist infrastructureinvestment in tourist infrastructureinvestment in tourist infrastructure
sector projects, SME’s andsector projects, SME’s andsector projects, SME’s and
lead to increase in per capitalead to increase in per capitalead to increase in per capita
loans.loans.loans.loans.
FY13 - J&K State’s Economy J&K StateFY13 - J&K State’s Economy J&K StateFY13 - J&K State’s Economy J&K State
Population (In Cr) 1.25Population (In Cr) 1.25Population (In Cr) 1.25
Area (in Sq Km) 2222368.00 Area (in Sq Km) 2222368.00 Area (in Sq Km) 222236
Density (Per/Sq Km) 1247.01 7.00 Density (Per/Sq Km) 124
Per Capita Income 30889
7.01 7.00
Per Capita Income 308896.00 Per Capita Income 30889
Population BPL (%) 21.63%23947
6.00
Population BPL (%) 21.63%23947 5.00 Population BPL (%) 21.63%
Literacy 68.74%23947
4.00
5.00
Literacy 68.74%4.00 Literacy 68.74%
Unemployment Rate 4.90%3.00
4.00Unemployment Rate 4.90%
FY13 - Indian Economy All India3.00
FY13 - Indian Economy All India10711 2.00
3.00FY13 - Indian Economy All India
Population (In Cr) 121.0210711 2.00
Population (In Cr) 121.021.00
2.00Population (In Cr) 121.02
Area (in Sq Kms) 328724089701.00 Area (in Sq Kms) 3287240
Density (Per/Sq Km) 3828970
0.00
1.00
Density (Per/Sq Km) 3828970
0.00 Density (Per/Sq Km) 382
Per Capita Income 39143
0.00
Per Capita Income 39143FY13 Per Capita Income 39143
Population BPL (%) 27.50%FY13
Population BPL (%) 27.50%J&K GDP Growth Rate
Population BPL (%) 27.50%
Literacy 74.04%J&K GDP Growth Rate Literacy 74.04%
Unemployment Rate 9.40%
J&K GDP Growth Rate
Unemployment Rate 9.40%Unemployment Rate 9.40%
only 0.30% of total nationalonly 0.30% of total nationalonly 0.30% of total national
accounts for only 0.2% ofaccounts for only 0.2% ofaccounts for only 0.2% of
fold and Personal Credit infold and Personal Credit infold and Personal Credit in
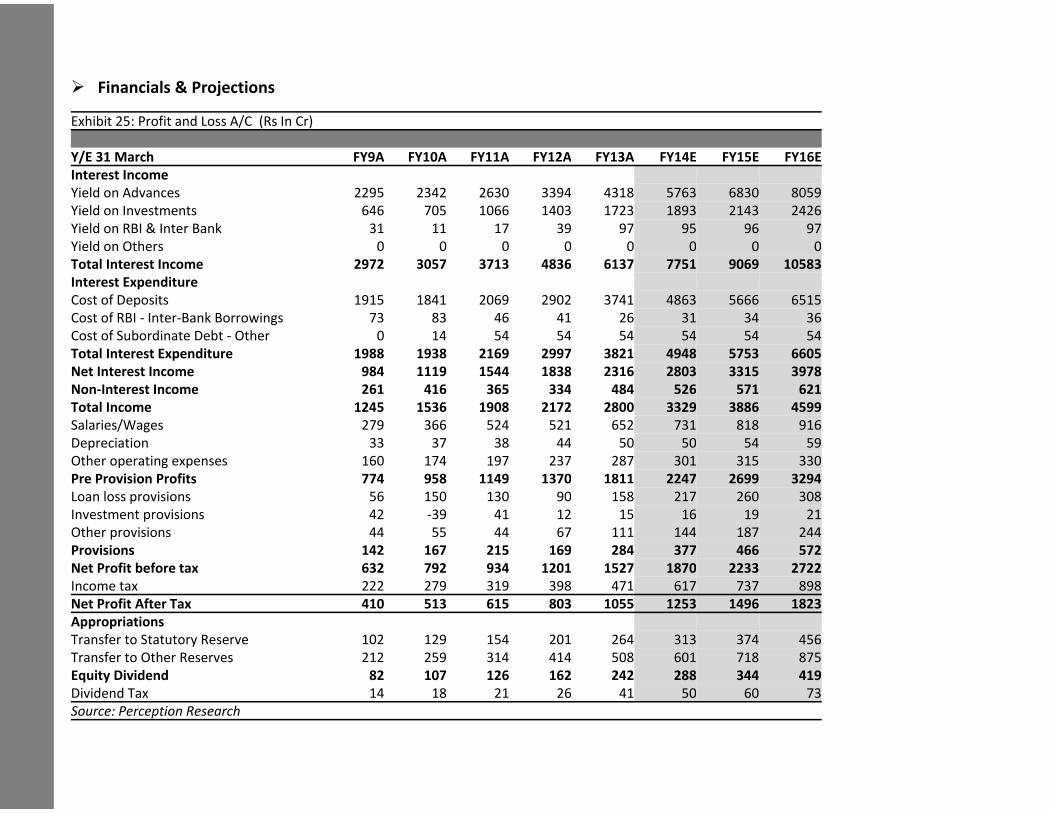
� Financials & Projections� Financials & Projections� Financials & Projections
Exhibit 25: Profit and Loss A/C (Rs In Cr)Exhibit 25: Profit and Loss A/C (Rs In Cr)Exhibit 25: Profit and Loss A/C (Rs In Cr)
Y/E 31 March FY9A FY10A FY11AY/E 31 March FY9A FY10A FY11AY/E 31 March FY9A FY10A FY11A
Interest IncomeInterest IncomeInterest Income
Yield on Advances 2295 2342 2630Yield on Advances 2295 2342 2630Yield on Advances 2295 2342 2630
Yield on Investments 646 705 1066Yield on Investments 646 705 1066
Yield on RBI & Inter Bank 31 11 17Yield on RBI & Inter Bank 31 11 17Yield on RBI & Inter Bank 31 11 17
Yield on Others 0 0 0Yield on Others 0 0 0Yield on Others 0 0 0
Total Interest Income 2972 3057 3713Total Interest Income 2972 3057 3713Total Interest Income 2972 3057 3713
Interest ExpenditureInterest ExpenditureInterest Expenditure
Cost of Deposits 1915 1841 2069Cost of Deposits 1915 1841 2069Cost of Deposits 1915 1841 2069
Cost of RBI - Inter-Bank Borrowings 73 83 46Cost of RBI - Inter-Bank Borrowings 73 83 46Cost of RBI - Inter-Bank Borrowings 73 83 46
Cost of Subordinate Debt - Other 0 14 54Cost of Subordinate Debt - Other 0 14 54Cost of Subordinate Debt - Other 0 14 54
Total Interest Expenditure 1988 1938 2169Total Interest Expenditure 1988 1938 2169Total Interest Expenditure 1988 1938 2169
Net Interest Income 984 1119 1544Net Interest Income 984 1119 1544Net Interest Income 984 1119 1544
Non-Interest Income 261 416 365Non-Interest Income 261 416 365Non-Interest Income 261 416 365
Total Income 1245 1536 1908Total Income 1245 1536 1908Total Income 1245 1536 1908
Salaries/Wages 279 366 524Salaries/Wages 279 366 524
Depreciation 33 37 38Depreciation 33 37 38Depreciation 33 37 38
Other operating expenses 160 174 197Other operating expenses 160 174 197Other operating expenses 160 174 197
Pre Provision Profits 774 958 1149Pre Provision Profits 774 958 1149Pre Provision Profits 774 958 1149
Loan loss provisions 56 150 130Loan loss provisions 56 150 130Loan loss provisions 56 150 130
Investment provisions 42 -39 41Investment provisions 42 -39 41Investment provisions 42 -39 41
Other provisions 44 55 44Other provisions 44 55 44Other provisions 44 55 44
Provisions 142 167 215Provisions 142 167 215Provisions 142 167 215
Net Profit before tax 632 792 934Net Profit before tax 632 792 934Net Profit before tax 632 792 934
Income tax 222 279 319Income tax 222 279 319Income tax 222 279 319
Net Profit After Tax 410 513 615Net Profit After Tax 410 513 615Net Profit After Tax 410 513 615
AppropriationsAppropriations
Transfer to Statutory Reserve 102 129 154
Appropriations
Transfer to Statutory Reserve 102 129 154Transfer to Statutory Reserve 102 129 154
Transfer to Other Reserves 212 259 314Transfer to Other Reserves 212 259 314Transfer to Other Reserves 212 259 314
Equity Dividend 82 107 126Equity Dividend 82 107 126Equity Dividend 82 107 126
Dividend Tax 14 18 21Dividend Tax 14 18 21Dividend Tax 14 18 21
Source: Perception ResearchSource: Perception ResearchSource: Perception Research
FY12A FY13A FY14E FY15E FY16EFY12A FY13A FY14E FY15E FY16EFY12A FY13A FY14E FY15E FY16E
3394 4318 5763 6830 80593394 4318 5763 6830 80593394 4318 5763 6830 8059
1403 1723 1893 2143 24261403 1723 1893 2143 2426
39 97 95 96 9739 97 95 96 9739 97 95 96 97
0 0 0 0 00 0 0 0 00 0 0 0 0
4836 6137 7751 9069 105834836 6137 7751 9069 105834836 6137 7751 9069 10583
2902 3741 4863 5666 65152902 3741 4863 5666 65152902 3741 4863 5666 6515
41 26 31 34 3641 26 31 34 3641 26 31 34 36
54 54 54 54 5454 54 54 54 5454 54 54 54 54
2997 3821 4948 5753 66052997 3821 4948 5753 66052997 3821 4948 5753 6605
1838 2316 2803 3315 39781838 2316 2803 3315 39781838 2316 2803 3315 3978
334 484 526 571 621334 484 526 571 621334 484 526 571 621
2172 2800 3329 3886 45992172 2800 3329 3886 45992172 2800 3329 3886 4599
521 652 731 818 916521 652 731 818 916
44 50 50 54 5944 50 50 54 5944 50 50 54 59
237 287 301 315 330237 287 301 315 330237 287 301 315 330
1370 1811 2247 2699 32941370 1811 2247 2699 32941370 1811 2247 2699 3294
90 158 217 260 30890 158 217 260 30890 158 217 260 308
12 15 16 19 2112 15 16 19 2112 15 16 19 21
67 111 144 187 24467 111 144 187 24467 111 144 187 244
169 284 377 466 572169 284 377 466 572169 284 377 466 572
1201 1527 1870 2233 27221201 1527 1870 2233 27221201 1527 1870 2233 2722
398 471 617 737 898398 471 617 737 898398 471 617 737 898
803 1055 1253 1496 1823803 1055 1253 1496 1823803 1055 1253 1496 1823
201 264 313 374 456201 264 313 374 456201 264 313 374 456
414 508 601 718 875414 508 601 718 875414 508 601 718 875
162 242 288 344 419162 242 288 344 419162 242 288 344 419
26 41 50 60 7326 41 50 60 7326 41 50 60 73
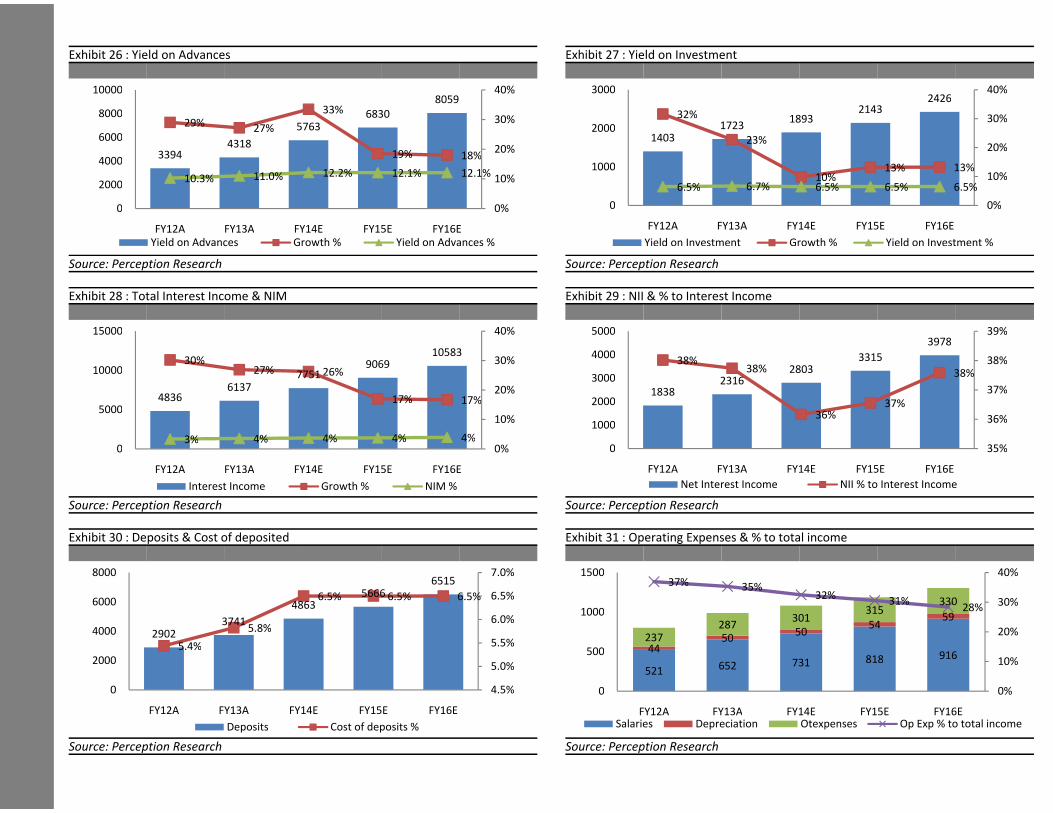
Exhibit 26 : Yield on AdvancesExhibit 26 : Yield on AdvancesExhibit 26 : Yield on Advances
40%100008059
40%10000
6830
805933%8000 6830
29%33%
30%8000
57636830
29%27%
30%8000
576329%27%
30%
60004318 20%
6000
33944318
19% 18%20%
40003394 19% 18%
20%4000
10.3% 11.0% 12.2% 12.1% 12.1%10%
4000
10.3% 11.0% 12.2% 12.1% 12.1%10%
200010.3% 11.0% 10%
2000
0%0
2000
0%0 0%0
FY12A FY13A FY14E FY15E FY16EFY12A FY13A FY14E FY15E FY16E
Yield on Advances Growth % Yield on Advances %Yield on Advances Growth % Yield on Advances %
Source: Perception Research
Yield on Advances Growth % Yield on Advances %
Source: Perception ResearchSource: Perception Research
Exhibit 28 : Total Interest Income & NIMExhibit 28 : Total Interest Income & NIMExhibit 28 : Total Interest Income & NIM
40%15000 40%15000
105839069
1058330% 30%
7751906930%
27% 26%30%
10000 77519069
27% 26%10000
61377751 26%
20%4836
613717% 17%
20%4836 17% 17%
500017% 17%
10%5000
10%5000
3% 4% 4% 4% 4%
10%
3% 4% 4% 4% 4%0%0
3% 4% 4% 4% 4%0%0 0%0
FY12A FY13A FY14E FY15E FY16EFY12A FY13A FY14E FY15E FY16EFY12A FY13A FY14E FY15E FY16E
Interest Income Growth % NIM %Interest Income Growth % NIM %
Source: Perception Research
Interest Income Growth % NIM %
Source: Perception ResearchSource: Perception Research
Exhibit 30 : Deposits & Cost of depositedExhibit 30 : Deposits & Cost of deposited
7.0%80006515
7.0%80006515
7.0%8000
56666515
6.5% 6.5% 6.5% 6.5%4863
56666.5% 6.5% 6.5% 6.5%6000 4863
6.5% 6.5% 6.5% 6.5%6000
3741
4863
5.8%6.0%
29023741
5.8%6.0%
4000 29025.4%
5.8%
5.5%4000 2902
5.4% 5.5%5.4% 5.5%
20005.0%
20005.0%
4.5%0 4.5%0 4.5%0
FY12A FY13A FY14E FY15E FY16EFY12A FY13A FY14E FY15E FY16EFY12A FY13A FY14E FY15E FY16E
Deposits Cost of deposits %Deposits Cost of deposits %
Source: Perception Research
Deposits Cost of deposits %
Source: Perception ResearchSource: Perception Research
Exhibit 27 : Yield on InvestmentExhibit 27 : Yield on InvestmentExhibit 27 : Yield on Investment
40%30002426
40%3000
21432426
32% 1893214332% 30%
1723189332% 30%
20001403
1723
23%2000
1403 23%20%
23%20%
13% 13%
20%
100010%
13% 13%10%
100010%
13% 13%
6.5% 6.7% 6.5% 6.5% 6.5%10%
100010%
6.5% 6.7% 6.5% 6.5% 6.5%10%
6.5% 6.7% 6.5% 6.5% 6.5%
0%0 0%0 0%0
FY12A FY13A FY14E FY15E FY16EFY12A FY13A FY14E FY15E FY16EFY12A FY13A FY14E FY15E FY16E
Yield on Investment Growth % Yield on Investment %Yield on Investment Growth % Yield on Investment %
Source: Perception ResearchSource: Perception ResearchSource: Perception Research
Exhibit 29 : NII & % to Interest IncomeExhibit 29 : NII & % to Interest IncomeExhibit 29 : NII & % to Interest Income
39%50003978
39%5000
3315
39784000 331538% 38%4000
2803331538%
38% 38%38%
4000
2316280338% 38%3000
18382316
38%
37%3000
18382316
37%
37%2000
183837%2000
36%37%
36%
2000
36% 36%1000
36%1000
35%0 35%0 35%0
FY12A FY13A FY14E FY15E FY16EFY12A FY13A FY14E FY15E FY16EFY12A FY13A FY14E FY15E FY16E
Net Interest Income NII % to Interest IncomeNet Interest Income NII % to Interest Income
Source: Perception Research
Net Interest Income NII % to Interest Income
Source: Perception ResearchSource: Perception Research
Exhibit 31 : Operating Expenses & % to total incomeExhibit 31 : Operating Expenses & % to total income
40%1500 40%150037% 35%
40%150037% 35%
32%330
35%32%
31%28%
30%
59301315
33031%28%
30%1000
5459
287301
315 28%1000
5054
59
237287
301
20%50
5054
237287
20%
91644
50237
500
652 731 818 91644
10%500
521 652 731 818 91610%
500
521 652 731 10%521
0%0 0%0 0%0
FY12A FY13A FY14E FY15E FY16EFY12A FY13A FY14E FY15E FY16EFY12A FY13A FY14E FY15E FY16ESalaries Depreciation Otexpenses Op Exp % to total incomeSalaries Depreciation Otexpenses Op Exp % to total income
Source: Perception ResearchSource: Perception ResearchSource: Perception Research
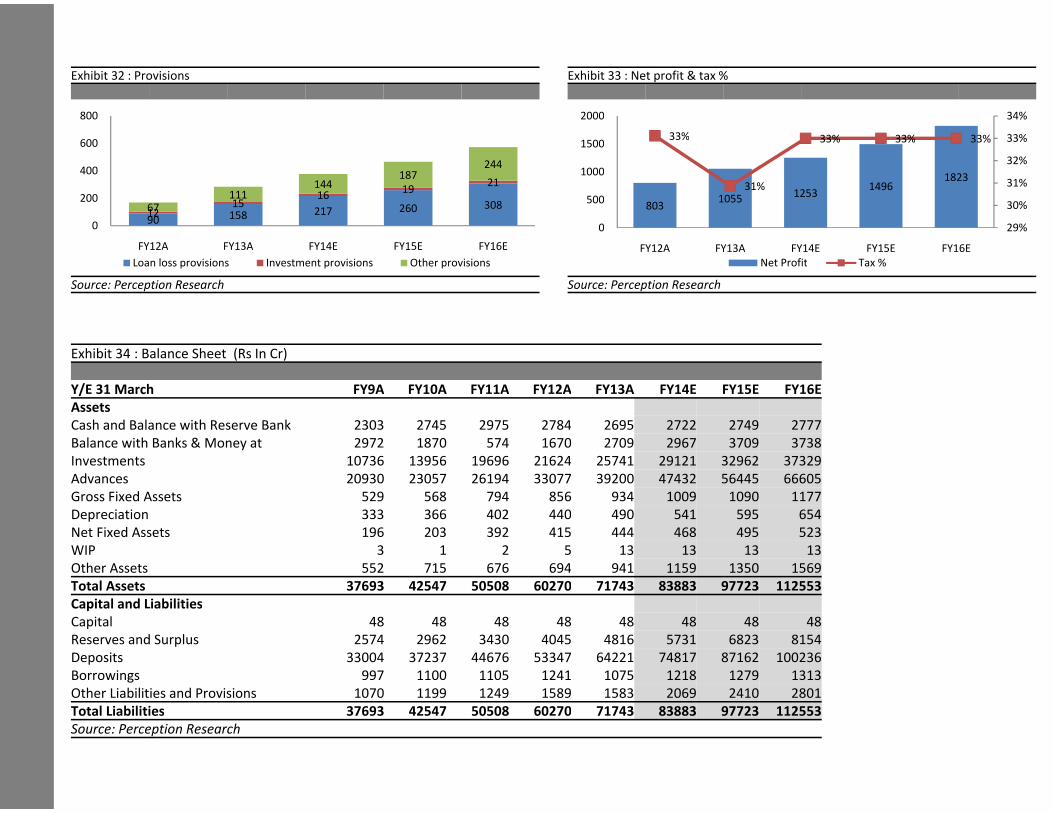
Exhibit 32 : ProvisionsExhibit 32 : ProvisionsExhibit 32 : Provisions
800800
600600
244400 187
244400
1921144
187400
1619
21111
144
200260 30815
1619
67111200
158 217 260 30812
1516
67111200
90 158 217 260 30812
1567
090 15812
00
FY12A FY13A FY14E FY15E FY16EFY12A FY13A FY14E FY15E FY16E
Loan loss provisions Investment provisions Other provisionsLoan loss provisions Investment provisions Other provisionsLoan loss provisions Investment provisions Other provisions
Source: Perception ResearchSource: Perception Research
Exhibit 34 : Balance Sheet (Rs In Cr)Exhibit 34 : Balance Sheet (Rs In Cr)Exhibit 34 : Balance Sheet (Rs In Cr)
Y/E 31 March FY9A FY10A FY11AY/E 31 March FY9A FY10A FY11AY/E 31 March FY9A FY10A FY11A
AssetsAssetsAssets
Cash and Balance with Reserve Bank 2303 2745 2975Cash and Balance with Reserve Bank 2303 2745 2975
Balance with Banks & Money at 2972 1870 574Balance with Banks & Money at 2972 1870 574Balance with Banks & Money at 2972 1870 574
Investments 10736 13956 19696Investments 10736 13956 19696Investments 10736 13956 19696
Advances 20930 23057 26194Advances 20930 23057 26194Advances 20930 23057 26194
Gross Fixed Assets 529 568 794Gross Fixed Assets 529 568 794Gross Fixed Assets 529 568 794
Depreciation 333 366 402Depreciation 333 366 402Depreciation 333 366 402
Net Fixed Assets 196 203 392Net Fixed Assets 196 203 392Net Fixed Assets 196 203 392
WIP 3 1 2WIP 3 1 2WIP 3 1 2
Other Assets 552 715 676Other Assets 552 715 676Other Assets 552 715 676
Total Assets 37693 42547 50508Total Assets 37693 42547 50508Total Assets 37693 42547 50508
Capital and LiabilitiesCapital and LiabilitiesCapital and Liabilities
Capital 48 48 48Capital 48 48 48
Reserves and Surplus 2574 2962 3430
Capital 48 48 48
Reserves and Surplus 2574 2962 3430Reserves and Surplus 2574 2962 3430
Deposits 33004 37237 44676Deposits 33004 37237 44676Deposits 33004 37237 44676
Borrowings 997 1100 1105Borrowings 997 1100 1105Borrowings 997 1100 1105
Other Liabilities and Provisions 1070 1199 1249Other Liabilities and Provisions 1070 1199 1249Other Liabilities and Provisions 1070 1199 1249
Total Liabilities 37693 42547 50508Total Liabilities 37693 42547 50508Total Liabilities 37693 42547 50508
Source: Perception ResearchSource: Perception ResearchSource: Perception Research
Exhibit 33 : Net profit & tax %Exhibit 33 : Net profit & tax %Exhibit 33 : Net profit & tax %
34%2000 34%2000
33% 33% 33% 33% 33%33% 33% 33% 33% 33%1500 33% 33% 33%
32%
33%1500
32%
1823
32%1000
14961823
31% 31%1000
10551253
14961823
31% 31%
8031055
1253149631%
30%500
8031055
30%500
803 30%
29%0 29%0
FY12A FY13A FY14E FY15E FY16EFY12A FY13A FY14E FY15E FY16E
Net Profit Tax %Net Profit Tax %Net Profit Tax %
Source: Perception ResearchSource: Perception Research
FY12A FY13A FY14E FY15E FY16EFY12A FY13A FY14E FY15E FY16EFY12A FY13A FY14E FY15E FY16E
2784 2695 2722 2749 27772784 2695 2722 2749 2777
1670 2709 2967 3709 37381670 2709 2967 3709 37381670 2709 2967 3709 3738
21624 25741 29121 32962 3732921624 25741 29121 32962 3732921624 25741 29121 32962 37329
33077 39200 47432 56445 6660533077 39200 47432 56445 6660533077 39200 47432 56445 66605
856 934 1009 1090 1177856 934 1009 1090 1177856 934 1009 1090 1177
440 490 541 595 654440 490 541 595 654440 490 541 595 654
415 444 468 495 523415 444 468 495 523415 444 468 495 523
5 13 13 13 135 13 13 13 135 13 13 13 13
694 941 1159 1350 1569694 941 1159 1350 1569694 941 1159 1350 1569
60270 71743 83883 97723 11255360270 71743 83883 97723 11255360270 71743 83883 97723 112553
48 48 48 48 4848 48 48 48 48
4045 4816 5731 6823 8154
48 48 48 48 48
4045 4816 5731 6823 81544045 4816 5731 6823 8154
53347 64221 74817 87162 10023653347 64221 74817 87162 10023653347 64221 74817 87162 100236
1241 1075 1218 1279 13131241 1075 1218 1279 13131241 1075 1218 1279 1313
1589 1583 2069 2410 28011589 1583 2069 2410 28011589 1583 2069 2410 2801
60270 71743 83883 97723 11255360270 71743 83883 97723 11255360270 71743 83883 97723 112553
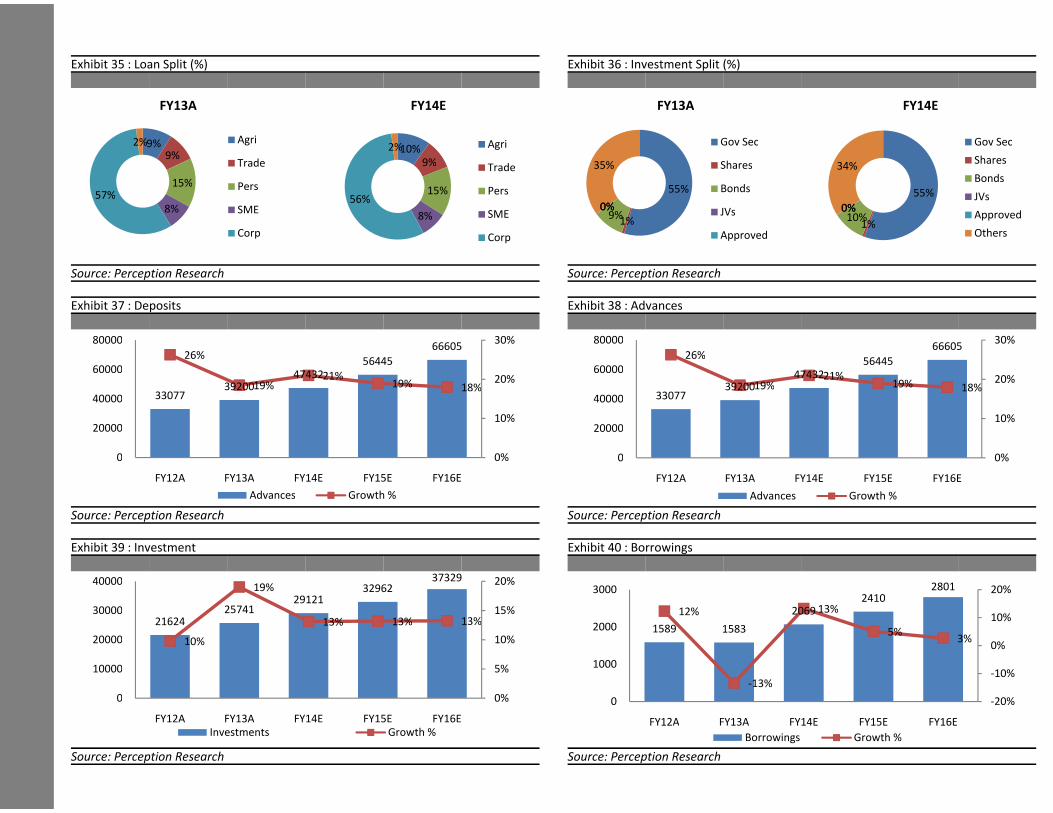
Exhibit 35 : Loan Split (%)Exhibit 35 : Loan Split (%)Exhibit 35 : Loan Split (%)
FY13A FY14EFY13A FY14EFY13A FY14E
2% Agri9%2% Agri10%2% Agri9%
9%
2% Agri10%2% Agri
9%Trade
10%
9% TradeTrade 9% Trade
15% Pers
Trade
15%57%
Pers 15% Pers57%Pers 15%
56%Pers
8%
57%
SME8%
56%
SME8% SME8% SME
Corp
8% SME
Corp CorpCorp Corp
Source: Perception ResearchSource: Perception ResearchSource: Perception Research
Exhibit 37 : DepositsExhibit 37 : DepositsExhibit 37 : Deposits
6660530%80000
6660526%
30%80000
56445
6660526%
4743256445
26%
21%60000 47432
19%21%
19% 20%60000
3920047432
19%21%
19% 18%20%
330773920019% 19% 18%
40000 3307740000
10%10%20000
10%2000020000
0%0 0%0 0%0
FY12A FY13A FY14E FY15E FY16EFY12A FY13A FY14E FY15E FY16EFY12A FY13A FY14E FY15E FY16E
Advances Growth %Advances Growth %
Source: Perception Research
Advances Growth %
Source: Perception ResearchSource: Perception Research
Exhibit 39 : InvestmentExhibit 39 : Investment
37329 20%4000032962
3732919%
20%40000
2912132962
3732919%
20%40000
2574129121
3296219%
2574129121
15%3000021624
2574113% 13% 13%
15%3000021624 13% 13% 13%
10% 10%20000 10% 10%20000
5%10000 5%10000
0%0 0%0
FY12A FY13A FY14E FY15E FY16EFY12A FY13A FY14E FY15E FY16EFY12A FY13A FY14E FY15E FY16E
Investments Growth %Investments Growth %
Source: Perception ResearchSource: Perception ResearchSource: Perception Research
Exhibit 36 : Investment Split (%)Exhibit 36 : Investment Split (%)Exhibit 36 : Investment Split (%)
FY13A FY14EFY13A FY14EFY13A FY14E
Gov Sec Gov SecGov Sec Gov SecGov Sec Gov Sec
Shares35% Shares 34%Shares35% Shares 34%Shares
Bonds55% Bonds
34%Bonds
55% Bonds 55%
Bonds
JVs55%
0%0%
Bonds 55%
0%0%JVs
9%0%0% JVs
10%0%0%
JVs
Approved1%
9%0%0% JVs
1%10%
0%0%Approved
1%9%
Approved1%
10% Approved
OthersApproved1%
OthersApproved Others
Source: Perception ResearchSource: Perception ResearchSource: Perception Research
Exhibit 38 : AdvancesExhibit 38 : AdvancesExhibit 38 : Advances
6660530%80000
6660526%
30%80000
56445
6660526%
4743256445
26%
21%60000 47432
19%21%
19% 20%60000
3920047432
19%21%
19% 18%20%
330773920019% 19% 18%
40000 3307740000
10%10%20000
10%2000020000
0%0 0%0 0%0
FY12A FY13A FY14E FY15E FY16EFY12A FY13A FY14E FY15E FY16EFY12A FY13A FY14E FY15E FY16E
Advances Growth %Advances Growth %
Source: Perception Research
Advances Growth %
Source: Perception ResearchSource: Perception Research
Exhibit 40 : BorrowingsExhibit 40 : Borrowings
2801 20%30002410
2801 20%30002410
2801
13%
20%3000
20692410
12% 13%10%
206912% 13%10%
2000 1589 1583 5%
10%2000 1589 1583 5%
3%0%
20003%
0%0%
1000-10%
1000
-13%-10%
1000
-13%-10%
-13%
-20%0 -20%0 -20%0
FY12A FY13A FY14E FY15E FY16EFY12A FY13A FY14E FY15E FY16E
Borrowings Growth %Borrowings Growth %
Source: Perception Research
Borrowings Growth %
Source: Perception ResearchSource: Perception Research
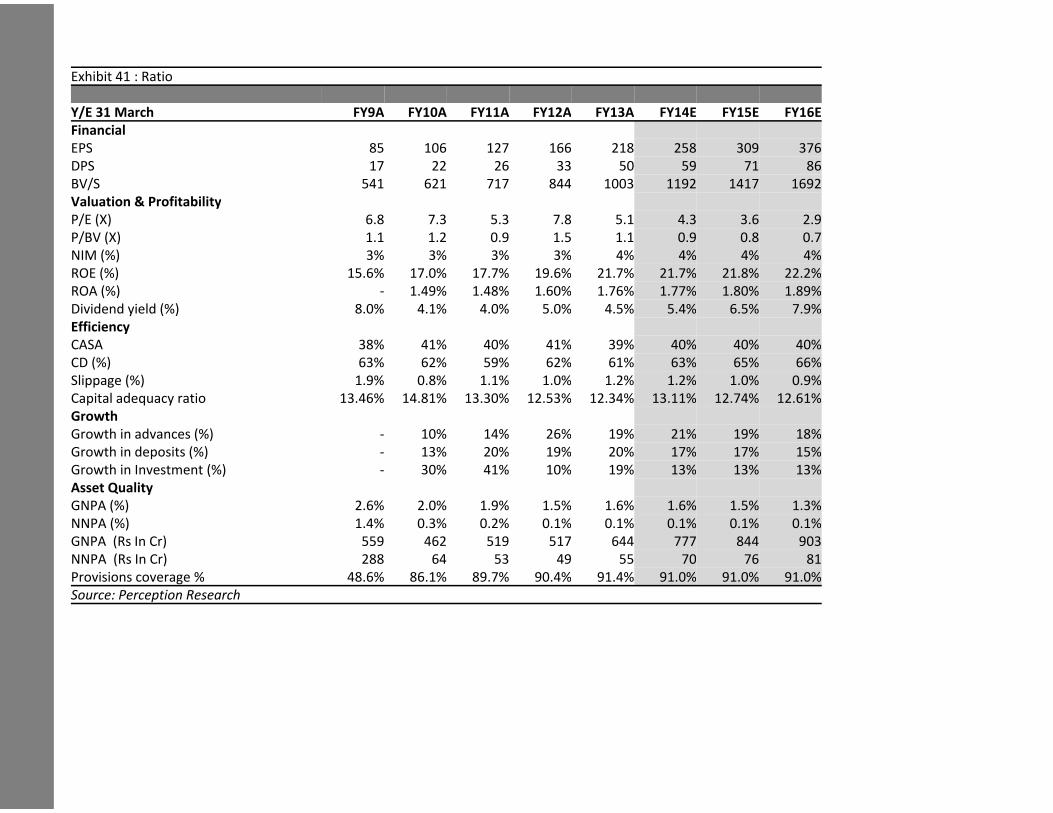
Exhibit 41 : Ratio Exhibit 41 : Ratio Exhibit 41 : Ratio
Y/E 31 March FY9A FY10A FY11AY/E 31 March FY9A FY10A FY11AY/E 31 March FY9A FY10A FY11A
FinancialFinancialFinancial
EPS 85 106 127EPS 85 106 127EPS 85 106 127
DPS 17 22 26DPS 17 22 26DPS 17 22 26
BV/S 541 621 717BV/S 541 621 717BV/S 541 621 717
Valuation & ProfitabilityValuation & Profitability
P/E (X) 6.8 7.3 5.3
Valuation & Profitability
P/E (X) 6.8 7.3 5.3P/E (X) 6.8 7.3 5.3
P/BV (X) 1.1 1.2 0.9P/BV (X) 1.1 1.2 0.9P/BV (X) 1.1 1.2 0.9
NIM (%) 3% 3% 3%NIM (%) 3% 3% 3%NIM (%) 3% 3% 3%
ROE (%) 15.6% 17.0% 17.7%ROE (%) 15.6% 17.0% 17.7%ROE (%) 15.6% 17.0% 17.7%
ROA (%) - 1.49% 1.48%ROA (%) - 1.49% 1.48%ROA (%) - 1.49% 1.48%
Dividend yield (%) 8.0% 4.1% 4.0%Dividend yield (%) 8.0% 4.1% 4.0%Dividend yield (%) 8.0% 4.1% 4.0%
EfficiencyEfficiencyEfficiency
CASA 38% 41% 40%CASA 38% 41% 40%CASA 38% 41% 40%
CD (%) 63% 62% 59%CD (%) 63% 62% 59%CD (%) 63% 62% 59%
Slippage (%) 1.9% 0.8% 1.1%Slippage (%) 1.9% 0.8% 1.1%Slippage (%) 1.9% 0.8% 1.1%
Capital adequacy ratio 13.46% 14.81% 13.30%Capital adequacy ratio 13.46% 14.81% 13.30%Capital adequacy ratio 13.46% 14.81% 13.30%
GrowthGrowth
Growth in advances (%) - 10% 14%Growth in advances (%) - 10% 14%Growth in advances (%) - 10% 14%
Growth in deposits (%) - 13% 20%Growth in deposits (%) - 13% 20%Growth in deposits (%) - 13% 20%
Growth in Investment (%) - 30% 41%Growth in Investment (%) - 30% 41%Growth in Investment (%) - 30% 41%
Asset QualityAsset QualityAsset Quality
GNPA (%) 2.6% 2.0% 1.9%GNPA (%) 2.6% 2.0% 1.9%GNPA (%) 2.6% 2.0% 1.9%
NNPA (%) 1.4% 0.3% 0.2%NNPA (%) 1.4% 0.3% 0.2%NNPA (%) 1.4% 0.3% 0.2%
GNPA (Rs In Cr) 559 462 519GNPA (Rs In Cr) 559 462 519GNPA (Rs In Cr) 559 462 519
NNPA (Rs In Cr) 288 64 53NNPA (Rs In Cr) 288 64 53NNPA (Rs In Cr) 288 64 53
Provisions coverage % 48.6% 86.1% 89.7%Provisions coverage % 48.6% 86.1% 89.7%Provisions coverage % 48.6% 86.1% 89.7%
Source: Perception ResearchSource: Perception ResearchSource: Perception Research
FY12A FY13A FY14E FY15E FY16EFY12A FY13A FY14E FY15E FY16EFY12A FY13A FY14E FY15E FY16E
166 218 258 309 376166 218 258 309 376166 218 258 309 376
33 50 59 71 8633 50 59 71 8633 50 59 71 86
844 1003 1192 1417 1692844 1003 1192 1417 1692844 1003 1192 1417 1692
7.8 5.1 4.3 3.6 2.97.8 5.1 4.3 3.6 2.97.8 5.1 4.3 3.6 2.9
1.5 1.1 0.9 0.8 0.71.5 1.1 0.9 0.8 0.71.5 1.1 0.9 0.8 0.7
3% 4% 4% 4% 4%3% 4% 4% 4% 4%3% 4% 4% 4% 4%
19.6% 21.7% 21.7% 21.8% 22.2%19.6% 21.7% 21.7% 21.8% 22.2%19.6% 21.7% 21.7% 21.8% 22.2%
1.60% 1.76% 1.77% 1.80% 1.89%1.60% 1.76% 1.77% 1.80% 1.89%1.60% 1.76% 1.77% 1.80% 1.89%
5.0% 4.5% 5.4% 6.5% 7.9%5.0% 4.5% 5.4% 6.5% 7.9%5.0% 4.5% 5.4% 6.5% 7.9%
41% 39% 40% 40% 40%41% 39% 40% 40% 40%41% 39% 40% 40% 40%
62% 61% 63% 65% 66%62% 61% 63% 65% 66%62% 61% 63% 65% 66%
1.0% 1.2% 1.2% 1.0% 0.9%1.0% 1.2% 1.2% 1.0% 0.9%1.0% 1.2% 1.2% 1.0% 0.9%
12.53% 12.34% 13.11% 12.74% 12.61%12.53% 12.34% 13.11% 12.74% 12.61%12.53% 12.34% 13.11% 12.74% 12.61%
26% 19% 21% 19% 18%26% 19% 21% 19% 18%26% 19% 21% 19% 18%
19% 20% 17% 17% 15%19% 20% 17% 17% 15%19% 20% 17% 17% 15%
10% 19% 13% 13% 13%10% 19% 13% 13% 13%10% 19% 13% 13% 13%
1.5% 1.6% 1.6% 1.5% 1.3%1.5% 1.6% 1.6% 1.5% 1.3%1.5% 1.6% 1.6% 1.5% 1.3%
0.1% 0.1% 0.1% 0.1% 0.1%0.1% 0.1% 0.1% 0.1% 0.1%0.1% 0.1% 0.1% 0.1% 0.1%
517 644 777 844 903517 644 777 844 903517 644 777 844 903
49 55 70 76 8149 55 70 76 8149 55 70 76 81
90.4% 91.4% 91.0% 91.0% 91.0%90.4% 91.4% 91.0% 91.0% 91.0%90.4% 91.4% 91.0% 91.0% 91.0%
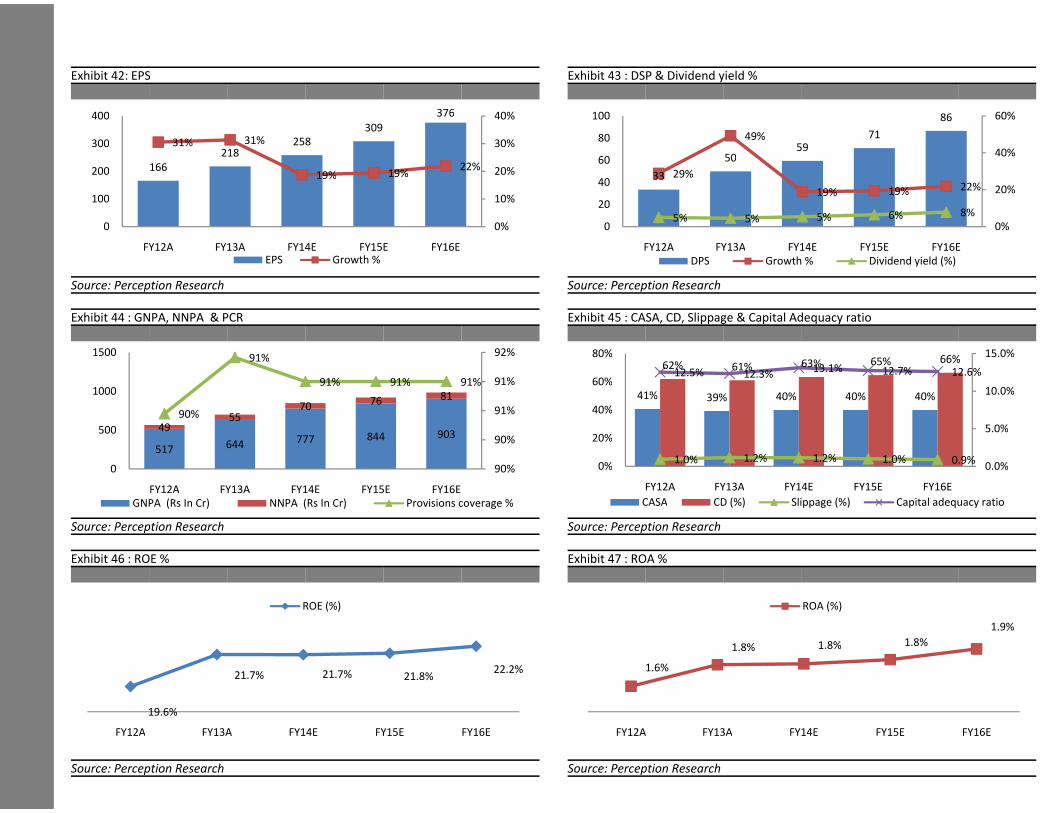
Exhibit 42: EPSExhibit 42: EPSExhibit 42: EPS
376376 40%400309
376 40%400
258
309
31% 31% 25831% 31% 30%300218
25831% 31% 30%300
166
218
22%16619% 19%
22% 20%200 16619% 19%
22% 20%200 19%
10%100 10%100 10%100
0%0 0%0 0%0
FY12A FY13A FY14E FY15E FY16EFY12A FY13A FY14E FY15E FY16EEPS Growth %EPS Growth %EPS Growth %
Source: Perception ResearchSource: Perception Research
Exhibit 44 : GNPA, NNPA & PCRExhibit 44 : GNPA, NNPA & PCRExhibit 44 : GNPA, NNPA & PCR
92%150091%
92%150091%
91% 91% 91% 91%91% 91% 91% 91%1000
76 81
91% 91% 91% 91%1000
7076 81
91%
1000
5570
7690% 91%
495590% 91%
500777 844 903
4990%
500
517 644 777 844 90349
90%500
517 644 777 90%517
90%0 90%0 90%0
FY12A FY13A FY14E FY15E FY16EFY12A FY13A FY14E FY15E FY16E
GNPA (Rs In Cr) NNPA (Rs In Cr) Provisions coverage %GNPA (Rs In Cr) NNPA (Rs In Cr) Provisions coverage %
Source: Perception Research
GNPA (Rs In Cr) NNPA (Rs In Cr) Provisions coverage %
Source: Perception ResearchSource: Perception Research
Exhibit 46 : ROE %Exhibit 46 : ROE %Exhibit 46 : ROE %
ROE (%)ROE (%)ROE (%)
21.7% 21.7% 22.2%21.7% 21.7% 21.8%
22.2%21.7% 21.7% 21.8%
19.6%19.6%19.6%
FY12A FY13A FY14E FY15E FY16EFY12A FY13A FY14E FY15E FY16E
Source: Perception ResearchSource: Perception ResearchSource: Perception Research
Exhibit 43 : DSP & Dividend yield %Exhibit 43 : DSP & Dividend yield %Exhibit 43 : DSP & Dividend yield %
86 60%100 86 60%100
7149%8059
7149%80
5059 40%
60
80
5059 40%
60
33
50
29%
60
33 29%22% 20%
4033
19% 19% 22% 20%40
19% 19% 22% 20%
205% 6% 8%
20
5% 5% 5% 6% 8%
0%0
20
5% 5% 5% 6% 8%
0%0 0%0
FY12A FY13A FY14E FY15E FY16EFY12A FY13A FY14E FY15E FY16E
DPS Growth % Dividend yield (%)DPS Growth % Dividend yield (%)DPS Growth % Dividend yield (%)
Source: Perception ResearchSource: Perception Research
Exhibit 45 : CASA, CD, Slippage & Capital Adequacy ratioExhibit 45 : CASA, CD, Slippage & Capital Adequacy ratioExhibit 45 : CASA, CD, Slippage & Capital Adequacy ratio
15.0%80%62% 61% 63% 65% 66%
15.0%80%62% 61% 63% 65% 66%
12.5% 12.3%13.1% 12.7% 12.6%
15.0%80%62% 61% 63%
12.5% 12.3%13.1% 12.7% 12.6%
60%12.5% 12.3% 12.6%
10.0%60%
41% 39% 40% 40% 40%10.0%
60%
41% 39% 40% 40% 40%10.0%
40%40%
5.0%
40%
5.0%20%
5.0%20%
1.0% 1.2% 1.2% 1.0% 0.9%
20%
1.0% 1.2% 1.2% 1.0% 0.9%0.0%0%
1.0% 1.2% 1.2% 1.0% 0.9%0.0%0% 0.0%0%
FY12A FY13A FY14E FY15E FY16EFY12A FY13A FY14E FY15E FY16EFY12A FY13A FY14E FY15E FY16E
CASA CD (%) Slippage (%) Capital adequacy ratioCASA CD (%) Slippage (%) Capital adequacy ratio
Source: Perception Research
CASA CD (%) Slippage (%) Capital adequacy ratio
Source: Perception ResearchSource: Perception Research
Exhibit 47 : ROA %Exhibit 47 : ROA %Exhibit 47 : ROA %
ROA (%)ROA (%)
1.9%
ROA (%)
1.9%
1.8% 1.8%
1.9%
1.8% 1.8% 1.8%1.8% 1.8% 1.8%
1.6%1.6%
FY12A FY13A FY14E FY15E FY16EFY12A FY13A FY14E FY15E FY16E
Source: Perception ResearchSource: Perception ResearchSource: Perception Research

� Quarterly performance Q1 FY14� Quarterly performance Q1 FY14� Quarterly performance Q1 FY14
Exhibit 48: Quarterly Financials Performance (Rs In Cr)Exhibit 48: Quarterly Financials Performance (Rs In Cr)Exhibit 48: Quarterly Financials Performance (Rs In Cr)
Profit & Loss Account Q1FY13 Q4FY14 Q1FY14 % QOQProfit & Loss Account Q1FY13 Q4FY14 Q1FY14 % QOQProfit & Loss Account Q1FY13 Q4FY14 Q1FY14 % QOQ
Interest Earned 1476 1627 1624 -0.2%Interest Earned 1476 1627 1624 -0.2%Interest Earned 1476 1627 1624 -0.2%
Interest Expended 941 993 969 -2.4%Interest Expended 941 993 969 -2.4%Interest Expended 941 993 969 -2.4%
Net Interest Income 536 634 655 3.4%Net Interest Income 536 634 655 3.4%Net Interest Income 536 634 655 3.4%
Other Income 93 209 92 -55.9%Other Income 93 209 92 -55.9%Other Income 93 209 92 -55.9%
Operating Income 629 842 747 -11.3%Operating Income 629 842 747 -11.3%Operating Income 629 842 747 -11.3%
Operating Expenses 214 304 266 -12.5%Operating Expenses 214 304 266 -12.5%Operating Expenses 214 304 266 -12.5%
Operating Profit 415 538 481 -10.6%Operating Profit 415 538 481 -10.6%Operating Profit 415 538 481 -10.6%
Provisions & Contingencies 50 179 36 -79.7%Provisions & Contingencies 50 179 36 -79.7%Provisions & Contingencies 50 179 36 -79.7%
PBT 365 360 445 23.7%PBT 365 360 445 23.7%PBT 365 360 445 23.7%
Tax Provision 119 109 137 25.0%Tax Provision 119 109 137 25.0%Tax Provision 119 109 137 25.0%
Net Profit 246 250 308 23.1%Net Profit 246 250 308 23.1%Net Profit 246 250 308 23.1%
Share Capital 48 48 48 0.0%Share Capital 48 48 48 0.0%Share Capital 48 48 48 0.0%
EPS in Rs. 51 52 64 23.1%EPS in Rs. 51 52 64 23.1%EPS in Rs. 51 52 64 23.1%
Balance Sheet Q1FY13 Q4FY14 Q1FY14 % QOQBalance Sheet Q1FY13 Q4FY14 Q1FY14 % QOQBalance Sheet Q1FY13 Q4FY14 Q1FY14 % QOQ
Capital & Liabilities Capital & Liabilities Capital & Liabilities
Capital 48 - 48Capital 48 - 48Capital 48 - 48
Reserves & Surplus 4291 - 5124Reserves & Surplus 4291 - 5124Reserves & Surplus 4291 - 5124
Deposits 53117 - 58601Deposits 53117 - 58601Deposits 53117 - 58601
Borrowings 1168 - 758Borrowings 1168 - 758Borrowings 1168 - 758
Other Liabilities & Provisions 1367 - 1216Other Liabilities & Provisions 1367 - 1216Other Liabilities & Provisions 1367 - 1216
Total 59992 - 65747Total 59992 - 65747Total 59992 - 65747
Assets Assets Assets
Cash & Bank Balance 2357 - 2871Cash & Bank Balance 2357 - 2871Cash & Bank Balance 2357 - 2871
Balance with Banks 1037 - 372Balance with Banks 1037 - 372Balance with Banks 1037 - 372
Investments 22016 - 21734Investments 22016 - 21734Investments 22016 - 21734
Advances 33225 - 39282Advances 33225 - 39282Advances 33225 - 39282
Fixed Assets 424 - 475Fixed Assets 424 - 475Fixed Assets 424 - 475
Other Assets 933 - 1013Other Assets 933 - 1013Other Assets 933 - 1013
Total 59992 - 65747Total 59992 - 65747Total 59992 - 65747
Source: Perception ResearchSource: Perception ResearchSource: Perception Research
% QOQ % SPLY FY12A FY13A % YOY% QOQ % SPLY FY12A FY13A % YOY% QOQ % SPLY FY12A FY13A % YOY
0.2% 10.0% 4836 6137 26.9%0.2% 10.0% 4836 6137 26.9%0.2% 10.0% 4836 6137 26.9%
2.4% 3.1% 2997 3821 27.5%2.4% 3.1% 2997 3821 27.5%2.4% 3.1% 2997 3821 27.5%
3.4% 22.3% 1838 2316 26.0%3.4% 22.3% 1838 2316 26.0%3.4% 22.3% 1838 2316 26.0%
55.9% -1.2% 334 484 44.8%55.9% -1.2% 334 484 44.8%55.9% -1.2% 334 484 44.8%
11.3% 18.8% 2172 2800 28.9%11.3% 18.8% 2172 2800 28.9%11.3% 18.8% 2172 2800 28.9%
12.5% 24.5% 802 989 23.3%12.5% 24.5% 802 989 23.3%12.5% 24.5% 802 989 23.3%
10.6% 15.9% 1370 1811 32.1%10.6% 15.9% 1370 1811 32.1%10.6% 15.9% 1370 1811 32.1%
79.7% -28.1% 169 284 67.9%79.7% -28.1% 169 284 67.9%79.7% -28.1% 169 284 67.9%
23.7% 21.9% 1201 1527 27.1%23.7% 21.9% 1201 1527 27.1%23.7% 21.9% 1201 1527 27.1%
25.0% 15.3% 398 471 18.5%25.0% 15.3% 398 471 18.5%25.0% 15.3% 398 471 18.5%
23.1% 25.1% 803 1055 31.4%23.1% 25.1% 803 1055 31.4%23.1% 25.1% 803 1055 31.4%
0.0% 0.0% 48 48 0.0%0.0% 0.0% 48 48 0.0%0.0% 0.0% 48 48 0.0%
23.1% 25.1% 166 218 31.4%23.1% 25.1% 166 218 31.4%23.1% 25.1% 166 218 31.4%
% QOQ % SPLY FY12A FY13A % YOY% QOQ % SPLY FY12A FY13A % YOY% QOQ % SPLY FY12A FY13A % YOY
- 0.0% 48 48 0.0%- 0.0% 48 48 0.0%- 0.0% 48 48 0.0%
- 19.4% 4045 4816 19.1%- 19.4% 4045 4816 19.1%- 19.4% 4045 4816 19.1%
- 10.3% 53347 64221 20.4%- 10.3% 53347 64221 20.4%- 10.3% 53347 64221 20.4%
- -35.2% 1241 1075 -13.4%- -35.2% 1241 1075 -13.4%- -35.2% 1241 1075 -13.4%
- -11.0% 1588 1583 -0.3%- -11.0% 1588 1583 -0.3%- -11.0% 1588 1583 -0.3%
- 9.6% 60269 71743 19.0%- 9.6% 60269 71743 19.0%- 9.6% 60269 71743 19.0%
- 21.8% 2784 2695 -3.2%- 21.8% 2784 2695 -3.2%- 21.8% 2784 2695 -3.2%
- -64.1% 1670 2709 62.2%- -64.1% 1670 2709 62.2%- -64.1% 1670 2709 62.2%
- -1.3% 21624 25741 19.0%- -1.3% 21624 25741 19.0%- -1.3% 21624 25741 19.0%
- 18.2% 33077 39200 18.5%- 18.2% 33077 39200 18.5%- 18.2% 33077 39200 18.5%
- 11.9% 420 456 8.5%- 11.9% 420 456 8.5%- 11.9% 420 456 8.5%
- 8.6% 693 941 35.8%- 8.6% 693 941 35.8%- 8.6% 693 941 35.8%
- 9.6% 60269 71743 19.0%- 9.6% 60269 71743 19.0%- 9.6% 60269 71743 19.0%
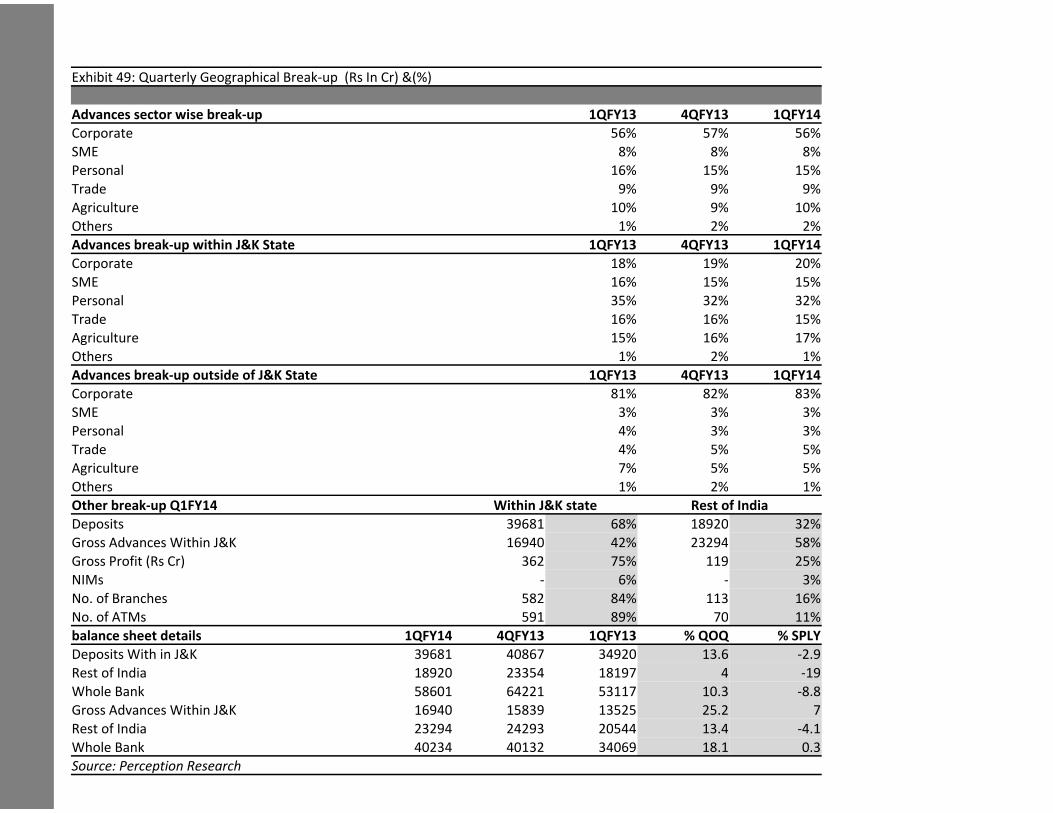
Exhibit 49: Quarterly Geographical Break-up (Rs In Cr) &(%)Exhibit 49: Quarterly Geographical Break-up (Rs In Cr) &(%)Exhibit 49: Quarterly Geographical Break-up (Rs In Cr) &(%)
Advances sector wise break-upAdvances sector wise break-upAdvances sector wise break-up
CorporateCorporateCorporate
SMESMESME
PersonalPersonalPersonal
TradeTradeTrade
AgricultureAgricultureAgriculture
OthersOthersOthers
Advances break-up within J&K StateAdvances break-up within J&K StateAdvances break-up within J&K State
CorporateCorporateCorporate
SMESMESME
PersonalPersonalPersonal
TradeTradeTrade
AgricultureAgricultureAgriculture
OthersOthersOthers
Advances break-up outside of J&K StateAdvances break-up outside of J&K StateAdvances break-up outside of J&K State
CorporateCorporateCorporate
SMESMESME
PersonalPersonalPersonal
TradeTradeTrade
AgricultureAgricultureAgriculture
OthersOthersOthers
Other break-up Q1FY14 Within J&K stateOther break-up Q1FY14 Within J&K stateOther break-up Q1FY14 Within J&K state
Deposits 39681Deposits 39681Deposits 39681
Gross Advances Within J&K 16940Gross Advances Within J&K 16940Gross Advances Within J&K 16940
Gross Profit (Rs Cr) 362Gross Profit (Rs Cr) 362Gross Profit (Rs Cr) 362
NIMsNIMsNIMs
No. of Branches 582No. of Branches 582No. of Branches 582
No. of ATMs 591No. of ATMs 591No. of ATMs 591
balance sheet details 1QFY14 4QFY13balance sheet details 1QFY14 4QFY13balance sheet details 1QFY14 4QFY13
Deposits With in J&K 39681 40867Deposits With in J&K 39681 40867Deposits With in J&K 39681 40867
Rest of India 18920 23354Rest of India 18920 23354Rest of India 18920 23354
Whole Bank 58601 64221Whole Bank 58601 64221Whole Bank 58601 64221
Gross Advances Within J&K 16940 15839Gross Advances Within J&K 16940 15839Gross Advances Within J&K 16940 15839
Rest of India 23294 24293Rest of India 23294 24293Rest of India 23294 24293
Whole Bank 40234 40132Whole Bank 40234 40132Whole Bank 40234 40132
Source: Perception ResearchSource: Perception ResearchSource: Perception Research
1QFY13 4QFY13 1QFY141QFY13 4QFY13 1QFY141QFY13 4QFY13 1QFY14
56% 57% 56%56% 57% 56%56% 57% 56%
8% 8% 8%8% 8% 8%8% 8% 8%
16% 15% 15%16% 15% 15%16% 15% 15%
9% 9% 9%9% 9% 9%9% 9% 9%
10% 9% 10%10% 9% 10%10% 9% 10%
1% 2% 2%1% 2% 2%1% 2% 2%
1QFY13 4QFY13 1QFY141QFY13 4QFY13 1QFY141QFY13 4QFY13 1QFY14
18% 19% 20%18% 19% 20%18% 19% 20%
16% 15% 15%16% 15% 15%16% 15% 15%
35% 32% 32%35% 32% 32%35% 32% 32%
16% 16% 15%16% 16% 15%16% 16% 15%
15% 16% 17%15% 16% 17%15% 16% 17%
1% 2% 1%1% 2% 1%1% 2% 1%
1QFY13 4QFY13 1QFY141QFY13 4QFY13 1QFY141QFY13 4QFY13 1QFY14
81% 82% 83%81% 82% 83%81% 82% 83%
3% 3% 3%3% 3% 3%3% 3% 3%
4% 3% 3%4% 3% 3%4% 3% 3%
4% 5% 5%4% 5% 5%4% 5% 5%
7% 5% 5%7% 5% 5%7% 5% 5%
1% 2% 1%1% 2% 1%1% 2% 1%
Within J&K state Rest of IndiaWithin J&K state Rest of IndiaWithin J&K state Rest of India
39681 68% 18920 32%39681 68% 18920 32%39681 68% 18920 32%
16940 42% 23294 58%16940 42% 23294 58%16940 42% 23294 58%
362 75% 119 25%362 75% 119 25%362 75% 119 25%
- 6% - 3%- 6% - 3%- 6% - 3%
582 84% 113 16%582 84% 113 16%582 84% 113 16%
591 89% 70 11%591 89% 70 11%591 89% 70 11%
4QFY13 1QFY13 % QOQ % SPLY4QFY13 1QFY13 % QOQ % SPLY4QFY13 1QFY13 % QOQ % SPLY
40867 34920 13.6 -2.940867 34920 13.6 -2.940867 34920 13.6 -2.9
23354 18197 4 -1923354 18197 4 -1923354 18197 4 -19
64221 53117 10.3 -8.864221 53117 10.3 -8.864221 53117 10.3 -8.8
15839 13525 25.2 715839 13525 25.2 715839 13525 25.2 7
24293 20544 13.4 -4.124293 20544 13.4 -4.124293 20544 13.4 -4.1
40132 34069 18.1 0.340132 34069 18.1 0.340132 34069 18.1 0.3
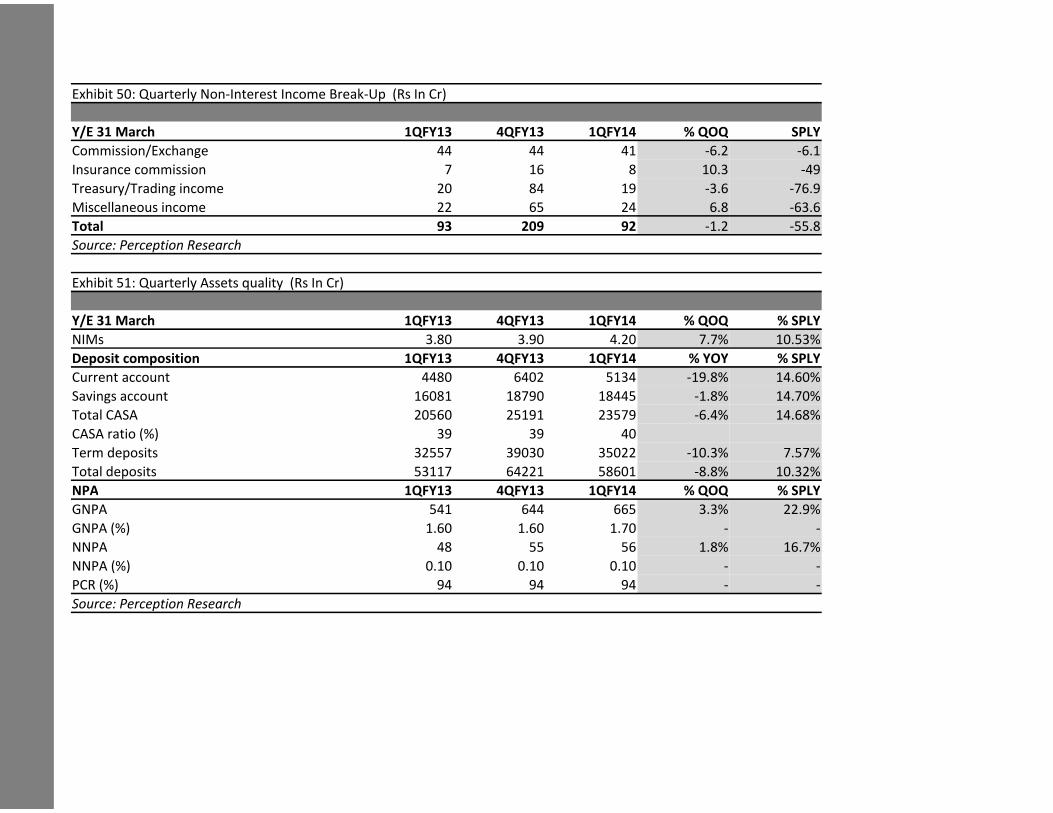
Exhibit 50: Quarterly Non-Interest Income Break-Up (Rs In Cr)Exhibit 50: Quarterly Non-Interest Income Break-Up (Rs In Cr)Exhibit 50: Quarterly Non-Interest Income Break-Up (Rs In Cr)
Y/E 31 March 1QFY13 4QFY13Y/E 31 March 1QFY13 4QFY13Y/E 31 March 1QFY13 4QFY13
Commission/Exchange 44Commission/Exchange 44Commission/Exchange 44
Insurance commission 7Insurance commission 7Insurance commission 7
Treasury/Trading income 20Treasury/Trading income 20Treasury/Trading income 20
Miscellaneous income 22Miscellaneous income 22Miscellaneous income 22
Total 93 209Total 93 209Total 93 209
Source: Perception ResearchSource: Perception ResearchSource: Perception Research
Exhibit 51: Quarterly Assets quality (Rs In Cr)Exhibit 51: Quarterly Assets quality (Rs In Cr)Exhibit 51: Quarterly Assets quality (Rs In Cr)
Y/E 31 March 1QFY13 4QFY13Y/E 31 March 1QFY13 4QFY13Y/E 31 March 1QFY13 4QFY13
NIMs 3.80 3.90NIMs 3.80 3.90NIMs 3.80 3.90
Deposit composition 1QFY13 4QFY13Deposit composition 1QFY13 4QFY13Deposit composition 1QFY13 4QFY13
Current account 4480 6402Current account 4480 6402Current account 4480 6402
Savings account 16081 18790Savings account 16081 18790Savings account 16081 18790
Total CASA 20560 25191Total CASA 20560 25191Total CASA 20560 25191
CASA ratio (%) 39CASA ratio (%) 39CASA ratio (%) 39
Term deposits 32557 39030Term deposits 32557 39030Term deposits 32557 39030
Total deposits 53117 64221Total deposits 53117 64221Total deposits 53117 64221
NPA 1QFY13 4QFY13NPA 1QFY13 4QFY13
GNPA 541 644GNPA 541 644
GNPA (%) 1.60 1.60GNPA (%) 1.60 1.60GNPA (%) 1.60 1.60
NNPA 48NNPA 48NNPA 48
NNPA (%) 0.10 0.10NNPA (%) 0.10 0.10NNPA (%) 0.10 0.10
PCR (%) 94PCR (%) 94PCR (%) 94
Source: Perception ResearchSource: Perception ResearchSource: Perception Research
4QFY13 1QFY14 % QOQ SPLY4QFY13 1QFY14 % QOQ SPLY4QFY13 1QFY14 % QOQ SPLY
44 41 -6.2 -6.144 41 -6.2 -6.144 41 -6.2 -6.1
16 8 10.3 -4916 8 10.3 -4916 8 10.3 -49
84 19 -3.6 -76.984 19 -3.6 -76.984 19 -3.6 -76.9
65 24 6.8 -63.665 24 6.8 -63.665 24 6.8 -63.6
209 92 -1.2 -55.8209 92 -1.2 -55.8209 92 -1.2 -55.8
4QFY13 1QFY14 % QOQ % SPLY4QFY13 1QFY14 % QOQ % SPLY4QFY13 1QFY14 % QOQ % SPLY
3.90 4.20 7.7% 10.53%3.90 4.20 7.7% 10.53%3.90 4.20 7.7% 10.53%
4QFY13 1QFY14 % YOY % SPLY4QFY13 1QFY14 % YOY % SPLY4QFY13 1QFY14 % YOY % SPLY
6402 5134 -19.8% 14.60%6402 5134 -19.8% 14.60%6402 5134 -19.8% 14.60%
18790 18445 -1.8% 14.70%18790 18445 -1.8% 14.70%18790 18445 -1.8% 14.70%
25191 23579 -6.4% 14.68%25191 23579 -6.4% 14.68%25191 23579 -6.4% 14.68%
39 4039 4039 40
39030 35022 -10.3% 7.57%39030 35022 -10.3% 7.57%39030 35022 -10.3% 7.57%
64221 58601 -8.8% 10.32%64221 58601 -8.8% 10.32%64221 58601 -8.8% 10.32%
4QFY13 1QFY14 % QOQ % SPLY4QFY13 1QFY14 % QOQ % SPLY
644 665 3.3% 22.9%644 665 3.3% 22.9%
1.60 1.70 - -1.60 1.70 - -1.60 1.70 - -
55 56 1.8% 16.7%55 56 1.8% 16.7%55 56 1.8% 16.7%
0.10 0.10 - -0.10 0.10 - -0.10 0.10 - -
94 94 - -94 94 - -94 94 - -
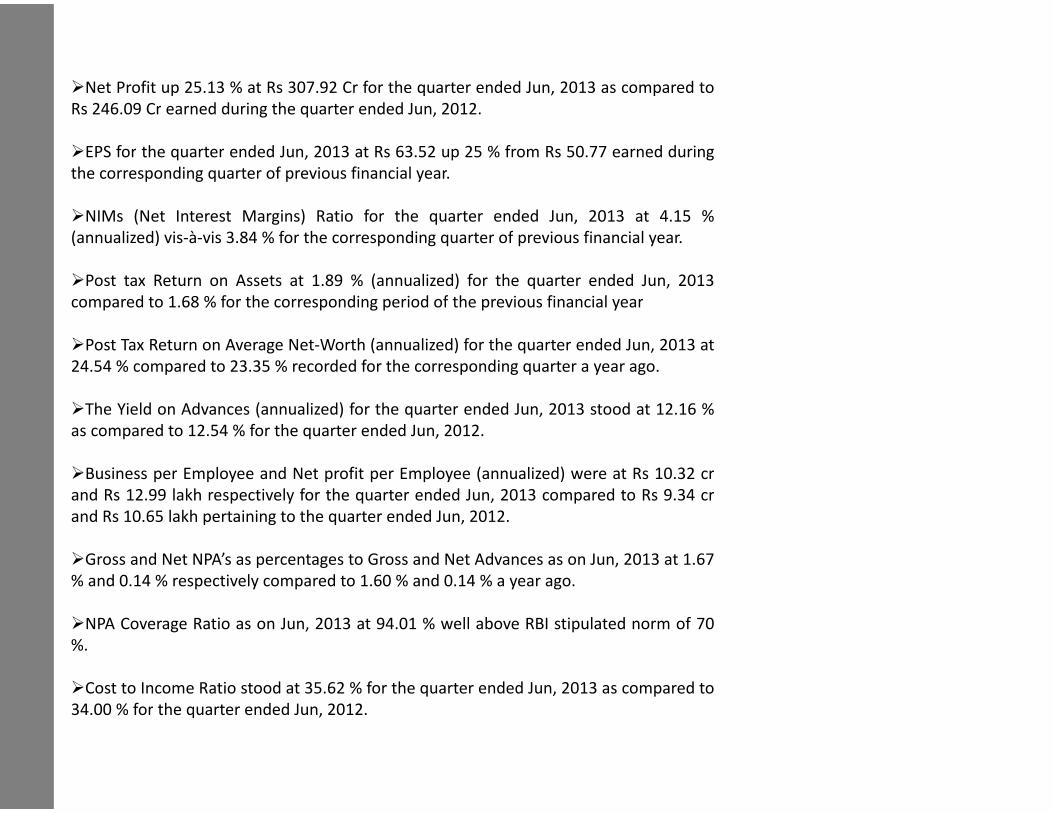
�Net Profit up 25.13 % at Rs 307.92 Cr for the quarter ended Jun,�Net Profit up 25.13 % at Rs 307.92 Cr for the quarter ended Jun,�Net Profit up 25.13 % at Rs 307.92 Cr for the quarter ended Jun,
Rs 246.09 Cr earned during the quarter ended Jun, 2012.Rs 246.09 Cr earned during the quarter ended Jun, 2012.Rs 246.09 Cr earned during the quarter ended Jun, 2012.Rs 246.09 Cr earned during the quarter ended Jun, 2012.
�EPS for the quarter ended Jun, 2013 at Rs 63.52 up 25 % from�EPS for the quarter ended Jun, 2013 at Rs 63.52 up 25 % from�EPS for the quarter ended Jun, 2013 at Rs 63.52 up 25 % from
the corresponding quarter of previous financial year.the corresponding quarter of previous financial year.the corresponding quarter of previous financial year.the corresponding quarter of previous financial year.
�NIMs (Net Interest Margins) Ratio for the quarter ended�NIMs (Net Interest Margins) Ratio for the quarter ended�NIMs (Net Interest Margins) Ratio for the quarter ended
(annualized) vis-à-vis 3.84 % for the corresponding quarter of previous(annualized) vis-à-vis 3.84 % for the corresponding quarter of previous(annualized) vis-à-vis 3.84 % for the corresponding quarter of previous(annualized) vis-à-vis 3.84 % for the corresponding quarter of previous
�Post tax Return on Assets at 1.89 % (annualized) for the�Post tax Return on Assets at 1.89 % (annualized) for the�Post tax Return on Assets at 1.89 % (annualized) for the
compared to 1.68 % for the corresponding period of the previouscompared to 1.68 % for the corresponding period of the previouscompared to 1.68 % for the corresponding period of the previous
�Post Tax Return on Average Net-Worth (annualized) for the quarter�Post Tax Return on Average Net-Worth (annualized) for the quarter�Post Tax Return on Average Net-Worth (annualized) for the quarter
24.54 % compared to 23.35 % recorded for the corresponding quarter24.54 % compared to 23.35 % recorded for the corresponding quarter24.54 % compared to 23.35 % recorded for the corresponding quarter
�The Yield on Advances (annualized) for the quarter ended Jun,�The Yield on Advances (annualized) for the quarter ended Jun,�The Yield on Advances (annualized) for the quarter ended Jun,
as compared to 12.54 % for the quarter ended Jun, 2012.as compared to 12.54 % for the quarter ended Jun, 2012.as compared to 12.54 % for the quarter ended Jun, 2012.
Business per Employee and Net profit per Employee (annualized)�Business per Employee and Net profit per Employee (annualized)�Business per Employee and Net profit per Employee (annualized)�Business per Employee and Net profit per Employee (annualized)
and Rs 12.99 lakh respectively for the quarter ended Jun, 2013and Rs 12.99 lakh respectively for the quarter ended Jun, 2013and Rs 12.99 lakh respectively for the quarter ended Jun, 2013
and Rs 10.65 lakh pertaining to the quarter ended Jun, 2012.and Rs 10.65 lakh pertaining to the quarter ended Jun, 2012.and Rs 10.65 lakh pertaining to the quarter ended Jun, 2012.
�Gross and Net NPA’s as percentages to Gross and Net Advances�Gross and Net NPA’s as percentages to Gross and Net Advances�Gross and Net NPA’s as percentages to Gross and Net Advances
% and 0.14 % respectively compared to 1.60 % and 0.14 % a year% and 0.14 % respectively compared to 1.60 % and 0.14 % a year% and 0.14 % respectively compared to 1.60 % and 0.14 % a year
�NPA Coverage Ratio as on Jun, 2013 at 94.01 % well above RBI�NPA Coverage Ratio as on Jun, 2013 at 94.01 % well above RBI�NPA Coverage Ratio as on Jun, 2013 at 94.01 % well above RBI
%.%.%.
Cost to Income Ratio stood at 35.62 % for the quarter ended�Cost to Income Ratio stood at 35.62 % for the quarter ended�Cost to Income Ratio stood at 35.62 % for the quarter ended�Cost to Income Ratio stood at 35.62 % for the quarter ended
34.00 % for the quarter ended Jun, 2012.34.00 % for the quarter ended Jun, 2012.34.00 % for the quarter ended Jun, 2012.
Jun, 2013 as compared toJun, 2013 as compared toJun, 2013 as compared to
from Rs 50.77 earned duringfrom Rs 50.77 earned duringfrom Rs 50.77 earned during
ended Jun, 2013 at 4.15 %ended Jun, 2013 at 4.15 %ended Jun, 2013 at 4.15 %
previous financial year.previous financial year.previous financial year.previous financial year.
quarter ended Jun, 2013quarter ended Jun, 2013quarter ended Jun, 2013
previous financial yearprevious financial yearprevious financial year
quarter ended Jun, 2013 atquarter ended Jun, 2013 atquarter ended Jun, 2013 at
quarter a year ago.quarter a year ago.quarter a year ago.
Jun, 2013 stood at 12.16 %Jun, 2013 stood at 12.16 %Jun, 2013 stood at 12.16 %
(annualized) were at Rs 10.32 cr(annualized) were at Rs 10.32 cr(annualized) were at Rs 10.32 cr(annualized) were at Rs 10.32 cr
2013 compared to Rs 9.34 cr2013 compared to Rs 9.34 cr2013 compared to Rs 9.34 cr
Advances as on Jun, 2013 at 1.67Advances as on Jun, 2013 at 1.67Advances as on Jun, 2013 at 1.67
year ago.year ago.year ago.
RBI stipulated norm of 70RBI stipulated norm of 70RBI stipulated norm of 70
Jun, 2013 as compared toJun, 2013 as compared toJun, 2013 as compared toJun, 2013 as compared to
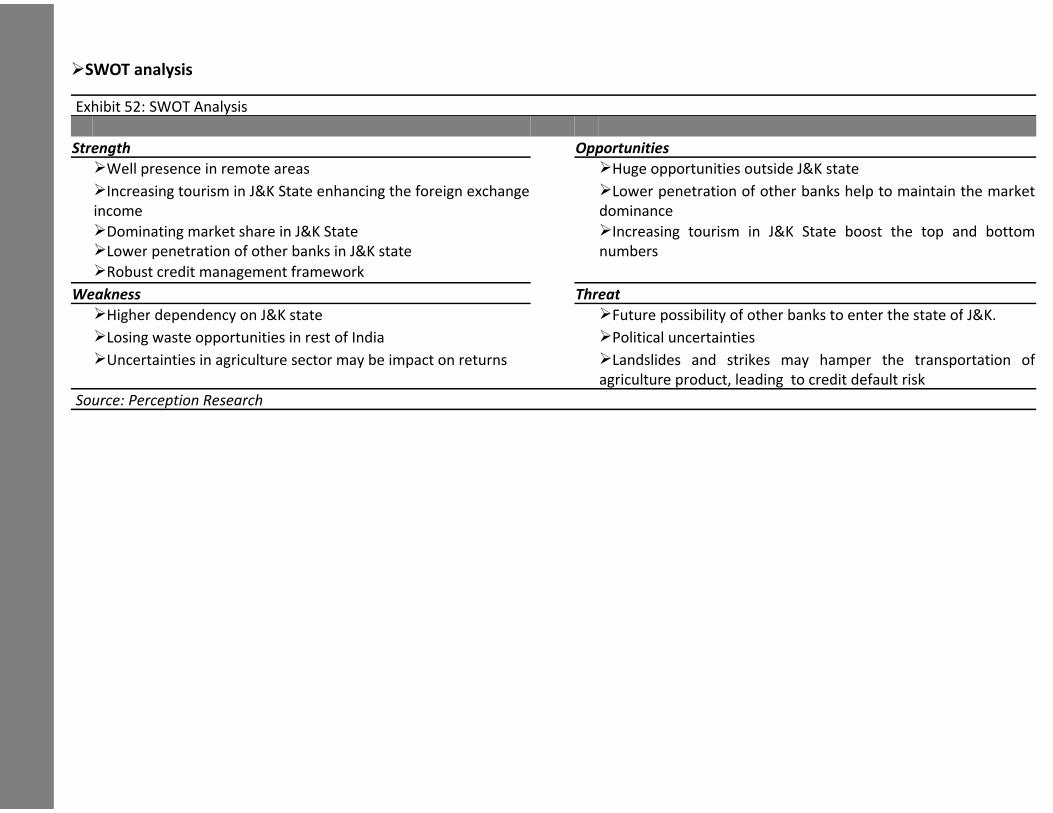
�SWOT analysis�SWOT analysis�SWOT analysisSWOT analysis
Exhibit 52: SWOT AnalysisExhibit 52: SWOT AnalysisExhibit 52: SWOT Analysis
StrengthStrengthStrength
�Well presence in remote areas�Well presence in remote areas�Well presence in remote areas
�Increasing tourism in J&K State enhancing the foreign exchange�Increasing tourism in J&K State enhancing the foreign exchange�Increasing tourism in J&K State enhancing the foreign exchange
incomeincomeincomeincome
�Dominating market share in J&K State�Dominating market share in J&K State�Dominating market share in J&K State
�Lower penetration of other banks in J&K state�Lower penetration of other banks in J&K state�Lower penetration of other banks in J&K state
�Robust credit management framework�Robust credit management framework�Robust credit management framework
WeaknessWeaknessWeaknessWeakness
�Higher dependency on J&K state�Higher dependency on J&K state�Higher dependency on J&K state
�Losing waste opportunities in rest of India�Losing waste opportunities in rest of India�Losing waste opportunities in rest of India
�Uncertainties in agriculture sector may be impact on returns�Uncertainties in agriculture sector may be impact on returns�Uncertainties in agriculture sector may be impact on returnsUncertainties in agriculture sector may be impact on returns
Source: Perception ResearchSource: Perception ResearchSource: Perception Research
OpportunitiesOpportunitiesOpportunities
�Huge opportunities outside J&K state�Huge opportunities outside J&K state�Huge opportunities outside J&K state
exchange �Lower penetration of other banks help to maintain the marketexchange �Lower penetration of other banks help to maintain the marketexchange �Lower penetration of other banks help to maintain the market
dominancedominancedominancedominance
�Increasing tourism in J&K State boost the top and bottom�Increasing tourism in J&K State boost the top and bottom�Increasing tourism in J&K State boost the top and bottom
numbersnumbersnumbers
ThreatThreatThreatThreat
�Future possibility of other banks to enter the state of J&K.�Future possibility of other banks to enter the state of J&K.�Future possibility of other banks to enter the state of J&K.
�Political uncertainties�Political uncertainties�Political uncertainties
�Landslides and strikes may hamper the transportation of�Landslides and strikes may hamper the transportation of�Landslides and strikes may hamper the transportation ofLandslides and strikes may hamper the transportation of
agriculture product, leading to credit default riskagriculture product, leading to credit default riskagriculture product, leading to credit default risk
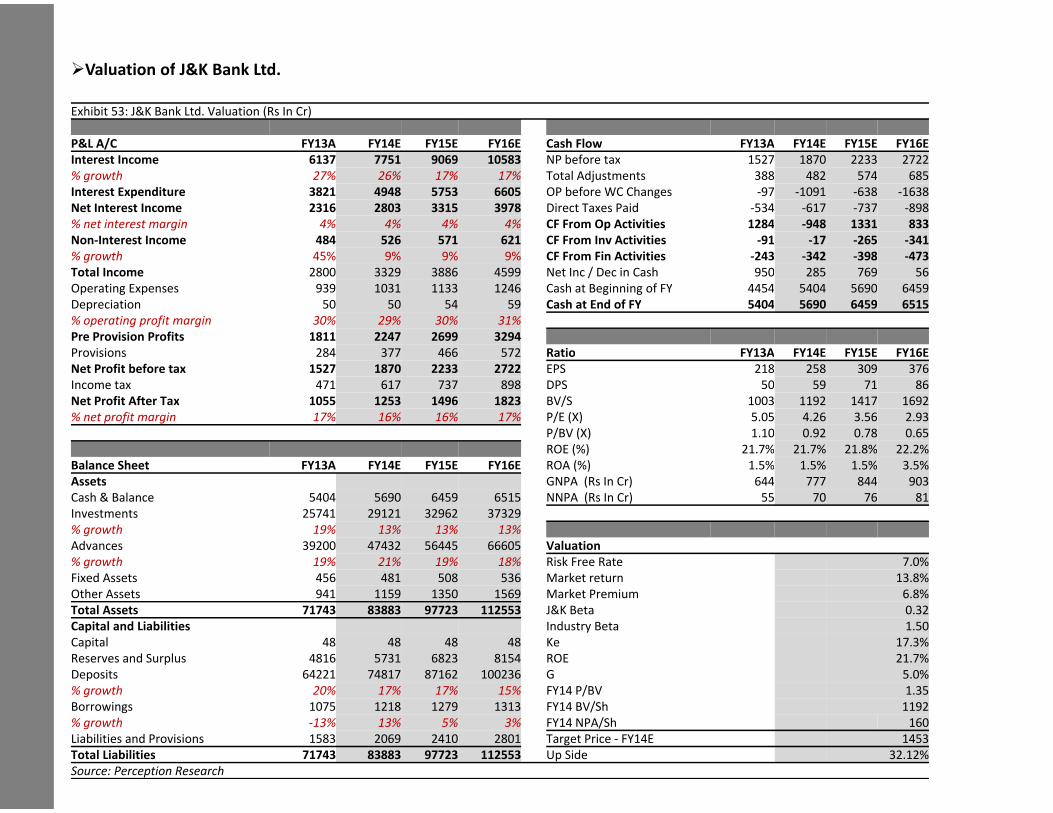
�Valuation of J&K Bank Ltd.�Valuation of J&K Bank Ltd.�Valuation of J&K Bank Ltd.Valuation of J&K Bank Ltd.
Exhibit 53: J&K Bank Ltd. Valuation (Rs In Cr)Exhibit 53: J&K Bank Ltd. Valuation (Rs In Cr)Exhibit 53: J&K Bank Ltd. Valuation (Rs In Cr)
P&L A/C FY13A FY14E FY15E FY16EP&L A/C FY13A FY14E FY15E FY16EP&L A/C FY13A FY14E FY15E FY16E
Interest Income 6137 7751 9069 10583Interest Income 6137 7751 9069 10583Interest Income 6137 7751 9069 10583
% growth 27% 26% 17% 17%% growth 27% 26% 17% 17%% growth 27% 26% 17% 17%
Interest Expenditure 3821 4948 5753 6605Interest Expenditure 3821 4948 5753 6605
Net Interest Income 2316 2803 3315 3978Net Interest Income 2316 2803 3315 3978Net Interest Income 2316 2803 3315 3978
% net interest margin 4% 4% 4% 4%% net interest margin 4% 4% 4% 4%% net interest margin 4% 4% 4% 4%
Non-Interest Income 484 526 571 621Non-Interest Income 484 526 571 621Non-Interest Income 484 526 571 621
% growth 45% 9% 9% 9%% growth 45% 9% 9% 9%
Total Income 2800 3329 3886 4599Total Income 2800 3329 3886 4599Total Income 2800 3329 3886 4599
Operating Expenses 939 1031 1133 1246Operating Expenses 939 1031 1133 1246Operating Expenses 939 1031 1133 1246
Depreciation 50 50 54 59Depreciation 50 50 54 59
% operating profit margin 30% 29% 30% 31%% operating profit margin 30% 29% 30% 31%% operating profit margin 30% 29% 30% 31%
Pre Provision Profits 1811 2247 2699 3294Pre Provision Profits 1811 2247 2699 3294Pre Provision Profits 1811 2247 2699 3294
Provisions 284 377 466 572Provisions 284 377 466 572Provisions 284 377 466 572
Net Profit before tax 1527 1870 2233 2722Net Profit before tax 1527 1870 2233 2722
Income tax 471 617 737 898Income tax 471 617 737 898Income tax 471 617 737 898
Net Profit After Tax 1055 1253 1496 1823Net Profit After Tax 1055 1253 1496 1823Net Profit After Tax 1055 1253 1496 1823
% net profit margin 17% 16% 16% 17%% net profit margin 17% 16% 16% 17%
Balance Sheet FY13A FY14E FY15E FY16EBalance Sheet FY13A FY14E FY15E FY16EBalance Sheet FY13A FY14E FY15E FY16E
AssetsAssets
Cash & Balance 5404 5690 6459 6515Cash & Balance 5404 5690 6459 6515Cash & Balance 5404 5690 6459 6515
Investments 25741 29121 32962 37329Investments 25741 29121 32962 37329Investments 25741 29121 32962 37329
% growth 19% 13% 13% 13%% growth 19% 13% 13% 13%% growth 19% 13% 13% 13%
Advances 39200 47432 56445 66605Advances 39200 47432 56445 66605
% growth 19% 21% 19% 18%% growth 19% 21% 19% 18%% growth 19% 21% 19% 18%
Fixed Assets 456 481 508 536Fixed Assets 456 481 508 536Fixed Assets 456 481 508 536
Other Assets 941 1159 1350 1569Other Assets 941 1159 1350 1569
Total Assets 71743 83883 97723 112553Total Assets 71743 83883 97723 112553Total Assets 71743 83883 97723 112553
Capital and LiabilitiesCapital and LiabilitiesCapital and Liabilities
Capital 48 48 48 48Capital 48 48 48 48Capital 48 48 48 48
Reserves and Surplus 4816 5731 6823 8154Reserves and Surplus 4816 5731 6823 8154
Deposits 64221 74817 87162 100236Deposits 64221 74817 87162 100236Deposits 64221 74817 87162 100236
% growth 20% 17% 17% 15%% growth 20% 17% 17% 15%% growth 20% 17% 17% 15%
Borrowings 1075 1218 1279 1313Borrowings 1075 1218 1279 1313
% growth -13% 13% 5% 3%
Borrowings 1075 1218 1279 1313
% growth -13% 13% 5% 3%% growth -13% 13% 5% 3%
Liabilities and Provisions 1583 2069 2410 2801Liabilities and Provisions 1583 2069 2410 2801Liabilities and Provisions 1583 2069 2410 2801
Total Liabilities 71743 83883 97723 112553Total Liabilities 71743 83883 97723 112553Total Liabilities 71743 83883 97723 112553
Source: Perception ResearchSource: Perception Research
Cash Flow FY13A FY14E FY15E FY16ECash Flow FY13A FY14E FY15E FY16ECash Flow FY13A FY14E FY15E FY16E
NP before tax 1527 1870 2233 2722NP before tax 1527 1870 2233 2722NP before tax 1527 1870 2233 2722
Total Adjustments 388 482 574 685Total Adjustments 388 482 574 685Total Adjustments 388 482 574 685
OP before WC Changes -97 -1091 -638 -1638OP before WC Changes -97 -1091 -638 -1638
Direct Taxes Paid -534 -617 -737 -898Direct Taxes Paid -534 -617 -737 -898Direct Taxes Paid -534 -617 -737 -898
CF From Op Activities 1284 -948 1331 833CF From Op Activities 1284 -948 1331 833CF From Op Activities 1284 -948 1331 833
CF From Inv Activities -91 -17 -265 -341CF From Inv Activities -91 -17 -265 -341CF From Inv Activities -91 -17 -265 -341
CF From Fin Activities -243 -342 -398 -473CF From Fin Activities -243 -342 -398 -473
Net Inc / Dec in Cash 950 285 769 56Net Inc / Dec in Cash 950 285 769 56Net Inc / Dec in Cash 950 285 769 56
Cash at Beginning of FY 4454 5404 5690 6459Cash at Beginning of FY 4454 5404 5690 6459Cash at Beginning of FY 4454 5404 5690 6459
Cash at End of FY 5404 5690 6459 6515Cash at End of FY 5404 5690 6459 6515
Ratio FY13A FY14E FY15E FY16ERatio FY13A FY14E FY15E FY16ERatio FY13A FY14E FY15E FY16E
EPS 218 258 309 376EPS 218 258 309 376
DPS 50 59 71 86DPS 50 59 71 86DPS 50 59 71 86
BV/S 1003 1192 1417 1692BV/S 1003 1192 1417 1692BV/S 1003 1192 1417 1692
P/E (X) 5.05 4.26 3.56 2.93P/E (X) 5.05 4.26 3.56 2.93
P/BV (X) 1.10 0.92 0.78 0.65P/BV (X) 1.10 0.92 0.78 0.65P/BV (X) 1.10 0.92 0.78 0.65
ROE (%) 21.7% 21.7% 21.8% 22.2%ROE (%) 21.7% 21.7% 21.8% 22.2%ROE (%) 21.7% 21.7% 21.8% 22.2%
ROA (%) 1.5% 1.5% 1.5% 3.5%ROA (%) 1.5% 1.5% 1.5% 3.5%ROA (%) 1.5% 1.5% 1.5% 3.5%
GNPA (Rs In Cr) 644 777 844 903GNPA (Rs In Cr) 644 777 844 903
NNPA (Rs In Cr) 55 70 76 81NNPA (Rs In Cr) 55 70 76 81NNPA (Rs In Cr) 55 70 76 81
ValuationValuation
Risk Free Rate 7.0%Risk Free Rate 7.0%Risk Free Rate 7.0%
Market return 13.8%Market return 13.8%Market return 13.8%
Market Premium 6.8%Market Premium 6.8%
J&K Beta 0.32J&K Beta 0.32J&K Beta 0.32
Industry Beta 1.50Industry Beta 1.50Industry Beta 1.50
Ke 17.3%Ke 17.3%Ke 17.3%
ROE 21.7%ROE 21.7%
G 5.0%G 5.0%G 5.0%
FY14 P/BV 1.35FY14 P/BV 1.35FY14 P/BV 1.35
FY14 BV/Sh 1192FY14 BV/Sh 1192
FY14 NPA/Sh 160
FY14 BV/Sh 1192
FY14 NPA/Sh 160FY14 NPA/Sh 160
Target Price - FY14E 1453Target Price - FY14E 1453Target Price - FY14E 1453
Up Side 32.12%Up Side 32.12%Up Side 32.12%
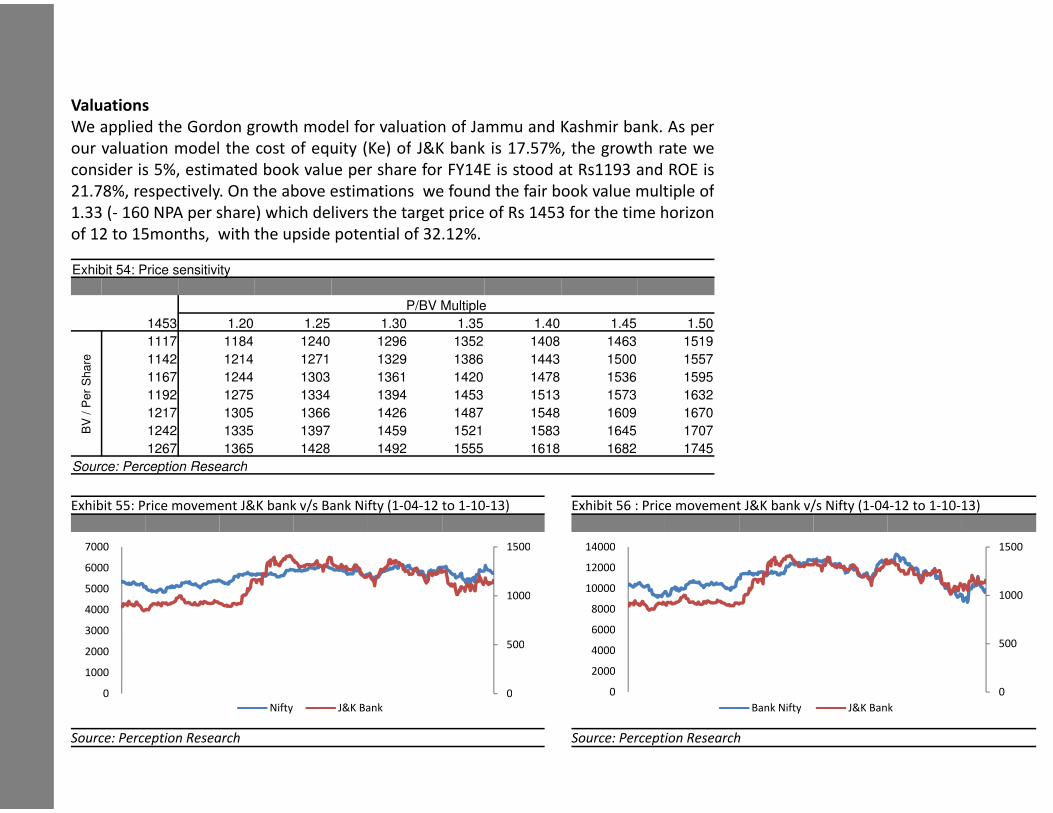
ValuationsValuationsValuations
We applied the Gordon growth model for valuation of JammuWe applied the Gordon growth model for valuation of JammuWe applied the Gordon growth model for valuation of JammuWe applied the Gordon growth model for valuation of Jammu
our valuation model the cost of equity (Ke) of J&K bank is 17.our valuation model the cost of equity (Ke) of J&K bank is 17.our valuation model the cost of equity (Ke) of J&K bank is 17.
consider is 5%, estimated book value per share for FY14E is stoodconsider is 5%, estimated book value per share for FY14E is stoodconsider is 5%, estimated book value per share for FY14E is stood
21.78%, respectively. On the above estimations we found the fair21.78%, respectively. On the above estimations we found the fair21.78%, respectively. On the above estimations we found the fair21.78%, respectively. On the above estimations we found the fair
1.33 (- 160 NPA per share) which delivers the target price of Rs1.33 (- 160 NPA per share) which delivers the target price of Rs1.33 (- 160 NPA per share) which delivers the target price of Rs
of 12 to 15months, with the upside potential of 32.12%.of 12 to 15months, with the upside potential of 32.12%.of 12 to 15months, with the upside potential of 32.12%.
Exhibit 54: Price sensitivityExhibit 54: Price sensitivityExhibit 54: Price sensitivity
P/BV MultipleP/BV MultipleP/BV Multiple
1453 1.20 1.25 1.30 1.351453 1.20 1.25 1.30 1.35
1117 1184 1240 1296 13521117 1184 1240 1296 1352
BV
/ P
er
Sh
are 1142 1214 1271 1329 1386
BV
/ P
er
Sh
are 1142 1214 1271 1329 1386
BV
/ P
er
Sh
are
1167 1244 1303 1361 1420
BV
/ P
er
Sh
are
1167 1244 1303 1361 1420
1192 1275 1334 1394 1453
BV
/ P
er
Sh
are
1192 1275 1334 1394 1453
BV
/ P
er
Sh
are
1192 1275 1334 1394 1453
1217 1305 1366 1426 1487
BV
/ P
er
Sh
are
1217 1305 1366 1426 1487
BV
/ P
er
Sh
are
1217 1305 1366 1426 1487
1242 1335 1397 1459 1521BV
/ P
er
Sh
are
1242 1335 1397 1459 15211242 1335 1397 1459 1521
1267 1365 1428 1492 15551267 1365 1428 1492 15551267 1365 1428 1492 1555
Source: Perception ResearchSource: Perception ResearchSource: Perception Research
Exhibit 55: Price movement J&K bank v/s Bank Nifty (1-04-12 to 1-10-13)Exhibit 55: Price movement J&K bank v/s Bank Nifty (1-04-12 to 1-10-13)Exhibit 55: Price movement J&K bank v/s Bank Nifty (1-04-12 to 1-10-13)
15007000 15007000
60006000
5000
6000
10005000
1000
4000
50001000
40004000
3000
500
3000
5002000
5002000
1000
2000
1000
00
1000
00 00
Nifty J&K BankNifty J&K BankNifty J&K Bank
Source: Perception ResearchSource: Perception ResearchSource: Perception Research
and Kashmir bank. As perand Kashmir bank. As perand Kashmir bank. As perand Kashmir bank. As per
.57%, the growth rate we.57%, the growth rate we.57%, the growth rate we
stood at Rs1193 and ROE isstood at Rs1193 and ROE isstood at Rs1193 and ROE is
fair book value multiple offair book value multiple offair book value multiple offair book value multiple of
1453 for the time horizon1453 for the time horizon1453 for the time horizon
1.40 1.45 1.501.40 1.45 1.50
1408 1463 15191408 1463 1519
1443 1500 15571443 1500 1557
1478 1536 15951478 1536 1595
1513 1573 16321513 1573 16321513 1573 1632
1548 1609 16701548 1609 16701548 1609 1670
1583 1645 17071583 1645 17071583 1645 1707
1618 1682 17451618 1682 17451618 1682 1745
Exhibit 56 : Price movement J&K bank v/s Nifty (1-04-12 to 1-10-13)Exhibit 56 : Price movement J&K bank v/s Nifty (1-04-12 to 1-10-13)Exhibit 56 : Price movement J&K bank v/s Nifty (1-04-12 to 1-10-13)
1500 1500140001500 150014000
1200012000
10000
12000
1000 100010000
1000 1000
8000
100001000
80008000
6000
500
6000
5004000
5004000
20002000
00
2000
00 00
Bank Nifty J&K BankBank Nifty J&K BankBank Nifty J&K Bank
Source: Perception ResearchSource: Perception ResearchSource: Perception Research
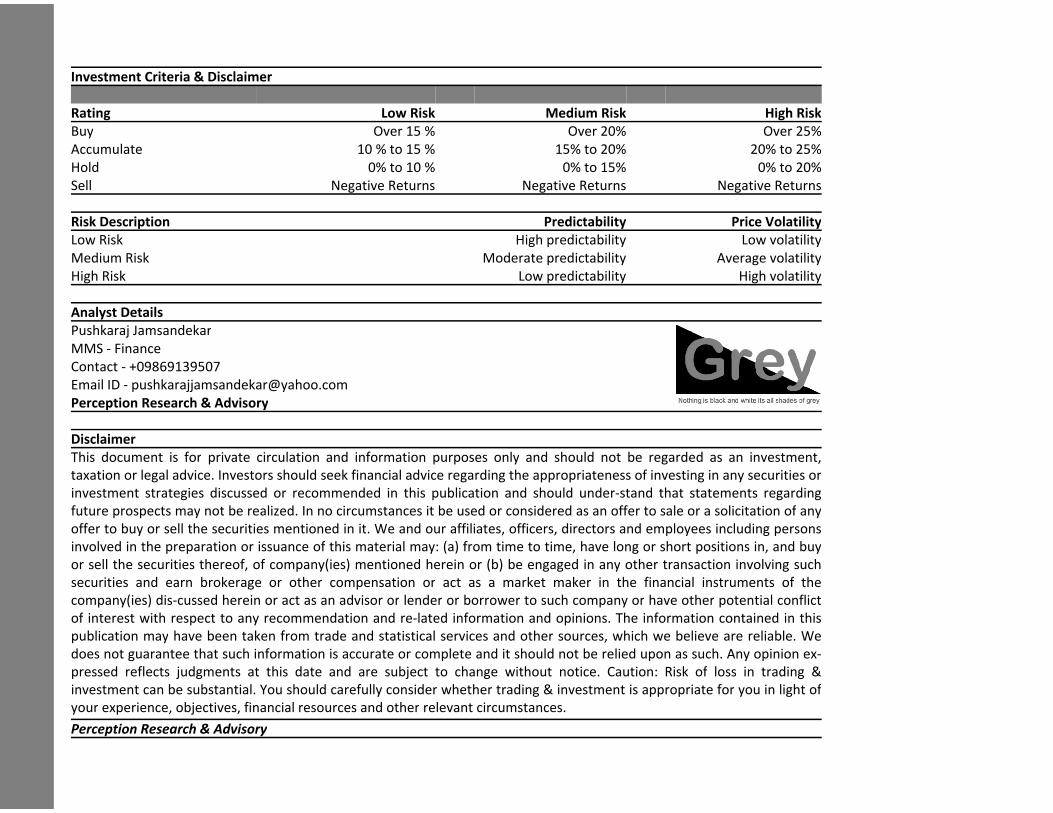
Investment Criteria & Disclaimer Investment Criteria & Disclaimer Investment Criteria & Disclaimer
Rating Low Risk Rating Low Risk Rating Low Risk
Buy Over 15 %Buy Over 15 %Buy Over 15 %
Accumulate 10 % to 15 %Accumulate 10 % to 15 %Accumulate 10 % to 15 %
Hold 0% to 10 %Hold 0% to 10 %Hold 0% to 10 %
Sell Negative Returns Negative ReturnsSell Negative Returns Negative ReturnsSell Negative Returns Negative Returns
Risk Description Risk Description Risk Description
Low Risk High predictabilityLow Risk High predictabilityLow Risk High predictability
Medium Risk Moderate predictabilityMedium Risk Moderate predictabilityMedium Risk Moderate predictability
High Risk Low predictabilityHigh Risk Low predictability
Analyst DetailsAnalyst DetailsAnalyst Details
Pushkaraj JamsandekarPushkaraj JamsandekarPushkaraj Jamsandekar
MMS - FinanceMMS - FinanceMMS - Finance
Contact - +09869139507 Contact - +09869139507 Contact - +09869139507
Email ID - [email protected] ID - [email protected] ID - [email protected]
Perception Research & AdvisoryPerception Research & AdvisoryPerception Research & Advisory
Disclaimer Disclaimer Disclaimer
This document is for private circulation and information purposes only andThis document is for private circulation and information purposes only andThis document is for private circulation and information purposes only and
taxation or legal advice. Investors should seek financial advice regarding thetaxation or legal advice. Investors should seek financial advice regarding thetaxation or legal advice. Investors should seek financial advice regarding the
investment strategies discussed or recommended in this publication andinvestment strategies discussed or recommended in this publication andinvestment strategies discussed or recommended in this publication and
future prospects may not be realized. In no circumstances it be used or consideredfuture prospects may not be realized. In no circumstances it be used or consideredfuture prospects may not be realized. In no circumstances it be used or considered
offer to buy or sell the securities mentioned in it. We and our affiliates, officers,offer to buy or sell the securities mentioned in it. We and our affiliates, officers,offer to buy or sell the securities mentioned in it. We and our affiliates, officers,
involved in the preparation or issuance of this material may: (a) from timeinvolved in the preparation or issuance of this material may: (a) from time
or sell the securities thereof, of company(ies) mentioned herein or (b) beor sell the securities thereof, of company(ies) mentioned herein or (b) beor sell the securities thereof, of company(ies) mentioned herein or (b) be
securities and earn brokerage or other compensation or act as a marketsecurities and earn brokerage or other compensation or act as a marketsecurities and earn brokerage or other compensation or act as a market
company(ies) dis-cussed herein or act as an advisor or lender or borrower tocompany(ies) dis-cussed herein or act as an advisor or lender or borrower tocompany(ies) dis-cussed herein or act as an advisor or lender or borrower to
of interest with respect to any recommendation and re-lated informationof interest with respect to any recommendation and re-lated informationof interest with respect to any recommendation and re-lated information
publication may have been taken from trade and statistical services and otherpublication may have been taken from trade and statistical services and otherpublication may have been taken from trade and statistical services and other
does not guarantee that such information is accurate or complete and it shoulddoes not guarantee that such information is accurate or complete and it shoulddoes not guarantee that such information is accurate or complete and it should
pressed reflects judgments at this date and are subject to change withoutpressed reflects judgments at this date and are subject to change withoutpressed reflects judgments at this date and are subject to change without
investment can be substantial. You should carefully consider whether tradinginvestment can be substantial. You should carefully consider whether tradinginvestment can be substantial. You should carefully consider whether trading
your experience, objectives, financial resources and other relevant circumstancesyour experience, objectives, financial resources and other relevant circumstancesyour experience, objectives, financial resources and other relevant circumstances
Perception Research & AdvisoryPerception Research & AdvisoryPerception Research & Advisory
Medium Risk High RiskMedium Risk High RiskMedium Risk High Risk
Over 20% Over 25%Over 20% Over 25%Over 20% Over 25%
15% to 20% 20% to 25%15% to 20% 20% to 25%15% to 20% 20% to 25%
0% to 15% 0% to 20%0% to 15% 0% to 20%0% to 15% 0% to 20%
Negative Returns Negative ReturnsNegative Returns Negative ReturnsNegative Returns Negative Returns
Predictability Price VolatilityPredictability Price VolatilityPredictability Price Volatility
High predictability Low volatilityHigh predictability Low volatilityHigh predictability Low volatility
Moderate predictability Average volatilityModerate predictability Average volatilityModerate predictability Average volatility
Low predictability High volatilityLow predictability High volatility
and should not be regarded as an investment,and should not be regarded as an investment,and should not be regarded as an investment,
the appropriateness of investing in any securities orthe appropriateness of investing in any securities orthe appropriateness of investing in any securities or
and should under-stand that statements regardingand should under-stand that statements regardingand should under-stand that statements regarding
considered as an offer to sale or a solicitation of anyconsidered as an offer to sale or a solicitation of anyconsidered as an offer to sale or a solicitation of any
officers, directors and employees including personsofficers, directors and employees including personsofficers, directors and employees including persons
to time, have long or short positions in, and buyto time, have long or short positions in, and buy
engaged in any other transaction involving suchengaged in any other transaction involving suchengaged in any other transaction involving such
market maker in the financial instruments of themarket maker in the financial instruments of themarket maker in the financial instruments of the
to such company or have other potential conflictto such company or have other potential conflictto such company or have other potential conflict
and opinions. The information contained in thisand opinions. The information contained in thisand opinions. The information contained in this
other sources, which we believe are reliable. Weother sources, which we believe are reliable. Weother sources, which we believe are reliable. We
should not be relied upon as such. Any opinion ex-should not be relied upon as such. Any opinion ex-should not be relied upon as such. Any opinion ex-
without notice. Caution: Risk of loss in trading &without notice. Caution: Risk of loss in trading &without notice. Caution: Risk of loss in trading &
trading & investment is appropriate for you in light oftrading & investment is appropriate for you in light oftrading & investment is appropriate for you in light of
circumstances.circumstances.circumstances.


![… · ltd/ Islami Bank Bangladesh I-tci/Jamuna Bank Lid/ Trust Bank Ltd/AB Bank Ltd/ Dhaka Bank Ltd/ Pubali Bank Ltd/Basic Bank I-Ic]/South East, Bank Ltd/ Dutch Bangla Bank Ltd](https://img.pdfslide.net/doc/110x75/5eaae1285617c3695347ef52/-ltd-islami-bank-bangladesh-i-tcijamuna-bank-lid-trust-bank-ltdab-bank-ltd.jpg)