Embed Size (px)
Citation preview

2017 OECD ECONOMIC SURVEY
OF LATVIA
Boosting productivity and inclusiveness
September 15th 2017, Riga Latvia
http://www.oecd.org/eco/surveys/economic-survey-latvia.htm
Main messages
1
• The Latvian economy is growing strongly, underpinned by progress with economic reforms.
• Deeper integration into international trade is necessary to catch up with high-income countries.
• Poverty and unemployment are still high. Access to jobs, housing and health services need to improve.

Growth has been strong
2
75
80
85
90
95
100
105
110
75
80
85
90
95
100
105
110
2007
Q1
2007
Q3
2008
Q1
2008
Q3
2009
Q1
2009
Q3
2010
Q1
2010
Q3
2011
Q1
2011
Q3
2012
Q1
2012
Q3
2013
Q1
2013
Q3
2014
Q1
2014
Q3
2015
Q1
2015
Q3
2016
Q1
2016
Q3
2017
Q1
Latvia Estonia Euro area
Real GDP, Index 2007 =100
Source: OECD (2017), OECD Economic Outlook: Statistics and Projections (database).
3
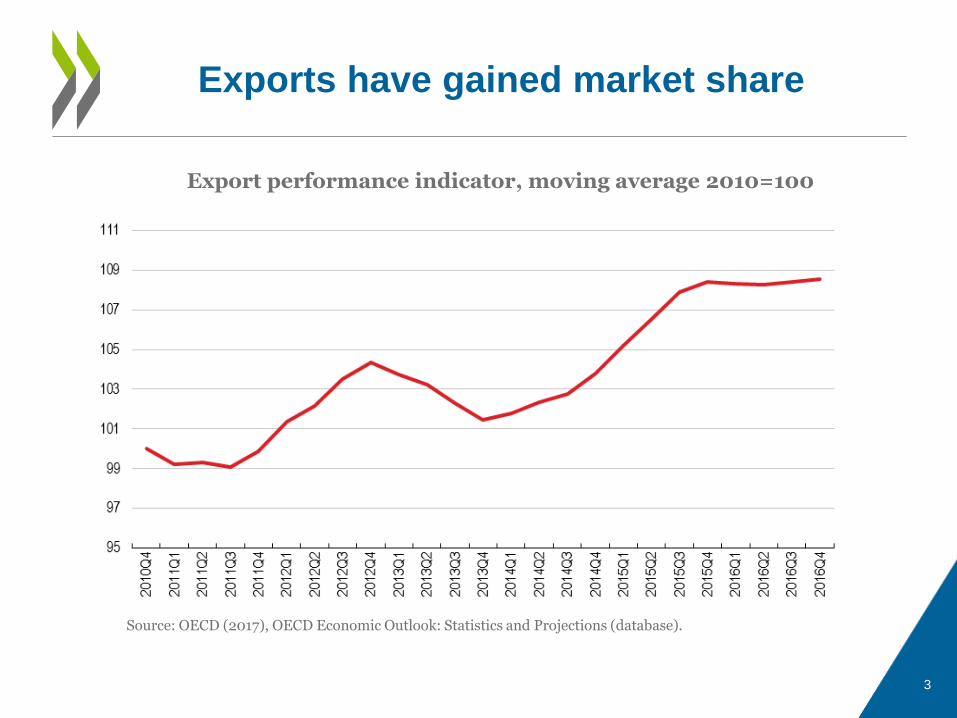
Exports have gained market share
Source: OECD (2017), OECD Economic Outlook: Statistics and Projections (database).
Export performance indicator, moving average 2010=100

4
Unemployment has fallen
Unemployment rate as % of labour force
Source: OECD (2017), OECD Economic Outlook: Statistics and Projections (database).
0
4
8
12
16
20
24
0
4
8
12
16
20
24
2010
Q4
2011
Q1
2011
Q2
2011
Q3
2011
Q4
2012
Q1
2012
Q2
2012
Q3
2012
Q4
2013
Q1
2013
Q2
2013
Q3
2013
Q4
2014
Q1
2014
Q2
2014
Q3
2014
Q4
2015
Q1
2015
Q2
2015
Q3
2015
Q4
2016
Q1
2016
Q2
2016
Q3
2016
Q4
2017
Q1
2017
Q2
Latvia Euro area
5
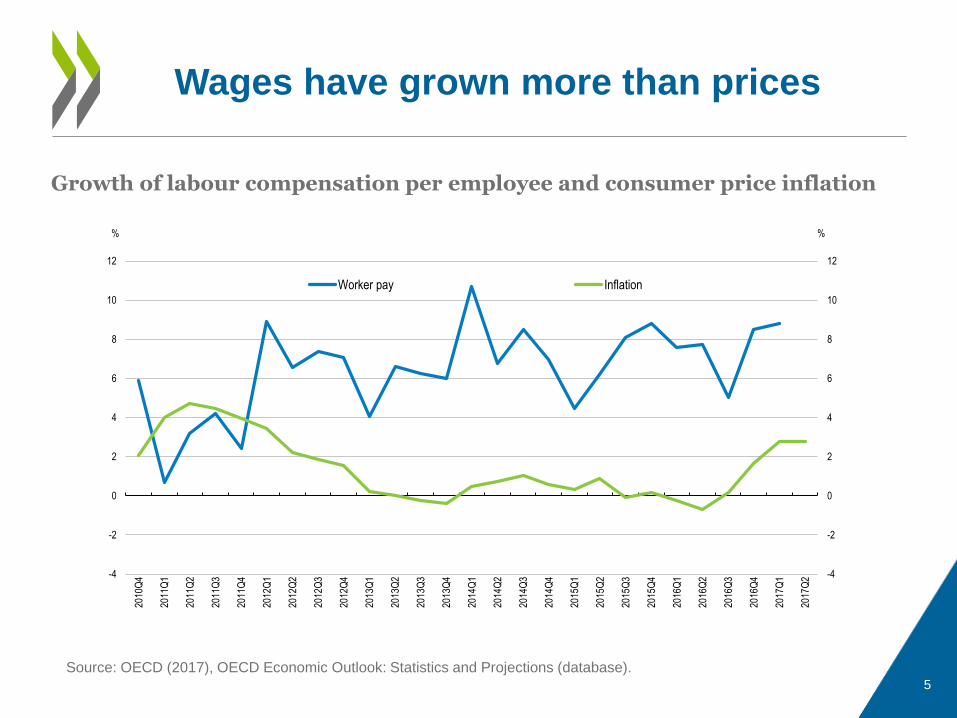
Wages have grown more than prices
Source: OECD (2017), OECD Economic Outlook: Statistics and Projections (database).
Growth of labour compensation per employee and consumer price inflation
-4
-2
0
2
4
6
8
10
12
-4
-2
0
2
4
6
8
10
12
2010
Q4
2011
Q1
2011
Q2
2011
Q3
2011
Q4
2012
Q1
2012
Q2
2012
Q3
2012
Q4
2013
Q1
2013
Q2
2013
Q3
2013
Q4
2014
Q1
2014
Q2
2014
Q3
2014
Q4
2015
Q1
2015
Q2
2015
Q3
2015
Q4
2016
Q1
2016
Q2
2016
Q3
2016
Q4
2017
Q1
2017
Q2
%%
Worker pay Inflation

6
Latvia is a top reformer
The 2017 Going for Growth reform responsiveness indicator
Source: OECD (2017) Going for Growth 2017 edition.
0
20
40
60
80
IDN
SV
N
AU
S
CA
N
ISL
TU
R
LUX
PR
T
PO
L
CH
E
NZ
L
ZA
F
KO
R
FIN
GB
R
SV
K
HU
N
SW
E
US
A
CO
L
OE
CD
ES
P
NO
R
IND
JPN
DE
U
DN
K
NLD
CZ
E
ES
T
IRL
ITA
GR
C
ME
X
CH
N
ISR
CH
L
AU
T
BE
L
BR
A
FR
A
LVA
%

7
Debt has fallen
Debt as % of GDP
Source: OECD (2017), OECD Economic Outlook: Statistics and Projections (database) and OECD National Accounts Statistics (database).
0
40
80
120
160
200
0
40
80
120
160
200
2010 2011 2012 2013 2014 2015
% %
Households Non-financial corporations
8
Important challenges remain

9
The gap in productivity remains large
-80
-75
-70
-65
-60
-55
-50
-45
199
5
199
7
199
9
200
1
200
3
200
5
200
7
200
9
201
1
201
3
201
5
%
Gap in GDP per capita of Latvia vis-à-vis the upper half of OECD countries
Source: OECD (2017), OECD National Accounts Statistics (database) and OECD Productivity Statistics (database).
10
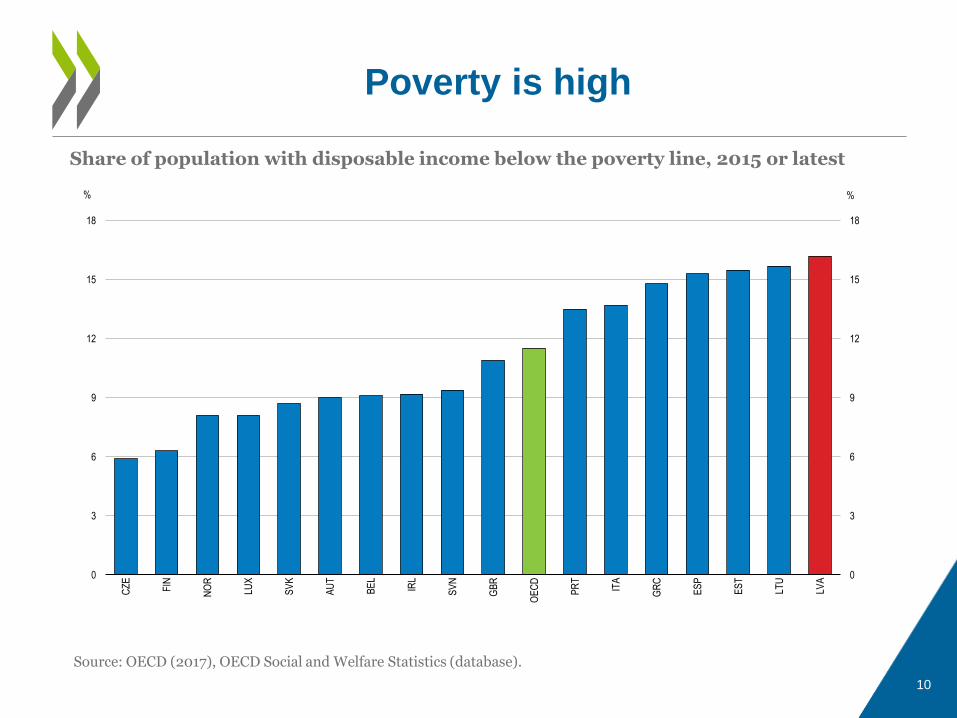
Poverty is high
Source: OECD (2017), OECD Social and Welfare Statistics (database).
Share of population with disposable income below the poverty line, 2015 or latest
0
3
6
9
12
15
18
0
3
6
9
12
15
18
CZ
E
FIN
NO
R
LUX
SV
K
AU
T
BE
L
IRL
SV
N
GB
R
OE
CD
PR
T
ITA
GR
C
ES
P
ES
T
LTU
LVA
%%
11
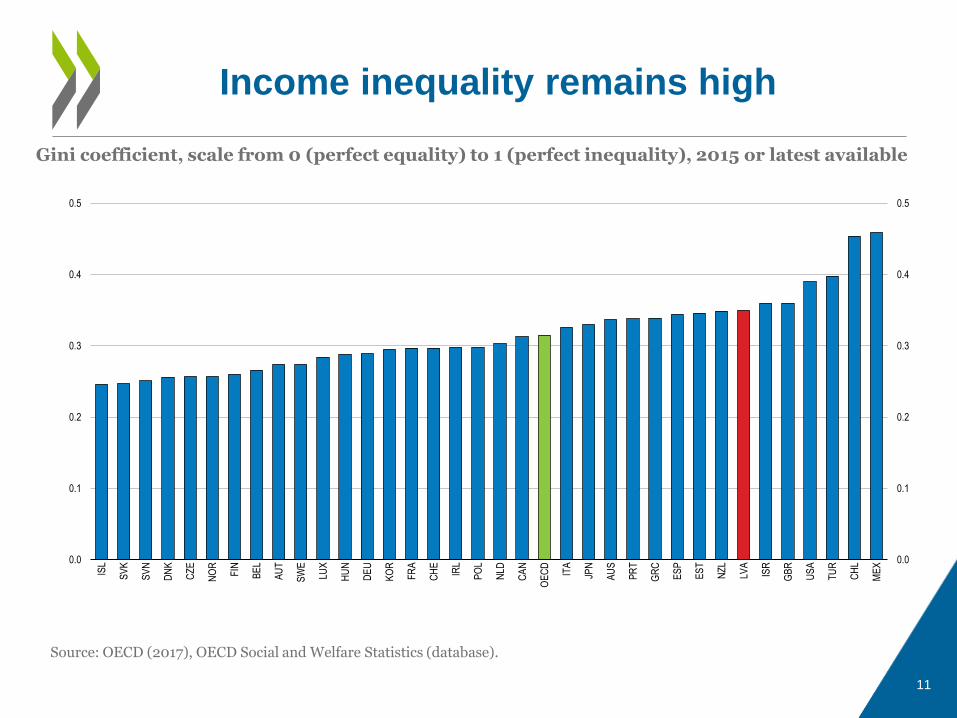
Income inequality remains high
Source: OECD (2017), OECD Social and Welfare Statistics (database).
Gini coefficient, scale from 0 (perfect equality) to 1 (perfect inequality), 2015 or latest available
0.0
0.1
0.2
0.3
0.4
0.5
0.0
0.1
0.2
0.3
0.4
0.5
ISL
SV
K
SV
N
DN
K
CZ
E
NO
R
FIN
BE
L
AU
T
SW
E
LUX
HU
N
DE
U
KO
R
FR
A
CH
E
IRL
PO
L
NLD
CA
N
OE
CD
ITA
JPN
AU
S
PR
T
GR
C
ES
P
ES
T
NZ
L
LVA
ISR
GB
R
US
A
TU
R
CH
L
ME
X

12
Higher income, better housing and better
health would raise wellbeing
Source: OECD (2016), OECD Better Life Index- Edition 2016.
OECD Better Life Index, from 0 (worse) to 1 (best), 2016
0.0
0.2
0.4
0.6
0.8
1.0
Income and wealth
Jobs and earnings
Housing
Work and life balance
Health status
Education and skillsSocial connections
Environmental quality
Personal security
Subjective well-being
Latvia OECD
Civic engagement and
governance
13
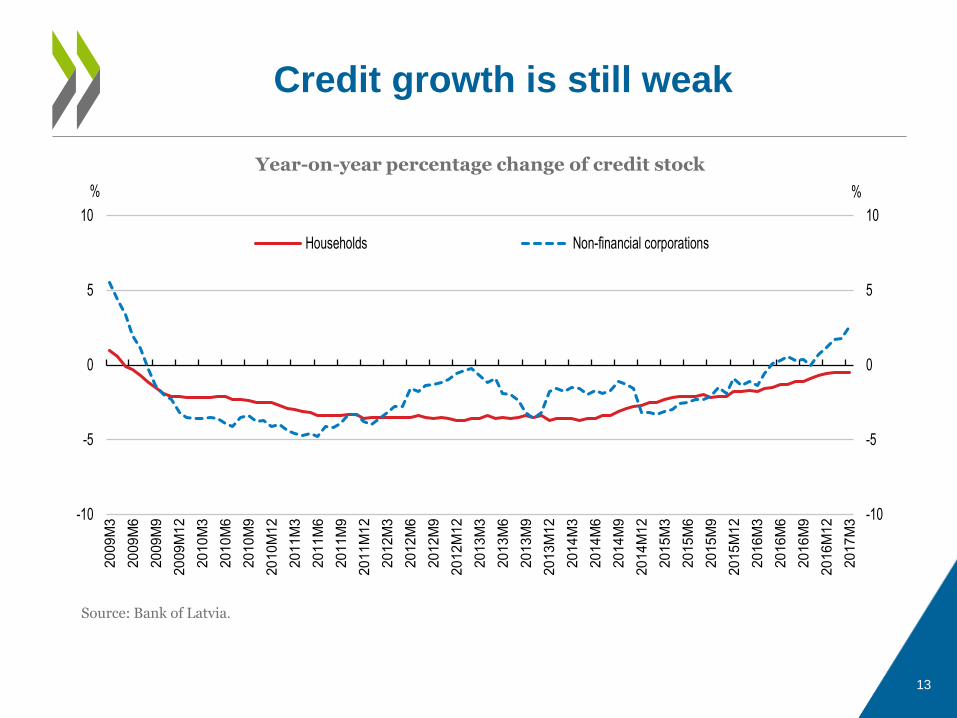
Credit growth is still weak
-10
-5
0
5
10
-10
-5
0
5
10
20
09
M3
20
09
M6
20
09
M9
20
09
M1
2
20
10
M3
20
10
M6
20
10
M9
20
10
M1
2
20
11
M3
20
11
M6
20
11
M9
20
11
M1
2
20
12
M3
20
12
M6
20
12
M9
20
12
M1
2
20
13
M3
20
13
M6
20
13
M9
20
13
M1
2
20
14
M3
20
14
M6
20
14
M9
20
14
M1
2
20
15
M3
20
15
M6
20
15
M9
20
15
M1
2
20
16
M3
20
16
M6
20
16
M9
20
16
M1
2
20
17
M3
%%
Households Non-financial corporations
Source: Bank of Latvia.
Year-on-year percentage change of credit stock

14
Seize opportunities in global markets to catch up with high-income countries

15
Productivity growth has slowed
Average annual growth of labour productivity
Source: OECD (2017), OECD Productivity Statistics (database).
0
2
4
6
8
10
0
2
4
6
8
10
1995-2005 2005-2016 1995-2005 2005-2016 1995-2005 2005-2016
Total Manufacturing Business sector services
%%
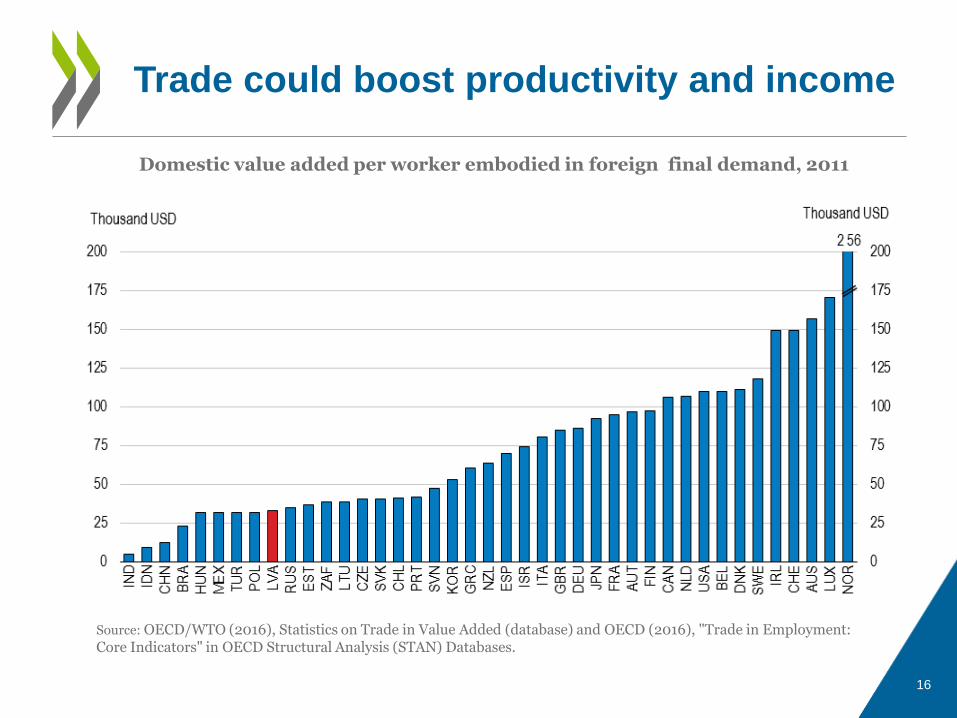
Trade could boost productivity and income
Domestic value added per worker embodied in foreign final demand, 2011
Source: OECD/WTO (2016), Statistics on Trade in Value Added (database) and OECD (2016), "Trade in Employment: Core Indicators" in OECD Structural Analysis (STAN) Databases.
16
17
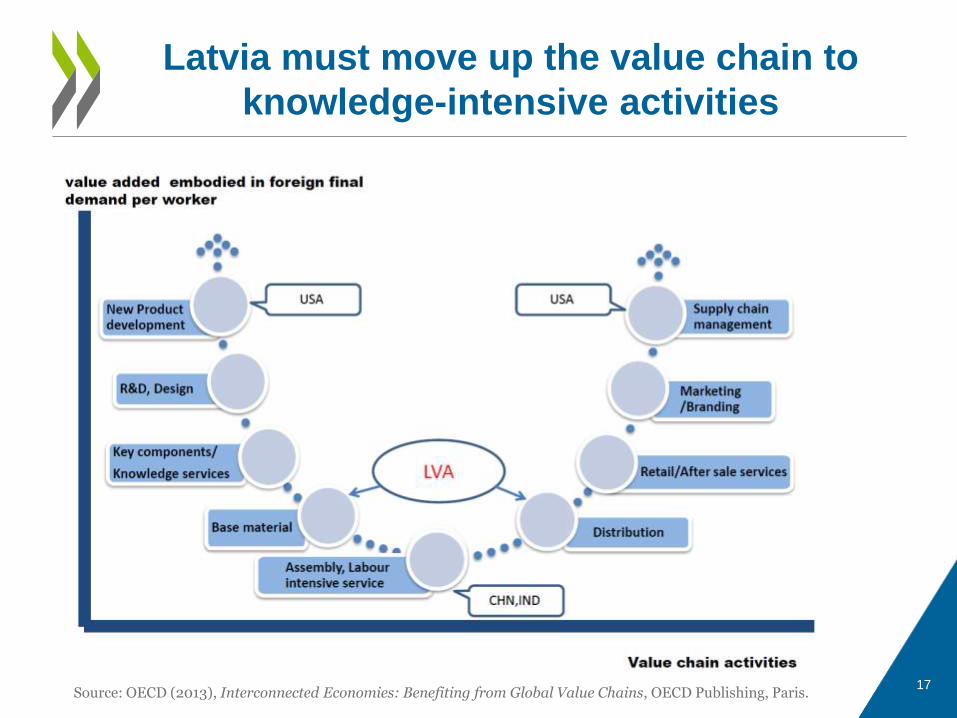
Latvia must move up the value chain to
knowledge-intensive activities
Source: OECD (2013), Interconnected Economies: Benefiting from Global Value Chains, OECD Publishing, Paris.
18
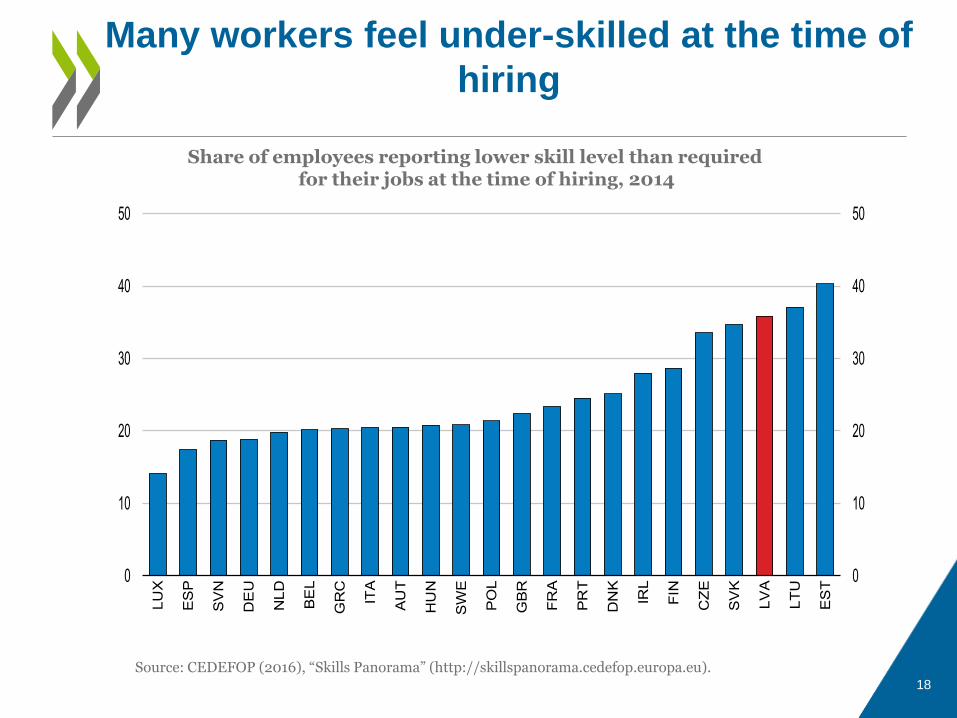
Many workers feel under-skilled at the time of
hiring
Source: CEDEFOP (2016), “Skills Panorama” (http://skillspanorama.cedefop.europa.eu).
Share of employees reporting lower skill level than required for their jobs at the time of hiring, 2014
0
10
20
30
40
50
0
10
20
30
40
50
LU
X
ES
P
SV
N
DE
U
NL
D
BE
L
GR
C
ITA
AU
T
HU
N
SW
E
PO
L
GB
R
FR
A
PR
T
DN
K
IRL
FIN
CZ
E
SV
K
LV
A
LT
U
ES
T

19
Skill shortages are holding back participation
in global value chains
Source: CEDEFOP (2016), “Skills Panorama” (http://skillspanorama.cedefop.europa.eu).
0
3
6
9
12
15
0
3
6
9
12
15
LUX
PR
T
DE
U
AU
T
ITA
ES
P
GB
R
SV
N
NLD
FR
A
DN
K
BE
L
PO
L
HU
N
GR
C
SW
E
IRL
SV
K
CZ
E
FIN
LVA
LTU
ES
T
%%
Share of employees reporting lower skill level than required for their current jobs, 2014
20
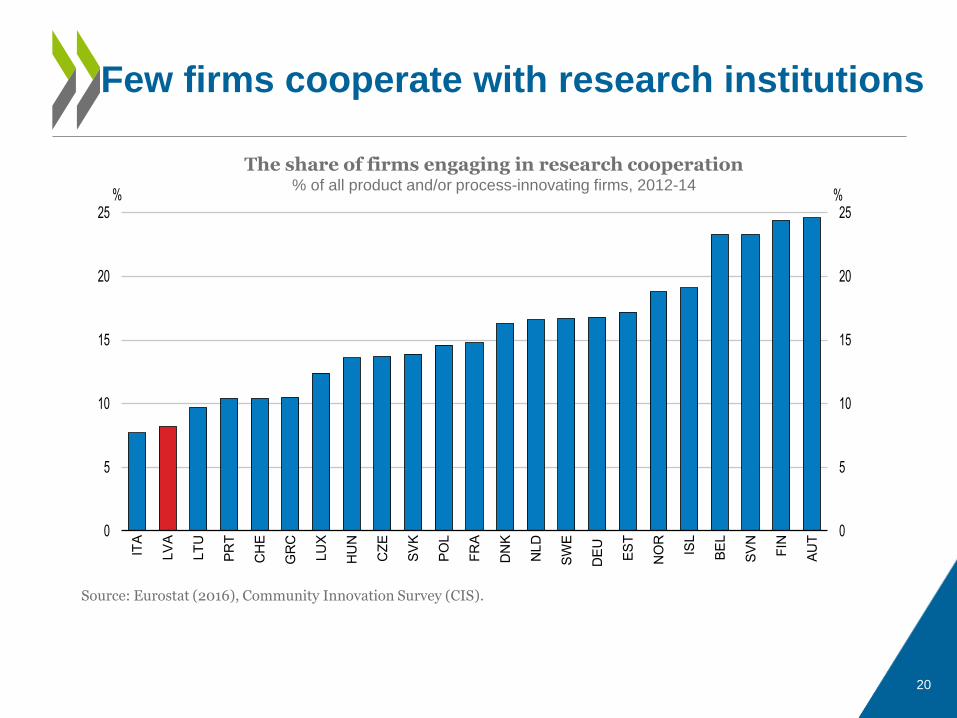
Few firms cooperate with research institutions
0
5
10
15
20
25
0
5
10
15
20
25
ITA
LV
A
LT
U
PR
T
CH
E
GR
C
LU
X
HU
N
CZ
E
SV
K
PO
L
FR
A
DN
K
NL
D
SW
E
DE
U
ES
T
NO
R
ISL
BE
L
SV
N
FIN
AU
T
%%
Source: Eurostat (2016), Community Innovation Survey (CIS).
The share of firms engaging in research cooperation % of all product and/or process-innovating firms, 2012-14

21
Low debt recovery hampers access to credit
0
20
40
60
80
100
0
20
40
60
80
100
TU
R
CH
L
GR
C
ES
T
HU
N
LUX
CH
E
LVA
SV
K
PO
L
ISR
ITA
CZ
E
ME
X
OE
CD
PR
T
SW
E
ES
P
FR
A
US
A
AU
S
AU
T
NZ
L
DE
U
KO
R
ISL
CA
N
IRL
DN
K
GB
R
SV
N
NL
D
BE
L
FIN
JPN
NO
R
%%
Source: World Bank (2017), Doing Business 2016: Measuring Regulatory Quality and Efficiency (Resolving insolvency database).
Average recovery rate from insolvency , 2016

22
Infrastructure lags behind peer countries
Global Competitiveness Index, scale from 1 to 7 (best)2016-17
0
1
2
3
4
5
6
7
0
1
2
3
4
5
6
7
Latvia Estonia Lithuania Finland
Source: World Economic Forum, "The Global Competitiveness Report 2016-2017".

23
Provide more generous grants for students attending vocational schools who are from low-income families.
Expand grants for university students and target them to students from low-income families.
Increase government funding of innovation promotion programmes with strong evaluation results.
Strengthen the specialisation of judges to improve the insolvency regime.
Apply the same cost-benefit tests to large national infrastructure projects as are applied to EU-funded projects.
Recommendations to seize opportunities in global
markets to catch up with high-income countries
24
Improving access to jobs, housing, and health services
25
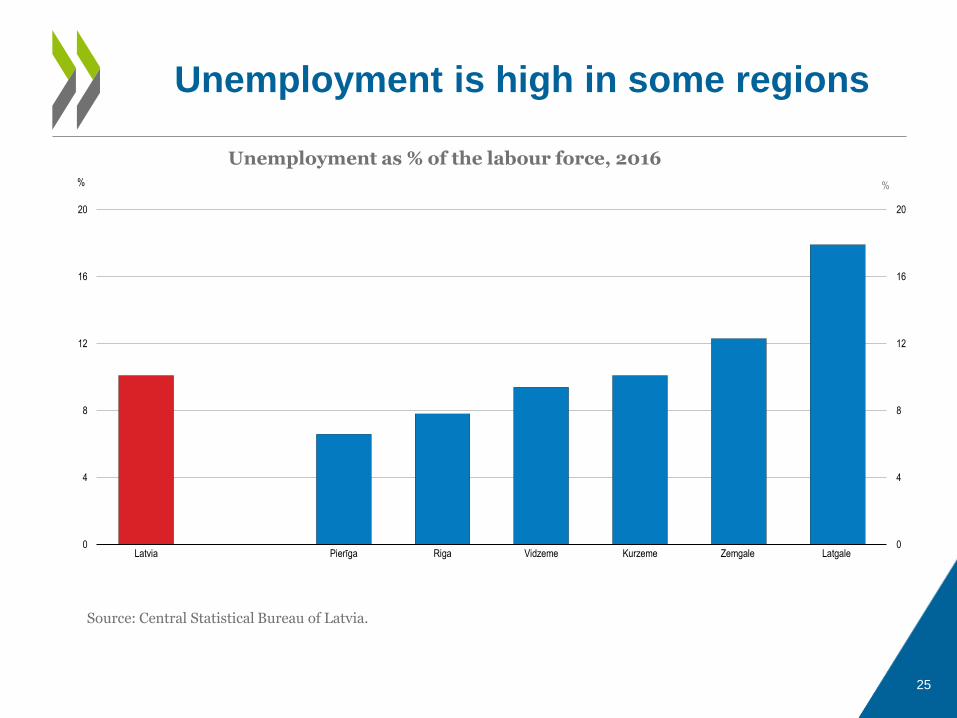
Unemployment is high in some regions
Source: Central Statistical Bureau of Latvia.
0
4
8
12
16
20
0
4
8
12
16
20
Latvia Pierīga Riga Vidzeme Kurzeme Zemgale Latgale
%%
Unemployment as % of the labour force, 2016

26
High unemployment keeps poverty high
Source: Central Statistical Bureau of Latvia.
0
9
18
27
36
45
0
9
18
27
36
45
Latvia Riga Pierīga Kurzeme Zemgale Vidzeme Latgale
%% Share of population with disposable income below 60% of median household income

27
Access to affordable rental housing is low
0
10
20
30
40
50
60
70
80
0
10
20
30
40
50
60
70
80
LT
U
ME
X³
PO
L
ES
T
SV
K
HU
N
CH
L³
LV
A
SV
N
PR
T
GR
C
CZ
E
ITA
ES
P
NO
R
IRL
AU
S³
ISL
KO
R
GB
R
FIN
LU
X
FR
A
CA
N³
US
A³
BE
L
AU
T
CH
E
SW
E³
DN
K³
NL
D³
DE
U
%%
Rent (private)¹ Rent (subsidized)²
Share of rental housing, low-income households, 2014 or latest year
Source: OECD (2016), OECD Affordable Housing Database.

28
Spending on active labour market policies is
low
Source: OECD (2017), OECD Employment and Labour Market Statistics (database).
Public expenditure, % of GDP, 2015 or most recent
0.0
0.4
0.8
1.2
1.6
2.0
2.4
0.0
0.4
0.8
1.2
1.6
2.0
2.4
ME
X
US
A
JPN
LVA
ISR
CH
L
ES
T
SV
K
AU
S
GB
R
CA
N
SV
N
LTU
NZ
L
KO
R
CZ
E
PO
L
ITA
OE
CD
NO
R
PR
T
IRL
CH
E
ES
P
DE
U
LUX
BE
L
AU
T
NLD
HU
N
FIN
FR
A
SW
E
DN
K
29
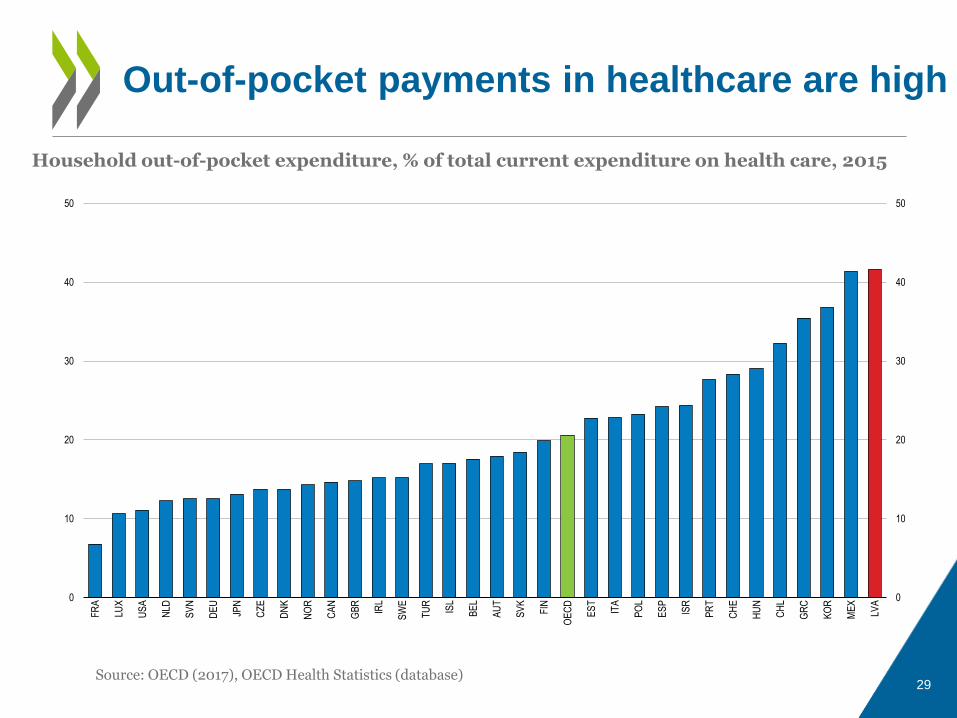
Out-of-pocket payments in healthcare are high
Source: OECD (2017), OECD Health Statistics (database)
0
10
20
30
40
50
0
10
20
30
40
50
FR
A
LUX
US
A
NLD
SV
N
DE
U
JPN
CZ
E
DN
K
NO
R
CA
N
GB
R
IRL
SW
E
TU
R
ISL
BE
L
AU
T
SV
K
FIN
OE
CD
ES
T
ITA
PO
L
ES
P
ISR
PR
T
CH
E
HU
N
CH
L
GR
C
KO
R
ME
X
LVA
Household out-of-pocket expenditure, % of total current expenditure on health care, 2015

30
Workers pay high fees for private pensions
0.0
0.4
0.8
1.2
1.6
2.0
0.0
0.4
0.8
1.2
1.6
2.0
FIN
DN
K
NL
D
LU
X
DE
U
GB
R¹
PR
T
ISL
NO
R
BE
L
AU
T
CA
N
ISR
NZ
L¹
HU
N
CH
E
CH
L¹
PO
L
AU
S
GR
C¹
TU
R¹
SV
K
SV
N
ES
P
CZ
E
ES
T
LV
A
% %
Operating costs of the private pension system% of assets under management, 2015
Source: OECD (2017), OECD Pensions Statistics (database).

31
Expand the mobility programme, which provides temporary support for relocation and transport to unemployed moving to a job.
Provide more funding for low-cost rented housing in areas of expanding employment.
Improve legal certainty in rental regulation and encourage out-of-court procedures.
Simplify the administrative process for obtaining a building permit.
Promote the provision of adult education by vocational education schools.
Lower operating costs in the compulsory private pension system, for example by introducing a low-cost fund as the default choice.
Reduce health care out-of-pocket payments especially for the low-income population.
Recommendations to improve access to jobs,
housing, and health services

32
Using budget and tax policy to support inclusive growth

Government debt is low
33
Source: OECD Economic Outlook 101 database. National Accounts definition of government debt (not Maastricht).
0
40
80
120
160
200
240
0
40
80
120
160
200
240
ES
T
LUX
NZ
L
NO
R
CH
E
KO
R
LVA
AU
S
CZ
E
DN
K
SW
E
LTU
SV
K
ISR
ISL
PO
L
NLD FIN
DE
U
IRL
HU
N
SV
N
CA
N
AU
T
US
A
OE
CD
ES
P
GB
R
FR
A
BE
L
PR
T
ITA
GR
C
JPN
General government debt % of GDP, 2016

34
Informality remains high
Source: Putniņš, T. and A. Sauka (2017), "Shadow Economy Index for the Baltic Countries", Stockholm School of Economics in Riga.
Estimated size of the shadow economy and underreported corporate profits and wages, 2016
35
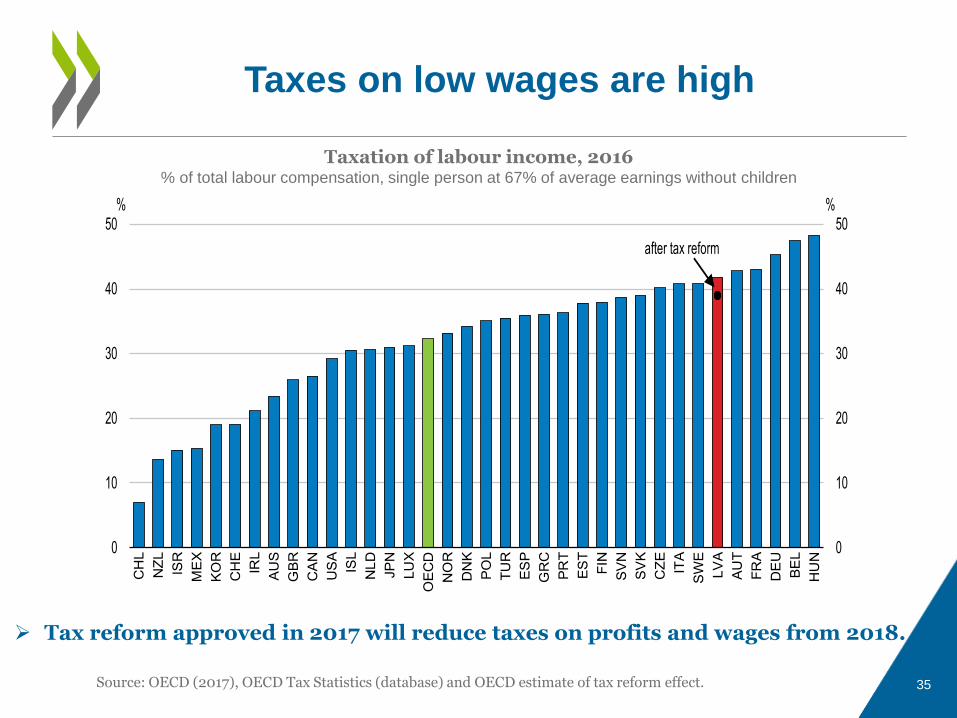
Taxes on low wages are high
Source: OECD (2017), OECD Tax Statistics (database) and OECD estimate of tax reform effect.
Taxation of labour income, 2016% of total labour compensation, single person at 67% of average earnings without children
0
10
20
30
40
50
0
10
20
30
40
50
CH
L
NZ
L
ISR
ME
X
KO
R
CH
E
IRL
AU
S
GB
R
CA
N
US
A
ISL
NL
D
JP
N
LU
X
OE
CD
NO
R
DN
K
PO
L
TU
R
ES
P
GR
C
PR
T
ES
T
FIN
SV
N
SV
K
CZ
E
ITA
SW
E
LV
A
AU
T
FR
A
DE
U
BE
L
HU
N
%%
after tax reform
Tax reform approved in 2017 will reduce taxes on profits and wages from 2018.

36
Raise spending to address pressing structural and social policy priorities.
Make better use of information and communication technology for tax law enforcement.
Strengthen the budgetary independence of the Corruption Prevention and Combating Bureau (KNAB).
Remove political influence in the appointment of judges.
Reduce taxes on low wages further.
Raise more revenues from the taxation of real estate and energy.
Broaden the base of business income taxation by removing tax exemptions.
Recommendations for budget and tax policy to
support inclusive growth

37
For more information
http://www.oecd.org/eco/surveys/economic-survey-latvia.htm
OECD
OECD Economics
Disclaimers:
The statistical data for Israel are supplied by and under the responsibility of the relevant Israeli authorities. The use of such data by the OECD is without
prejudice to the status of the Golan Heights, East Jerusalem and Israeli settlements in the West Bank under the terms of international law.
This document and any map included herein are without prejudice to the status of or sovereignty over any territory, to the delimitation of international frontiers
and boundaries and to the name of any territory, city or area.