Embed Size (px)
Citation preview
Making SusanneTHE WORLD RECESSION SUSCEPTIBILITY ANALYSIS WEBTOOL
Aditya Gupta (2011009)
1
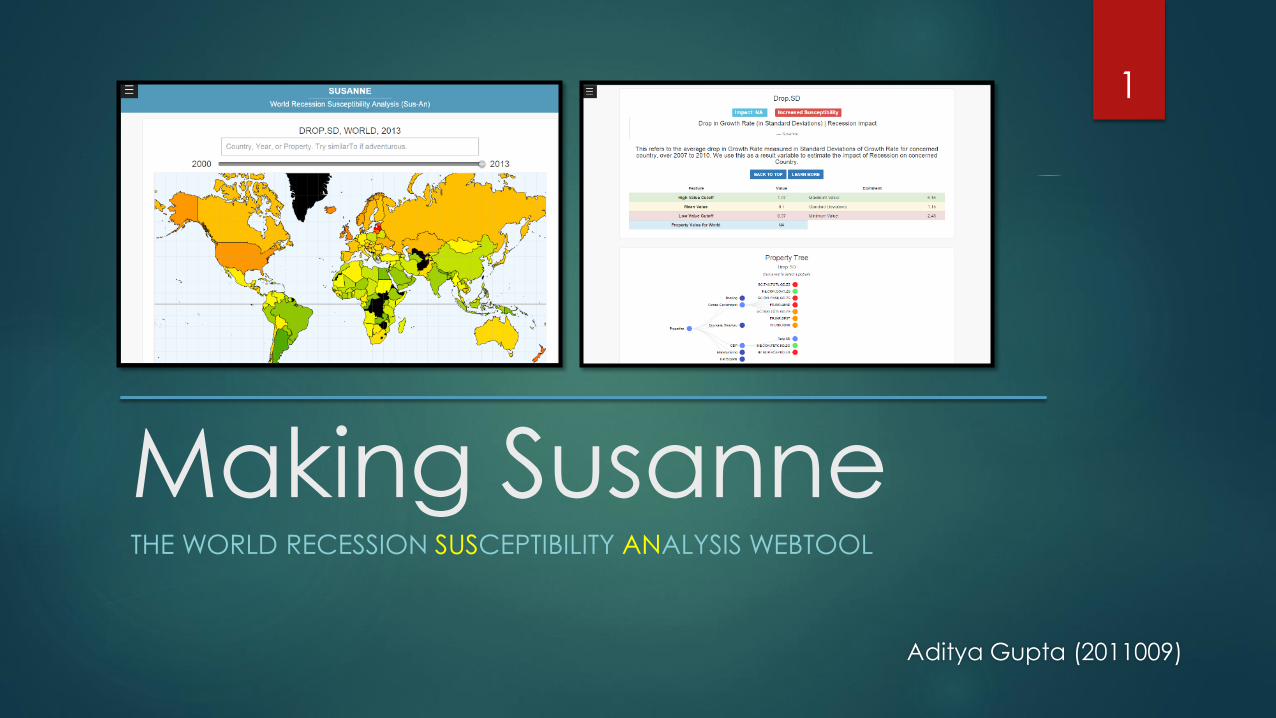
Overview
Objective and Motive
Process
Data
Data Collection
Data Cleanup
Dependent Variable
Analysis
Regression, Classification
Clustering and Results
Further Work
Presentation
Drawbacks
2
Objective
Key Questions
To study what economic
composition makes economies
more susceptible to
Global Recession
By how much? How significantly?
Can we predict recession impact?
Studying similarity of economies
How to quantify
Recession impact
Susceptibility
Key Goals
Empirically ascertain significance
and impact of certain economic
traits vis-à-vis expert opinions
Develop a powerful model to
predict recession susceptibility
Present a global and intuitive view
across parameters and their
significance, i.e., Susanne.
3
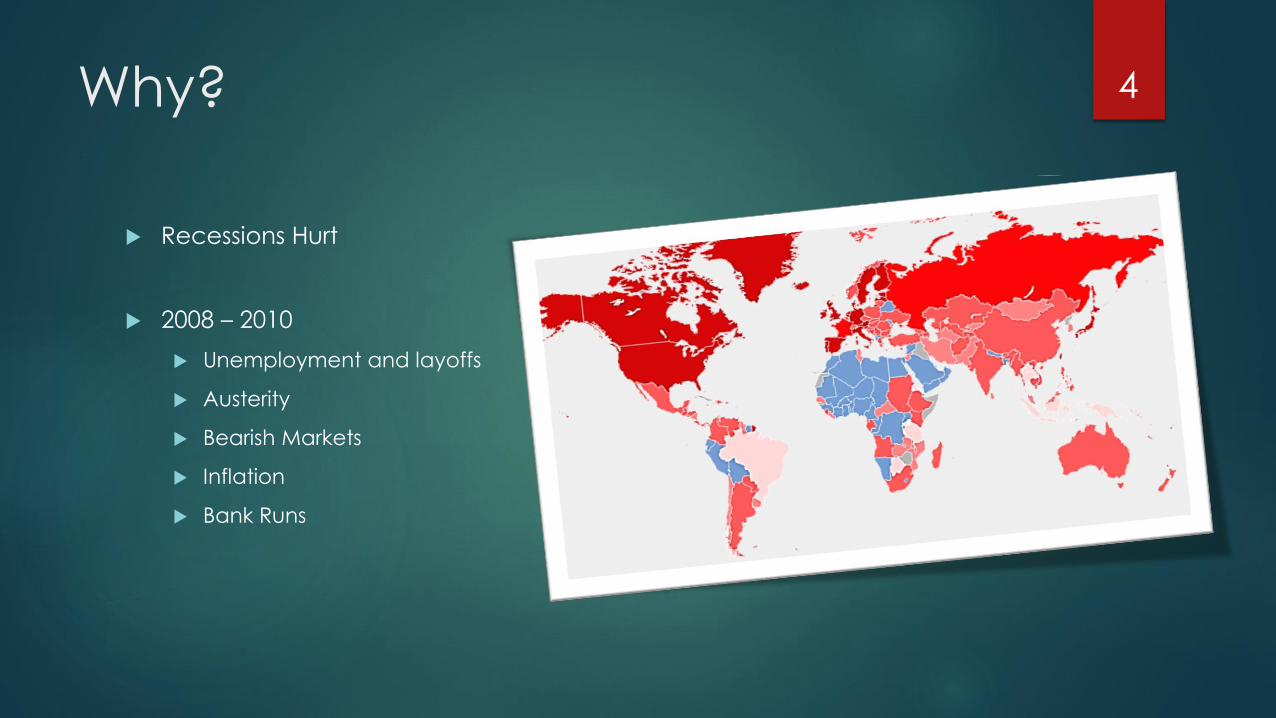
Why? 4
Recessions Hurt
2008 – 2010
Unemployment and layoffs
Austerity
Bearish Markets
Inflation
Bank Runs

DataA BIG PROBLEM IN ITSELF
5
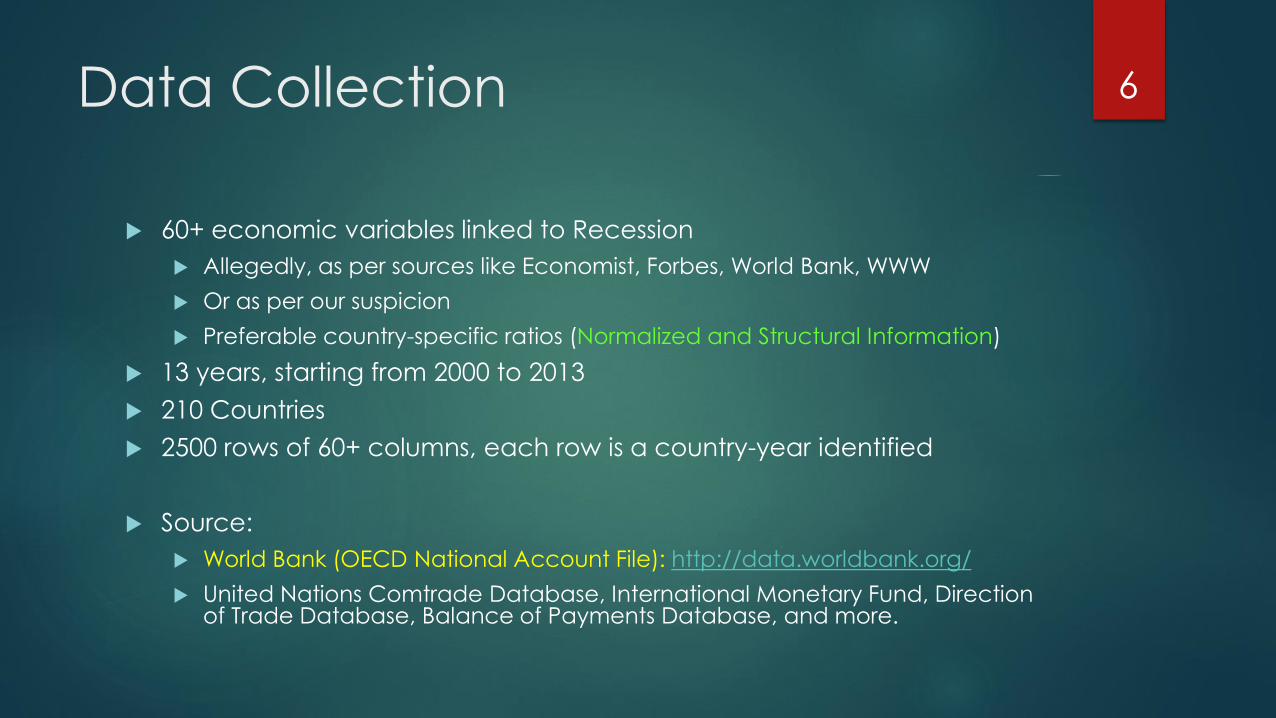
Data Collection
60+ economic variables linked to Recession
Allegedly, as per sources like Economist, Forbes, World Bank, WWW
Or as per our suspicion
Preferable country-specific ratios (Normalized and Structural Information)
13 years, starting from 2000 to 2013
210 Countries
2500 rows of 60+ columns, each row is a country-year identified
Source:
World Bank (OECD National Account File): http://data.worldbank.org/
United Nations Comtrade Database, International Monetary Fund, Direction of Trade Database, Balance of Payments Database, and more.
6
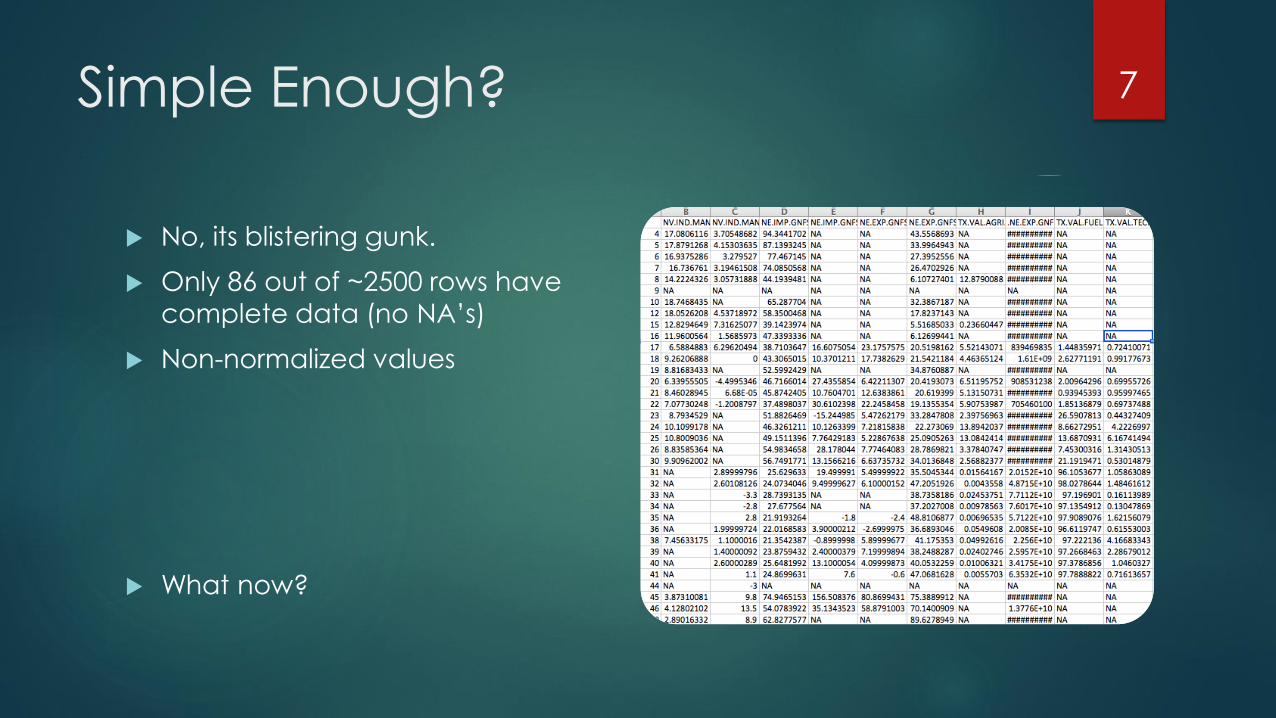
Simple Enough?
No, its blistering gunk.
Only 86 out of ~2500 rows have complete data (no NA’s)
Non-normalized values
What now?
7
Data Cleanup
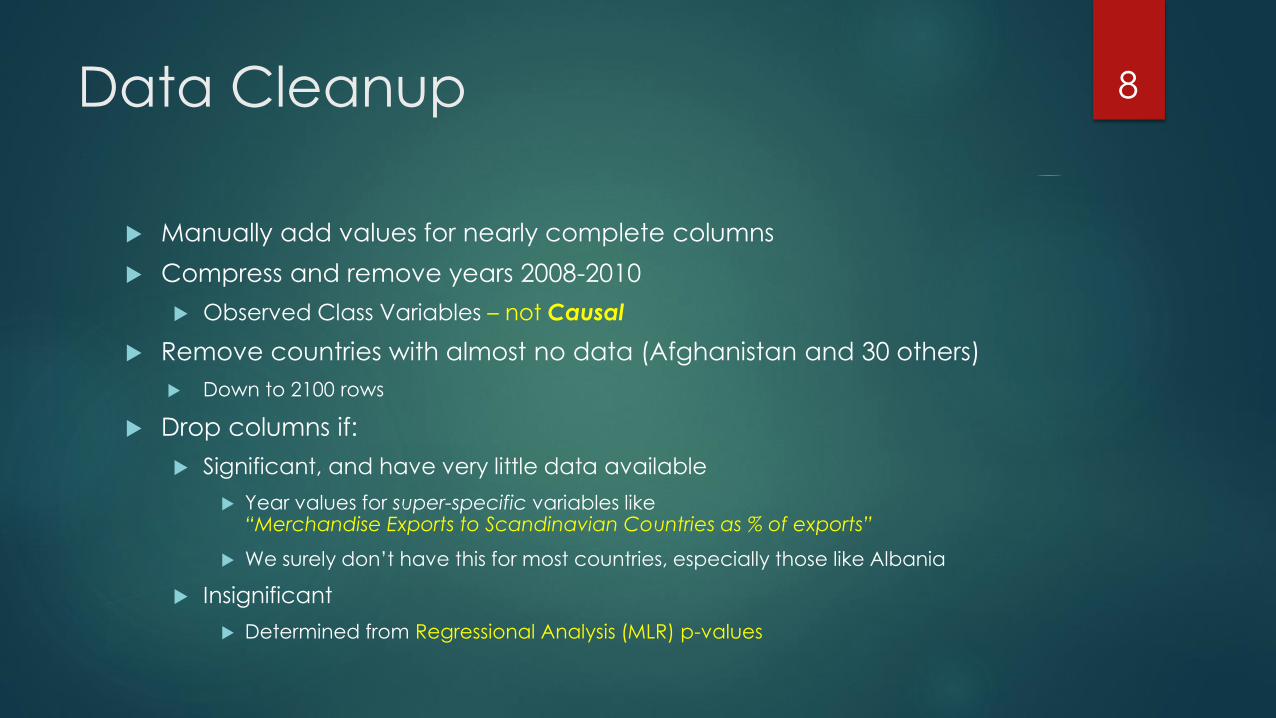
Manually add values for nearly complete columns
Compress and remove years 2008-2010
Observed Class Variables – not Causal
Remove countries with almost no data (Afghanistan and 30 others)
Down to 2100 rows
Drop columns if:
Significant, and have very little data available
Year values for super-specific variables like “Merchandise Exports to Scandinavian Countries as % of exports”
We surely don’t have this for most countries, especially those like Albania
Insignificant
Determined from Regressional Analysis (MLR) p-values
8
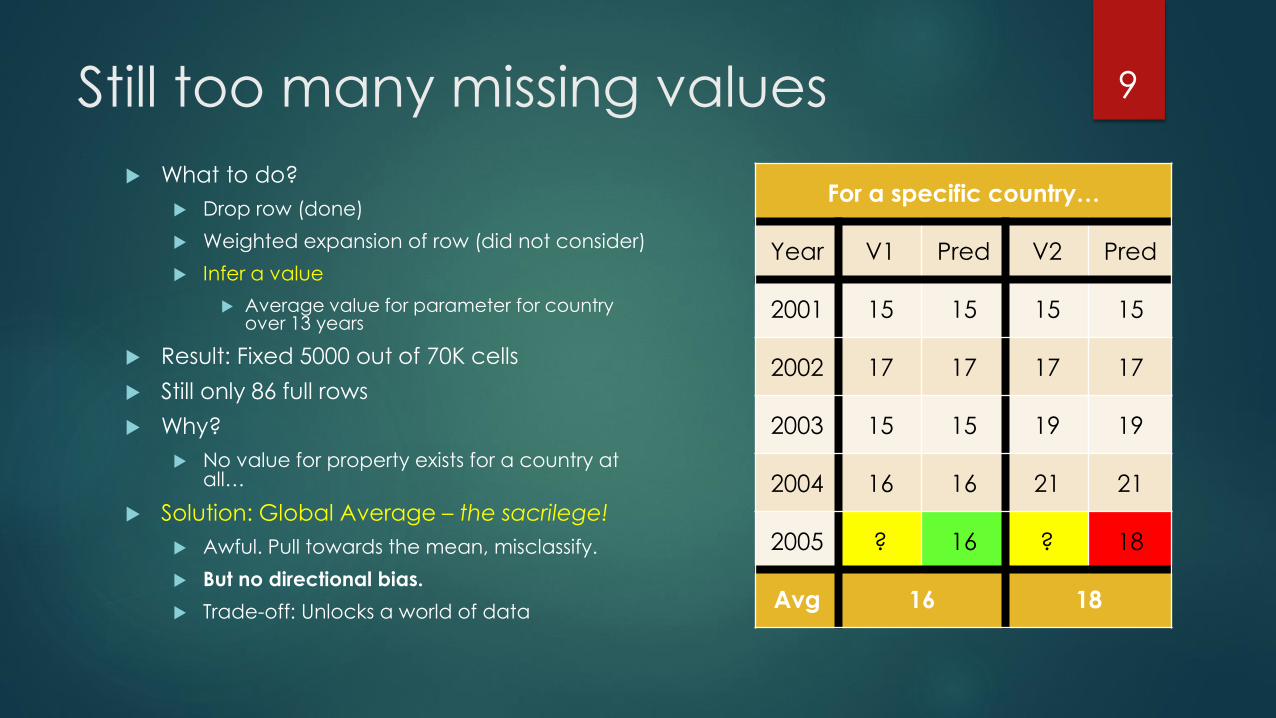
Still too many missing values
What to do?
Drop row (done)
Weighted expansion of row (did not consider)
Infer a value
Average value for parameter for country over 13 years
Result: Fixed 5000 out of 70K cells
Still only 86 full rows
Why?
No value for property exists for a country at all…
Solution: Global Average – the sacrilege!
Awful. Pull towards the mean, misclassify.
But no directional bias.
Trade-off: Unlocks a world of data
9
For a specific country…
Year V1 Pred V2 Pred
2001 15 15 15 15
2002 17 17 17 17
2003 15 15 19 19
2004 16 16 21 21
2005 ? 16 ? 18
Avg 16 18
Dependent Variable
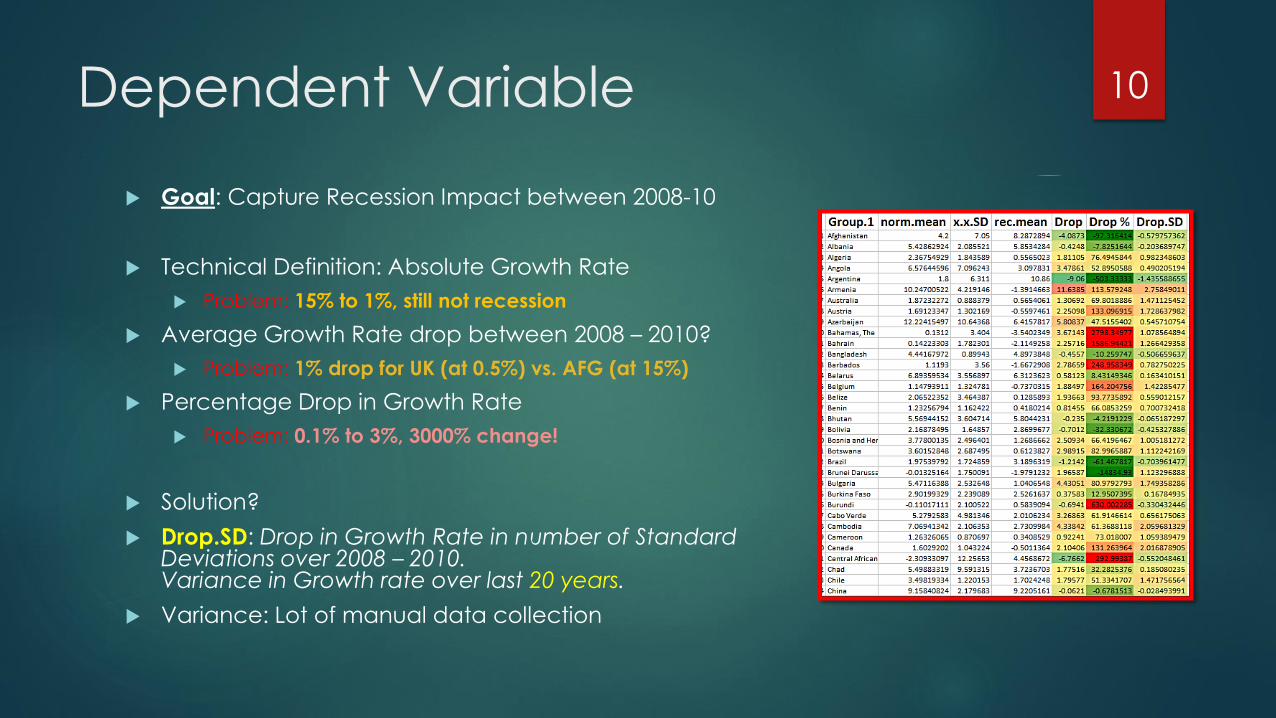
Goal: Capture Recession Impact between 2008-10
Technical Definition: Absolute Growth Rate
Problem: 15% to 1%, still not recession
Average Growth Rate drop between 2008 – 2010?
Problem: 1% drop for UK (at 0.5%) vs. AFG (at 15%)
Percentage Drop in Growth Rate
Problem: 0.1% to 3%, 3000% change!
Solution?
Drop.SD: Drop in Growth Rate in number of Standard Deviations over 2008 – 2010. Variance in Growth rate over last 20 years.
Variance: Lot of manual data collection
10
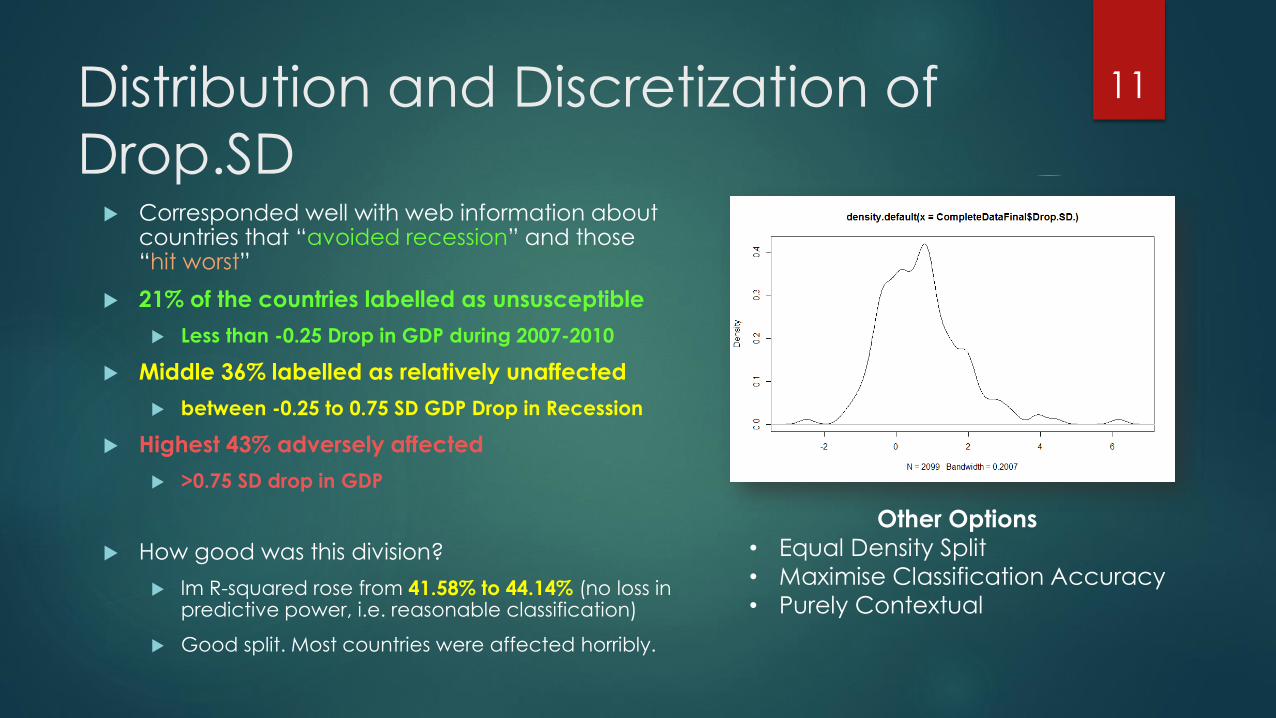
Distribution and Discretization of
Drop.SD Corresponded well with web information about
countries that “avoided recession” and those “hit worst”
21% of the countries labelled as unsusceptible
Less than -0.25 Drop in GDP during 2007-2010
Middle 36% labelled as relatively unaffected
between -0.25 to 0.75 SD GDP Drop in Recession
Highest 43% adversely affected
>0.75 SD drop in GDP
How good was this division?
lm R-squared rose from 41.58% to 44.14% (no loss in predictive power, i.e. reasonable classification)
Good split. Most countries were affected horribly.
11
Other Options
• Equal Density Split
• Maximise Classification Accuracy
• Purely Contextual

AnalysisAFTER WE FINALLY HAVE 2099 COMPLETE ROWS OF DATA
12
Classification: Can we predict
Recession Susceptibility?
Assumption (non trivial)
Drop.SD correctly represents Recession Impact in 08-10
Recession Impact in 08-10 correctly represents Recession Susceptibility
Can’t do better but guess a few things.
SVM has 92% accuracy. Seems like it.
Caveat:
Bootstrap Analysis: Training Data = Test Data
Workaround (can’t generate new countries or years):
5-Fold Cross Validation
13
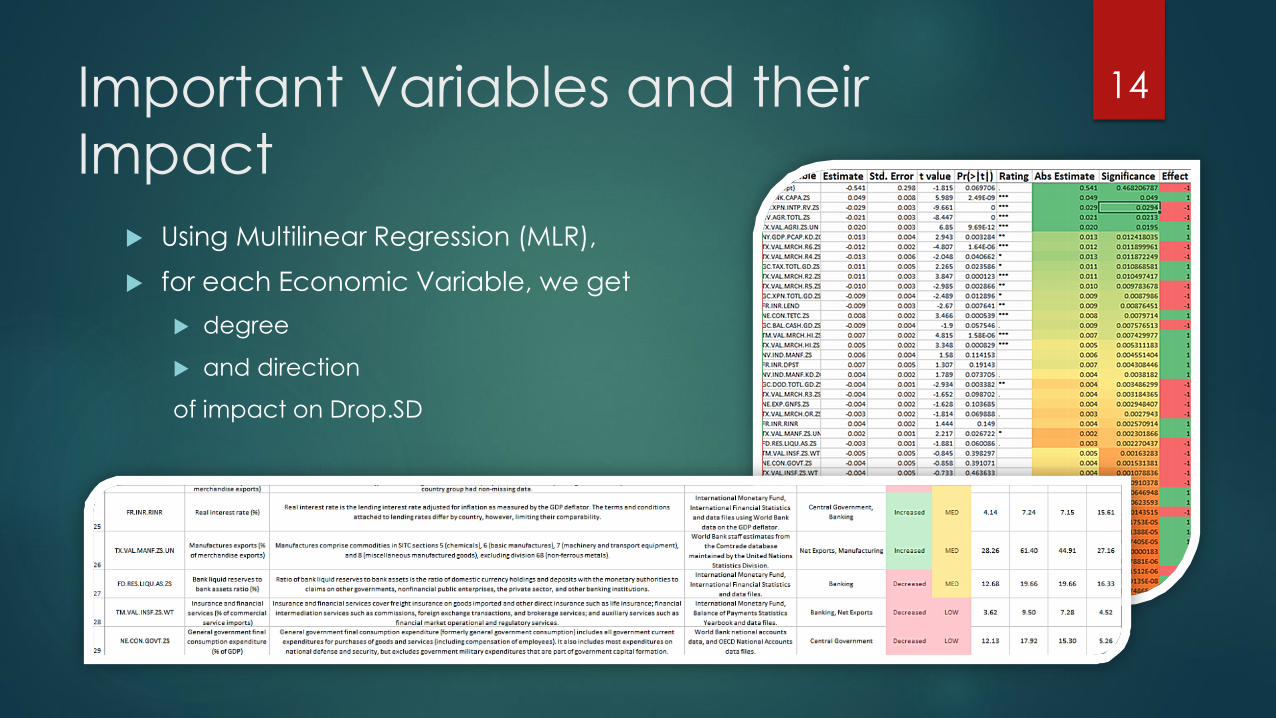
Important Variables and their
Impact
Using Multilinear Regression (MLR),
for each Economic Variable, we get
degree
and direction
of impact on Drop.SD
14

Clustering
Motivation:
“Are we brute-engineering a predictor, or is there an actual underlying economic structural pattern of recession-susceptibility?”
70% accuracy (consistent clusters)with k-means, using multiple k
values.
You decide.
15
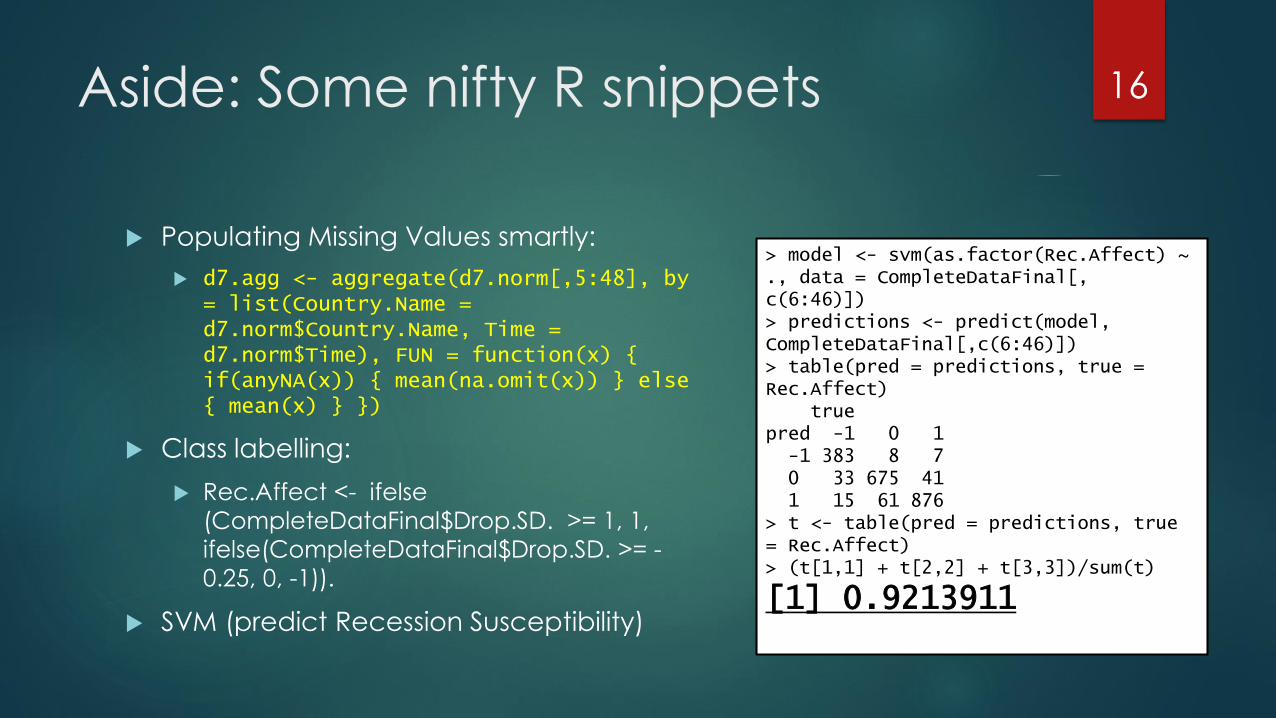
Aside: Some nifty R snippets
Populating Missing Values smartly:
d7.agg <- aggregate(d7.norm[,5:48], by = list(Country.Name = d7.norm$Country.Name, Time = d7.norm$Time), FUN = function(x) { if(anyNA(x)) { mean(na.omit(x)) } else { mean(x) } })
Class labelling:
Rec.Affect <- ifelse
(CompleteDataFinal$Drop.SD. >= 1, 1,
ifelse(CompleteDataFinal$Drop.SD. >= -
0.25, 0, -1)).
SVM (predict Recession Susceptibility)
16
> model <- svm(as.factor(Rec.Affect) ~ ., data = CompleteDataFinal[, c(6:46)])> predictions <- predict(model, CompleteDataFinal[,c(6:46)])> table(pred = predictions, true = Rec.Affect)
truepred -1 0 1-1 383 8 70 33 675 411 15 61 876
> t <- table(pred = predictions, true = Rec.Affect)> (t[1,1] + t[2,2] + t[3,3])/sum(t)
[1] 0.9213911
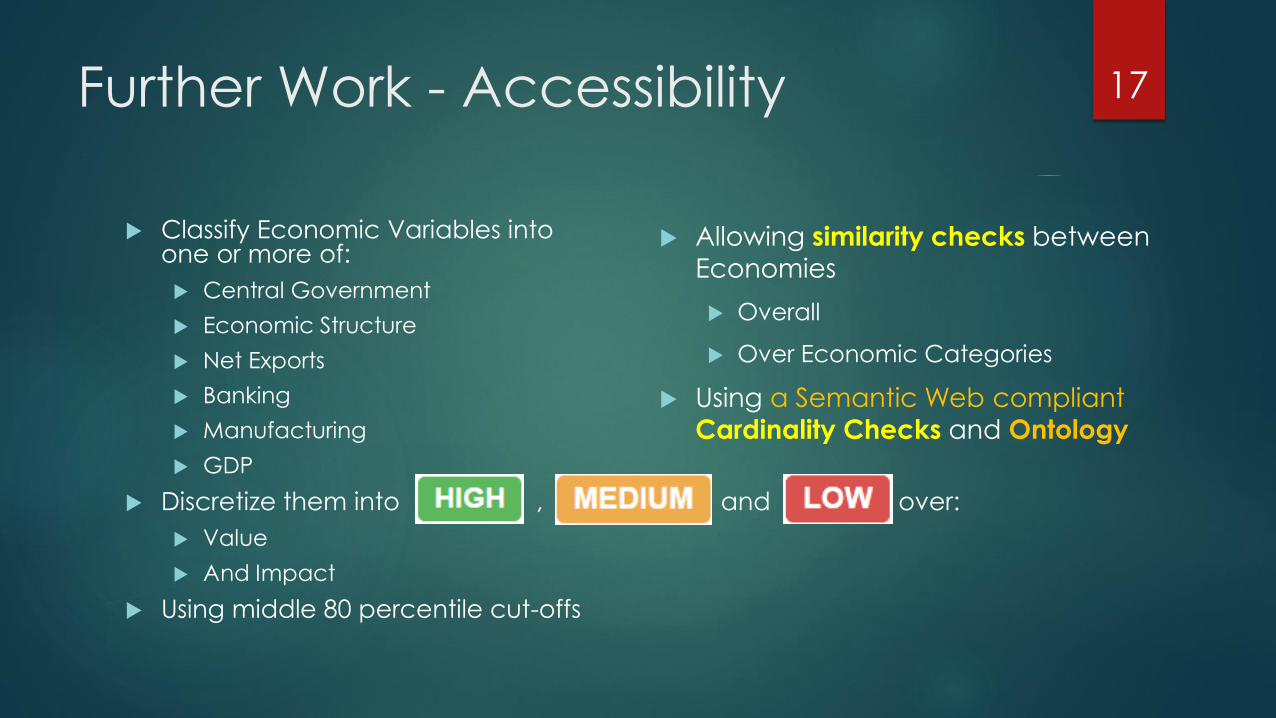
Allowing similarity checks between
Economies
Overall
Over Economic Categories
Using a Semantic Web compliant
Cardinality Checks and Ontology
Classify Economic Variables intoone or more of:
Central Government
Economic Structure
Net Exports
Banking
Manufacturing
GDP
Discretize them into , and over:
Value
And Impact
Using middle 80 percentile cut-offs
Further Work - Accessibility 17

Presentation THE WEBTOOL, I.E, SUSANNE
18
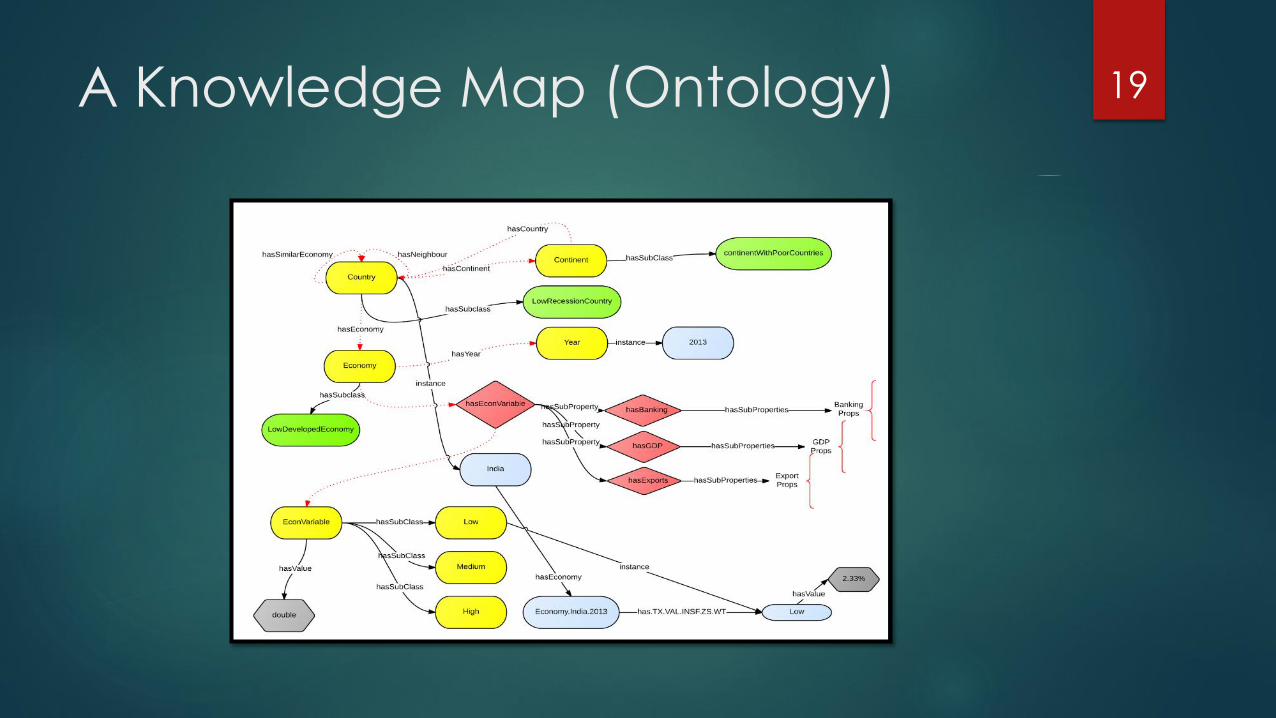
A Knowledge Map (Ontology) 19
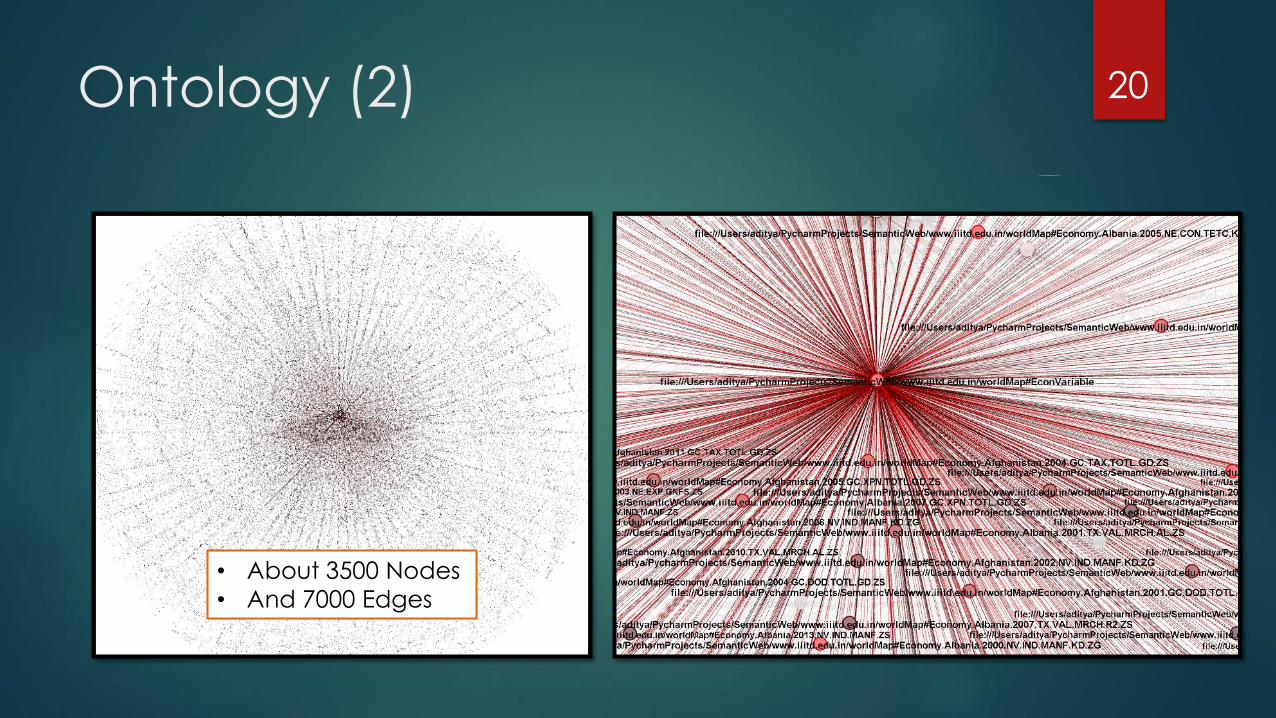
Ontology (2) 20
• About 3500 Nodes
• And 7000 Edges
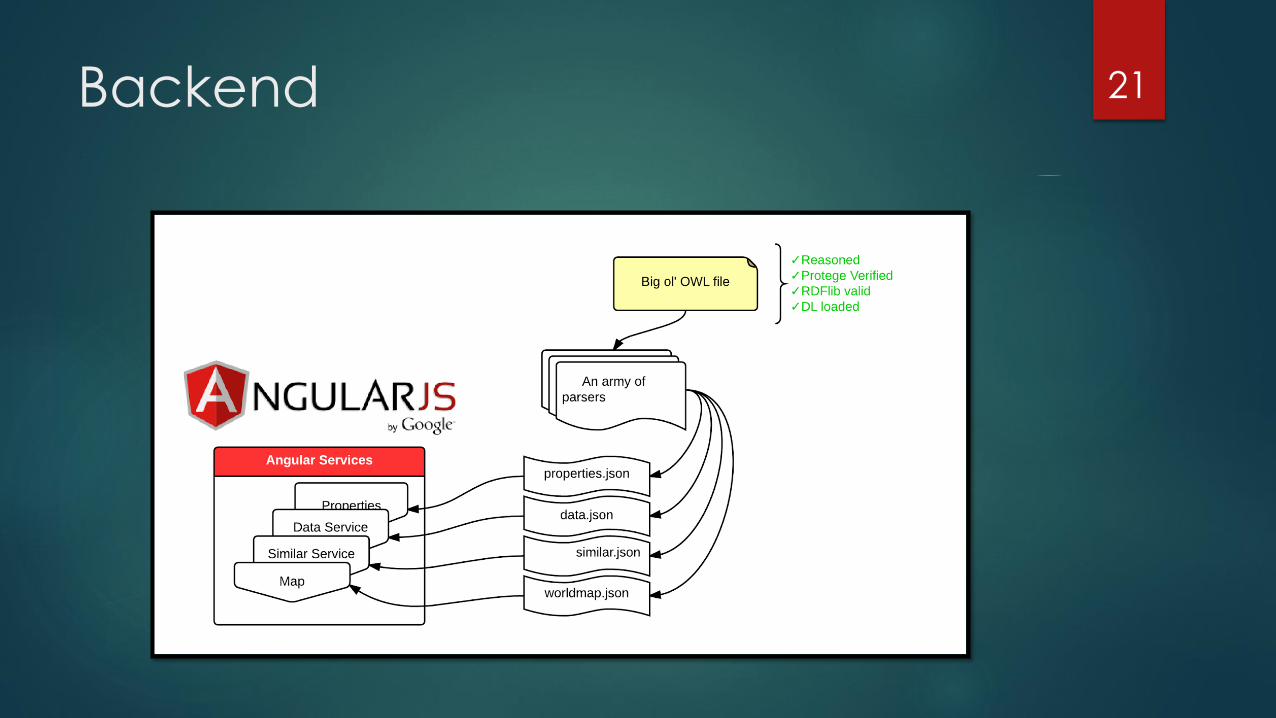
Backend 21
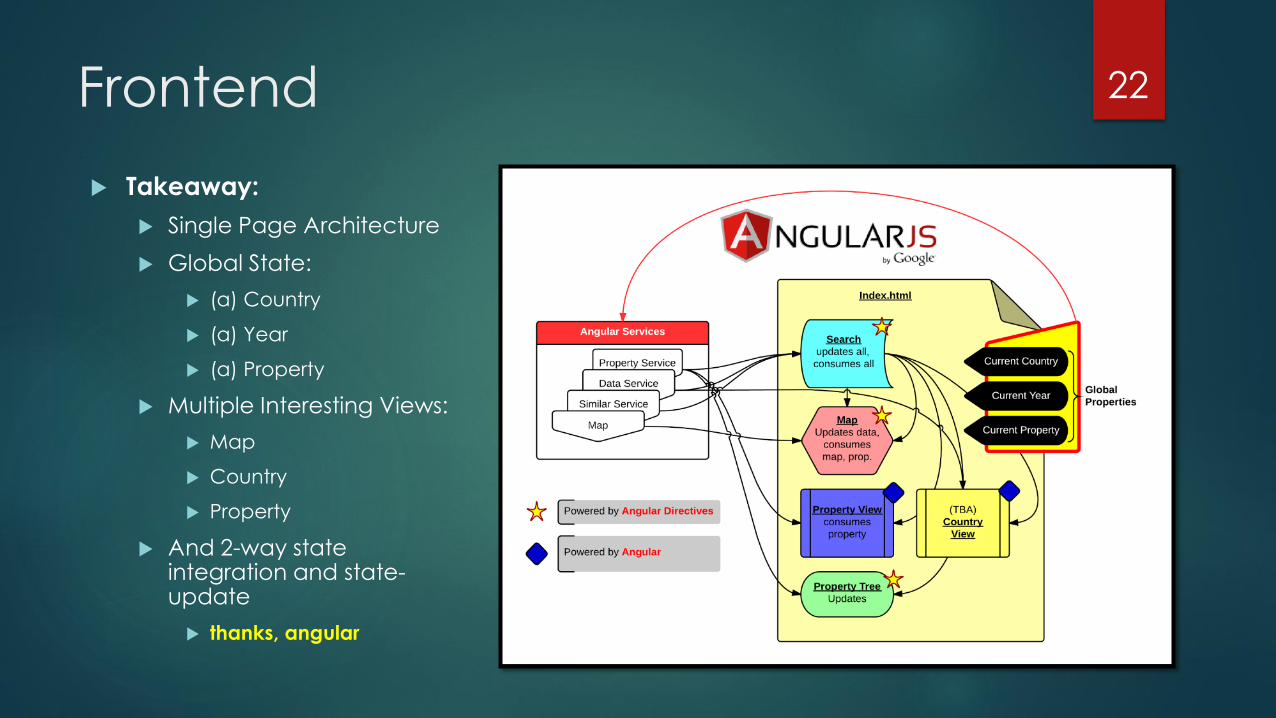
Frontend 22
Takeaway:
Single Page Architecture
Global State:
(a) Country
(a) Year
(a) Property
Multiple Interesting Views:
Map
Country
Property
And 2-way state integration and state-update
thanks, angular
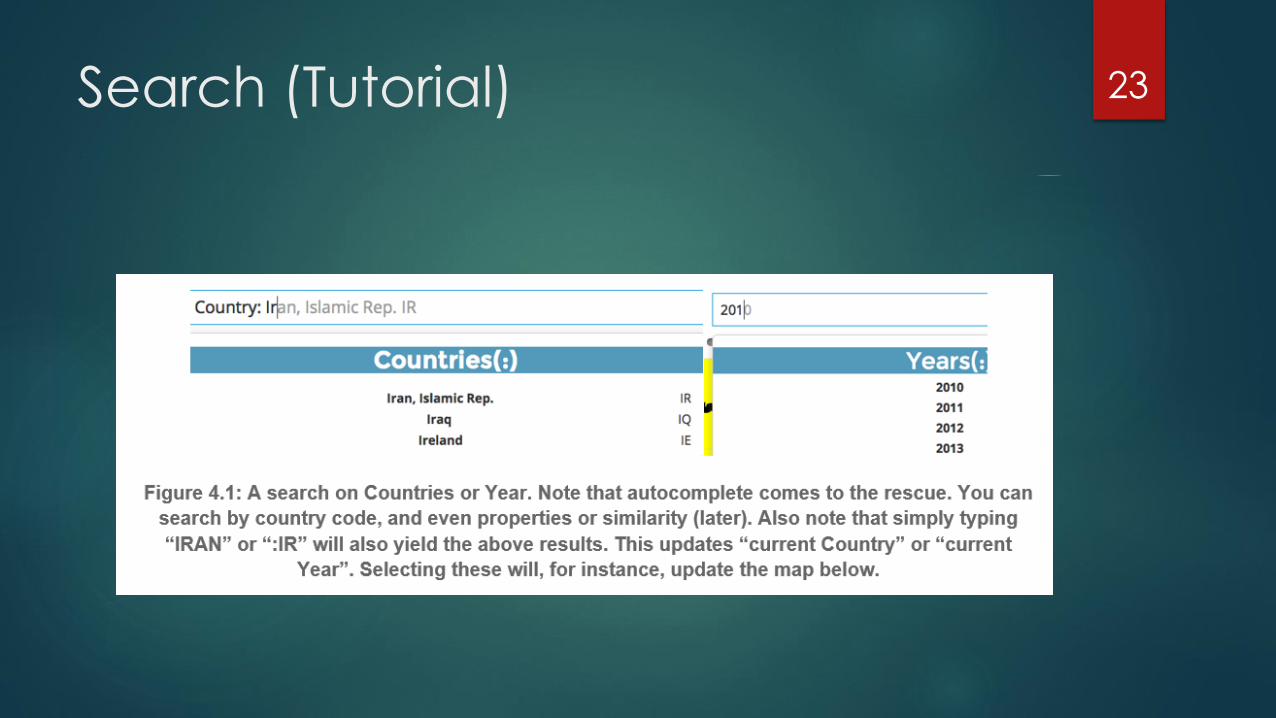
Search (Tutorial) 23
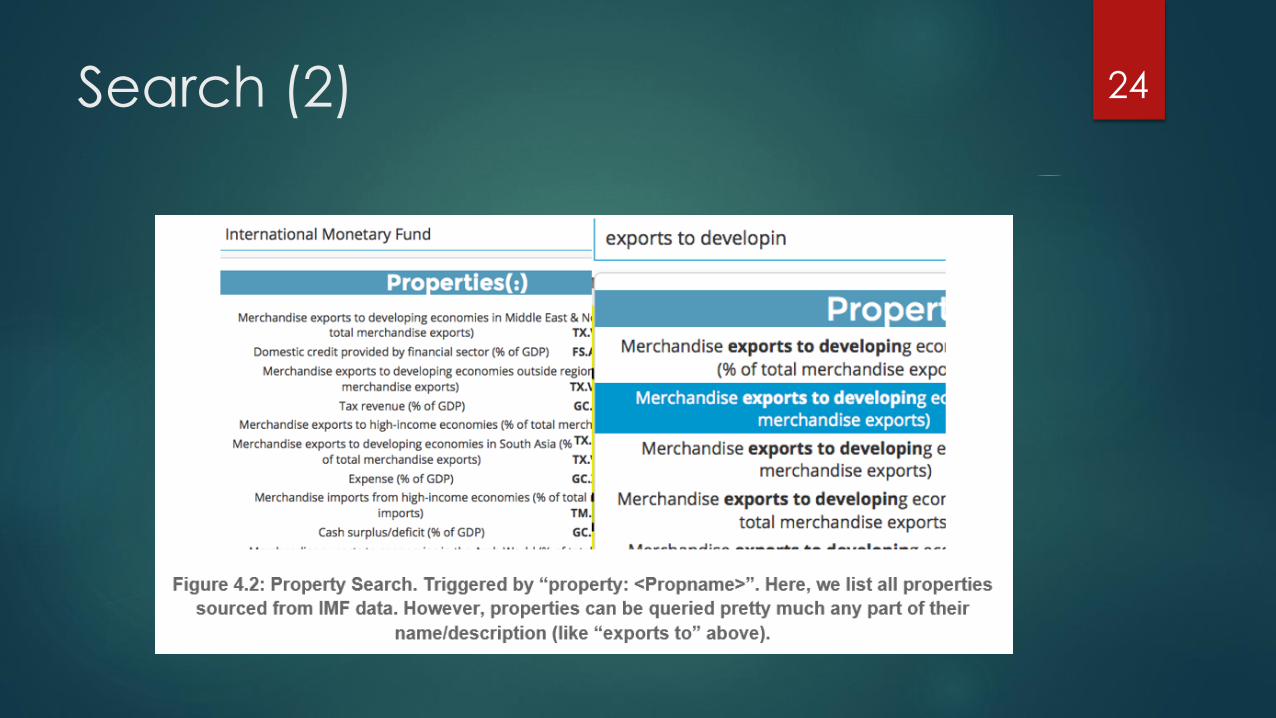
Search (2) 24
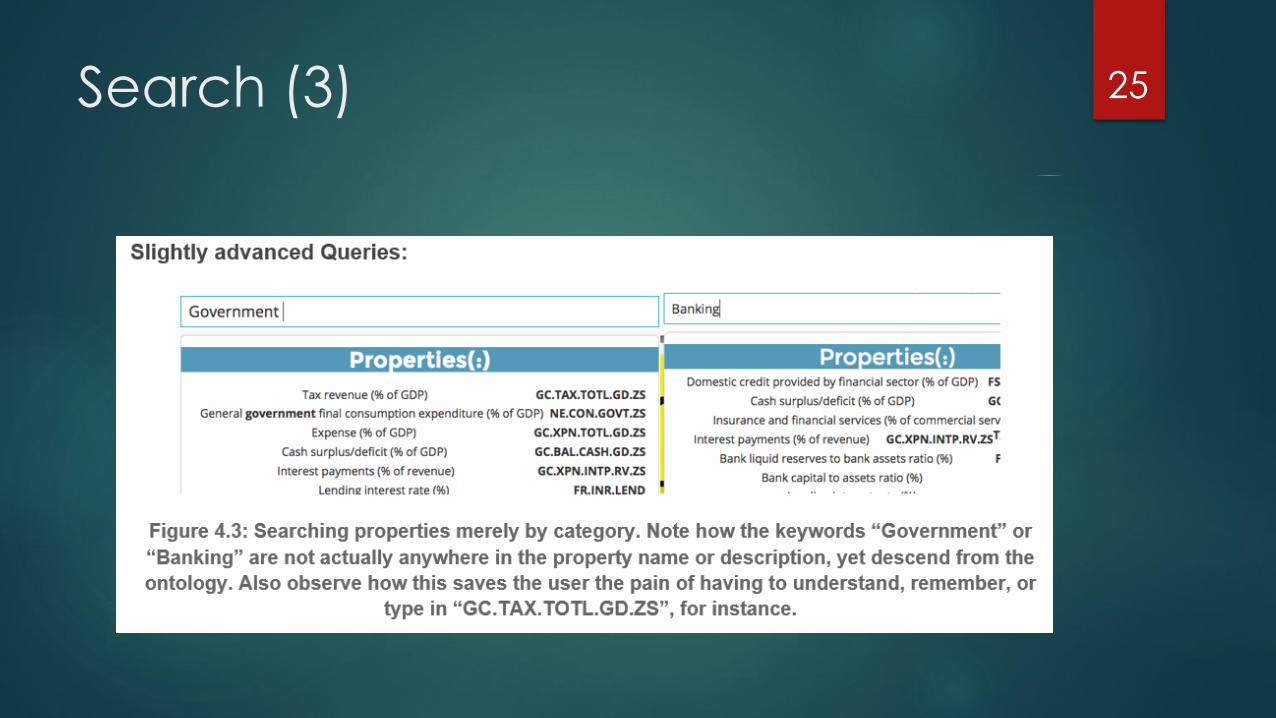
Search (3) 25
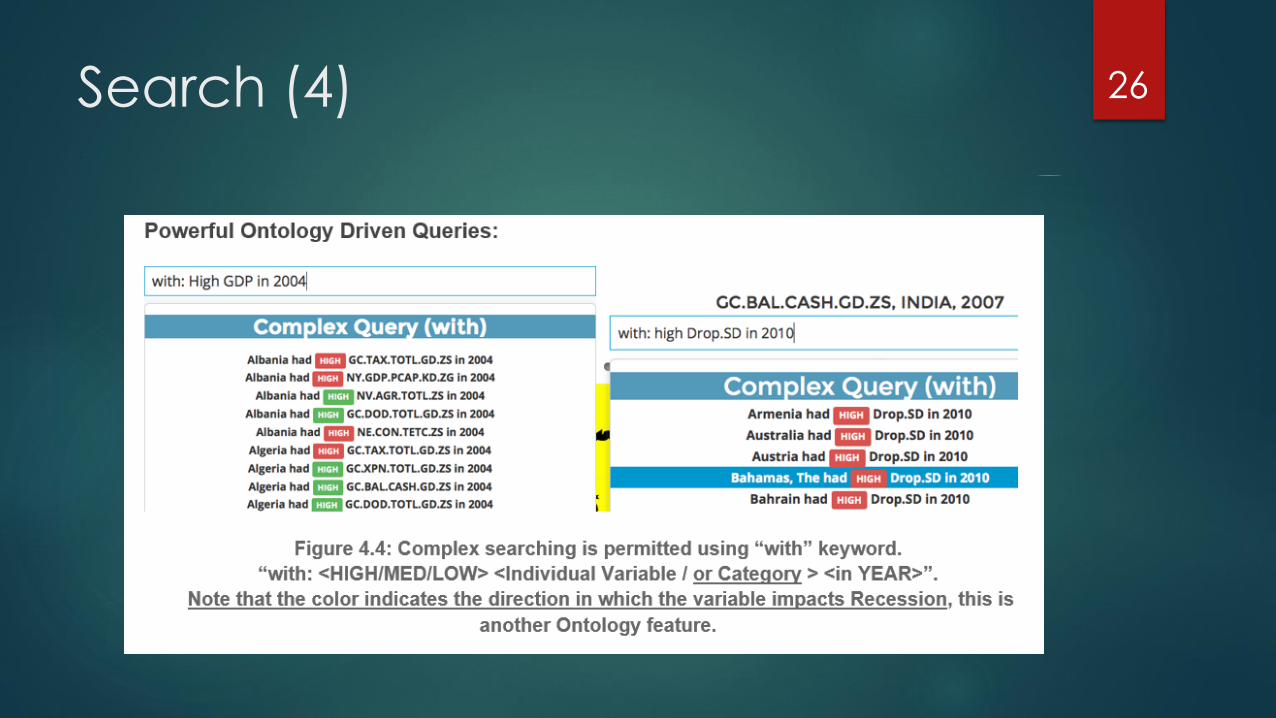
Search (4) 26
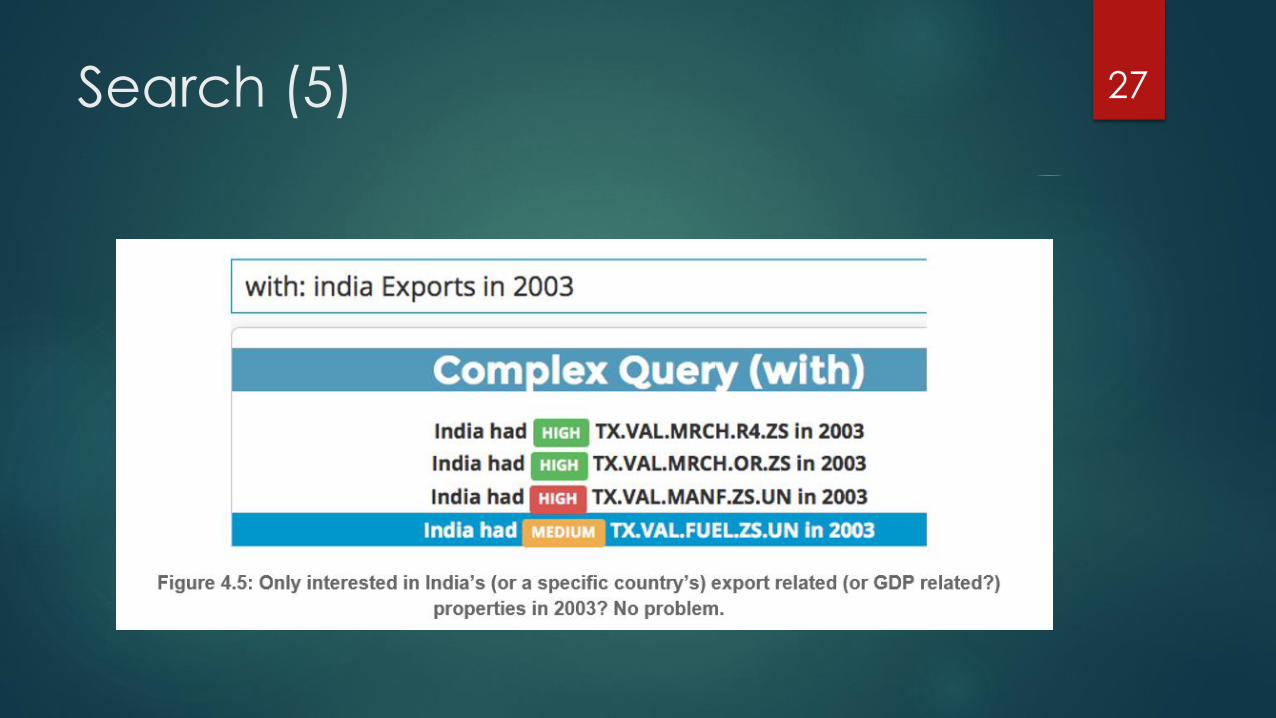
Search (5) 27
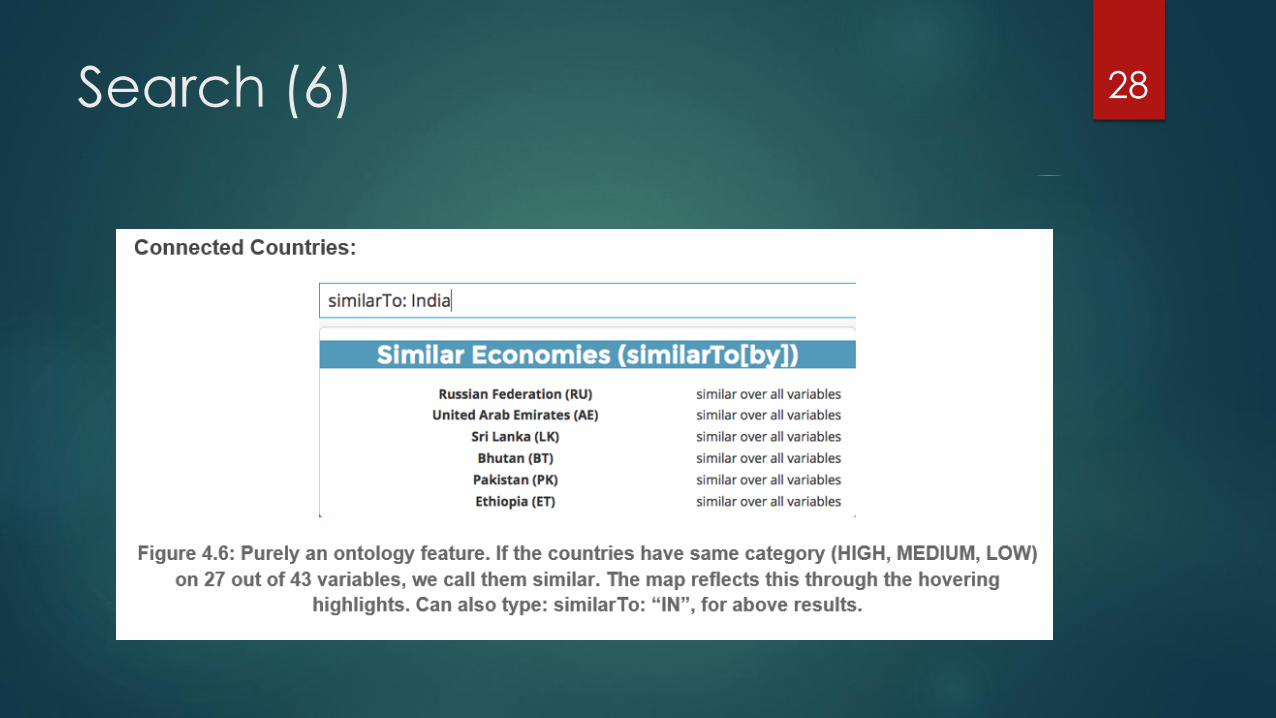
Search (6) 28
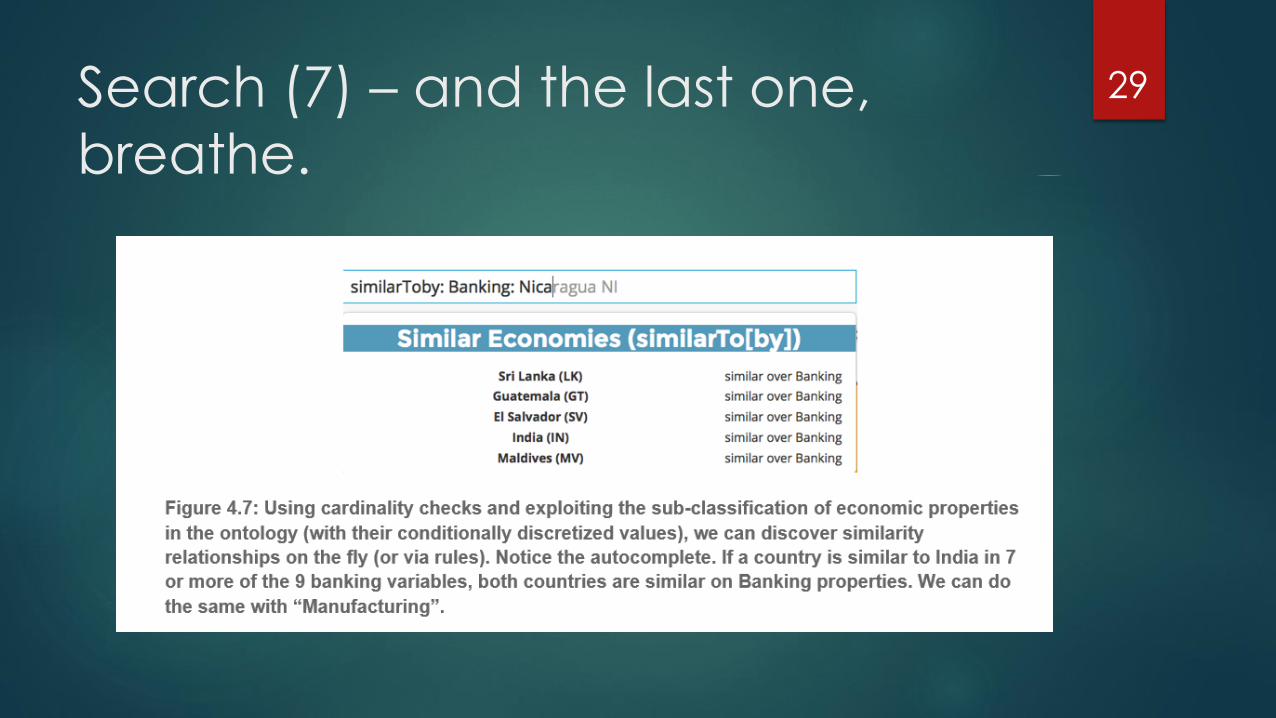
Search (7) – and the last one,
breathe.
29

Thank YouSincerely
31