Embed Size (px)
Citation preview
1
UNITED STATES SECURITIES AND EXCHANGE COMMISSION
Washington, D.C. 20549
FORM 10-K ⌧ ANNUAL REPORT PURSUANT TO SECTION 13 OR 15(d) OF THE SECURITIES
EXCHANGE ACT OF 1934
For the Fiscal Year Ended December 31, 2004
OR
TRANSITION REPORT PURSUANT TO SECTION 13 OR 15(d) OF THE SECURITIES AND EXCHANGE ACT OF 1934
Commission File No. 1-13881
MARRIOTT INTERNATIONAL, INC. (Exact name of registrant as specified in its charter)
Delaware 52-2055918 (State of Incorporation) (IRS Employer Identification Number) 10400 Fernwood Road, Bethesda, Maryland 20817 (Address of Principal Executive Offices) (Zip Code)
Registrant’s Telephone Number, Including Area Code (301) 380-3000
Securities registered pursuant to Section 12(b) of the Act:
Title of Each Class Name of Each Exchange on Which Registered Class A Common Stock, $0.01 par value
(225,768,576 shares outstanding as of February 10, 2005) New York Stock Exchange Chicago Stock Exchange Pacific Stock Exchange
Philadelphia Stock Exchange
Securities registered pursuant to Section 12(g) of the Act: NONE
Indicate by check mark whether the registrant: (1) has filed all reports required to be filed by Section 13 or 15(d) of the Securities Exchange Act of 1934 during the preceding 12 months (or for such shorter period that the registrant was required to file such reports), and (2) has been subject to such filing requirements for the past 90 days.
Yes ⌧ No
Indicate by check mark if disclosure by delinquent filers pursuant to Item 405 of Regulation S-K is not contained herein, and will not be contained, to the best of the registrant’s knowledge, in definitive proxy or information statements incorporated by reference in Part III of this Form 10-K or any amendment to this Form 10-K.
Indicate by checkmark whether the registrant is an accelerated filer (as defined in Exchange Act Rule 12b-2).
Yes ⌧ No
The aggregate market value of shares of common stock held by non-affiliates at June 18, 2004, was $8,908,154,899.
DOCUMENTS INCORPORATED BY REFERENCE
Portions of the Proxy Statement prepared for the 2005 Annual Meeting of Shareholders are incorporated by reference into Part III of this report.
Final Filed with SEC:
February 23, 2005
2
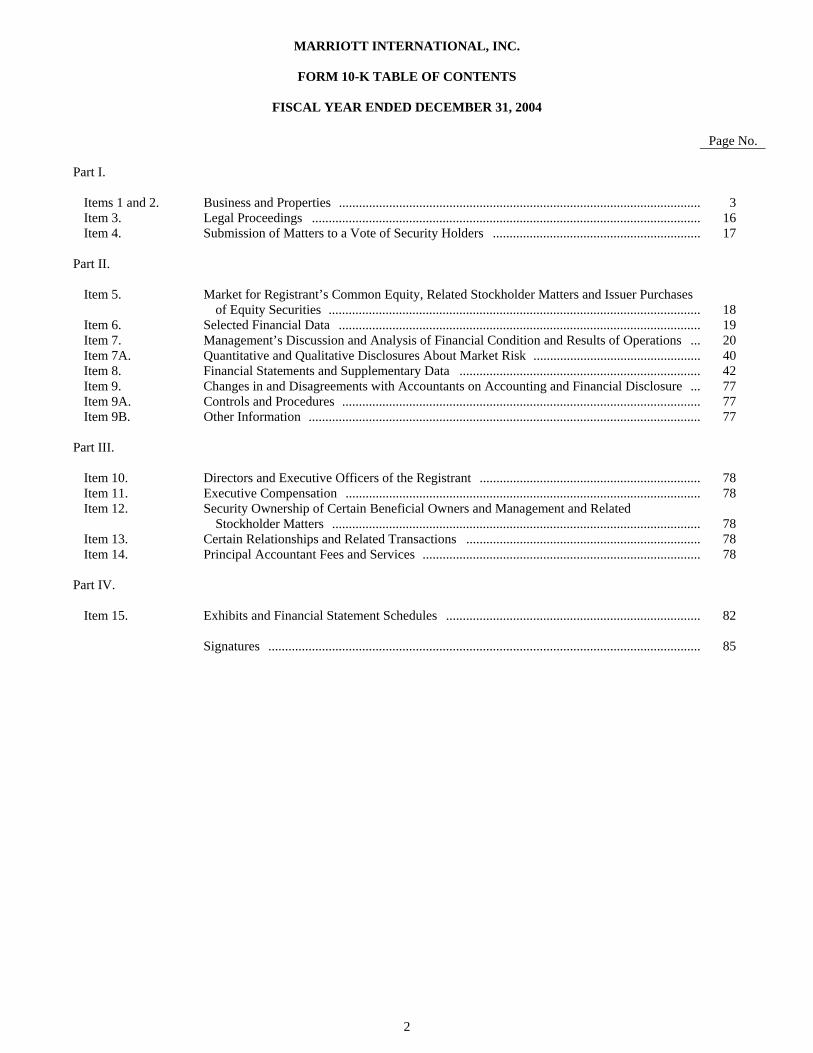
MARRIOTT INTERNATIONAL, INC.
FORM 10-K TABLE OF CONTENTS
FISCAL YEAR ENDED DECEMBER 31, 2004
Page No. Part I.
Items 1 and 2. Business and Properties ............................................................................................................ 3 Item 3. Legal Proceedings .................................................................................................................... 16 Item 4. Submission of Matters to a Vote of Security Holders .............................................................. 17
Part II.
Item 5. Market for Registrant’s Common Equity, Related Stockholder Matters and Issuer Purchases
of Equity Securities ............................................................................................................... 18
Item 6. Selected Financial Data ............................................................................................................ 19 Item 7. Management’s Discussion and Analysis of Financial Condition and Results of Operations ... 20 Item 7A. Quantitative and Qualitative Disclosures About Market Risk .................................................. 40 Item 8. Financial Statements and Supplementary Data ........................................................................ 42 Item 9. Changes in and Disagreements with Accountants on Accounting and Financial Disclosure ... 77 Item 9A. Controls and Procedures ........................................................................................................... 77 Item 9B. Other Information ..................................................................................................................... 77
Part III.
Item 10. Directors and Executive Officers of the Registrant .................................................................. 78 Item 11. Executive Compensation .......................................................................................................... 78 Item 12. Security Ownership of Certain Beneficial Owners and Management and Related
Stockholder Matters .............................................................................................................. 78
Item 13. Certain Relationships and Related Transactions ...................................................................... 78 Item 14. Principal Accountant Fees and Services ................................................................................... 78
Part IV. Item 15. Exhibits and Financial Statement Schedules ............................................................................ 82
Signatures ................................................................................................................................. 85
3
Throughout this report, we refer to Marriott International, Inc., together with its subsidiaries, as “we,” “us,” or “the Company.” PART I
Items 1 and 2. Business and Properties.
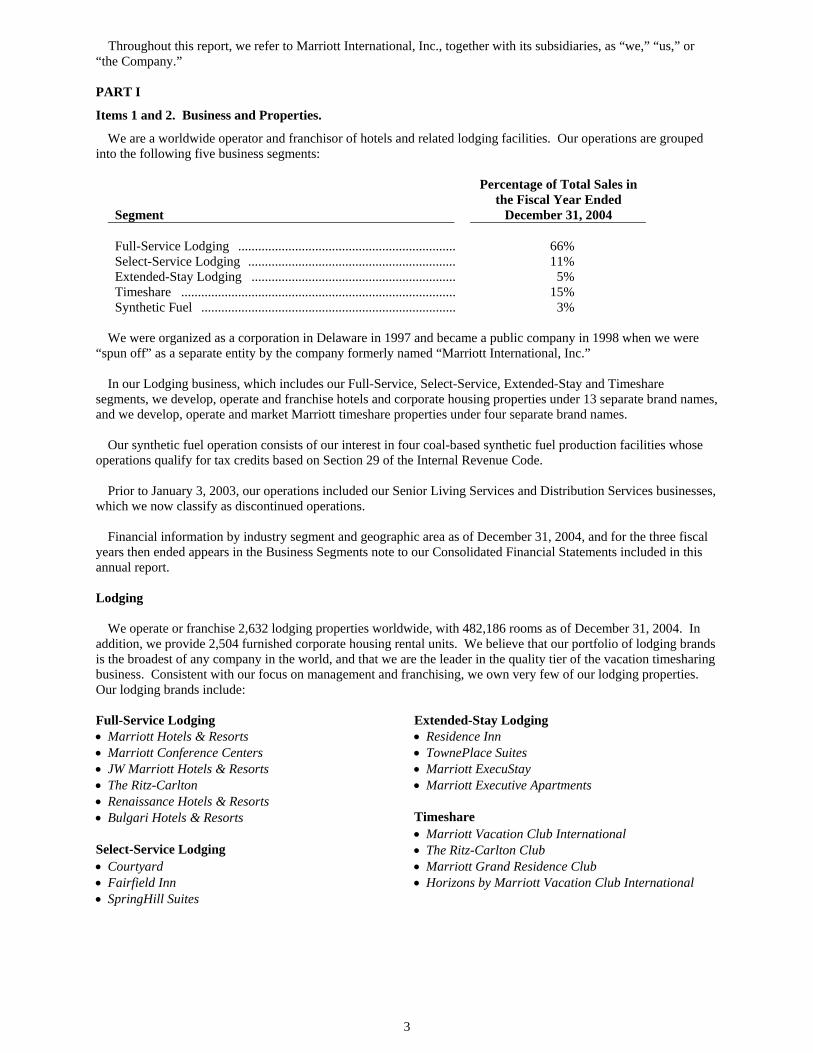
We are a worldwide operator and franchisor of hotels and related lodging facilities. Our operations are grouped into the following five business segments:
Segment
Percentage of Total Sales in the Fiscal Year Ended
December 31, 2004 Full-Service Lodging ................................................................. 66% Select-Service Lodging .............................................................. 11% Extended-Stay Lodging ............................................................. 5% Timeshare .................................................................................. 15% Synthetic Fuel ............................................................................ 3%
We were organized as a corporation in Delaware in 1997 and became a public company in 1998 when we were “spun off” as a separate entity by the company formerly named “Marriott International, Inc.” In our Lodging business, which includes our Full-Service, Select-Service, Extended-Stay and Timeshare segments, we develop, operate and franchise hotels and corporate housing properties under 13 separate brand names, and we develop, operate and market Marriott timeshare properties under four separate brand names. Our synthetic fuel operation consists of our interest in four coal-based synthetic fuel production facilities whose operations qualify for tax credits based on Section 29 of the Internal Revenue Code. Prior to January 3, 2003, our operations included our Senior Living Services and Distribution Services businesses, which we now classify as discontinued operations. Financial information by industry segment and geographic area as of December 31, 2004, and for the three fiscal years then ended appears in the Business Segments note to our Consolidated Financial Statements included in this annual report. Lodging We operate or franchise 2,632 lodging properties worldwide, with 482,186 rooms as of December 31, 2004. In addition, we provide 2,504 furnished corporate housing rental units. We believe that our portfolio of lodging brands is the broadest of any company in the world, and that we are the leader in the quality tier of the vacation timesharing business. Consistent with our focus on management and franchising, we own very few of our lodging properties. Our lodging brands include: Full-Service Lodging Extended-Stay Lodging • Marriott Hotels & Resorts • Residence Inn • Marriott Conference Centers • TownePlace Suites • JW Marriott Hotels & Resorts • Marriott ExecuStay • The Ritz-Carlton • Marriott Executive Apartments • Renaissance Hotels & Resorts • Bulgari Hotels & Resorts Timeshare • Marriott Vacation Club International Select-Service Lodging • The Ritz-Carlton Club • Courtyard • Marriott Grand Residence Club • Fairfield Inn • Horizons by Marriott Vacation Club International • SpringHill Suites
4
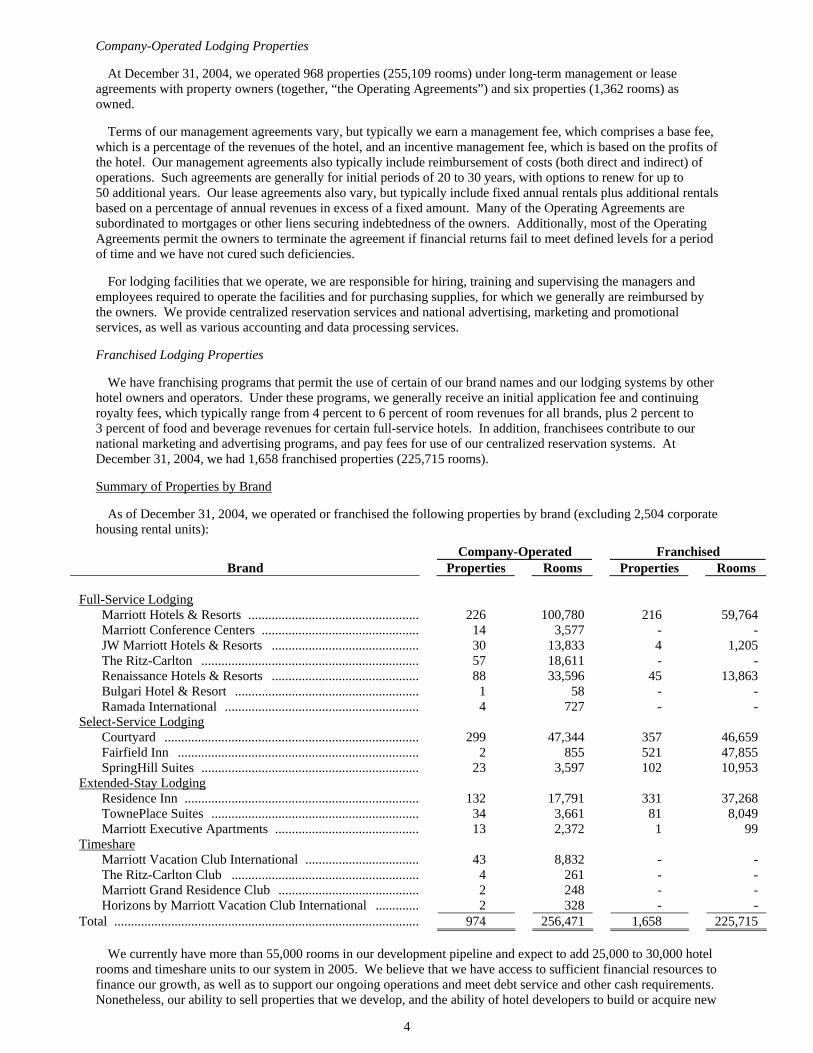
Company-Operated Lodging Properties At December 31, 2004, we operated 968 properties (255,109 rooms) under long-term management or lease agreements with property owners (together, “the Operating Agreements”) and six properties (1,362 rooms) as owned. Terms of our management agreements vary, but typically we earn a management fee, which comprises a base fee, which is a percentage of the revenues of the hotel, and an incentive management fee, which is based on the profits of the hotel. Our management agreements also typically include reimbursement of costs (both direct and indirect) of operations. Such agreements are generally for initial periods of 20 to 30 years, with options to renew for up to 50 additional years. Our lease agreements also vary, but typically include fixed annual rentals plus additional rentals based on a percentage of annual revenues in excess of a fixed amount. Many of the Operating Agreements are subordinated to mortgages or other liens securing indebtedness of the owners. Additionally, most of the Operating Agreements permit the owners to terminate the agreement if financial returns fail to meet defined levels for a period of time and we have not cured such deficiencies. For lodging facilities that we operate, we are responsible for hiring, training and supervising the managers and employees required to operate the facilities and for purchasing supplies, for which we generally are reimbursed by the owners. We provide centralized reservation services and national advertising, marketing and promotional services, as well as various accounting and data processing services. Franchised Lodging Properties We have franchising programs that permit the use of certain of our brand names and our lodging systems by other hotel owners and operators. Under these programs, we generally receive an initial application fee and continuing royalty fees, which typically range from 4 percent to 6 percent of room revenues for all brands, plus 2 percent to 3 percent of food and beverage revenues for certain full-service hotels. In addition, franchisees contribute to our national marketing and advertising programs, and pay fees for use of our centralized reservation systems. At December 31, 2004, we had 1,658 franchised properties (225,715 rooms). Summary of Properties by Brand As of December 31, 2004, we operated or franchised the following properties by brand (excluding 2,504 corporate housing rental units):
Full-Service Lodging Marriott Hotels & Resorts .................................................... 226 100,780 216 59,764 Marriott Conference Centers ................................................ 14 3,577 - - JW Marriott Hotels & Resorts ............................................. 30 13,833 4 1,205 The Ritz-Carlton .................................................................. 57 18,611 - - Renaissance Hotels & Resorts ............................................. 88 33,596 45 13,863 Bulgari Hotel & Resort ........................................................ 1 58 - - Ramada International ........................................................... 4 727 - - Select-Service Lodging Courtyard ............................................................................. 299 47,344 357 46,659 Fairfield Inn ......................................................................... 2 855 521 47,855 SpringHill Suites .................................................................. 23 3,597 102 10,953 Extended-Stay Lodging Residence Inn ....................................................................... 132 17,791 331 37,268 TownePlace Suites ............................................................... 34 3,661 81 8,049 Marriott Executive Apartments ............................................ 13 2,372 1 99 Timeshare Marriott Vacation Club International ................................... 43 8,832 - - The Ritz-Carlton Club ......................................................... 4 261 - - Marriott Grand Residence Club ........................................... 2 248 - - Horizons by Marriott Vacation Club International .............. 2 328 - - Total ............................................................................................ 974 256,471 1,658 225,715
We currently have more than 55,000 rooms in our development pipeline and expect to add 25,000 to 30,000 hotel rooms and timeshare units to our system in 2005. We believe that we have access to sufficient financial resources to finance our growth, as well as to support our ongoing operations and meet debt service and other cash requirements. Nonetheless, our ability to sell properties that we develop, and the ability of hotel developers to build or acquire new
Company-Operated Franchised Brand Properties Rooms Properties Rooms
5
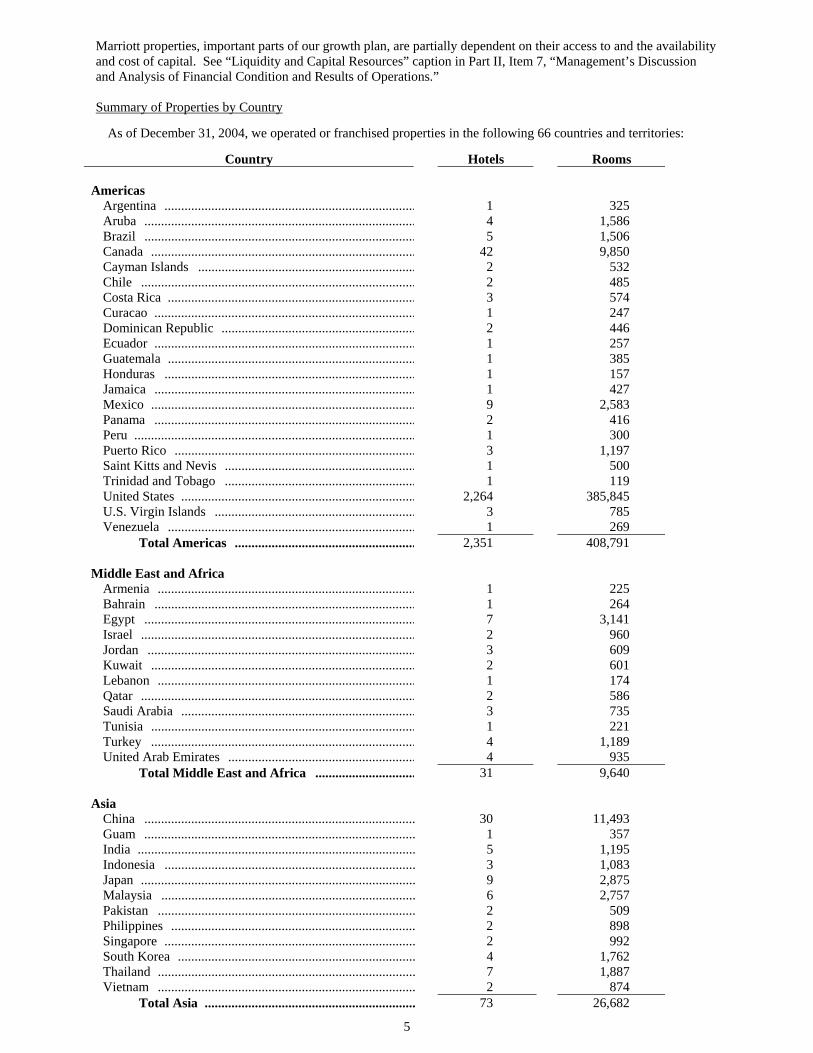
Marriott properties, important parts of our growth plan, are partially dependent on their access to and the availability and cost of capital. See “Liquidity and Capital Resources” caption in Part II, Item 7, “Management’s Discussion and Analysis of Financial Condition and Results of Operations.” Summary of Properties by Country
As of December 31, 2004, we operated or franchised properties in the following 66 countries and territories:
Country Hotels Rooms Americas
Argentina ........................................................................... 1 325 Aruba ................................................................................. 4 1,586 Brazil ................................................................................. 5 1,506 Canada ............................................................................... 42 9,850 Cayman Islands ................................................................. 2 532 Chile .................................................................................. 2 485 Costa Rica .......................................................................... 3 574 Curacao .............................................................................. 1 247 Dominican Republic .......................................................... 2 446 Ecuador .............................................................................. 1 257 Guatemala .......................................................................... 1 385 Honduras ........................................................................... 1 157 Jamaica .............................................................................. 1 427 Mexico ............................................................................... 9 2,583 Panama .............................................................................. 2 416 Peru .................................................................................... 1 300 Puerto Rico ........................................................................ 3 1,197 Saint Kitts and Nevis ......................................................... 1 500 Trinidad and Tobago ......................................................... 1 119 United States ...................................................................... 2,264 385,845 U.S. Virgin Islands ............................................................ 3 785 Venezuela .......................................................................... 1 269
Total Americas ...................................................... 2,351 408,791 Middle East and Africa
Armenia ............................................................................. 1 225 Bahrain .............................................................................. 1 264 Egypt ................................................................................. 7 3,141 Israel .................................................................................. 2 960 Jordan ................................................................................ 3 609 Kuwait ............................................................................... 2 601 Lebanon ............................................................................. 1 174 Qatar .................................................................................. 2 586 Saudi Arabia ...................................................................... 3 735 Tunisia ............................................................................... 1 221 Turkey ............................................................................... 4 1,189 United Arab Emirates ........................................................ 4 935
Total Middle East and Africa .............................. 31 9,640
Asia China ................................................................................. 30 11,493 Guam ................................................................................. 1 357 India ................................................................................... 5 1,195 Indonesia ........................................................................... 3 1,083 Japan .................................................................................. 9 2,875 Malaysia ............................................................................ 6 2,757 Pakistan ............................................................................. 2 509 Philippines ......................................................................... 2 898 Singapore ........................................................................... 2 992 South Korea ....................................................................... 4 1,762 Thailand ............................................................................. 7 1,887 Vietnam ............................................................................. 2 874
Total Asia ............................................................... 73 26,682
6
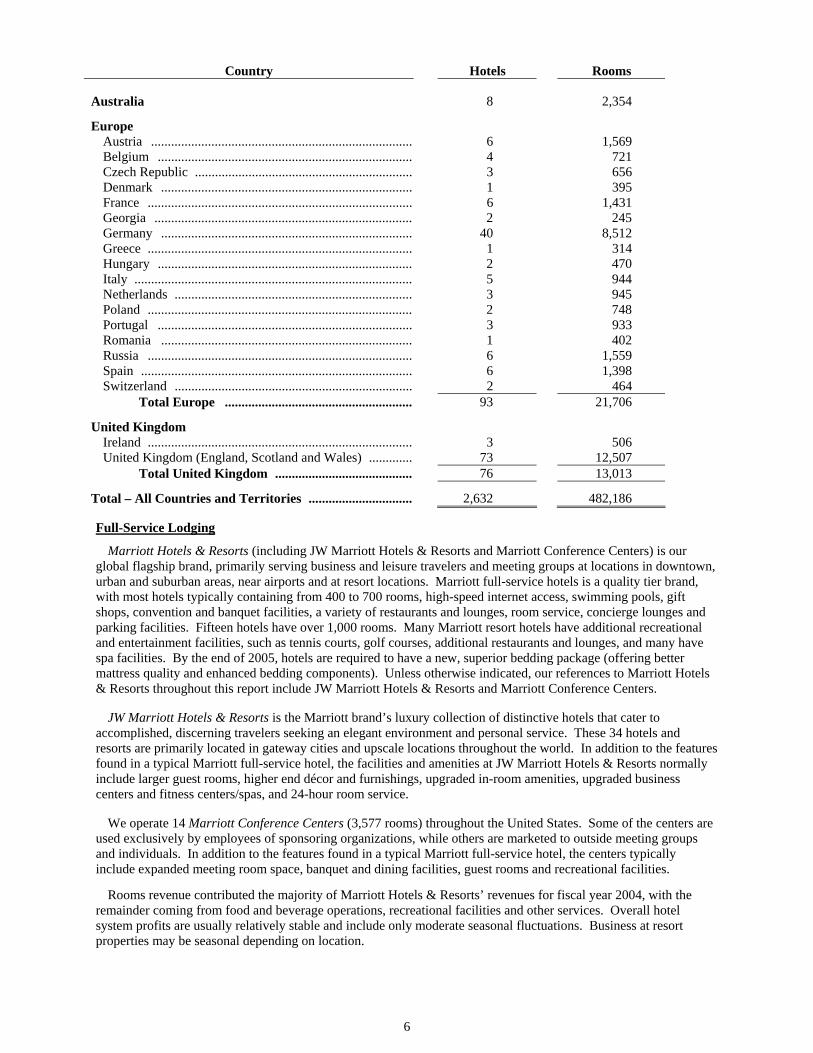
Country Hotels Rooms Australia 8 2,354
Europe Austria .............................................................................. 6 1,569 Belgium ............................................................................ 4 721 Czech Republic ................................................................. 3 656 Denmark ........................................................................... 1 395 France ............................................................................... 6 1,431 Georgia ............................................................................. 2 245 Germany ........................................................................... 40 8,512 Greece ............................................................................... 1 314 Hungary ............................................................................ 2 470 Italy ................................................................................... 5 944 Netherlands ....................................................................... 3 945 Poland ............................................................................... 2 748 Portugal ............................................................................ 3 933 Romania ........................................................................... 1 402 Russia ............................................................................... 6 1,559 Spain ................................................................................. 6 1,398 Switzerland ....................................................................... 2 464
Total Europe ........................................................ 93 21,706
United Kingdom Ireland ............................................................................... 3 506 United Kingdom (England, Scotland and Wales) ............. 73 12,507
Total United Kingdom ......................................... 76 13,013
Total – All Countries and Territories ............................... 2,632 482,186
Full-Service Lodging
Marriott Hotels & Resorts (including JW Marriott Hotels & Resorts and Marriott Conference Centers) is our global flagship brand, primarily serving business and leisure travelers and meeting groups at locations in downtown, urban and suburban areas, near airports and at resort locations. Marriott full-service hotels is a quality tier brand, with most hotels typically containing from 400 to 700 rooms, high-speed internet access, swimming pools, gift shops, convention and banquet facilities, a variety of restaurants and lounges, room service, concierge lounges and parking facilities. Fifteen hotels have over 1,000 rooms. Many Marriott resort hotels have additional recreational and entertainment facilities, such as tennis courts, golf courses, additional restaurants and lounges, and many have spa facilities. By the end of 2005, hotels are required to have a new, superior bedding package (offering better mattress quality and enhanced bedding components). Unless otherwise indicated, our references to Marriott Hotels & Resorts throughout this report include JW Marriott Hotels & Resorts and Marriott Conference Centers. JW Marriott Hotels & Resorts is the Marriott brand’s luxury collection of distinctive hotels that cater to accomplished, discerning travelers seeking an elegant environment and personal service. These 34 hotels and resorts are primarily located in gateway cities and upscale locations throughout the world. In addition to the features found in a typical Marriott full-service hotel, the facilities and amenities at JW Marriott Hotels & Resorts normally include larger guest rooms, higher end décor and furnishings, upgraded in-room amenities, upgraded business centers and fitness centers/spas, and 24-hour room service. We operate 14 Marriott Conference Centers (3,577 rooms) throughout the United States. Some of the centers are used exclusively by employees of sponsoring organizations, while others are marketed to outside meeting groups and individuals. In addition to the features found in a typical Marriott full-service hotel, the centers typically include expanded meeting room space, banquet and dining facilities, guest rooms and recreational facilities. Rooms revenue contributed the majority of Marriott Hotels & Resorts’ revenues for fiscal year 2004, with the remainder coming from food and beverage operations, recreational facilities and other services. Overall hotel system profits are usually relatively stable and include only moderate seasonal fluctuations. Business at resort properties may be seasonal depending on location.
7
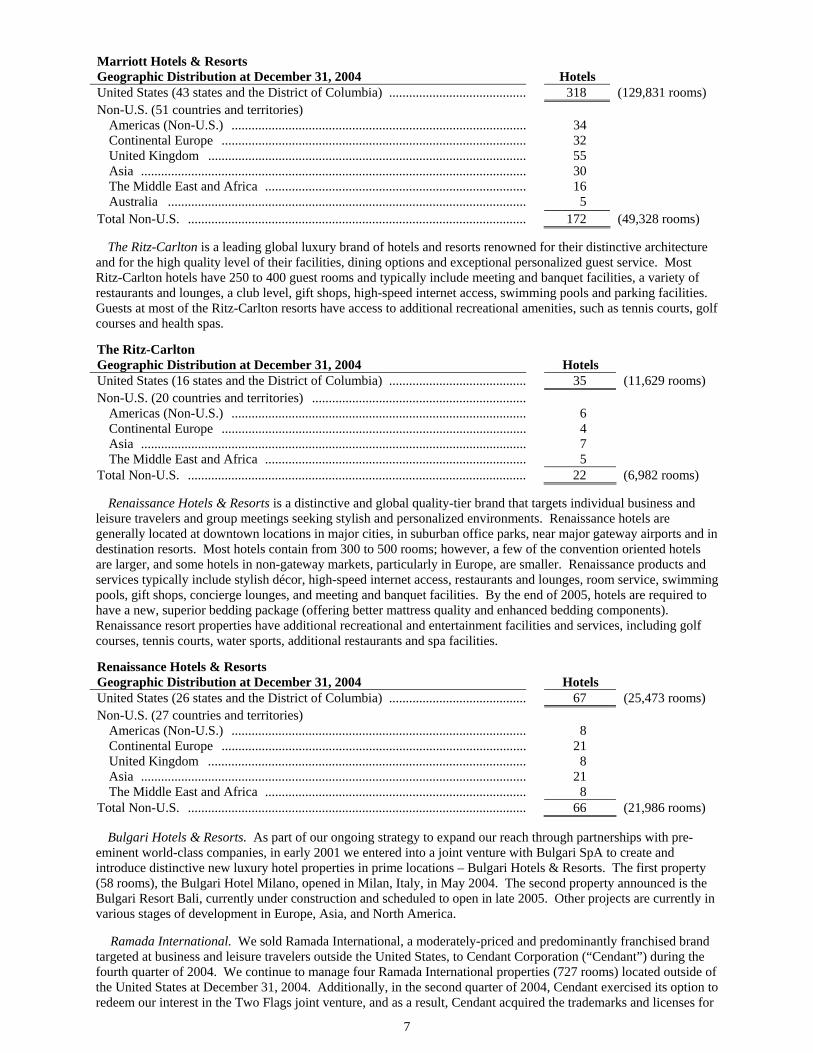
Marriott Hotels & Resorts Geographic Distribution at December 31, 2004
Hotels
United States (43 states and the District of Columbia) ......................................... 318 (129,831 rooms) Non-U.S. (51 countries and territories) Americas (Non-U.S.) ........................................................................................ 34 Continental Europe ........................................................................................... 32 United Kingdom ............................................................................................... 55 Asia ................................................................................................................... 30 The Middle East and Africa .............................................................................. 16 Australia ........................................................................................................... 5 Total Non-U.S. ..................................................................................................... 172 (49,328 rooms) The Ritz-Carlton is a leading global luxury brand of hotels and resorts renowned for their distinctive architecture and for the high quality level of their facilities, dining options and exceptional personalized guest service. Most Ritz-Carlton hotels have 250 to 400 guest rooms and typically include meeting and banquet facilities, a variety of restaurants and lounges, a club level, gift shops, high-speed internet access, swimming pools and parking facilities. Guests at most of the Ritz-Carlton resorts have access to additional recreational amenities, such as tennis courts, golf courses and health spas. The Ritz-Carlton Geographic Distribution at December 31, 2004
Hotels
United States (16 states and the District of Columbia) ......................................... 35 (11,629 rooms) Non-U.S. (20 countries and territories) ................................................................ Americas (Non-U.S.) ........................................................................................ 6 Continental Europe ........................................................................................... 4 Asia ................................................................................................................... 7 The Middle East and Africa .............................................................................. 5 Total Non-U.S. ..................................................................................................... 22 (6,982 rooms) Renaissance Hotels & Resorts is a distinctive and global quality-tier brand that targets individual business and leisure travelers and group meetings seeking stylish and personalized environments. Renaissance hotels are generally located at downtown locations in major cities, in suburban office parks, near major gateway airports and in destination resorts. Most hotels contain from 300 to 500 rooms; however, a few of the convention oriented hotels are larger, and some hotels in non-gateway markets, particularly in Europe, are smaller. Renaissance products and services typically include stylish décor, high-speed internet access, restaurants and lounges, room service, swimming pools, gift shops, concierge lounges, and meeting and banquet facilities. By the end of 2005, hotels are required to have a new, superior bedding package (offering better mattress quality and enhanced bedding components). Renaissance resort properties have additional recreational and entertainment facilities and services, including golf courses, tennis courts, water sports, additional restaurants and spa facilities. Renaissance Hotels & Resorts Geographic Distribution at December 31, 2004
Hotels
United States (26 states and the District of Columbia) ......................................... 67 (25,473 rooms) Non-U.S. (27 countries and territories) Americas (Non-U.S.) ........................................................................................ 8 Continental Europe ........................................................................................... 21 United Kingdom ............................................................................................... 8 Asia ................................................................................................................... 21 The Middle East and Africa .............................................................................. 8 Total Non-U.S. ..................................................................................................... 66 (21,986 rooms) Bulgari Hotels & Resorts. As part of our ongoing strategy to expand our reach through partnerships with pre-eminent world-class companies, in early 2001 we entered into a joint venture with Bulgari SpA to create and introduce distinctive new luxury hotel properties in prime locations – Bulgari Hotels & Resorts. The first property (58 rooms), the Bulgari Hotel Milano, opened in Milan, Italy, in May 2004. The second property announced is the Bulgari Resort Bali, currently under construction and scheduled to open in late 2005. Other projects are currently in various stages of development in Europe, Asia, and North America. Ramada International. We sold Ramada International, a moderately-priced and predominantly franchised brand targeted at business and leisure travelers outside the United States, to Cendant Corporation (“Cendant”) during the fourth quarter of 2004. We continue to manage four Ramada International properties (727 rooms) located outside of the United States at December 31, 2004. Additionally, in the second quarter of 2004, Cendant exercised its option to redeem our interest in the Two Flags joint venture, and as a result, Cendant acquired the trademarks and licenses for
8
the Ramada and Days Inn lodging brands in the United States. The Two Flags joint venture was originally formed in 2002 by us and Cendant to further develop and expand the Ramada and Days Inn brands in the United States. We contributed the domestic Ramada license agreements and related intellectual property to the joint venture, and Cendant contributed the Days Inn license agreement and related intellectual property.
Select-Service Lodging
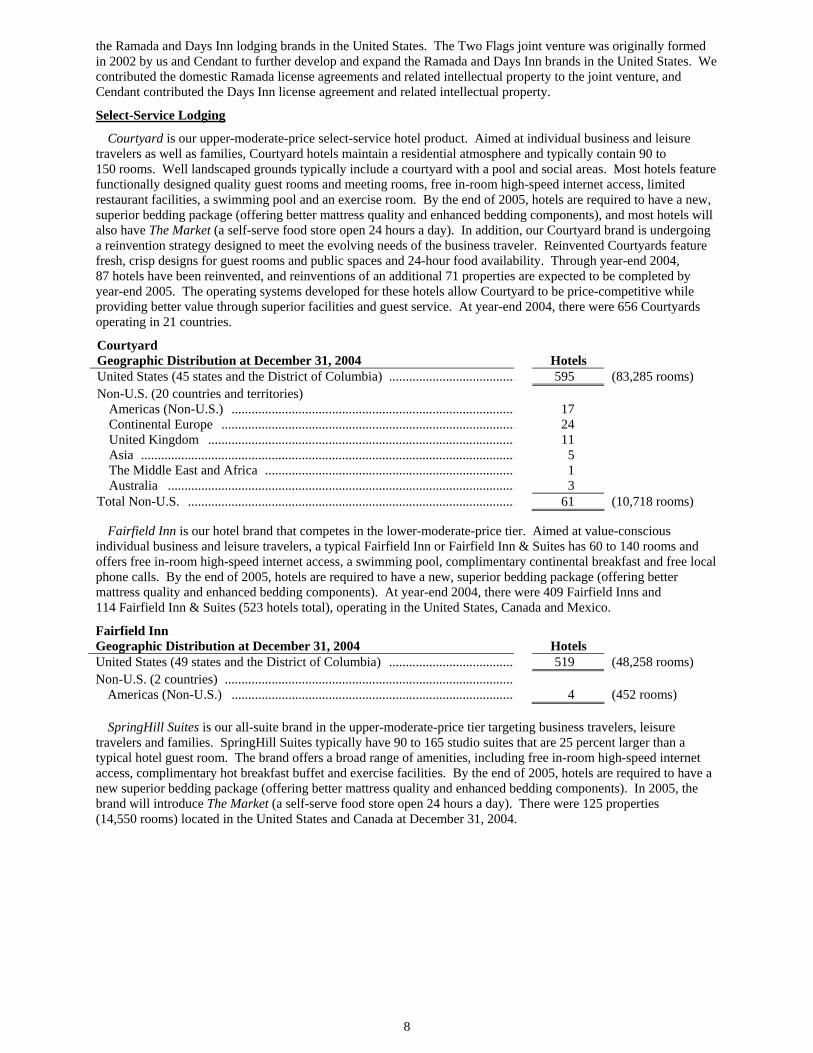
Courtyard is our upper-moderate-price select-service hotel product. Aimed at individual business and leisure travelers as well as families, Courtyard hotels maintain a residential atmosphere and typically contain 90 to 150 rooms. Well landscaped grounds typically include a courtyard with a pool and social areas. Most hotels feature functionally designed quality guest rooms and meeting rooms, free in-room high-speed internet access, limited restaurant facilities, a swimming pool and an exercise room. By the end of 2005, hotels are required to have a new, superior bedding package (offering better mattress quality and enhanced bedding components), and most hotels will also have The Market (a self-serve food store open 24 hours a day). In addition, our Courtyard brand is undergoing a reinvention strategy designed to meet the evolving needs of the business traveler. Reinvented Courtyards feature fresh, crisp designs for guest rooms and public spaces and 24-hour food availability. Through year-end 2004, 87 hotels have been reinvented, and reinventions of an additional 71 properties are expected to be completed by year-end 2005. The operating systems developed for these hotels allow Courtyard to be price-competitive while providing better value through superior facilities and guest service. At year-end 2004, there were 656 Courtyards operating in 21 countries.
Courtyard Geographic Distribution at December 31, 2004
Hotels
United States (45 states and the District of Columbia) ...................................... 595 (83,285 rooms) Non-U.S. (20 countries and territories) Americas (Non-U.S.) ..................................................................................... 17 Continental Europe ........................................................................................ 24 United Kingdom ............................................................................................ 11 Asia ................................................................................................................ 5 The Middle East and Africa ........................................................................... 1 Australia ........................................................................................................ 3 Total Non-U.S. .................................................................................................. 61 (10,718 rooms) Fairfield Inn is our hotel brand that competes in the lower-moderate-price tier. Aimed at value-conscious individual business and leisure travelers, a typical Fairfield Inn or Fairfield Inn & Suites has 60 to 140 rooms and offers free in-room high-speed internet access, a swimming pool, complimentary continental breakfast and free local phone calls. By the end of 2005, hotels are required to have a new, superior bedding package (offering better mattress quality and enhanced bedding components). At year-end 2004, there were 409 Fairfield Inns and 114 Fairfield Inn & Suites (523 hotels total), operating in the United States, Canada and Mexico.
Fairfield Inn Geographic Distribution at December 31, 2004
Hotels
United States (49 states and the District of Columbia) ...................................... 519 (48,258 rooms) Non-U.S. (2 countries) ....................................................................................... Americas (Non-U.S.) ..................................................................................... 4 (452 rooms) SpringHill Suites is our all-suite brand in the upper-moderate-price tier targeting business travelers, leisure travelers and families. SpringHill Suites typically have 90 to 165 studio suites that are 25 percent larger than a typical hotel guest room. The brand offers a broad range of amenities, including free in-room high-speed internet access, complimentary hot breakfast buffet and exercise facilities. By the end of 2005, hotels are required to have a new superior bedding package (offering better mattress quality and enhanced bedding components). In 2005, the brand will introduce The Market (a self-serve food store open 24 hours a day). There were 125 properties (14,550 rooms) located in the United States and Canada at December 31, 2004.
9
Extended-Stay Lodging
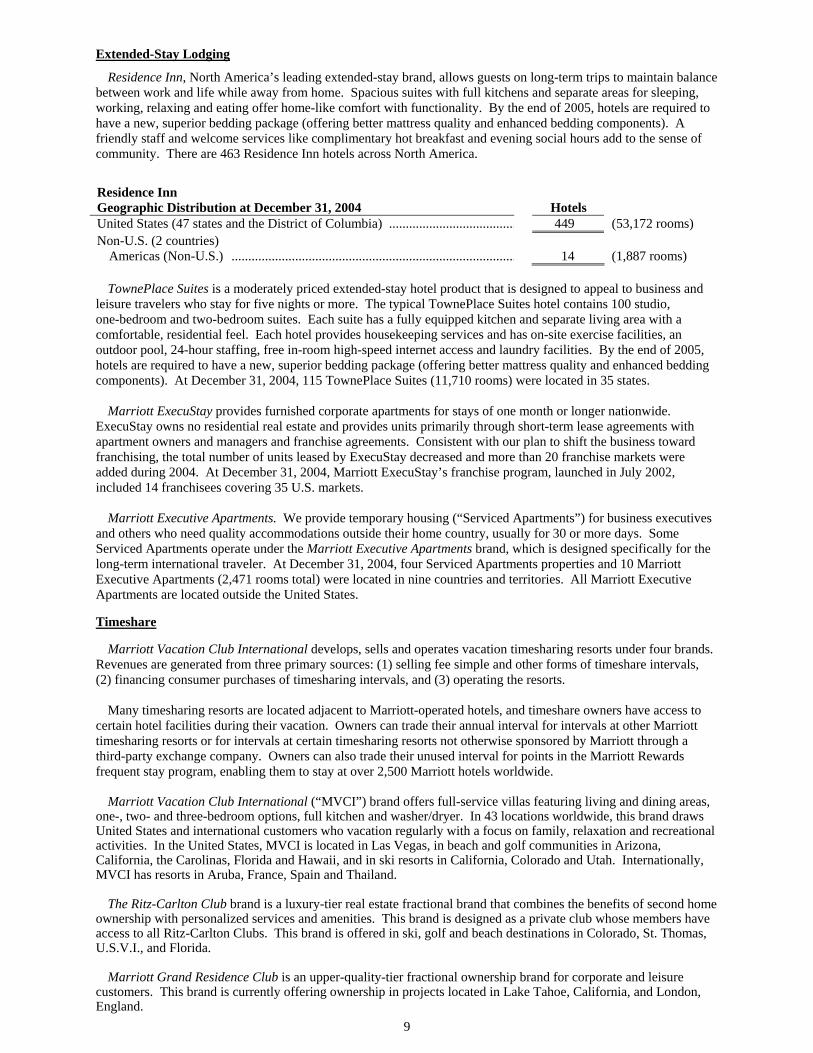
Residence Inn, North America’s leading extended-stay brand, allows guests on long-term trips to maintain balance between work and life while away from home. Spacious suites with full kitchens and separate areas for sleeping, working, relaxing and eating offer home-like comfort with functionality. By the end of 2005, hotels are required to have a new, superior bedding package (offering better mattress quality and enhanced bedding components). A friendly staff and welcome services like complimentary hot breakfast and evening social hours add to the sense of community. There are 463 Residence Inn hotels across North America.
Residence Inn Geographic Distribution at December 31, 2004
Hotels
United States (47 states and the District of Columbia) ...................................... 449 (53,172 rooms) Non-U.S. (2 countries) Americas (Non-U.S.) ..................................................................................... 14 (1,887 rooms) TownePlace Suites is a moderately priced extended-stay hotel product that is designed to appeal to business and leisure travelers who stay for five nights or more. The typical TownePlace Suites hotel contains 100 studio, one-bedroom and two-bedroom suites. Each suite has a fully equipped kitchen and separate living area with a comfortable, residential feel. Each hotel provides housekeeping services and has on-site exercise facilities, an outdoor pool, 24-hour staffing, free in-room high-speed internet access and laundry facilities. By the end of 2005, hotels are required to have a new, superior bedding package (offering better mattress quality and enhanced bedding components). At December 31, 2004, 115 TownePlace Suites (11,710 rooms) were located in 35 states. Marriott ExecuStay provides furnished corporate apartments for stays of one month or longer nationwide. ExecuStay owns no residential real estate and provides units primarily through short-term lease agreements with apartment owners and managers and franchise agreements. Consistent with our plan to shift the business toward franchising, the total number of units leased by ExecuStay decreased and more than 20 franchise markets were added during 2004. At December 31, 2004, Marriott ExecuStay’s franchise program, launched in July 2002, included 14 franchisees covering 35 U.S. markets. Marriott Executive Apartments. We provide temporary housing (“Serviced Apartments”) for business executives and others who need quality accommodations outside their home country, usually for 30 or more days. Some Serviced Apartments operate under the Marriott Executive Apartments brand, which is designed specifically for the long-term international traveler. At December 31, 2004, four Serviced Apartments properties and 10 Marriott Executive Apartments (2,471 rooms total) were located in nine countries and territories. All Marriott Executive Apartments are located outside the United States.
Timeshare
Marriott Vacation Club International develops, sells and operates vacation timesharing resorts under four brands. Revenues are generated from three primary sources: (1) selling fee simple and other forms of timeshare intervals, (2) financing consumer purchases of timesharing intervals, and (3) operating the resorts. Many timesharing resorts are located adjacent to Marriott-operated hotels, and timeshare owners have access to certain hotel facilities during their vacation. Owners can trade their annual interval for intervals at other Marriott timesharing resorts or for intervals at certain timesharing resorts not otherwise sponsored by Marriott through a third-party exchange company. Owners can also trade their unused interval for points in the Marriott Rewards frequent stay program, enabling them to stay at over 2,500 Marriott hotels worldwide. Marriott Vacation Club International (“MVCI”) brand offers full-service villas featuring living and dining areas, one-, two- and three-bedroom options, full kitchen and washer/dryer. In 43 locations worldwide, this brand draws United States and international customers who vacation regularly with a focus on family, relaxation and recreational activities. In the United States, MVCI is located in Las Vegas, in beach and golf communities in Arizona, California, the Carolinas, Florida and Hawaii, and in ski resorts in California, Colorado and Utah. Internationally, MVCI has resorts in Aruba, France, Spain and Thailand. The Ritz-Carlton Club brand is a luxury-tier real estate fractional brand that combines the benefits of second home ownership with personalized services and amenities. This brand is designed as a private club whose members have access to all Ritz-Carlton Clubs. This brand is offered in ski, golf and beach destinations in Colorado, St. Thomas, U.S.V.I., and Florida. Marriott Grand Residence Club is an upper-quality-tier fractional ownership brand for corporate and leisure customers. This brand is currently offering ownership in projects located in Lake Tahoe, California, and London, England.
10
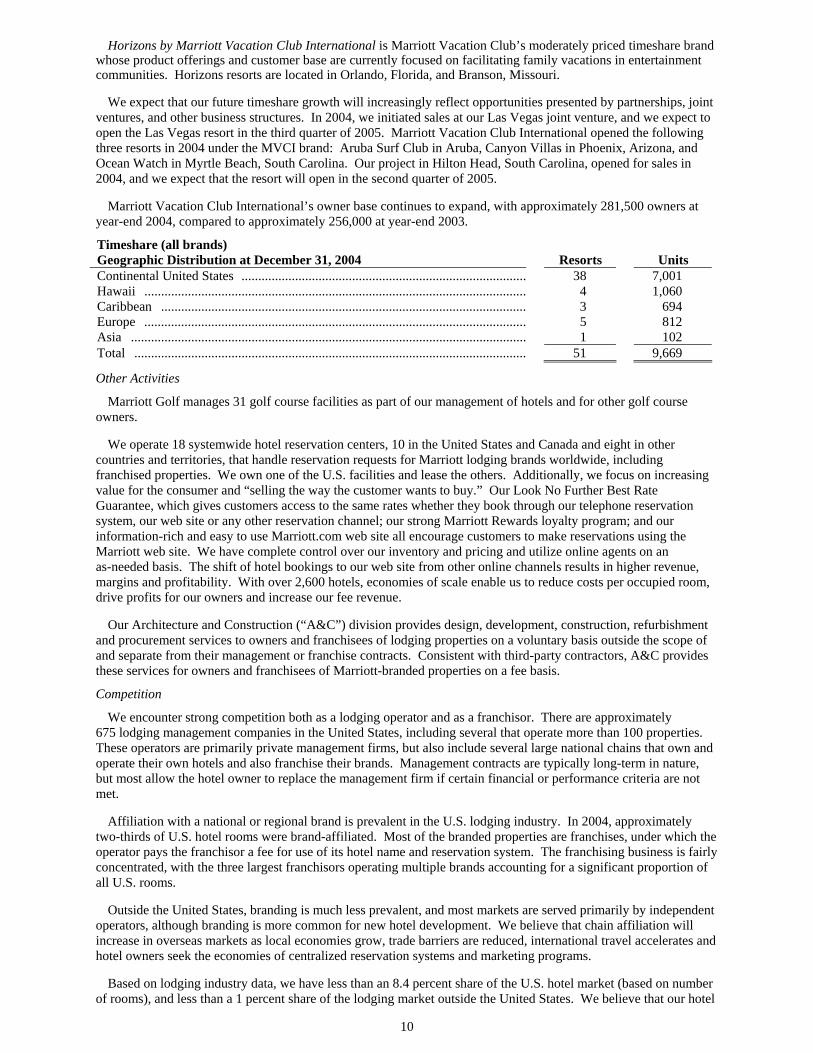
Horizons by Marriott Vacation Club International is Marriott Vacation Club’s moderately priced timeshare brand whose product offerings and customer base are currently focused on facilitating family vacations in entertainment communities. Horizons resorts are located in Orlando, Florida, and Branson, Missouri. We expect that our future timeshare growth will increasingly reflect opportunities presented by partnerships, joint ventures, and other business structures. In 2004, we initiated sales at our Las Vegas joint venture, and we expect to open the Las Vegas resort in the third quarter of 2005. Marriott Vacation Club International opened the following three resorts in 2004 under the MVCI brand: Aruba Surf Club in Aruba, Canyon Villas in Phoenix, Arizona, and Ocean Watch in Myrtle Beach, South Carolina. Our project in Hilton Head, South Carolina, opened for sales in 2004, and we expect that the resort will open in the second quarter of 2005. Marriott Vacation Club International’s owner base continues to expand, with approximately 281,500 owners at year-end 2004, compared to approximately 256,000 at year-end 2003.
Timeshare (all brands) Geographic Distribution at December 31, 2004
Resorts
Units Continental United States ..................................................................................... 38 7,001 Hawaii .................................................................................................................. 4 1,060 Caribbean ............................................................................................................. 3 694 Europe .................................................................................................................. 5 812 Asia ...................................................................................................................... 1 102 Total ..................................................................................................................... 51 9,669
Other Activities
Marriott Golf manages 31 golf course facilities as part of our management of hotels and for other golf course owners. We operate 18 systemwide hotel reservation centers, 10 in the United States and Canada and eight in other countries and territories, that handle reservation requests for Marriott lodging brands worldwide, including franchised properties. We own one of the U.S. facilities and lease the others. Additionally, we focus on increasing value for the consumer and “selling the way the customer wants to buy.” Our Look No Further Best Rate Guarantee, which gives customers access to the same rates whether they book through our telephone reservation system, our web site or any other reservation channel; our strong Marriott Rewards loyalty program; and our information-rich and easy to use Marriott.com web site all encourage customers to make reservations using the Marriott web site. We have complete control over our inventory and pricing and utilize online agents on an as-needed basis. The shift of hotel bookings to our web site from other online channels results in higher revenue, margins and profitability. With over 2,600 hotels, economies of scale enable us to reduce costs per occupied room, drive profits for our owners and increase our fee revenue. Our Architecture and Construction (“A&C”) division provides design, development, construction, refurbishment and procurement services to owners and franchisees of lodging properties on a voluntary basis outside the scope of and separate from their management or franchise contracts. Consistent with third-party contractors, A&C provides these services for owners and franchisees of Marriott-branded properties on a fee basis.
Competition
We encounter strong competition both as a lodging operator and as a franchisor. There are approximately 675 lodging management companies in the United States, including several that operate more than 100 properties. These operators are primarily private management firms, but also include several large national chains that own and operate their own hotels and also franchise their brands. Management contracts are typically long-term in nature, but most allow the hotel owner to replace the management firm if certain financial or performance criteria are not met. Affiliation with a national or regional brand is prevalent in the U.S. lodging industry. In 2004, approximately two-thirds of U.S. hotel rooms were brand-affiliated. Most of the branded properties are franchises, under which the operator pays the franchisor a fee for use of its hotel name and reservation system. The franchising business is fairly concentrated, with the three largest franchisors operating multiple brands accounting for a significant proportion of all U.S. rooms. Outside the United States, branding is much less prevalent, and most markets are served primarily by independent operators, although branding is more common for new hotel development. We believe that chain affiliation will increase in overseas markets as local economies grow, trade barriers are reduced, international travel accelerates and hotel owners seek the economies of centralized reservation systems and marketing programs. Based on lodging industry data, we have less than an 8.4 percent share of the U.S. hotel market (based on number of rooms), and less than a 1 percent share of the lodging market outside the United States. We believe that our hotel
11
brands are attractive to hotel owners seeking a management company or franchise affiliation because our hotels typically generate higher occupancies and Revenue per Available Room (REVPAR) than direct competitors in most market areas. We attribute this performance premium to our success in achieving and maintaining strong customer preference. Approximately 34 percent of our timeshare ownership resort sales come from additional purchases by or referrals from existing owners. We believe that the location and quality of our lodging facilities, our marketing programs, our reservation systems and our emphasis on guest service and satisfaction are contributing factors across all of our brands.
Properties that we operate or franchise are regularly upgraded to maintain their competitiveness. Our management, lease and franchise agreements provide for the allocation of funds, generally a fixed percentage of revenue, for periodic renovation of buildings and replacement of furnishings. We believe that these ongoing refurbishment programs are adequate to preserve the competitive position and earning power of the hotels and timeshare properties. While service excellence is Marriott’s hallmark, we continually look for new ways to delight our guests. Currently, we are focused on elevating the Marriott experience beyond that of a traditional hotel stay to a total guest experience that encompasses exceptional style, personal luxury and superior service. This approach to hospitality, “The New Look and Feel of Marriott Now,” is influenced by the world’s foremost innovations in design, technology, culinary expertise, service and comfort.
This evolution can begin to be seen across all of our brands, in new hotel designs, exotic destinations, enhanced fitness centers, sumptuous spas and expanded culinary offerings. Each brand, whether luxury or moderately priced, will be more upscale and attuned to customer needs than ever before. We believe that by operating a number of hotels among our brands, we stay in direct touch with customers and react to changes in the marketplace more quickly than chains that rely exclusively on franchising. The vacation ownership industry is one of the fastest growing segments in hospitality and is comprised of a number of highly competitive companies including several branded hotel companies. Since entering the timeshare industry in 1984, we have become a recognized leader in vacation ownership worldwide. Competition in the timeshare business is based primarily on the quality and location of timeshare resorts, the pricing of timeshare intervals and the availability of program benefits, such as exchange programs. We believe that our focus on offering distinct vacation experiences, combined with our financial strength, diverse market presence, strong brands and well-maintained properties, will enable us to remain competitive.
Marriott Rewards is a frequent guest program with over 21 million members and nine participating Marriott brands. The Marriott Rewards program yields repeat guest business by rewarding frequent stays with points toward free hotel stays and other rewards, or airline miles with any of 26 participating airline programs. We believe that Marriott Rewards generates substantial repeat business that might otherwise go to competing hotels. In 2004, approximately 40 percent of our room nights were purchased by Marriott Rewards members. In addition, the ability of Marriott Vacation Club International timeshare owners to convert unused intervals into Marriott Rewards points enhances the competitive position of our timeshare brand.
Synthetic Fuel
Operations
Our synthetic fuel operation currently consists of our interest in four coal-based synthetic fuel production facilities (the “Facilities”), two of which are located at a coal mine in Saline County, Illinois, with the remaining two located at a coal mine in Jefferson County, Alabama. Three of the four plants are held in one entity, and one of the plants is held in a separate entity. The synthetic fuel produced at the Facilities through 2007 qualifies for tax credits based on Section 29 of the Internal Revenue Code (credits are not available for fuel produced after 2007). Although the Facilities incur significant losses, these losses are more than offset by the tax credits generated under Section 29, which reduce our income tax expense.
At both of the locations, the synthetic fuel operation has entered into long-term site leases at sites that are adjacent to large underground mines as well as barge load-out facilities on navigable rivers. In addition, the synthetic fuel operation has entered into long-term coal purchase agreements with the owners of the adjacent coal mines and long-term synthetic fuel sales contracts with the Tennessee Valley Authority and with Alabama Power Company, two major utilities. These contracts ensure that the operation has long-term agreements to purchase coal and sell synthetic fuel, covering approximately 80 percent of the productive capacity of the Facilities. From time to time, the synthetic fuel operation supplements these base contracts, as opportunities arise, by entering into spot contracts to buy coal from these or other coal mines and sell synthetic fuel to different end users. The operation is slightly seasonal as the synthetic fuel is mainly burned to produce electricity, and electricity use peaks in the summer in the markets served by the synthetic fuel operation. The long-term contracts can generally be canceled by us in the event that we choose not to operate the Facilities or that the synthetic fuel produced at the Facilities does not qualify for tax credits under Section 29 of the Internal Revenue Code.
In addition, the synthetic fuel operation has entered into a long-term operations and maintenance agreement with an experienced manager of synthetic fuel facilities. This manager is responsible for staffing the Facilities, operating and maintaining the machinery and conducting routine maintenance on behalf of the synthetic fuel operation.
12
Finally, the synthetic fuel operation has entered into a long-term license and binder purchase agreement with Headwaters Incorporated, which permits the operation to utilize a carboxylated polystyrene copolymer emulsion patented by Headwaters and manufactured by Dow Chemical that is mixed with coal to produce a qualified synthetic fuel.
Our Investment
We acquired the Facilities from PacifiCorp Financial Services (“PacifiCorp”) in October 2001 for $46 million in cash. We began operating these Facilities in the first quarter of 2002.
On June 21, 2003, we sold an approximately 50 percent ownership interest in the synthetic fuel entities. We received cash and promissory notes totaling $25 million at closing, and we are receiving additional profits that we expect will continue over the life of the ventures based on the actual amount of tax credits allocated to the purchaser.
On November 7, 2003, the U.S. Internal Revenue Service (“IRS”) issued private letter rulings to the synthetic fuel joint venture confirming that the synthetic fuel produced by the Facilities is a “qualified fuel” under Section 29 of the Internal Revenue Code and that the resulting tax credit may be allocated among the members of the synthetic fuel joint venture.
As a result of a put option associated with the June 21, 2003, sale of a 50 percent ownership interest, we consolidated the two synthetic fuel joint ventures from that date through November 6, 2003. Effective November 7, 2003, because the put option was voided, we began accounting for the synthetic fuel joint ventures using the equity method of accounting. Beginning March 26, 2004, as a result of adopting FIN 46(R), “Consolidation of Variable Interest Entities,” we have again consolidated the synthetic fuel joint ventures, and we reflect our partner’s share of the operating losses as minority interest.
Internal Revenue Service Placed-in-Service Challenge
In July 2004, IRS field auditors issued a notice of proposed adjustment and later a Summary Report to PacifiCorp that included a challenge to the placed-in-service dates of three of the four synthetic fuel facilities owned by one of our synthetic fuel joint ventures. One of the conditions to qualify for tax credits under Section 29 of the Internal Revenue Code is that the production facility must have been placed in service before July 1, 1998. We strongly believe that all the Facilities meet the placed-in-service requirement. Although we are engaged in discussions with the IRS and are confident this issue will be resolved in our favor and not result in a material charge to us, we cannot assure you as to the ultimate outcome of this matter. If ultimately resolved against us, we could be prevented from realizing projected future tax credits and cause us to reverse previously utilized tax credits, requiring the payment of substantial additional taxes. Since acquiring the plants, we have recognized approximately $435 million of tax credits from all four plants through December 31, 2004. The tax credits recognized through December 31, 2004, associated with the three facilities in question totaled approximately $330 million. On October 6, 2004, we entered into amendment agreements with our synthetic fuel partner that result in a shift in the allocation of tax credits between us. On the synthetic fuel facility that is not being reviewed by the IRS, our partner increased its allocation of tax credits from approximately 50 percent to 90 percent through March 31, 2005, and pays a higher price per tax credit to us for that additional share of tax credits. With respect to the three synthetic fuel facilities under IRS review, our partner reduced its allocation of tax credits from approximately 50 percent to an average of roughly 5 percent through March 31, 2005. If the IRS’ placed-in-service challenge regarding the three facilities is not successfully resolved by March 31, 2005, our partner will have the right to return its ownership interest in those three facilities to us at that time. We will have the flexibility to continue to operate at current levels, reduce production and/or sell an interest to another party. If there is a successful resolution by March 31, 2005, our partner’s share of the tax credits from all four facilities will return to approximately 50 percent. In any event, on March 31, 2005, our share of the tax credits from the one facility not under review will return to approximately 50 percent.
Discontinued Operations
Senior Living Services
On December 30, 2002, we entered into definitive agreements to sell our senior living management business to Sunrise Senior Living, Inc. (“Sunrise”) and to sell nine senior living communities to CNL Retirement Properties, Inc. (“CNL”), and we recorded after-tax charges of $131 million in 2002 associated with our agreement to sell our senior living management business. We completed the sales to Sunrise and CNL, in addition to the related sale of a parcel of land to Sunrise in March 2003, for $266 million. We recorded after-tax gains of $19 million in 2003.
As a result of the above transactions we now report this business in discontinued operations.
13
Distribution Services In the third quarter of 2002, we completed a strategic review of our Distribution Services business and decided to exit that business. As of January 3, 2003, through a combination of sale and transfer of nine facilities and the termination of all operations at four facilities, we completed our exit of the Distribution Services business. We recorded after-tax charges of $40 million in 2002 in connection with the decision to exit this business. Accordingly, we now report this business in discontinued operations. Forward-Looking Statements We make forward-looking statements in this report based on the beliefs and assumptions of our management and on information currently available to us. Forward-looking statements include information about our possible or assumed future results of operations in “Management’s Discussion and Analysis of Financial Condition and Results of Operations” under the headings “Business and Overview,” “Liquidity and Capital Resources” and other statements throughout this report preceded by, followed by or that include the words “believes,” “expects,” “anticipates,” “intends,” “plans,” “estimates,” or similar expressions.
Forward-looking statements involve risks, uncertainties and assumptions, including risks described below and other risks that we describe from time to time in our periodic filings with the SEC, and our actual results may differ materially from those expressed in our forward-looking statements. We therefore caution you not to rely unduly on any forward-looking statement. The forward-looking statements in this report speak only as of the date of the report, and we undertake no obligation to update or revise any forward-looking statement, whether as a result of new information, future developments or otherwise. Risks and Uncertainties We are subject to various risks that could have a negative effect on the Company and its financial condition. You should understand that these risks could cause results to differ materially from those expressed in forward-looking statements contained in this report and in other Company communications. Because there is no way to determine in advance whether, or to what extent, any present uncertainty will ultimately impact our business, you should give equal weight to each of the following.
The lodging industry is highly competitive, which may impact our ability to compete successfully with other hotel and timeshare properties for customers. We generally operate in markets that contain numerous competitors. Each of our hotel and timeshare brands competes with major hotel chains in national and international venues and with independent companies in regional markets. Our ability to remain competitive and attract and retain business and leisure travelers depends on our success in distinguishing the quality, value and efficiency of our lodging products and services from those offered by others. If we are unable to compete successfully in these areas, this could limit our operating margins, diminish our market share and reduce our earnings.
We are subject to the range of operating risks common to the hotel, timeshare and corporate apartment industries. The profitability of the hotels, vacation timeshare resorts and corporate apartments that we operate or franchise may be adversely affected by a number of factors, including:
(1) the availability of and demand for hotel rooms, timeshares and apartments; (2) international, national and regional economic conditions; (3) the desirability of particular locations and changes in travel patterns; (4) taxes and government regulations that influence or determine wages, prices, interest rates, construction
procedures and costs; (5) the availability of capital to allow us and potential hotel owners and joint venture partners to fund
investments; (6) regional and national development of competing properties; and (7) increases in wages and other labor costs, energy, healthcare, insurance, transportation and fuel, and other
expenses central to the conduct of our business.
Any one or more of these factors could limit or reduce the demand, and therefore the prices we are able to obtain, for hotel rooms, timeshare units and corporate apartments. In addition, reduced demand for hotels could also give rise to losses under loans, guarantees and minority equity investments that we have made in connection with hotels that we manage.
The uncertain pace of the lodging industry’s recovery will continue to impact our financial results and growth. Both the Company and the lodging industry were hurt by several events occurring over the last few years, including the global economic downturn, the terrorist attacks on New York and Washington, Severe Acute Respiratory Syndrome (SARS) and military action in Iraq. Business and leisure travel decreased and remained depressed as some potential travelers reduced or avoided discretionary travel in light of increased delays and safety concerns and economic declines stemming from an erosion in consumer confidence. Weaker hotel performance reduced management and franchise fees and gave rise to fundings or losses under loans, guarantees and minority investments that we have made in connection with some hotels that we manage, which, in turn, has had a material adverse impact on our financial performance. Although both the lodging and travel industries are recovering, the pace, duration and full extent of that recovery remain unclear. Accordingly, our financial results and growth could be harmed if that recovery stalls or is reversed.
14
Our lodging operations are subject to international, national and regional conditions. Because we conduct our business on a national and international platform, our activities are susceptible to changes in the performance of regional and global economies. In recent years, our business has been hurt by decreases in travel resulting from recent economic conditions, the military action in Iraq, and the heightened travel security measures that have resulted from the threat of further terrorism. Our future economic performance is similarly subject to the uncertain magnitude and duration of the economic recovery in the United States, the prospects of improving economic performance in other regions, the unknown pace of any business travel recovery that results, and the occurrence of any future incidents in the countries in which we operate.
Our growth strategy depends upon third-party owners/operators, and future arrangements with these third parties may be less favorable. Our present growth strategy for development of additional lodging facilities entails entering into and maintaining various arrangements with property owners. The terms of our management agreements, franchise agreements and leases for each of our lodging facilities are influenced by contract terms offered by our competitors, among other things. We cannot assure you that any of our current arrangements will continue. Moreover, we may not be able to enter into future collaborations, or to renew or enter into agreements in the future, on terms that are as favorable to us as those under existing collaborations and agreements.
We may have disputes with the owners of the hotels that we manage or franchise. Consistent with our focus on management and franchising, we own very few of our lodging properties. The nature of our responsibilities under our management agreements to manage each hotel and enforce the standards required for our brands under both management and franchise agreements may, in some instances, be subject to interpretation and may give rise to disagreements. We seek to resolve any disagreements in order to develop and maintain positive relations with current and potential hotel owners and joint venture partners, but have not always been able to do so. Failure to resolve such disagreements has in the past resulted in litigation, and could do so in the future.
Our ability to grow our management and franchise systems is subject to the range of risks associated with real estate investments. Our ability to sustain continued growth through management or franchise agreements for new hotels and the conversion of existing facilities to managed or franchised Marriott brands is affected, and may potentially be limited, by a variety of factors influencing real estate development generally. These include site availability, financing, planning, zoning and other local approvals, and other limitations that may be imposed by market and submarket factors, such as projected room occupancy, growth in demand opposite projected supply, territorial restrictions in our management and franchise agreements, costs of construction and anticipated room rate structure.
We depend on capital to buy and maintain hotels, and we may be unable to access capital when necessary. In order to fund new hotel investments, as well as refurbish and improve existing hotels, both the Company and current and potential hotel owners must periodically spend money. The availability of funds for new investments and maintenance of existing hotels depends in large measure on capital markets and liquidity factors over which we can exert little control. Our ability to recover loan and guarantee advances from hotel operations or from owners through the proceeds of hotel sales, refinancing of debt or otherwise may also affect our ability to recycle and raise new capital.
In the event of damage to or other potential losses involving properties that we own, manage or franchise, potential losses may not be covered by insurance. We have comprehensive property and liability insurance policies with coverage features and insured limits that we believe are customary. Market forces beyond our control may nonetheless limit both the scope of property and liability insurance coverage that we can obtain and our ability to obtain coverage at reasonable rates. There are certain types of losses, generally of a catastrophic nature, such as earthquakes and floods or terrorist acts, that may be uninsurable or may be too expensive to justify insuring against. As a result, we may not be successful in obtaining insurance without increases in cost or decreases in coverage levels. In addition, we may carry insurance coverage that, in the event of a substantial loss, would not be sufficient to pay the full current market value or current replacement cost of our lost investment or that of hotel owners, or in some cases could also result in certain losses being totally uninsured. As a result, we could lose all, or a portion of, the capital we have invested in a property, as well as the anticipated future revenue from the property, and we could remain obligated for guarantees, debt or other financial obligations related to the property.
Risks relating to acts of God, terrorist activity and war could reduce the demand for lodging, which may adversely affect our revenues. Acts of God, such as natural disasters and the spread of contagious diseases, in locations where we own, manage or franchise significant properties and areas of the world from which we draw a large number of customers can cause a decline in the level of business and leisure travel and reduce the demand for lodging. Wars (including the potential for war), terrorist activity (including threats of terrorist activity), political unrest and other forms of civil strife and geopolitical uncertainty can have a similar effect. Any one or more of these events may reduce the overall demand for hotel rooms, timeshare units and corporate apartments, or limit the prices that we are able to obtain for them, both of which could adversely affect our revenues.
15
Increasing use of internet reservation services may adversely impact our revenues. Some of our hotel rooms are booked through internet travel intermediaries serving both the leisure, and increasingly, the corporate travel sectors. While Marriott’s Look No Further Best Rate Guarantee has greatly reduced the ability of these internet travel intermediaries to undercut the published rates of Marriott hotels, these internet travel intermediaries continue their attempts to commoditize hotel rooms, by aggressively marketing to price-sensitive travelers and corporate accounts and increasing the importance of general indicators of quality (such as “three-star downtown hotel”) at the expense of brand identification. These agencies hope that consumers will eventually develop brand loyalties to their travel services rather than to our lodging brands. Although we expect to continue to maintain and even increase the strength of our brands in the online marketplace, if the amount of sales made through internet intermediaries increases significantly, our business and profitability may be harmed.
Changes in privacy law could adversely affect our ability to market our products effectively. Our timeshare business, and to a lesser extent our lodging segments, rely on a variety of direct marketing techniques, including telemarketing and mass mailings. Recent initiatives, such as the National Do Not Call Registry and various state laws regarding marketing and solicitation, including anti-spam legislation, have created some concern about the continuing effectiveness of telemarketing and mass mailing techniques and could force further changes in our marketing strategy. If this occurs, we may not be able to develop adequate alternative marketing strategies, which could impact the amount and timing of our sales of timeshare units and other products. We also obtain lists of potential customers from travel service providers with whom we have substantial relationships and market to some individuals on these lists directly. If the acquisition of these lists were outlawed or otherwise restricted, our ability to develop new customers and introduce them to our products could be impaired.
Activities relating to our synthetic fuel operations could increase our tax liabilities. The Company earns revenues and generates tax credits from its synthetic fuel operations, which create a fuel that qualifies for tax credits pursuant to Section 29 of the Internal Revenue Code. The performance of the synthetic fuel operations depends in part on our ability to utilize the tax credits, which in turn is dependent on our financial performance. If our businesses do not generate sufficient profits, we might suffer losses associated with generating tax credits that we were unable to utilize. In addition, the IRS field audit team’s challenge to whether three of our synthetic fuel facilities satisfy statutory placed-in-service requirements could, if ultimately resolved against us, prevent us from realizing projected future tax credits and cause us to reverse previously utilized credits, requiring payment of substantial additional taxes. The ability of our synthetic fuel operations to generate tax credits could also be adversely impacted by the productivity of these operations, which may be diminished by problems related to supply, production and demand at any of the synthetic fuel facilities, the power plants that buy synthetic fuel from the joint venture or the coal mines where the joint venture buys coal, and by the reduction or elimination of projected future tax credits for synthetic fuel if average crude oil prices in 2005 and beyond exceed certain statutory thresholds, which could affect our ongoing production decisions.
Obligations associated with our exit from the Senior Living Services business may be larger than expected. Our agreement to sell the Senior Living Services business provides for indemnification of Sunrise Senior Living, Inc. based on pre-closing events and liabilities resulting from the consummation of the transaction. The amount of the indemnification obligations depends, in large part, on actions of third parties that are outside of our control. As a result, it is difficult to predict the ultimate impact of the indemnities, and the amount of these adjustments and indemnities could be larger than expected.
Employee Relations At December 31, 2004, we had approximately 133,000 employees. Approximately 9,000 employees were represented by labor unions. We believe relations with our employees are positive.
Other Properties In addition to the operating properties discussed above, we lease five office buildings with combined space of approximately 1.3 million square feet in Maryland and Florida where our corporate, Ritz-Carlton and Marriott Vacation Club International headquarters are located.
We believe our properties are in generally good physical condition with the need for only routine repairs and maintenance and periodic capital improvements.
Internet Address and Company SEC Filings Our internet address is www.marriott.com. On the investor relations portion of our web site, www.mariott.com/investor, we provide a link to our electronic SEC filings, including our annual report on Form 10-K, our quarterly reports on Form 10-Q, our current reports on Form 8-K and any amendments to these reports. All such filings are available free of charge and are available as soon as reasonably practicable after filing.
Executive Officers of the Registrant
See Item 10 on page 78 of this report for information about our executive officers.
16
Item 3. Legal Proceedings. The CTF/HPI arbitration and litigation is described under the caption heading “Litigation and Arbitration” in Footnote 18 of the Notes to Consolidated Financial Statements set forth in Part II, Item 8, of this annual report and is hereby incorporated by reference. In addition, on December 22, 2004, P.T. Karang Mas Sejahtera, the owner of The Ritz-Carlton Bali Resort and Spa, filed an action against the Company and The Ritz-Carlton Hotel Company, LLC in the Superior Court of the State of California for the County of Los Angeles alleging breach of the operating agreement governing the hotel, breach of fiduciary duty, fraudulent concealment, interference with contract and conspiracy to breach fiduciary duty. The complaint seeks unspecified damages, an accounting and a declaration that the owner has a right to terminate the operating agreement governing the hotel. On January 21, 2005, we removed the action to the U.S. District Court for the Central District of California, filed an answer and moved to transfer the action to the District of Maryland. No scheduling order has been entered at this time. We believe that the claims made against us are without merit, and we intend to vigorously defend against them. However, we cannot assure you as to the outcome of these lawsuits, nor can we currently estimate the range of potential losses to the Company. From time to time, we are also subject to certain legal proceedings and claims in the ordinary course of business. We currently are not aware of any such legal proceedings or claims that we believe will have, individually or in the aggregate, a material adverse effect on our business, financial condition or operating results.

17
Item 4. Submission of Matters to a Vote of Security Holders. None.
18
Part II
Item 5. Market for Registrant’s Common Equity, Related Stockholder Matters and Issuer Purchases of Equity Securities.
Market Information and Dividends
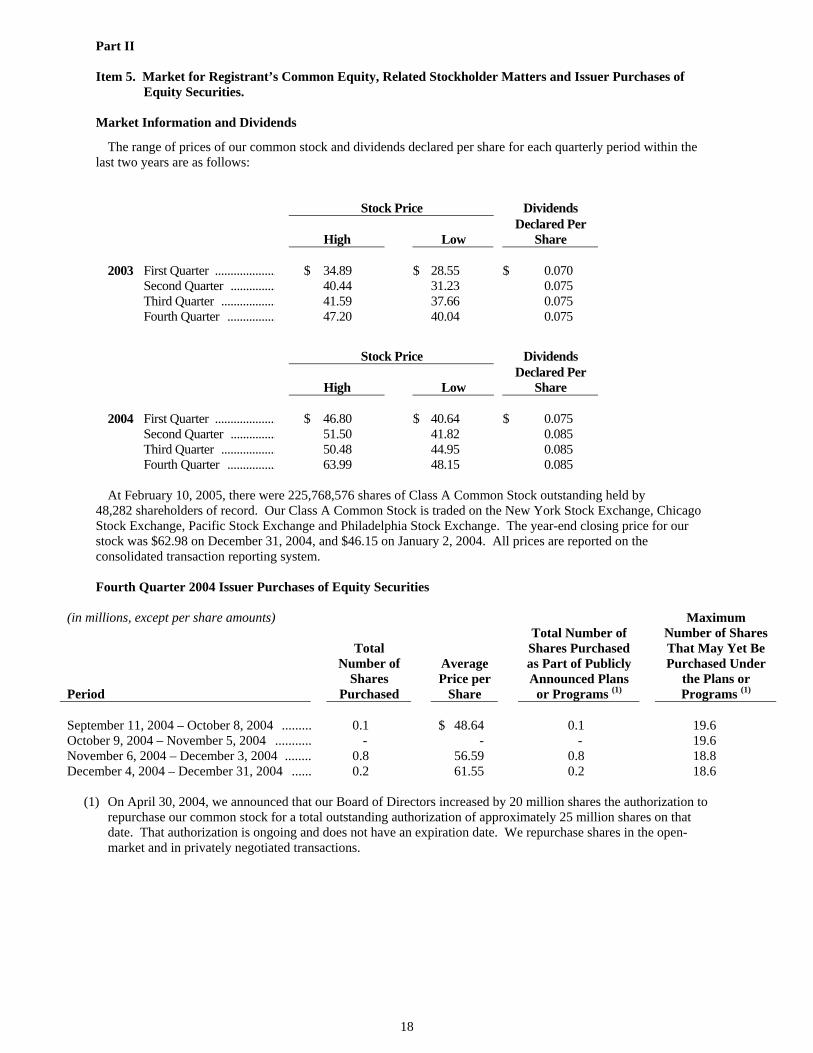
The range of prices of our common stock and dividends declared per share for each quarterly period within the last two years are as follows:
Stock Price
Dividends
High
Low
Declared Per Share
2003 First Quarter .................... $ 34.89 $ 28.55 $ 0.070 Second Quarter ............... 40.44 31.23 0.075 Third Quarter .................. 41.59 37.66 0.075 Fourth Quarter ................ 47.20 40.04 0.075
Stock Price Dividends
High
Low Declared Per
Share 2004 First Quarter .................... $ 46.80 $ 40.64 $ 0.075 Second Quarter ............... 51.50 41.82 0.085 Third Quarter .................. 50.48 44.95 0.085 Fourth Quarter ................ 63.99 48.15 0.085
At February 10, 2005, there were 225,768,576 shares of Class A Common Stock outstanding held by 48,282 shareholders of record. Our Class A Common Stock is traded on the New York Stock Exchange, Chicago Stock Exchange, Pacific Stock Exchange and Philadelphia Stock Exchange. The year-end closing price for our stock was $62.98 on December 31, 2004, and $46.15 on January 2, 2004. All prices are reported on the consolidated transaction reporting system. Fourth Quarter 2004 Issuer Purchases of Equity Securities
(in millions, except per share amounts) Period
Total Number of
Shares Purchased
Average Price per
Share
Total Number of Shares Purchased as Part of Publicly Announced Plans
or Programs (1)
Maximum Number of Shares That May Yet Be Purchased Under
the Plans or Programs (1)
September 11, 2004 – October 8, 2004 ......... 0.1 $ 48.64 0.1 19.6 October 9, 2004 – November 5, 2004 ........... - - .- 19.6 November 6, 2004 – December 3, 2004 ........ 0.8 56.59 0.8 18.8 December 4, 2004 – December 31, 2004 ...... 0.2 61.55 0.2 18.6
(1) On April 30, 2004, we announced that our Board of Directors increased by 20 million shares the authorization to
repurchase our common stock for a total outstanding authorization of approximately 25 million shares on that date. That authorization is ongoing and does not have an expiration date. We repurchase shares in the open-market and in privately negotiated transactions.
19
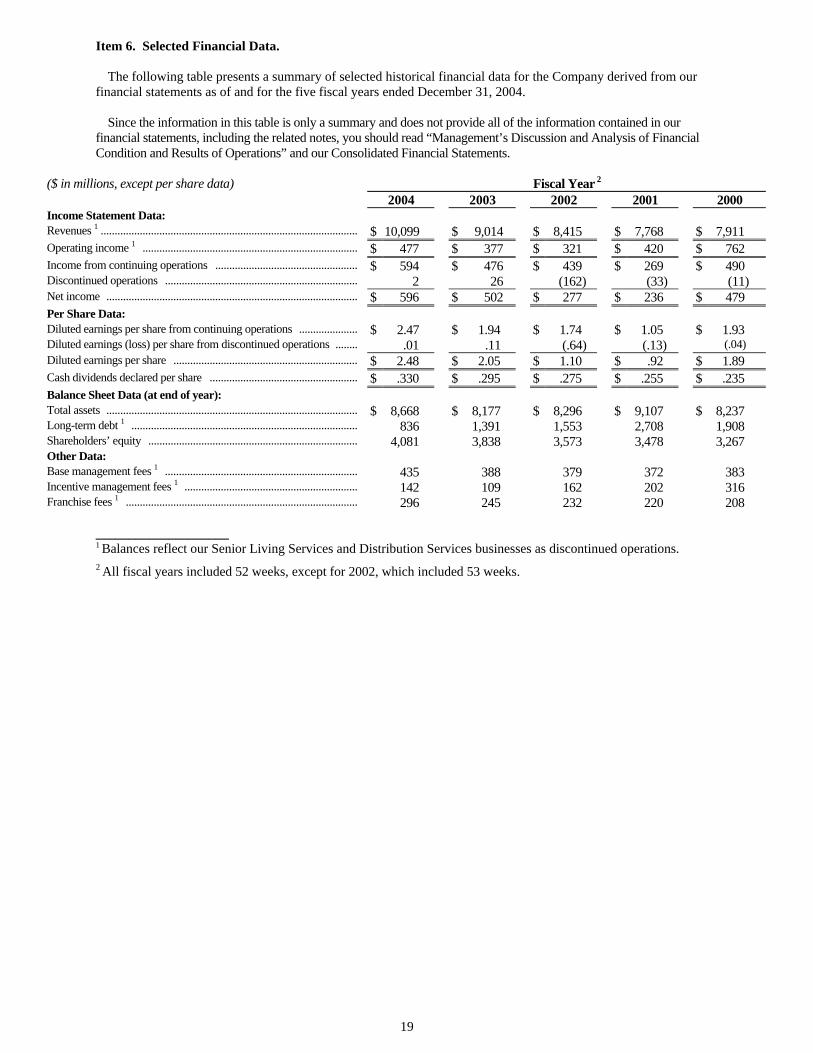
Item 6. Selected Financial Data. The following table presents a summary of selected historical financial data for the Company derived from our financial statements as of and for the five fiscal years ended December 31, 2004. Since the information in this table is only a summary and does not provide all of the information contained in our financial statements, including the related notes, you should read “Management’s Discussion and Analysis of Financial Condition and Results of Operations” and our Consolidated Financial Statements.
($ in millions, except per share data) Fiscal Year 2 2004 2003 2002 2001 2000 Income Statement Data: Revenues 1 ............................................................................................ $ 10,099 $ 9,014 $ 8,415 $ 7,768 $ 7,911 Operating income 1 ............................................................................. $ 477 $ 377 $ 321 $ 420 $ 762 Income from continuing operations ................................................... $ 594 $ 476 $ 439 $ 269 $ 490 Discontinued operations ..................................................................... 2 26 (162) (33) (11) Net income .......................................................................................... $ 596 $ 502 $ 277 $ 236 $ 479 Per Share Data: Diluted earnings per share from continuing operations ..................... $ 2.47 $ 1.94 $ 1.74 $ 1.05 $ 1.93 Diluted earnings (loss) per share from discontinued operations ........ .01 .11 (.64) (.13) (.04) Diluted earnings per share .................................................................. $ 2.48 $ 2.05 $ 1.10 $ .92 $ 1.89 Cash dividends declared per share ..................................................... $ .330 $ .295 $ .275 $ .255 $ .235 Balance Sheet Data (at end of year): Total assets .......................................................................................... $ 8,668 $ 8,177 $ 8,296 $ 9,107 $ 8,237 Long-term debt 1 ................................................................................. 836 1,391 1,553 2,708 1,908 Shareholders’ equity ........................................................................... 4,081 3,838 3,573 3,478 3,267 Other Data: Base management fees 1 ..................................................................... 435 388 379 372 383 Incentive management fees 1 .............................................................. 142 109 162 202 316 Franchise fees 1 ................................................................................... 296 245 232 220 208
____________________ 1 Balances reflect our Senior Living Services and Distribution Services businesses as discontinued operations. 2 All fiscal years included 52 weeks, except for 2002, which included 53 weeks.
20
Item 7. Management’s Discussion and Analysis of Financial Condition and Results of Operations. BUSINESS AND OVERVIEW We are a worldwide operator and franchisor of 2,632 hotels and related facilities. Our operations are grouped into five business segments, Full-Service Lodging, Select-Service Lodging, Extended-Stay Lodging, Timeshare and Synthetic Fuel. In our Lodging business, we operate, develop and franchise under 13 separate brand names in 66 countries and territories. We also operate and develop Marriott timeshare properties under four separate brand names. We earn base, incentive and franchise fees based upon the terms of our management and franchise agreements. Revenues are also generated from the following sources associated with our timeshare business: (1) selling timeshare intervals, (2) operating the resorts, and (3) financing customer purchases of timesharing intervals. In addition, we earn revenues and generate tax credits from our synthetic fuel joint ventures. We evaluate the performance of our segments based primarily on the results of the segment without allocating corporate expenses, interest expense and interest income. With the exception of our Synthetic Fuel segment, we do not allocate income taxes to our segments. As timeshare note sales are an integral part of the timeshare business, we include timeshare note sale gains in our timeshare segment results, and we allocate other gains as well as equity income (losses) from our joint ventures to each of our segments. Lodging supply growth in the United States was low during 2004, while demand growth was high. In the United States, demand was strong in the Eastern and Western regions, while the Midwestern and South Central regions experienced more moderate increases in demand. Demand associated with business travel improved steadily in 2004, and leisure demand remained high. The weak U.S. dollar in relation to other currencies, particularly the euro, resulted in increased travel into the U.S. as overseas trips for many international travelers were less expensive. Conversely, many U.S. vacationers who might have traveled abroad, traveled domestically instead, as the weak dollar made overseas trips more costly. Outside of the U.S. we experienced stronger demand versus the prior year, particularly in Asia and the Middle East. While demand in Latin America and the Caribbean was also good, Europe remains a challenge, as some economies have been slow to rebound. We focus on increasing value for the consumer and “selling the way the customer wants to buy.” Our Look No Further Best Rate Guarantee, strong Marriott Rewards loyalty program, and information-rich, easy to use web site encourage customers to make reservations through Marriott.com. We have complete control over our inventory and pricing and utilize online agents on an as needed basis. The shift of hotel bookings to our web site from other online channels results in higher revenue, margins and profitability. By the end of 2004, we had high-speed internet access available in over 2,400 hotels, far outpacing our competition, and we had wireless internet access in lobbies, meeting rooms and public spaces in more than 1,900 hotels.
CONSOLIDATED RESULTS
The following discussion presents an analysis of results of our operations for fiscal years ended December 31, 2004, January 2, 2004 (which we refer to as “2003”), and January 3, 2003 (which we refer to as “2002”).
Continuing Operations Revenues
2004 Compared to 2003
Revenues increased 12 percent to $10,099 million in 2004, primarily reflecting higher fees related to increased demand for hotel rooms and unit expansion, as well as strong sales in our Timeshare segment.
2003 Compared to 2002
Revenues increased 7 percent to $9,014 million in 2003, reflecting revenue from new lodging properties, partially offset by lower demand for hotel rooms and consequently lower fees to us.
Operating Income 2004 Compared to 2003
Operating income increased $100 million to $477 million in 2004. The increase is primarily due to higher fees, which are related both to stronger REVPAR, driven by increased occupancy and average daily rate, and to the
21
growth in the number of rooms, and strong timeshare results, which are mainly attributable to strong demand and improved margins, partially offset by higher general and administrative expenses. General, administrative and other expenses increased $84 million in 2004 to $607 million, primarily reflecting higher administrative expenses in both our lodging ($55 million) and timeshare businesses ($24 million), primarily associated with increased overhead costs related to the Company’s unit growth and increased development costs primarily associated with our Timeshare segment, and a $10 million reduction in foreign exchange gains, offset by $6 million of lower litigation expenses.
2003 Compared to 2002
Operating income increased 17 percent to $377 million in 2003. The favorable comparisons to 2002 include the impact of the $50 million write down of goodwill recorded in 2002 associated with our ExecuStay business, the 2003 receipt of $36 million of insurance proceeds associated with lost management fees resulting from the destruction of the Marriott World Trade Center hotel and lower 2003 operating losses from our synthetic fuel operation. In 2003, the synthetic fuel business generated operating losses of $104 million, compared to $134 million in 2002. Operating income in 2003 was hurt by $53 million of lower incentive fees, which resulted from the weak operating environment in domestic lodging. General, administrative and other expenses increased $13 million in 2003 to $523 million, reflecting higher litigation expenses related to two continuing and previously disclosed lawsuits, partially offset by the impact of the additional week in 2002 (our 2002 fiscal year included 53 weeks compared to 52 weeks in 2003). The expenses also reflect foreign exchange gains of $7 million, compared to losses of $6 million in 2002.
Gains and Other Income
The following table shows our gains and other income for the fiscal years ended December 31, 2004, January 2, 2004, and January 3, 2003.
Interest Expense
2004 Compared to 2003
Interest expense decreased $11 million to $99 million, reflecting the repayment of $234 million of senior debt in the fourth quarter of 2003 and other subsequent debt reductions, partially offset by lower capitalized interest resulting from fewer projects under construction, primarily related to our Timeshare segment.
2003 Compared to 2002
Interest expense increased $24 million to $110 million, reflecting interest on the mortgage debt assumed in the fourth quarter of 2002 associated with the acquisition of 14 senior living communities, and lower capitalized interest resulting from fewer projects under construction, primarily related to our Timeshare segment. In the fourth quarter of 2003, $234 million of senior debt was repaid. The weighted average interest rate on the repaid debt was 7 percent.
Interest Income, Provision for Loan Losses, and Income Tax
2004 Compared to 2003
Interest income, before the provision for loan losses, increased $17 million (13 percent) to $146 million, reflecting higher loan balances, including the $200 million note collected in the third quarter of 2004 related to the acquisition by Cendant Corporation of our interest in the Two Flags joint venture and higher interest rates. We recognized $9 million of interest income associated with the $200 million note, which was issued early in the 2004 second quarter. Our provision for loan losses for 2004 was a benefit of $8 million and includes $3 million of reserves for loans deemed uncollectible at three hotels, offset by the reversal of $11 million of reserves no longer deemed necessary.
Income from continuing operations before income taxes generated a tax provision of $100 million in 2004, compared to a tax benefit of $43 million in 2003. The difference is primarily attributable to the impact of the synthetic fuel joint venture, which generated a tax benefit and tax credits of $165 million in 2004, compared to $245 million in 2003 and to higher pre-tax income. In the third quarter of 2003, we sold a 50 percent interest in our synthetic fuel joint ventures, and we currently consolidate the joint ventures.
($ in millions) 2004 2003 2002 Timeshare note sale gains ........................................................... $ 64 $ 64 $ 60 Synthetic fuel earn-out payments received, net ........................... 28 - - Gains on sales of real estate ........................................................ 44 21 28 Gains on sales of joint venture investments ................................ 19 21 44 Other ........................................................................................... 9 - - $ 164 $ 106 $ 132
22
2003 Compared to 2002
Interest income increased $7 million (6 percent) to $129 million. Our provision for loan losses for 2003 was $7 million and includes $15 million of reserves for loans deemed uncollectible at six hotels, offset by the reversal of $8 million of reserves no longer deemed necessary. Income from continuing operations before income taxes and minority interest generated a tax benefit of $43 million in 2003, compared to a tax provision of $32 million in 2002. The difference is primarily attributable to the impact of our synthetic fuel operation, which generated a tax benefit and tax credits of $245 million in 2003, compared to $208 million in 2002. Excluding the impact of the synthetic fuel operation, our pre-tax income was lower in 2003, which also contributed to the favorable tax impact. Our effective tax rate for discontinued operations increased from 15.7 percent to 39 percent due to the impact of the taxes in 2002 associated with the sale of stock in connection with the disposal of our Senior Living Services business.
Minority Interest
Minority interest increased from an expense of $55 million in 2003 to a benefit of $40 million in 2004, primarily as a result of the change in the ownership structure of the synthetic fuel joint ventures following our sale of 50 percent of our interest in the joint ventures. Due to the purchaser’s put option, which expired on November 6, 2003, minority interest for 2003 reflected our partner’s share of the synthetic fuel operating losses and their share of the associated tax benefit, along with their share of the tax credits from the June 21, 2003, sale date through the put option’s expiration date, when we began accounting for the ventures under the equity method of accounting. For 2004, minority interest reflects our partner’s share of the synthetic fuel losses from March 26, 2004, (when we began consolidating the ventures due to the adoption of FIN 46(R)) through year-end. For additional information, see the discussion relating to our “Synthetic Fuel” segment on page 31.
Income from Continuing Operations
2004 Compared to 2003
Income from continuing operations increased 25 percent to $594 million, and diluted earnings per share from continuing operations increased 27 percent to $2.47. The favorable results were primarily driven by strong hotel demand, new unit growth, strong timeshare results, higher interest income reflecting higher balances and rates, lower interest expense due to debt reductions, lower loan loss provisions, stronger synthetic fuel results and increased gains of $58 million, partially offset by higher income taxes excluding the synthetic fuel impact, and higher general and administrative expenses.
2003 Compared to 2002
Income from continuing operations increased 8 percent to $476 million, and diluted earnings per share from continuing operations advanced 11 percent to $1.94. Synthetic fuel operations contributed $96 million in 2003 compared to $74 million in 2002. Our lodging financial results declined $5 million to $702 million in 2003. The comparisons from 2002 benefit from the $50 million pre-tax charge to write down acquisition goodwill for ExecuStay in 2002, offset by the $44 million pre-tax gain on the sale of our investment in Interval International in 2002, and further benefit from our 2003 receipt of a $36 million insurance settlement for lost management fees associated with the New York Marriott World Trade Center hotel, which was destroyed in the 2001 terrorist attacks.
Marriott Lodging
We consider lodging revenues and lodging financial results to be meaningful indicators of our performance because they measure our growth in profitability as a lodging company and enable investors to compare the sales and results of our lodging operations to those of other lodging companies.
Revenues ($ in millions)
2004 2003 2002
Full-Service ............................................................. $ 6,611 $ 5,876 $ 5,508 Select-Service ......................................................... 1,118 1,000 967 Extended-Stay ......................................................... 547 557 600 Timeshare ............................................................... 1,502 1,279 1,147 Total lodging ....................................................... 9,778 8,712 8,222 Synthetic Fuel ......................................................... 321 302 193 $ 10,099 $ 9,014 $ 8,415
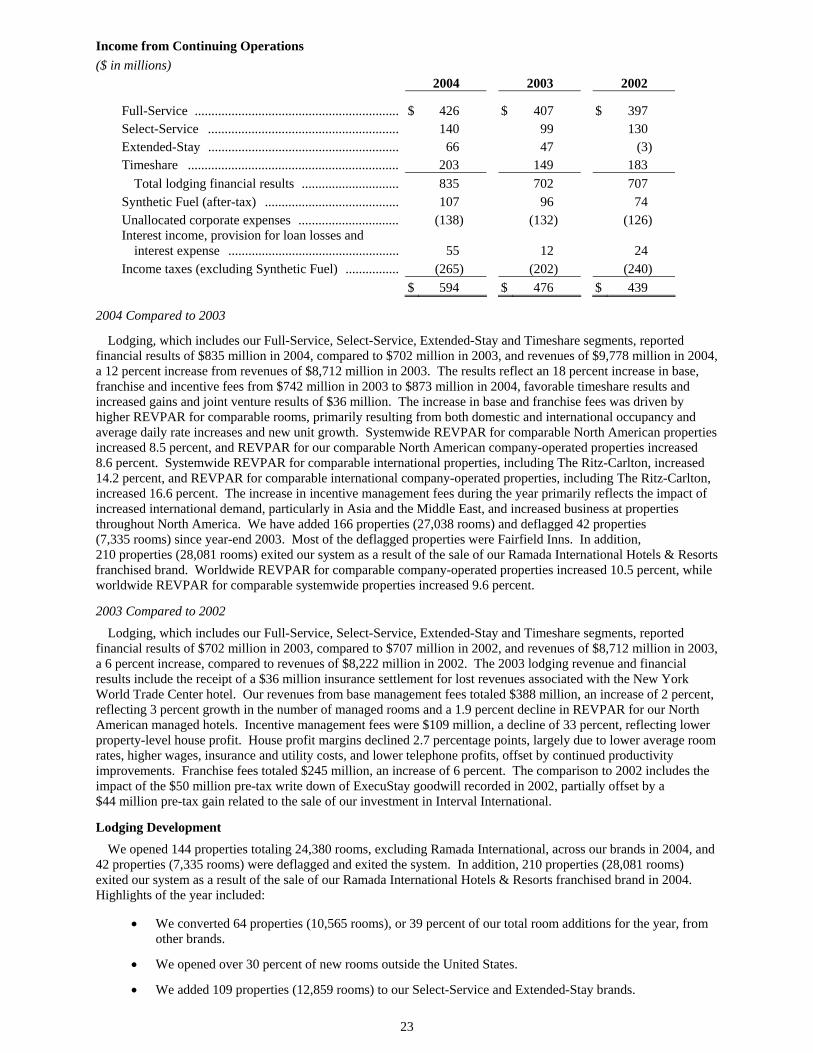
23
Income from Continuing Operations ($ in millions)
2004 2003 2002
Full-Service ............................................................. $ 426 $ 407 $ 397 Select-Service ......................................................... 140 99 130 Extended-Stay ......................................................... 66 47 (3) Timeshare ............................................................... 203 149 183 Total lodging financial results ............................. 835 702 707 Synthetic Fuel (after-tax) ........................................ 107 96 74 Unallocated corporate expenses .............................. (138) (132) (126) Interest income, provision for loan losses and interest expense ................................................... 55 12 24 Income taxes (excluding Synthetic Fuel) ................ (265) (202) (240) $ 594 $ 476 $ 439
2004 Compared to 2003
Lodging, which includes our Full-Service, Select-Service, Extended-Stay and Timeshare segments, reported financial results of $835 million in 2004, compared to $702 million in 2003, and revenues of $9,778 million in 2004, a 12 percent increase from revenues of $8,712 million in 2003. The results reflect an 18 percent increase in base, franchise and incentive fees from $742 million in 2003 to $873 million in 2004, favorable timeshare results and increased gains and joint venture results of $36 million. The increase in base and franchise fees was driven by higher REVPAR for comparable rooms, primarily resulting from both domestic and international occupancy and average daily rate increases and new unit growth. Systemwide REVPAR for comparable North American properties increased 8.5 percent, and REVPAR for our comparable North American company-operated properties increased 8.6 percent. Systemwide REVPAR for comparable international properties, including The Ritz-Carlton, increased 14.2 percent, and REVPAR for comparable international company-operated properties, including The Ritz-Carlton, increased 16.6 percent. The increase in incentive management fees during the year primarily reflects the impact of increased international demand, particularly in Asia and the Middle East, and increased business at properties throughout North America. We have added 166 properties (27,038 rooms) and deflagged 42 properties (7,335 rooms) since year-end 2003. Most of the deflagged properties were Fairfield Inns. In addition, 210 properties (28,081 rooms) exited our system as a result of the sale of our Ramada International Hotels & Resorts franchised brand. Worldwide REVPAR for comparable company-operated properties increased 10.5 percent, while worldwide REVPAR for comparable systemwide properties increased 9.6 percent.
2003 Compared to 2002
Lodging, which includes our Full-Service, Select-Service, Extended-Stay and Timeshare segments, reported financial results of $702 million in 2003, compared to $707 million in 2002, and revenues of $8,712 million in 2003, a 6 percent increase, compared to revenues of $8,222 million in 2002. The 2003 lodging revenue and financial results include the receipt of a $36 million insurance settlement for lost revenues associated with the New York World Trade Center hotel. Our revenues from base management fees totaled $388 million, an increase of 2 percent, reflecting 3 percent growth in the number of managed rooms and a 1.9 percent decline in REVPAR for our North American managed hotels. Incentive management fees were $109 million, a decline of 33 percent, reflecting lower property-level house profit. House profit margins declined 2.7 percentage points, largely due to lower average room rates, higher wages, insurance and utility costs, and lower telephone profits, offset by continued productivity improvements. Franchise fees totaled $245 million, an increase of 6 percent. The comparison to 2002 includes the impact of the $50 million pre-tax write down of ExecuStay goodwill recorded in 2002, partially offset by a $44 million pre-tax gain related to the sale of our investment in Interval International.
Lodging Development We opened 144 properties totaling 24,380 rooms, excluding Ramada International, across our brands in 2004, and 42 properties (7,335 rooms) were deflagged and exited the system. In addition, 210 properties (28,081 rooms) exited our system as a result of the sale of our Ramada International Hotels & Resorts franchised brand in 2004. Highlights of the year included:
• We converted 64 properties (10,565 rooms), or 39 percent of our total room additions for the year, from other brands.
• We opened over 30 percent of new rooms outside the United States.
• We added 109 properties (12,859 rooms) to our Select-Service and Extended-Stay brands.
24
• We opened our first Bulgari Hotel & Resort in Milan, Italy, in May 2004. The second property is expected to open in Bali in 2005.
• We opened three new Marriott Vacation Club International properties in Aruba; Phoenix, Arizona; and Myrtle Beach, South Carolina.
We currently have more than 55,000 rooms in our development pipeline and expect to add 25,000 to 30,000 hotel rooms and timeshare units to our system in 2005. We expect to deflag approximately 4,000 rooms during 2005. These growth plans are subject to numerous risks and uncertainties, many of which are outside of our control. See “Forward-Looking Statements” above and “Liquidity and Capital Resources” below.
REVPAR
We consider Revenue per Available Room (REVPAR) to be a meaningful indicator of our performance because it measures the period-over-period change in room revenues for comparable properties. We calculate REVPAR by dividing room sales for comparable properties by room nights available to guests for the period. REVPAR may not be comparable to similarly titled measures, such as revenues. The following table shows occupancy, average daily rate and REVPAR for each of our comparable principal established brands. We have not presented statistics for company-operated North American Fairfield Inn and SpringHill Suites properties here (or in the comparable information for the prior years presented later in this report) because we operate only a limited number of properties, as both of these brands are predominantly franchised and such information would not be meaningful for those brands (identified as “nm” in the tables below). Systemwide statistics include data from our franchised properties, in addition to our owned, leased and managed properties. For North American properties (except for The Ritz-Carlton, which includes January through December), the occupancy, average daily rate and REVPAR statistics used throughout this report for the fiscal year ended December 31, 2004, include the period from January 3, 2004, through December 31, 2004, while the statistics for the fiscal year ended January 2, 2004, include the period from January 4, 2003, through January 2, 2004.
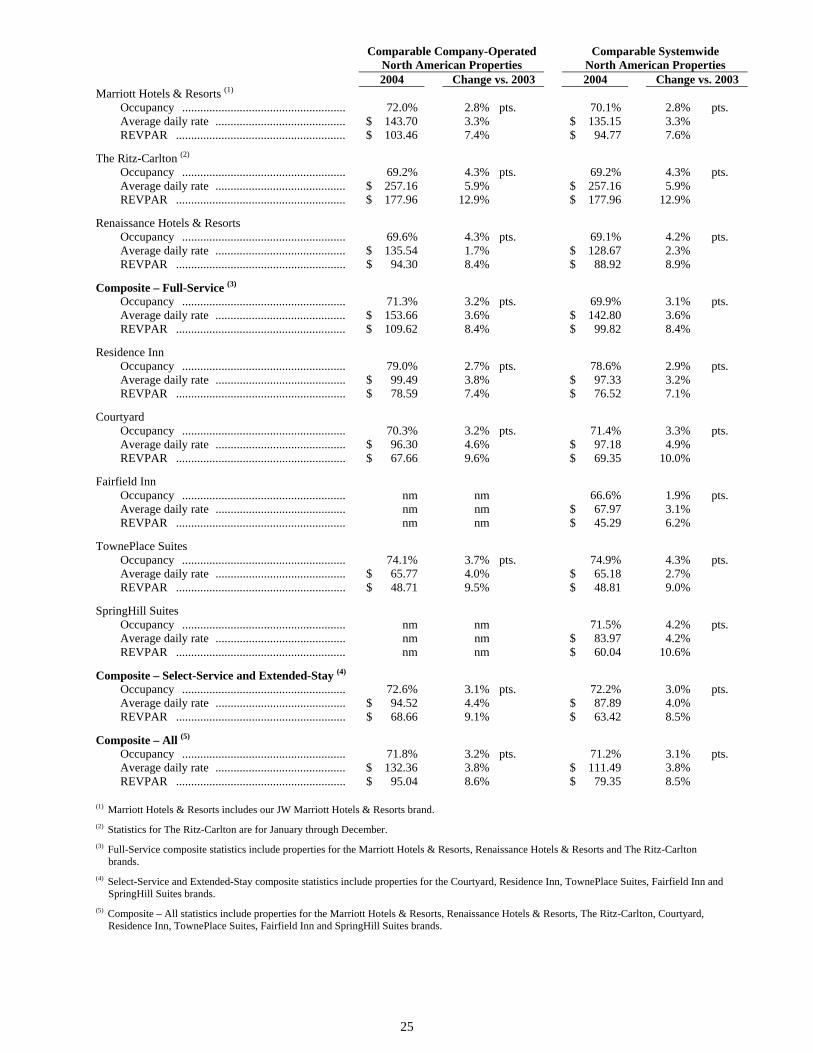
25
Comparable Company-Operated North American Properties
Comparable Systemwide North American Properties
2004 Change vs. 2003 2004 Change vs. 2003 Marriott Hotels & Resorts (1) Occupancy ...................................................... 72.0% 2.8% pts. 70.1% 2.8% pts. Average daily rate ........................................... $ 143.70 3.3% $ 135.15 3.3% REVPAR ........................................................ $ 103.46 7.4% $ 94.77 7.6%
The Ritz-Carlton (2) Occupancy ...................................................... 69.2% 4.3% pts. 69.2% 4.3% pts. Average daily rate ........................................... $ 257.16 5.9% $ 257.16 5.9% REVPAR ........................................................ $ 177.96 12.9% $ 177.96 12.9%
Renaissance Hotels & Resorts Occupancy ...................................................... 69.6% 4.3% pts. 69.1% 4.2% pts. Average daily rate ........................................... $ 135.54 1.7% $ 128.67 2.3% REVPAR ........................................................ $ 94.30 8.4% $ 88.92 8.9%
Composite – Full-Service (3) Occupancy ...................................................... 71.3% 3.2% pts. 69.9% 3.1% pts. Average daily rate ........................................... $ 153.66 3.6% $ 142.80 3.6% REVPAR ........................................................ $ 109.62 8.4% $ 99.82 8.4%
Residence Inn Occupancy ...................................................... 79.0% 2.7% pts. 78.6% 2.9% pts. Average daily rate ........................................... $ 99.49 3.8% $ 97.33 3.2% REVPAR ........................................................ $ 78.59 7.4% $ 76.52 7.1%
Courtyard Occupancy ...................................................... 70.3% 3.2% pts. 71.4% 3.3% pts. Average daily rate ........................................... $ 96.30 4.6% $ 97.18 4.9% REVPAR ........................................................ $ 67.66 9.6% $ 69.35 10.0%
Fairfield Inn Occupancy ...................................................... nm nm 66.6% 1.9% pts. Average daily rate ........................................... nm nm $ 67.97 3.1% REVPAR ........................................................ nm nm $ 45.29 6.2%
TownePlace Suites Occupancy ...................................................... 74.1% 3.7% pts. 74.9% 4.3% pts. Average daily rate ........................................... $ 65.77 4.0% $ 65.18 2.7% REVPAR ........................................................ $ 48.71 9.5% $ 48.81 9.0%
SpringHill Suites Occupancy ...................................................... nm nm 71.5% 4.2% pts. Average daily rate ........................................... nm nm $ 83.97 4.2% REVPAR ........................................................ nm nm $ 60.04 10.6%
Composite – Select-Service and Extended-Stay (4) Occupancy ...................................................... 72.6% 3.1% pts. 72.2% 3.0% pts. Average daily rate ........................................... $ 94.52 4.4% $ 87.89 4.0% REVPAR ........................................................ $ 68.66 9.1% $ 63.42 8.5%
Composite – All (5) Occupancy ...................................................... 71.8% 3.2% pts. 71.2% 3.1% pts. Average daily rate ........................................... $ 132.36 3.8% $ 111.49 3.8% REVPAR ........................................................ $ 95.04 8.6% $ 79.35 8.5% (1) Marriott Hotels & Resorts includes our JW Marriott Hotels & Resorts brand. (2) Statistics for The Ritz-Carlton are for January through December.
(3) Full-Service composite statistics include properties for the Marriott Hotels & Resorts, Renaissance Hotels & Resorts and The Ritz-Carlton
brands.
(4) Select-Service and Extended-Stay composite statistics include properties for the Courtyard, Residence Inn, TownePlace Suites, Fairfield Inn and SpringHill Suites brands.
(5) Composite – All statistics include properties for the Marriott Hotels & Resorts, Renaissance Hotels & Resorts, The Ritz-Carlton, Courtyard, Residence Inn, TownePlace Suites, Fairfield Inn and SpringHill Suites brands.
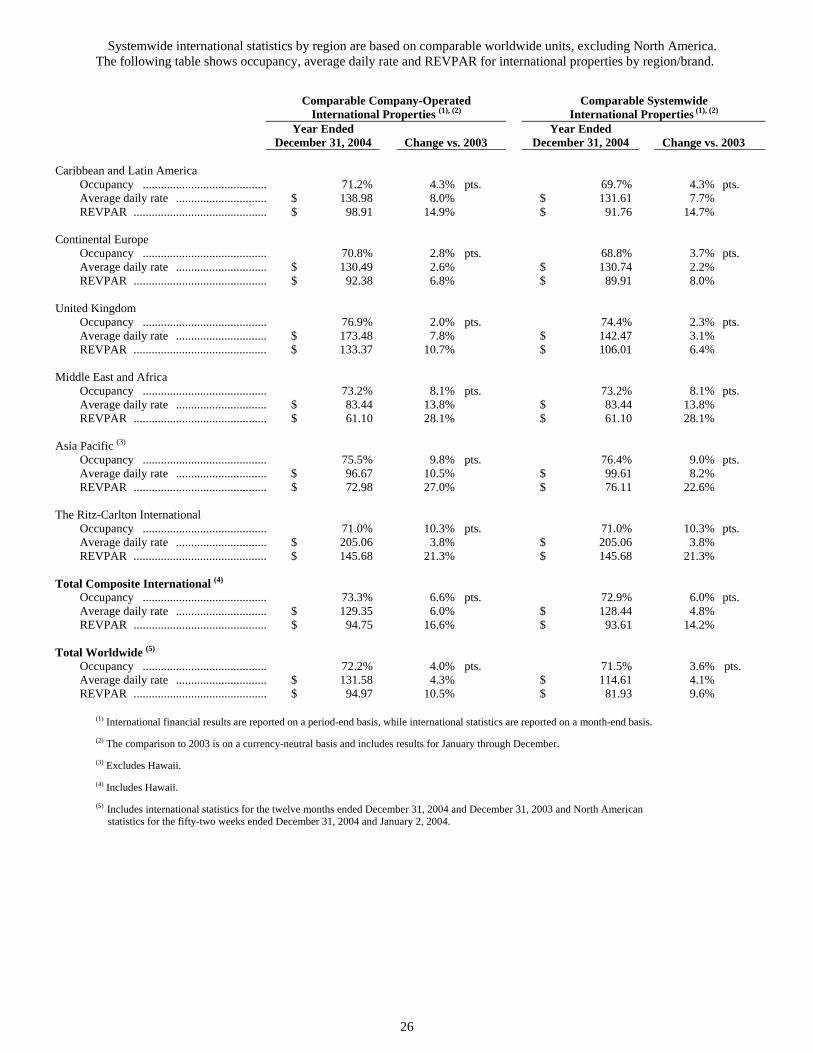
26
Systemwide international statistics by region are based on comparable worldwide units, excluding North America. The following table shows occupancy, average daily rate and REVPAR for international properties by region/brand.
Comparable Company-Operated
International Properties (1), (2) Comparable Systemwide
International Properties (1), (2) Year Ended
December 31, 2004 Change vs. 2003 Year Ended
December 31, 2004 Change vs. 2003 Caribbean and Latin America
Occupancy ......................................... 71.2% 4.3% pts. 69.7% 4.3% pts. Average daily rate .............................. $ 138.98 8.0% $ 131.61 7.7% REVPAR ............................................ $ 98.91 14.9% $ 91.76 14.7% Continental Europe Occupancy ......................................... 70.8% 2.8% pts. 68.8% 3.7% pts. Average daily rate .............................. $ 130.49 2.6% $ 130.74 2.2% REVPAR ............................................ $ 92.38 6.8% $ 89.91 8.0% United Kingdom Occupancy ......................................... 76.9% 2.0% pts. 74.4% 2.3% pts. Average daily rate .............................. $ 173.48 7.8% $ 142.47 3.1% REVPAR ............................................ $ 133.37 10.7% $ 106.01 6.4% Middle East and Africa Occupancy ......................................... 73.2% 8.1% pts. 73.2% 8.1% pts. Average daily rate .............................. $ 83.44 13.8% $ 83.44 13.8% REVPAR ............................................ $ 61.10 28.1% $ 61.10 28.1% Asia Pacific (3) Occupancy ......................................... 75.5% 9.8% pts. 76.4% 9.0% pts. Average daily rate .............................. $ 96.67 10.5% $ 99.61 8.2% REVPAR ............................................ $ 72.98 27.0% $ 76.11 22.6% The Ritz-Carlton International Occupancy ......................................... 71.0% 10.3% pts. 71.0% 10.3% pts. Average daily rate .............................. $ 205.06 3.8% $ 205.06 3.8% REVPAR ............................................ $ 145.68 21.3% $ 145.68 21.3% Total Composite International (4) Occupancy ......................................... 73.3% 6.6% pts. 72.9% 6.0% pts. Average daily rate .............................. $ 129.35 6.0% $ 128.44 4.8% REVPAR ............................................ $ 94.75 16.6% $ 93.61 14.2% Total Worldwide (5) Occupancy ......................................... 72.2% 4.0% pts. 71.5% 3.6% pts. Average daily rate .............................. $ 131.58 4.3% $ 114.61 4.1% REVPAR ............................................ $ 94.97 10.5% $ 81.93 9.6%
(1) International financial results are reported on a period-end basis, while international statistics are reported on a month-end basis. (2) The comparison to 2003 is on a currency-neutral basis and includes results for January through December. (3) Excludes Hawaii. (4) Includes Hawaii. (5) Includes international statistics for the twelve months ended December 31, 2004 and December 31, 2003 and North American statistics for the fifty-two weeks ended December 31, 2004 and January 2, 2004.
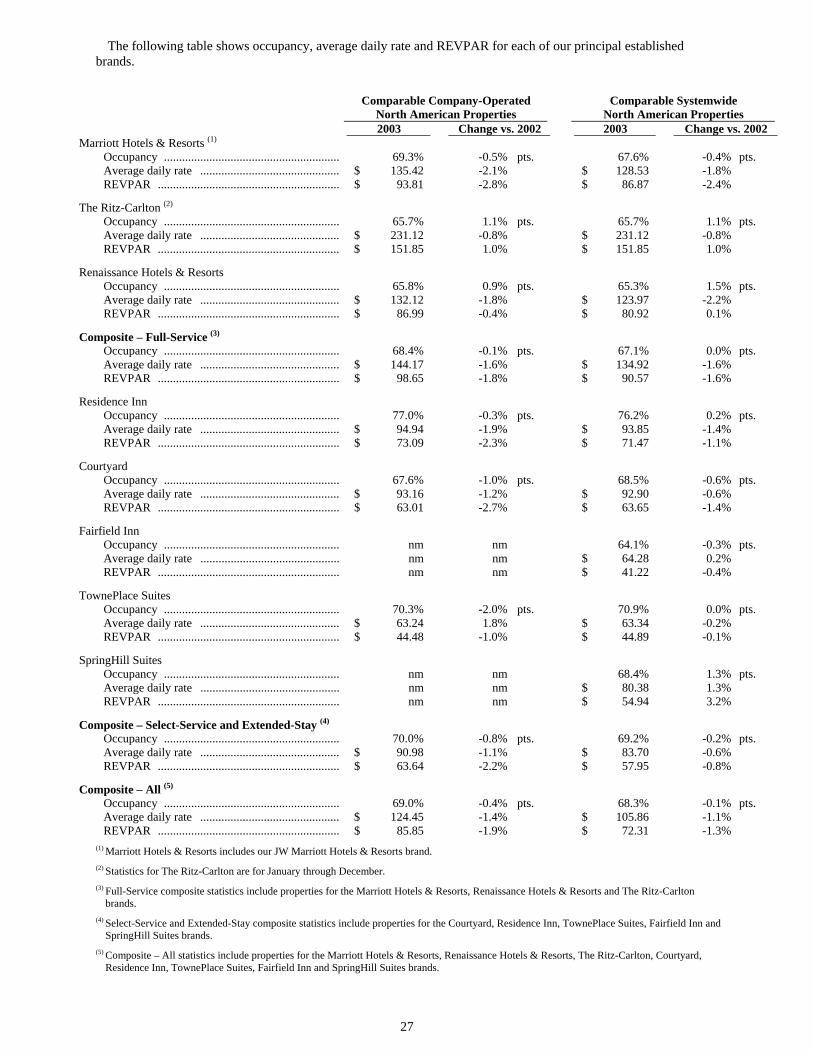
27
The following table shows occupancy, average daily rate and REVPAR for each of our principal established brands.
Comparable Company-Operated
North American Properties Comparable Systemwide
North American Properties 2003 Change vs. 2002 2003 Change vs. 2002 Marriott Hotels & Resorts (1) Occupancy .......................................................... 69.3% -0.5% pts. 67.6% -0.4% pts. Average daily rate .............................................. $ 135.42 -2.1% $ 128.53 -1.8% REVPAR ............................................................ $ 93.81 -2.8% $ 86.87 -2.4%
The Ritz-Carlton (2) Occupancy .......................................................... 65.7% 1.1% pts. 65.7% 1.1% pts. Average daily rate .............................................. $ 231.12 -0.8% $ 231.12 -0.8% REVPAR ............................................................ $ 151.85 1.0% $ 151.85 1.0%
Renaissance Hotels & Resorts Occupancy .......................................................... 65.8% 0.9% pts. 65.3% 1.5% pts. Average daily rate .............................................. $ 132.12 -1.8% $ 123.97 -2.2% REVPAR ............................................................ $ 86.99 -0.4% $ 80.92 0.1%
Composite – Full-Service (3) Occupancy .......................................................... 68.4% -0.1% pts. 67.1% 0.0% pts. Average daily rate .............................................. $ 144.17 -1.6% $ 134.92 -1.6% REVPAR ............................................................ $ 98.65 -1.8% $ 90.57 -1.6%
Residence Inn Occupancy .......................................................... 77.0% -0.3% pts. 76.2% 0.2% pts. Average daily rate .............................................. $ 94.94 -1.9% $ 93.85 -1.4% REVPAR ............................................................ $ 73.09 -2.3% $ 71.47 -1.1%
Courtyard Occupancy .......................................................... 67.6% -1.0% pts. 68.5% -0.6% pts. Average daily rate .............................................. $ 93.16 -1.2% $ 92.90 -0.6% REVPAR ............................................................ $ 63.01 -2.7% $ 63.65 -1.4%
Fairfield Inn Occupancy .......................................................... nm nm 64.1% -0.3% pts. Average daily rate .............................................. nm nm $ 64.28 0.2% REVPAR ............................................................ nm nm $ 41.22 -0.4%
TownePlace Suites Occupancy .......................................................... 70.3% -2.0% pts. 70.9% 0.0% pts. Average daily rate .............................................. $ 63.24 1.8% $ 63.34 -0.2% REVPAR ............................................................ $ 44.48 -1.0% $ 44.89 -0.1%
SpringHill Suites Occupancy .......................................................... nm nm 68.4% 1.3% pts. Average daily rate .............................................. nm nm $ 80.38 1.3% REVPAR ............................................................ nm nm $ 54.94 3.2%
Composite – Select-Service and Extended-Stay (4) Occupancy .......................................................... 70.0% -0.8% pts. 69.2% -0.2% pts. Average daily rate .............................................. $ 90.98 -1.1% $ 83.70 -0.6% REVPAR ............................................................ $ 63.64 -2.2% $ 57.95 -0.8%
Composite – All (5) Occupancy .......................................................... 69.0% -0.4% pts. 68.3% -0.1% pts. Average daily rate .............................................. $ 124.45 -1.4% $ 105.86 -1.1% REVPAR ............................................................ $ 85.85 -1.9% $ 72.31 -1.3%
(1) Marriott Hotels & Resorts includes our JW Marriott Hotels & Resorts brand.
(2) Statistics for The Ritz-Carlton are for January through December.
(3) Full-Service composite statistics include properties for the Marriott Hotels & Resorts, Renaissance Hotels & Resorts and The Ritz-Carlton
brands.
(4) Select-Service and Extended-Stay composite statistics include properties for the Courtyard, Residence Inn, TownePlace Suites, Fairfield Inn and SpringHill Suites brands.
(5) Composite – All statistics include properties for the Marriott Hotels & Resorts, Renaissance Hotels & Resorts, The Ritz-Carlton, Courtyard, Residence Inn, TownePlace Suites, Fairfield Inn and SpringHill Suites brands.
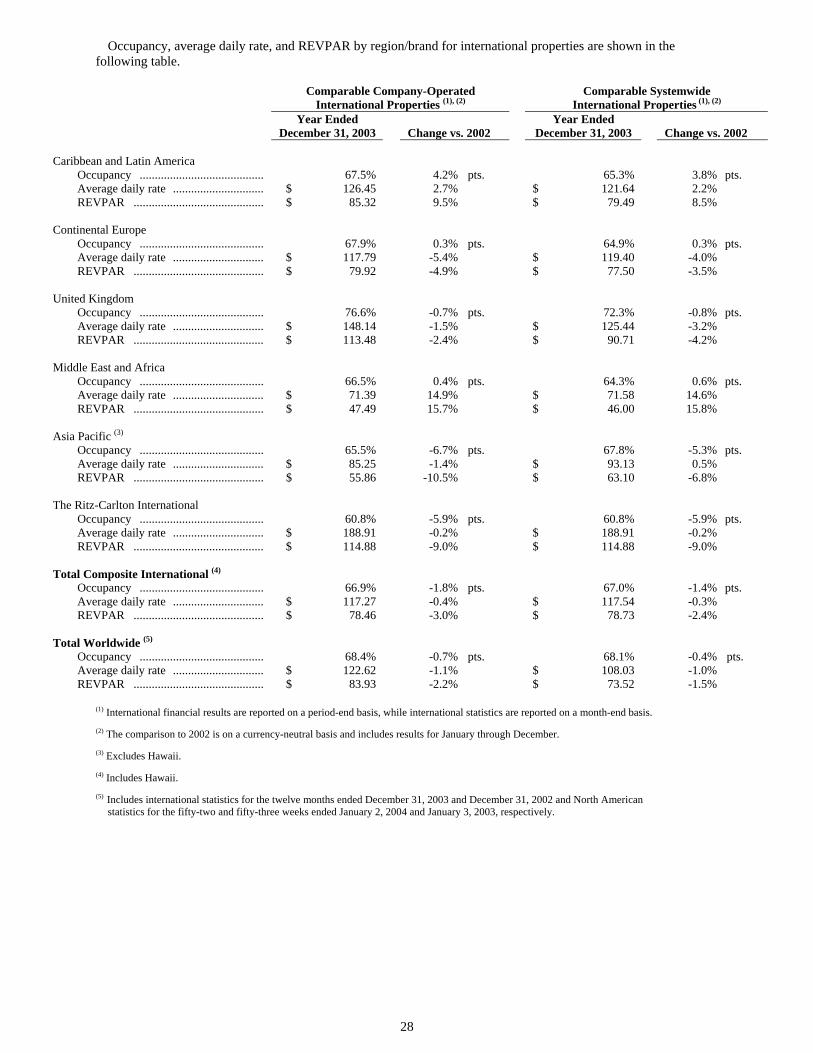
28
Occupancy, average daily rate, and REVPAR by region/brand for international properties are shown in the following table.
Comparable Company-Operated
International Properties (1), (2) Comparable Systemwide
International Properties (1), (2) Year Ended
December 31, 2003 Change vs. 2002 Year Ended
December 31, 2003 Change vs. 2002 Caribbean and Latin America
Occupancy ......................................... 67.5% 4.2% pts. 65.3% 3.8% pts. Average daily rate .............................. $ 126.45 2.7% $ 121.64 2.2% REVPAR ........................................... $ 85.32 9.5% $ 79.49 8.5% Continental Europe Occupancy ......................................... 67.9% 0.3% pts. 64.9% 0.3% pts. Average daily rate .............................. $ 117.79 -5.4% $ 119.40 -4.0% REVPAR ........................................... $ 79.92 -4.9% $ 77.50 -3.5% United Kingdom Occupancy ......................................... 76.6% -0.7% pts. 72.3% -0.8% pts. Average daily rate .............................. $ 148.14 -1.5% $ 125.44 -3.2% REVPAR ........................................... $ 113.48 -2.4% $ 90.71 -4.2% Middle East and Africa Occupancy ......................................... 66.5% 0.4% pts. 64.3% 0.6% pts. Average daily rate .............................. $ 71.39 14.9% $ 71.58 14.6% REVPAR ........................................... $ 47.49 15.7% $ 46.00 15.8% Asia Pacific (3) Occupancy ......................................... 65.5% -6.7% pts. 67.8% -5.3% pts. Average daily rate .............................. $ 85.25 -1.4% $ 93.13 0.5% REVPAR ........................................... $ 55.86 -10.5% $ 63.10 -6.8% The Ritz-Carlton International Occupancy ......................................... 60.8% -5.9% pts. 60.8% -5.9% pts. Average daily rate .............................. $ 188.91 -0.2% $ 188.91 -0.2% REVPAR ........................................... $ 114.88 -9.0% $ 114.88 -9.0% Total Composite International (4) Occupancy ......................................... 66.9% -1.8% pts. 67.0% -1.4% pts. Average daily rate .............................. $ 117.27 -0.4% $ 117.54 -0.3% REVPAR ........................................... $ 78.46 -3.0% $ 78.73 -2.4% Total Worldwide (5) Occupancy ......................................... 68.4% -0.7% pts. 68.1% -0.4% pts. Average daily rate .............................. $ 122.62 -1.1% $ 108.03 -1.0% REVPAR ........................................... $ 83.93 -2.2% $ 73.52 -1.5%
(1) International financial results are reported on a period-end basis, while international statistics are reported on a month-end basis. (2) The comparison to 2002 is on a currency-neutral basis and includes results for January through December. (3) Excludes Hawaii. (4) Includes Hawaii. (5) Includes international statistics for the twelve months ended December 31, 2003 and December 31, 2002 and North American statistics for the fifty-two and fifty-three weeks ended January 2, 2004 and January 3, 2003, respectively.
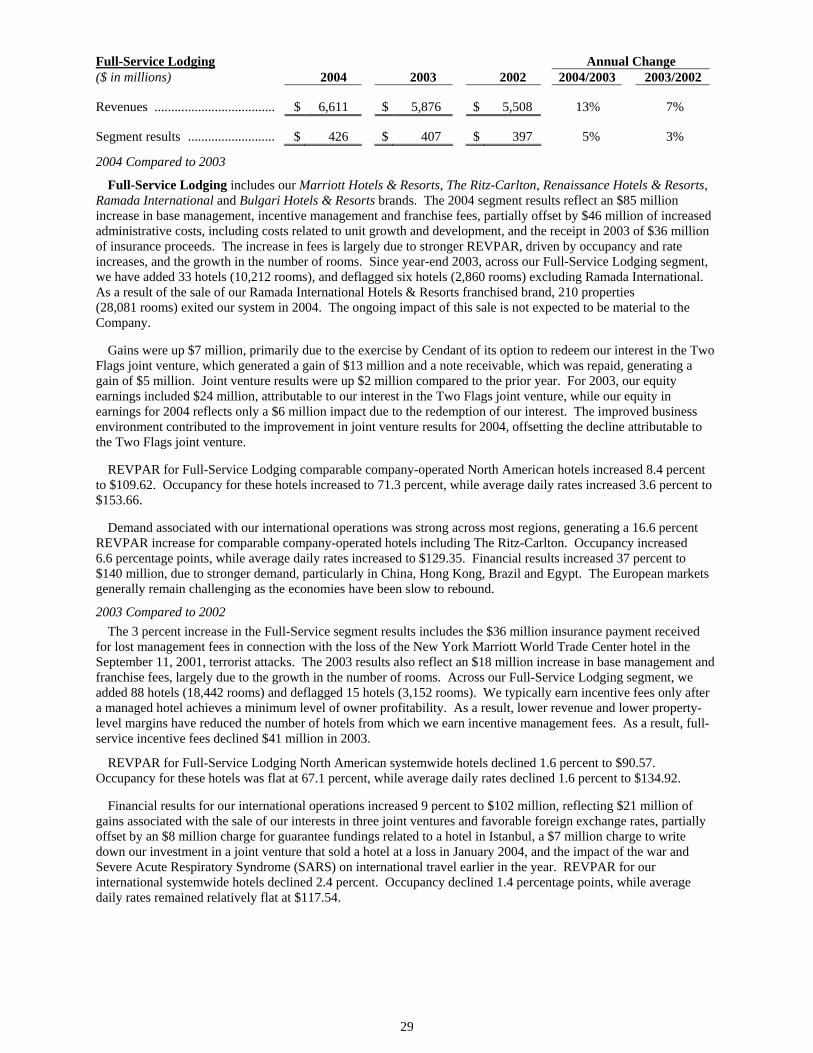
29
Full-Service Lodging Annual Change ($ in millions) 2004 2003 2002 2004/2003 2003/2002 Revenues .................................... $ 6,611 $ 5,876 $ 5,508 13% 7% Segment results .......................... $ 426 $ 407 $ 397 5% 3%
2004 Compared to 2003
Full-Service Lodging includes our Marriott Hotels & Resorts, The Ritz-Carlton, Renaissance Hotels & Resorts, Ramada International and Bulgari Hotels & Resorts brands. The 2004 segment results reflect an $85 million increase in base management, incentive management and franchise fees, partially offset by $46 million of increased administrative costs, including costs related to unit growth and development, and the receipt in 2003 of $36 million of insurance proceeds. The increase in fees is largely due to stronger REVPAR, driven by occupancy and rate increases, and the growth in the number of rooms. Since year-end 2003, across our Full-Service Lodging segment, we have added 33 hotels (10,212 rooms), and deflagged six hotels (2,860 rooms) excluding Ramada International. As a result of the sale of our Ramada International Hotels & Resorts franchised brand, 210 properties (28,081 rooms) exited our system in 2004. The ongoing impact of this sale is not expected to be material to the Company. Gains were up $7 million, primarily due to the exercise by Cendant of its option to redeem our interest in the Two Flags joint venture, which generated a gain of $13 million and a note receivable, which was repaid, generating a gain of $5 million. Joint venture results were up $2 million compared to the prior year. For 2003, our equity earnings included $24 million, attributable to our interest in the Two Flags joint venture, while our equity in earnings for 2004 reflects only a $6 million impact due to the redemption of our interest. The improved business environment contributed to the improvement in joint venture results for 2004, offsetting the decline attributable to the Two Flags joint venture. REVPAR for Full-Service Lodging comparable company-operated North American hotels increased 8.4 percent to $109.62. Occupancy for these hotels increased to 71.3 percent, while average daily rates increased 3.6 percent to $153.66. Demand associated with our international operations was strong across most regions, generating a 16.6 percent REVPAR increase for comparable company-operated hotels including The Ritz-Carlton. Occupancy increased 6.6 percentage points, while average daily rates increased to $129.35. Financial results increased 37 percent to $140 million, due to stronger demand, particularly in China, Hong Kong, Brazil and Egypt. The European markets generally remain challenging as the economies have been slow to rebound.
2003 Compared to 2002 The 3 percent increase in the Full-Service segment results includes the $36 million insurance payment received for lost management fees in connection with the loss of the New York Marriott World Trade Center hotel in the September 11, 2001, terrorist attacks. The 2003 results also reflect an $18 million increase in base management and franchise fees, largely due to the growth in the number of rooms. Across our Full-Service Lodging segment, we added 88 hotels (18,442 rooms) and deflagged 15 hotels (3,152 rooms). We typically earn incentive fees only after a managed hotel achieves a minimum level of owner profitability. As a result, lower revenue and lower property-level margins have reduced the number of hotels from which we earn incentive management fees. As a result, full-service incentive fees declined $41 million in 2003.
REVPAR for Full-Service Lodging North American systemwide hotels declined 1.6 percent to $90.57. Occupancy for these hotels was flat at 67.1 percent, while average daily rates declined 1.6 percent to $134.92. Financial results for our international operations increased 9 percent to $102 million, reflecting $21 million of gains associated with the sale of our interests in three joint ventures and favorable foreign exchange rates, partially offset by an $8 million charge for guarantee fundings related to a hotel in Istanbul, a $7 million charge to write down our investment in a joint venture that sold a hotel at a loss in January 2004, and the impact of the war and Severe Acute Respiratory Syndrome (SARS) on international travel earlier in the year. REVPAR for our international systemwide hotels declined 2.4 percent. Occupancy declined 1.4 percentage points, while average daily rates remained relatively flat at $117.54.
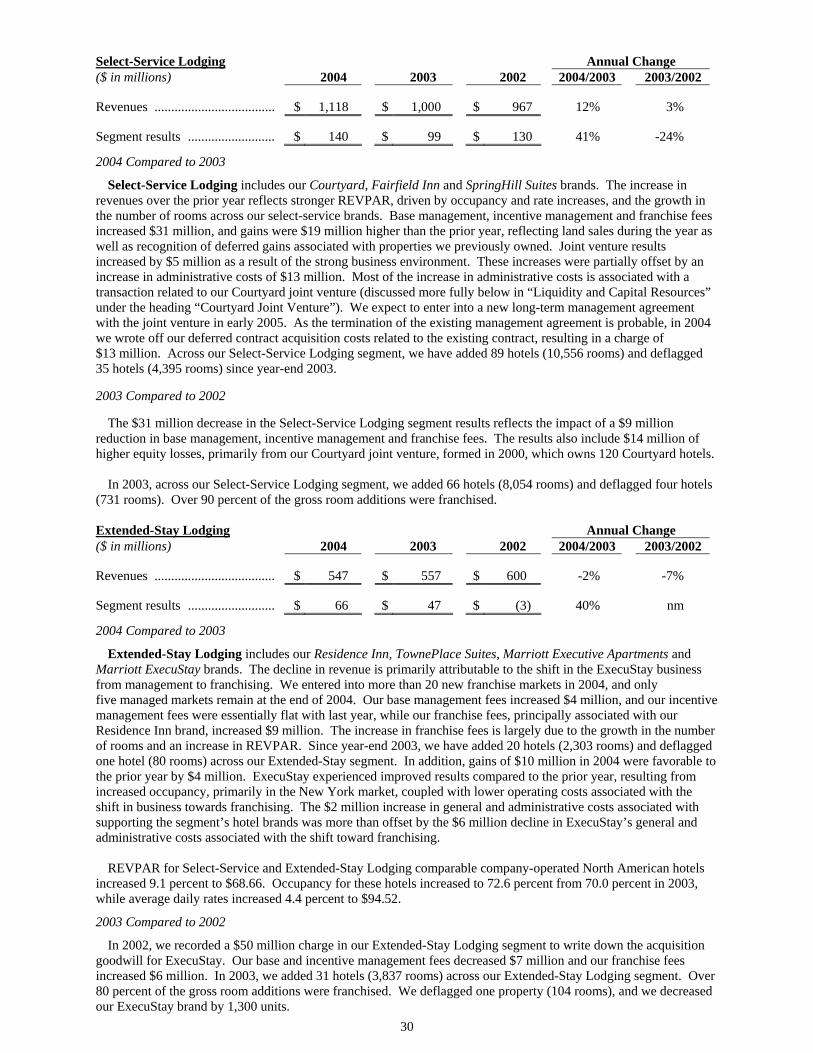
30
Select-Service Lodging Annual Change ($ in millions) 2004 2003 2002 2004/2003 2003/2002 Revenues .................................... $ 1,118 $ 1,000 $ 967 12% 3% Segment results .......................... $ 140 $ 99 $ 130 41% -24%
2004 Compared to 2003
Select-Service Lodging includes our Courtyard, Fairfield Inn and SpringHill Suites brands. The increase in revenues over the prior year reflects stronger REVPAR, driven by occupancy and rate increases, and the growth in the number of rooms across our select-service brands. Base management, incentive management and franchise fees increased $31 million, and gains were $19 million higher than the prior year, reflecting land sales during the year as well as recognition of deferred gains associated with properties we previously owned. Joint venture results increased by $5 million as a result of the strong business environment. These increases were partially offset by an increase in administrative costs of $13 million. Most of the increase in administrative costs is associated with a transaction related to our Courtyard joint venture (discussed more fully below in “Liquidity and Capital Resources” under the heading “Courtyard Joint Venture”). We expect to enter into a new long-term management agreement with the joint venture in early 2005. As the termination of the existing management agreement is probable, in 2004 we wrote off our deferred contract acquisition costs related to the existing contract, resulting in a charge of $13 million. Across our Select-Service Lodging segment, we have added 89 hotels (10,556 rooms) and deflagged 35 hotels (4,395 rooms) since year-end 2003.
2003 Compared to 2002
The $31 million decrease in the Select-Service Lodging segment results reflects the impact of a $9 million reduction in base management, incentive management and franchise fees. The results also include $14 million of higher equity losses, primarily from our Courtyard joint venture, formed in 2000, which owns 120 Courtyard hotels. In 2003, across our Select-Service Lodging segment, we added 66 hotels (8,054 rooms) and deflagged four hotels (731 rooms). Over 90 percent of the gross room additions were franchised. Extended-Stay Lodging Annual Change ($ in millions) 2004 2003 2002 2004/2003 2003/2002 Revenues .................................... $ 547 $ 557 $ 600 -2% -7% Segment results .......................... $ 66 $ 47 $ (3) 40% nm
2004 Compared to 2003
Extended-Stay Lodging includes our Residence Inn, TownePlace Suites, Marriott Executive Apartments and Marriott ExecuStay brands. The decline in revenue is primarily attributable to the shift in the ExecuStay business from management to franchising. We entered into more than 20 new franchise markets in 2004, and only five managed markets remain at the end of 2004. Our base management fees increased $4 million, and our incentive management fees were essentially flat with last year, while our franchise fees, principally associated with our Residence Inn brand, increased $9 million. The increase in franchise fees is largely due to the growth in the number of rooms and an increase in REVPAR. Since year-end 2003, we have added 20 hotels (2,303 rooms) and deflagged one hotel (80 rooms) across our Extended-Stay segment. In addition, gains of $10 million in 2004 were favorable to the prior year by $4 million. ExecuStay experienced improved results compared to the prior year, resulting from increased occupancy, primarily in the New York market, coupled with lower operating costs associated with the shift in business towards franchising. The $2 million increase in general and administrative costs associated with supporting the segment’s hotel brands was more than offset by the $6 million decline in ExecuStay’s general and administrative costs associated with the shift toward franchising. REVPAR for Select-Service and Extended-Stay Lodging comparable company-operated North American hotels increased 9.1 percent to $68.66. Occupancy for these hotels increased to 72.6 percent from 70.0 percent in 2003, while average daily rates increased 4.4 percent to $94.52.
2003 Compared to 2002
In 2002, we recorded a $50 million charge in our Extended-Stay Lodging segment to write down the acquisition goodwill for ExecuStay. Our base and incentive management fees decreased $7 million and our franchise fees increased $6 million. In 2003, we added 31 hotels (3,837 rooms) across our Extended-Stay Lodging segment. Over 80 percent of the gross room additions were franchised. We deflagged one property (104 rooms), and we decreased our ExecuStay brand by 1,300 units.
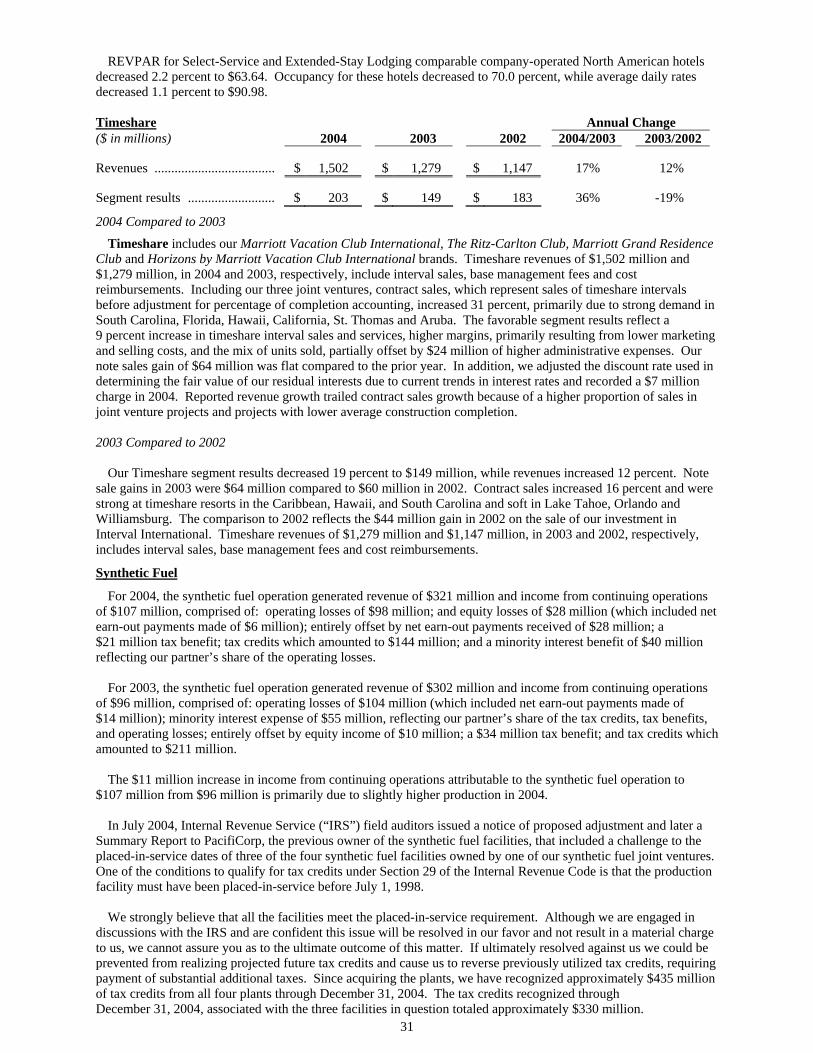
31
REVPAR for Select-Service and Extended-Stay Lodging comparable company-operated North American hotels decreased 2.2 percent to $63.64. Occupancy for these hotels decreased to 70.0 percent, while average daily rates decreased 1.1 percent to $90.98. Timeshare Annual Change ($ in millions) 2004 2003 2002 2004/2003 2003/2002 Revenues .................................... $ 1,502 $ 1,279 $ 1,147 17% 12% Segment results .......................... $ 203 $ 149 $ 183 36% -19%
2004 Compared to 2003
Timeshare includes our Marriott Vacation Club International, The Ritz-Carlton Club, Marriott Grand Residence Club and Horizons by Marriott Vacation Club International brands. Timeshare revenues of $1,502 million and $1,279 million, in 2004 and 2003, respectively, include interval sales, base management fees and cost reimbursements. Including our three joint ventures, contract sales, which represent sales of timeshare intervals before adjustment for percentage of completion accounting, increased 31 percent, primarily due to strong demand in South Carolina, Florida, Hawaii, California, St. Thomas and Aruba. The favorable segment results reflect a 9 percent increase in timeshare interval sales and services, higher margins, primarily resulting from lower marketing and selling costs, and the mix of units sold, partially offset by $24 million of higher administrative expenses. Our note sales gain of $64 million was flat compared to the prior year. In addition, we adjusted the discount rate used in determining the fair value of our residual interests due to current trends in interest rates and recorded a $7 million charge in 2004. Reported revenue growth trailed contract sales growth because of a higher proportion of sales in joint venture projects and projects with lower average construction completion. 2003 Compared to 2002 Our Timeshare segment results decreased 19 percent to $149 million, while revenues increased 12 percent. Note sale gains in 2003 were $64 million compared to $60 million in 2002. Contract sales increased 16 percent and were strong at timeshare resorts in the Caribbean, Hawaii, and South Carolina and soft in Lake Tahoe, Orlando and Williamsburg. The comparison to 2002 reflects the $44 million gain in 2002 on the sale of our investment in Interval International. Timeshare revenues of $1,279 million and $1,147 million, in 2003 and 2002, respectively, includes interval sales, base management fees and cost reimbursements.
Synthetic Fuel
For 2004, the synthetic fuel operation generated revenue of $321 million and income from continuing operations of $107 million, comprised of: operating losses of $98 million; and equity losses of $28 million (which included net earn-out payments made of $6 million); entirely offset by net earn-out payments received of $28 million; a $21 million tax benefit; tax credits which amounted to $144 million; and a minority interest benefit of $40 million reflecting our partner’s share of the operating losses. For 2003, the synthetic fuel operation generated revenue of $302 million and income from continuing operations of $96 million, comprised of: operating losses of $104 million (which included net earn-out payments made of $14 million); minority interest expense of $55 million, reflecting our partner’s share of the tax credits, tax benefits, and operating losses; entirely offset by equity income of $10 million; a $34 million tax benefit; and tax credits which amounted to $211 million. The $11 million increase in income from continuing operations attributable to the synthetic fuel operation to $107 million from $96 million is primarily due to slightly higher production in 2004. In July 2004, Internal Revenue Service (“IRS”) field auditors issued a notice of proposed adjustment and later a Summary Report to PacifiCorp, the previous owner of the synthetic fuel facilities, that included a challenge to the placed-in-service dates of three of the four synthetic fuel facilities owned by one of our synthetic fuel joint ventures. One of the conditions to qualify for tax credits under Section 29 of the Internal Revenue Code is that the production facility must have been placed-in-service before July 1, 1998. We strongly believe that all the facilities meet the placed-in-service requirement. Although we are engaged in discussions with the IRS and are confident this issue will be resolved in our favor and not result in a material charge to us, we cannot assure you as to the ultimate outcome of this matter. If ultimately resolved against us we could be prevented from realizing projected future tax credits and cause us to reverse previously utilized tax credits, requiring payment of substantial additional taxes. Since acquiring the plants, we have recognized approximately $435 million of tax credits from all four plants through December 31, 2004. The tax credits recognized through December 31, 2004, associated with the three facilities in question totaled approximately $330 million.
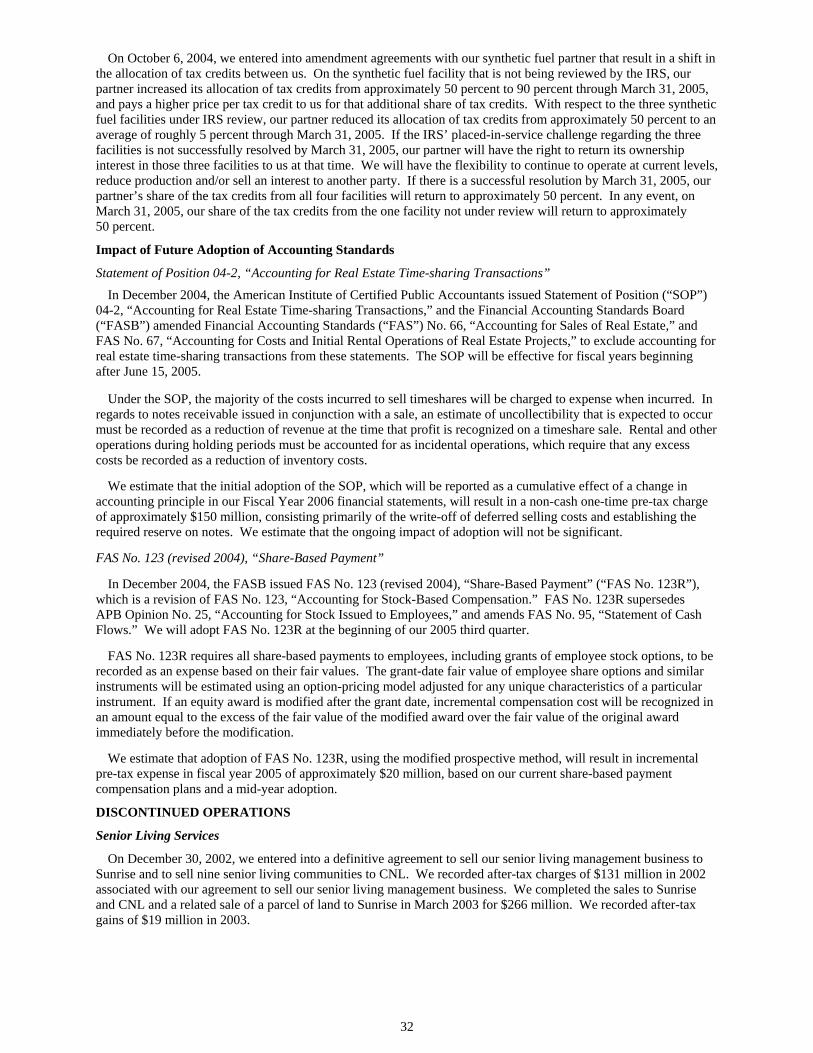
32
On October 6, 2004, we entered into amendment agreements with our synthetic fuel partner that result in a shift in the allocation of tax credits between us. On the synthetic fuel facility that is not being reviewed by the IRS, our partner increased its allocation of tax credits from approximately 50 percent to 90 percent through March 31, 2005, and pays a higher price per tax credit to us for that additional share of tax credits. With respect to the three synthetic fuel facilities under IRS review, our partner reduced its allocation of tax credits from approximately 50 percent to an average of roughly 5 percent through March 31, 2005. If the IRS’ placed-in-service challenge regarding the three facilities is not successfully resolved by March 31, 2005, our partner will have the right to return its ownership interest in those three facilities to us at that time. We will have the flexibility to continue to operate at current levels, reduce production and/or sell an interest to another party. If there is a successful resolution by March 31, 2005, our partner’s share of the tax credits from all four facilities will return to approximately 50 percent. In any event, on March 31, 2005, our share of the tax credits from the one facility not under review will return to approximately 50 percent.
Impact of Future Adoption of Accounting Standards
Statement of Position 04-2, “Accounting for Real Estate Time-sharing Transactions”
In December 2004, the American Institute of Certified Public Accountants issued Statement of Position (“SOP”) 04-2, “Accounting for Real Estate Time-sharing Transactions,” and the Financial Accounting Standards Board (“FASB”) amended Financial Accounting Standards (“FAS”) No. 66, “Accounting for Sales of Real Estate,” and FAS No. 67, “Accounting for Costs and Initial Rental Operations of Real Estate Projects,” to exclude accounting for real estate time-sharing transactions from these statements. The SOP will be effective for fiscal years beginning after June 15, 2005. Under the SOP, the majority of the costs incurred to sell timeshares will be charged to expense when incurred. In regards to notes receivable issued in conjunction with a sale, an estimate of uncollectibility that is expected to occur must be recorded as a reduction of revenue at the time that profit is recognized on a timeshare sale. Rental and other operations during holding periods must be accounted for as incidental operations, which require that any excess costs be recorded as a reduction of inventory costs. We estimate that the initial adoption of the SOP, which will be reported as a cumulative effect of a change in accounting principle in our Fiscal Year 2006 financial statements, will result in a non-cash one-time pre-tax charge of approximately $150 million, consisting primarily of the write-off of deferred selling costs and establishing the required reserve on notes. We estimate that the ongoing impact of adoption will not be significant. FAS No. 123 (revised 2004), “Share-Based Payment” In December 2004, the FASB issued FAS No. 123 (revised 2004), “Share-Based Payment” (“FAS No. 123R”), which is a revision of FAS No. 123, “Accounting for Stock-Based Compensation.” FAS No. 123R supersedes APB Opinion No. 25, “Accounting for Stock Issued to Employees,” and amends FAS No. 95, “Statement of Cash Flows.” We will adopt FAS No. 123R at the beginning of our 2005 third quarter. FAS No. 123R requires all share-based payments to employees, including grants of employee stock options, to be recorded as an expense based on their fair values. The grant-date fair value of employee share options and similar instruments will be estimated using an option-pricing model adjusted for any unique characteristics of a particular instrument. If an equity award is modified after the grant date, incremental compensation cost will be recognized in an amount equal to the excess of the fair value of the modified award over the fair value of the original award immediately before the modification. We estimate that adoption of FAS No. 123R, using the modified prospective method, will result in incremental pre-tax expense in fiscal year 2005 of approximately $20 million, based on our current share-based payment compensation plans and a mid-year adoption.
DISCONTINUED OPERATIONS
Senior Living Services
On December 30, 2002, we entered into a definitive agreement to sell our senior living management business to Sunrise and to sell nine senior living communities to CNL. We recorded after-tax charges of $131 million in 2002 associated with our agreement to sell our senior living management business. We completed the sales to Sunrise and CNL and a related sale of a parcel of land to Sunrise in March 2003 for $266 million. We recorded after-tax gains of $19 million in 2003.
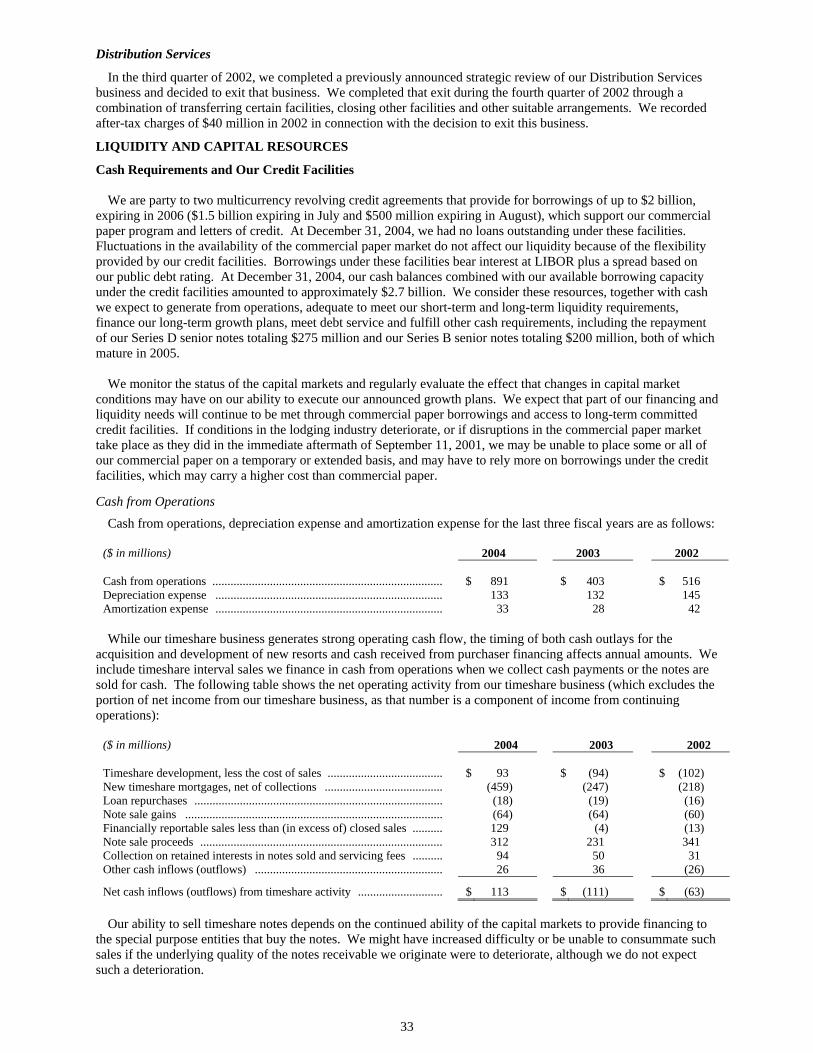
33
Distribution Services
In the third quarter of 2002, we completed a previously announced strategic review of our Distribution Services business and decided to exit that business. We completed that exit during the fourth quarter of 2002 through a combination of transferring certain facilities, closing other facilities and other suitable arrangements. We recorded after-tax charges of $40 million in 2002 in connection with the decision to exit this business.
LIQUIDITY AND CAPITAL RESOURCES
Cash Requirements and Our Credit Facilities We are party to two multicurrency revolving credit agreements that provide for borrowings of up to $2 billion, expiring in 2006 ($1.5 billion expiring in July and $500 million expiring in August), which support our commercial paper program and letters of credit. At December 31, 2004, we had no loans outstanding under these facilities. Fluctuations in the availability of the commercial paper market do not affect our liquidity because of the flexibility provided by our credit facilities. Borrowings under these facilities bear interest at LIBOR plus a spread based on our public debt rating. At December 31, 2004, our cash balances combined with our available borrowing capacity under the credit facilities amounted to approximately $2.7 billion. We consider these resources, together with cash we expect to generate from operations, adequate to meet our short-term and long-term liquidity requirements, finance our long-term growth plans, meet debt service and fulfill other cash requirements, including the repayment of our Series D senior notes totaling $275 million and our Series B senior notes totaling $200 million, both of which mature in 2005. We monitor the status of the capital markets and regularly evaluate the effect that changes in capital market conditions may have on our ability to execute our announced growth plans. We expect that part of our financing and liquidity needs will continue to be met through commercial paper borrowings and access to long-term committed credit facilities. If conditions in the lodging industry deteriorate, or if disruptions in the commercial paper market take place as they did in the immediate aftermath of September 11, 2001, we may be unable to place some or all of our commercial paper on a temporary or extended basis, and may have to rely more on borrowings under the credit facilities, which may carry a higher cost than commercial paper.
Cash from Operations
Cash from operations, depreciation expense and amortization expense for the last three fiscal years are as follows:
($ in millions) 2004 2003 2002 Cash from operations ............................................................................ $ 891 $ 403 $ 516 Depreciation expense ........................................................................... 133 132 145 Amortization expense ........................................................................... 33 28 42
While our timeshare business generates strong operating cash flow, the timing of both cash outlays for the acquisition and development of new resorts and cash received from purchaser financing affects annual amounts. We include timeshare interval sales we finance in cash from operations when we collect cash payments or the notes are sold for cash. The following table shows the net operating activity from our timeshare business (which excludes the portion of net income from our timeshare business, as that number is a component of income from continuing operations):
($ in millions) 2004 2003 2002 Timeshare development, less the cost of sales ...................................... $ 93 $ (94) $ (102) New timeshare mortgages, net of collections ....................................... (459) (247) (218) Loan repurchases .................................................................................. (18) (19) (16) Note sale gains ..................................................................................... (64) (64) (60) Financially reportable sales less than (in excess of) closed sales .......... 129 (4) (13) Note sale proceeds ................................................................................ 312 231 341 Collection on retained interests in notes sold and servicing fees .......... 94 50 31 Other cash inflows (outflows) .............................................................. 26 36 (26)
Net cash inflows (outflows) from timeshare activity ............................ $ 113 $ (111) $ (63) Our ability to sell timeshare notes depends on the continued ability of the capital markets to provide financing to the special purpose entities that buy the notes. We might have increased difficulty or be unable to consummate such sales if the underlying quality of the notes receivable we originate were to deteriorate, although we do not expect such a deterioration.
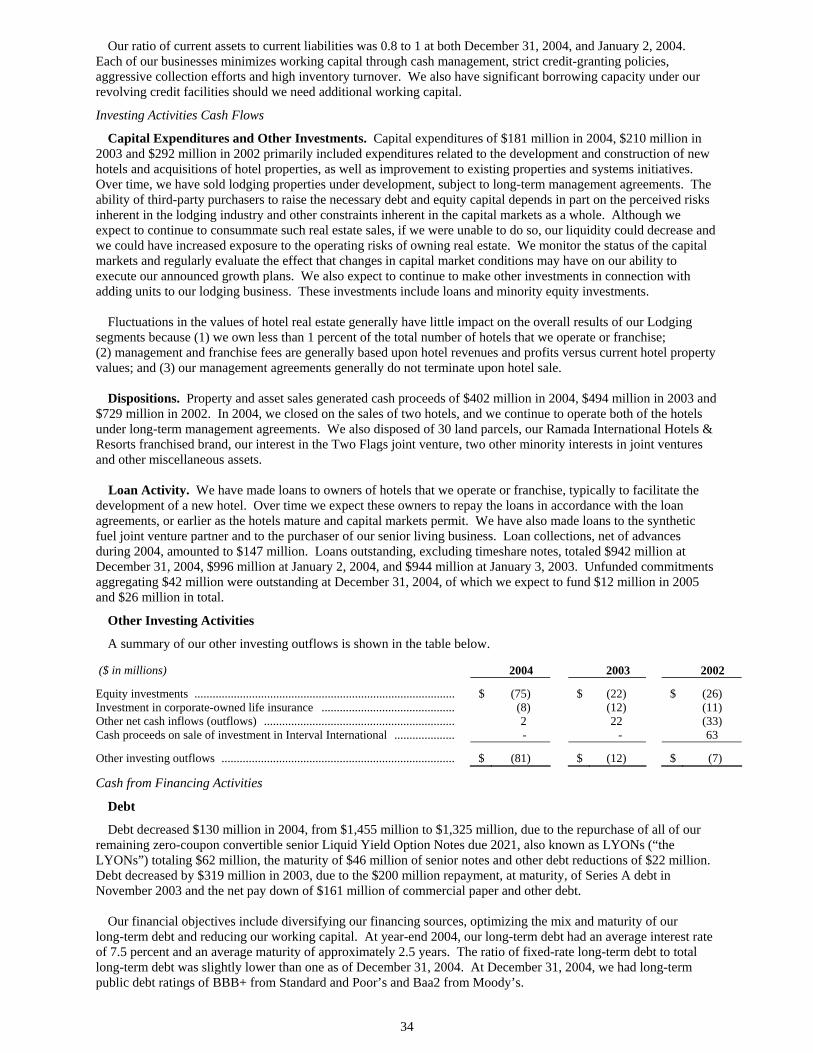
34
Our ratio of current assets to current liabilities was 0.8 to 1 at both December 31, 2004, and January 2, 2004. Each of our businesses minimizes working capital through cash management, strict credit-granting policies, aggressive collection efforts and high inventory turnover. We also have significant borrowing capacity under our revolving credit facilities should we need additional working capital.
Investing Activities Cash Flows
Capital Expenditures and Other Investments. Capital expenditures of $181 million in 2004, $210 million in 2003 and $292 million in 2002 primarily included expenditures related to the development and construction of new hotels and acquisitions of hotel properties, as well as improvement to existing properties and systems initiatives. Over time, we have sold lodging properties under development, subject to long-term management agreements. The ability of third-party purchasers to raise the necessary debt and equity capital depends in part on the perceived risks inherent in the lodging industry and other constraints inherent in the capital markets as a whole. Although we expect to continue to consummate such real estate sales, if we were unable to do so, our liquidity could decrease and we could have increased exposure to the operating risks of owning real estate. We monitor the status of the capital markets and regularly evaluate the effect that changes in capital market conditions may have on our ability to execute our announced growth plans. We also expect to continue to make other investments in connection with adding units to our lodging business. These investments include loans and minority equity investments. Fluctuations in the values of hotel real estate generally have little impact on the overall results of our Lodging segments because (1) we own less than 1 percent of the total number of hotels that we operate or franchise; (2) management and franchise fees are generally based upon hotel revenues and profits versus current hotel property values; and (3) our management agreements generally do not terminate upon hotel sale. Dispositions. Property and asset sales generated cash proceeds of $402 million in 2004, $494 million in 2003 and $729 million in 2002. In 2004, we closed on the sales of two hotels, and we continue to operate both of the hotels under long-term management agreements. We also disposed of 30 land parcels, our Ramada International Hotels & Resorts franchised brand, our interest in the Two Flags joint venture, two other minority interests in joint ventures and other miscellaneous assets.
Loan Activity. We have made loans to owners of hotels that we operate or franchise, typically to facilitate the development of a new hotel. Over time we expect these owners to repay the loans in accordance with the loan agreements, or earlier as the hotels mature and capital markets permit. We have also made loans to the synthetic fuel joint venture partner and to the purchaser of our senior living business. Loan collections, net of advances during 2004, amounted to $147 million. Loans outstanding, excluding timeshare notes, totaled $942 million at December 31, 2004, $996 million at January 2, 2004, and $944 million at January 3, 2003. Unfunded commitments aggregating $42 million were outstanding at December 31, 2004, of which we expect to fund $12 million in 2005 and $26 million in total.
Other Investing Activities
A summary of our other investing outflows is shown in the table below. ($ in millions) 2004 2003 2002
Equity investments ...................................................................................... $ (75) $ (22) $ (26) Investment in corporate-owned life insurance ............................................ (8) (12) (11) Other net cash inflows (outflows) ............................................................... 2 22 (33) Cash proceeds on sale of investment in Interval International .................... - - 63
Other investing outflows ............................................................................. $ (81) $ (12) $ (7)
Cash from Financing Activities
Debt
Debt decreased $130 million in 2004, from $1,455 million to $1,325 million, due to the repurchase of all of our remaining zero-coupon convertible senior Liquid Yield Option Notes due 2021, also known as LYONs (“the LYONs”) totaling $62 million, the maturity of $46 million of senior notes and other debt reductions of $22 million. Debt decreased by $319 million in 2003, due to the $200 million repayment, at maturity, of Series A debt in November 2003 and the net pay down of $161 million of commercial paper and other debt. Our financial objectives include diversifying our financing sources, optimizing the mix and maturity of our long-term debt and reducing our working capital. At year-end 2004, our long-term debt had an average interest rate of 7.5 percent and an average maturity of approximately 2.5 years. The ratio of fixed-rate long-term debt to total long-term debt was slightly lower than one as of December 31, 2004. At December 31, 2004, we had long-term public debt ratings of BBB+ from Standard and Poor’s and Baa2 from Moody’s.
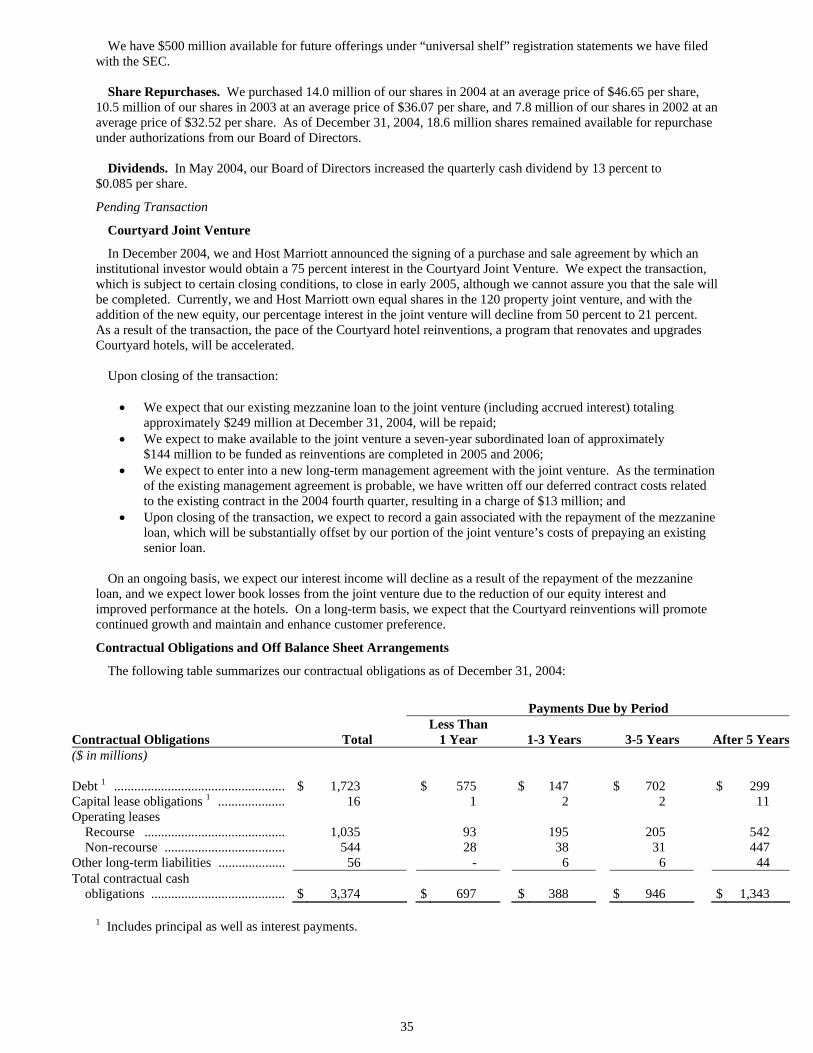
35
We have $500 million available for future offerings under “universal shelf” registration statements we have filed with the SEC. Share Repurchases. We purchased 14.0 million of our shares in 2004 at an average price of $46.65 per share, 10.5 million of our shares in 2003 at an average price of $36.07 per share, and 7.8 million of our shares in 2002 at an average price of $32.52 per share. As of December 31, 2004, 18.6 million shares remained available for repurchase under authorizations from our Board of Directors. Dividends. In May 2004, our Board of Directors increased the quarterly cash dividend by 13 percent to $0.085 per share.
Pending Transaction
Courtyard Joint Venture
In December 2004, we and Host Marriott announced the signing of a purchase and sale agreement by which an institutional investor would obtain a 75 percent interest in the Courtyard Joint Venture. We expect the transaction, which is subject to certain closing conditions, to close in early 2005, although we cannot assure you that the sale will be completed. Currently, we and Host Marriott own equal shares in the 120 property joint venture, and with the addition of the new equity, our percentage interest in the joint venture will decline from 50 percent to 21 percent. As a result of the transaction, the pace of the Courtyard hotel reinventions, a program that renovates and upgrades Courtyard hotels, will be accelerated.
Upon closing of the transaction: • We expect that our existing mezzanine loan to the joint venture (including accrued interest) totaling
approximately $249 million at December 31, 2004, will be repaid; • We expect to make available to the joint venture a seven-year subordinated loan of approximately
$144 million to be funded as reinventions are completed in 2005 and 2006; • We expect to enter into a new long-term management agreement with the joint venture. As the termination
of the existing management agreement is probable, we have written off our deferred contract costs related to the existing contract in the 2004 fourth quarter, resulting in a charge of $13 million; and
• Upon closing of the transaction, we expect to record a gain associated with the repayment of the mezzanine loan, which will be substantially offset by our portion of the joint venture’s costs of prepaying an existing senior loan.
On an ongoing basis, we expect our interest income will decline as a result of the repayment of the mezzanine
loan, and we expect lower book losses from the joint venture due to the reduction of our equity interest and improved performance at the hotels. On a long-term basis, we expect that the Courtyard reinventions will promote continued growth and maintain and enhance customer preference.
Contractual Obligations and Off Balance Sheet Arrangements
The following table summarizes our contractual obligations as of December 31, 2004:
Payments Due by Period
Contractual Obligations
Total Less Than
1 Year 1-3 Years
3-5 Years
After 5 Years($ in millions) Debt 1 ................................................... $ 1,723 $ 575 $ 147 $ 702 $ 299 Capital lease obligations 1 .................... 16 1 2 2 11 Operating leases Recourse .......................................... 1,035 93 195 205 542 Non-recourse .................................... 544 28 38 31 447 Other long-term liabilities .................... 56 - 6 6 44 Total contractual cash
obligations ........................................
$ 3,374
$
697
$
388
$
946
$
1,343
1 Includes principal as well as interest payments.
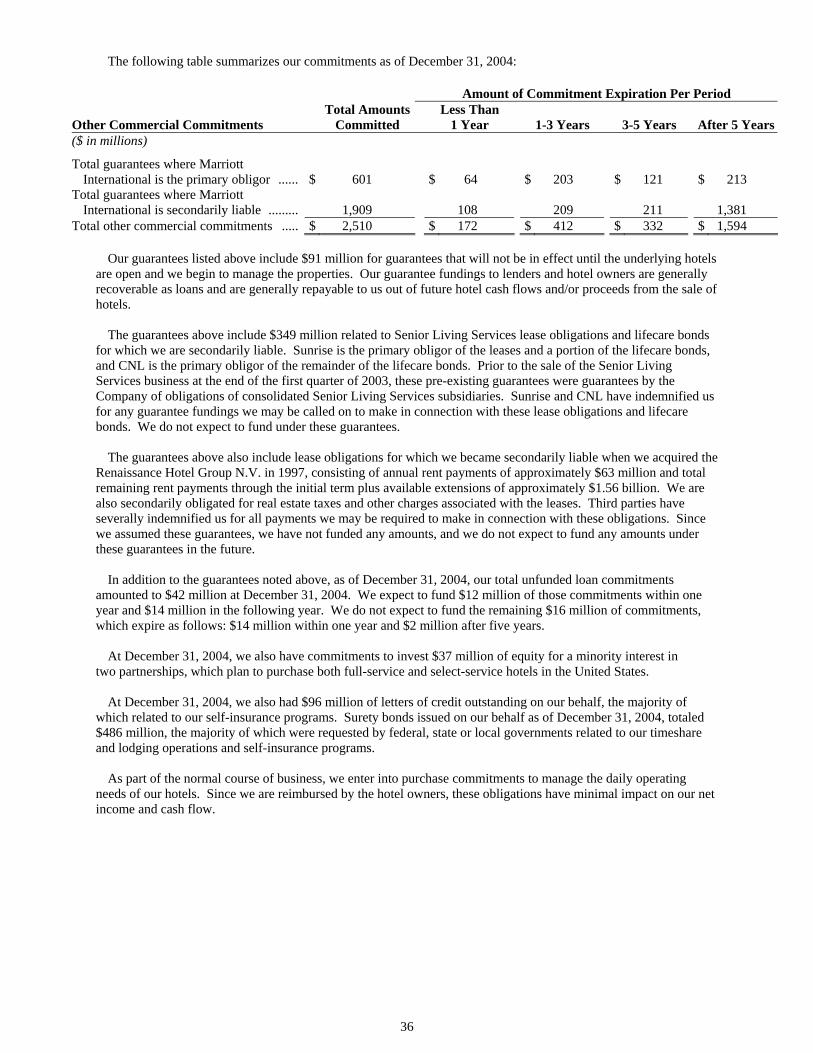
36
The following table summarizes our commitments as of December 31, 2004:
Our guarantees listed above include $91 million for guarantees that will not be in effect until the underlying hotels are open and we begin to manage the properties. Our guarantee fundings to lenders and hotel owners are generally recoverable as loans and are generally repayable to us out of future hotel cash flows and/or proceeds from the sale of hotels. The guarantees above include $349 million related to Senior Living Services lease obligations and lifecare bonds for which we are secondarily liable. Sunrise is the primary obligor of the leases and a portion of the lifecare bonds, and CNL is the primary obligor of the remainder of the lifecare bonds. Prior to the sale of the Senior Living Services business at the end of the first quarter of 2003, these pre-existing guarantees were guarantees by the Company of obligations of consolidated Senior Living Services subsidiaries. Sunrise and CNL have indemnified us for any guarantee fundings we may be called on to make in connection with these lease obligations and lifecare bonds. We do not expect to fund under these guarantees. The guarantees above also include lease obligations for which we became secondarily liable when we acquired the Renaissance Hotel Group N.V. in 1997, consisting of annual rent payments of approximately $63 million and total remaining rent payments through the initial term plus available extensions of approximately $1.56 billion. We are also secondarily obligated for real estate taxes and other charges associated with the leases. Third parties have severally indemnified us for all payments we may be required to make in connection with these obligations. Since we assumed these guarantees, we have not funded any amounts, and we do not expect to fund any amounts under these guarantees in the future. In addition to the guarantees noted above, as of December 31, 2004, our total unfunded loan commitments amounted to $42 million at December 31, 2004. We expect to fund $12 million of those commitments within one year and $14 million in the following year. We do not expect to fund the remaining $16 million of commitments, which expire as follows: $14 million within one year and $2 million after five years. At December 31, 2004, we also have commitments to invest $37 million of equity for a minority interest in two partnerships, which plan to purchase both full-service and select-service hotels in the United States. At December 31, 2004, we also had $96 million of letters of credit outstanding on our behalf, the majority of which related to our self-insurance programs. Surety bonds issued on our behalf as of December 31, 2004, totaled $486 million, the majority of which were requested by federal, state or local governments related to our timeshare and lodging operations and self-insurance programs. As part of the normal course of business, we enter into purchase commitments to manage the daily operating needs of our hotels. Since we are reimbursed by the hotel owners, these obligations have minimal impact on our net income and cash flow.
Amount of Commitment Expiration Per Period
Other Commercial Commitments Total Amounts
Committed Less Than
1 Year 1-3 Years
3-5 Years After 5 Years($ in millions)
Total guarantees where Marriott International is the primary obligor ......
$
601
$
64
$
203
$
121
$
213
Total guarantees where Marriott International is secondarily liable .........
1,909
108
209
211
1,381 Total other commercial commitments ..... $ 2,510 $ 172 $ 412 $ 332 $ 1,594
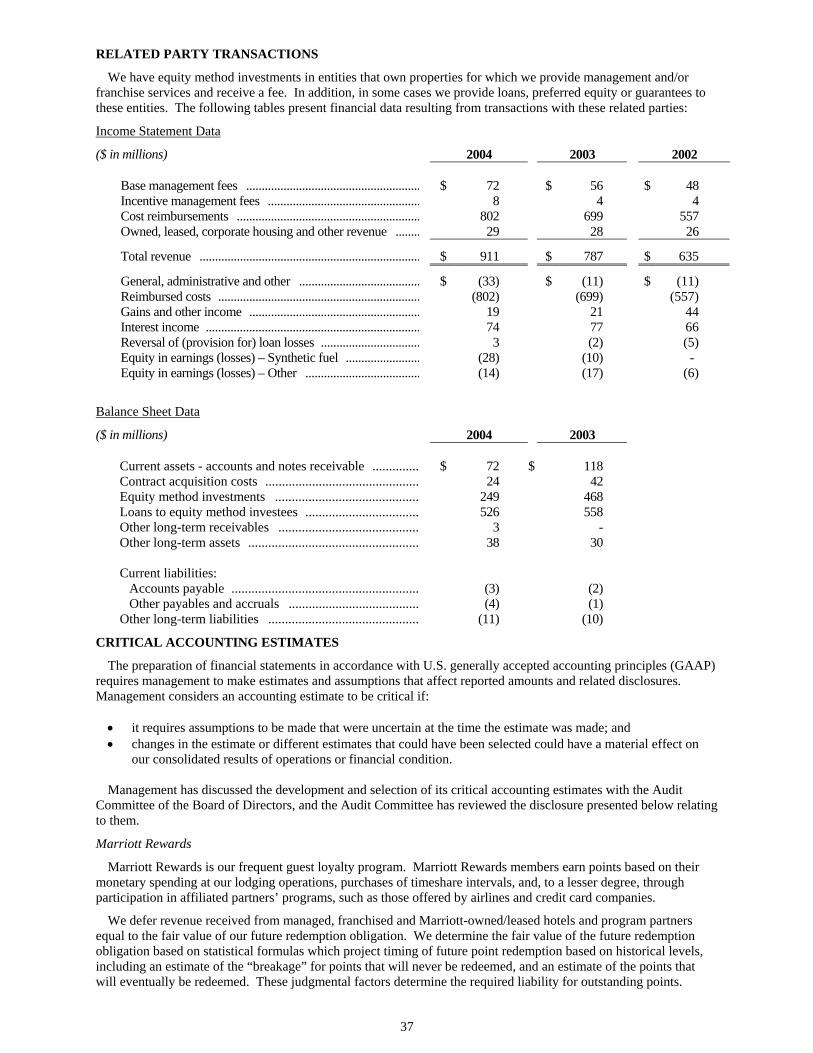
37
RELATED PARTY TRANSACTIONS
We have equity method investments in entities that own properties for which we provide management and/or franchise services and receive a fee. In addition, in some cases we provide loans, preferred equity or guarantees to these entities. The following tables present financial data resulting from transactions with these related parties:
Income Statement Data
($ in millions) 2004 2003 2002
Base management fees ........................................................ $ 72 $ 56 $ 48 Incentive management fees ................................................. 8 4 4 Cost reimbursements ........................................................... 802 699 557 Owned, leased, corporate housing and other revenue ........ 29 28 26
Total revenue ....................................................................... $ 911 $ 787 $ 635
General, administrative and other ....................................... $ (33) $ (11) $ (11) Reimbursed costs ................................................................. (802) (699) (557) Gains and other income ....................................................... 19 21 44 Interest income ..................................................................... 74 77 66 Reversal of (provision for) loan losses ................................ 3 (2) (5) Equity in earnings (losses) – Synthetic fuel ........................ (28) (10) - Equity in earnings (losses) – Other ..................................... (14) (17) (6)
Balance Sheet Data
($ in millions) 2004 2003
Current assets - accounts and notes receivable .............. $ 72 $ 118 Contract acquisition costs .............................................. 24 42 Equity method investments ........................................... 249 468 Loans to equity method investees .................................. 526 558 Other long-term receivables .......................................... 3 - Other long-term assets ................................................... 38 30 Current liabilities: Accounts payable ........................................................ (3) (2) Other payables and accruals ....................................... (4) (1) Other long-term liabilities ............................................. (11) (10)
CRITICAL ACCOUNTING ESTIMATES
The preparation of financial statements in accordance with U.S. generally accepted accounting principles (GAAP) requires management to make estimates and assumptions that affect reported amounts and related disclosures. Management considers an accounting estimate to be critical if: • it requires assumptions to be made that were uncertain at the time the estimate was made; and • changes in the estimate or different estimates that could have been selected could have a material effect on
our consolidated results of operations or financial condition.
Management has discussed the development and selection of its critical accounting estimates with the Audit Committee of the Board of Directors, and the Audit Committee has reviewed the disclosure presented below relating to them.
Marriott Rewards
Marriott Rewards is our frequent guest loyalty program. Marriott Rewards members earn points based on their monetary spending at our lodging operations, purchases of timeshare intervals, and, to a lesser degree, through participation in affiliated partners’ programs, such as those offered by airlines and credit card companies.
We defer revenue received from managed, franchised and Marriott-owned/leased hotels and program partners equal to the fair value of our future redemption obligation. We determine the fair value of the future redemption obligation based on statistical formulas which project timing of future point redemption based on historical levels, including an estimate of the “breakage” for points that will never be redeemed, and an estimate of the points that will eventually be redeemed. These judgmental factors determine the required liability for outstanding points.
38
Our management and franchise agreements require that we be reimbursed currently for the costs of operating the program, including marketing, promotion, communication with, and performing member services for the Marriott Rewards members. Due to the requirement that hotels reimburse us for program operating costs as incurred, we receive and recognize the balance of the revenue from hotels in connection with the Marriott Rewards program at the time such costs are incurred and expensed. We recognize the component of revenue from program partners that corresponds to program maintenance services over the expected life of the points awarded.
Upon the redemption of points, we recognize as revenue the amounts previously deferred, and recognize the corresponding expense relating to the costs of the awards redeemed.
Valuation of Goodwill
We evaluate the fair value of goodwill to assess potential impairments on an annual basis, or during the year if an event or other circumstance indicates that we may not be able to recover the carrying amount of the asset. We evaluate the fair value of goodwill at the reporting unit level and make that determination based upon future cash flow projections which assume certain growth projections which may or may not occur. We record an impairment loss for goodwill when the carrying value of the intangible asset is less than its estimated fair value.
Loan Loss Reserves
We measure loan impairment based on the present value of expected future cash flows discounted at the loan’s original effective interest rate or the estimated fair value of the collateral. For impaired loans, we establish a specific impairment reserve for the difference between the recorded investment in the loan and the present value of the expected future cash flows, which assumes certain growth projections which may or may not occur, or the estimated fair value of the collateral. We apply our loan impairment policy individually to all loans in the portfolio and do not aggregate loans for the purpose of applying such policy. Where we determine that a loan is impaired, we recognize interest income on a cash basis. At December 31, 2004, our recorded investment in impaired loans was $181 million. We have a $92 million allowance for credit losses, leaving $89 million of our investment in impaired loans for which there is no related allowance for credit losses.
Legal Contingencies
We are subject to various legal proceedings and claims, the outcomes of which are subject to significant uncertainty. We record an accrual for loss contingencies when a loss is probable and the amount of the loss can be reasonably estimated. We review these accruals each reporting period and make revisions based on changes in facts and circumstances.
Income Taxes
We record the current year amounts payable or refundable, as well as the consequences of events that give rise to deferred tax assets and liabilities based on differences in how those events are treated for tax purposes. We base our estimate of deferred tax assets and liabilities on current tax laws and rates and, in certain cases, business plans and other expectations about future outcomes. Changes in existing laws and rates, and their related interpretations, and future business results may affect the amount of deferred tax liabilities or the valuation of deferred tax assets over time. Our accounting for deferred tax consequences represents management’s best estimate of future events that can be appropriately reflected in the accounting estimates.
OTHER MATTERS
Audit Services Our independent registered public accounting firm, Ernst & Young LLP (“E&Y”), recently notified the Securities
and Exchange Commission (“SEC”), the Public Company Accounting Oversight Board and the Audit Committee of our Board of Directors that certain non-audit services E&Y performed in China and Japan for a large number of public companies, including Marriott, have raised questions regarding E&Y’s independence in its performance of audit services.
With respect to Marriott, from 2001 through 2004, E&Y performed tax calculation and preparation services for Marriott employees located in China and Japan, and affiliates of E&Y made payment of the relevant taxes on behalf of Marriott. The payment of those taxes involved handling of Company-related funds, which is not permitted under SEC auditor independence rules. These actions by affiliates of E&Y have been discontinued, and both the amount of the taxes and the fees paid to E&Y in connection with these services are de minimis.
The Audit Committee and E&Y discussed E&Y’s independence with respect to the Company in light of the foregoing facts. E&Y informed the Audit Committee that it does not believe that the holding and paying of those funds impaired E&Y’s independence with respect to the Company. The Company, based on its own review, also is

39
not aware of any additional non-audit services that may compromise E&Y’s independence in performing audit services for the Company.
Inflation
Inflation has been moderate in recent years and has not had a significant impact on our businesses.
40
Item 7A. Quantitative and Qualitative Disclosures About Market Risk.
We are exposed to market risk from changes in interest rates and foreign exchange rates. We manage our exposure to these risks by monitoring available financing alternatives, through development and application of credit granting policies and by entering into derivative arrangements. We do not foresee any significant changes in either our exposure to fluctuations in interest rates or foreign exchange rates or in how such exposure is managed in the future.
We are exposed to interest rate risk on our floating-rate timeshare and notes receivable, our residual interests retained in connection with the sale of timeshare intervals, and the fair value of our fixed-rate notes receivable.
Changes in interest rates also impact our floating-rate long-term debt and the fair value of our fixed-rate long-term
debt. We use derivative instruments as part of our overall strategy to manage our exposure to market risks associated
with fluctuations in interest rates and foreign currency exchange rates. As a matter of policy, we do not use derivatives for trading or speculative purposes.
At December 31, 2004, we were party to the following derivative instruments:
• An interest rate swap agreement under which we receive a floating rate of interest and pay a fixed rate of interest. The swap modifies our interest rate exposure by effectively converting a note receivable with a fixed rate to a floating rate. The aggregate notional amount of the swap is $92 million and it matures in 2010.
• Six outstanding interest rate swap agreements to manage interest rate risk associated with the residual interests we retain in conjunction with our timeshare note sales. We are required by purchasers and/or rating agencies to utilize interest rate swaps to protect the excess spread within our sold note pools. The aggregate notional amount of the swaps is $535 million, and they expire through 2022.
• Forward foreign exchange and option contracts to hedge the potential volatility of earnings and cash flows associated with variations in foreign exchange rates during fiscal year 2005. The aggregate dollar equivalent of the notional amounts of the contracts is approximately $36 million, and they expire throughout 2005.
• Forward foreign exchange contracts to manage the foreign currency exposure related to certain monetary assets denominated in pounds sterling. The aggregate dollar equivalent of the notional amounts of the forward contracts is $36 million at December 31, 2004.
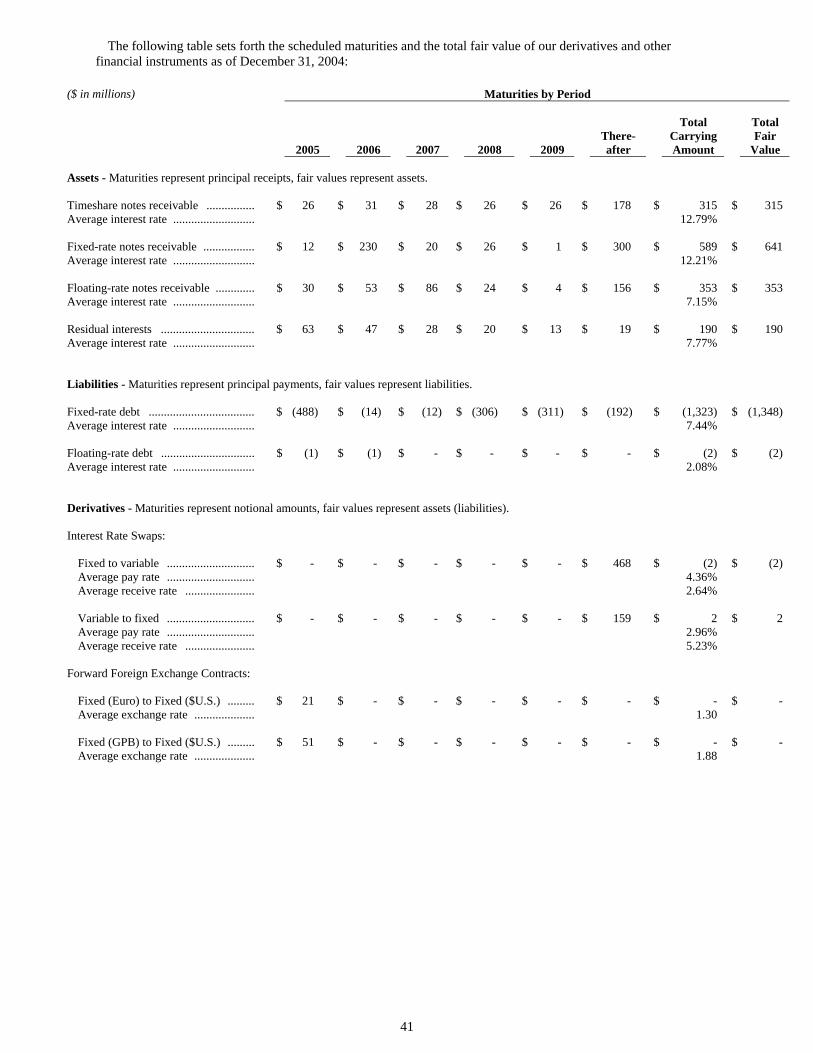
41
The following table sets forth the scheduled maturities and the total fair value of our derivatives and other financial instruments as of December 31, 2004:
($ in millions) Maturities by Period
2005 2006 2007 2008 2009
There- after
Total Carrying Amount
Total Fair
Value Assets - Maturities represent principal receipts, fair values represent assets. Timeshare notes receivable ................ $ 26 $ 31 $ 28 $ 26 $ 26 $ 178 $ 315 $ 315 Average interest rate ........................... 12.79% Fixed-rate notes receivable ................. $ 12 $ 230 $ 20 $ 26 $ 1 $ 300 $ 589 $ 641 Average interest rate ........................... 12.21% Floating-rate notes receivable ............. $ 30 $ 53 $ 86 $ 24 $ 4 $ 156 $ 353 $ 353 Average interest rate ........................... 7.15% Residual interests ............................... $ 63 $ 47 $ 28 $ 20 $ 13 $ 19 $ 190 $ 190 Average interest rate ........................... 7.77% Liabilities - Maturities represent principal payments, fair values represent liabilities. Fixed-rate debt ................................... $ (488) $ (14) $ (12) $ (306) $ (311) $ (192) $ (1,323) $ (1,348) Average interest rate ........................... 7.44% Floating-rate debt ............................... $ (1) $ (1) $ - $ - $ - $ - $ (2) $ (2) Average interest rate ........................... 2.08% Derivatives - Maturities represent notional amounts, fair values represent assets (liabilities). Interest Rate Swaps:
Fixed to variable ............................. $ - $ - $ - $ - $ - $ 468 $ (2) $ (2) Average pay rate ............................. 4.36% Average receive rate ....................... 2.64% Variable to fixed ............................. $ - $ - $ - $ - $ - $ 159 $ 2 $ 2 Average pay rate ............................. 2.96% Average receive rate ....................... 5.23%
Forward Foreign Exchange Contracts:
Fixed (Euro) to Fixed ($U.S.) ......... $ 21 $ - $ - $ - $ - $ - $ - $ - Average exchange rate .................... 1.30 Fixed (GPB) to Fixed ($U.S.) ......... $ 51 $ - $ - $ - $ - $ - $ - $ - Average exchange rate .................... 1.88
42
Item 8. Financial Statements and Supplementary Data. The following financial information is included on the pages indicated:
Page Management’s Report on Internal Control Over Financial Reporting ............... 43
Report of Independent Registered Public Accounting Firm on Internal Control Over Financial Reporting ................................................................ 44 Report of Independent Registered Public Accounting Firm .............................. 45 Consolidated Statement of Income .................................................................... 46 Consolidated Balance Sheet ............................................................................... 47 Consolidated Statement of Cash Flows .............................................................. 48 Consolidated Statement of Comprehensive Income .......................................... 49 Consolidated Statement of Shareholders’ Equity ............................................... 50 Notes to Consolidated Financial Statements ...................................................... 51
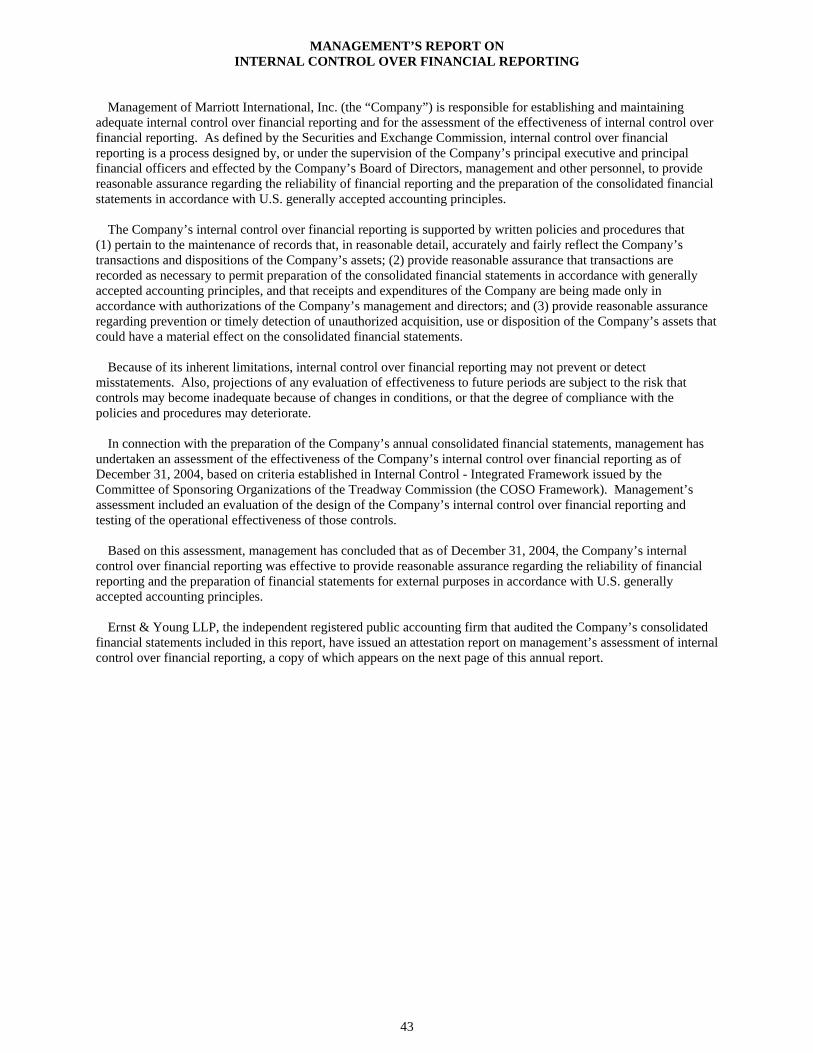
43
MANAGEMENT’S REPORT ON INTERNAL CONTROL OVER FINANCIAL REPORTING
Management of Marriott International, Inc. (the “Company”) is responsible for establishing and maintaining adequate internal control over financial reporting and for the assessment of the effectiveness of internal control over financial reporting. As defined by the Securities and Exchange Commission, internal control over financial reporting is a process designed by, or under the supervision of the Company’s principal executive and principal financial officers and effected by the Company’s Board of Directors, management and other personnel, to provide reasonable assurance regarding the reliability of financial reporting and the preparation of the consolidated financial statements in accordance with U.S. generally accepted accounting principles. The Company’s internal control over financial reporting is supported by written policies and procedures that (1) pertain to the maintenance of records that, in reasonable detail, accurately and fairly reflect the Company’s transactions and dispositions of the Company’s assets; (2) provide reasonable assurance that transactions are recorded as necessary to permit preparation of the consolidated financial statements in accordance with generally accepted accounting principles, and that receipts and expenditures of the Company are being made only in accordance with authorizations of the Company’s management and directors; and (3) provide reasonable assurance regarding prevention or timely detection of unauthorized acquisition, use or disposition of the Company’s assets that could have a material effect on the consolidated financial statements.
Because of its inherent limitations, internal control over financial reporting may not prevent or detect misstatements. Also, projections of any evaluation of effectiveness to future periods are subject to the risk that controls may become inadequate because of changes in conditions, or that the degree of compliance with the policies and procedures may deteriorate. In connection with the preparation of the Company’s annual consolidated financial statements, management has undertaken an assessment of the effectiveness of the Company’s internal control over financial reporting as of December 31, 2004, based on criteria established in Internal Control - Integrated Framework issued by the Committee of Sponsoring Organizations of the Treadway Commission (the COSO Framework). Management’s assessment included an evaluation of the design of the Company’s internal control over financial reporting and testing of the operational effectiveness of those controls. Based on this assessment, management has concluded that as of December 31, 2004, the Company’s internal control over financial reporting was effective to provide reasonable assurance regarding the reliability of financial reporting and the preparation of financial statements for external purposes in accordance with U.S. generally accepted accounting principles. Ernst & Young LLP, the independent registered public accounting firm that audited the Company’s consolidated financial statements included in this report, have issued an attestation report on management’s assessment of internal control over financial reporting, a copy of which appears on the next page of this annual report.
44
REPORT OF INDEPENDENT REGISTERED PUBLIC ACCOUNTING FIRM
ON INTERNAL CONTROL OVER FINANCIAL REPORTING
The Board of Directors and Shareholders of Marriott International, Inc.: We have audited management’s assessment, included in the accompanying Management’s Report on Internal Control Over Financial Reporting, that Marriott International, Inc. maintained effective internal control over financial reporting as of December 31, 2004, based on criteria established in Internal Control-Integrated Framework issued by the Committee of Sponsoring Organizations of the Treadway Commission (“the COSO criteria”). Marriott International, Inc.’s management is responsible for maintaining effective internal control over financial reporting and for its assessment of the effectiveness of internal control over financial reporting. Our responsibility is to express an opinion on management’s assessment and an opinion on the effectiveness of the company’s internal control over financial reporting based on our audit. We conducted our audit in accordance with the standards of the Public Company Accounting Oversight Board (United States). Those standards require that we plan and perform the audit to obtain reasonable assurance about whether effective internal control over financial reporting was maintained in all material respects. Our audit included obtaining an understanding of internal control over financial reporting, evaluating management’s assessment, testing and evaluating the design and operating effectiveness of internal control, and performing such other procedures as we considered necessary in the circumstances. We believe that our audit provides a reasonable basis for our opinion. A company’s internal control over financial reporting is a process designed to provide reasonable assurance regarding the reliability of financial reporting and the preparation of financial statements for external purposes in accordance with generally accepted accounting principles. A company’s internal control over financial reporting includes those policies and procedures that (1) pertain to the maintenance of records that, in reasonable detail, accurately and fairly reflect the transactions and dispositions of the assets of the company; (2) provide reasonable assurance that transactions are recorded as necessary to permit preparation of financial statements in accordance with generally accepted accounting principles, and that receipts and expenditures of the company are being made only in accordance with authorizations of management and directors of the company; and (3) provide reasonable assurance regarding prevention or timely detection of unauthorized acquisition, use, or disposition of the company’s assets that could have a material effect on the financial statements. Because of its inherent limitations, internal control over financial reporting may not prevent or detect misstatements. Also, projections of any evaluation of effectiveness to future periods are subject to the risk that controls may become inadequate because of changes in conditions, or that the degree of compliance with the policies or procedures may deteriorate.
In our opinion, management’s assessment that Marriott International, Inc. maintained effective internal control over financial reporting as of December 31, 2004, is fairly stated, in all material respects, based on the COSO criteria. Also, in our opinion, Marriott International, Inc. maintained, in all material respects, effective internal control over financial reporting as of December 31, 2004, based on the COSO criteria. We also have audited, in accordance with the standards of the Public Company Accounting Oversight Board (United States), the consolidated balance sheet of Marriott International, Inc. as of December 31, 2004 and January 2, 2004, and the related consolidated statements of income, cash flows, comprehensive income and shareholders’ equity for each of the three fiscal years in the period ended December 31, 2004 of Marriott International, Inc. and our report dated February 21, 2005 expressed an unqualified opinion thereon.
/s/ Ernst & Young LLP McLean, Virginia February 21, 2005
45
REPORT OF INDEPENDENT REGISTERED PUBLIC ACCOUNTING FIRM
To the Shareholders of Marriott International, Inc.: We have audited the accompanying consolidated balance sheet of Marriott International, Inc. as of December 31, 2004 and January 2, 2004, and the related consolidated statements of income, cash flows, comprehensive income and shareholders’ equity for each of the three fiscal years in the period ended December 31, 2004. These financial statements are the responsibility of the Company’s management. Our responsibility is to express an opinion on these financial statements based on our audits. We conducted our audits in accordance with the standards of the Public Company Accounting Oversight Board (United States). Those standards require that we plan and perform an audit to obtain reasonable assurance about whether the financial statements are free of material misstatement. An audit includes examining, on a test basis, evidence supporting the amounts and disclosures in the financial statements. An audit also includes assessing the accounting principles used and significant estimates made by management, as well as evaluating the overall financial statement presentation. We believe that our audits provide a reasonable basis for our opinion. In our opinion, the financial statements referred to above present fairly, in all material respects, the consolidated financial position of Marriott International, Inc. as of December 31, 2004 and January 2, 2004, and the consolidated results of its operations and its cash flows for each of the three fiscal years in the period ended December 31, 2004, in conformity with U.S. generally accepted accounting principles. We also have audited, in accordance with the standards of the Public Company Accounting Oversight Board (United States), the effectiveness of Marriott International, Inc.’s internal control over financial reporting as of December 31, 2004, based on criteria established in Internal Control-Integrated Framework issued by the Committee of Sponsoring Organizations of the Treadway Commission and our report dated February 21, 2005 expressed an unqualified opinion thereon.
/s/ Ernst & Young LLP McLean, Virginia February 21, 2005
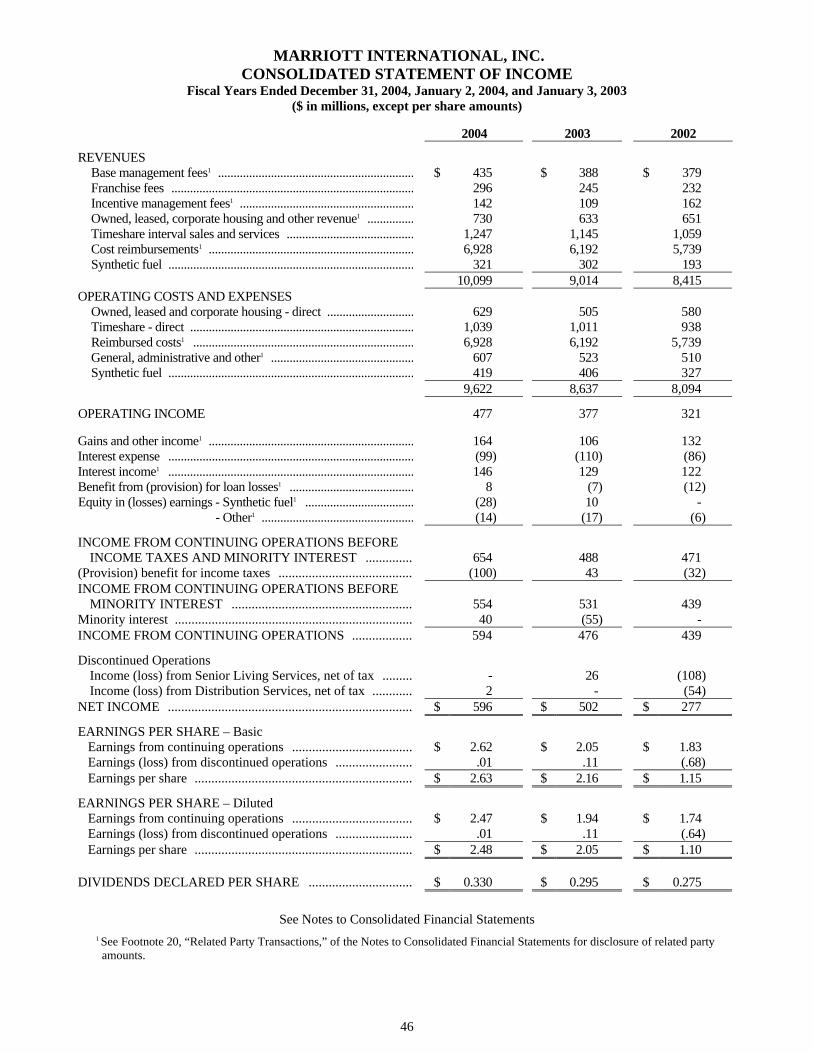
46
MARRIOTT INTERNATIONAL, INC. CONSOLIDATED STATEMENT OF INCOME
Fiscal Years Ended December 31, 2004, January 2, 2004, and January 3, 2003 ($ in millions, except per share amounts)
2004 2003 2002
REVENUES Base management fees1 ............................................................... $ 435 $ 388 $ 379 Franchise fees .............................................................................. 296 245 232 Incentive management fees1 ........................................................ 142 109 162
Owned, leased, corporate housing and other revenue1 ............... 730 633 651 Timeshare interval sales and services ......................................... 1,247 1,145 1,059 Cost reimbursements1 .................................................................. 6,928 6,192 5,739 Synthetic fuel ............................................................................... 321 302 193 10,099 9,014 8,415
OPERATING COSTS AND EXPENSES Owned, leased and corporate housing - direct ............................ 629 505 580 Timeshare - direct ........................................................................ 1,039 1,011 938 Reimbursed costs1 ....................................................................... 6,928 6,192 5,739 General, administrative and other1 .............................................. 607 523 510 Synthetic fuel ............................................................................... 419 406 327 9,622 8,637 8,094
OPERATING INCOME 477 377 321
Gains and other income1 .................................................................. 164 106 132 Interest expense ............................................................................... (99) (110) (86) Interest income1 ............................................................................... 146 129 122 Benefit from (provision) for loan losses1 ........................................ 8 (7) (12) Equity in (losses) earnings - Synthetic fuel1 ................................... (28) 10 - - Other1 ................................................. (14) (17) (6)
INCOME FROM CONTINUING OPERATIONS BEFORE INCOME TAXES AND MINORITY INTEREST .............. 654 488 471 (Provision) benefit for income taxes ........................................ (100) 43 (32) INCOME FROM CONTINUING OPERATIONS BEFORE
MINORITY INTEREST ......................................................
554
531
439 Minority interest ....................................................................... 40 (55) - INCOME FROM CONTINUING OPERATIONS .................. 594 476 439
Discontinued Operations Income (loss) from Senior Living Services, net of tax ......... - 26 (108)
Income (loss) from Distribution Services, net of tax ............ 2 - (54) NET INCOME ......................................................................... $ 596 $ 502 $ 277
EARNINGS PER SHARE – Basic Earnings from continuing operations .................................... $ 2.62 $ 2.05 $ 1.83 Earnings (loss) from discontinued operations ....................... .01 .11 (.68) Earnings per share ................................................................. $ 2.63 $ 2.16 $ 1.15
EARNINGS PER SHARE – Diluted Earnings from continuing operations .................................... $ 2.47 $ 1.94 $ 1.74 Earnings (loss) from discontinued operations ....................... .01 .11 (.64) Earnings per share ................................................................. $ 2.48 $ 2.05 $ 1.10 DIVIDENDS DECLARED PER SHARE ............................... $ 0.330 $ 0.295 $ 0.275
See Notes to Consolidated Financial Statements
1 See Footnote 20, “Related Party Transactions,” of the Notes to Consolidated Financial Statements for disclosure of related party amounts.
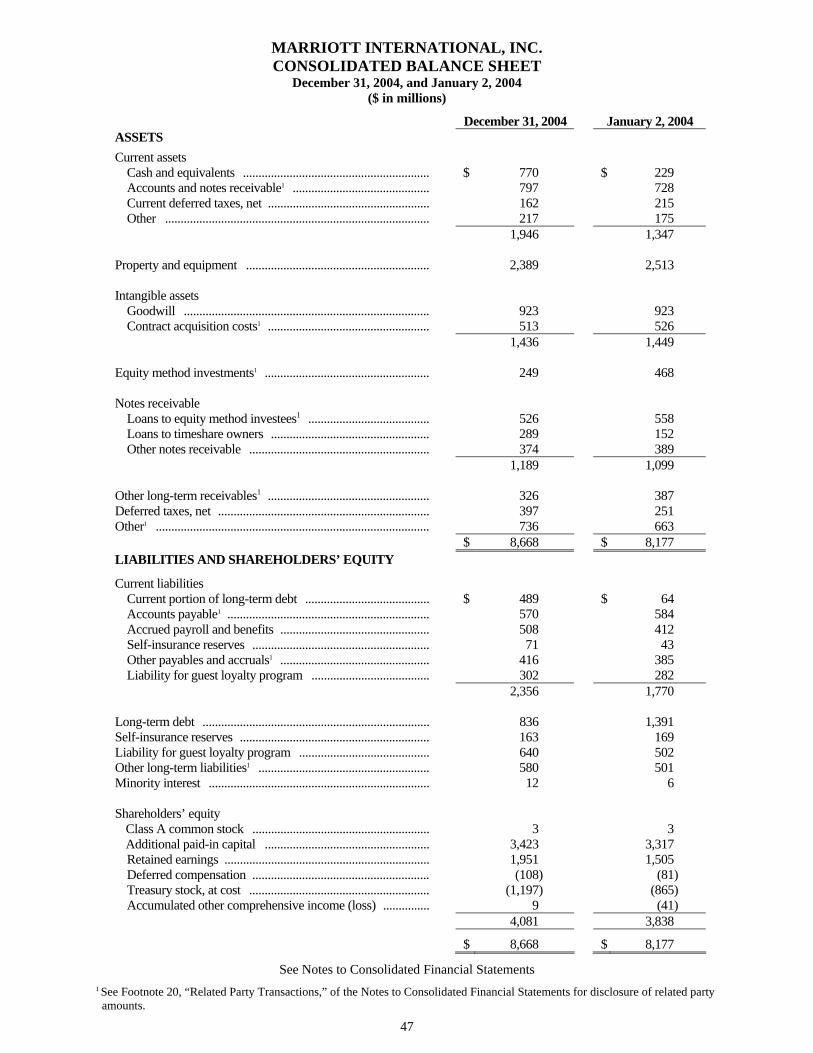
47
MARRIOTT INTERNATIONAL, INC. CONSOLIDATED BALANCE SHEET
December 31, 2004, and January 2, 2004 ($ in millions)
December 31, 2004 January 2, 2004 ASSETS Current assets Cash and equivalents ............................................................ $ 770 $ 229 Accounts and notes receivable1 ............................................ 797 728 Current deferred taxes, net .................................................... 162 215 Other ..................................................................................... 217 175 1,946 1,347 Property and equipment ........................................................... 2,389 2,513 Intangible assets Goodwill ............................................................................... 923 923 Contract acquisition costs1 .................................................... 513 526 1,436 1,449 Equity method investments1 ..................................................... 249 468 Notes receivable Loans to equity method investees1 ....................................... 526 558 Loans to timeshare owners ................................................... 289 152 Other notes receivable .......................................................... 374 389 1,189 1,099 Other long-term receivables1 .................................................... 326 387 Deferred taxes, net .................................................................... 397 251 Other1 ........................................................................................ 736 663 $ 8,668 $ 8,177 LIABILITIES AND SHAREHOLDERS’ EQUITY
Current liabilities Current portion of long-term debt ........................................ $ 489 $ 64 Accounts payable1 ................................................................. 570 584 Accrued payroll and benefits ................................................ 508 412 Self-insurance reserves ......................................................... 71 43 Other payables and accruals1 ................................................ 416 385 Liability for guest loyalty program ...................................... 302 282 2,356 1,770 Long-term debt ......................................................................... 836 1,391 Self-insurance reserves ............................................................. 163 169 Liability for guest loyalty program .......................................... 640 502 Other long-term liabilities1 ....................................................... 580 501 Minority interest ....................................................................... 12 6 Shareholders’ equity Class A common stock ......................................................... 3 3 Additional paid-in capital ..................................................... 3,423 3,317 Retained earnings .................................................................. 1,951 1,505 Deferred compensation ......................................................... (108) (81) Treasury stock, at cost .......................................................... (1,197) (865) Accumulated other comprehensive income (loss) ............... 9 (41) 4,081 3,838
$ 8,668 $ 8,177
See Notes to Consolidated Financial Statements 1 See Footnote 20, “Related Party Transactions,” of the Notes to Consolidated Financial Statements for disclosure of related party amounts.
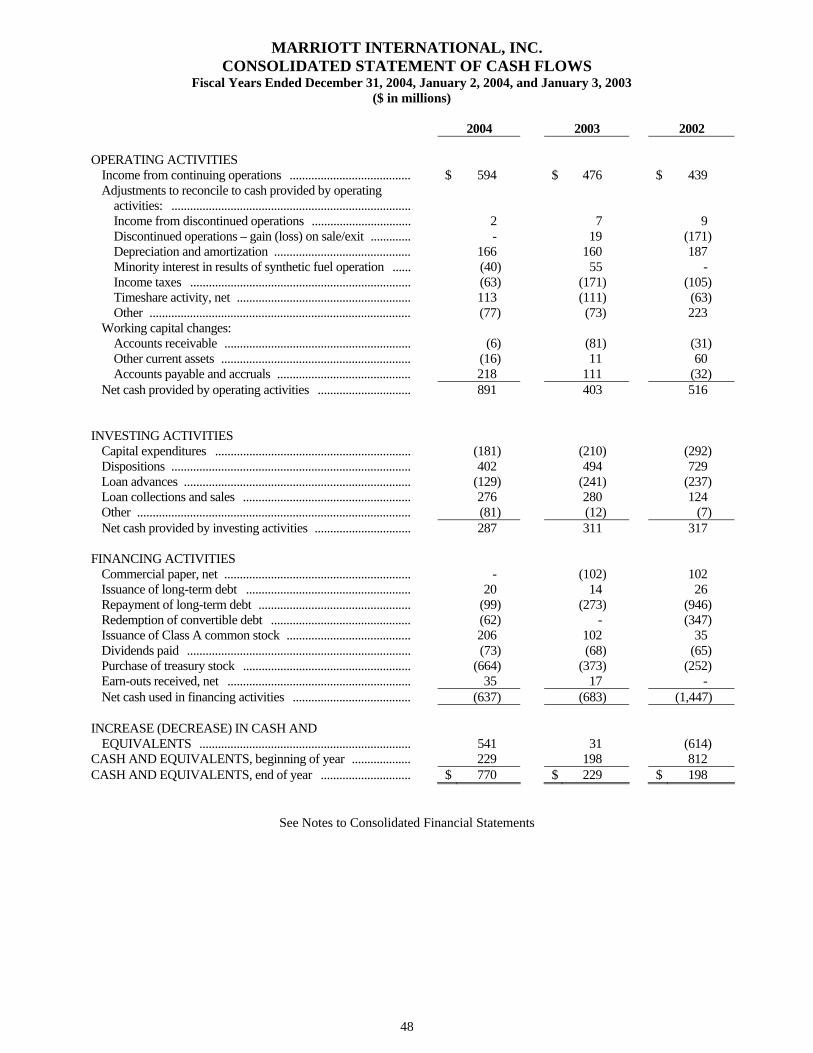
48
MARRIOTT INTERNATIONAL, INC. CONSOLIDATED STATEMENT OF CASH FLOWS
Fiscal Years Ended December 31, 2004, January 2, 2004, and January 3, 2003 ($ in millions)
2004 2003 2002
OPERATING ACTIVITIES Income from continuing operations ....................................... $ 594 $ 476 $ 439 Adjustments to reconcile to cash provided by operating activities: .............................................................................
Income from discontinued operations ................................ 2 7 9 Discontinued operations – gain (loss) on sale/exit ............. - 19 (171) Depreciation and amortization ............................................ 166 160 187 Minority interest in results of synthetic fuel operation ...... (40) 55 - Income taxes ....................................................................... (63) (171) (105) Timeshare activity, net ........................................................ 113 (111) (63) Other .................................................................................... (77) (73) 223 Working capital changes: Accounts receivable ............................................................ (6) (81) (31) Other current assets ............................................................. (16) 11 60 Accounts payable and accruals ........................................... 218 111 (32) Net cash provided by operating activities .............................. 891 403 516 INVESTING ACTIVITIES Capital expenditures ............................................................... (181) (210) (292) Dispositions ............................................................................. 402 494 729 Loan advances ......................................................................... (129) (241) (237) Loan collections and sales ...................................................... 276 280 124 Other ........................................................................................ (81) (12) (7) Net cash provided by investing activities ............................... 287 311 317 FINANCING ACTIVITIES Commercial paper, net ............................................................ - (102) 102 Issuance of long-term debt ..................................................... 20 14 26 Repayment of long-term debt ................................................. (99) (273) (946) Redemption of convertible debt ............................................. (62) - (347) Issuance of Class A common stock ........................................ 206 102 35 Dividends paid ........................................................................ (73) (68) (65) Purchase of treasury stock ...................................................... (664) (373) (252) Earn-outs received, net ........................................................... 35 17 - Net cash used in financing activities ...................................... (637) (683) (1,447) INCREASE (DECREASE) IN CASH AND EQUIVALENTS ....................................................................
541
31
(614)
CASH AND EQUIVALENTS, beginning of year ................... 229 198 812 CASH AND EQUIVALENTS, end of year ............................. $ 770 $ 229 $ 198
See Notes to Consolidated Financial Statements
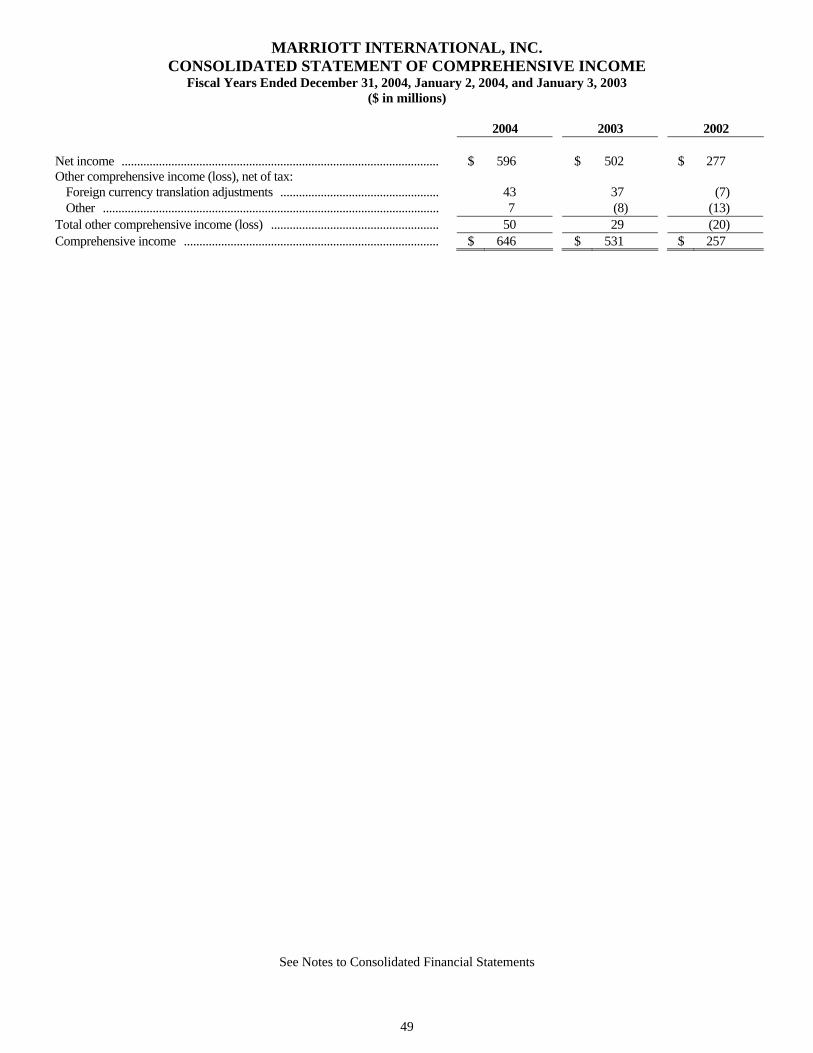
49
MARRIOTT INTERNATIONAL, INC. CONSOLIDATED STATEMENT OF COMPREHENSIVE INCOME
Fiscal Years Ended December 31, 2004, January 2, 2004, and January 3, 2003 ($ in millions)
2004 2003 2002
Net income ...................................................................................................... $ 596 $ 502 $ 277 Other comprehensive income (loss), net of tax: Foreign currency translation adjustments ................................................... 43 37 (7) Other ............................................................................................................ 7 (8) (13) Total other comprehensive income (loss) ...................................................... 50 29 (20) Comprehensive income .................................................................................. $ 646 $ 531 $ 257
See Notes to Consolidated Financial Statements
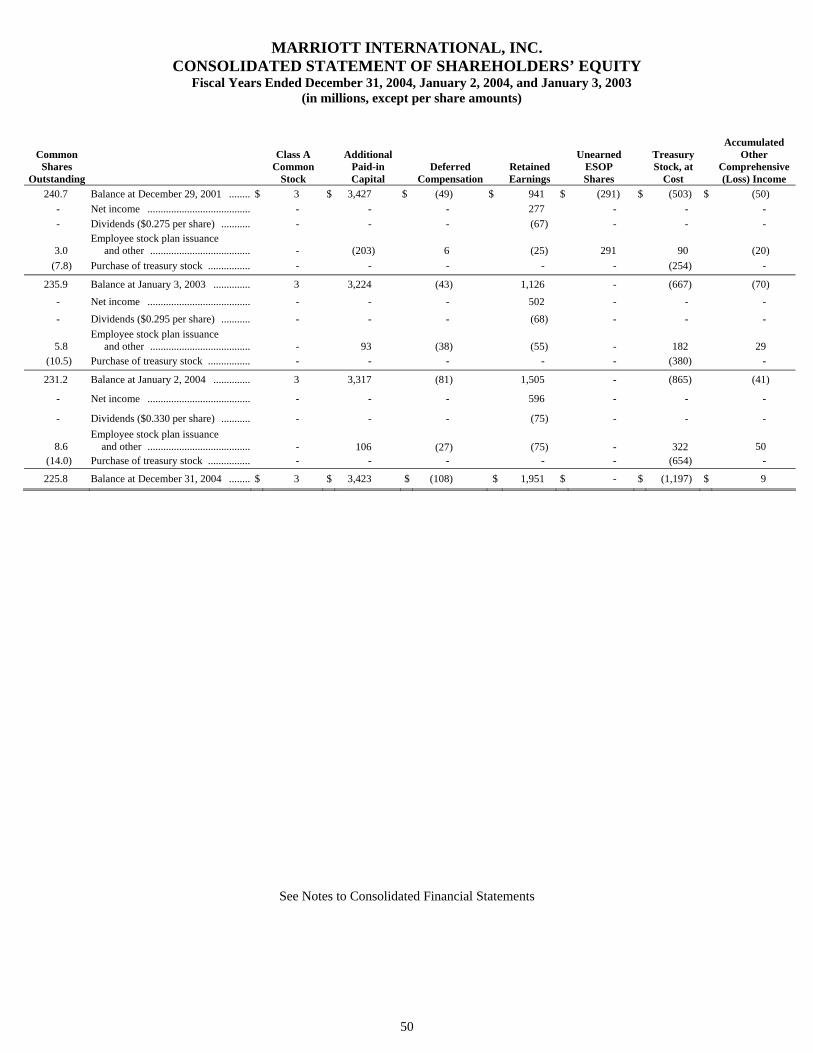
50
MARRIOTT INTERNATIONAL, INC. CONSOLIDATED STATEMENT OF SHAREHOLDERS’ EQUITY
Fiscal Years Ended December 31, 2004, January 2, 2004, and January 3, 2003 (in millions, except per share amounts)
Common
Shares Outstanding
Class A
Common Stock
Additional
Paid-in Capital
Deferred Compensation
Retained Earnings
Unearned
ESOP Shares
Treasury Stock, at
Cost
Accumulated Other
Comprehensive (Loss) Income
240.7 Balance at December 29, 2001 ......... $ 3 $ 3,427 $ (49) $ 941 $ (291) $ (503) $ (50) - Net income ........................................ - - - 277 - - - - Dividends ($0.275 per share) ............ - - - (67) - - -
3.0 Employee stock plan issuance and other .......................................
- (203)
6
(25) 291
90
(20) (7.8) Purchase of treasury stock ................. - - - - - (254) -
235.9 Balance at January 3, 2003 ............... 3 3,224 (43) 1,126 - (667) (70) - Net income ........................................ - - - 502 - - - - Dividends ($0.295 per share) ............ - - - (68) - - -
5.8 Employee stock plan issuance and other .......................................
- 93
(38)
(55) -
182
29 (10.5) Purchase of treasury stock ................. - - - - - (380) -
231.2 Balance at January 2, 2004 ............... 3 3,317 (81) 1,505 - (865) (41)
- Net income ........................................ - - - 596 - - -
- Dividends ($0.330 per share) ............ - - - (75) - - -
8.6 Employee stock plan issuance
and other ........................................ -
106 (27)
(75) -
322
50 (14.0) Purchase of treasury stock ................. - - - - - (654) -
225.8 Balance at December 31, 2004 ......... $ 3 $ 3,423 $ (108) $ 1,951 $ - $ (1,197) $ 9
See Notes to Consolidated Financial Statements
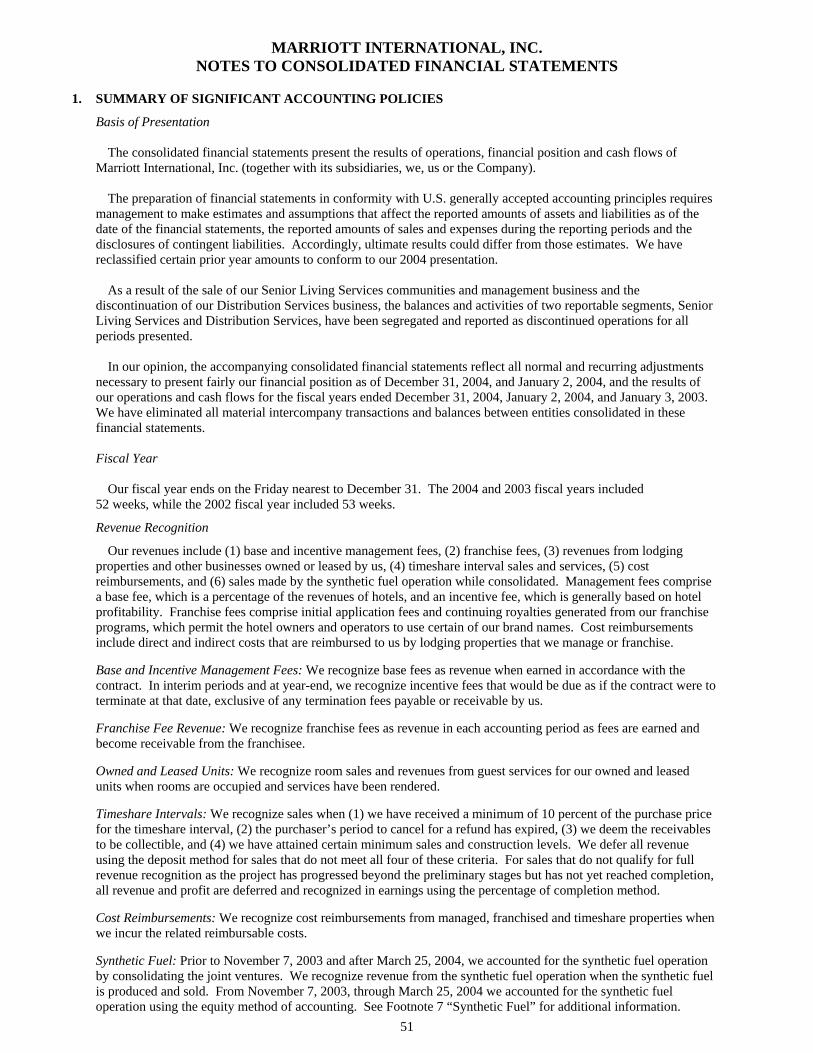
51
MARRIOTT INTERNATIONAL, INC. NOTES TO CONSOLIDATED FINANCIAL STATEMENTS
1. SUMMARY OF SIGNIFICANT ACCOUNTING POLICIES
Basis of Presentation The consolidated financial statements present the results of operations, financial position and cash flows of Marriott International, Inc. (together with its subsidiaries, we, us or the Company). The preparation of financial statements in conformity with U.S. generally accepted accounting principles requires management to make estimates and assumptions that affect the reported amounts of assets and liabilities as of the date of the financial statements, the reported amounts of sales and expenses during the reporting periods and the disclosures of contingent liabilities. Accordingly, ultimate results could differ from those estimates. We have reclassified certain prior year amounts to conform to our 2004 presentation. As a result of the sale of our Senior Living Services communities and management business and the discontinuation of our Distribution Services business, the balances and activities of two reportable segments, Senior Living Services and Distribution Services, have been segregated and reported as discontinued operations for all periods presented. In our opinion, the accompanying consolidated financial statements reflect all normal and recurring adjustments necessary to present fairly our financial position as of December 31, 2004, and January 2, 2004, and the results of our operations and cash flows for the fiscal years ended December 31, 2004, January 2, 2004, and January 3, 2003. We have eliminated all material intercompany transactions and balances between entities consolidated in these financial statements. Fiscal Year Our fiscal year ends on the Friday nearest to December 31. The 2004 and 2003 fiscal years included 52 weeks, while the 2002 fiscal year included 53 weeks.
Revenue Recognition
Our revenues include (1) base and incentive management fees, (2) franchise fees, (3) revenues from lodging properties and other businesses owned or leased by us, (4) timeshare interval sales and services, (5) cost reimbursements, and (6) sales made by the synthetic fuel operation while consolidated. Management fees comprise a base fee, which is a percentage of the revenues of hotels, and an incentive fee, which is generally based on hotel profitability. Franchise fees comprise initial application fees and continuing royalties generated from our franchise programs, which permit the hotel owners and operators to use certain of our brand names. Cost reimbursements include direct and indirect costs that are reimbursed to us by lodging properties that we manage or franchise. Base and Incentive Management Fees: We recognize base fees as revenue when earned in accordance with the contract. In interim periods and at year-end, we recognize incentive fees that would be due as if the contract were to terminate at that date, exclusive of any termination fees payable or receivable by us. Franchise Fee Revenue: We recognize franchise fees as revenue in each accounting period as fees are earned and become receivable from the franchisee. Owned and Leased Units: We recognize room sales and revenues from guest services for our owned and leased units when rooms are occupied and services have been rendered. Timeshare Intervals: We recognize sales when (1) we have received a minimum of 10 percent of the purchase price for the timeshare interval, (2) the purchaser’s period to cancel for a refund has expired, (3) we deem the receivables to be collectible, and (4) we have attained certain minimum sales and construction levels. We defer all revenue using the deposit method for sales that do not meet all four of these criteria. For sales that do not qualify for full revenue recognition as the project has progressed beyond the preliminary stages but has not yet reached completion, all revenue and profit are deferred and recognized in earnings using the percentage of completion method. Cost Reimbursements: We recognize cost reimbursements from managed, franchised and timeshare properties when we incur the related reimbursable costs. Synthetic Fuel: Prior to November 7, 2003 and after March 25, 2004, we accounted for the synthetic fuel operation by consolidating the joint ventures. We recognize revenue from the synthetic fuel operation when the synthetic fuel is produced and sold. From November 7, 2003, through March 25, 2004 we accounted for the synthetic fuel operation using the equity method of accounting. See Footnote 7 “Synthetic Fuel” for additional information.
52
Other Revenue includes land rent income and other revenue. In 2003, we recorded a $36 million insurance settlement for lost management fees associated with the New York Marriott World Trade Center hotel, which was destroyed in the 2001 terrorist attacks. Ground Leases We are both the lessor and lessee of land under long-term operating leases, which include scheduled increases in minimum rents. We recognize these scheduled rent increases on a straight-line basis over the initial lease terms.
Real Estate Sales We account for the sales of real estate in accordance with Financial Accounting Standards (“FAS”) No. 66 “Accounting for Sales of Real Estate.” We reduce gains on sales of real estate by the maximum exposure to loss if we have continuing involvement with the property and do not transfer substantially all of the risks and rewards of ownership. We reduced gains on sales of real estate due to maximum exposure to loss by $1 million in 2004, $4 million in 2003 and $51 million in 2002. In sales transactions where we retain a management contract, the terms and conditions of the management contract are comparable to the terms and conditions of the management contracts obtained directly with third-party owners in competitive bid processes.
Profit Sharing Plan We contribute to a profit sharing plan for the benefit of employees meeting certain eligibility requirements and electing participation in the plan. Contributions are determined based on a specified percentage of salary deferrals by participating employees. Excluding the discontinued Senior Living Services and Distribution Services businesses, we recognized compensation cost from profit sharing of $70 million in 2004, $53 million in 2003 and $54 million in 2002. We recognized compensation cost from profit sharing of $1 million in 2003 and $8 million in 2002, related to the discontinued Senior Living Services and Distribution Services businesses.
Self-Insurance Programs We are self-insured for certain levels of property, liability, workers’ compensation and employee medical coverage. We accrue estimated costs of these self-insurance programs at the present value of projected settlements for known and incurred but not reported claims. We use a discount rate of 4.8 percent to determine the present value of the projected settlements, which we consider to be reasonable given our history of settled claims, including payment patterns and the fixed nature of the individual settlements.
Marriott Rewards Marriott Rewards is our frequent guest loyalty program. Marriott Rewards members earn points based on their monetary spending at our lodging operations, purchases of timeshare intervals, and, to a lesser degree, through participation in affiliated partners’ programs, such as those offered by airlines and credit card companies. Points, which we accumulate and track on the members’ behalf, can be redeemed for hotel stays at most of our lodging operations, airline tickets, airline frequent flier program miles, rental cars and a variety of other awards. Points cannot be redeemed for cash.
We provide Marriott Rewards as a marketing program to participating hotels. We charge the cost of operating the program, including the estimated cost of award redemption, to hotels based on members’ qualifying expenditures.
We defer revenue received from managed and franchised properties, Marriott-owned/leased hotels and program partners equal to the fair value of our future redemption obligation. We determine the fair value of the future redemption obligation based on statistical formulas which project timing of future point redemption based on historical levels, including an estimate of the “breakage” for points that will never be redeemed and an estimate of the points that will eventually be redeemed. These judgmental factors determine the required liability for outstanding points. Our management and franchise agreements require that we be reimbursed currently for the costs of operating the program, including marketing, promotion, communication with, and performing member services for the Marriott Rewards members. Due to the requirement that properties reimburse us for program operating costs as incurred, we receive and recognize the balance of the revenue from properties in connection with the Marriott Rewards program at the time such costs are incurred and expensed. We recognize the component of revenue from program partners that corresponds to program maintenance services over the expected life of the points awarded. Upon the redemption of points, we recognize as revenue the amounts previously deferred, and recognize the corresponding expense relating to the costs of the awards redeemed. Our liability for the Marriott Rewards program was $942 million at December 31, 2004, and $784 million at January 2, 2004.
Guarantees
We record a liability for the fair value of a guarantee on the date a guarantee is issued or modified. The offsetting entry depends on the circumstances in which the guarantee was issued. Funding under the guarantee reduces the recorded liability. When no funding is forecasted, the liability is amortized into income on a straight-line basis over the remaining term of the guarantee.
53
Rebates and Allowances
We participate in various vendor rebate and allowance arrangements as a manager of hotel properties. There are three types of programs that are common in the hotel industry that are sometimes referred to as “rebates” or “allowances,” including unrestricted rebates, marketing (restricted) rebates and sponsorships. The primary business purpose of these arrangements is to secure favorable pricing for our hotel owners for various products and services or enhance resources for promotional campaigns co-sponsored by certain vendors. More specifically, unrestricted rebates are funds returned to the buyer, generally based upon volumes or quantities of goods purchased. Marketing (restricted) allowances are funds allocated by vendor agreements for certain marketing or other joint promotional initiatives. Sponsorships are funds paid by vendors, generally used by the vendor to gain exposure at meetings and events, which are accounted for as a reduction of the cost of the event.
We account for rebates and allowances as adjustments of the prices of the vendors’ products and services in accordance with EITF 02-16, “Accounting by a Customer (Including a Reseller) for Certain Consideration Received from a Vendor.” We show vendor costs and the reimbursement of those costs as reimbursed costs and cost reimbursements revenue, respectively; therefore, rebates are reflected as a reduction of these line items.
Cash and Equivalents
We consider all highly liquid investments with an initial maturity of three months or less at date of purchase to be cash equivalents.
Restricted Cash
Restricted cash, totaling $105 million and $139 million at December 31, 2004 and January 2, 2004 respectively, is recorded in other long-term assets in the accompanying Consolidated Balance Sheet. Restricted cash primarily consists of deposits received on timeshare interval sales that are held in escrow until the contract is closed.
Loan Loss Valuation
We measure loan impairment based on the present value of expected future cash flows discounted at the loan’s original effective interest rate or the estimated fair value of the collateral. For impaired loans, we establish a specific impairment reserve for the difference between the recorded investment in the loan and the present value of the expected future cash flows or the estimated fair value of the collateral. We apply our loan impairment policy individually to all loans in the portfolio and do not aggregate loans for the purpose of applying such policy. For loans that we have determined to be impaired, we recognize interest income on a cash basis.
Valuation of Goodwill
We evaluate the fair value of goodwill to assess potential impairments on an annual basis, or during the year if an event or other circumstance indicates that we may not be able to recover the carrying amount of the asset. We evaluate the fair value of goodwill at the reporting unit level and make that determination based upon future cash flow projections. We record an impairment loss for goodwill when the carrying value of the intangible asset is less than its estimated fair value.
Assets Held for Sale
We consider properties to be assets held for sale when management approves and commits to a formal plan to actively market a property for sale. Upon designation as an asset held for sale, we record the carrying value of each property at the lower of its carrying value or its estimated fair value, less estimated costs to sell, and we stop recording depreciation expense.
Investments
Except as otherwise required by FIN 46(R), “Consolidation of Variable Interest Entities,” we consolidate entities that we control. We account for investments in joint ventures using the equity method of accounting when we exercise significant influence over the venture. If we do not exercise significant influence, we account for the investment using the cost method of accounting. We account for investments in limited partnerships and limited liability companies using the equity method of accounting when we own more than a minimal investment. Our ownership interest in these equity method investments varies generally from 10 percent to 50 percent.
54
Costs Incurred to Sell Real Estate Projects
We capitalize direct costs incurred to sell real estate projects attributable to and recoverable from the sales of timeshare interests until the sales are recognized. Costs eligible for capitalization follow the guidelines of FAS No. 67, “Accounting for Costs and Initial Rental Operations of Real Estate Projects.” Selling and marketing costs capitalized under this approach were approximately $89 million and $69 million at December 31, 2004, and January 2, 2004, respectively, and are included in property and equipment in the accompanying Consolidated Balance Sheet. If a contract is canceled, we charge unrecoverable direct selling and marketing costs to expense and record deposits forfeited as income.
Residual Interests
We periodically sell notes receivable originated by our timeshare segment in connection with the sale of timeshare intervals. We retain servicing assets and other interests in the assets transferred to entities that are accounted for as residual interests. We treat the residual interests, excluding servicing assets, as “trading” securities under the provisions of FAS No. 115, “Accounting for Certain Investments in Debt and Equity Securities.” At the end of each reporting period, we estimate the fair value of the residual interests, excluding servicing assets, using a discounted cash flow model. We report changes in the fair values of these residual interests, excluding servicing assets, through the accompanying Consolidated Statement of Income. Servicing assets are classified as held to maturity under the provisions of FAS No. 115 and are recorded at amortized cost.
Derivative Instruments
We use derivative instruments as part of our overall strategy to manage our exposure to market risks associated with fluctuations in interest rates and foreign currency exchange rates. As a matter of policy, we do not use derivatives for trading or speculative purposes. We record all derivatives at fair value either as assets or liabilities. We recognize, currently in earnings, changes in fair value of derivatives not designated as hedging instruments and of derivatives designated as fair value hedging instruments. Changes in the fair value of the hedged item in a fair value hedge are recorded as an adjustment to the carrying amount of the hedged item and recognized in earnings in the same income statement line item as the change in the fair value of the derivative. We record the effective portion of changes in fair value of derivatives designated as cash flow hedging instruments as a component of other comprehensive income and report the ineffective portion currently in earnings. We reclassify amounts included in other comprehensive income into earnings in the same period during which the hedged item affects earnings.
Foreign Operations
The U.S. dollar is the functional currency of our consolidated and unconsolidated entities operating in the United States. The functional currency for our consolidated and unconsolidated entities operating outside of the United States is generally the currency of the environment in which the entity primarily generates and expends cash. For consolidated entities whose functional currency is not the U.S. dollar, we translate their financial statements into U.S. dollars, and we do the same, as needed, for unconsolidated entities whose functional currency is not the U.S. dollar. Assets and liabilities are translated at the exchange rate in effect as of the financial statement date, and income statement accounts are translated using the weighted average exchange rate for the period. Translation adjustments from foreign exchange and the effect of exchange rate changes on intercompany transactions of a long-term investment nature are included as a separate component of shareholder’s equity. We report gains and losses from foreign exchange rate changes related to intercompany receivables and payables that are not of a long-term investment nature, as well as gains and losses from foreign currency transactions, currently in operating costs and expenses, and those amounted to a $3 million loss in 2004, a $7 million gain in 2003, and a $6 million loss in 2002.
New Accounting Standards
In December 2004, the American Institute of Certified Public Accountants issued Statement of Position (“SOP”) 04-2, “Accounting for Real Estate Time-sharing Transactions,” and the Financial Accounting Standards Board (“FASB”) amended FAS No. 66, “Accounting for Sales of Real Estate,” and FAS No. 67 “Accounting for Costs and Initial Rental Operations of Real Estate Projects,” to exclude accounting for real estate time-sharing transactions from these statements. The SOP will be effective for fiscal years beginning after June 15, 2005.
55
Under the SOP, the majority of the costs incurred to sell timeshares will be charged to expense when incurred. In regards to notes receivable issued in conjunction with a sale, an estimate of uncollectibility that is expected to occur must be recorded as a reduction of revenue at the time that profit is recognized on a timeshare sale. Rental and other operations during holding periods must be accounted for as incidental operations, which require that any excess costs be recorded as a reduction of inventory costs.
We estimate that the initial adoption of the SOP, which will be reported as a cumulative effect of a change in accounting principle in our Fiscal Year 2006 financial statements, will result in a one-time non-cash pre-tax charge of approximately $150 million, consisting primarily of the write-off of deferred selling costs and establishing the required reserve on notes. We estimate that the ongoing impact of adoption will not be significant.
In December 2004, the FASB issued FAS No. 123 (revised 2004), “Share-Based Payment” (“FAS No. 123R”), which is a revision of FAS No. 123, “Accounting for Stock-Based Compensation.” FAS No. 123R supersedes APB Opinion No. 25, “Accounting for Stock Issued to Employees,” and amends FAS No. 95, “Statement of Cash Flows.” We will adopt FAS No. 123R at the beginning of our 2005 third quarter.
FAS No. 123R requires all share-based payments to employees, including grants of employee stock options, to be recorded as an expense based on their fair values. The grant-date fair value of employee share options and similar instruments will be estimated using an option-pricing model adjusted for any unique characteristics of a particular instrument. If an equity award is modified after the grant date, incremental compensation cost will be recognized in an amount equal to the excess of the fair value of the modified award over the fair value of the original award immediately before the modification.
We estimate that the adoption of FAS No. 123R, using the modified prospective method, will result in incremental pre-tax expense in fiscal year 2005 of approximately $20 million, based on our current share-based payment compensation plans and a mid-year adoption.
Stock-based Compensation
We have several stock-based employee compensation plans that we account for using the intrinsic value method under the recognition and measurement principles of Accounting Principles Board (APB) Opinion No. 25, “Accounting for Stock Issued to Employees.” Accordingly, we do not reflect stock-based employee compensation cost in net income for our Stock Option Program, the Supplemental Executive Stock Option awards or the Employee Stock Purchase Plan. We recognized stock-based employee compensation cost of $31 million, $19 million and $9 million, net of tax, for deferred share grants, restricted share grants and restricted stock units (2004 and 2003 only) for 2004, 2003 and 2002, respectively.
The following table illustrates the effect on net income and earnings per share as if we had applied the fair value recognition provisions of FAS No. 123, “Accounting for Stock-Based Compensation,” to stock-based employee compensation. We have included the impact of measured but unrecognized compensation cost and excess tax benefits credited to additional paid-in-capital in the calculation of the diluted pro forma shares for all years presented. In addition, we have included the estimated impact of reimbursements from third parties.
($ in millions, except per share amounts) 2004 2003 2002
Net income, as reported ............................................. $ 596 $ 502 $ 277 Add: Stock-based employee compensation expense included in reported net income, net of related tax effects ...............................................
31
19
9
Deduct: Total stock-based employee compensation expense determined under fair value-based method for all awards, net of related tax effects and estimated reimbursed costs ............
(58)
(48)
(37) Pro forma net income ................................................ $ 569 $ 473 $ 249
Earnings per share: Basic – as reported ................................................. $ 2.63 $ 2.16 $ 1.15 Basic – pro forma ................................................... $ 2.51 $ 2.03 $ 1.04
Diluted – as reported .............................................. $ 2.48 $ 2.05 $ 1.10 Diluted – pro forma ................................................ $ 2.35 $ 1.94 $ 0.99
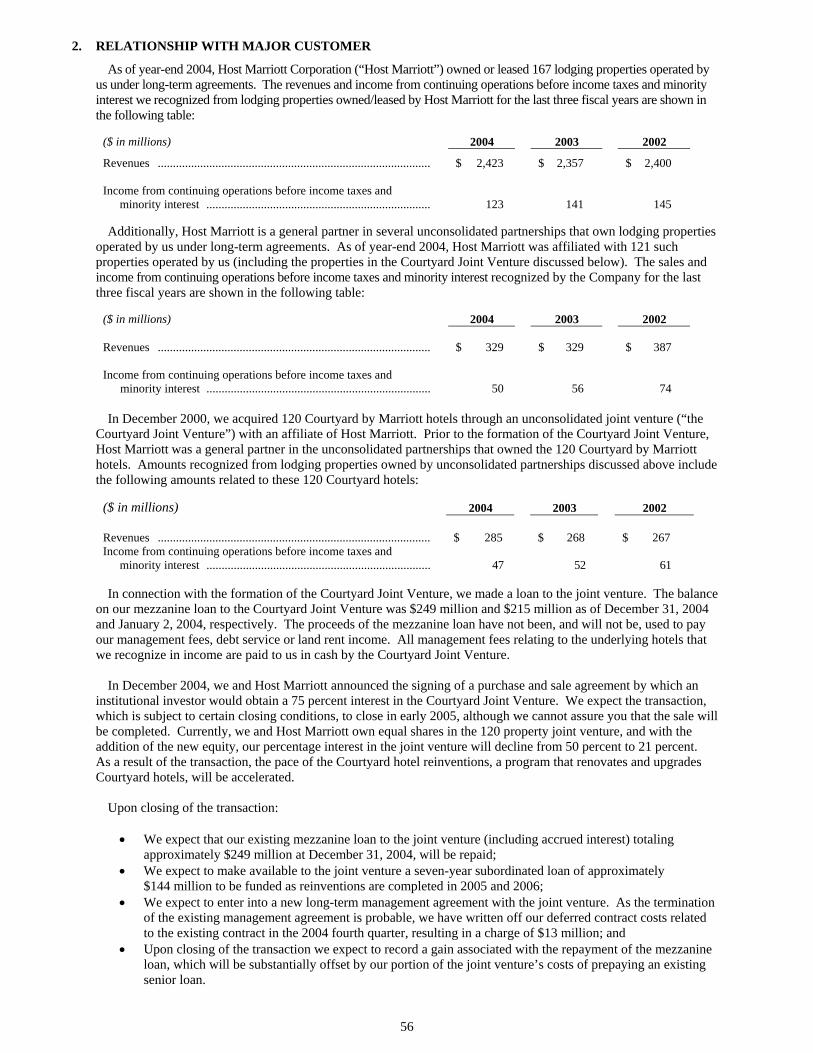
56
2. RELATIONSHIP WITH MAJOR CUSTOMER
As of year-end 2004, Host Marriott Corporation (“Host Marriott”) owned or leased 167 lodging properties operated by us under long-term agreements. The revenues and income from continuing operations before income taxes and minority interest we recognized from lodging properties owned/leased by Host Marriott for the last three fiscal years are shown in the following table:
($ in millions) 2004 2003 2002
Revenues .......................................................................................... $ 2,423 $ 2,357 $ 2,400 Income from continuing operations before income taxes and minority interest .......................................................................... 123 141 145
Additionally, Host Marriott is a general partner in several unconsolidated partnerships that own lodging properties operated by us under long-term agreements. As of year-end 2004, Host Marriott was affiliated with 121 such properties operated by us (including the properties in the Courtyard Joint Venture discussed below). The sales and income from continuing operations before income taxes and minority interest recognized by the Company for the last three fiscal years are shown in the following table:
($ in millions) 2004 2003 2002 Revenues .......................................................................................... $ 329 $ 329 $ 387 Income from continuing operations before income taxes and minority interest .......................................................................... 50 56 74
In December 2000, we acquired 120 Courtyard by Marriott hotels through an unconsolidated joint venture (“the Courtyard Joint Venture”) with an affiliate of Host Marriott. Prior to the formation of the Courtyard Joint Venture, Host Marriott was a general partner in the unconsolidated partnerships that owned the 120 Courtyard by Marriott hotels. Amounts recognized from lodging properties owned by unconsolidated partnerships discussed above include the following amounts related to these 120 Courtyard hotels:
($ in millions) 2004 2003 2002 Revenues .......................................................................................... $ 285 $ 268 $ 267 Income from continuing operations before income taxes and minority interest .......................................................................... 47 52 61
In connection with the formation of the Courtyard Joint Venture, we made a loan to the joint venture. The balance on our mezzanine loan to the Courtyard Joint Venture was $249 million and $215 million as of December 31, 2004 and January 2, 2004, respectively. The proceeds of the mezzanine loan have not been, and will not be, used to pay our management fees, debt service or land rent income. All management fees relating to the underlying hotels that we recognize in income are paid to us in cash by the Courtyard Joint Venture.
In December 2004, we and Host Marriott announced the signing of a purchase and sale agreement by which an institutional investor would obtain a 75 percent interest in the Courtyard Joint Venture. We expect the transaction, which is subject to certain closing conditions, to close in early 2005, although we cannot assure you that the sale will be completed. Currently, we and Host Marriott own equal shares in the 120 property joint venture, and with the addition of the new equity, our percentage interest in the joint venture will decline from 50 percent to 21 percent. As a result of the transaction, the pace of the Courtyard hotel reinventions, a program that renovates and upgrades Courtyard hotels, will be accelerated.
Upon closing of the transaction: • We expect that our existing mezzanine loan to the joint venture (including accrued interest) totaling
approximately $249 million at December 31, 2004, will be repaid; • We expect to make available to the joint venture a seven-year subordinated loan of approximately
$144 million to be funded as reinventions are completed in 2005 and 2006; • We expect to enter into a new long-term management agreement with the joint venture. As the termination
of the existing management agreement is probable, we have written off our deferred contract costs related to the existing contract in the 2004 fourth quarter, resulting in a charge of $13 million; and
• Upon closing of the transaction we expect to record a gain associated with the repayment of the mezzanine loan, which will be substantially offset by our portion of the joint venture’s costs of prepaying an existing senior loan.
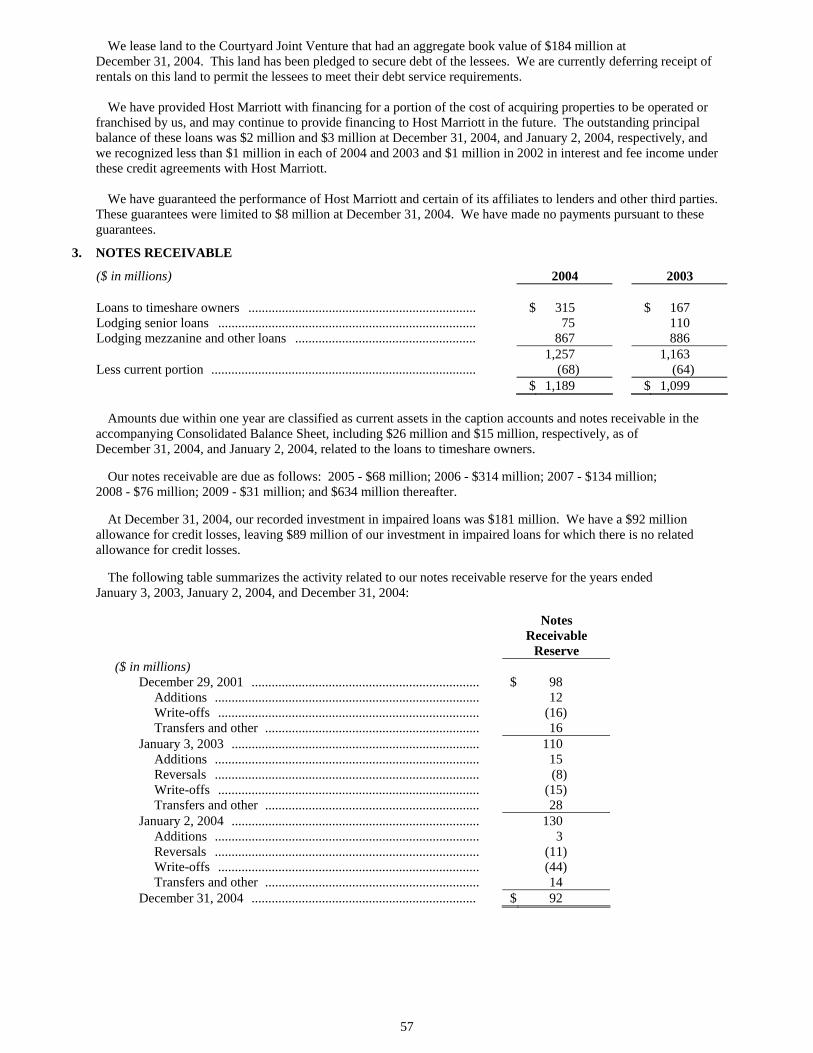
57
We lease land to the Courtyard Joint Venture that had an aggregate book value of $184 million at December 31, 2004. This land has been pledged to secure debt of the lessees. We are currently deferring receipt of rentals on this land to permit the lessees to meet their debt service requirements. We have provided Host Marriott with financing for a portion of the cost of acquiring properties to be operated or franchised by us, and may continue to provide financing to Host Marriott in the future. The outstanding principal balance of these loans was $2 million and $3 million at December 31, 2004, and January 2, 2004, respectively, and we recognized less than $1 million in each of 2004 and 2003 and $1 million in 2002 in interest and fee income under these credit agreements with Host Marriott. We have guaranteed the performance of Host Marriott and certain of its affiliates to lenders and other third parties. These guarantees were limited to $8 million at December 31, 2004. We have made no payments pursuant to these guarantees.
3. NOTES RECEIVABLE
($ in millions) 2004 2003 Loans to timeshare owners .................................................................... $ 315 $ 167 Lodging senior loans ............................................................................. 75 110 Lodging mezzanine and other loans ...................................................... 867 886 1,257 1,163 Less current portion ............................................................................... (68) (64) $ 1,189 $ 1,099 Amounts due within one year are classified as current assets in the caption accounts and notes receivable in the accompanying Consolidated Balance Sheet, including $26 million and $15 million, respectively, as of December 31, 2004, and January 2, 2004, related to the loans to timeshare owners. Our notes receivable are due as follows: 2005 - $68 million; 2006 - $314 million; 2007 - $134 million; 2008 - $76 million; 2009 - $31 million; and $634 million thereafter. At December 31, 2004, our recorded investment in impaired loans was $181 million. We have a $92 million allowance for credit losses, leaving $89 million of our investment in impaired loans for which there is no related allowance for credit losses. The following table summarizes the activity related to our notes receivable reserve for the years ended January 3, 2003, January 2, 2004, and December 31, 2004:
Notes Receivable
Reserve ($ in millions) December 29, 2001 .................................................................... $ 98 Additions ............................................................................... 12 Write-offs .............................................................................. (16) Transfers and other ................................................................ 16 January 3, 2003 .......................................................................... 110 Additions ............................................................................... 15 Reversals ............................................................................... (8) Write-offs .............................................................................. (15) Transfers and other ................................................................ 28 January 2, 2004 .......................................................................... 130 Additions ............................................................................... 3 Reversals ............................................................................... (11) Write-offs .............................................................................. (44) Transfers and other ................................................................ 14 December 31, 2004 ................................................................... $ 92
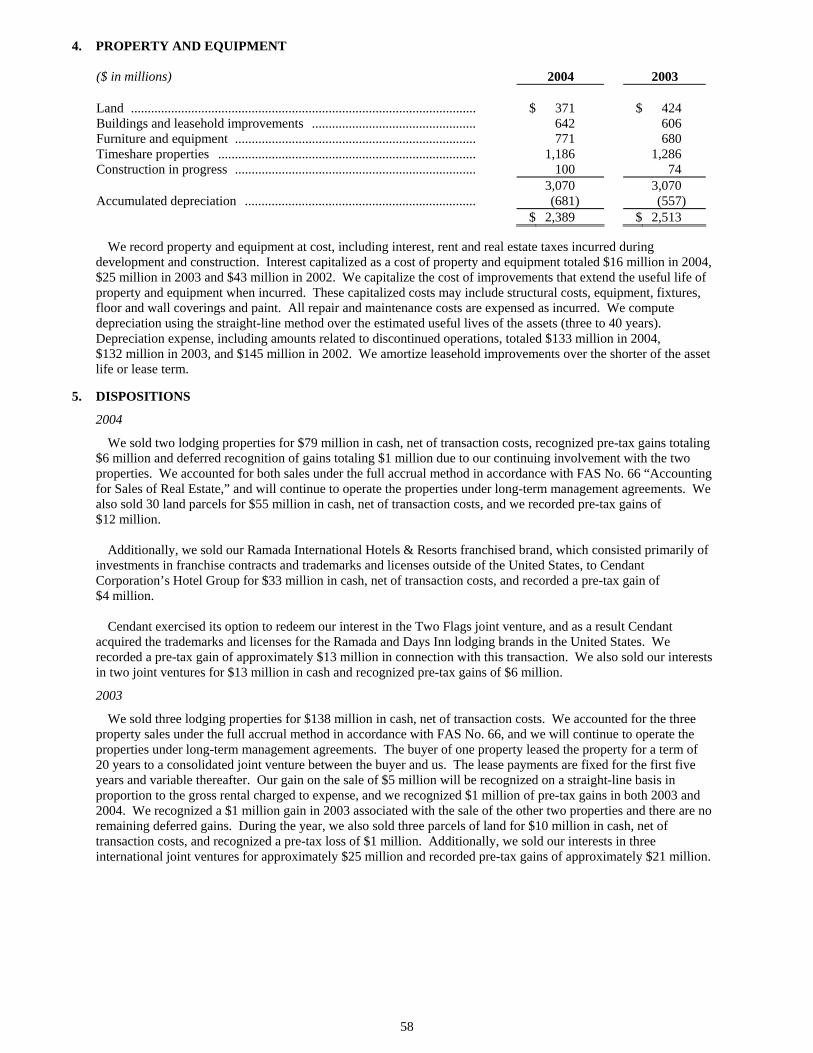
58
4. PROPERTY AND EQUIPMENT ($ in millions) 2004 2003 Land ....................................................................................................... $ 371 $ 424 Buildings and leasehold improvements ................................................. 642 606 Furniture and equipment ........................................................................ 771 680 Timeshare properties ............................................................................. 1,186 1,286 Construction in progress ........................................................................ 100 74 3,070 3,070 Accumulated depreciation ..................................................................... (681) (557) $ 2,389 $ 2,513 We record property and equipment at cost, including interest, rent and real estate taxes incurred during development and construction. Interest capitalized as a cost of property and equipment totaled $16 million in 2004, $25 million in 2003 and $43 million in 2002. We capitalize the cost of improvements that extend the useful life of property and equipment when incurred. These capitalized costs may include structural costs, equipment, fixtures, floor and wall coverings and paint. All repair and maintenance costs are expensed as incurred. We compute depreciation using the straight-line method over the estimated useful lives of the assets (three to 40 years). Depreciation expense, including amounts related to discontinued operations, totaled $133 million in 2004, $132 million in 2003, and $145 million in 2002. We amortize leasehold improvements over the shorter of the asset life or lease term.
5. DISPOSITIONS
2004
We sold two lodging properties for $79 million in cash, net of transaction costs, recognized pre-tax gains totaling $6 million and deferred recognition of gains totaling $1 million due to our continuing involvement with the two properties. We accounted for both sales under the full accrual method in accordance with FAS No. 66 “Accounting for Sales of Real Estate,” and will continue to operate the properties under long-term management agreements. We also sold 30 land parcels for $55 million in cash, net of transaction costs, and we recorded pre-tax gains of $12 million. Additionally, we sold our Ramada International Hotels & Resorts franchised brand, which consisted primarily of investments in franchise contracts and trademarks and licenses outside of the United States, to Cendant Corporation’s Hotel Group for $33 million in cash, net of transaction costs, and recorded a pre-tax gain of $4 million. Cendant exercised its option to redeem our interest in the Two Flags joint venture, and as a result Cendant acquired the trademarks and licenses for the Ramada and Days Inn lodging brands in the United States. We recorded a pre-tax gain of approximately $13 million in connection with this transaction. We also sold our interests in two joint ventures for $13 million in cash and recognized pre-tax gains of $6 million.
2003
We sold three lodging properties for $138 million in cash, net of transaction costs. We accounted for the three property sales under the full accrual method in accordance with FAS No. 66, and we will continue to operate the properties under long-term management agreements. The buyer of one property leased the property for a term of 20 years to a consolidated joint venture between the buyer and us. The lease payments are fixed for the first five years and variable thereafter. Our gain on the sale of $5 million will be recognized on a straight-line basis in proportion to the gross rental charged to expense, and we recognized $1 million of pre-tax gains in both 2003 and 2004. We recognized a $1 million gain in 2003 associated with the sale of the other two properties and there are no remaining deferred gains. During the year, we also sold three parcels of land for $10 million in cash, net of transaction costs, and recognized a pre-tax loss of $1 million. Additionally, we sold our interests in three international joint ventures for approximately $25 million and recorded pre-tax gains of approximately $21 million.
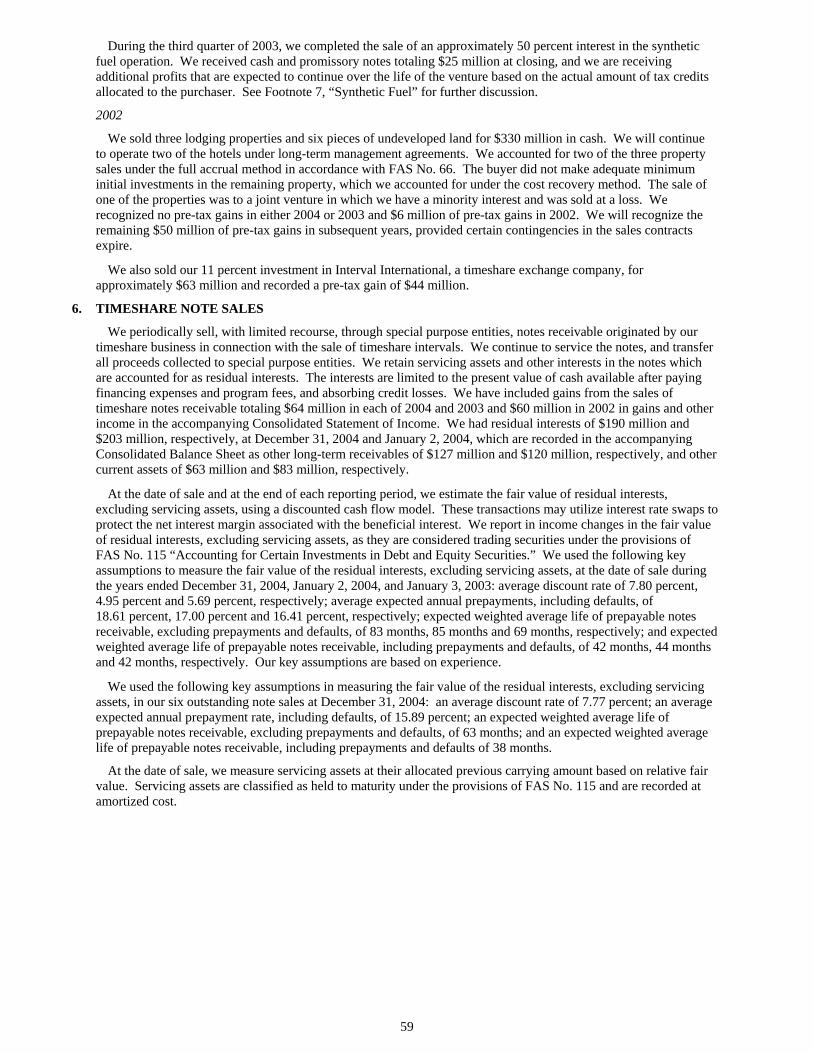
59
During the third quarter of 2003, we completed the sale of an approximately 50 percent interest in the synthetic fuel operation. We received cash and promissory notes totaling $25 million at closing, and we are receiving additional profits that are expected to continue over the life of the venture based on the actual amount of tax credits allocated to the purchaser. See Footnote 7, “Synthetic Fuel” for further discussion.
2002
We sold three lodging properties and six pieces of undeveloped land for $330 million in cash. We will continue to operate two of the hotels under long-term management agreements. We accounted for two of the three property sales under the full accrual method in accordance with FAS No. 66. The buyer did not make adequate minimum initial investments in the remaining property, which we accounted for under the cost recovery method. The sale of one of the properties was to a joint venture in which we have a minority interest and was sold at a loss. We recognized no pre-tax gains in either 2004 or 2003 and $6 million of pre-tax gains in 2002. We will recognize the remaining $50 million of pre-tax gains in subsequent years, provided certain contingencies in the sales contracts expire.
We also sold our 11 percent investment in Interval International, a timeshare exchange company, for approximately $63 million and recorded a pre-tax gain of $44 million.
6. TIMESHARE NOTE SALES
We periodically sell, with limited recourse, through special purpose entities, notes receivable originated by our timeshare business in connection with the sale of timeshare intervals. We continue to service the notes, and transfer all proceeds collected to special purpose entities. We retain servicing assets and other interests in the notes which are accounted for as residual interests. The interests are limited to the present value of cash available after paying financing expenses and program fees, and absorbing credit losses. We have included gains from the sales of timeshare notes receivable totaling $64 million in each of 2004 and 2003 and $60 million in 2002 in gains and other income in the accompanying Consolidated Statement of Income. We had residual interests of $190 million and $203 million, respectively, at December 31, 2004 and January 2, 2004, which are recorded in the accompanying Consolidated Balance Sheet as other long-term receivables of $127 million and $120 million, respectively, and other current assets of $63 million and $83 million, respectively.
At the date of sale and at the end of each reporting period, we estimate the fair value of residual interests, excluding servicing assets, using a discounted cash flow model. These transactions may utilize interest rate swaps to protect the net interest margin associated with the beneficial interest. We report in income changes in the fair value of residual interests, excluding servicing assets, as they are considered trading securities under the provisions of FAS No. 115 “Accounting for Certain Investments in Debt and Equity Securities.” We used the following key assumptions to measure the fair value of the residual interests, excluding servicing assets, at the date of sale during the years ended December 31, 2004, January 2, 2004, and January 3, 2003: average discount rate of 7.80 percent, 4.95 percent and 5.69 percent, respectively; average expected annual prepayments, including defaults, of 18.61 percent, 17.00 percent and 16.41 percent, respectively; expected weighted average life of prepayable notes receivable, excluding prepayments and defaults, of 83 months, 85 months and 69 months, respectively; and expected weighted average life of prepayable notes receivable, including prepayments and defaults, of 42 months, 44 months and 42 months, respectively. Our key assumptions are based on experience.
We used the following key assumptions in measuring the fair value of the residual interests, excluding servicing assets, in our six outstanding note sales at December 31, 2004: an average discount rate of 7.77 percent; an average expected annual prepayment rate, including defaults, of 15.89 percent; an expected weighted average life of prepayable notes receivable, excluding prepayments and defaults, of 63 months; and an expected weighted average life of prepayable notes receivable, including prepayments and defaults of 38 months.
At the date of sale, we measure servicing assets at their allocated previous carrying amount based on relative fair value. Servicing assets are classified as held to maturity under the provisions of FAS No. 115 and are recorded at amortized cost.
60
Cash flows between us and third-party purchasers during the years ended December 31, 2004, January 2, 2004, and January 3, 2003, were as follows: net proceeds to us from new timeshare note sales of $312 million, $231 million and $341 million, respectively; repurchases by us of defaulted loans (over 150 days overdue) of $18 million, $19 million and $16 million, respectively; servicing fees received by us of $4 million, $3 million and $3 million, respectively; and cash flows received from our retained interests of $90 million, $47 million and $28 million, respectively.
At December 31, 2004, $810 million of principal remains outstanding in all sales in which we have a retained residual interest. Delinquencies of more than 90 days at December 31, 2004, amounted to $4 million. Net of recoveries, we incurred no losses on defaulted loans that were resolved during the year ended December 31, 2004. We have been able to resell timeshare units underlying defaulted loans without incurring material losses.
On November 21, 2002, we repurchased notes receivable with a principal balance of $381 million and immediately sold $365 million of those notes, along with $135 million of additional notes, in a $500 million sale to an investor group. We have included net proceeds from these transactions of $89 million, including repayments of interest rate swaps on the $381 million of repurchased notes receivable, in the net proceeds from new timeshare note sales disclosed above. We realized a gain of $14 million, primarily associated with the $135 million of additional notes sold, which is included in the $60 million gain on the sales of notes receivable for fiscal year 2002 disclosed above.
We have completed a stress test on the fair value of the residual interests with the objective of measuring the change in value associated with independent changes in individual key variables. The methodology used applied unfavorable changes that would be considered statistically significant for the key variables of prepayment rate, discount rate and weighted average remaining term. The fair value of the residual interests was $190 million at December 31, 2004, before any stress test changes were applied. An increase of 100 basis points in the prepayment rate would decrease the year-end valuation by $3 million, or 1.7 percent, and an increase of 200 basis points in the prepayment rate would decrease the year-end valuation by $7 million, or 3.4 percent. An increase of 100 basis points in the discount rate would decrease the year-end valuation by $4 million, or 2.2 percent, and an increase of 200 basis points in the discount rate would decrease the year-end valuation by $8 million, or 4.4 percent. A decline of two months in the weighted-average remaining term would decrease the year-end valuation by $2 million, or 1 percent, and a decline of four months in the weighted-average remaining term would decrease the year-end valuation by $4 million, or 2.1 percent.
7. SYNTHETIC FUEL
Operations
Our synthetic fuel operation currently consists of our interest in four coal-based synthetic fuel production facilities (the “Facilities”), two of which are located at a coal mine in Saline County, Illinois, with the remaining two located at a coal mine in Jefferson County, Alabama. Three of the four plants are held in one entity, and one of the plants is held in a separate entity. The synthetic fuel produced at the Facilities through 2007 qualifies for tax credits based on Section 29 of the Internal Revenue Code (credits are not available for fuel produced after 2007). Although the Facilities incur significant losses, these losses are more than offset by the tax credits generated under Section 29, which reduce our income tax expense.
At both of the locations, the synthetic fuel operation has entered into long-term site leases at sites that are adjacent to large underground mines as well as barge load-out facilities on navigable rivers. In addition, the synthetic fuel operation has entered into long-term coal purchase agreements with the owners of the adjacent coal mines and long-term synthetic fuel sales contracts with the Tennessee Valley Authority and with Alabama Power Company, two major utilities. These contracts ensure that the operation has long-term agreements to purchase coal and sell synthetic fuel, covering approximately 80 percent of the productive capacity of the facilities. From time to time, the synthetic fuel operation supplements these base contracts, as opportunities arise, by entering into spot contracts to buy coal from these or other coal mines and sell synthetic fuel to different end users. The operation is slightly seasonal as the synthetic fuel is mainly burned to produce electricity and electricity use peaks in the summer in the markets served by the synthetic fuel operation. The long-term contracts can generally be canceled by us in the event that we choose not to operate the Facilities or that the synthetic fuel produced at the Facilities does not qualify for tax credits under Section 29 of the Internal Revenue Code.
The synthetic fuel operation has entered into a long-term operations and maintenance agreement with an experienced manager of synthetic fuel facilities. This manager is responsible for staffing the facilities, operating and maintaining the machinery and conducting routine maintenance on behalf of the synthetic fuel operation.
Finally, the synthetic fuel operation has entered into a long-term license and binder purchase agreement with Headwaters Incorporated, which permits the operation to utilize a carboxylated polystyrene copolymer emulsion patented by Headwaters and manufactured by Dow Chemical that is mixed with coal to produce a qualified synthetic fuel.
61
Our Investment
As a result of a put option associated with the June 21, 2003, sale of a 50 percent ownership interest in the synthetic fuel entities, we consolidated the two synthetic fuel joint ventures from that date through November 6, 2003. Effective November 7, 2003, because the put option was voided, we began accounting for the synthetic fuel joint ventures using the equity method of accounting. Beginning March 26, 2004, as a result of adopting FIN 46(R), we have again consolidated the synthetic fuel joint ventures, and we reflect our partner’s share of the operating losses as minority interest.
Internal Revenue Service (“IRS”) Placed-in-Service Challenge
In July 2004, IRS field auditors issued a notice of proposed adjustment and later a Summary Report to PacifiCorp, the previous owner of the Facilities, that included a challenge to the placed-in-service dates of three of the four synthetic fuel facilities owned by one of our synthetic fuel joint ventures. One of the conditions to qualify for tax credits under Section 29 of the Internal Revenue Code is that the production facility must have been placed in service before July 1, 1998.
We strongly believe that all the facilities meet the placed-in-service requirement. Although we are engaged in discussions with the IRS and are confident this issue will be resolved in our favor and not result in a material charge to us, we cannot assure you as to the ultimate outcome of this matter. If ultimately resolved against us we could be prevented from realizing projected future tax credits and cause us to reverse previously utilized tax credits, requiring payment of substantial additional taxes. Since acquiring the plants, we have recognized approximately $435 million of tax credits from all four plants through December 31, 2004. The tax credits recognized through December 31, 2004, associated with the three facilities in question totaled approximately $330 million.
On October 6, 2004, we entered into amendment agreements with our synthetic fuel partner that result in a shift in the allocation of tax credits between us. On the synthetic fuel facility that is not being reviewed by the IRS, our partner increased its allocation of tax credits from approximately 50 percent to 90 percent through March 31, 2005, and pays a higher price per tax credit to us for that additional share of tax credits. With respect to the three synthetic fuel facilities under IRS review, our partner reduced its allocation of tax credits from approximately 50 percent to an average of roughly 5 percent through March 31, 2005. If the IRS’ placed-in-service challenge regarding the three facilities is not successfully resolved by March 31, 2005, our partner will have the right to return its ownership interest in those three facilities to us at that time. We will have the flexibility to continue to operate at current levels, reduce production and/or sell an interest to another party. If there is a successful resolution by March 31, 2005, our partner’s share of the tax credits from all four facilities will return to approximately 50 percent. In any event, on March 31, 2005, our share of the tax credits from the one facility not under review will return to approximately 50 percent.
8. DISCONTINUED OPERATIONS
Senior Living Services
During 2002, we completed the sale of 41 properties for $210 million and recorded an after-tax loss of $2 million. On December 30, 2002, we entered into a definitive agreement to sell our senior living management business to Sunrise Senior Living, Inc. (“Sunrise”) and to sell nine senior living communities to CNL Retirement Properties, Inc. (“CNL”) and recorded an after-tax charge of $131 million. We completed the sales to Sunrise and CNL, in addition to the related sale of a parcel of land to Sunrise in March 2003, for $266 million. We recorded after-tax gains of $19 million in 2003. Also, on December 30, 2002, we purchased 14 senior living communities for approximately $15 million in cash, plus the assumption of $227 million in debt, from an unrelated owner. We had previously agreed to provide a form of credit enhancement on the outstanding debt related to these communities. Management approved and committed to a plan to sell these communities within 12 months. As part of that plan, on March 31, 2003, we acquired all of the subordinated credit-enhanced mortgage securities relating to the 14 communities in a transaction in which we issued $46 million of unsecured Marriott International, Inc. notes, due April 2004. In the 2003 third quarter, we sold the 14 communities to CNL for approximately $184 million. We provided a $92 million acquisition loan to CNL in connection with the sale. Sunrise currently operates, and will continue to operate, the 14 communities under long-term management agreements. We recorded a gain, net of taxes, of $1 million. The operating results of our senior living segment are reported in discontinued operations during the years ended January 2, 2004, and January 3, 2003 and the remaining assets and liabilities were classified as assets held for sale and liabilities of businesses held for sale, respectively, on the accompanying Consolidated Balance Sheet at January 3, 2003.
62
The following table provides additional income statement and balance sheet information relating to the Senior Living Services business: ($ in millions) 2004 2003 2002 Income Statement Summary Sales ............................................................................ $ - $ 184 $ 802 Pre-tax income on operations ..................................... $ - $ 11 $ 37 Tax provision .............................................................. - (4) (14) Income on operations, net of tax ................................. $ - $ 7 $ 23 Pre-tax gain (loss) on disposal .................................... $ - $ 31 $ (141) Tax (provision) benefit ............................................... - (12) 10 Gain (loss) on disposal, net of tax .............................. $ - $ 19 $ (131) Balance Sheet Summary Property, plant and equipment ...................................... $ - $ - $ 434 Goodwill ......................................................................... - - 115 Other assets ................................................................. - - 54 Liabilities .................................................................... - - 317
The tax benefit in 2002 of $10 million associated with the loss on disposal includes $45 million of additional taxes related to goodwill with no tax basis.
Distribution Services
In the third quarter of 2002, we completed a previously announced strategic review of our Distribution Services business and decided to exit that business. We completed that exit during the fourth quarter of 2002 through a combination of transferring certain facilities, closing other facilities and other suitable arrangements. In the year ended January 3, 2003, we recognized a pre-tax charge of $65 million in connection with the decision to exit this business. The charge includes (1) $15 million for payments to third parties to subsidize their assumption of, or in some cases to terminate, existing distribution or warehouse lease contracts; (2) $9 million for severance costs; (3) $10 million related to the adjusting of fixed assets to net realizable values; (4) $2 million related to inventory losses; (5) $15 million for losses on equipment leases; (6) $10 million for losses on warehouse leases; and (7) $4 million of other associated charges.
The following table provides additional income statement and balance sheet information relating to the Distribution Services business: ($ in millions) 2004 2003 2002 Income Statement Summary Sales ............................................................................ $ - $ - $ 1,376 Pre-tax income (loss) .................................................. $ 3 $ - $ (24) Tax (provision) benefit ............................................... (1) - 10 Income (loss), net of tax ............................................. $ 2 $ - $ (14) Pre-tax exit costs ......................................................... $ - $ - $ (65) Tax benefit .................................................................. - - 25 Exit costs, net of tax ................................................... $ - $ - $ (40) Balance Sheet Summary Property, plant and equipment ...................................... $ - $ - $ 9 Other assets ................................................................. - - 21 Liabilities .................................................................... - - 49
63
9. GOODWILL AND INTANGIBLE ASSETS ($ in millions) 2004 2003 Contract acquisition costs ............................................................................. $ 738 $ 730 Accumulated amortization ............................................................................ (225) (204) $ 513 $ 526 Goodwill ....................................................................................................... $ 1,051 $ 1,051 Accumulated amortization ............................................................................ (128) (128) $ 923 $ 923
We capitalize costs incurred to acquire management, franchise, and license agreements that are both direct and incremental. We amortize these costs on a straight-line basis over the initial term of the agreements, typically 15 to 30 years. Amortization expense, including amounts related to discontinued operations, totaled $33 million in 2004, $28 million in 2003 and $42 million in 2002.
10. SHAREHOLDERS’ EQUITY Eight hundred million shares of our Class A Common Stock, with a par value of $.01 per share, are authorized. Ten million shares of preferred stock, without par value, are authorized, 200,000 shares have been issued, 100,000 of which were for the Employee Stock Ownership Plan (ESOP) and 100,000 of which were for Capped Convertible Preferred Stock. As of December 31, 2004, there were no outstanding shares of the ESOP stock, and all the shares of the Capped Convertible Preferred Stock shares were retired and cancelled. On March 27, 1998, our Board of Directors adopted a shareholder rights plan under which one preferred stock purchase right was distributed for each share of our Class A Common Stock. Each right entitles the holder to buy 1/1000th of a share of a newly issued series of junior participating preferred stock of the Company at an exercise price of $175. The rights may not presently be exercised, but will be exercisable 10 days after a person or group acquires beneficial ownership of 20 percent or more of our Class A Common Stock or begins a tender or exchange for 30 percent or more of our Class A Common Stock. Shares owned by a person or group on March 27, 1998, and held continuously thereafter, are exempt for purposes of determining beneficial ownership under the rights plan. The rights are nonvoting and will expire on the tenth anniversary of the adoption of the shareholder rights plan unless previously exercised or redeemed by us for $.01 each. If we are involved in a merger or certain other business combinations not approved by the Board of Directors, each right entitles its holder, other than the acquiring person or group, to purchase common stock of either the Company or the acquirer having a value of twice the exercise price of the right.
During the second quarter of 2000, we established an employee stock ownership plan solely to fund employer contributions to the profit sharing plan. The ESOP acquired 100,000 shares of special-purpose Company convertible preferred stock (ESOP Preferred Stock) for $1 billion. The ESOP Preferred Stock had a stated value and liquidation preference of $10,000 per share, paid a quarterly dividend of 1 percent of the stated value, and was convertible into our Class A Common Stock at any time based on the amount of our contributions to the ESOP and the market price of the common stock on the conversion date, subject to certain caps and a floor price. We held a note from the ESOP, which was eliminated upon consolidation, for the purchase price of the ESOP Preferred Stock. The shares of ESOP Preferred Stock were pledged as collateral for the repayment of the ESOP’s note, and those shares were released from the pledge as principal on the note was repaid. Shares of ESOP Preferred Stock released from the pledge were redeemable for cash based on the value of the common stock into which those shares could be converted. Principal and interest payments on the ESOP’s debt were forgiven periodically to fund contributions to the ESOP and release shares of ESOP Preferred Stock. Unearned ESOP shares were reflected within shareholders’ equity and amortized as shares of ESOP Preferred Stock were released and cash was allocated to employees’ accounts. The fair market value of the unearned ESOP shares at December 28, 2001, was $263 million. The last of the shares of ESOP Preferred Stock were released to fund contributions as of July 18, 2002, at which time the remainder of the principal and interest due on the ESOP’s note was forgiven. As of December 31, 2004, there were no outstanding shares of ESOP Preferred Stock.
Our accumulated other comprehensive income of $9 million and our accumulated other comprehensive loss of
$41 million at December 31, 2004, and January 2, 2004, respectively, consists primarily of fair value changes of certain financial instruments and foreign currency translation adjustments.
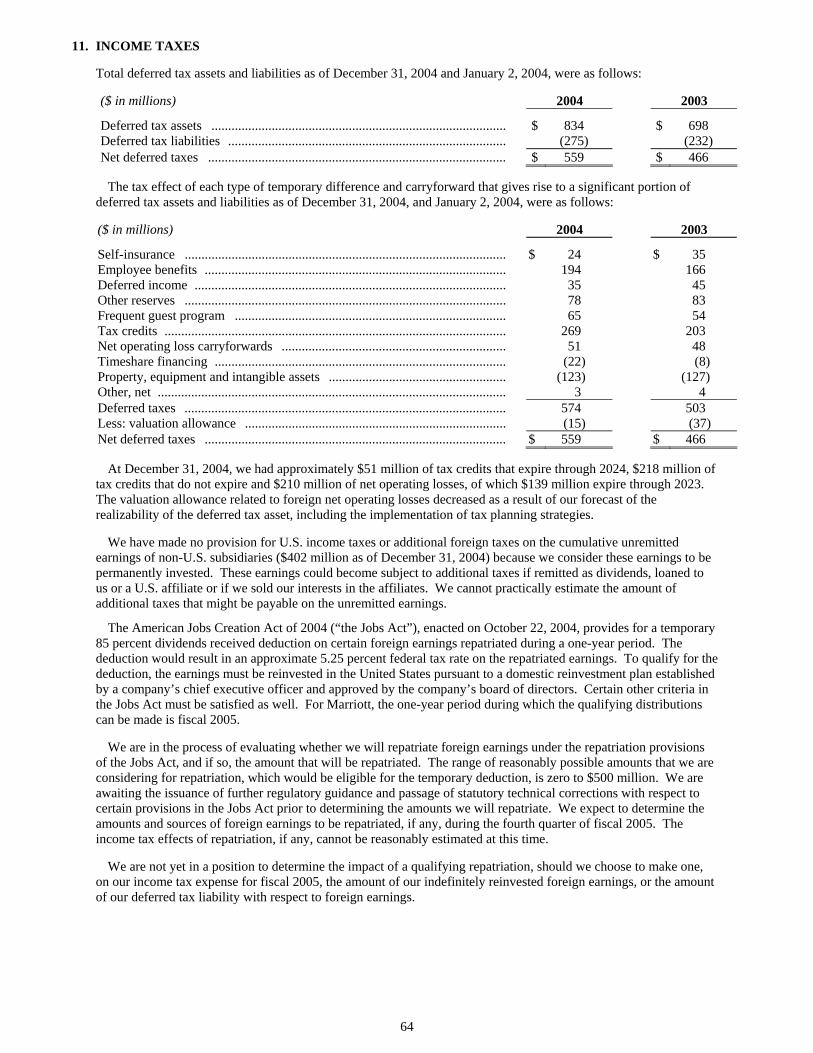
64
11. INCOME TAXES
Total deferred tax assets and liabilities as of December 31, 2004 and January 2, 2004, were as follows: ($ in millions) 2004 2003
Deferred tax assets ......................................................................................... $ 834 $ 698 Deferred tax liabilities .................................................................................... (275) (232) Net deferred taxes .......................................................................................... $ 559 $ 466
The tax effect of each type of temporary difference and carryforward that gives rise to a significant portion of deferred tax assets and liabilities as of December 31, 2004, and January 2, 2004, were as follows: ($ in millions) 2004 2003
Self-insurance ................................................................................................. $ 24 $ 35 Employee benefits ........................................................................................... 194 166 Deferred income .............................................................................................. 35 45 Other reserves ................................................................................................. 78 83 Frequent guest program .................................................................................. 65 54 Tax credits ....................................................................................................... 269 203 Net operating loss carryforwards .................................................................... 51 48 Timeshare financing ........................................................................................ (22) (8) Property, equipment and intangible assets ...................................................... (123) (127) Other, net ......................................................................................................... 3 4 Deferred taxes ................................................................................................. 574 503 Less: valuation allowance ............................................................................... (15) (37) Net deferred taxes ........................................................................................... $ 559 $ 466 At December 31, 2004, we had approximately $51 million of tax credits that expire through 2024, $218 million of tax credits that do not expire and $210 million of net operating losses, of which $139 million expire through 2023. The valuation allowance related to foreign net operating losses decreased as a result of our forecast of the realizability of the deferred tax asset, including the implementation of tax planning strategies. We have made no provision for U.S. income taxes or additional foreign taxes on the cumulative unremitted earnings of non-U.S. subsidiaries ($402 million as of December 31, 2004) because we consider these earnings to be permanently invested. These earnings could become subject to additional taxes if remitted as dividends, loaned to us or a U.S. affiliate or if we sold our interests in the affiliates. We cannot practically estimate the amount of additional taxes that might be payable on the unremitted earnings.
The American Jobs Creation Act of 2004 (“the Jobs Act”), enacted on October 22, 2004, provides for a temporary 85 percent dividends received deduction on certain foreign earnings repatriated during a one-year period. The deduction would result in an approximate 5.25 percent federal tax rate on the repatriated earnings. To qualify for the deduction, the earnings must be reinvested in the United States pursuant to a domestic reinvestment plan established by a company’s chief executive officer and approved by the company’s board of directors. Certain other criteria in the Jobs Act must be satisfied as well. For Marriott, the one-year period during which the qualifying distributions can be made is fiscal 2005. We are in the process of evaluating whether we will repatriate foreign earnings under the repatriation provisions of the Jobs Act, and if so, the amount that will be repatriated. The range of reasonably possible amounts that we are considering for repatriation, which would be eligible for the temporary deduction, is zero to $500 million. We are awaiting the issuance of further regulatory guidance and passage of statutory technical corrections with respect to certain provisions in the Jobs Act prior to determining the amounts we will repatriate. We expect to determine the amounts and sources of foreign earnings to be repatriated, if any, during the fourth quarter of fiscal 2005. The income tax effects of repatriation, if any, cannot be reasonably estimated at this time. We are not yet in a position to determine the impact of a qualifying repatriation, should we choose to make one, on our income tax expense for fiscal 2005, the amount of our indefinitely reinvested foreign earnings, or the amount of our deferred tax liability with respect to foreign earnings.
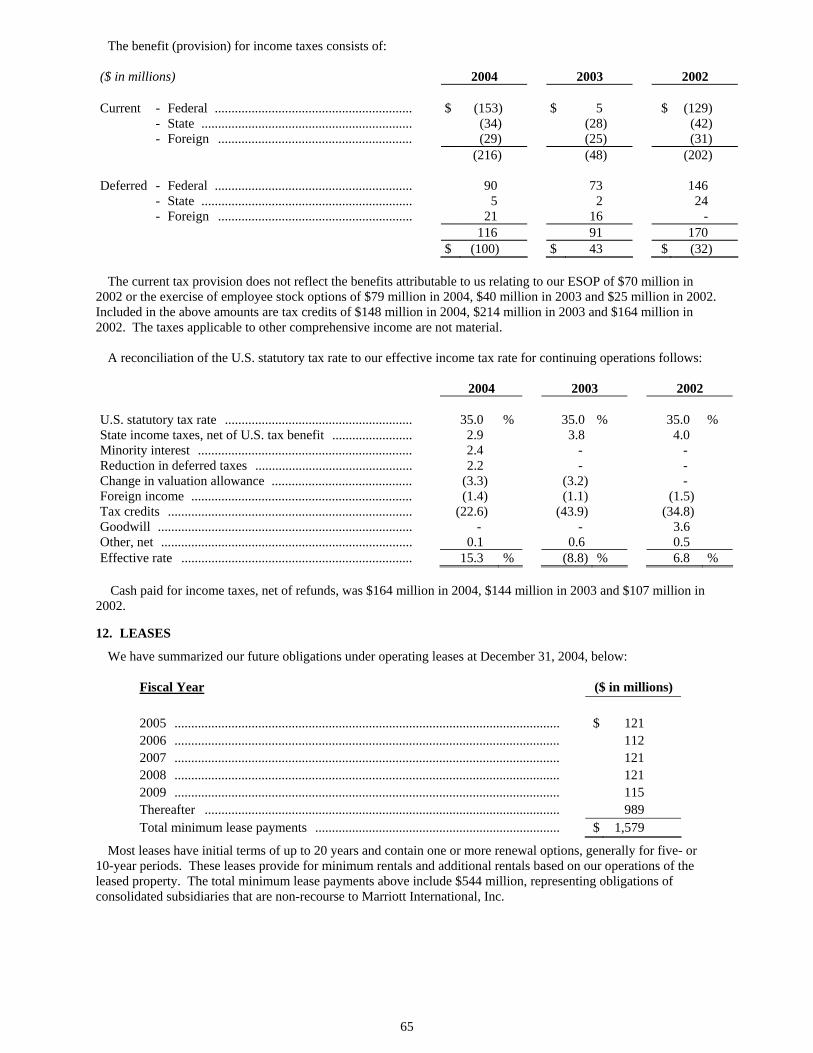
65
The benefit (provision) for income taxes consists of: ($ in millions) 2004 2003 2002 Current - Federal ........................................................... $ (153) $ 5 $ (129) - State ............................................................... (34) (28) (42) - Foreign .......................................................... (29) (25) (31) (216) (48) (202) Deferred - Federal ........................................................... 90 73 146 - State ............................................................... 5 2 24 - Foreign .......................................................... 21 16 - 116 91 170 $ (100) $ 43 $ (32)
The current tax provision does not reflect the benefits attributable to us relating to our ESOP of $70 million in 2002 or the exercise of employee stock options of $79 million in 2004, $40 million in 2003 and $25 million in 2002. Included in the above amounts are tax credits of $148 million in 2004, $214 million in 2003 and $164 million in 2002. The taxes applicable to other comprehensive income are not material. A reconciliation of the U.S. statutory tax rate to our effective income tax rate for continuing operations follows: 2004 2003 2002 U.S. statutory tax rate ........................................................ 35.0 % 35.0 % 35.0 % State income taxes, net of U.S. tax benefit ........................ Minority interest ................................................................
2.9 2.4
3.8 0.-
4.0 0.-
Reduction in deferred taxes ............................................... 2.2 - 0.- Change in valuation allowance .......................................... (3.3) (3.2) - Foreign income .................................................................. (1.4) (1.1) (1.5) Tax credits ......................................................................... (22.6) (43.9) (34.8) Goodwill ............................................................................ - - 3.6 Other, net ........................................................................... 0.1 0.6 0.5 Effective rate ..................................................................... 15.3 % (8.8) % 6.8 %
Cash paid for income taxes, net of refunds, was $164 million in 2004, $144 million in 2003 and $107 million in 2002.
12. LEASES
We have summarized our future obligations under operating leases at December 31, 2004, below:
Fiscal Year ($ in millions) 2005 ................................................................................................................... $ 121 2006 ................................................................................................................... 112 2007 ................................................................................................................... 121 2008 ................................................................................................................... 121 2009 ................................................................................................................... 115 Thereafter .......................................................................................................... 989 Total minimum lease payments ......................................................................... $ 1,579
Most leases have initial terms of up to 20 years and contain one or more renewal options, generally for five- or 10-year periods. These leases provide for minimum rentals and additional rentals based on our operations of the leased property. The total minimum lease payments above include $544 million, representing obligations of consolidated subsidiaries that are non-recourse to Marriott International, Inc.
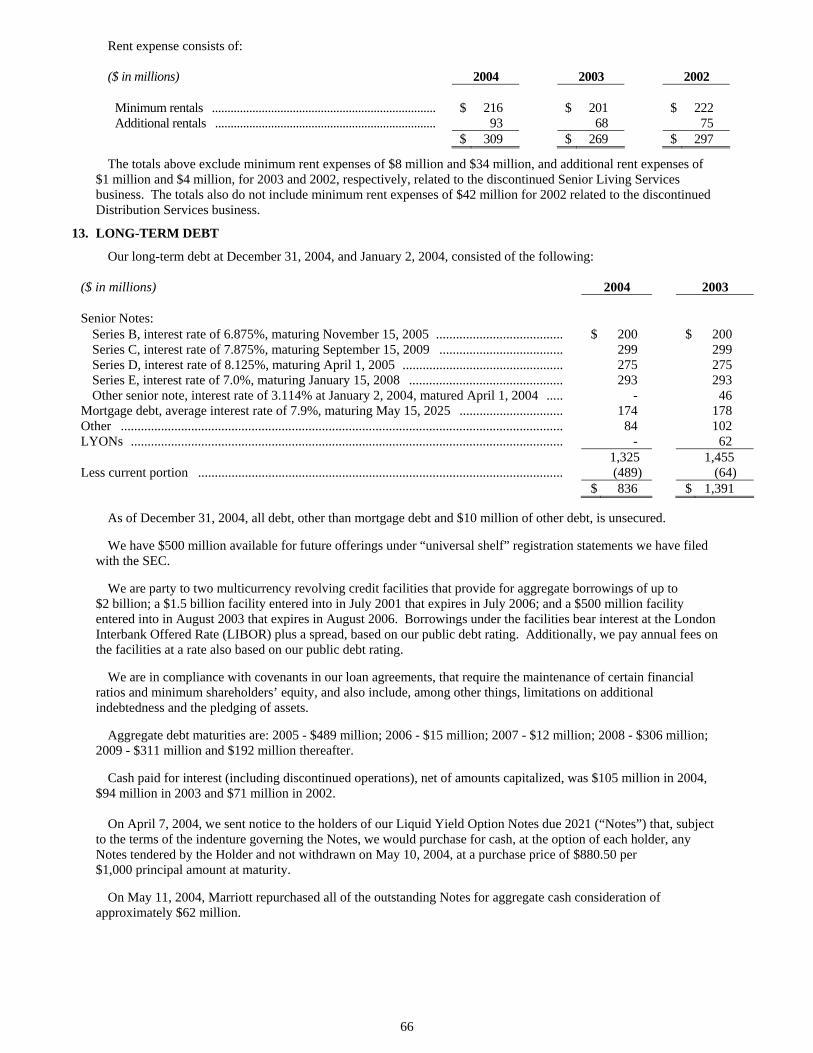
66
Rent expense consists of:
($ in millions) 2004 2003 2002
Minimum rentals ........................................................................ $ 216 $ 201 $ 222 Additional rentals ....................................................................... 93 68 75 $ 309 $ 269 $ 297
The totals above exclude minimum rent expenses of $8 million and $34 million, and additional rent expenses of $1 million and $4 million, for 2003 and 2002, respectively, related to the discontinued Senior Living Services business. The totals also do not include minimum rent expenses of $42 million for 2002 related to the discontinued Distribution Services business.
13. LONG-TERM DEBT
Our long-term debt at December 31, 2004, and January 2, 2004, consisted of the following:
($ in millions) 2004 2003 Senior Notes:
Series B, interest rate of 6.875%, maturing November 15, 2005 ...................................... $ 200 $ 200 Series C, interest rate of 7.875%, maturing September 15, 2009 ..................................... 299 299 Series D, interest rate of 8.125%, maturing April 1, 2005 ................................................ 275 275 Series E, interest rate of 7.0%, maturing January 15, 2008 .............................................. 293 293 Other senior note, interest rate of 3.114% at January 2, 2004, matured April 1, 2004 ..... - 46
Mortgage debt, average interest rate of 7.9%, maturing May 15, 2025 ............................... 174 178 Other .................................................................................................................................... 84 102 LYONs ................................................................................................................................. - 62 1,325 1,455 Less current portion ............................................................................................................. (489) (64) $ 836 $ 1,391
As of December 31, 2004, all debt, other than mortgage debt and $10 million of other debt, is unsecured. We have $500 million available for future offerings under “universal shelf” registration statements we have filed with the SEC. We are party to two multicurrency revolving credit facilities that provide for aggregate borrowings of up to $2 billion; a $1.5 billion facility entered into in July 2001 that expires in July 2006; and a $500 million facility entered into in August 2003 that expires in August 2006. Borrowings under the facilities bear interest at the London Interbank Offered Rate (LIBOR) plus a spread, based on our public debt rating. Additionally, we pay annual fees on the facilities at a rate also based on our public debt rating. We are in compliance with covenants in our loan agreements, that require the maintenance of certain financial ratios and minimum shareholders’ equity, and also include, among other things, limitations on additional indebtedness and the pledging of assets. Aggregate debt maturities are: 2005 - $489 million; 2006 - $15 million; 2007 - $12 million; 2008 - $306 million; 2009 - $311 million and $192 million thereafter. Cash paid for interest (including discontinued operations), net of amounts capitalized, was $105 million in 2004, $94 million in 2003 and $71 million in 2002. On April 7, 2004, we sent notice to the holders of our Liquid Yield Option Notes due 2021 (“Notes”) that, subject to the terms of the indenture governing the Notes, we would purchase for cash, at the option of each holder, any Notes tendered by the Holder and not withdrawn on May 10, 2004, at a purchase price of $880.50 per $1,000 principal amount at maturity. On May 11, 2004, Marriott repurchased all of the outstanding Notes for aggregate cash consideration of approximately $62 million.
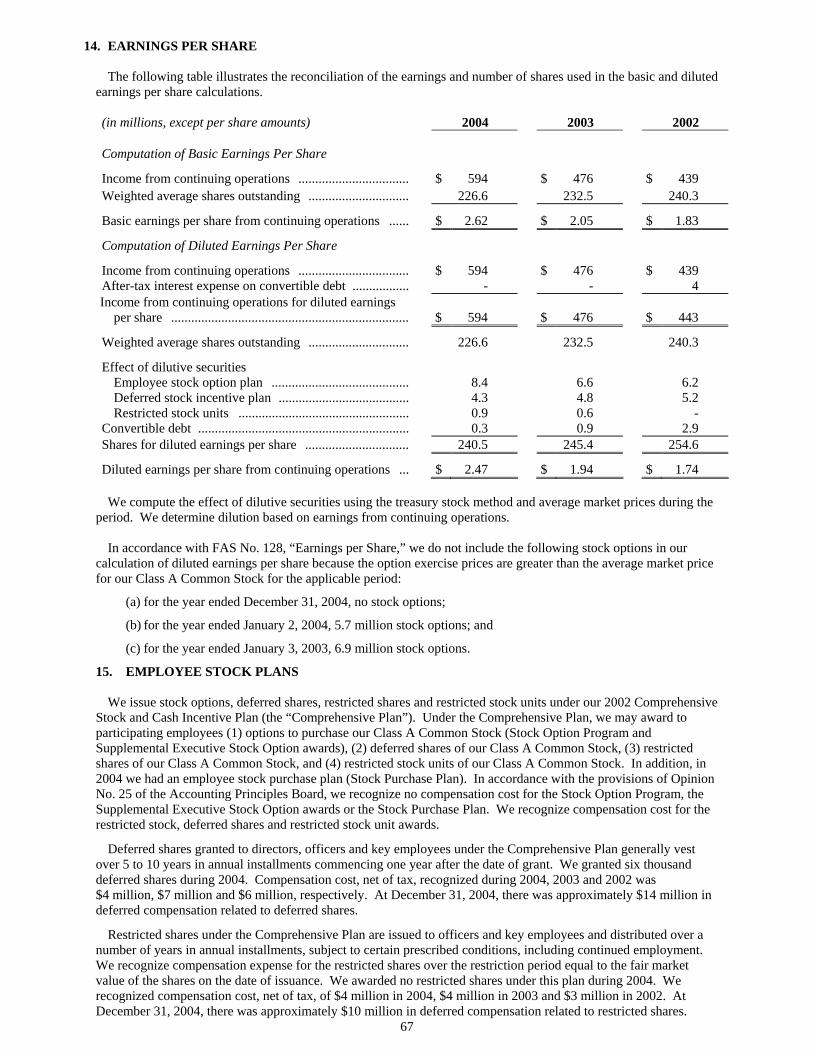
67
14. EARNINGS PER SHARE The following table illustrates the reconciliation of the earnings and number of shares used in the basic and diluted earnings per share calculations. (in millions, except per share amounts) 2004 2003 2002 Computation of Basic Earnings Per Share
Income from continuing operations ................................. $ 594 $ 476 $ 439 Weighted average shares outstanding .............................. 226.6 232.5 240.3
Basic earnings per share from continuing operations ...... $ 2.62 $ 2.05 $ 1.83
Computation of Diluted Earnings Per Share
Income from continuing operations ................................. $ 594 $ 476 $ 439 After-tax interest expense on convertible debt ................. - - 4 Income from continuing operations for diluted earnings per share .......................................................................
$
594
$
476
$
443
Weighted average shares outstanding .............................. 226.6 232.5 240.3
Effect of dilutive securities Employee stock option plan ......................................... 8.4 6.6 6.2 Deferred stock incentive plan ....................................... 4.3 4.8 5.2 Restricted stock units ................................................... 0.9 0.6 - Convertible debt ............................................................... 0.3 0.9 2.9 Shares for diluted earnings per share ............................... 240.5 245.4 254.6
Diluted earnings per share from continuing operations ... $ 2.47 $ 1.94 $ 1.74
We compute the effect of dilutive securities using the treasury stock method and average market prices during the period. We determine dilution based on earnings from continuing operations. In accordance with FAS No. 128, “Earnings per Share,” we do not include the following stock options in our calculation of diluted earnings per share because the option exercise prices are greater than the average market price for our Class A Common Stock for the applicable period:
(a) for the year ended December 31, 2004, no stock options;
(b) for the year ended January 2, 2004, 5.7 million stock options; and
(c) for the year ended January 3, 2003, 6.9 million stock options.
15. EMPLOYEE STOCK PLANS We issue stock options, deferred shares, restricted shares and restricted stock units under our 2002 Comprehensive Stock and Cash Incentive Plan (the “Comprehensive Plan”). Under the Comprehensive Plan, we may award to participating employees (1) options to purchase our Class A Common Stock (Stock Option Program and Supplemental Executive Stock Option awards), (2) deferred shares of our Class A Common Stock, (3) restricted shares of our Class A Common Stock, and (4) restricted stock units of our Class A Common Stock. In addition, in 2004 we had an employee stock purchase plan (Stock Purchase Plan). In accordance with the provisions of Opinion No. 25 of the Accounting Principles Board, we recognize no compensation cost for the Stock Option Program, the Supplemental Executive Stock Option awards or the Stock Purchase Plan. We recognize compensation cost for the restricted stock, deferred shares and restricted stock unit awards.
Deferred shares granted to directors, officers and key employees under the Comprehensive Plan generally vest over 5 to 10 years in annual installments commencing one year after the date of grant. We granted six thousand deferred shares during 2004. Compensation cost, net of tax, recognized during 2004, 2003 and 2002 was $4 million, $7 million and $6 million, respectively. At December 31, 2004, there was approximately $14 million in deferred compensation related to deferred shares.
Restricted shares under the Comprehensive Plan are issued to officers and key employees and distributed over a number of years in annual installments, subject to certain prescribed conditions, including continued employment. We recognize compensation expense for the restricted shares over the restriction period equal to the fair market value of the shares on the date of issuance. We awarded no restricted shares under this plan during 2004. We recognized compensation cost, net of tax, of $4 million in 2004, $4 million in 2003 and $3 million in 2002. At December 31, 2004, there was approximately $10 million in deferred compensation related to restricted shares.
68
Restricted stock units under the Comprehensive Plan are issued to certain officers and key employees and vest over four years in annual installments commencing one year after the date of grant. We recognize compensation expense for the fair market value of the shares over the vesting period. Included in the 2004 and 2003 compensation costs is $23 million and $8 million, respectively, net of tax, related to the grant of approximately 1.6 million units and 1.9 million units, respectively, under the restricted stock unit plan, which was started in the first quarter of 2003. At December 31, 2004, there was approximately $84 million in deferred compensation related to unit grants. Under the unit plan, fixed grants will be awarded annually to certain employees.
Under the Stock Purchase Plan in 2004, eligible employees were able to purchase our Class A Common Stock through payroll deductions at the lower of the market value at the beginning or end of each plan year.
Employee stock options may be granted to officers and key employees at exercise prices equal to the market price of our Class A Common Stock on the date of grant. Nonqualified options expire 10 years after the date of grant, except those issued from 1990 through 2000, which expire 15 years after the date of the grant. Most options under the Stock Option Program are exercisable in cumulative installments of one quarter at the end of each of the first four years following the date of grant. In February 1997, 2.2 million Supplemental Executive Stock Option awards were awarded to certain of our officers. The options vest after eight years but could vest earlier if our stock price meets certain performance criteria. None of these options, which have an exercise price of $25, were exercised during 2004, 2003 or 2002, and 1.9 million remained outstanding at December 31, 2004.
For the purposes of the disclosures required by FAS No. 123, “Accounting for Stock-Based Compensation,” the fair value of each option granted during 2004, 2003 and 2002 was $17, $11 and $14, respectively. We estimated the fair value of each option granted on the date of grant using the Black-Scholes option-pricing method, using the assumptions noted in the following table:
2004 2003 2002 Annual dividends ............................................................ $ 0.32 $ 0.30 $ 0.28 Expected volatility .......................................................... 31 % 32 % 32 % Risk-free interest rate ...................................................... 3.7 % 3.5 % 3.6 % Expected life (in years) ................................................... 7 7 7 Pro forma compensation cost for the Stock Option Program, the Supplemental Executive Stock Option awards and employee purchases pursuant to the Stock Purchase Plan subsequent to December 30, 1994, would reduce our net income as described in the “Summary of Significant Accounting Policies” as required by FAS No. 148, “Accounting for Stock-Based Compensation-Transition and Disclosure, an amendment of Financial Accounting Standards Board (“FASB”) Statement No. 123.” A summary of our Stock Option Program activity during 2004, 2003 and 2002 is presented below: Number of
Options (in millions)
Weighted Average Exercise
Price Outstanding at December 29, 2001 .................................. 38.3 $ 29 Granted during the year ................................................ 1.4 37 Exercised during the year ............................................. (1.6) 22 Forfeited during the year .............................................. (0.6) 37 Outstanding at January 3, 2003 ........................................ 37.5 29 Granted during the year ................................................ 4.0 30 Exercised during the year ............................................. (4.6) 22 Forfeited during the year .............................................. (0.7) 37 Outstanding at January 2, 2004 ........................................ 36.2 29 Granted during the year ................................................ 1.8 46 Exercised during the year ............................................. (7.3) 30 Forfeited during the year .............................................. (0.3) 38 Outstanding at December 31, 2004 .................................. 30.4 $ 31
There were 22.0 million, 25.1 million and 24.9 million exercisable options under the Stock Option Program at December 31, 2004, January 2, 2004, and January 3, 2003, respectively, with weighted average exercise prices of $29, $28 and $25, respectively. At December 31, 2004, 47.0 million shares were reserved under the Comprehensive Plan (including 32.3 million shares under the Stock Option Program and Supplemental Executive Stock Option awards), and 5.5 million shares were reserved under the Stock Purchase Plan.
69
Stock options issued under the Stock Option Program outstanding at December 31, 2004, were as follows:
Outstanding Exercisable
Range of Exercise Prices
Number of
Options (in millions)
Weighted Average
Remaining Life(in Years)
Weighted Average Exercise
Price
Number of
Options (in millions)
Weighted Average Exercise
Price $ 3 to 5 0.4 1 $ 3 0.4 $ 3
6 to 9 1.2 3 7 1.2 7 10 to 15 1.6 5 13 1.6 13 16 to 24 1.1 6 17 1.1 17 25 to 37 18.7 8 31 13.8 31
38 to 49 7.4 8 45 3.9 44 $ 3 to 49 30.4 8 $ 31 22.0 $ 29
16. FAIR VALUE OF FINANCIAL INSTRUMENTS
We believe that the fair values of current assets and current liabilities approximate their reported carrying amounts. The fair values of noncurrent financial assets, liabilities and derivatives are shown below.
2004 2003 Carrying
Amount Fair
Value Carrying
Amount Fair
Value ($ in millions) Notes and other long-term assets .................. $ 1,702 $ 1,770 $ 1,740 $ 1,778 Long-term debt and other long-term
liabilities ................................................... $
848
$
875
$
1,373
$
1,487
Derivative instruments .................................. $ - $ - $ (1) $ (1) We value notes and other receivables based on the expected future cash flows discounted at risk-adjusted rates. We determine valuations for long-term debt and other long-term liabilities based on quoted market prices or expected future payments discounted at risk-adjusted rates.
17. DERIVATIVE INSTRUMENTS
During the year ended January 2, 2004, we entered into an interest rate swap agreement under which we receive a floating rate of interest and pay a fixed rate of interest. The swap modifies our interest rate exposure by effectively converting a note receivable with a fixed rate to a floating rate. The aggregate notional amount of the swap is $92 million, and it matures in 2010. The swap is classified as a fair value hedge, and the change in the fair value of the swap, as well as the change in the fair value of the underlying note receivable, is recognized in interest income. The fair value of the swap was a liability of approximately $3 million at December 31, 2004, and January 2, 2004. The hedge is highly effective, and therefore, no net gain or loss was reported in earnings during the years ended December 31, 2004, and January 2, 2004. At December 31, 2004, we had six outstanding interest rate swap agreements to manage interest rate risk associated with the residual interests we retain in conjunction with our timeshare note sales. We are required by purchasers and/or rating agencies to utilize interest rate swaps to protect the excess spread within our sold note pools. The aggregate notional amount of the swaps is $535 million, and they expire through 2022. These swaps are not accounted for as hedges under FAS No. 133, “Accounting for Derivative Instruments and Hedging Activities.” The fair value of the swaps is a net asset of approximately $3 million at December 31, 2004, a net asset of approximately $1 million at January 2, 2004, and a net liability of $2 million at January 3, 2003. We recorded a $2 million net gain, $3 million net gain and $21 million net loss during the years ended December 31, 2004, January 2, 2004 and January 3, 2003, respectively. These expenses were largely offset by income resulting from the change in fair value of the retained interests and note sale gains in response to changes in interest rates. During the years ended December 31, 2004, and January 2, 2004, we entered into interest rate swaps to manage interest rate risk associated with forecasted timeshare note sales. These swaps were not accounted for as hedges under FAS No. 133. The swaps were terminated upon the sale of the notes and resulted in a gain of $2 million during the year ended December 31, 2004 and a loss of $4 million during the year ended January 2, 2004. These amounts were largely offset by changes in the note sale gains and losses.

70
During the years ended December 31, 2004 and January 2, 2004, we entered into forward foreign exchange contracts to manage the foreign currency exposure related to certain monetary assets denominated in pounds sterling. The aggregate dollar equivalent of the notional amount of the contracts is $36 million at December 31, 2004. The forward exchange contracts are not accounted for as hedges in accordance with FAS No. 133. The fair value of the forward contracts is approximately zero at December 31, 2004, and January 2, 2004. We recorded a $3 million and $2 million net loss relating to these forward foreign exchange contracts for the years ended December 31, 2004 and January 2, 2004, respectively. The net losses for both years were offset by income recorded from translating the related monetary assets denominated in pounds sterling into U.S. dollars.
During fiscal years 2004 and 2003, we entered into foreign exchange option and forward contracts to hedge the potential volatility of earnings and cash flows associated with variations in foreign exchange rates. The aggregate dollar equivalent of the notional amounts of the contracts is $36 million at December 31, 2004. These contracts have terms of less than a year and are classified as cash flow hedges. Changes in their fair values are recorded as a component of other comprehensive income. The fair value of the forward contracts is approximately zero and $1 million at December 31, 2004, and January 2, 2004, respectively. During 2004, it was determined that certain derivatives were no longer effective in offsetting the hedged item. Thus, cash flow hedge accounting treatment was discontinued and the ineffective contracts resulted in a loss of $1 million, which was reported in earnings for fiscal year 2004. The remaining hedges were highly effective and there was no net gain or loss reported in earnings for the fiscal years 2004 and 2003. As of December 31, 2004, there were no deferred gains or losses accumulated in other comprehensive income that we expect to reclassify into earnings over the next 12 months.
18. CONTINGENCIES
Guarantees
We issue guarantees to certain lenders and hotel owners primarily to obtain long-term management contracts. The guarantees generally have a stated maximum amount of funding and a term of five years or less. The terms of guarantees to lenders generally require us to fund if cash flows from hotel operations are inadequate to cover annual debt service or to repay the loan at the end of the term. The terms of the guarantees to hotel owners generally require us to fund if the hotels do not attain specified levels of operating profit.
We also enter into project completion guarantees with certain lenders in conjunction with hotels and timeshare units that we or our joint venture partners are building.
The maximum potential amount of future fundings for guarantees where we are the primary obligor and the carrying amount of the liability for expected future fundings at December 31, 2004, are as follows:
($ in millions)
Guarantee Type
Maximum Potential Amount
of Future Fundings
Liability for Future Fundings at
December 31, 2004 Debt service .................................................. $ 227 $ 4 Operating profit ............................................ 276 14 Project completion ........................................ 52 - Other ............................................................. 46 5 Total guarantees where Marriott
International is the primary obligor ...........
$ 601
$
23
Our guarantees of $601 million listed above include $91 million for guarantees that will not be in effect until the underlying hotels open and we begin to manage the properties. The $91 million of guarantees not in effect is comprised of $72 million of operating profit guarantees and $19 million of debt service guarantees. Guarantee fundings to lenders and hotel owners are generally recoverable as loans and are generally repayable to us out of future hotel cash flows and/or proceeds from the sale of hotels.
In addition to the guarantees noted above, in conjunction with financing obtained for specific projects or properties owned by joint ventures in which we are a party, we may provide industry standard indemnifications to the lender for loss, liability or damage occurring as a result of the actions of the other joint venture owner or our own actions, in each case limited to the lesser of (i) our ownership interest in the entity or (ii) the actual loss, liability or damage occurring as a result of our actions.
The guarantees above do not include $349 million related to Senior Living Services lease obligations and lifecare bonds for which we are secondarily liable. Sunrise is the primary obligor of the leases and a portion of the lifecare bonds, and CNL is the primary obligor of the remainder of the lifecare bonds. Prior to the sale of the Senior Living Services business at the end of the first quarter of 2003, these pre-existing guarantees were guarantees by the Company of obligations of consolidated Senior Living Services subsidiaries. Sunrise and CNL have indemnified us for any guarantee fundings we may be called on to make in connection with these lease obligations and lifecare bonds. We do not expect to fund under the guarantees.
71
The guarantees above also do not include lease obligations for which we became secondarily liable when we acquired the Renaissance Hotel Group N.V. in 1997, consisting of annual rent payments of approximately $63 million and total remaining rent payments through the initial term plus available extensions of approximately $1.56 billion. We are also secondarily obligated for real estate taxes and other charges associated with the leases. Third parties have severally indemnified us for all payments we may be required to make in connection with these obligations. Since we assumed these guarantees, we have not funded any amounts, and we do not expect to fund any amounts under these guarantees in the future.
Commitments and Letters of Credit
In addition to the guarantees noted above, as of December 31, 2004, we had extended approximately $42 million of loan commitments to owners of lodging properties, under which we expect to fund approximately $12 million by December 30, 2005, and $14 million over the following year. We do not expect to fund the remaining $16 million of commitments, which expire as follows: $14 million within one year and $2 million after five years. At December 31, 2004, we also have commitments to invest $37 million of equity for a minority interest in two partnerships that plan to purchase both full-service and select-service hotels in the U.S. At December 31, 2004, we also had $96 million of letters of credit outstanding on our behalf, the majority of which related to our self-insurance programs. Surety bonds issued on our behalf as of December 31, 2004 totaled $486 million, the majority of which were requested by federal, state or local governments related to our timeshare and lodging operations and self-insurance programs.
Litigation and Arbitration
CTF/HPI arbitration and litigation. On April 8, 2002, we initiated an arbitration proceeding against CTF Hotel Holdings, Inc. (“CTF”) and its affiliate, Hotel Property Investments (B.V.I.) Ltd. (“HPI”), in connection with a dispute over procurement and other issues for certain Renaissance hotels and resorts that we manage for CTF and HPI. On April 12, 2002, CTF filed a lawsuit in U.S. District Court in Delaware against us and Avendra LLC, alleging that, in connection with procurement at 20 of those hotels, we engaged in improper acts of self-dealing, and claiming breach of fiduciary, contractual and other duties; fraud; misrepresentation; and violations of the RICO and the Robinson-Patman Acts. CTF seeks various remedies, including a stay of the arbitration proceedings against CTF and unspecified actual, treble and punitive damages. The district court enjoined the arbitration with respect to CTF, but granted our request to stay the court proceedings pending the resolution of the arbitration with respect to HPI. Both parties have appealed that ruling. The arbitration panel hearing on the matter began on April 6, 2004 and concluded on June 11, 2004. Briefing has been concluded.
In a decision dated August 23, 2004 a panel of the Third Circuit affirmed the district court’s stay of the arbitration as to CTF but reversed the district court’s stay of the trial. On September 7, 2004, we filed with the Third Circuit a petition for rehearing en banc in which we asked the court to reconsider its decision vacating the stay of the trial. The petition was denied on September 24, 2004. No scheduling order has been entered by the district court. We believe that CTF’s and HPI’s claims against us are without merit, and we intend to vigorously defend against them. However, we cannot assure you as to the outcome of the arbitration or the related litigation; nor can we currently estimate the range of any potential losses to the Company.
19. BUSINESS SEGMENTS
We are a diversified hospitality company with operations in five business segments:
• Full-Service Lodging, which includes Marriott Hotels & Resorts, The Ritz-Carlton, Renaissance Hotels & Resorts and Bulgari Hotels & Resorts;
• Select-Service Lodging, which includes Courtyard, Fairfield Inn and SpringHill Suites; • Extended-Stay Lodging, which includes Residence Inn, TownePlace Suites, Marriott ExecuStay and Marriott
Executive Apartments; • Timeshare, which includes the development, marketing, operation and ownership of timeshare properties
under the Marriott Vacation Club International, The Ritz-Carlton Club, Marriott Grand Residence Club and Horizons by Marriott Vacation Club International; and
• Synthetic Fuel, which includes our interest in the operation of coal-based synthetic fuel production facilities.
In addition to the segments above, in 2002 we announced our intent to sell, and subsequently did sell, our Senior Living Services business segment and exited our Distribution Services business segment.
72
We evaluate the performance of our segments based primarily on the results of the segment without allocating corporate expenses, interest expense and interest income. With the exception of the Synthetic Fuel segment, we do not allocate income taxes to our segments. The synthetic fuel operation generated a tax benefit and credits of $165 million, $245 million and $208 million, respectively, for the years ended December 31, 2004, January 2, 2004, and January 3, 2003, from our synthetic fuel joint venture. As timeshare note sales are an integral part of the timeshare business, we include timeshare note sale gains in our timeshare segment results, and we allocate other gains as well as equity in earnings (losses) from our joint ventures to each of our segments. We have aggregated the brands and businesses presented within each of our segments considering their similar economic characteristics, types of customers, distribution channels and the regulatory business environment of the brands and operations within each segment.
Revenues ($ in millions)
2004 2003 2002
Full-Service ..................................................................................... $ 6,611 $ 5,876 $ 5,508 Select-Service .................................................................................. 1,118 1,000 967 Extended-Stay ................................................................................. 547 557 600 Timeshare ........................................................................................ 1,502 1,279 1,147 Total lodging ............................................................................... 9,778 8,712 8,222 Synthetic Fuel .................................................................................. 321 302 193 $ 10,099 $ 9,014 $ 8,415
Income from Continuing Operations ($ in millions)
2004 2003 2002
Full-Service ..................................................................................... $ 426 $ 407 $ 397 Select-Service ................................................................................... 140 99 130 Extended-Stay ................................................................................. 66 47 (3) Timeshare ........................................................................................ 203 149 183 Total lodging financial results .................................................... 835 702 707 Synthetic Fuel (after-tax) ................................................................. 107 96 74 Unallocated corporate expenses ...................................................... (138) (132) (126) Interest income, provision for loan losses and interest expense ...... 55 12 24 Income taxes (excluding Synthetic Fuel) ........................................ (265) (202) (240) $ 594 $ 476 $ 439
Equity in Earnings (Losses) of Equity Method Investees ($ in millions)
2004 2003 2002
Full-Service ..................................................................................... $ 10 $ 8 $ 5 Select-Service .................................................................................. (17) (22) (8) Timeshare ........................................................................................ (7) (4) (2) Synthetic Fuel .................................................................................. (28) 10 - Corporate ......................................................................................... - 1 (1) $ (42) $ (7) $ (6)
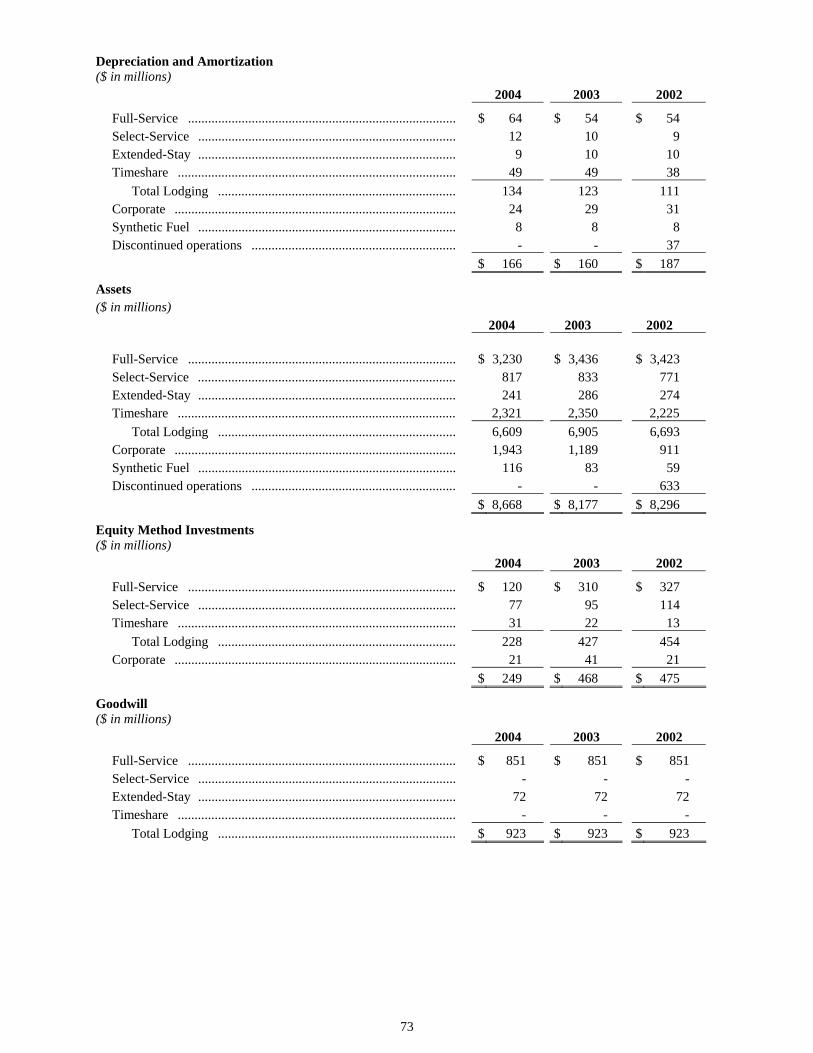
73
Depreciation and Amortization ($ in millions) 2004 2003 2002
Full-Service ................................................................................ $ 64 $ 54 $ 54 Select-Service ............................................................................. 12 10 9 Extended-Stay ............................................................................. 9 10 10 Timeshare ................................................................................... 49 49 38 Total Lodging ....................................................................... 134 123 111 Corporate .................................................................................... 24 29 31 Synthetic Fuel ............................................................................. 8 8 8 Discontinued operations ............................................................. - - 37 $ 166 $ 160 $ 187
Assets ($ in millions) 2004 2003 2002 Full-Service ................................................................................ $ 3,230 $ 3,436 $ 3,423 Select-Service ............................................................................. 817 833 771 Extended-Stay ............................................................................. 241 286 274 Timeshare ................................................................................... 2,321 2,350 2,225 Total Lodging ....................................................................... 6,609 6,905 6,693 Corporate .................................................................................... 1,943 1,189 911 Synthetic Fuel ............................................................................. 116 83 59 Discontinued operations ............................................................. - - 633 $ 8,668 $ 8,177 $ 8,296
Equity Method Investments ($ in millions) 2004 2003 2002
Full-Service ................................................................................ $ 120 $ 310 $ 327 Select-Service ............................................................................. 77 95 114 Timeshare ................................................................................... 31 22 13 Total Lodging ....................................................................... 228 427 454 Corporate .................................................................................... 21 41 21 $ 249 $ 468 $ 475
Goodwill ($ in millions) 2004 2003 2002
Full-Service ................................................................................ $ 851 $ 851 $ 851 Select-Service ............................................................................. - - - Extended-Stay ............................................................................. 72 72 72 Timeshare ................................................................................... - - - Total Lodging ....................................................................... $ 923 $ 923 $ 923
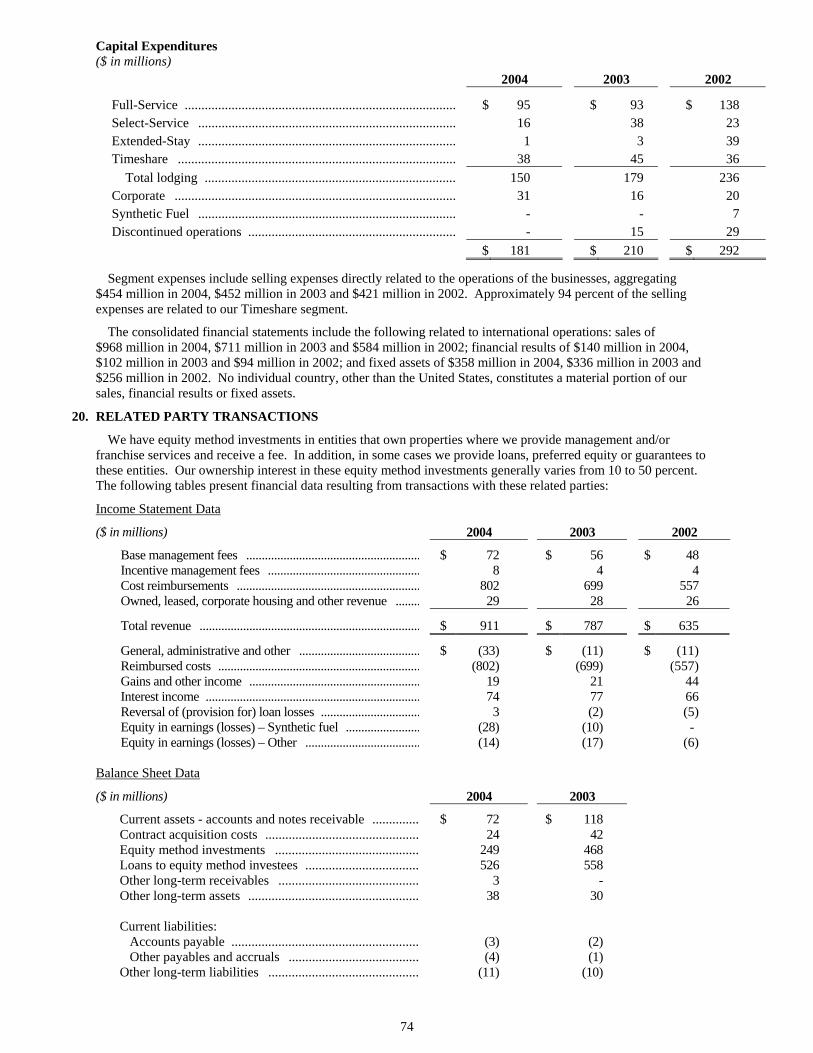
74
Capital Expenditures ($ in millions) 2004 2003 2002
Full-Service ................................................................................. $ 95 $ 93 $ 138 Select-Service ............................................................................. 16 38 23 Extended-Stay ............................................................................. 1 3 39 Timeshare ................................................................................... 38 45 36 Total lodging ........................................................................... 150 179 236 Corporate .................................................................................... 31 16 20 Synthetic Fuel ............................................................................. - - 7 Discontinued operations .............................................................. - 15 29 $ 181 $ 210 $ 292 Segment expenses include selling expenses directly related to the operations of the businesses, aggregating $454 million in 2004, $452 million in 2003 and $421 million in 2002. Approximately 94 percent of the selling expenses are related to our Timeshare segment.
The consolidated financial statements include the following related to international operations: sales of $968 million in 2004, $711 million in 2003 and $584 million in 2002; financial results of $140 million in 2004, $102 million in 2003 and $94 million in 2002; and fixed assets of $358 million in 2004, $336 million in 2003 and $256 million in 2002. No individual country, other than the United States, constitutes a material portion of our sales, financial results or fixed assets.
20. RELATED PARTY TRANSACTIONS
We have equity method investments in entities that own properties where we provide management and/or franchise services and receive a fee. In addition, in some cases we provide loans, preferred equity or guarantees to these entities. Our ownership interest in these equity method investments generally varies from 10 to 50 percent. The following tables present financial data resulting from transactions with these related parties:
Income Statement Data
($ in millions) 2004 2003 2002
Base management fees ........................................................ $ 72 $ 56 $ 48 Incentive management fees ................................................. 8 4 4 Cost reimbursements ........................................................... 802 699 557 Owned, leased, corporate housing and other revenue ........ 29 28 26
Total revenue ....................................................................... $ 911 $ 787 $ 635
General, administrative and other ....................................... $ (33) $ (11) $ (11) Reimbursed costs ................................................................. (802) (699) (557) Gains and other income ....................................................... 19 21 44 Interest income ..................................................................... 74 77 66 Reversal of (provision for) loan losses ................................ 3 (2) (5) Equity in earnings (losses) – Synthetic fuel ........................ (28) (10) - Equity in earnings (losses) – Other ..................................... (14) (17) (6)
Balance Sheet Data
($ in millions) 2004 2003
Current assets - accounts and notes receivable .............. $ 72 $ 118 Contract acquisition costs .............................................. 24 42 Equity method investments ........................................... 249 468 Loans to equity method investees .................................. 526 558 Other long-term receivables .......................................... 3 - Other long-term assets ................................................... 38 30 Current liabilities: Accounts payable ........................................................ (3) (2) Other payables and accruals ....................................... (4) (1) Other long-term liabilities ............................................. (11) (10)
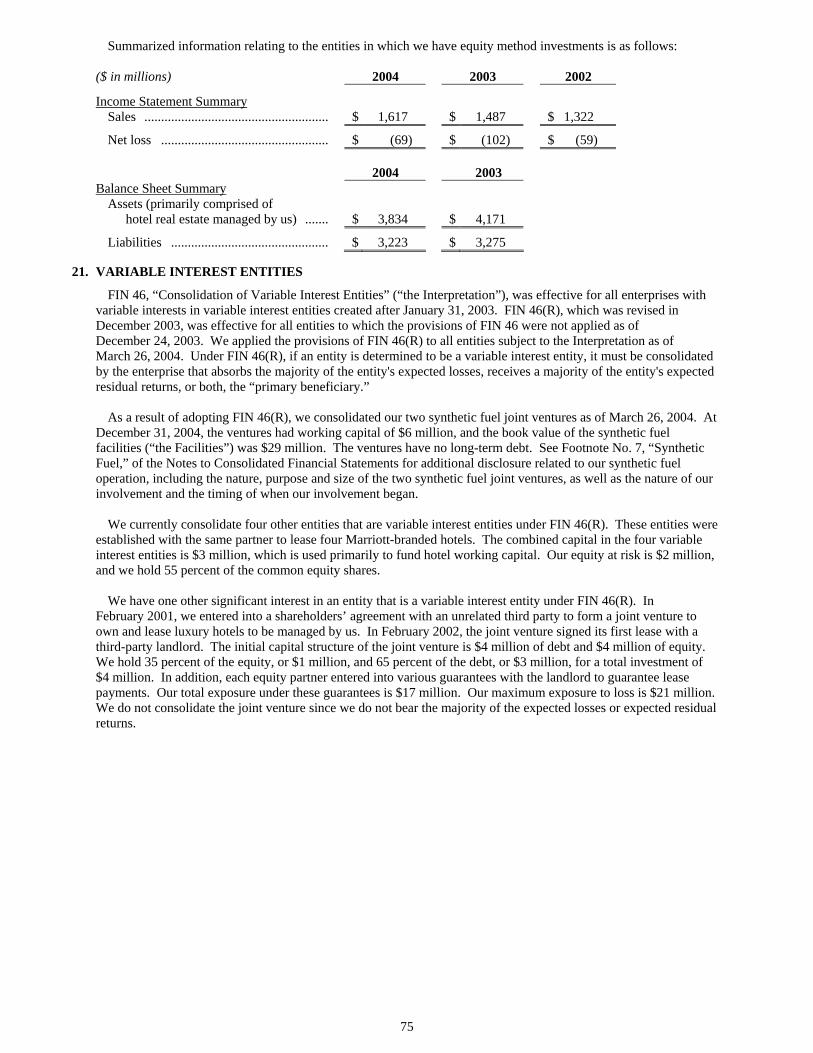
75
Summarized information relating to the entities in which we have equity method investments is as follows: ($ in millions) 2004 2003 2002
Income Statement Summary Sales ....................................................... $ 1,617 $ 1,487 $ 1,322
Net loss .................................................. $ (69) $ (102) $ (59) 2004 2003 Balance Sheet Summary
Assets (primarily comprised of hotel real estate managed by us) ....... $ 3,834 $ 4,171
Liabilities ............................................... $ 3,223 $ 3,275
21. VARIABLE INTEREST ENTITIES
FIN 46, “Consolidation of Variable Interest Entities” (“the Interpretation”), was effective for all enterprises with variable interests in variable interest entities created after January 31, 2003. FIN 46(R), which was revised in December 2003, was effective for all entities to which the provisions of FIN 46 were not applied as of December 24, 2003. We applied the provisions of FIN 46(R) to all entities subject to the Interpretation as of March 26, 2004. Under FIN 46(R), if an entity is determined to be a variable interest entity, it must be consolidated by the enterprise that absorbs the majority of the entity's expected losses, receives a majority of the entity's expected residual returns, or both, the “primary beneficiary.” As a result of adopting FIN 46(R), we consolidated our two synthetic fuel joint ventures as of March 26, 2004. At December 31, 2004, the ventures had working capital of $6 million, and the book value of the synthetic fuel facilities (“the Facilities”) was $29 million. The ventures have no long-term debt. See Footnote No. 7, “Synthetic Fuel,” of the Notes to Consolidated Financial Statements for additional disclosure related to our synthetic fuel operation, including the nature, purpose and size of the two synthetic fuel joint ventures, as well as the nature of our involvement and the timing of when our involvement began. We currently consolidate four other entities that are variable interest entities under FIN 46(R). These entities were established with the same partner to lease four Marriott-branded hotels. The combined capital in the four variable interest entities is $3 million, which is used primarily to fund hotel working capital. Our equity at risk is $2 million, and we hold 55 percent of the common equity shares. We have one other significant interest in an entity that is a variable interest entity under FIN 46(R). In February 2001, we entered into a shareholders’ agreement with an unrelated third party to form a joint venture to own and lease luxury hotels to be managed by us. In February 2002, the joint venture signed its first lease with a third-party landlord. The initial capital structure of the joint venture is $4 million of debt and $4 million of equity. We hold 35 percent of the equity, or $1 million, and 65 percent of the debt, or $3 million, for a total investment of $4 million. In addition, each equity partner entered into various guarantees with the landlord to guarantee lease payments. Our total exposure under these guarantees is $17 million. Our maximum exposure to loss is $21 million. We do not consolidate the joint venture since we do not bear the majority of the expected losses or expected residual returns.
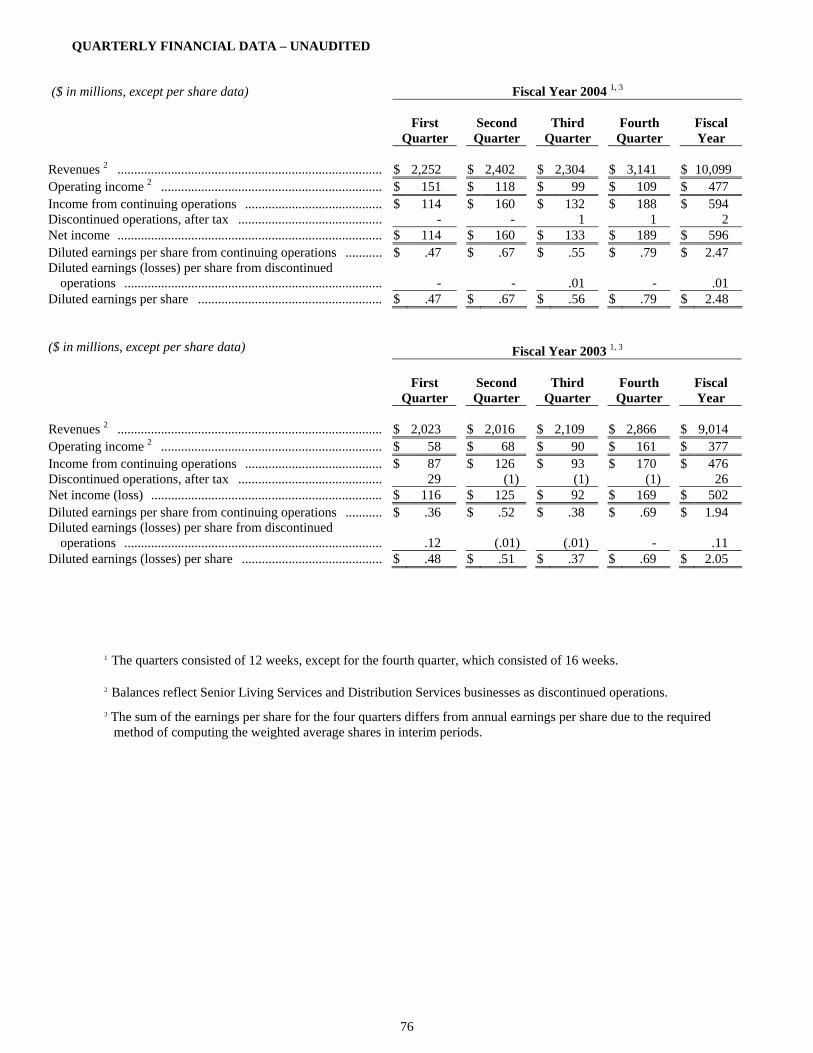
76
QUARTERLY FINANCIAL DATA – UNAUDITED
($ in millions, except per share data) Fiscal Year 2003 1, 3
First Quarter
Second Quarter
Third Quarter
Fourth Quarter
Fiscal Year
Revenues 2 ................................................................................ $ 2,023 $ 2,016 $ 2,109 $ 2,866 $ 9,014 Operating income 2 ................................................................... $ 58 $ 68 $ 90 $ 161 $ 377 Income from continuing operations .......................................... $ 87 $ 126 $ 93 $ 170 $ 476 Discontinued operations, after tax ............................................ 29 (1) (1) (1) 26 Net income (loss) ...................................................................... $ 116 $ 125 $ 92 $ 169 $ 502 Diluted earnings per share from continuing operations ............ $ .36 $ .52 $ .38 $ .69 $ 1.94 Diluted earnings (losses) per share from discontinued operations .............................................................................. .12 (.01) (.01) - .11 Diluted earnings (losses) per share ........................................... $ .48 $ .51 $ .37 $ .69 $ 2.05
1 The quarters consisted of 12 weeks, except for the fourth quarter, which consisted of 16 weeks.
2 Balances reflect Senior Living Services and Distribution Services businesses as discontinued operations. 3 The sum of the earnings per share for the four quarters differs from annual earnings per share due to the required
method of computing the weighted average shares in interim periods.
($ in millions, except per share data) Fiscal Year 2004 1, 3
First Quarter
Second Quarter
Third Quarter
Fourth Quarter
Fiscal Year
Revenues 2 ................................................................................ $ 2,252 $ 2,402 $ 2,304 $ 3,141 $ 10,099 Operating income 2 ................................................................... $ 151 $ 118 $ 99 $ 109 $ 477 Income from continuing operations .......................................... $ 114 $ 160 $ 132 $ 188 $ 594 Discontinued operations, after tax ............................................ - - 1 1 2 Net income ................................................................................ $ 114 $ 160 $ 133 $ 189 $ 596 Diluted earnings per share from continuing operations ............ $ .47 $ .67 $ .55 $ .79 $ 2.47 Diluted earnings (losses) per share from discontinued operations .............................................................................. - - .01 - .01 Diluted earnings per share ........................................................ $ .47 $ .67 $ .56 $ .79 $ 2.48
77
Item 9. Changes in and Disagreements With Accountants on Accounting and Financial Disclosure. None. Item 9A. Controls and Procedures. Disclosure Controls and Procedures As of the end of the period covered by this annual report, we carried out an evaluation, under the supervision and with the participation of the Company’s management, including our Chief Executive Officer and Chief Financial Officer, of the effectiveness of the design and operation of our disclosure controls and procedures (as such term is defined in Rules 13a-15(e) and 15d-15(e) of the Exchange Act), and management necessarily applied its judgment in assessing the costs and benefits of such controls and procedures, which, by their nature, can provide only reasonable assurance regarding management’s control objectives. You should note that the design of any system of controls is based in part upon certain assumptions about the likelihood of future events, and we cannot assure you that any design will succeed in achieving its stated goals under all potential future conditions, regardless of how remote. Based upon the foregoing evaluation, our Chief Executive Officer and the Chief Financial Officer concluded that our disclosure controls and procedures are effective to ensure that information required to be disclosed by the Company in the reports that it files or submits under the Exchange Act is recorded, processed, summarized and reported within the time periods specified in the rules and forms of the Securities and Exchange Commission.
Internal Control Over Financial Reporting
See “Management’s Report on Internal Control Over Financial Reporting” included in Part II, Item 8 “Financial Statements and Supplementary Data.” Item 9B. Other Information. None.
78
PART III
Items 10, 11, 12, 13, 14. As described below, we incorporate certain information appearing in the Proxy Statement we will furnish to our shareholders in connection with the 2005 Annual Meeting of Shareholders by reference in this Form 10-K Annual Report.
ITEM 10. We incorporate this information by reference to the “Directors Standing For Election,” “Directors Continuing In Office,” “Section 16(a) Beneficial Ownership Reporting Compliance,” “Audit Committee” and “Selection of Director Nominees” sections of our Proxy Statement. We have included information regarding our executive officers and our Code of Ethics below.
ITEM 11. We incorporate this information by reference to the
“Executive Compensation” section of our Proxy Statement.
ITEM 12. We incorporate this information by reference to the
“Securities Authorized for Issuance Under Equity Compensation Plans” and the “Stock Ownership” sections of our Proxy Statement.
ITEM 13. We incorporate this information by reference to the
“Certain Relationships and Related Transactions” section of our Proxy Statement.
ITEM 14. We incorporate this information by reference to the
“Principal Independent Auditor Fee Disclosure” and the “Pre-Approval of Independent Auditor Fees and Services Policy” sections of our Proxy Statement.
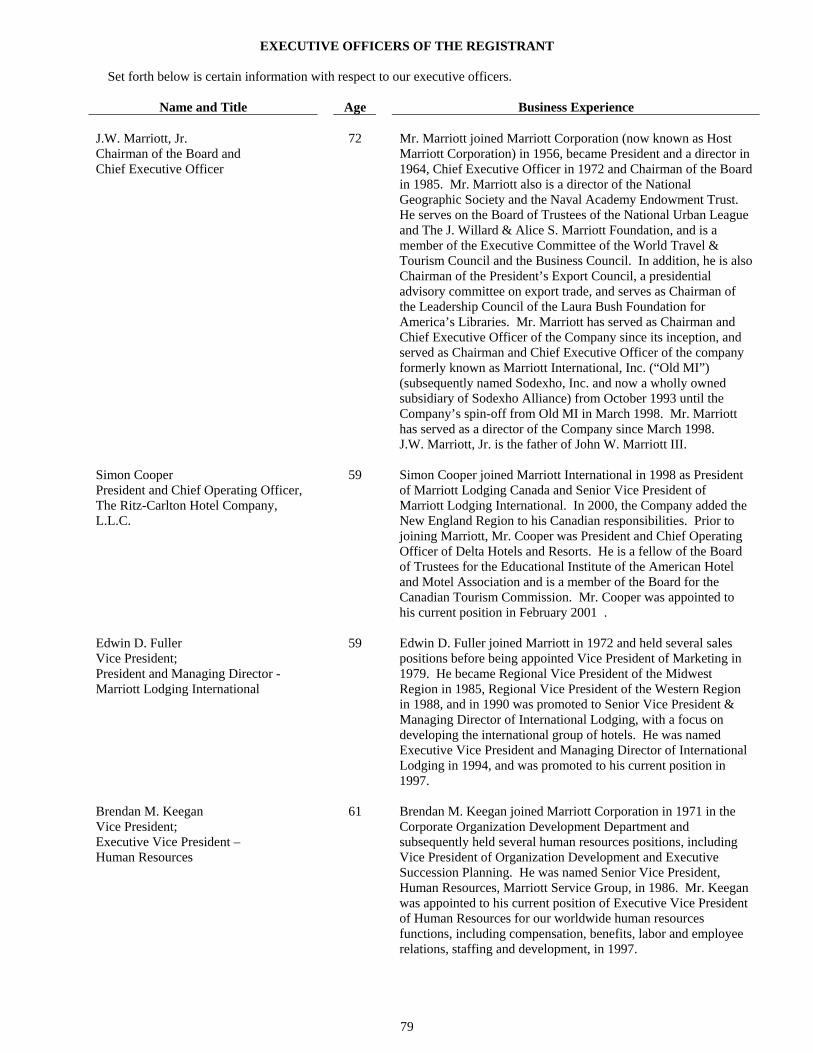
79
EXECUTIVE OFFICERS OF THE REGISTRANT Set forth below is certain information with respect to our executive officers.
Name and Title Age Business Experience J.W. Marriott, Jr. Chairman of the Board and Chief Executive Officer
72
Mr. Marriott joined Marriott Corporation (now known as Host Marriott Corporation) in 1956, became President and a director in 1964, Chief Executive Officer in 1972 and Chairman of the Board in 1985. Mr. Marriott also is a director of the National Geographic Society and the Naval Academy Endowment Trust. He serves on the Board of Trustees of the National Urban League and The J. Willard & Alice S. Marriott Foundation, and is a member of the Executive Committee of the World Travel & Tourism Council and the Business Council. In addition, he is also Chairman of the President’s Export Council, a presidential advisory committee on export trade, and serves as Chairman of the Leadership Council of the Laura Bush Foundation for America’s Libraries. Mr. Marriott has served as Chairman and Chief Executive Officer of the Company since its inception, and served as Chairman and Chief Executive Officer of the company formerly known as Marriott International, Inc. (“Old MI”) (subsequently named Sodexho, Inc. and now a wholly owned subsidiary of Sodexho Alliance) from October 1993 until the Company’s spin-off from Old MI in March 1998. Mr. Marriott has served as a director of the Company since March 1998. J.W. Marriott, Jr. is the father of John W. Marriott III.
Simon Cooper President and Chief Operating Officer, The Ritz-Carlton Hotel Company, L.L.C.
59
Simon Cooper joined Marriott International in 1998 as President of Marriott Lodging Canada and Senior Vice President of Marriott Lodging International. In 2000, the Company added the New England Region to his Canadian responsibilities. Prior to joining Marriott, Mr. Cooper was President and Chief Operating Officer of Delta Hotels and Resorts. He is a fellow of the Board of Trustees for the Educational Institute of the American Hotel and Motel Association and is a member of the Board for the Canadian Tourism Commission. Mr. Cooper was appointed to his current position in February 2001 .
Edwin D. Fuller Vice President; President and Managing Director - Marriott Lodging International
59 Edwin D. Fuller joined Marriott in 1972 and held several sales positions before being appointed Vice President of Marketing in 1979. He became Regional Vice President of the Midwest Region in 1985, Regional Vice President of the Western Region in 1988, and in 1990 was promoted to Senior Vice President & Managing Director of International Lodging, with a focus on developing the international group of hotels. He was named Executive Vice President and Managing Director of International Lodging in 1994, and was promoted to his current position in 1997.
Brendan M. Keegan Vice President; Executive Vice President – Human Resources
61 Brendan M. Keegan joined Marriott Corporation in 1971 in the Corporate Organization Development Department and subsequently held several human resources positions, including Vice President of Organization Development and Executive Succession Planning. He was named Senior Vice President, Human Resources, Marriott Service Group, in 1986. Mr. Keegan was appointed to his current position of Executive Vice President of Human Resources for our worldwide human resources functions, including compensation, benefits, labor and employee relations, staffing and development, in 1997.
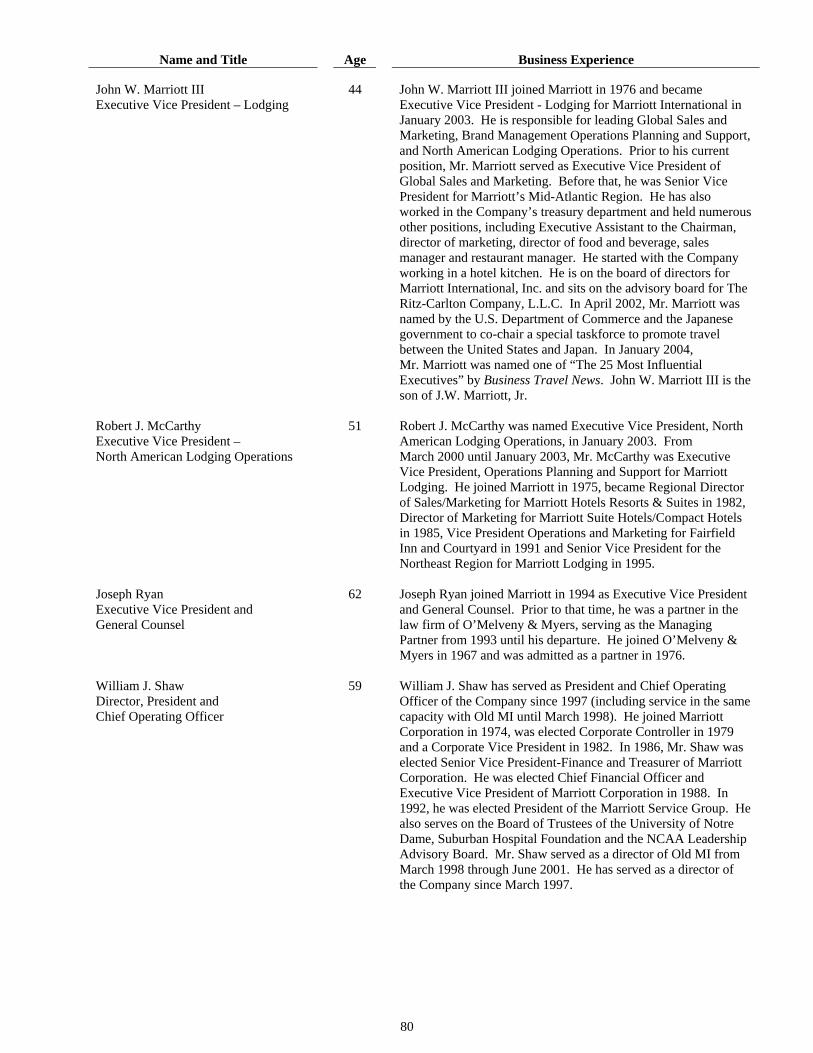
80
Name and Title Age Business Experience
John W. Marriott III Executive Vice President – Lodging
44 John W. Marriott III joined Marriott in 1976 and became Executive Vice President - Lodging for Marriott International in January 2003. He is responsible for leading Global Sales and Marketing, Brand Management Operations Planning and Support, and North American Lodging Operations. Prior to his current position, Mr. Marriott served as Executive Vice President of Global Sales and Marketing. Before that, he was Senior Vice President for Marriott’s Mid-Atlantic Region. He has also worked in the Company’s treasury department and held numerous other positions, including Executive Assistant to the Chairman, director of marketing, director of food and beverage, sales manager and restaurant manager. He started with the Company working in a hotel kitchen. He is on the board of directors for Marriott International, Inc. and sits on the advisory board for The Ritz-Carlton Company, L.L.C. In April 2002, Mr. Marriott was named by the U.S. Department of Commerce and the Japanese government to co-chair a special taskforce to promote travel between the United States and Japan. In January 2004, Mr. Marriott was named one of “The 25 Most Influential Executives” by Business Travel News. John W. Marriott III is the son of J.W. Marriott, Jr.
Robert J. McCarthy Executive Vice President – North American Lodging Operations
51 Robert J. McCarthy was named Executive Vice President, North American Lodging Operations, in January 2003. From March 2000 until January 2003, Mr. McCarthy was Executive Vice President, Operations Planning and Support for Marriott Lodging. He joined Marriott in 1975, became Regional Director of Sales/Marketing for Marriott Hotels Resorts & Suites in 1982, Director of Marketing for Marriott Suite Hotels/Compact Hotels in 1985, Vice President Operations and Marketing for Fairfield Inn and Courtyard in 1991 and Senior Vice President for the Northeast Region for Marriott Lodging in 1995.
Joseph Ryan Executive Vice President and General Counsel
62 Joseph Ryan joined Marriott in 1994 as Executive Vice President and General Counsel. Prior to that time, he was a partner in the law firm of O’Melveny & Myers, serving as the Managing Partner from 1993 until his departure. He joined O’Melveny & Myers in 1967 and was admitted as a partner in 1976.
William J. Shaw Director, President and Chief Operating Officer
59 William J. Shaw has served as President and Chief Operating Officer of the Company since 1997 (including service in the same capacity with Old MI until March 1998). He joined Marriott Corporation in 1974, was elected Corporate Controller in 1979 and a Corporate Vice President in 1982. In 1986, Mr. Shaw was elected Senior Vice President-Finance and Treasurer of Marriott Corporation. He was elected Chief Financial Officer and Executive Vice President of Marriott Corporation in 1988. In 1992, he was elected President of the Marriott Service Group. He also serves on the Board of Trustees of the University of Notre Dame, Suburban Hospital Foundation and the NCAA Leadership Advisory Board. Mr. Shaw served as a director of Old MI from March 1998 through June 2001. He has served as a director of the Company since March 1997.
81
Name and Title Age Business Experience
Arne M. Sorenson Executive Vice President, Chief Financial Officer and President - Continental European Lodging
46 Arne M. Sorenson joined Old MI in 1996 as Senior Vice President of Business Development. He was instrumental in our acquisition of the Renaissance Hotel Group in 1997. Prior to joining Marriott, he was a partner in the law firm of Latham & Watkins in Washington, D.C., where he played a key role in 1992 and 1993 in the distribution of Old MI by Marriott Corporation. Mr. Sorenson was appointed Executive Vice President and Chief Financial Officer in 1998 and assumed the additional title of President, Continental European Lodging, in January 2003.
James M. Sullivan Executive Vice President - Lodging Development
61 James M. Sullivan joined Marriott Corporation in 1980, departed in 1983 to acquire, manage, expand and subsequently sell a successful restaurant chain, and returned to Marriott Corporation in 1986 as Vice President of Mergers and Acquisitions. Mr. Sullivan became Senior Vice President, Finance – Lodging in 1989, Senior Vice President – Lodging Development in 1990 and was appointed to his current position in 1995.
Stephen P. Weisz Vice President; President – Marriott Vacation Club International
54 Stephen P. Weisz joined Marriott Corporation in 1972 and was named Regional Vice President of the Mid-Atlantic Region in 1991. Mr. Weisz had previously served as Senior Vice President of Rooms Operations before being appointed Vice President of the Revenue Management Group. Mr. Weisz became Senior Vice President of Sales and Marketing for Marriott Hotels Resorts & Suites in 1992 and Executive Vice President – Lodging Brands in 1994. Mr. Weisz was appointed to his current position in 1996.
Code of Ethics The Company has long maintained and enforced an Ethical Conduct Policy that applies to all Marriott associates, including our Chief Executive Officer, Chief Financial Officer and Principal Accounting Officer. We have posted our Ethical Conduct Policy, which has been in substantially its current form since the mid-1980s, in the Corporate Governance section of our Investor Relations web site, http://ir.shareholder.com/mar/corporategovernance.cfm. Any future changes or amendments to our Ethical Conduct Policy, and any waiver of our Ethical Conduct Policy that applies to our Chief Executive Officer, Chief Financial Officer and Principal Accounting Officer, will be posted to http://ir.shareholder.com/mar/corporategovernance.cfm.
82
PART IV Item 15. Exhibits and Financial Statement Schedules. LIST OF DOCUMENTS FILED AS PART OF THIS REPORT
(1) FINANCIAL STATEMENTS The response to this portion of Item 15 is submitted under Item 8 of this Report on Form 10-K. (2) FINANCIAL STATEMENT SCHEDULES
Information relating to schedules for which provision is made in the applicable accounting regulations of the SEC is included in the notes to the financial statements and is incorporated herein by reference.
(3) EXHIBITS
Any shareholder who wants a copy of the following Exhibits may obtain one from us upon request at a charge that reflects the reproduction cost of such Exhibits. Requests should be made to the Secretary, Marriott International, Inc., Marriott Drive, Department 52/862, Washington, D.C. 20058.
Exhibit No. Description
Incorporation by Reference (where a report or registration statement is indicated below, that document has been previously filed with the SEC and the applicable exhibit is incorporated by reference thereto)
3.1 Third Amended and Restated Certificate of
Incorporation of the Company. Exhibit No. 3 to our Form 10-Q for the fiscal quarter ended June 18, 1999.
3.2 Amended and Restated Bylaws. Exhibit No. 3.2 to our Form 10-K for the fiscal year ended January 3, 2003.
3.3 Amended and Restated Rights Agreement dated as of August 9, 1999, with The Bank of New York, as Rights Agent.
Exhibit No. 4.1 to our Form 10-Q for the fiscal quarter ended September 10, 1999.
3.4 Certificate of Designation, Preferences and Rights of the Marriott International, Inc. ESOP Convertible Preferred Stock.
Exhibit No. 3.1 to our Form 10-Q for the fiscal quarter ended June 16, 2000.
3.5 Certificate of Designation, Preferences and Rights of the Marriott International, Inc. Capped Convertible Preferred Stock.
Exhibit No. 3.2 to our Form 10-Q for the fiscal quarter ended June 16, 2000.
4.1 Indenture dated November 16, 1998, with The Chase Manhattan Bank, as Trustee.
Exhibit No. 4.1 to our Form 10-K for the fiscal year ended January 1, 1999.
4.2 Form of 6.875% Series B Note due 2005. Exhibit No. 4.3 to our Form 10-K for the fiscal year ended January 1, 1999.
4.3 Form of 7.875% Series C Note due 2009.
Exhibit No. 4.1 to our Form 8-K dated September 20, 1999.
4.4 Form of 8.125% Series D Note due 2005. Exhibit No. 4.1 to our Form 8-K dated March 28, 2000.
4.5 Form of 7.0% Series E Note due 2008. Exhibit No. 4.1 (f) to our Form S-3 filed on January 17, 2001.
83
Exhibit No. Description
Incorporation by Reference (where a report or registration statement is indicated below, that document has been previously filed with the SEC and the applicable exhibit is incorporated by reference thereto)
10.1 2002 Comprehensive Stock and Cash Incentive
Plan. Appendix B in our definitive proxy statement filed on March 28, 2002.
10.2 $1.5 billion Credit Agreement dated July 31, 2001, as amended, with Citibank, N.A. as Administrative Agent, and certain banks.
Exhibit No. 10 to our Form 10-Q/A for the fiscal quarter ended September 7, 2001, and Exhibit No. 10.1 to our Form 10-Q for the fiscal quarter ended September 6, 2002 (Amendment No. 1).
10.3 $500 million Credit Agreement dated as of August 5, 2003, with Citibank, N.A. as Administrative Agent, and certain banks.
Exhibit No. 10 to our Form 10-Q for the fiscal quarter ended September 12, 2003.
10.4 Agreement for Purchase of Membership Interest in Synthetic American Fuel Enterprises I, LLC (“SynFuel I”) dated as of January 28, 2003 (“SynFuel I Purchase Agreement”).
Exhibit No. 10.1 to our Form 10-Q for the fiscal quarter ended June 20, 2003.
10.5 Amendment to SynFuel I Purchase Agreement. Exhibit No. 10.2 to our Form 10-Q for the fiscal quarter ended June 20, 2003.
10.6 Amended and Restated Limited Liability Company Agreement of SynFuel I dated as of January 28, 2003.
Exhibit No. 10.3 to our Form 10-Q for the fiscal quarter ended June 20, 2003.
10.7 Agreement for Purchase of Membership Interest in Synthetic American Fuel Enterprises II, LLC (“SynFuel II”) dated as of January 28, 2003 (“SynFuel II Purchase Agreement”).
Exhibit No. 10.4 to our Form 10-Q for the fiscal quarter ended June 20, 2003.
10.8 Amendment to SynFuel II Purchase Agreement.
Exhibit No. 10.5 to our Form 10-Q for the fiscal quarter ended June 20, 2003.
10.9 Amended and Restated Limited Liability Company Agreement of SynFuel II dated as of January 28, 2003.
Exhibit No. 10.6 to our Form 10-Q for the fiscal quarter ended June 20, 2003.
10.10 Guaranty of Marriott International, Inc. dated as of January 28, 2003, of certain obligations under the SynFuel I and II purchase agreements and the amended and restated SynFuel I and II limited liability company agreements.
Exhibit No. 10.7 to our Form 10-Q for the fiscal quarter ended June 20, 2003.
10.11 Second Amendment Agreement regarding Synthetic American Fuel Enterprises I, LLC dated as of October 6, 2004.
Exhibit No. 10.1 to our Form 8-K dated October 6, 2004.
10.12 Third Amendment Agreement regarding Synthetic American Fuel Enterprises II, LLC dated as of October 6, 2004.
Exhibit No. 10.2 to our Form 8-K dated October 6, 2004.
10.13 Marriott International, Inc. Executive Officer Deferred Compensation Plan.
Exhibit No. 10.1 to our Form 10-Q for the fiscal quarter ended September 10, 2004.
10.14 Marriott International, Inc. Executive Officer Incentive Plan and Executive Officer Individual Performance Plan.
Exhibit No. 10.2 to our Form 10-Q for the fiscal quarter ended September 10, 2004.
84
Exhibit No. Description
Incorporation by Reference (where a report or registration statement is indicated below, that document has been previously filed with the SEC and the applicable exhibit is incorporated by reference thereto)
10.15
Form of Employee Non-Qualified Stock Option Agreement for the Marriott International, Inc. 2002 Comprehensive Stock and Cash Incentive Plan.
Exhibit No. 10.3 to our Form 10-Q for the fiscal quarter ended September 10, 2004.
10.16 Form of Non-Employee Director Non-Qualified Stock Option Agreement for the Marriott International, Inc. 2002 Comprehensive Stock and Cash Incentive Plan.
Exhibit No. 10.4 to our Form 10-Q for the fiscal quarter ended September 10, 2004.
10.17 Form of Executive Restricted Stock Unit Agreement for the Marriott International, Inc. 2002 Comprehensive Stock and Cash Incentive Plan.
Filed with this report.
12 Statement of Computation of Ratio of Earnings to Fixed Charges.
Filed with this report.
21 Subsidiaries of Marriott International, Inc. Filed with this report. 23 Consent of Ernst & Young LLP. Filed with this report. 31.1 Certification of Chief Executive Officer
Pursuant to Rule 13a-14(a). Filed with this report.
31.2 Certification of Chief Financial Officer Pursuant
to Rule 13a-14(a). Filed with this report.
32 Section 1350 Certifications. Filed with this report.
85
SIGNATURES
Pursuant to the requirements of Section 13 or 15(d) of the Securities Exchange Act of 1934, we have duly caused this Form 10-K to be signed on our behalf by the undersigned, thereunto duly authorized, on this 22nd day of February, 2005. MARRIOTT INTERNATIONAL, INC. By /s/ J.W. Marriott, Jr. J.W. Marriott, Jr. Chief Executive Officer Pursuant to the requirements of the Securities Exchange Act of 1934, this Form 10-K has been signed by the following persons on our behalf in the capacities indicated and on the date indicated above. PRINCIPAL EXECUTIVE OFFICER:
/s/ J.W. Marriott, Jr. J.W. Marriott, Jr. Chairman of the Board, Chief Executive Officer
and Director PRINCIPAL FINANCIAL OFFICER:
/s/ Arne M. Sorenson Arne M. Sorenson Executive Vice President and Chief Financial Officer PRINCIPAL ACCOUNTING OFFICER:
/s/ Carl T. Berquist Carl T. Berquist Executive Vice President, Financial Information and Enterprise Risk Management DIRECTORS:
/s/ Richard S. Braddock /s/ George Muñoz Richard S. Braddock, Director George Muñoz, Director
/s/ Lawrence W. Kellner /s/ Harry J. Pearce Lawrence W. Kellner, Director Harry J. Pearce, Director
/s/ Debra L. Lee /s/ Roger W. Sant Debra L. Lee, Director Roger W. Sant, Director
/s/ John W. Marriott III /s/ William J. Shaw John W. Marriott III, Director William J. Shaw, Director
/s/ Floretta Dukes McKenzie /s/ Lawrence M. Small Floretta Dukes McKenzie, Director Lawrence M. Small, Director
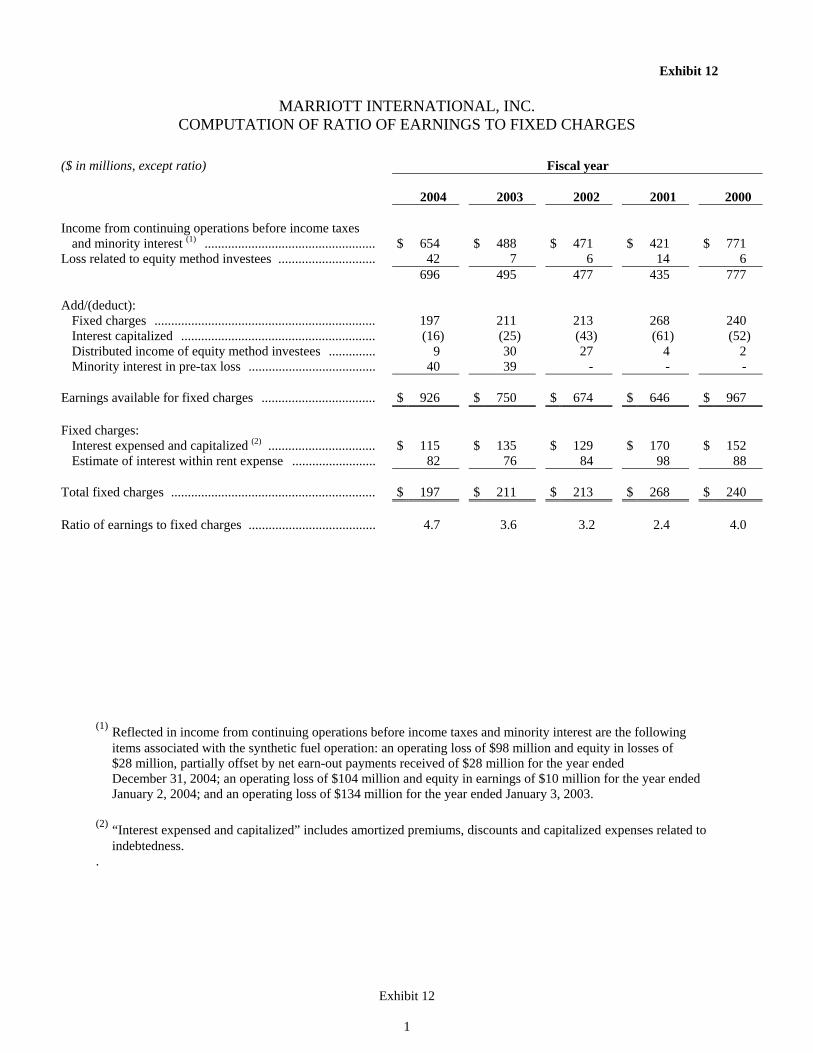
Exhibit 12
1
Exhibit 12
MARRIOTT INTERNATIONAL, INC. COMPUTATION OF RATIO OF EARNINGS TO FIXED CHARGES
($ in millions, except ratio) Fiscal year 2004 2003 2002 2001 2000 Income from continuing operations before income taxes and minority interest (1) ................................................... $ 654 $ 488 $ 471
$ 421 $ 771
Loss related to equity method investees ............................. 42 7 6 14 6 696 495 477 435 777 Add/(deduct): Fixed charges .................................................................. 197 211 213 268 240 Interest capitalized .......................................................... (16) (25) (43) (61) (52) Distributed income of equity method investees .............. 9 30 27 4 2 Minority interest in pre-tax loss ...................................... 40 39 - - - Earnings available for fixed charges .................................. $ 926 $ 750 $ 674 $ 646 $ 967 Fixed charges: Interest expensed and capitalized (2) ................................ $ 115 $ 135 $ 129 $ 170 $ 152 Estimate of interest within rent expense ......................... 82 76 84 98 88 Total fixed charges ............................................................. $ 197 $ 211 $ 213 $ 268 $ 240 Ratio of earnings to fixed charges ...................................... 4.7 3.6 3.2 2.4 4.0
(1) Reflected in income from continuing operations before income taxes and minority interest are the following items associated with the synthetic fuel operation: an operating loss of $98 million and equity in losses of $28 million, partially offset by net earn-out payments received of $28 million for the year ended December 31, 2004; an operating loss of $104 million and equity in earnings of $10 million for the year ended January 2, 2004; and an operating loss of $134 million for the year ended January 3, 2003.
(2) “Interest expensed and capitalized” includes amortized premiums, discounts and capitalized expenses related to indebtedness. .
Exhibit 23
1
Exhibit 23
Consent of Independent Registered Public Accounting Firm
We consent to the incorporation by reference in the following Registration Statements of Marriott International, Inc. and in the related Prospectuses of our reports dated February 21, 2005, with respect to the consolidated financial statements of Marriott International, Inc., Marriott International, Inc. management’s assessment of the effectiveness of internal control over financial reporting, and the effectiveness of internal control over financial reporting of Marriott International, Inc., included in this Annual Report (Form 10-K) for the fiscal year ended December 31, 2004.
1. Form S-3 No. 333-53860 2. Form S-3 No. 333-94697 3. Form S-3 No. 333-77827 4. Form S-8 No. 333-55350 5. Form S-8 No. 333-36388 6. Form S-8 No. 333-58747 7. Form S-8 No. 333-48407 8. Form S-8 No. 333-48417
/s/ Ernst & Young LLP McLean, Virginia February 21, 2005
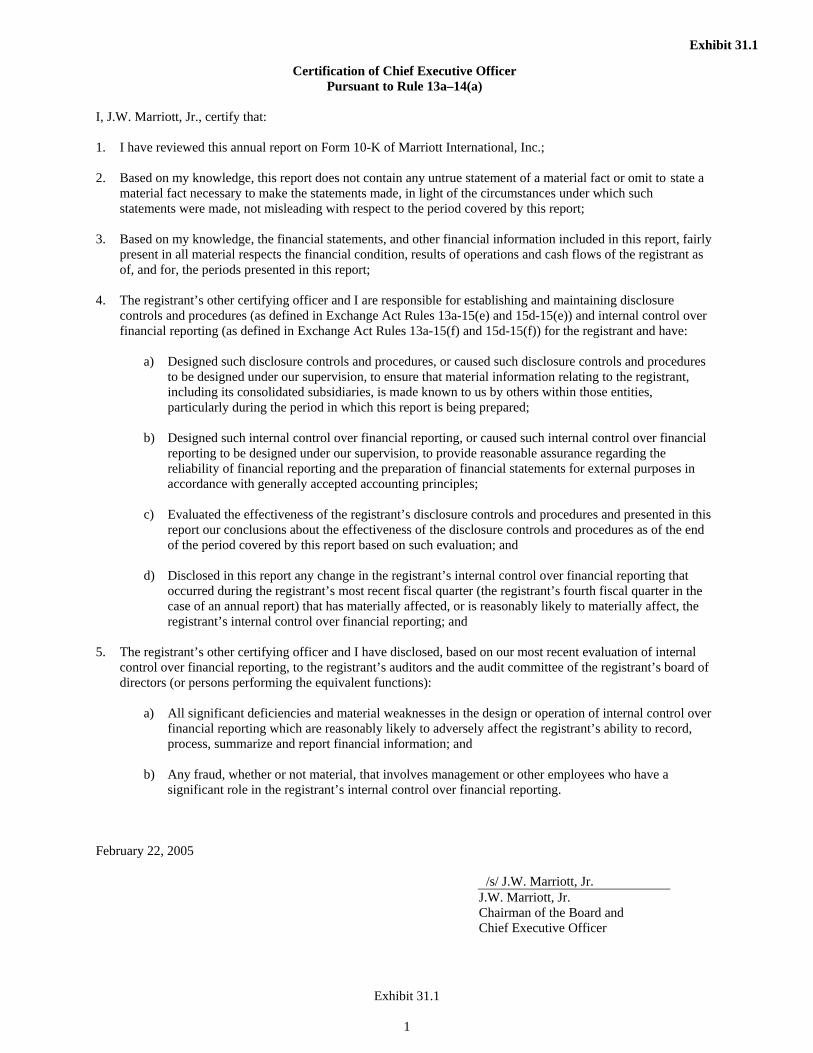
Exhibit 31.1
1
Certification of Chief Executive Officer Pursuant to Rule 13a–14(a)
I, J.W. Marriott, Jr., certify that: 1. I have reviewed this annual report on Form 10-K of Marriott International, Inc.; 2. Based on my knowledge, this report does not contain any untrue statement of a material fact or omit to state a material fact necessary to make the statements made, in light of the circumstances under which such statements were made, not misleading with respect to the period covered by this report; 3. Based on my knowledge, the financial statements, and other financial information included in this report, fairly present in all material respects the financial condition, results of operations and cash flows of the registrant as of, and for, the periods presented in this report; 4. The registrant’s other certifying officer and I are responsible for establishing and maintaining disclosure controls and procedures (as defined in Exchange Act Rules 13a-15(e) and 15d-15(e)) and internal control over financial reporting (as defined in Exchange Act Rules 13a-15(f) and 15d-15(f)) for the registrant and have:
a) Designed such disclosure controls and procedures, or caused such disclosure controls and procedures to be designed under our supervision, to ensure that material information relating to the registrant, including its consolidated subsidiaries, is made known to us by others within those entities, particularly during the period in which this report is being prepared; b) Designed such internal control over financial reporting, or caused such internal control over financial reporting to be designed under our supervision, to provide reasonable assurance regarding the reliability of financial reporting and the preparation of financial statements for external purposes in accordance with generally accepted accounting principles;
c) Evaluated the effectiveness of the registrant’s disclosure controls and procedures and presented in this report our conclusions about the effectiveness of the disclosure controls and procedures as of the end of the period covered by this report based on such evaluation; and
d) Disclosed in this report any change in the registrant’s internal control over financial reporting that occurred during the registrant’s most recent fiscal quarter (the registrant’s fourth fiscal quarter in the case of an annual report) that has materially affected, or is reasonably likely to materially affect, the registrant’s internal control over financial reporting; and
5. The registrant’s other certifying officer and I have disclosed, based on our most recent evaluation of internal control over financial reporting, to the registrant’s auditors and the audit committee of the registrant’s board of directors (or persons performing the equivalent functions):
a) All significant deficiencies and material weaknesses in the design or operation of internal control over financial reporting which are reasonably likely to adversely affect the registrant’s ability to record, process, summarize and report financial information; and
b) Any fraud, whether or not material, that involves management or other employees who have a significant role in the registrant’s internal control over financial reporting.
February 22, 2005
/s/ J.W. Marriott, Jr. J.W. Marriott, Jr.
Chairman of the Board and Chief Executive Officer
Exhibit 31.1
Exhibit 31.2
1
Certification of Chief Financial Officer Pursuant to Rule 13a–14(a)
I, Arne M. Sorenson, certify that:
1. I have reviewed this annual report on Form 10-K of Marriott International, Inc.; 2. Based on my knowledge, this report does not contain any untrue statement of a material fact or omit to state a material fact necessary to make the statements made, in light of the circumstances under which such statements were made, not misleading with respect to the period covered by this report; 3. Based on my knowledge, the financial statements, and other financial information included in this report, fairly present in all material respects the financial condition, results of operations and cash flows of the registrant as of, and for, the periods presented in this report; 4. The registrant’s other certifying officer and I are responsible for establishing and maintaining disclosure controls and procedures (as defined in Exchange Act Rules 13a-15(e) and 15d-15(e)) and internal control over financial reporting (as defined in Exchange Act Rules 13a-15(f) and 15d-15(f)) for the registrant and have:
a) Designed such disclosure controls and procedures, or caused such disclosure controls and procedures to be designed under our supervision, to ensure that material information relating to the registrant, including its consolidated subsidiaries, is made known to us by others within those entities, particularly during the period in which this report is being prepared; b) Designed such internal control over financial reporting, or caused such internal control over financial reporting to be designed under our supervision, to provide reasonable assurance regarding the reliability of financial reporting and the preparation of financial statements for external purposes in accordance with generally accepted accounting principles; c) Evaluated the effectiveness of the registrant’s disclosure controls and procedures and presented in this report our conclusions about the effectiveness of the disclosure controls and procedures as of the end of the period covered by this report based on such evaluation; and d) Disclosed in this report any change in the registrant’s internal control over financial reporting that occurred during the registrant’s most recent fiscal quarter (the registrant’s fourth fiscal quarter in the case of an annual report) that has materially affected, or is reasonably likely to materially affect, the registrant’s internal control over financial reporting; and
5. The registrant’s other certifying officer and I have disclosed, based on our most recent evaluation of internal control over financial reporting, to the registrant’s auditors and the audit committee of the registrant’s board of directors (or persons performing the equivalent functions):
(a) All significant deficiencies and material weaknesses in the design or operation of internal control over financial reporting which are reasonably likely to adversely affect the registrant’s ability to record, process, summarize and report financial information; and
(b) Any fraud, whether or not material, that involves management or other employees who have a significant role in the registrant’s internal control over financial reporting. February 22, 2005
/s/ Arne M. Sorenson Arne M. Sorenson
Executive Vice President and Chief Financial Officer
Exhibit 31.2
Exhibit 32
1
Certification Pursuant to Rule 13a–14(b) and Section 906 of the Sarbanes-Oxley Act of 2002
(18 U.S.C. Section 1350 (a) and (b))
I, J.W. Marriott, Jr., Chairman of the Board and Chief Executive Officer of Marriott International, Inc. (the “Company”) certify that:
(1) the annual report on Form 10-K of the Company for the year ended December 31, 2004 (the “Annual Report”) fully complies with the requirements of section 13(a) or 15(d) of the Securities Exchange Act of 1934 (15 U.S.C. 78m or 78o(d)); and
(2) the information contained in the Annual Report fairly presents, in all material respects, the financial condition and results of operations of the Company.
February 22, 2005 /s/ J.W. Marriott, Jr. J.W. Marriott, Jr.
Chairman of the Board and Chief Executive Officer
I, Arne M. Sorenson, Executive Vice President and Chief Financial Officer of Marriott International, Inc. (the “Company”) certify that:
(1) the annual report on Form 10-K of the Company for the year ended December 31, 2004 (the “Annual Report”) fully complies with the requirements of section 13(a) or 15(d) of the Securities Exchange Act of 1934 (15 U.S.C. 78m or 78o(d)); and
(2) the information contained in the Annual Report fairly presents, in all material respects, the financial condition and results of operations of the Company.
February 22, 2005 /s/ Arne M. Sorenson Arne M. Sorenson
Executive Vice President and Chief Financial Officer
Exhibit 32