Embed Size (px)
Citation preview

© Medco Health Solutions, Inc. , . , .
-
TAIL
OR
ING
SO
LUT
ION
SFO
R O
UR
CU
STO
ME
RS
, P.
8C
HA
IRM
AN
’S L
ET
TE
R,
P.3
AC
HIE
VIN
G R
ES
ULT
SFO
R O
UR
SH
AR
EH
OLD
ER
S,
P.2
0D
EL
IVE
RIN
G W
OR
LD
-CL
AS
S S
ER
VIC
ETO
OU
R C
US
TOM
ER
S’
CU
STO
ME
RS
,P.
14
,
.
: . , . , .. . , Chair
. , .. .
: . , Chair
. , . , .. . . , . . , . .
: , .. . , Chair
. . , . . , .. . . , . .
First Column . , .
.
.
. , .. , ...
Second Column . , .. , ..
. , . , ...
. , ..
, ...
The Bank of New York, - - (Outside the United States) - (Hearing-Impaired TDD Phone)
:
Shareholder Relations Department, P.O. Box ,Church Street Station, New York, NY [email protected]://www.stockbny.com
:
Receive and Deliver Department, P.O. Box ,Church Street Station, New York, NY 10286
Phone: MHS-NEWS ( -)E-mail: [email protected]
Phone: -E-mail: [email protected]
Medco’s Annual Meeting of Shareholders will be held on April , , at : a.m. at the Grand Hyatt Hotel, New York, N.Y.
Medco Health Solutions, Inc.100 Parsons Pond DriveFranklin Lakes, NJ - -www.medco.com
Delaware
Medco’s common stock is listed on the New YorkStock Exchange under the ticker symbol MHS.
High $27.70 $38.00
Low $20.50 $24.15
Reflects when-issued trading from August , .
Number of shareholders of record as ofFebruary , : ,.
Medco currently does not pay dividends and does notplan to pay dividends in the foreseeable future.
PricewaterhouseCoopers LLPFlorham Park, NJ
Medco’s Annual Report, Proxy Statement,Form -, Form -, and other filingsare available free of charge by visitingour website at www.medco.comunder Investor Relations.
. , .Chairman, President, &Chief Executive Officer
. Group President, Systemed
. Senior Vice President, Product & Business Development
. , .. , . .Senior Vice President, Medical Affairs &Chief Medical Officer
. Group President, Health Plans
. Executive Vice President,Chief Operating Officer
. Senior Vice President,General Counsel & Secretary
. Senior Vice President,Pharmaceutical Contracting
Senior Vice President, Human Resources
. Senior Vice President, Finance & Chief Financial Officer
. Vice President & Controller,Chief Accounting Officer
. Senior Vice President,Chief Marketing Officer
. Group President, Key Accounts
. Group President, National Accounts
Design by Addison www.addison.comMajor photography by Alan Thornton
Information, including quarterly earnings releases and other announcements, may be reviewed or downloaded by accessing theInvestor Relations section ofwww.medco.com.
Medco’s ethics hotline phone number is -.
16.9
22.3
29.1
33.034.334.3
.93*
.56
1.19*
.80
.95
1.35* 1.34
1.571.57
493
582
687712
6886881.20
1.26 1.22 1.24
1.501.50
00
.40
1.20
1.60
99 00 01 02 0303 99 00 01 02 0303 99 00 01 02 0303 99 00 01 02 0303
.80
9
18
27
36
0
200
400
600
800
0
.30
.60
.90
1.20
1.50
(In millions, except per share data)
()
Total net revenues $34,264.5 $32,958.5 4%
Income before provision for income taxes $728.7 $620.3 17%
Net income $425.8 $361.6 18%
Net income per diluted share $1.57 $1.34 17%
Cash and cash equivalents $638.5 $14.4 N/M§
Working capital $1,155.0 $1,171.5 (1%)
Total assets $10,263.0 $9,922.5 3%
Total debt $1,396.1 – N/M§
Adjusted prescription volume† 688.2 711.6 (3%)
Total prescriptions administered 532.0 548.2 (3%)
Mail order 78.1 81.7 (4%)
Retail 453.9 466.5 (3%)
*Assumes Statement of Financial Accounting Standards No. 142, “Goodwill and Other Intangible Assets,” was in effect, whereby goodwill is not amortized.†Estimated adjusted prescription volume equals mail order prescriptions multiplied by 3, plus retail prescriptions. The mail order prescriptions
are multiplied by 3 to adjust for the fact that mail order prescriptions include approximately 3 times the amount of product days supplied compared with
retail prescriptions.‡For a reconciliation of reported net income to EBITDA and a presentation of EBITDA per adjusted prescription, refer to page 36 of the Management’s
Discussion and Analysis included in this annual report.§Not meaningful.
(in billions of dollars)
(in dollars)
†
(in millions of dollars)/ ‡
(in dollars)
Medco Health Solutions, Inc.

... ’
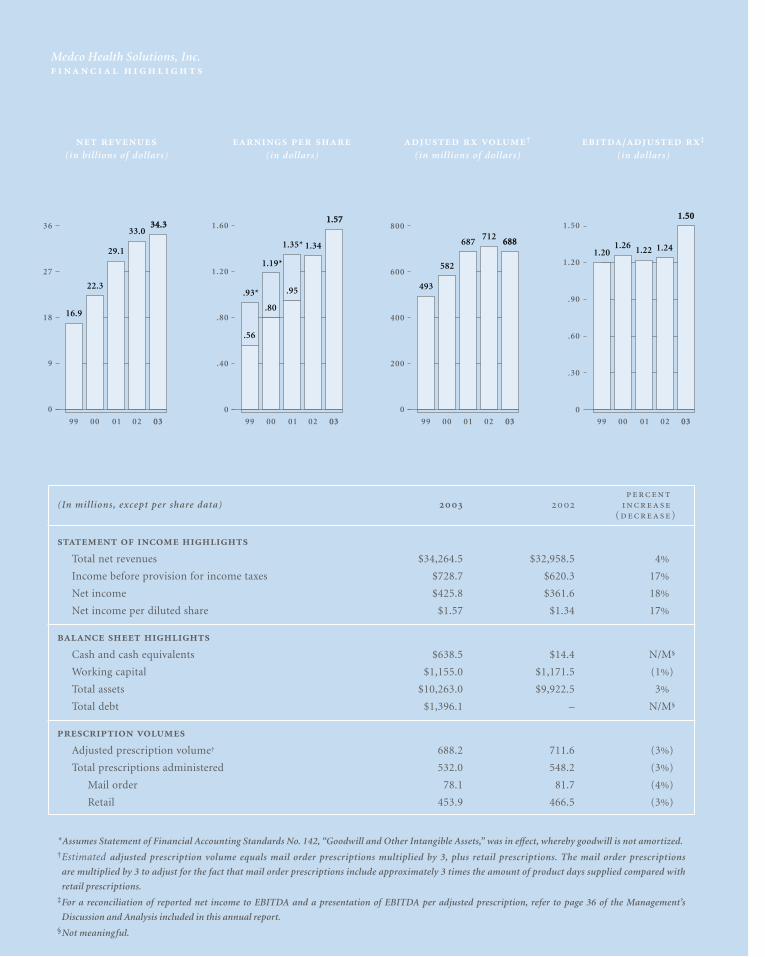
• Prescription benefit plan design
• Formulary consulting
• Pharmaceutical contracting
• Specialty pharmacy management
• Custom retail networks
• Mail order pharmacy programs
• Integrated specialty networks
• Retail price discounts
• Pharmaceutical rebates
• Low-cost claims processing
• Generic drug programs
• Drug utilization programs
• 24/7 customer service call centers
• Dedicated account service
• Proprietary benefit planning tools
• Physician prescribing analysis
• Powerful information management tools
• Flexible plan design
• Health and benefit information
• Customized formularies
• Drug education
• Convenient, fully automated mail order pharmacy
• Retail networks covering 60,000pharmacies
• Online prescription refills and renewals
• Individual savings analysis
• Medication pricing and coverage comparisons
• Co-payment options
• Broad access to generic drugs
• Health management programs
• Specialty pharmacy service
• Drug safety programs
• Treatment guidelines
:
for :
for ’
:
’
Medco Health Solutions, Inc., is one of the nation’s leading prescription benefit managers (PBMs),
with the largest mail order pharmacy operation. Our programs and services help our customers
moderate the cost and enhance the quality of prescription drug benefits provided to their members
nationwide. Our customers include Blue Cross/Blue Shield plans; managed care organizations;
insurance carriers; third-party benefit plan administrators; federal, state, and local government agencies;
union-sponsored benefit plans; and employers.
> >
> >
> >
> >
M E D C O H E A LT H S O L U T I O N S , I N C . 3
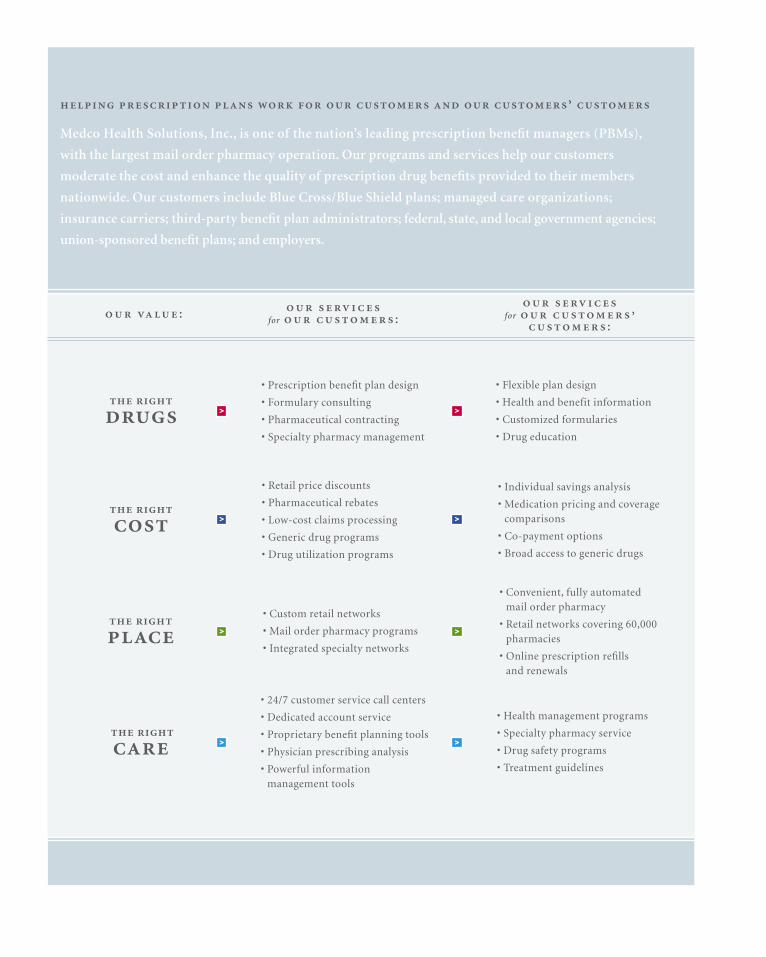
August 19, 2003 marked a defining moment in the successful 20-year history of Medco Health
Solutions, Inc. On that day, we rang the opening bell at the New York Stock Exchange—where more than
270 million shares of Medco stock were distributed to Merck & Co., Inc., shareholders in a 100 percent
to our , , and :
spin-off transaction. Medco became the largest domestic corpo-
rate spin-off in more than 3 years, the newest member of the S&P
500 and Fortune 500, and—based upon our 2003 net revenues of
$34 billion—America’s leading independent manager of prescrip-
tion benefit plans.
In little more than 4 months as a newly public company, we’ve
made significant strides in building shareholder value. During
the year, we managed 532 million prescriptions. That includes
78 million prescriptions in our mail order pharmacies—more
than the mail order total of our three largest competitors com-
bined. In fact, our $11.3 billion mail order business makes
Medco one of the largest pharmacy operations in the country
and, we believe, the safest and most efficient.
We continue to deliver value to both our customers and share-
holders by simultaneously lowering the rate of growth of our
customers’ drug expenditures and delivering significant growth in
net income. Through increases in generic dispensing rates, high
mail order penetration, and further gains in efficiencies from
automation and technology, gross margins for the full year
reached 4.4 percent, up from 3.9 percent in 2002, and net income
grew 18 percent to $425.8 million. The Company generated cash
from operations of over $1.1 billion and Earnings Before Interest
Income/Expense, Taxes, Depreciation, and Amortization
(EBITDA) of $1.0 billion.
In short, it was a strong performance in 2003. And, already in
2004, we have renewed $15 billion of business, including
UnitedHealth Group, which represents more than $7 billion
in estimated 2004 net revenues, as well as the Commonwealth
of Virginia.
. On the day our stock began trading,
I pledged that Medco would have but one focus: the relentless
pursuit of world-class status in the eyes of our
customers. Attaining this level of performance requires that we
deliver administrative, clinical, and financial experience that is
second to none in our industry. The evidence is clear that, as we
deliver on this promise to our customers and to our
customers’ customers, we will also deliver success to our com-
pany and our shareholders.
There is ample evidence from some of the country’s most
influential and respected independent organizations that world-
class status is within our reach:
• In January 2003, a significant study issued by the government’s
General Accounting Office (GAO) concluded that three of the
PBMs providing services to federal employees lowered drug
costs by 27 to 53 percent, on average for drugs in their selec-
tion, through their mail order pharmacies. Medco was one of
the three PBMs cited in the GAO report.
. , ., , ,
“ — the most transparent
contracts in 2004 in all regards.” – Lisa Gill, Vice President and Senior Research Analyst, JP Morgan
“ , purchasing power that is difficult to match.” – Eric Veiel, CFA, Senior Research Analyst, Wachovia Securities
• In September, Medco, for the third straight year, was rated the
number one PBM for customer satisfaction and the number
one mail order pharmacy in the Wilson Rx Pharmacy Benefit
Satisfaction Report. Four consecutive times, Medco also
earned the highest ranking in overall customer satisfaction
with prescription drug benefits and services from J.D. Power
and Associates*—both achievements unprecedented and unri-
valed in the industry.
• And in December, Medco’s network of mail order pharmacies
achieved a perfect score of 100 from the Joint Commission on
Accreditation of Healthcare Organizations—a leading
independent standards-setting and accrediting body in
healthcare, placing Medco in the highest 5 percent of organiza-
tions reviewed.
With the independent recognition that we have received, many
might conclude we have achieved world-class status already. But
we see significant opportunity to take Medco to an even higher
level of performance.
. We have
made investments in our future that deliver proprietary, com-
petitive advantages for Medco. These investments form the
foundation for the delivery of a unique service experience to our
customers that distinguishes Medco from its competitors.
These strategic investments include two automated dispensing
pharmacies, each capable of delivering more than 1 million
prescriptions per week. Our proprietary automated pharmacies
are widely regarded as the most efficient ever designed and so
advanced that we have been granted or have pending 35 U.S.
patents on various technologies. Our customer service facilities
handle more than 2 million member contacts a week—all in an
environment embracing a Six Sigma®† quality discipline that
enables us to achieve continuous improvement for all of our crit-
ical business processes. We have built one of the nation’s largest
Internet pharmacies, handling 13.8 million prescriptions, repre-
senting nearly $2 billion in drug spend during 2003. In addition,
the percentage of refills and renewals ordered using our interac-
tive voice response technology and the Internet increased to 57
percent compared with 50 percent in 2002.
We have also deployed companywide reliability and change
management programs that will drive excellence in execution
across our operations, reducing our time to market with new
capabilities and increasing our ability to implement error-free
updates and customer solutions to our systems.
Medco currently has manufacturer rebate agreements in place
with approximately 80 brand-name drug manufacturers, as well
as discount arrangements with virtually all of the U.S. retail
pharmacies, and we are one of the largest purchasers of generic
drugs in the United States. Our tremendous scale, combined
with our many clinical programs, enabled us to keep the aggre-
gated median drug trend for all of our customers combined at
9.6 percent in 2003—below the national average.
.
As we move into 2004, our first full year as a stand-alone
company, we see opportunity for growth.
We are transitioning our customer sales and service organization
into four market-facing groups that will have accountability for
taking client relationships to a level of strategic relevance that
we refer to as “customer-intimate.” These groups focus on the
*.. SM. , .. . ...
† , .
M E D C O H E A LT H S O L U T I O N S , I N C . 5
unique needs of clients from our largest to our smallest, and
include Health Plans, National Accounts, Key Accounts
(UnitedHealth Group, Labor, and Government), and Systemed
(small and middle markets).
To the extent that knowledge is power, we are building powerful
proprietary technology tools that will enable clients to better
monitor and manage their prescription drug programs. Our
account teams are now able to use our enormous data capabili-
ties in the field to consult with clients and provide solutions that
are tailored to their needs.
Customer intimacy cannot become a reality without a high
degree of trust among partners. That is why we are leading our
industry in developing practices that enhance the financial
transparency of our operations.
As our clients become more aggressive in reducing their drug
trend, they are leveraging our strongest core capabilities—mail
order service and the generic interchange program. Both repre-
sent the ideal alignment of interests—members receive high-
quality care, clients enjoy significant savings, and Medco earns
incremental margin. This margin growth opportunity is impor-
tant to understand given the fact that brand-name drugs with
aggregate sales volume of $38 billion are scheduled to go off
patent with generic availability over the next 4 years.
Additionally, in 2004, as new and expensive biotech drugs continue
to stream through the pipeline, we will continue to invest in our
specialty pharmacy, where we are well positioned in the market.
Specialty drugs were included in virtually every request for
proposal on which we bid in 2003, and, among those contracts that
we have won, 95 percent included managing specialty pharmacy.
The landmark legislation to modernize Medicare with a pre-
scription drug benefit enables Medco to extend the market-
based tools that have so effectively managed drug spending in
the private sector to assist America’s seniors. Medicare represents
a new $530 bil l ion market opportunity over the next
10 years, and we look forward to actively participating. We
believe that Medicare reform is good public policy for America
and a strong business opportunity for Medco.
—’ . We begin 2004
with confidence, experience, and enthusiasm. While our chal-
lenge is great, we are constrained neither by opportunity
nor capability.
Ensuring that millions of Americans have access to affordable,
high-quality prescription healthcare is more than our busi-
ness—it’s our calling. And every day, our 13,000 employees are
guided by the pledge we made on our first day as a newly
public company: to lead our industry with a passion for quality
and excellence, to serve our customers with the integrity of a
trusted advisor, to provide our members with the highest quality
care, and—by delivering on our customer commitments—to
build enduring value for our shareholders.
I invite you to carefully review our annual report, which chroni-
cles many of the ways Medco is providing customers with
Extra-Strength Solutions™.*
*- , .
Sincerely,
David B. Snow, Jr.
Chairman, President, & Chief Executive Officer

Medco’s competitive advantage begins with our management team, and 2003 has been a year of
changes leading to increased strength, accountability, and productivity.
Several new senior executives with proven experience in quality, healthcare, branding, and operations have joined our
organization and complement a seasoned core of Medco leaders. Every member of the team brings focus, expertise,
and intense commitment to our goal of achieving world-class excellence in the eyes of our customers. Careful
planning is fundamental to this goal; therefore, we’ve developed a strategic plan that begins with a realignment of
resources to better serve our customers.
Another key new initiative that involves every member of our management team, as well as our 13,000 Medco
employees, is our Change Management and Implementation (CMI) process. CMI is designed to bring us closer to
zero-defect execution in every critical process, and it has made meaningful differences already in terms of
accountability—aligning strategic, annual, and tactical goals—and in managing the business process to ensure that
objectives are met and return maximized. CMI, combined with our talented people and our Six Sigma operating
culture, enables us to deliver the kind of quality that will ensure our future as the unparalleled PBM leader.
with

7M E D C O H E A LT H S O L U T I O N S , I N C . 7
. , . (Not Pictured)Chairman, President, &Chief Executive Officer
. , .. , . .Senior Vice President,Medical Affairs & Chief Medical Officer
. Senior Vice President,Chief Marketing Officer
Senior Vice President, Human Resources
. Group President, National Accounts
. Executive Vice President,Chief Operating Officer
. Group President, Systemed
. Senior Vice President,Pharmaceutical Contracting
. Senior Vice President, Finance & Chief Financial Officer
. Group President, Key Accounts
. Senior Vice President, General Counsel & Secretary
. Group President, Health Plans
. Senior Vice President, Product & Business Development
A world-class company delivers a smooth and uniquely
tailored experience for every customer administratively,
clinically, and financially. Our leadership ensures that we
have the direction, the technology, the people, and the core
competencies to innovate creatively and deliver on that
promise. With our hands-on management team in place,
and our processes driving the quality of our operations,
Medco is well along on the journey to achieving world-class
status in every aspect of our business.
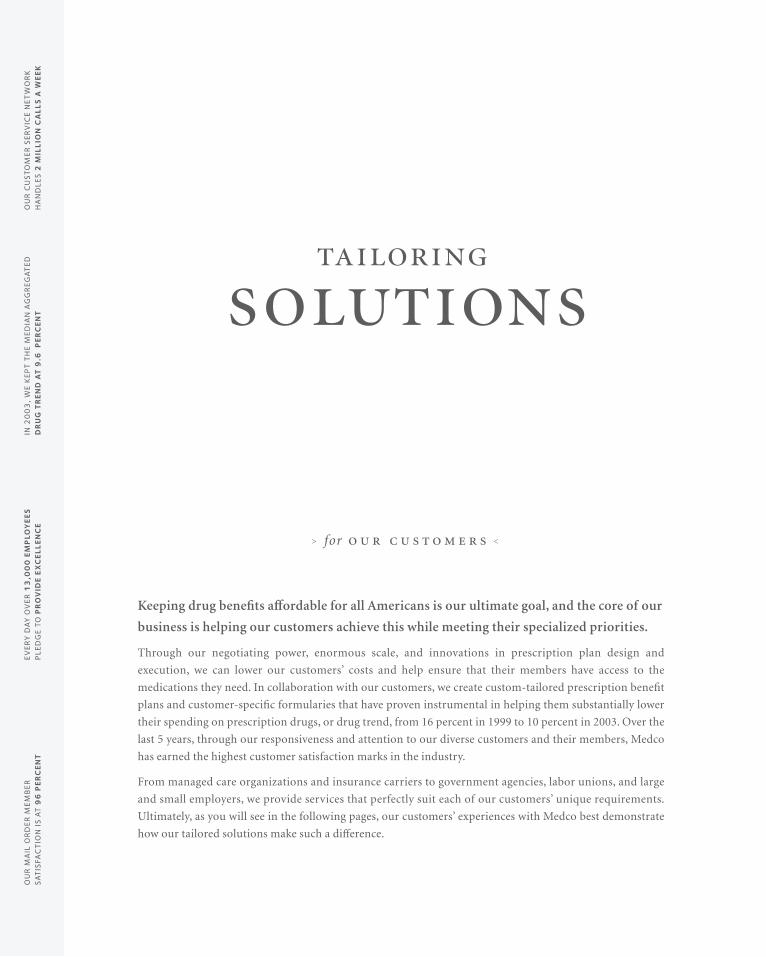
Keeping drug benefits affordable for all Americans is our ultimate goal, and the core of our
business is helping our customers achieve this while meeting their specialized priorities.
Through our negotiating power, enormous scale, and innovations in prescription plan design and
execution, we can lower our customers’ costs and help ensure that their members have access to the
medications they need. In collaboration with our customers, we create custom-tailored prescription benefit
plans and customer-specific formularies that have proven instrumental in helping them substantially lower
their spending on prescription drugs, or drug trend, from 16 percent in 1999 to 10 percent in 2003. Over the
last 5 years, through our responsiveness and attention to our diverse customers and their members, Medco
has earned the highest customer satisfaction marks in the industry.
From managed care organizations and insurance carriers to government agencies, labor unions, and large
and small employers, we provide services that perfectly suit each of our customers’ unique requirements.
Ultimately, as you will see in the following pages, our customers’ experiences with Medco best demonstrate
how our tailored solutions make such a difference.
> for <
EV
ER
Y D
AY
OV
ER
13
,00
0 E
MP
LOY
EE
S
PLE
DG
E T
O P
RO
VID
E E
XC
EL
LE
NC
EO
UR
MA
IL O
RD
ER
ME
MB
ER
SA
TIS
FAC
TIO
N I
S A
T 9
6 P
ER
CE
NT
OU
R C
US
TOM
ER
SE
RV
ICE
NE
TW
OR
KH
AN
DLE
S 2
MIL
LIO
N C
AL
LS
A W
EE
KIN
20
03
, W
E K
EP
T T
HE
ME
DIA
N A
GG
RE
GA
TE
DD
RU
G T
RE
ND
AT
9.6
PE
RC
EN
T

M E D C O H E A LT H S O L U T I O N S , I N C . 9
> <
> <
> <
“... .”
“... - .”
“ ,
.”

>
-
. ,
,
, .
>
’
, ’
.
>
()
, ,
.
M E D C O H E A LT H S O L U T I O N S , I N C . 1 1
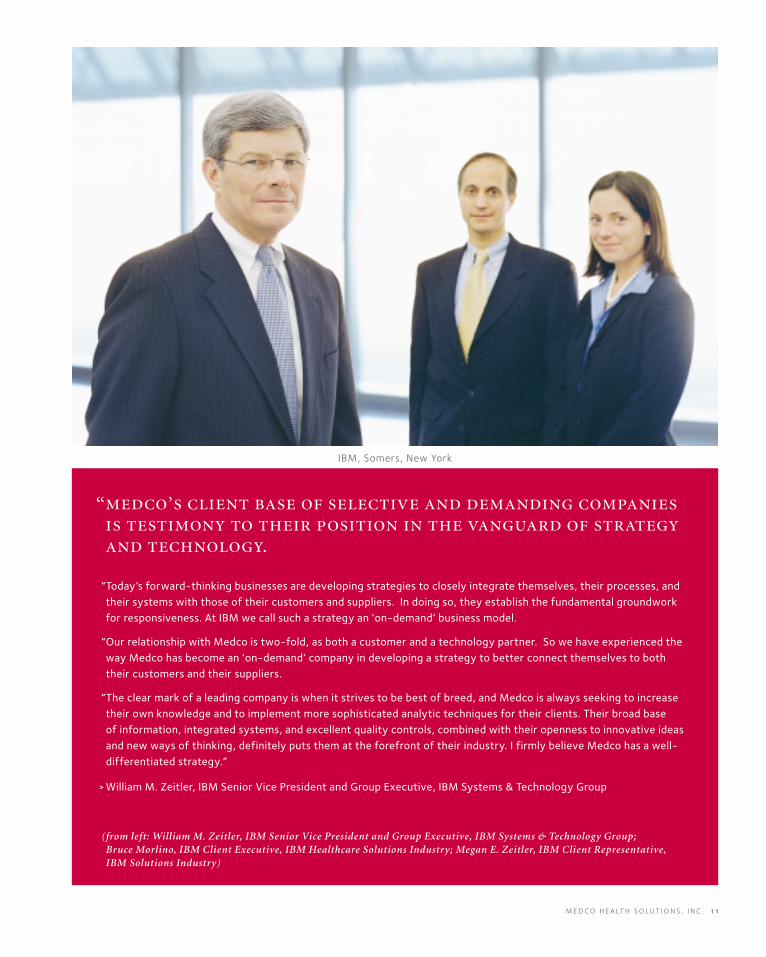
IBM, Somers, New York
“’ .
“Today’s forward-thinking businesses are developing strategies to closely integrate themselves, their processes, andtheir systems with those of their customers and suppliers. In doing so, they establish the fundamental groundworkfor responsiveness. At IBM we call such a strategy an ‘on-demand’ business model.
“Our relationship with Medco is two-fold, as both a customer and a technology partner. So we have experienced theway Medco has become an ‘on-demand’ company in developing a strategy to better connect themselves to boththeir customers and their suppliers.
“The clear mark of a leading company is when it strives to be best of breed, and Medco is always seeking to increasetheir own knowledge and to implement more sophisticated analytic techniques for their clients. Their broad baseof information, integrated systems, and excellent quality controls, combined with their openness to innovative ideasand new ways of thinking, definitely puts them at the forefront of their industry. I firmly believe Medco has a well-differentiated strategy.”
> William M. Zeitler, IBM Senior Vice President and Group Executive, IBM Systems & Technology Group
(from left: William M. Zeitler, IBM Senior Vice President and Group Executive, IBM Systems & Technology Group; Bruce Morlino, IBM Client Executive, IBM Healthcare Solutions Industry; Megan E. Zeitler, IBM Client Representative,IBM Solutions Industry)
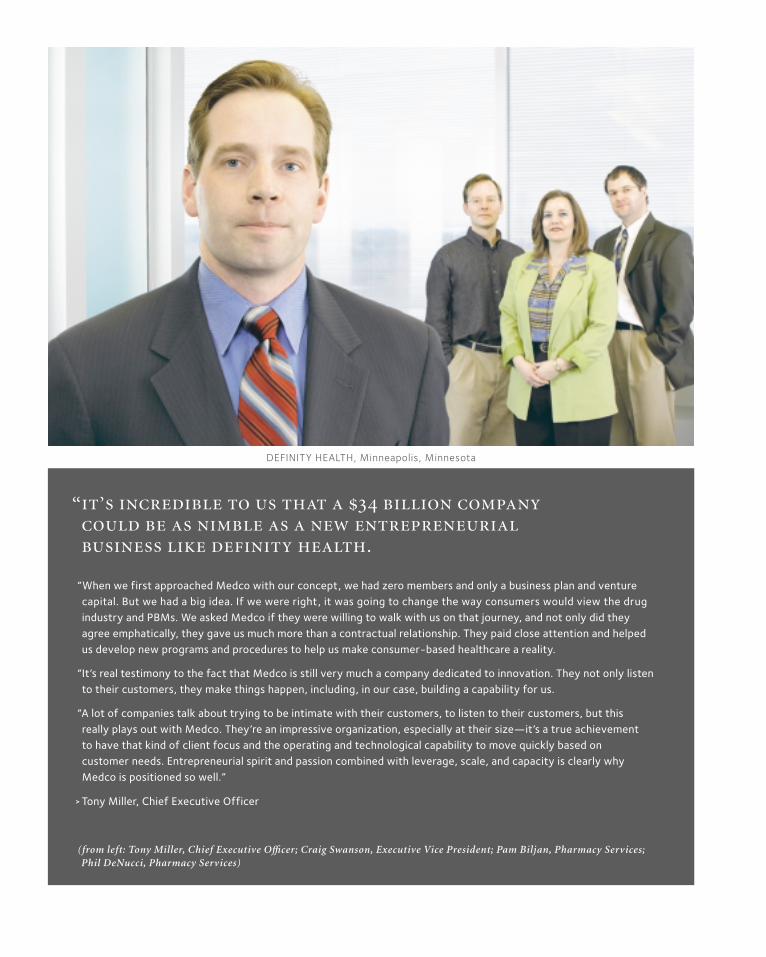
“’ .
“When we first approached Medco with our concept, we had zero members and only a business plan and venturecapital. But we had a big idea. If we were right, it was going to change the way consumers would view the drugindustry and PBMs. We asked Medco if they were willing to walk with us on that journey, and not only did they agree emphatically, they gave us much more than a contractual relationship. They paid close attention and helped us develop new programs and procedures to help us make consumer-based healthcare a reality.
“It’s real testimony to the fact that Medco is still very much a company dedicated to innovation. They not only listento their customers, they make things happen, including, in our case, building a capability for us.
“A lot of companies talk about trying to be intimate with their customers, to listen to their customers, but this really plays out with Medco. They’re an impressive organization, especially at their size—it’s a true achievement to have that kind of client focus and the operating and technological capability to move quickly based on customer needs. Entrepreneurial spirit and passion combined with leverage, scale, and capacity is clearly why Medco is positioned so well.”
DEFINITY HEALTH, Minneapolis, Minnesota
> Tony Miller, Chief Executive Officer
(from left: Tony Miller, Chief Executive Officer; Craig Swanson, Executive Vice President; Pam Biljan, Pharmacy Services; Phil DeNucci, Pharmacy Services)

M E D C O H E A LT H S O L U T I O N S , I N C . 1 3
“ , ‘ ’ .
“When we looked for a PBM for our complex system, Medco was the strongest for several reasons. The University ofTexas System and its employees are very focused on customer service because we deliver it ourselves. Since we’revery attentive to customer needs when it comes to our own employees, we would expect no less from our PBM. TheUniversity of Texas System has a large number of employees who are health professionals and very experienced and clinically knowledgeable about the services we’re delivering to them from Medco. That alone would suggest thatwe have the best possible PBM.
“Since we operate in a public setting, we need a PBM that can work effectively with outside scrutiny. Medco hasfacilitated forums with similar large public group plans so we can understand what our counterparts are doing.Together, we look at legislative issues and problem-solving techniques that might have individual or collective appli-cations. That’s going above and beyond.”
THE UNIVERSITY OF TEXAS SYSTEM, Austin, Texas
> Dan Stewart, Executive Director of Benefits Administration
(Dan Stewart, Executive Director of Benefits Administration)
“When you are responsible for delivering high-quality pharmaceutical healthcare
to more than 60 million people and managing approximately 10 million prescriptions
a week, member satisfaction is as critically important to us as it is to our customers.”
– David B. Snow, Jr., Chairman, President, & Chief Executive Officer
Safety, speed, and service are the hallmarks of every Medco member interaction. Our network of almost
60,000 retail pharmacies offers convenient service across the country, and with nearly 2,000 pharmacists on
our staff, as well as industry-leading mail order capabilities, we offer an unparalleled member experience.
Clinical safety always comes first, as demonstrated by our pharmacist-supervised drug utilization reviews
and innovative pediatric and senior drug review programs, which help assure member safety. Moreover, with
our proprietary methods and advanced robotics, we help ensure timely delivery of prescriptions while
providing the safest and most cost-effective way to fill a prescription through mail order.
Consistent with our mission to deliver value, we focus on productivity and efficiency for our customers and
their members. Our interactive voice response system, our “first-call resolution” customer service policy, and
our 24/7 pharmacist availability keep member satisfaction at extraordinary levels.
The following section describes our unparalleled patented process. The Medco Mail Order Service features
unique patented processes that include state-of-the-art safety procedures, world-class member service, and
maximum prescription savings.
-
> to ’ <
20
01
-20
03
WIL
SO
N R
X N
O.
1IN
CU
STO
ME
RS
AT
ISFA
CT
ION
3 Y
EA
RS
IN
A R
OW
AW
AR
DS
DE
MO
NS
TR
AT
ING
UN
PR
EC
ED
EN
TE
DA
CH
IEV
EM
EN
TS
IN
TH
E I
ND
US
TR
YJ.
D.
PO
WE
RA
ND
AS
SO
CIA
TE
S A
WA
RD
SFO
R C
US
TOM
ER
SA
TIS
FAC
TIO
N F
OU
RC
ON
SE
CU
TIV
E T
IME
S
20
03
JO
INT
CO
MM
ISS
ION
ON
AC
CR
ED
ITA
TIO
N
OF
HE
ALT
HC
AR
E O
RG
AN
IZA
TIO
NS
(JC
AH
O)
AC
CR
ED
ITA
TIO
N W
ITH
A P
ER
FEC
T 1
00
% S
CO
RE

M E D C O H E A LT H S O L U T I O N S , I N C . 1 5
1 > Superior Accessibility. It all begins with a doctor’s prescriptionthat a patient chooses to fill at our mail order pharmacy. The originalprescription can be faxed or phoned in by a physician or mailed in bya patient, and refills can be faxed, mailed, phoned, or ordered onlineby a patient at www.medco.com.
2 > Single Networked Platform. New prescriptions that arereceived by our automated pharmacies are scanned, allowingus to share and store documents across our network as wellas to help ensure accuracy and safety.
1 >
1 > 2 >

4 > Extensive Clinical Review. Pharmacists, aided by proprietarycomputer technology, review prescriptions for potentially harmfulinteractions. Prescriptions that require special attention are routed to pharmacists who are trained to solve a variety of issues,including calling a physician, benefit office, or member.
3 > Precision Prescription Entry. After the prescription has been logged, patient eligibility and any additional nonclinicalinformation are checked before electronically forwarding theprescription to a pharmacist.
4 >
3 > 4 >

M E D C O H E A LT H S O L U T I O N S , I N C . 1 7
6 > Advanced Robotic Dispensing. After the prescription bottle has been labeled and scanned, tablets and capsules are electronicallycounted and dispensed and then sent to high-speed capping machines.
5 > Systematic Checks. The prescription information is theninstantaneously transferred to one of our automated dispensingpharmacies. The heart of these automated pharmacies is the Command Center, which prioritizes orders and monitors thedispensing of each prescription. Bar code technology is usedextensively to precisely track each individual prescription.
5 >
5 > 6 > 6 >
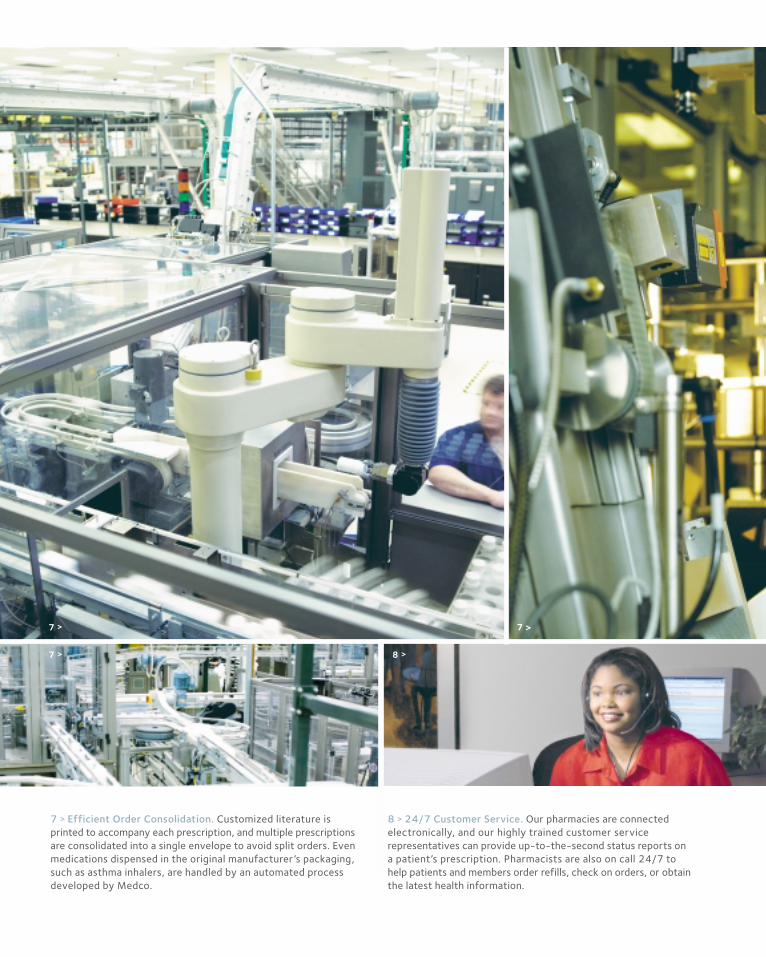
8 > 24/7 Customer Service. Our pharmacies are connectedelectronically, and our highly trained customer servicerepresentatives can provide up-to-the-second status reports ona patient’s prescription. Pharmacists are also on call 24/7 tohelp patients and members order refills, check on orders, or obtain the latest health information.
7 > Efficient Order Consolidation. Customized literature is printed to accompany each prescription, and multiple prescriptionsare consolidated into a single envelope to avoid split orders. Evenmedications dispensed in the original manufacturer’s packaging,such as asthma inhalers, are handled by an automated processdeveloped by Medco.
7 >
7 > 8 >
7 >

M E D C O H E A LT H S O L U T I O N S , I N C . 1 9
10 > Unequaled Mail Order. The Medco Mail Order Service, withour proprietary, patented system, results in a safe way to fill aprescription, enhance member satisfaction, and maximize savings.
9 > Prompt Turnaround. Our systems are designed to enable us to presort packages, thereby ensuring faster mail processing.
9 >
10 >10 >
Medco’s business continues to grow as our customers and our customers’ customers
recognize the attractive economics and high quality of the solutions we have to offer.
Over the past 5 years, we have expanded our business and increased our bottom line.
This kind of growth comes from a deliberate strategy of staying at the forefront of the industry—in
knowledge, innovation, technology, and in pioneering products and services. In addition, we have expanded
our business organically, building our services and technology from the ground up, planning each move
with solid reasoning behind it and financial potential in front of it.
Currently, there are significant trends positively affecting our industry, including the increasing use of
mail order pharmacies, the unprecedented number of brand-name drugs going off patent, the growth
of specialty and biotech pharmaceuticals, and the dramatic expansion of the Medicare program to cover
prescription drugs. Medco is well positioned to capture the great potential in these four areas. To each
of them we bring the kind of expertise to which others only aspire, and the kind of growth potential that
our shareholders value.
> for <
ME
DC
O I
S O
NE
OF
AM
ER
ICA
’S L
AR
GE
ST
PU
RC
HA
SE
RS
OF
GE
NE
RIC
DR
UG
SM
ED
CO
MA
IL O
RD
ER
SE
RV
ICE
FILL
ED
7
8 M
ILL
ION
PR
ES
CR
IPT
ION
S I
N 2
00
3
ME
DC
O I
S A
PA
RT
OF
TH
E S
OL
UT
IO
N
INL
OW
ER
IN
G D
RU
G T
RE
ND
ME
DC
O E
NS
UR
ES
TH
AT
TH
E R
IGH
T D
RU
GS
AR
E G
OIN
G T
O T
HE
RIG
HT
PE
OP
LE
M E D C O H E A LT H S O L U T I O N S , I N C . 2 1
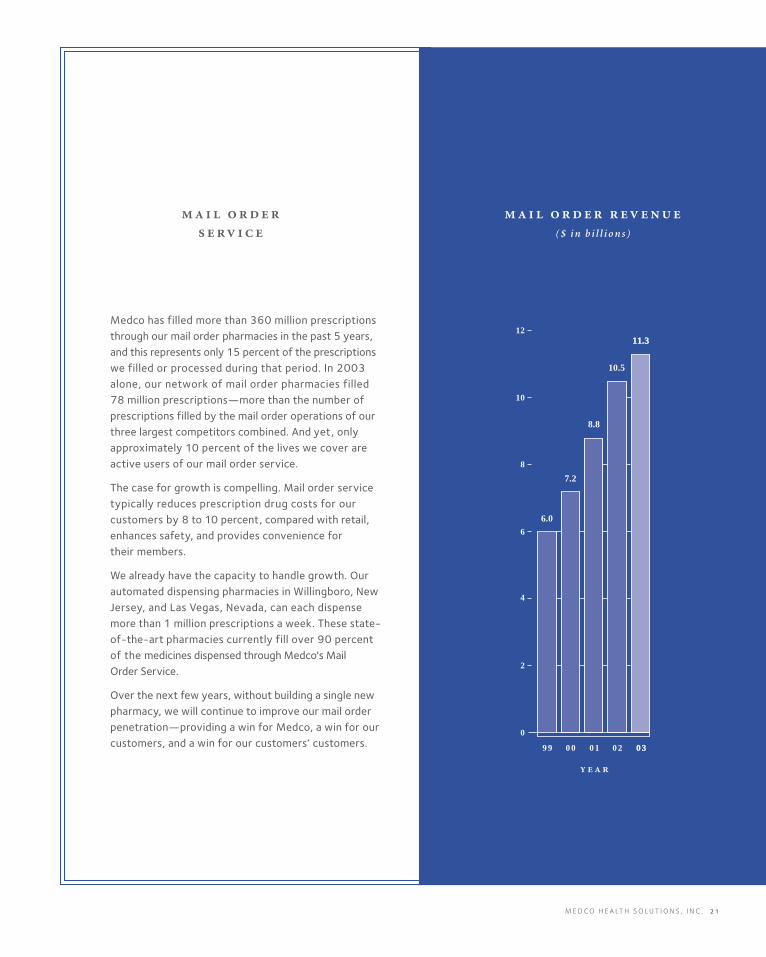
Medco has filled more than 360 million prescriptionsthrough our mail order pharmacies in the past 5 years,and this represents only 15 percent of the prescriptionswe filled or processed during that period. In 2003alone, our network of mail order pharmacies filled 78 million prescriptions—more than the number of prescriptions filled by the mail order operations of ourthree largest competitors combined. And yet, onlyapproximately 10 percent of the lives we cover areactive users of our mail order service.
The case for growth is compelling. Mail order servicetypically reduces prescription drug costs for ourcustomers by 8 to 10 percent, compared with retail,enhances safety, and provides convenience fortheir members.
We already have the capacity to handle growth. Ourautomated dispensing pharmacies in Willingboro, NewJersey, and Las Vegas, Nevada, can each dispense more than 1 million prescriptions a week. These state-of-the-art pharmacies currently fill over 90 percentof the medicines dispensed through Medco's Mail Order Service.
Over the next few years, without building a single newpharmacy, we will continue to improve our mail orderpenetration—providing a win for Medco, a win for ourcustomers, and a win for our customers’ customers.
9 9 0 0 0 1 0 2 0 30 3
6.0
7.2
8.8
10.5
11.311.3
0
2
4
6
8
10
12
( $ i n b i l l i o n s )
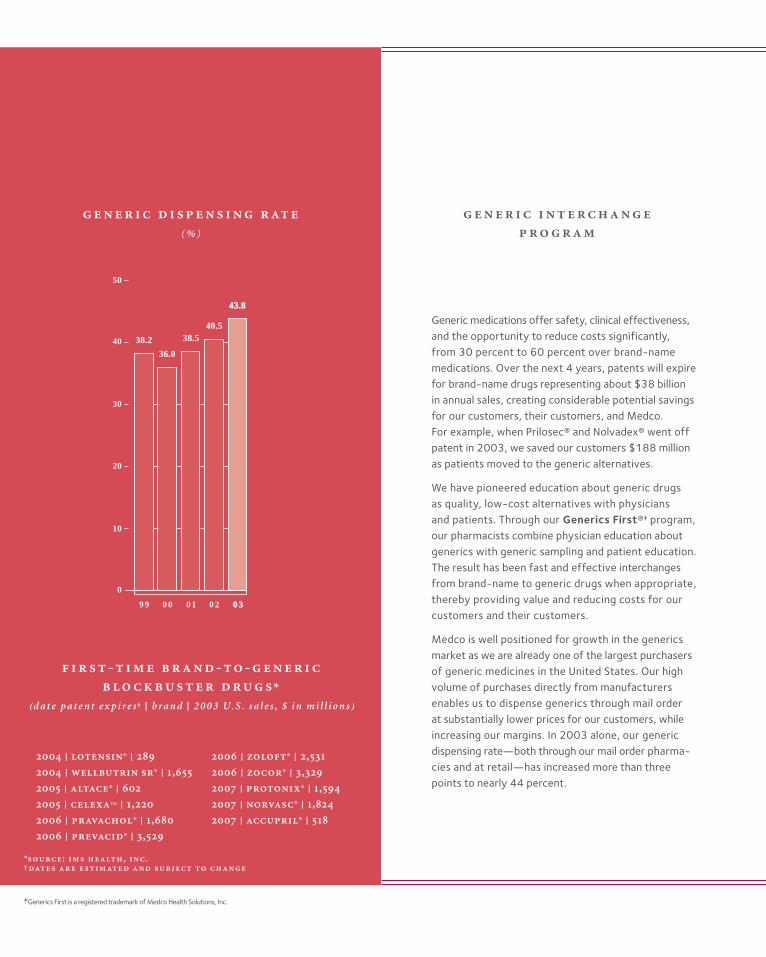
38.2
36.0
38.540.5
43.843.8
0
10
20
30
40
50
9 9 0 0 0 1 0 2 0 30 3
Generic medications offer safety, clinical effectiveness,and the opportunity to reduce costs significantly,from 30 percent to 60 percent over brand-namemedications. Over the next 4 years, patents will expirefor brand-name drugs representing about $38 billion in annual sales, creating considerable potential savingsfor our customers, their customers, and Medco. For example, when Prilosec® and Nolvadex® went offpatent in 2003, we saved our customers $188 millionas patients moved to the generic alternatives.
We have pioneered education about generic drugs as quality, low-cost alternatives with physicians and patients. Through our Generics First®‡ program, our pharmacists combine physician education aboutgenerics with generic sampling and patient education.The result has been fast and effective interchangesfrom brand-name to generic drugs when appropriate,thereby providing value and reducing costs for ourcustomers and their customers.
Medco is well positioned for growth in the genericsmarket as we are already one of the largest purchasersof generic medicines in the United States. Our highvolume of purchases directly from manufacturersenables us to dispense generics through mail orderat substantially lower prices for our customers, whileincreasing our margins. In 2003 alone, our genericdispensing rate—both through our mail order pharma-cies and at retail—has increased more than threepoints to nearly 44 percent.
( % )
- - - *
⁽ d a t e p a t e n t e x p i r e s † | b r a n d | 2 0 0 3 U. S . s a l e s , $ i n m i l l i o n s ⁾
| ® |
| ® | ,
| ® |
| ™ | ,
| ® | ,
| ® | ,
| ® | ,
| ® | ,
| ® | ,
| ® | ,
| ® |
*: , .†
‡Generics First is a registered trademark of Medco Health Solutions, Inc.
M E D C O H E A LT H S O L U T I O N S , I N C . 2 3
0
1
2
3
4
5
6
7
0 3 0 3 0 3 0 40 4
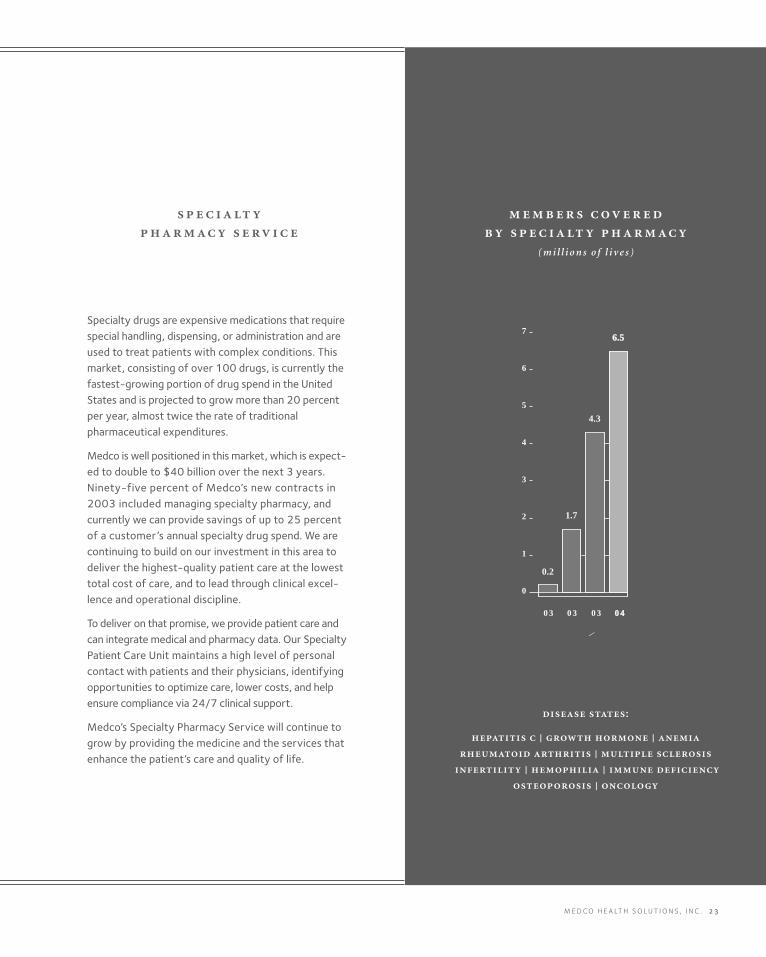
0.2
1.7
4.3
6.56.5
⁄
Specialty drugs are expensive medications that requirespecial handling, dispensing, or administration and areused to treat patients with complex conditions. Thismarket, consisting of over 100 drugs, is currently thefastest-growing portion of drug spend in the UnitedStates and is projected to grow more than 20 percent per year, almost twice the rate of traditionalpharmaceutical expenditures.
Medco is well positioned in this market, which is expect-ed to double to $40 billion over the next 3 years.Ninety-five percent of Medco’s new contracts in2003 included managing specialty pharmacy, and currently we can provide savings of up to 25 percent of a customer’s annual specialty drug spend. We arecontinuing to build on our investment in this area todeliver the highest-quality patient care at the lowesttotal cost of care, and to lead through clinical excel-lence and operational discipline.
To deliver on that promise, we provide patient care andcan integrate medical and pharmacy data. Our SpecialtyPatient Care Unit maintains a high level of personalcontact with patients and their physicians, identifyingopportunities to optimize care, lower costs, and helpensure compliance via 24/7 clinical support.
Medco’s Specialty Pharmacy Service will continue togrow by providing the medicine and the services thatenhance the patient’s care and quality of life.
( m i l l i o n s o f l i v e s )
:
| |
|
| |
|

0
10
20
30
40
50
60
70
80
4042
46
53
61
70
77
0 1 0 5 E 1 0 E 1 5 E 2 0 E 2 5 E 3 0 E
0
225
450
675
900
1,125
1,350
1,575
1,800
207
338
660
1,226
1,625
1,349
<19 20-34 35-49 50-64 65-79 80+
The largest independent PBMs manage about half of the total drug spend in the United States, and weconsider the other half our core opportunity—beginning with the Medicare drug benefit that isexpected to debut, first as a discount card program, in mid-2004. The landmark legislation to modernizeMedicare with a prescription drug benefit estimated at more than $530 billion over the next 10 years willenable us to extend our market-based tools, whichhave so effectively managed drug spending in theprivate sector, to assist America’s seniors.
Medco already administers discount drug cards formore than 1.7 million members—and we look forwardto being part of the solution in extending lowerprices, improving service, and providing higher levelsof safety to America’s senior citizens. We are activelyengaged in developing offerings for the upcomingdiscount card program and for the permanent benefit,which is expected to be implemented starting in 2006.
Building on our extensive experience with retireesacross our population, our current profitably adminis-tered discount card programs, and our expertise ingenerics and mail order services, we believe Medicarereform will be positive for our business, as well as good public policy.
†
( i n m i l l i o n s )
*
( i n d o l l a r s )
*: †: ⁽⁾
Accupril® (quinapril HCl) is a registered trademark of Pfizer Inc; Altace® (ramipril) is a registered trademark of King Pharmaceuticals, Inc.; Celexa™ (citalopram hydrobromide) is a trademark of Forest Pharmaceuticals, Inc.; Lotensin®(benazepril HCl) is a registered trademark of Novartis Pharmaceuticals Corporation; Nolvadex® (tamoxifen citrate) is a registered trademark of AstraZeneca Pharmaceuticals L.P.; Norvasc® (amlodipine besylate) is a registered trademarkof Pfizer Inc; Pravachol® (pravastatin sodium) is a registered trademark of Bristol-Myers Squibb Company; Prevacid® (lansoprazole) is a registered trademark of TAP Pharmaceuticals Inc.; Prilosec® (omeprazole) is a registered trademarkof AstraZeneca Pharmaceuticals L.P.; Protonix® (pantoprazole sodium sesquihydrate) is a registered trademark of Wyeth Pharmaceuticals; Wellbutrin SR® (bupropion HCl) is a registered trademark of GlaxoSmithKline; Zocor®(simvastatin) is a registered trademark of Merck & Co., Inc.; Zoloft® (sertraline HCl) is a registered trademark of Pfizer Inc.
M E D C O H E A LT H S O L U T I O N S , I N C . 2 5
’
’
’
,
We are one of the nation’s largest prescription benefit man-
agers, and we provide sophisticated programs and services for
our clients and the members of their prescription benefit
plans, as well as for the physicians and pharmacies the mem-
bers use. We were acquired as a wholly-owned subsidiary of
Merck and Co., Inc., (“Merck”) on November 18, 1993, and
were spun off as a separate publicly traded enterprise (“the
separation”) on August 19, 2003. Our programs and services
help our clients control the cost and enhance the quality of
the prescription drug benefits they offer to their members.
We accomplish this by providing prescription benefit man-
agement (“PBM”) services through our national networks of
retail pharmacies and our own mail order pharmacies. We
have a large number of clients in each of the major industry
categories, including Blue Cross/Blue Shield plans; managed
care organizations; insurance carriers; third-party benefit
plan administrators; employers; federal, state and local gov-
ernment agencies; and union-sponsored benefit plans.
We operate in a competitive market that is characterized by
pricing and margin pressures as clients seek to control the
growth in the cost of providing prescription drug benefits to
their members. Prescription drug costs have risen consider-
ably over the past several years, largely as a result of inflation
on brand-name products and the introduction of new prod-
ucts produced by pharmaceutical manufacturers. These pre-
scription drug cost increases, known as drug trend, have
garnered significant attention throughout the United States as
they contribute significantly to the rise in the national cost of
healthcare. Our business model is designed to reduce this
level of drug trend.
The complicated environment in which we operate presents
us with opportunities, challenges and risks. Our customers
are paramount to our success; and the retention of these cus-
tomers and winning new customers poses the greatest
opportunity, and the loss thereof represents an ongoing risk.
The preservation of our relationships with pharmaceutical
manufacturers and retail pharmacies is very important to the
execution of our business strategies going forward. In addi-
tion, in large part because of the current political focus in the
United States on the cost of prescription drugs, we are the
subject of lawsuits and negative press, even though our pri-
mary mission is to curb the costs at issue.
Medco Health Solutions, Inc. ’
Management reviews the following indicators in analyzing
our consolidated financial performance: net revenues, with a
particular focus on mail order revenue, adjusted prescription
volume, generic penetration, gross margin percentage,
diluted earnings per share, Earnings Before Interest
Income/Expense, Taxes, Depreciation, and Amortization
(“EBITDA”) and EBITDA per adjusted prescription.
We believe these measures are important in evaluating our
overall performance and highlight key business trends. These
measures are also reflective of the success of our execution of
strategic objectives.
Our net income increased by 18% to $426 million in 2003.
Our 2003 EBITDA per adjusted prescription increased 21%
to $1.50. While our total net revenues grew by 4% to over
$34 billion, our total cost of revenues increased at the lower
rate of 3.7%, which resulted in a gross margin percentage
improvement to 4.4% in 2003 from 3.9% in 2002. Our gross
margin improvement contributed $221 million to our growth
in income before provision for income taxes of $108 million,
with a partial offset from $99 million in increased selling,
general and administrative expenses, and interest and intan-
gible amortization growth totaling $14 million. Our results of
operations in 2003 also include $69 million of restructuring
expenses on a pre-tax basis. Approximately $46 million of
these restructuring costs are recorded in cost of revenues,
with the remaining $23 million reflected in selling, general
and administrative expenses.
Our revenue continued to increase despite a 4.4% decline in
mail order prescription volume and a 2.7% decline in retail
volume, with these volume declines primarily the result of the
loss of clients in 2002, and the decision not to renew a mail
order only client in early 2003. The revenue growth is caused
by overall higher prices charged by brand-name pharmaceuti-
cal manufacturers, reflecting inflation and the introduction of
newer higher-cost medications. This growth was partially off-
set by the volume declines from lost business and lower utiliza-
tion growth and steeper discounting to our clients. The
discounts are associated with increased utilization of generic
drugs by our customers’ membership. Our percentage of
prescriptions dispensed that were generics increased to 43.8%
in 2003 compared to 40.5% in 2002.
This increase in generic utilization not only saves our clients
and their membership in drug costs, but it also is a key con-
tributor to our 2003 margin growth, particularly in mail
order, because we are able to purchase significant quantities of
generic drugs for our mail order pharmacies at greater vol-
ume discounts than brand-name drugs. Further contributing
to our gross margin improvement are improved brand phar-
maceutical manufacturer rebates, reflecting improved formu-
lary management as well as the achievement of market share
requirements. In 2002, market share requirements were
reestablished as a result of new or renegotiated contracts,
essentially increasing performance requirements for earning
rebates. The majority of these rebates are shared with our
clients in the form of direct rebate pass-backs, guarantees, and
steeper pricing discounts, which ultimately benefit our clients
and their members through lower drug costs.
The efficiency of our operations is critical to sustaining our
profitability, since we are a low-margin business with only a
small percentage of our revenue flowing to net income. We
have continued to yield productivity improvements from our
significant historical investments in pharmacy automation,
internet and integrated voice-response technologies. The
drive to further optimize our efficiency resulted in charges
against our cost of product net revenues of $46 million for
severance and accelerated depreciation costs related to
affected pharmacies and call centers from decisions to stream-
line our operations and maximize leverage from our auto-
mated technologies.
Our selling, general and administrative expenses increased by
$99 million, primarily from increased information technol-
ogy and related depreciation expenses. Included in this
expense category in 2003 are severance charges of $23 mil-
lion from programs designed to further improve produc-
tivity in our corporate functions. Our intangible asset
amortization expense increased over 2002 from a change in
amortization lives, and our net interest expense increased
due to debt we incurred as a result of our separation from
Merck, with a debt balance of approximately $1.4 billion out-
standing at year-end 2003.
’ ( )
M E D C O H E A LT H S O L U T I O N S , I N C . 2 7
. Our net
revenues are derived primarily from the sale of prescrip-
tion drugs through our networks of contractually affiliated
retail pharmacies and through our mail order pharmacies,
and are recorded net of certain rebates and guarantees
payable to clients. For further details see our critical account-
ing policies included in “Use of Estimates and Critical
Accounting Policies” below and Note 2 to our consolidated
financial statements included in this annual report.
Cost of revenues for prescriptions dispensed through our net-
work of retail pharmacies includes the contractual cost of
drugs dispensed by, and professional fees paid to, retail phar-
macies in the networks. Our cost of revenues relating to drugs
dispensed by our mail order pharmacies consists primarily of
the cost of inventory dispensed and our costs incurred to
process and dispense the prescriptions, including the associ-
ated depreciation. The operating costs of our call center phar-
macies are also included in cost of revenues. In addition, cost
of revenues for both retail sales and mail order sales includes a
credit for rebates earned from brand pharmaceutical manu-
facturers whose drugs are included in our formularies. These
rebates generally take the form of formulary rebates, which
are earned based on the volume of a specific drug dispensed,
or market share rebates, which are earned based on the
achievement of contractually specified market share levels for
prescription drugs.
Selling, general and administrative expenses reflect the costs
of operations dedicated to generating new sales, maintaining
existing customer relationships, managing clinical programs,
enhancing technology capabilities, directing pharmacy oper-
ations and other staff activities. Our historical financial state-
ments also include allocations of costs relating to certain
corporate functions provided by Merck prior to the separa-
tion date, including finance, legal, public affairs, executive
oversight, human resources, procurement and other services.
Interest and other (income) expense, net primarily includes
interest expense on debt incurred as a result of our separa-
tion from Merck, partially offset by interest income gener-
ated by short-term investments in marketable securities.
. Our key assets include cash and short-
term investments, accounts receivable, inventories, fixed
assets, goodwill and intangibles. Cash reflects the positive
cash flow from our operations. Accounts receivable primarily
represents amounts due from clients for prescriptions dis-
pensed from retail pharmacies in our networks or from
prescription drugs received by members from our mail order
pharmacies, including fees due to us, net of any rebate liabili-
ties or payments due to clients under guarantees. Accounts
receivable also include amounts due from pharmaceutical
manufacturers for earned rebates and other prescription
services. Inventories reflect the cost of prescription products
held for dispensing by our mail order pharmacies and are
recorded on a first-in, first-out basis. Fixed assets include our
investment in mail order pharmacies, call center pharmacies,
and information technology, including capitalized software
development. The net goodwill and intangible assets are
comprised primarily of the push-down of goodwill and
intangibles related to our acquisition in 1993 by Merck.
Our primary liabilities include claims and other accounts
payable, accrued expenses and other current liabilities, debt
and deferred tax liabilities. Claims and other accounts
payable primarily consist of amounts payable to retail net-
work pharmacies for prescriptions dispensed and services
rendered, and amounts payable for mail order prescription
inventory purchases. Accrued expenses and other current lia-
bilities primarily consist of employee- and facility-related
cost accruals incurred in the normal course of business, as
well as income taxes payable. In conjunction with our separa-
tion from Merck, we incurred debt, the proceeds of which
were paid to Merck in the form of a dividend. In addition, we
have a deferred tax liability primarily associated with our
recorded intangible assets. We do not have any off-balance
sheet entities.
. An important element of our operatingcash flow is the timing of billing cycles, which are two-week periods of accumulated prescription administrationbillings for retail and mail order prescriptions. We bill the cycle activity to clients on this bi-weekly schedule and generally collect before we pay our obligations to theretail pharmacies for that same cycle. Thus, at the end of
any given reporting period, unbilled receivables will rep-resent up to two weeks of dispensing activity to clientsand will fluctuate at the end of a fiscal month dependingon the timing of these billing cycles. We pay for prescrip-tion drug inventory in accordance with payment termsoffered by our suppliers to take advantage of appropriatediscounts. Effective mail order inventory managementfurther generates positive cash flows. Pharmaceuticalmanufacturers’ rebates are recorded as earned on amonthly basis, with actual bills generally rendered on aquarterly basis and paid by the manufacturers within an agreed-upon term. Payments of rebates to clients are generally made after our receipt of the rebates from thepharmaceutical manufacturers.
Prior to the separation, cash was swept by Merck on a daily
basis and was reflected in our consolidated statement of cash
flows in intercompany transfer from (to) Merck and in our
consolidated balance sheet as “Due from Merck, net.” Subse-
quent to the separation, we are managing our own cash and
investments. Our cash primarily includes demand deposits
with banks or other financial institutions. Our short-term
investments include certificates of deposit and U.S. govern-
ment securities that have average maturities of less than one
year and that are held to satisfy statutory capital requirements
for our insurance subsidiaries.
Ongoing cash outflows are associated with expenditures to
support our mail order and retail pharmacy network opera-
tions, call center pharmacies and other selling, general and
administrative functions. The largest components of these
expenditures include mail order inventory purchases prima-
rily from a wholesaler, retail pharmacy payments, rebate and
guarantee payments to clients, employee payroll and benefits,
operating expenses, capital expenditures, interest and princi-
pal payments on our debt and income taxes.
-
We began providing PBM services in the second quarter of
2000 to UnitedHealth Group under a five-year contract.
Revenues from UnitedHealth Group, which is currently our
largest client, amounted to approximately $6,100 million, or
18% of our net revenues in 2003, approximately $5,300 mil-
lion, or 16% of our net revenues in 2002, and approximately
$4,600 million, or 16% of our net revenues in 2001. On
January 12, 2004, we announced an early renewal agreement
to provide PBM services, including mail order, to
UnitedHealth Group effective January 1, 2004, for an initial
five-year term. At UnitedHealth Group’s option, the agree-
ment may be extended for three additional years through
2011. None of our other clients individually represented more
than 10% of our net revenues in 2003.
We conduct our operations in one segment, which involves
sales of prescription drugs to members of our clients, either
through our networks of contractually affiliated retail phar-
macies or by our mail order pharmacies, and in one geo-
graphic region: the United States and Puerto Rico. We offer
fully integrated PBM services to virtually all of our clients
and their members. The PBM services we provide to our
clients are generally delivered and managed under a single
contract for each client.
Rebate contracts with pharmaceutical manufacturers of
brand-name drugs are negotiated on an enterprise-wide level
based on our consolidated retail and mail order prescription
volumes. We believe the level of rebates we are able to negoti-
ate significantly benefits from our substantial mail order vol-
ume because we are able to achieve a higher level of
formulary compliance in mail order than in retail. As a result,
although the rebate contracts generate rebates on retail and
mail order prescriptions equally on the basis of drug cost, it is
not practicable to determine the true value of rebates earned
specifically on retail or mail order prescription volume.
Certain elements of our cost structure are identifiable
between retail and mail order. In the case of retail, we are
able to separately identify the drug ingredient costs and pro-
fessional fees we pay to retail pharmacies in our networks of
affiliated pharmacies. In the case of mail order, we are able to
identify the costs to operate our mail order pharmacies, and
inventory procurement costs. It is not practicable to sepa-
rately identify certain other costs, the most substantial of
which are our call center costs relating to retail and mail
order. Calls from members may relate to general plan design
’ ( )
M E D C O H E A LT H S O L U T I O N S , I N C . 2 9
a single segment enterprise for purposes of making decisions
about resource allocations and in assessing our performance.
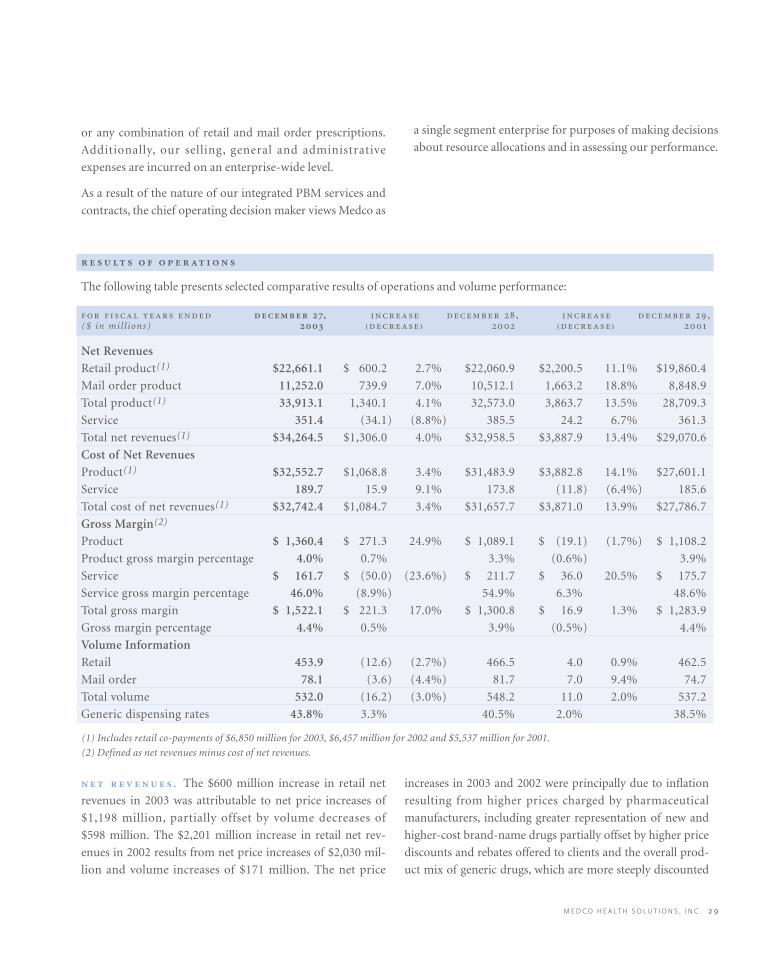
The following table presents selected comparative results of operations and volume performance:
, , ,($ in mil l ions) ₍₎ ₍₎
Net Revenues
Retail product(1) $22,661.1 $ 600.2 2.7% $22,060.9 $2,200.5 11.1% $19,860.4
Mail order product 11,252.0 739.9 7.0% 10,512.1 1,663.2 18.8% 8,848.9
Total product(1) 33,913.1 1,340.1 4.1% 32,573.0 3,863.7 13.5% 28,709.3
Service 351.4 (34.1) (8.8%) 385.5 24.2 6.7% 361.3
Total net revenues(1) $34,264.5 $1,306.0 4.0% $32,958.5 $3,887.9 13.4% $29,070.6
Cost of Net Revenues
Product(1) $32,552.7 $1,068.8 3.4% $31,483.9 $3,882.8 14.1% $27,601.1
Service 189.7 15.9 9.1% 173.8 (11.8) (6.4%) 185.6
Total cost of net revenues(1) $32,742.4 $1,084.7 3.4% $31,657.7 $3,871.0 13.9% $27,786.7
Gross Margin(2)
Product $ 1,360.4 $ 271.3 24.9% $ 1,089.1 $ (19.1) (1.7%) $ 1,108.2
Product gross margin percentage 4.0% 0.7% 3.3% (0.6%) 3.9%
Service $ 161.7 $ (50.0) (23.6%) $ 211.7 $ 36.0 20.5% $ 175.7
Service gross margin percentage 46.0% (8.9%) 54.9% 6.3% 48.6%
Total gross margin $ 1,522.1 $ 221.3 17.0% $ 1,300.8 $ 16.9 1.3% $ 1,283.9
Gross margin percentage 4.4% 0.5% 3.9% (0.5%) 4.4%
Volume Information
Retail 453.9 (12.6) (2.7%) 466.5 4.0 0.9% 462.5
Mail order 78.1 (3.6) (4.4%) 81.7 7.0 9.4% 74.7
Total volume 532.0 (16.2) (3.0%) 548.2 11.0 2.0% 537.2
Generic dispensing rates 43.8% 3.3% 40.5% 2.0% 38.5%
(1) Includes retail co-payments of $6,850 million for 2003, $6,457 million for 2002 and $5,537 million for 2001.
(2) Defined as net revenues minus cost of net revenues.
. The $600 million increase in retail net
revenues in 2003 was attributable to net price increases of
$1,198 million, partially offset by volume decreases of
$598 million. The $2,201 million increase in retail net rev-
enues in 2002 results from net price increases of $2,030 mil-
lion and volume increases of $171 million. The net price
increases in 2003 and 2002 were principally due to inflation
resulting from higher prices charged by pharmaceutical
manufacturers, including greater representation of new and
higher-cost brand-name drugs partially offset by higher price
discounts and rebates offered to clients and the overall prod-
uct mix of generic drugs, which are more steeply discounted
or any combination of retail and mail order prescriptions.
Additionally, our selling, general and administrative
expenses are incurred on an enterprise-wide level.
As a result of the nature of our integrated PBM services and
contracts, the chief operating decision maker views Medco as
’ ( )
fees on a per-prescription basis and lower prescription vol-
umes, as well as lower prescription services and data fees
from pharmaceutical manufacturers of $8 million. The 2002
increase of $24 million resulted primarily from higher sales
of prescription services and data to pharmaceutical manu-
facturers of $34 million, partially offset by a $10 million
decline from decreasing client administrative fees on a per-
prescription basis.
. The product gross margin percentage
improved 0.7 points in 2003, reflecting a 4.1% increase in
product net revenues as discussed in the above net revenue
analysis compared with a corresponding increase in cost of
product net revenues of 3.4%. The lower rate of increase in
the cost of product net revenues compared with product net
revenues is principally due to greater utilization of lower-cost
generic products and higher rebates earned from pharma-
ceutical manufacturers through improved formulary man-
agement. The increase in rebates earned in 2003 reflects the
achievement of market share requirements in multiyear
pharmaceutical manufacturer contracts that were renegoti-
ated in 2002, as well as the impact of higher levels of rebates
due to new products and renegotiated terms on existing
products in 2003. Partially offsetting these 2003 cost
improvements were a $15 million charge for adverse
purchase commitments, and severance and accelerated
depreciation costs amounting to $46 million as a result of
management decisions to close or reallocate resources in cer-
tain mail order and call center operations. These actions
realign pharmacy operations to retire older facilities and
rebalance volume to facilities closer to our members.
The product gross margin percentage declined 0.6 points in
2002, reflecting a 13.5% increase in product net revenues as
discussed in the net revenue analysis above compared with a
corresponding cost of product net revenues increase of
14.1%. The higher rate of increase in the cost of product net
revenues compared with product net revenues results from a
decline in rebates earned associated with higher market share
requirements in the aforementioned renegotiated pharma-
ceutical manufacturer contracts, higher depreciation from
investments in pharmacy and call center technology and
operating costs associated with new business initiated at the
beginning of 2002.
than brand-name drugs. Included in 2003 retail net revenues
are the favorable impact of a $15 million client dispute settle-
ment offset by $16 million of increased reserves associated
with other price and related disputes with clients. Retail vol-
ume decreased 2.7% for 2003 compared with 2002, primarily
as a result of client losses and lower utilization growth rates.
The 2003 retail volume decrease reflects an 8.5% decline
resulting from client losses, partially offset by a 5.8% increase
resulting from higher prescription drug utilization and vol-
umes from new clients. The 2002 retail volume increase of
0.9% results from increased utilization.
The $740 million increase in mail order net revenues in 2003
was attributable to net price increases of $1,202 million,
partially offset by volume decreases of $462 million. The
$1,663 million increase in mail order net revenues in 2002
was attributable to volume increases of $832 million and net
price increases of $831 million. The net price increases in
2003 and 2002 were principally due to inflation resulting
from higher prices charged by pharmaceutical manufactur-
ers, including greater representation of new and higher-cost
brand-name drugs, offset by an increase in the product mix
of generic drugs, which are discounted more steeply than
brand-name drugs. Mail order net revenues in 2003 also
reflect higher client service guarantee costs of $27 million,
partially offset by $11 million for favorable closure on guar-
antees related to former clients. Mail order volume decreased
4.4% in 2003, primarily as a result of client losses, including
our decision not to renew a mail order only client in early
2003. The 2003 mail order volume reflects an 11.9% decline
resulting from client terminations, partially offset by a 7.5%
increase resulting from higher prescription drug utilization
and volumes from new clients. The mail order volume
increase of 9.4% in 2002 resulted from client plan design
changes in support of mail order utilization.
Generic drug usage increased by 3.3 points in 2003 and
2.0 points in 2002. These increases reflect the impact of client
plan design changes promoting the use of lower-cost and
more steeply discounted generics, our programs to further
support generic utilization, and the introduction of new
generic products during these periods.
Service revenues declined $34 million in 2003 as a result of
lower client administrative fees of $26 million from decreased
M E D C O H E A LT H S O L U T I O N S , I N C . 3 1
,
. Selling, general and administrative expenses for
2003 of $686 million exceeded 2002 by $99 million, or 16.8%.
Selling, general and administrative expenses for 2002 of
$588 million exceeded 2001 by $9 million, or 1.6%. The 2003
increase is primarily attributable to higher expenses related
to information systems technology including depreciation of
$63 million and expenses related to the additional services
required to operate as a public company. These additional
expenses associated with our operation as an independent
enterprise totaled $22 million in 2003. We also incurred
higher non-income taxes of $14 million and earned compen-
sation expense for restricted stock units of $5 million.
In 2003, we recorded $23 million of severance expenses,
representing an increase of $19 million over 2002 as a result
of management decisions to streamline corporate functions
and yield future efficiency gains. In addition, we recorded
$16 million in litigation expenses in 2003, an increase of $6
million over the prior year. This expense growth was partially
offset by a $27 million reduction in previously allocated costs
from Merck that are no longer incurred. The increase in 2002
primarily reflects $40 million in higher technology-related
expenses, including depreciation, as well as $10 million in lit-
igation expenses reserves, partially offset by approximately
$32 million in savings primarily from the integration of
ProVantage Health Services, Inc. (“ProVantage”), into Medco’s
infrastructure, and other cost-savings initiatives. ProVantage
was acquired by us in mid-year 2000 and was integrated into
Rebates from pharmaceutical manufacturers, which are
reflected as a reduction in cost of product net revenues,
totaled $2,970 million in 2003, $2,465 million in 2002 and
$2,535 million in 2001, with formulary rebates representing
50%, 54% and 47% of total rebates, respectively.
The service gross margin percentage declined 8.9 points in
2003, reflecting an 8.8% decrease in service net revenues as
discussed in the net revenue analysis above compared with a
corresponding increase in cost of service revenues of 9.1%.
Cost of service revenues increased despite the revenue
declines because of higher program costs, as well as the fact
that the revenue components that decreased do not generate
significant variable costs. The service gross margin percent-
age increased 6.3 points in 2002, reflecting a 6.7% increase in
service net revenues as discussed in the above service revenue
analysis compared with a corresponding decrease in cost of
service revenues of 6.4%. The decrease in cost of service rev-
enues reflects a reduction in member communication mate-
rials costs, which vary from period to period depending on
the number of new client installations and plan changes of
existing clients.
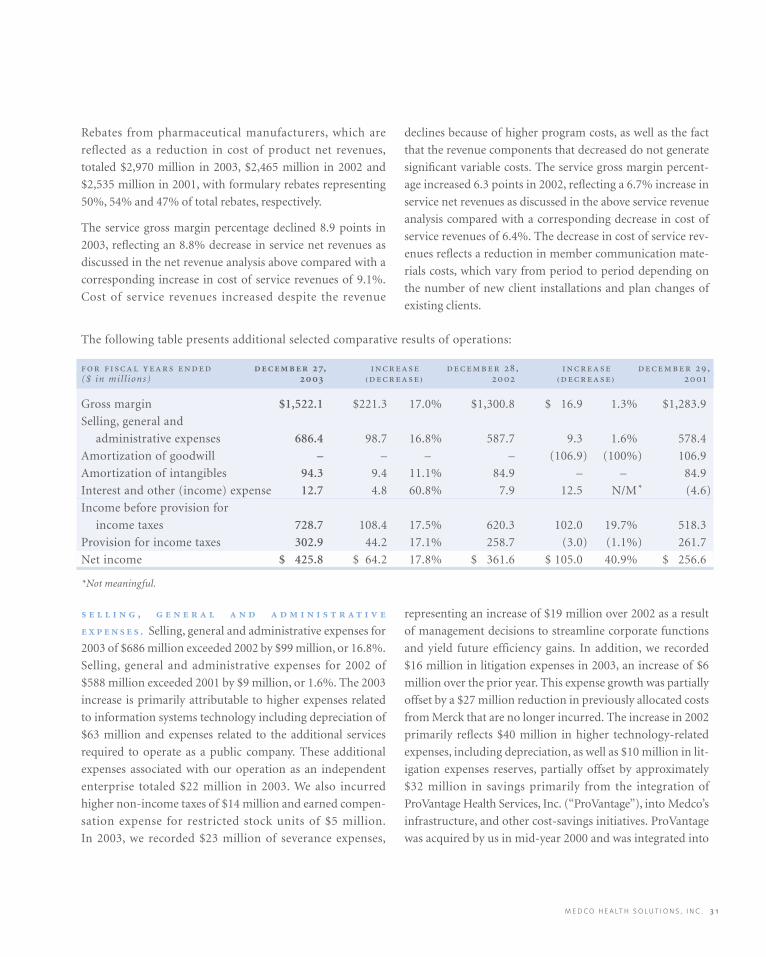
The following table presents additional selected comparative results of operations:
, , ,($ in mil l ions) ₍₎ ₍₎
Gross margin $1,522.1 $221.3 17.0% $1,300.8 $ 16.9 1.3% $1,283.9
Selling, general and
administrative expenses 686.4 98.7 16.8% 587.7 9.3 1.6% 578.4
Amortization of goodwill – – – – (106.9) (100%) 106.9
Amortization of intangibles 94.3 9.4 11.1% 84.9 – – 84.9
Interest and other (income) expense 12.7 4.8 60.8% 7.9 12.5 N/M* (4.6)
Income before provision for
income taxes 728.7 108.4 17.5% 620.3 102.0 19.7% 518.3
Provision for income taxes 302.9 44.2 17.1% 258.7 (3.0) (1.1%) 261.7
Net income $ 425.8 $ 64.2 17.8% $ 361.6 $ 105.0 40.9% $ 256.6
*Not meaningful.
’ ( )
Medco in mid-year 2001, thus resulting in six months of
expenses in the first half of 2001 and significantly reduced
expenses thereafter.
.
Amortization of goodwill was $0 in 2003 and 2002 and
$107 million in 2001. In accordance with Statement of
Financial Accounting Standards (“SFAS”) No. 142, “Goodwill
and Other Intangible Assets” (“SFAS 142”), effective
December 30, 2001, goodwill is no longer amortized, but
rather, is evaluated for impairment on an annual basis using a
two-step fair-value-based test. The most recent assessment of
goodwill impairment was performed as of September 27,
2003, and the recorded goodwill was determined not to be
impaired. Amortization of intangible assets was $94 million
in 2003, $85 million in 2002 and $85 million 2001. The
increase in 2003 resulted from a re-evaluation of the useful
life of the intangible assets created at the time of Merck’s
acquisition of Medco in 1993. During 2002 and 2001, the
intangible assets from the Merck acquisition were being
amortized over a weighted average useful life of 38 years based
on the historical customer retention rate. Effective December
29, 2002, the Company revised the useful life of its intangible
assets to 35 years based on an analysis of the useful life of the
assets which took into account historical client turnover experi-
ence, including recent losses of clients and expected future
losses, and the annual intangible assets amortization expense
was increased by $9.4 million compared to 2002. In February
2004, we were notified of client decisions to transition their
business to other PBMs by the end of 2004. Because these
clients were in our client base at the time of the Merck acquisi-
tion and therefore were included in the recorded intangible
assets, we re-evaluated the weighted average useful life of the
assets. Effective as of the beginning of the 2004 fiscal year, the
weighted average useful life was revised from 35 years to 23
years, with the estimated annual intangible asset amortization
expense increasing to $179.9 million from $94.3 million in
2003. The loss of additional clients that were in our customer
base at the time of our acquisition by Merck may result in a
material noncash impairment charge or accelerated amortiza-
tion of our intangible assets which would negatively impact our
net income.
( ) , .
Interest and other (income) expense, net, was $12.7 million in
2003 and includes $29.3 million in interest expense on the
$1,496 million of debt incurred associated with the separation
in August of 2003. The weighted average borrowing rate of this
debt was approximately 5.1%. Partially offsetting the interest
expense is an $11 million gain associated with the sale of a
minority equity investment in a nonpublic company and
$5.6 million of interest income from positive cash flow and the
associated cash balances. Interest and other (income) expense,
net, was $8 million in 2002 and $(5) million in 2001. The inter-
est and other (income) expense amount recorded in 2002
includes a $7.0 million swap cancellation fee and $4.0 million
of debt issuance charges related to the 2002 public offering that
did not materialize, partially offset by interest income. The
2001 interest and other (income) expense amount is com-
prised primarily of interest income.
. Our effective tax rate
(defined as the percentage relationship of provision for
income taxes to income before provision for income taxes)
decreased marginally to 41.6% in 2003, compared with
41.7% in 2002. Our effective tax rate was 50.5% in 2001 and
would have been 41.9%, excluding the impact of goodwill
amortization. Until we adopted SFAS 142 in 2002 and
ceased to amortize goodwill, our effective tax rate was higher
than our applicable combined statutory tax rate because we
did not receive a tax deduction for our goodwill amortiza-
tion expense.
. Net income as
a percentage of net revenues was 1.2% in 2003, 1.1% in 2002
and 0.9% in 2001, as a result of the aforementioned factors.
Basic earnings per share increased 17.9% in 2003. The
weighted average shares outstanding were 270.1 million for
2003. Diluted earnings per share increased 17.2% in 2003.
The diluted weighted average shares outstanding were
270.8 million for 2003.
M E D C O H E A LT H S O L U T I O N S , I N C . 3 3
We were a wholly-owned subsidiary of Merck from
November 18, 1993, through August 19, 2003. For the majority
of that period, Merck provided us with various services, includ-
ing finance, legal, public affairs, executive oversight, human
resources, procurement and other services. Our historical
financial statements include expense allocations related to these
services, which diminished as we prepared for our separation
from Merck. These expense allocations are reflected in selling,
general and administrative expenses and amounted to $0.4 mil-
lion in 2003 (all of which was recorded in the first quarter),
$27.4 million in 2002 and $26.4 million in 2001. We consider
these allocations to be reasonable reflections of the utilization
of services provided. By the separation date, we had assumed
full responsibility for these services and the related expenses.
Our cost of mail order inventory purchased from Merck
included in cost of revenues totaled $930.4 million in 2003
through the separation date of August 19, 2003, $1,415.0 mil-
lion in 2002 and $1,344.7 million in 2001. This inventory from
Merck was recorded at a price that we believe approximated
the price an unrelated third party would pay. During these
periods, purchases from Merck as a percentage of our total cost
of revenues remained consistently in the 4% to 5% range.
We also generated revenues from sales to Merck of PBM and
other services, amounting to $78.0 million in 2003 through
the separation date of August 19, 2003, $115.2 million in
2002 and $99.9 million in 2001. Revenues derived from sales
to Merck were not material in relation to overall revenues in
these periods.
In connection with the separation, we entered into a man-
aged care agreement with Merck. The managed care agree-
ment includes terms related to market share performance
levels, formulary access rebates and market share rebates
payable by Merck, as well as other provisions, including
liquidated damages which do not represent a guarantee
which would require that a liability be recorded in the bal-
ance sheet at fair value upon issuance. We record rebates
from Merck in cost of revenues based upon the volume of
Merck prescription drugs dispensed through our retail phar-
macy networks and by our mail order pharmacies. The gross
earned rebates from Merck totaled $301.1 million in 2003
through the separation date of August 19, 2003, $443.9 mil-
lion in 2002 and $439.4 million in 2001.
We also entered into a tax responsibility allocation agreement
with Merck. The tax responsibility allocation agreement
includes, among other items, terms for the filing and payment
of income taxes through the separation date. Prior to May 21,
2002, the Company was structured as a single member limited
liability company, with Merck as the sole member. Effective
May 21, 2002, the Company converted from a limited liability
company wholly-owned by Merck to a corporation wholly-
owned by Merck (the “incorporation”). For the period up to
the separation date, Merck was charged federal taxes on our
income as part of Merck’s consolidated tax return, and our lia-
bility for federal income taxes was paid to Merck as part of the
settlement of the net intercompany receivable from Merck.
For state income taxes prior to our incorporation, Merck was
taxed on our income and our liability was paid to Merck
in the settlement of the net intercompany receivable
from Merck. This is also generally the case for the post-
incorporation period through the separation date in states
where Merck filed a unitary or combined tax return. In states
where Merck does not file a unitary or combined tax return,
we are generally responsible since incorporation for filing
and paying the associated taxes, with our estimated state tax
liability reflected in accrued expenses and other current lia-
bilities. Subsequent to the date of separation, we are respon-
sible for filing our own federal and state tax returns and
making the associated payments.
In addition to the managed care agreement and tax responsi-
bility agreement, we entered into an indemnification and
insurance matters agreement where, among other items, we
may be obligated to indemnify Merck for lawsuits where
Medco and Merck are named as defendants, as well as a mas-
ter separation and distribution agreement and other related
agreements.
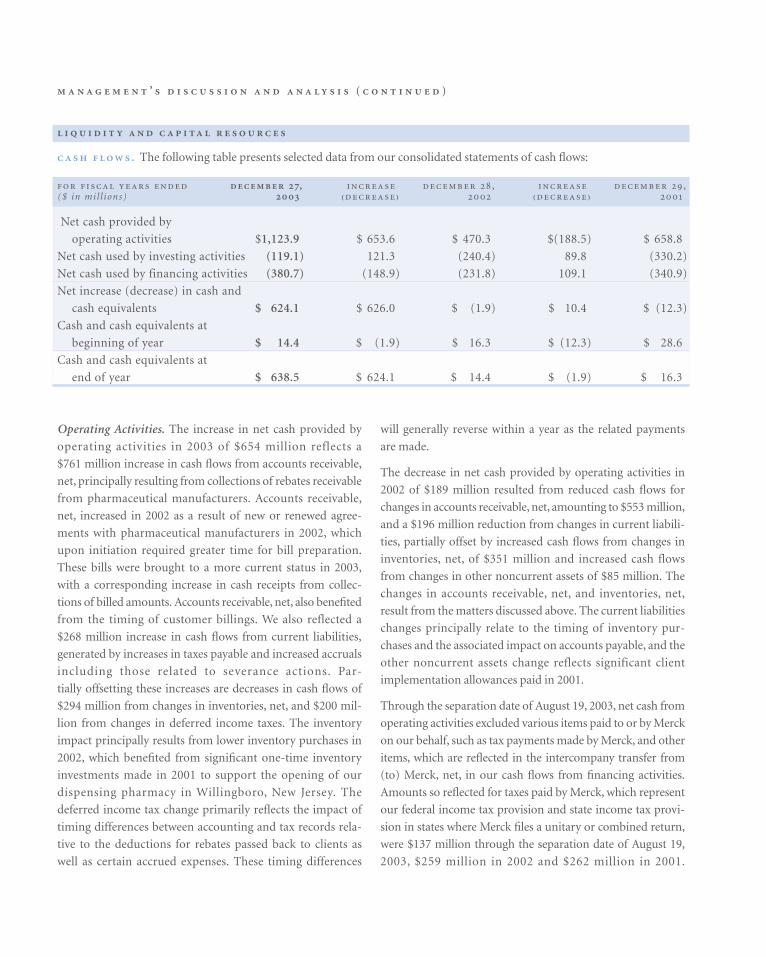
’ ( )
will generally reverse within a year as the related payments
are made.
The decrease in net cash provided by operating activities in
2002 of $189 million resulted from reduced cash flows for
changes in accounts receivable, net, amounting to $553 million,
and a $196 million reduction from changes in current liabili-
ties, partially offset by increased cash flows from changes in
inventories, net, of $351 million and increased cash flows
from changes in other noncurrent assets of $85 million. The
changes in accounts receivable, net, and inventories, net,
result from the matters discussed above. The current liabilities
changes principally relate to the timing of inventory pur-
chases and the associated impact on accounts payable, and the
other noncurrent assets change reflects significant client
implementation allowances paid in 2001.
Through the separation date of August 19, 2003, net cash from
operating activities excluded various items paid to or by Merck
on our behalf, such as tax payments made by Merck, and other
items, which are reflected in the intercompany transfer from
(to) Merck, net, in our cash flows from financing activities.
Amounts so reflected for taxes paid by Merck, which represent
our federal income tax provision and state income tax provi-
sion in states where Merck files a unitary or combined return,
were $137 million through the separation date of August 19,
2003, $259 million in 2002 and $262 million in 2001.
. The following table presents selected data from our consolidated statements of cash flows:
, , ,($ in mil l ions) ₍₎ ₍₎
Net cash provided by
operating activities $1,123.9 $ 653.6 $ 470.3 $(188.5) $ 658.8
Net cash used by investing activities (119.1) 121.3 (240.4) 89.8 (330.2)
Net cash used by financing activities (380.7) (148.9) (231.8) 109.1 (340.9)
Net increase (decrease) in cash and
cash equivalents $ 624.1 $ 626.0 $ (1.9) $ 10.4 $ (12.3)
Cash and cash equivalents at
beginning of year $ 14.4 $ (1.9) $ 16.3 $ (12.3) $ 28.6
Cash and cash equivalents at
end of year $ 638.5 $ 624.1 $ 14.4 $ (1.9) $ 16.3
Operating Activities. The increase in net cash provided by
operating activities in 2003 of $654 million reflects a
$761 million increase in cash flows from accounts receivable,
net, principally resulting from collections of rebates receivable
from pharmaceutical manufacturers. Accounts receivable,
net, increased in 2002 as a result of new or renewed agree-
ments with pharmaceutical manufacturers in 2002, which
upon initiation required greater time for bill preparation.
These bills were brought to a more current status in 2003,
with a corresponding increase in cash receipts from collec-
tions of billed amounts. Accounts receivable, net, also benefited
from the timing of customer billings. We also reflected a
$268 million increase in cash flows from current liabilities,
generated by increases in taxes payable and increased accruals
including those related to severance actions. Par-
tially offsetting these increases are decreases in cash flows of
$294 million from changes in inventories, net, and $200 mil-
lion from changes in deferred income taxes. The inventory
impact principally results from lower inventory purchases in
2002, which benefited from significant one-time inventory
investments made in 2001 to support the opening of our
dispensing pharmacy in Willingboro, New Jersey. The
deferred income tax change primarily reflects the impact of
timing differences between accounting and tax records rela-
tive to the deductions for rebates passed back to clients as
well as certain accrued expenses. These timing differences
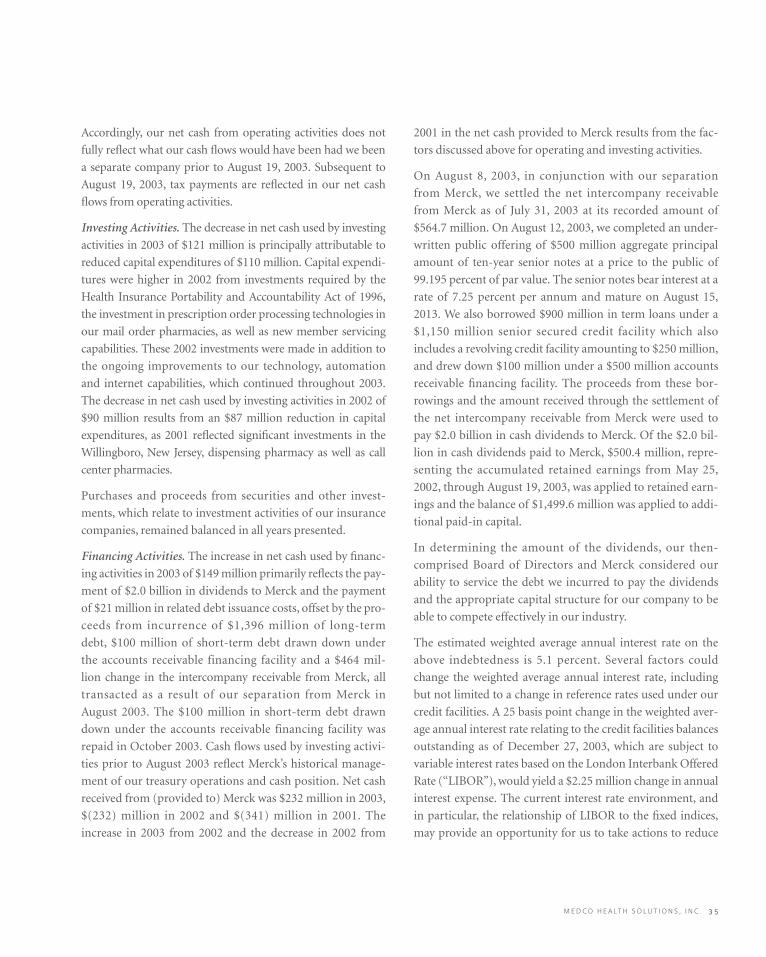
M E D C O H E A LT H S O L U T I O N S , I N C . 3 5
Accordingly, our net cash from operating activities does not
fully reflect what our cash flows would have been had we been
a separate company prior to August 19, 2003. Subsequent to
August 19, 2003, tax payments are reflected in our net cash
flows from operating activities.
Investing Activities. The decrease in net cash used by investing
activities in 2003 of $121 million is principally attributable to
reduced capital expenditures of $110 million. Capital expendi-
tures were higher in 2002 from investments required by the
Health Insurance Portability and Accountability Act of 1996,
the investment in prescription order processing technologies in
our mail order pharmacies, as well as new member servicing
capabilities. These 2002 investments were made in addition to
the ongoing improvements to our technology, automation
and internet capabilities, which continued throughout 2003.
The decrease in net cash used by investing activities in 2002 of
$90 million results from an $87 million reduction in capital
expenditures, as 2001 reflected significant investments in the
Willingboro, New Jersey, dispensing pharmacy as well as call
center pharmacies.
Purchases and proceeds from securities and other invest-
ments, which relate to investment activities of our insurance
companies, remained balanced in all years presented.
Financing Activities. The increase in net cash used by financ-
ing activities in 2003 of $149 million primarily reflects the pay-
ment of $2.0 billion in dividends to Merck and the payment
of $21 million in related debt issuance costs, offset by the pro-
ceeds from incurrence of $1,396 million of long-term
debt, $100 million of short-term debt drawn down under
the accounts receivable financing facility and a $464 mil-
lion change in the intercompany receivable from Merck, all
transacted as a result of our separation from Merck in
August 2003. The $100 million in short-term debt drawn
down under the accounts receivable financing facility was
repaid in October 2003. Cash flows used by investing activi-
ties prior to August 2003 reflect Merck’s historical manage-
ment of our treasury operations and cash position. Net cash
received from (provided to) Merck was $232 million in 2003,
$(232) million in 2002 and $(341) million in 2001. The
increase in 2003 from 2002 and the decrease in 2002 from
2001 in the net cash provided to Merck results from the fac-
tors discussed above for operating and investing activities.
On August 8, 2003, in conjunction with our separation
from Merck, we settled the net intercompany receivable
from Merck as of July 31, 2003 at its recorded amount of
$564.7 million. On August 12, 2003, we completed an under-
written public offering of $500 million aggregate principal
amount of ten-year senior notes at a price to the public of
99.195 percent of par value. The senior notes bear interest at a
rate of 7.25 percent per annum and mature on August 15,
2013. We also borrowed $900 million in term loans under a
$1,150 million senior secured credit facility which also
includes a revolving credit facility amounting to $250 million,
and drew down $100 million under a $500 million accounts
receivable financing facility. The proceeds from these bor-
rowings and the amount received through the settlement of
the net intercompany receivable from Merck were used to
pay $2.0 billion in cash dividends to Merck. Of the $2.0 bil-
lion in cash dividends paid to Merck, $500.4 million, repre-
senting the accumulated retained earnings from May 25,
2002, through August 19, 2003, was applied to retained earn-
ings and the balance of $1,499.6 million was applied to addi-
tional paid-in capital.
In determining the amount of the dividends, our then-
comprised Board of Directors and Merck considered our
ability to service the debt we incurred to pay the dividends
and the appropriate capital structure for our company to be
able to compete effectively in our industry.
The estimated weighted average annual interest rate on the
above indebtedness is 5.1 percent. Several factors could
change the weighted average annual interest rate, including
but not limited to a change in reference rates used under our
credit facilities. A 25 basis point change in the weighted aver-
age annual interest rate relating to the credit facilities balances
outstanding as of December 27, 2003, which are subject to
variable interest rates based on the London Interbank Offered
Rate (“LIBOR”), would yield a $2.25 million change in annual
interest expense. The current interest rate environment, and
in particular, the relationship of LIBOR to the fixed indices,
may provide an opportunity for us to take actions to reduce
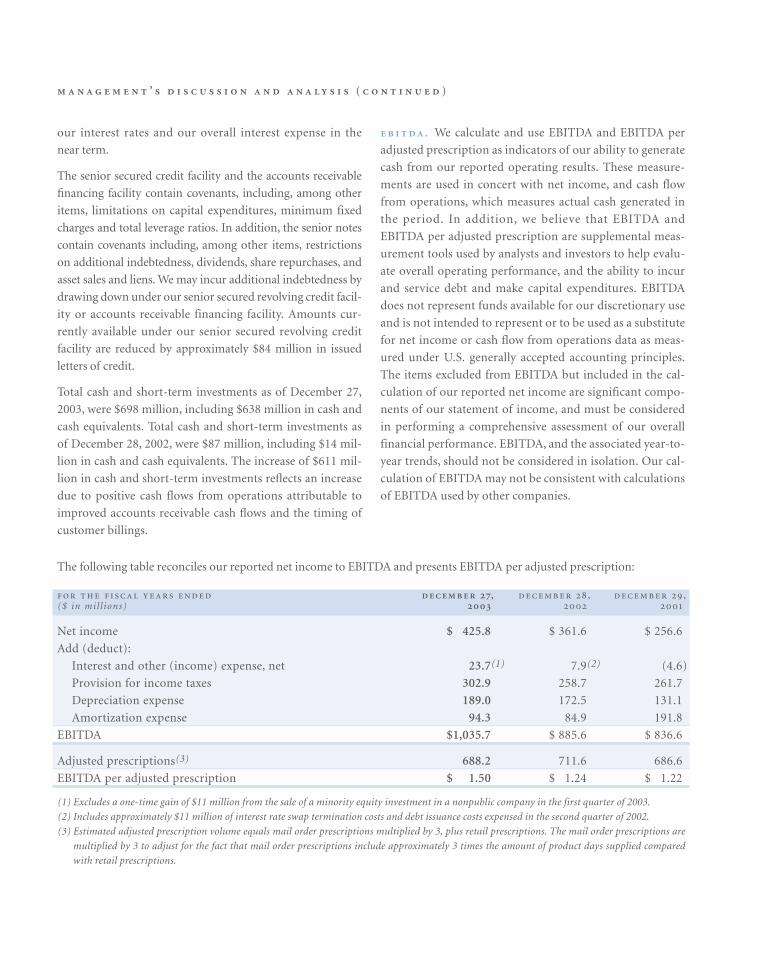
’ ( )
The following table reconciles our reported net income to EBITDA and presents EBITDA per adjusted prescription:
, , ,($ in mil l ions)
Net income $ 425.8 $ 361.6 $ 256.6
Add (deduct):
Interest and other (income) expense, net 23.7(1) 7.9(2) (4.6)
Provision for income taxes 302.9 258.7 261.7
Depreciation expense 189.0 172.5 131.1
Amortization expense 94.3 84.9 191.8
EBITDA $1,035.7 $ 885.6 $ 836.6
Adjusted prescriptions(3) 688.2 711.6 686.6
EBITDA per adjusted prescription $ 1.50 $ 1.24 $ 1.22
(1) Excludes a one-time gain of $11 million from the sale of a minority equity investment in a nonpublic company in the first quarter of 2003.
(2) Includes approximately $11 million of interest rate swap termination costs and debt issuance costs expensed in the second quarter of 2002.
(3) Estimated adjusted prescription volume equals mail order prescriptions multiplied by 3, plus retail prescriptions. The mail order prescriptions are
multiplied by 3 to adjust for the fact that mail order prescriptions include approximately 3 times the amount of product days supplied compared
with retail prescriptions.
our interest rates and our overall interest expense in the
near term.
The senior secured credit facility and the accounts receivable
financing facility contain covenants, including, among other
items, limitations on capital expenditures, minimum fixed
charges and total leverage ratios. In addition, the senior notes
contain covenants including, among other items, restrictions
on additional indebtedness, dividends, share repurchases, and
asset sales and liens. We may incur additional indebtedness by
drawing down under our senior secured revolving credit facil-
ity or accounts receivable financing facility. Amounts cur-
rently available under our senior secured revolving credit
facility are reduced by approximately $84 million in issued
letters of credit.
Total cash and short-term investments as of December 27,
2003, were $698 million, including $638 million in cash and
cash equivalents. Total cash and short-term investments as
of December 28, 2002, were $87 million, including $14 mil-
lion in cash and cash equivalents. The increase of $611 mil-
lion in cash and short-term investments reflects an increase
due to positive cash flows from operations attributable to
improved accounts receivable cash flows and the timing of
customer billings.
. We calculate and use EBITDA and EBITDA per
adjusted prescription as indicators of our ability to generate
cash from our reported operating results. These measure-
ments are used in concert with net income, and cash flow
from operations, which measures actual cash generated in
the period. In addition, we believe that EBITDA and
EBITDA per adjusted prescription are supplemental meas-
urement tools used by analysts and investors to help evalu-
ate overall operating performance, and the ability to incur
and service debt and make capital expenditures. EBITDA
does not represent funds available for our discretionary use
and is not intended to represent or to be used as a substitute
for net income or cash flow from operations data as meas-
ured under U.S. generally accepted accounting principles.
The items excluded from EBITDA but included in the cal-
culation of our reported net income are significant compo-
nents of our statement of income, and must be considered
in performing a comprehensive assessment of our overall
financial performance. EBITDA, and the associated year-to-
year trends, should not be considered in isolation. Our cal-
culation of EBITDA may not be consistent with calculations
of EBITDA used by other companies.
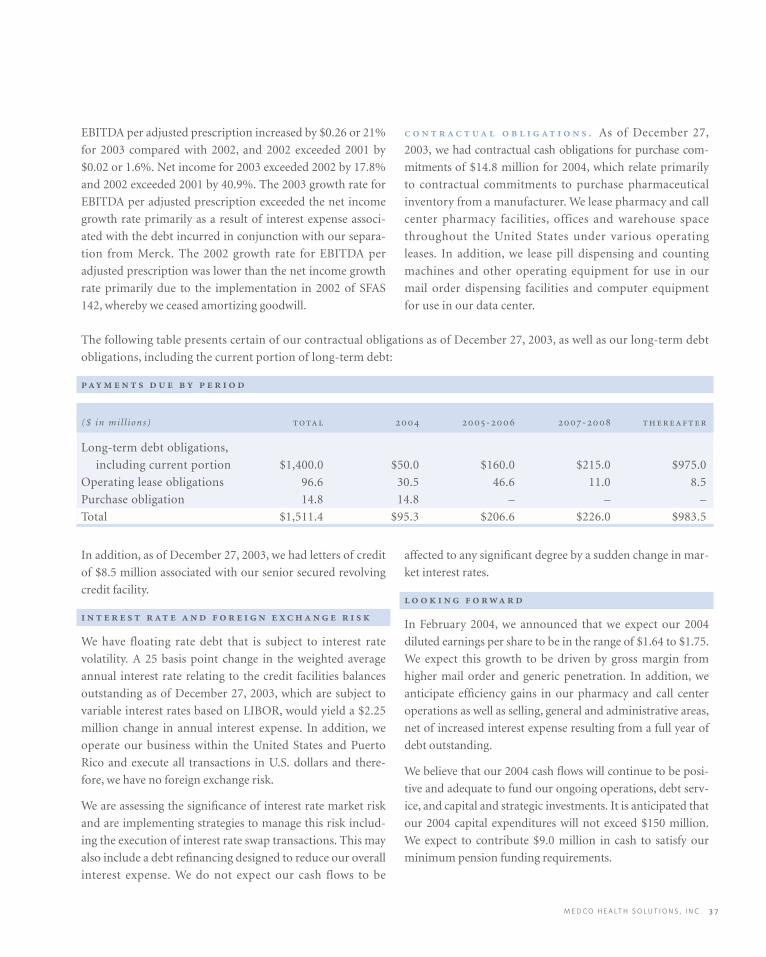
M E D C O H E A LT H S O L U T I O N S , I N C . 3 7
EBITDA per adjusted prescription increased by $0.26 or 21%
for 2003 compared with 2002, and 2002 exceeded 2001 by
$0.02 or 1.6%. Net income for 2003 exceeded 2002 by 17.8%
and 2002 exceeded 2001 by 40.9%. The 2003 growth rate for
EBITDA per adjusted prescription exceeded the net income
growth rate primarily as a result of interest expense associ-
ated with the debt incurred in conjunction with our separa-
tion from Merck. The 2002 growth rate for EBITDA per
adjusted prescription was lower than the net income growth
rate primarily due to the implementation in 2002 of SFAS
142, whereby we ceased amortizing goodwill.
. As of December 27,
2003, we had contractual cash obligations for purchase com-
mitments of $14.8 million for 2004, which relate primarily
to contractual commitments to purchase pharmaceutical
inventory from a manufacturer. We lease pharmacy and call
center pharmacy facilities, offices and warehouse space
throughout the United States under various operating
leases. In addition, we lease pill dispensing and counting
machines and other operating equipment for use in our
mail order dispensing facilities and computer equipment
for use in our data center.
affected to any significant degree by a sudden change in mar-
ket interest rates.
In February 2004, we announced that we expect our 2004
diluted earnings per share to be in the range of $1.64 to $1.75.
We expect this growth to be driven by gross margin from
higher mail order and generic penetration. In addition, we
anticipate efficiency gains in our pharmacy and call center
operations as well as selling, general and administrative areas,
net of increased interest expense resulting from a full year of
debt outstanding.
We believe that our 2004 cash flows will continue to be posi-
tive and adequate to fund our ongoing operations, debt serv-
ice, and capital and strategic investments. It is anticipated that
our 2004 capital expenditures will not exceed $150 million.
We expect to contribute $9.0 million in cash to satisfy our
minimum pension funding requirements.
The following table presents certain of our contractual obligations as of December 27, 2003, as well as our long-term debt
obligations, including the current portion of long-term debt:
($ in mil l ions) - -
Long-term debt obligations,
including current portion $1,400.0 $50.0 $160.0 $215.0 $975.0
Operating lease obligations 96.6 30.5 46.6 11.0 8.5
Purchase obligation 14.8 14.8 – – –
Total $1,511.4 $95.3 $206.6 $226.0 $983.5
In addition, as of December 27, 2003, we had letters of credit
of $8.5 million associated with our senior secured revolving
credit facility.
We have floating rate debt that is subject to interest rate
volatility. A 25 basis point change in the weighted average
annual interest rate relating to the credit facilities balances
outstanding as of December 27, 2003, which are subject to
variable interest rates based on LIBOR, would yield a $2.25
million change in annual interest expense. In addition, we
operate our business within the United States and Puerto
Rico and execute all transactions in U.S. dollars and there-
fore, we have no foreign exchange risk.
We are assessing the significance of interest rate market risk
and are implementing strategies to manage this risk includ-
ing the execution of interest rate swap transactions. This may
also include a debt refinancing designed to reduce our overall
interest expense. We do not expect our cash flows to be
’ ( )
We do not expect to pay cash dividends in the foreseeable
future. Moreover, the terms of the credit agreement governing
our senior secured credit facility and the indenture governing
our ten-year senior unsecured notes limit the amount of divi-
dends we may pay. Payment of future cash dividends, if any, will
be at the discretion of our Board of Directors in accordance
with applicable law after taking into account various factors,
including our financial condition, operating results, current
and anticipated cash needs, plans for expansion and contrac-
tual restrictions with respect to the payment of dividends.
The majority of our clients contract with us for periods rang-
ing from three to five years, with some of longer duration.
Therefore, a significant portion of our book of business may
be subject to renewal in any given year. Historical retention
rates are not necessarily indicative of future retention rates.
In February 2004, we were notified of client decisions to tran-
sition their business to other PBMs. Because these clients
were in our client base at the time of the Merck acquisition
and therefore were included in the recorded intangible assets,
we re-evaluated the weighted average useful life of the assets.
Effective as of the beginning of the 2004 fiscal year, the
weighted average useful life was revised from 35 years to 23
years, with the estimated annual intangible asset amortiza-
tion expense increasing to $179.9 million from $94.3 million
in 2003. The loss of additional clients that were in our cus-
tomer base at the time of our acquisition by Merck may result
in a material noncash impairment charge or accelerated
amortization of our intangible assets which would negatively
impact our net income.
. The preparation of consolidated
financial statements requires companies to include certain
amounts that are based on management’s best estimates and
judgments. In preparing the consolidated financial statements,
management reviewed its accounting policies and believes that
these accounting policies are appropriate for a fair presenta-
tion of our financial position, results of operations and of cash
flows. Several of these accounting policies contain estimates,
the most significant of which are discussed below. Actual
results may differ from those estimates, and it is possible that
future results of operations for any particular quarterly or
annual period could be materially affected by the ultimate
actual results. We discuss the impact and any associated risks
related to these policies on our business operations through-
out this “Management’s Discussion and Analysis” section.
. We describe below
what we believe to be our critical accounting policies.
Revenue Recognition. Our revenues are derived principally
from sales of prescription drugs to our clients, either through
our networks of contractually affiliated retail pharmacies or
our mail order pharmacies. We recognize these revenues
when the prescriptions are dispensed through retail pharma-
cies in our contractually affiliated networks or our mail order
pharmacies and received by our members. We have deter-
mined that our responsibilities under our client contracts to
adjudicate member claims properly and control clients’ drug
spend, our separate contractual pricing relationships and
responsibilities to the retail pharmacies in our networks, and
our interaction with members, among other indicators, qual-
ify us as the principal under the indicators set forth in EITF
99-19, “Reporting Gross Revenue as a Principal vs. Net as an
Agent,” in most of our transactions with customers. Our
responsibilities under our client contracts include validating
that the patient is a member of the client’s plan and that
the prescription drug is in the applicable formulary, instruct-
ing the pharmacist as to the prescription price and the
co-payment due from the patient who is a member of a
client’s plan, identifying possible adverse drug interactions for
the pharmacist to address with the physician prior to dispens-
ing, suggesting medically appropriate generic alternatives to
control drug cost to our clients and their members, and
approving the prescription for dispensing. We recognize rev-
enues from our retail network contracts where we are the
principal and our mail order pharmacies, on a gross reporting
basis, in accordance with EITF 99-19 at the prescription price
(ingredient cost plus dispensing fee) negotiated with our
clients, including the portion of the price to be settled directly
by the member (co-payment) plus our administrative fees.
Although we do not have credit risk with respect to retail
co-payments, all of the above indicators of gross treatment are
present. In addition, we view these co-payments as a mecha-
nism that we negotiate with our clients to help them manage
their retained prescription drug spending costs, and the level
of co-payments does not affect our rebates or margin on the
M E D C O H E A LT H S O L U T I O N S , I N C . 3 9
transaction. In the limited instances where the terms of our
contracts and nature of our involvement in the prescription
fulfillment process do not qualify us as a principal under
EITF 99-19, our revenues on those transactions consist of the
administrative fee paid to us by our clients.
We deduct from our revenues the manufacturers’ rebates that
are earned by our clients based on their members’ utilization
of brand formulary drugs. We estimate these rebates at
period-end based on actual and estimated claims data and
our estimates of the manufacturers’ rebates earned by our
clients. We base our estimates on the best available data at
period-end and recent history for the various factors that can
affect the amount of rebates due to the client. We adjust our
rebates payable to clients to the actual amounts paid when
these rebates are paid, generally on a quarterly basis, or as sig-
nificant events occur. We record any cumulative effect of these
adjustments against revenues as identified, and adjust our
estimates prospectively to consider recurring matters. Adjust-
ments generally result from contract changes with our clients,
differences between the estimated and actual product mix
subject to rebates or whether the product was included in the
applicable formulary. Adjustments to our estimates have not
been material to our quarterly or annual results of operations.
We also deduct from our revenues discounts offered and
other payments made to our clients. Other payments include,
for example, implementation allowances and payments
related to performance guarantees. Where we provide imple-
mentation or other allowances to clients upon contract initia-
tion, we capitalize these payments and amortize them
generally on a straight-line basis over the life of the contract as
a reduction of revenue only if these payments are refundable
upon cancellation or relate to noncancelable contracts.
Rebates Receivable and Payable. Rebates receivable from phar-
maceutical manufacturers are earned based upon the dis-
pensing of prescriptions at either pharmacies in our retail
networks or our mail order pharmacies, and are recorded as a
reduction of cost of revenues and are included in accounts
receivable, net. We accrue rebates receivable by multiplying
estimated rebatable prescription drugs dispensed by the phar-
macies in our retail networks, or dispensed by our mail order
pharmacies, by the contractually agreed manufacturer rebate
amount, which in certain cases may be based on estimated
market share data. We revise rebates receivable estimates to
actual, with the difference recorded to cost of revenues, when
third party market share data is available and final rebatable
prescriptions are calculated, and rebates are billed to the
manufacturer, generally 30 to 90 days subsequent to the end
of the applicable quarter. Historically, the effect of adjust-
ments resulting from the reconciliation of our estimated
rebates recognized and recorded to actual amounts billed has
not been material to our results of operations. Rebates
payable to clients are estimated and accrued as a reduction in
accounts receivable, net, based upon the prescription drugs
dispensed by the pharmacies in our retail networks or by our
mail order pharmacies. Rebates are generally paid to clients
on a quarterly basis after collection of rebates receivable from
manufacturers, at which time rebates payable are revised to
reflect amounts due. Typically, our client contracts give the
client the right to audit our calculation of pharmaceutical
manufacturers’ rebates passed back to them. In addition, our
contracts with pharmaceutical manufacturers generally give
the manufacturer the right to audit our calculation of
amounts billed to them. To date, adjustments related to these
audits have not been material.
Contract Profitability. We monitor contract profitability peri-
odically throughout the term of each contract and if the con-
tract would result in a loss over its total life, we would record
a charge to earnings immediately for the entire amount of
the loss. To date, no charges have been required.
Allocations from Merck. Our historical financial statements
include allocations of certain corporate functions historically
provided by Merck prior to the separation, such as finance,
legal, public affairs, executive oversight, human resources,
procurement and other services. These allocations were made
using relative percentages of operating expenses, pre-tax
income, headcount, the effort expended by Merck for us com-
pared with its other operations, or other reasonable methods.
We consider these allocations to be reasonable reflections of
the utilization of services provided. By the separation date, we
had assumed full responsibility for these services and the
related expenses.
Income Taxes. As described previously in our “Transactions
with Merck” section, Merck is responsible through the sepa-
ration date for the filing of federal income taxes, and state
’ ( )
income taxes where Merck files a unitary or combined
return. As described further in Note 12 to our consolidated
financial statements included in this annual report, under the
terms of the tax responsibility allocation agreement with
Merck, the Company is responsible for the payment of fed-
eral income taxes and all state income taxes on income
earned subsequent to the date of the separation, except that
the Company is also generally responsible for state income
taxes on income earned subsequent to the May 2002 date of
the incorporation in states where Merck does not file a uni-
tary or combined return. These federal and state income tax
liabilities are reflected in accrued expenses and other current
liabilities. Merck is responsible for the payment of federal
and state income taxes on income earned prior to the afore-
mentioned transition dates. Those federal and state income
tax liabilities were reflected in “Due from Merck, net.” The
Company records deferred tax assets and liabilities based on
temporary differences between the financial statement basis
and the tax basis of assets and liabilities using presently
enacted tax rates.
Due to our incorporation in May 2002 and our separation
from Merck in August 2003, we do not have substantial tax
filing history as an independent company. The significant
estimates reflected in our tax provision include taxable
income and our state apportionment rate. Because these
estimates have been based on our limited history, these esti-
mates may change in future periods as our business evolves
and we make future tax filings.
Property and Equipment. We state property and equipment at
cost less accumulated depreciation and amortization. We cal-
culate depreciation using the straight-line method for assets
with useful lives ranging from three to 45 years. We amortize
leasehold improvements over the shorter of the remaining life
of the lease or the useful lives of the assets.
Software Developed for Internal Use. We invest significantly in
developing software to meet the needs of our clients. We have
adopted American Institute of Certified Public Accountants
Statement of Position 98-1, “Accounting for the Costs of
Computer Software Developed or Obtained for Internal
Use.” Certain costs of computer software developed or
obtained for internal use are capitalized and amortized on a
straight-line basis over three to five years. Costs for general
and administrative expenses, overhead, maintenance and
training, as well as the cost of software that does not add
functionality to the existing system, are expensed as incurred.
Goodwill and Intangible Assets. Goodwill primarily represents
the push-down of the excess of acquisition costs over the fair
value of our net assets from our acquisition by Merck in
1993, and, to a significantly lesser extent, our acquisition
of ProVantage in 2000. Effective December 30, 2001, we
adopted SFAS 142, which requires us to cease amortization of
goodwill and to test goodwill for impairment upon adoption
and at least annually thereafter. To determine whether good-
will has been impaired, we must first determine the fair value
of the Company. This determination involves significant
judgment. If we conclude that our fair value is less than our
book value, SFAS 142 requires us to allocate our fair value to
our assets and liabilities as if we had been acquired at that fair
value. We must record an impairment charge to the extent
recorded goodwill exceeds the amount of goodwill resulting
from this allocation. The most recent assessment of goodwill
impairment was performed as of September 27, 2003, and
the recorded goodwill was determined not to be impaired.
Our intangible assets primarily represent the value of cus-
tomer relationships that was recorded upon our acquisition in
1993 by Merck. These assets are reviewed for impairment
whenever events, such as losses of significant clients, or other
changes in circumstances indicate that the carrying amount
may not be recoverable. When these events occur, we compare
the carrying amount of the assets to the undiscounted pre-tax
expected future cash flows derived from the lowest appropriate
asset grouping. If this comparison indicates that there is an
impairment, the amount of the impairment is calculated using
discounted expected future cash flows. We performed an
impairment test as of December 27, 2003, and the intangible
assets were determined not to be impaired. In addition, we
continually assess the amortizable lives of our intangible
assets, taking into account historical client turnover experi-
ence, including recent losses of clients and expected future
losses, to ensure they reflect current circumstances. Until
December 28, 2002, the intangible assets from the Merck
acquisition were being amortized over a weighted average use-
ful life of 38 years. Effective as of the beginning of fiscal year
2003, we revised the weighted average useful life of the intangi-
ble assets to 35 years, with the annual intangible asset amorti-
zation expense increasing by $9.4 million compared to 2002.
Effective as of the beginning of the 2004 fiscal year, the
M E D C O H E A LT H S O L U T I O N S , I N C . 4 1
weighted average useful life was revised from 35 years to
23 years, with the estimated annual intangible asset amorti-
zation expense increasing to $179.9 million from $94.3 million
in 2003.
Pension and Other Postretirement Benefit Plans. Pension and
other postretirement benefit plan information for financial
reporting purposes is calculated using actuarial assumptions,
including a discount rate for plan benefit obligations and an
expected rate of return on pension plan assets.
We reassess our benefit plan assumptions on a regular basis.
For both the pension and other postretirement benefit plans,
the discount rate is evaluated annually and modified to
reflect the prevailing market rate at the end of our fiscal year
of a portfolio of high-quality (AA and above) fixed-income
debt instruments that would provide the future cash flows
needed to pay the benefits included in the benefit obligation
as they come due. At December 27, 2003, we changed the
discount rate to 6.0% from 6.5% for our pension and other
postretirement benefit plans.
The expected rate of return for the pension plan represents
the average rate of return to be earned on the plan assets over
the period the benefits included in the benefit obligation are
to be paid. In developing the expected rate of return, we
consider long-term compound annualized returns of histori-
cal market data as well as historical actual returns on our plan
assets. Using this reference information, we develop forward-
looking return expectations for each asset category and a
weighted average expected long-term rate of return for a tar-
geted portfolio allocated across these investment categories.
As a result of this analysis, for 2004, we changed the expected
rate of return from 8.75% to 8.0% for our pension plan.
Actuarial assumptions are based on management’s best esti-
mates and judgment. A reasonably possible change of plus
(minus) 25 basis points in the discount rate assumption, with
other assumptions held constant, would have an estimated
$1.7 million favorable (unfavorable) impact on net pension
and postretirement benefit cost. A reasonably possible
change of plus (minus) 25 basis points in the expected rate of
return assumption, with other assumptions held constant,
would have an estimated $0.2 million favorable (unfavor-
able) impact on net pension cost. Therefore, holding all other
assumptions constant, the aforementioned change in the dis-
count rate and asset rate of return results in a $4.0 million
increase in the net pension and other postretirement
benefit cost for 2004.
The healthcare cost trend rate for other postretirement bene-
fit plans for 2004 is 11.5%. The Compensation Committee of
the Board of Directors approved a change to the postretire-
ment health benefit plan which included changes to age and
service requirements, introduction of a limit (or cap) on
company subsidies to be based on 2004 costs, and reduced
subsidies for spouses and dependents. Since the plan will be
capped based on 2004 costs, employer liability will not be
affected by trend after 2004. We expect that this plan change
will result in approximately $15 million of net postretire-
ment benefit cost reductions in 2004 compared to 2003.
For additional information on pension and other postretire-
ment plans, see Note 7 to our consolidated financial state-
ments included in this annual report.
Contingencies. We are currently involved in various legal pro-
ceedings and commercial disputes with clients and suppliers
that arise from time to time in the ordinary course of business.
We have considered these proceedings and disputes in deter-
mining the necessity of any reserves for losses that are probable
and reasonably estimable in accordance with SFAS No. 5,
“Accounting for Contingencies.” Our recorded reserves are
based on estimates developed with consideration given to the
potential merits of claims, the range of possible settlements,
advice from outside counsel, and management’s strategy with
regard to the settlement of such claims or defense against such
claims. The determination of these reserves involves a signifi-
cant amount of management judgment. We do not believe
that the ultimate resolution of these contingencies will have a
material adverse effect on our consolidated financial position
or liquidity as set forth in our consolidated financial state-
ments for the year ended December 27, 2003. It is possible,
however, that future results of operations for any particular
quarterly or annual period could be materially adversely
affected by the ultimate resolution of these matters or by
expense provisions relating to changes in our assumptions or
our strategies related to these proceedings. For additional
information on contingencies, see Note 10 to our consolidated
financial statements included in this annual report.
’ ( )
In January 2003, the FASB issued Interpretation No. 46,
“Consolidation of Variable Interest Entities” (“FIN 46”).
FIN 46 requires a variable interest entity to be consolidated by a
company if that company is subject to a majority of the risk of
loss from the variable interest entity’s activities or entitled to
receive a majority of the entity’s residual returns or both. The
consolidation provisions of FIN 46 were originally effective for
financial periods ending after July 15, 2003. In October 2003,
the FASB issued Staff Position FIN 46-6, “Effective Date of FIN
46,” which delays the implementation date to financial periods
ending after December 31, 2003. In December 2003, the FASB
published a revision to FIN 46 (“FIN 46R”) to clarify some of
the provisions of FIN 46, and to exempt certain entities from its
requirements. The Company does not have any variable inter-
est entities that would require consolidation under FIN 46 and
FIN46R. Therefore, the Company does not expect the adoption
of these standards to have a material impact on the results of
operations, cash flows or financial position.
This annual report contains “forward-looking statements” as
that term is defined in the Private Securities Litigation
Reform Act of 1995. These statements involve risks and
uncertainties that may cause results to differ materially from
those set forth in the statements. No forward-looking state-
ment can be guaranteed, and actual results may differ materi-
ally from those projected. We undertake no obligation to
publicly update any forward-looking statement, whether as a
result of new information, future events, or otherwise. The
forward-looking statements are not historical facts, but
rather are based on current expectations, estimates, assump-
tions and projections about our industry, business and future
financial results. We use words such as “anticipates,”
“believes,” “plans,” “expects,” “future,” “intends,” “may,” “will,”
“should,” “estimates,” “predicts,” “potential,” “continue” and
similar expressions to identify these forward-looking state-
ments. Our actual results could differ materially from the
results contemplated by these forward-looking statements
due to a number of factors. These factors include:
• Competition in the PBM industry and in the healthcare
industry generally
• Pressure on discounts and rebates from pharmaceutical
manufacturers and margins in the PBM industry
• The impact on our business and competitive position of our
managed care agreement with Merck
• Our ability to obtain new clients and the possible termination
of, or unfavorable modification to, contracts with key clients
• Possible contractual or regulatory changes affecting pricing, rebates,
discounts, or other practices of pharmaceutical manufacturers
• Risks associated with our indebtedness and debt serv-
ice obligations
• Risks associated with our ability to continue to develop
innovative programs and services
• Governmental investigations and governmental and qui
tam actions filed against us
• Liability and other claims asserted against us
• Risks related to bioterrorism and mail tampering
• Risks related to rapid changes in technology and our ability
to protect our technology and enforce our intellectual prop-
erty and contract rights
• Developments in the healthcare industry, including the impact
of increases in healthcare costs, changes in drug utilization and
cost patterns and the introduction of new drugs
• New or existing governmental regulations and changes in, or
the failure to comply with, governmental regulations
• The possibility of a material noncash charge to income if our
recorded goodwill is impaired
• The possibility of a material noncash charge to income if our
recorded intangible assets are impaired or require accelerated
amortization from a change in the remaining useful life
• Legislative proposals that impact our industry or the way we
do business; and general economic and business conditions
The foregoing list of factors is not exhaustive. One should
carefully consider the foregoing factors and the other uncer-
tainties and potential events described in our annual report
on Form 10-K, our registration statements on Form 10 (SEC
File No. 1-31312) and Form S-1 (SEC File No. 333-86404),
and other documents filed from time to time with the
Securities and Exchange Commission.
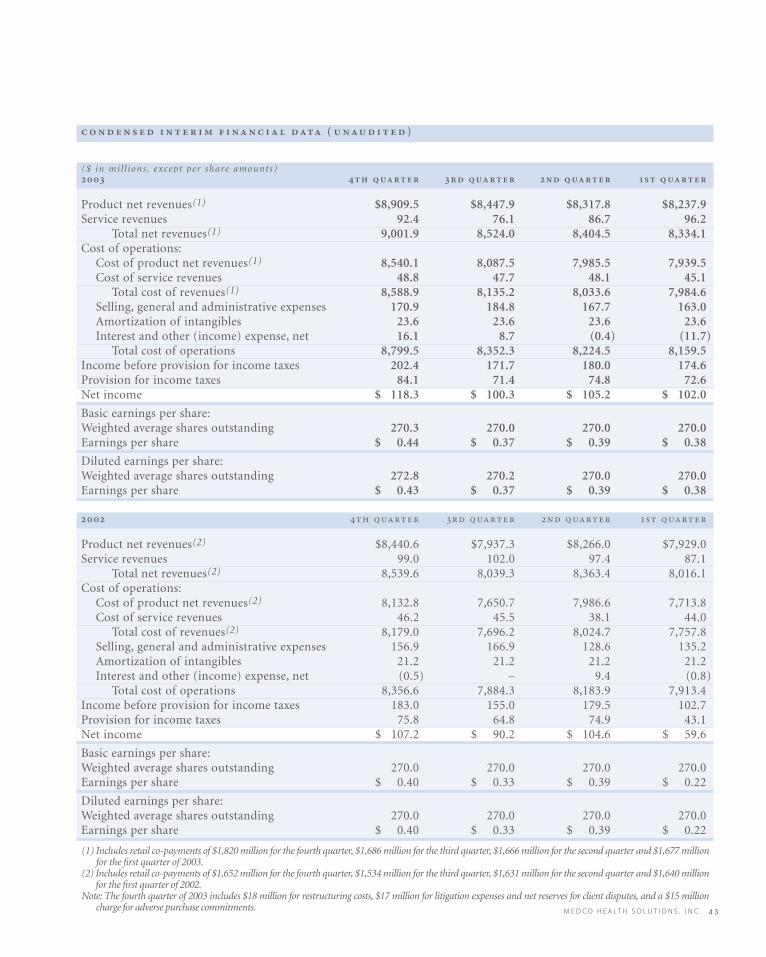
M E D C O H E A LT H S O L U T I O N S , I N C . 4 3
( )
($ in mil l ions , except per share amounts)
Product net revenues(1) $8,909.5 $8,447.9 $8,317.8 $8,237.9 Service revenues 92.4 76.1 86.7 96.2
Total net revenues(1) 9,001.9 8,524.0 8,404.5 8,334.1 Cost of operations:
Cost of product net revenues(1) 8,540.1 8,087.5 7,985.5 7,939.5 Cost of service revenues 48.8 47.7 48.1 45.1
Total cost of revenues(1) 8,588.9 8,135.2 8,033.6 7,984.6 Selling, general and administrative expenses 170.9 184.8 167.7 163.0 Amortization of intangibles 23.6 23.6 23.6 23.6 Interest and other (income) expense, net 16.1 8.7 (0.4) (11.7)
Total cost of operations 8,799.5 8,352.3 8,224.5 8,159.5 Income before provision for income taxes 202.4 171.7 180.0 174.6 Provision for income taxes 84.1 71.4 74.8 72.6 Net income $ 118.3 $ 100.3 $ 105.2 $ 102.0
Basic earnings per share:Weighted average shares outstanding 270.3 270.0 270.0 270.0Earnings per share $ 0.44 $ 0.37 $ 0.39 $ 0.38
Diluted earnings per share:Weighted average shares outstanding 272.8 270.2 270.0 270.0Earnings per share $ 0.43 $ 0.37 $ 0.39 $ 0.38
Product net revenues(2) $8,440.6 $7,937.3 $8,266.0 $7,929.0 Service revenues 99.0 102.0 97.4 87.1
Total net revenues(2) 8,539.6 8,039.3 8,363.4 8,016.1 Cost of operations:
Cost of product net revenues(2) 8,132.8 7,650.7 7,986.6 7,713.8 Cost of service revenues 46.2 45.5 38.1 44.0
Total cost of revenues(2) 8,179.0 7,696.2 8,024.7 7,757.8 Selling, general and administrative expenses 156.9 166.9 128.6 135.2 Amortization of intangibles 21.2 21.2 21.2 21.2 Interest and other (income) expense, net (0.5) – 9.4 (0.8)
Total cost of operations 8,356.6 7,884.3 8,183.9 7,913.4 Income before provision for income taxes 183.0 155.0 179.5 102.7 Provision for income taxes 75.8 64.8 74.9 43.1 Net income $ 107.2 $ 90.2 $ 104.6 $ 59.6
Basic earnings per share:Weighted average shares outstanding 270.0 270.0 270.0 270.0Earnings per share $ 0.40 $ 0.33 $ 0.39 $ 0.22
Diluted earnings per share:Weighted average shares outstanding 270.0 270.0 270.0 270.0Earnings per share $ 0.40 $ 0.33 $ 0.39 $ 0.22
(1) Includes retail co-payments of $1,820 million for the fourth quarter, $1,686 million for the third quarter, $1,666 million for the second quarter and $1,677 millionfor the first quarter of 2003.
(2) Includes retail co-payments of $1,652 million for the fourth quarter, $1,534 million for the third quarter, $1,631 million for the second quarter and $1,640 millionfor the first quarter of 2002.
Note: The fourth quarter of 2003 includes $18 million for restructuring costs, $17 million for litigation expenses and net reserves for client disputes, and a $15 millioncharge for adverse purchase commitments.

The management of Medco Health Solutions, Inc. (“the
Company”) is responsible for the objectivity and integrity of
the accompanying consolidated financial statements. The
consolidated financial statements have been prepared in
conformity with U.S. generally accepted accounting princi-
ples and include amounts, where necessary, based on the
best estimates and judgments of management.
The Company maintains a system of internal controls that is
designed to provide reasonable assurance that transactions
are executed as authorized and accurately recorded, that
assets are appropriately safeguarded, and that accounting
records are sufficiently reliable to permit the preparation of
the consolidated financial statements. The system of internal
controls is comprised of policies and procedures that provide
control over specific inherent risks associated with the pro-
cessing of transactions; an organizational structure that pro-
vides appropriate segregation of duties; and careful selection,
training and development of operating and financial man-
agers. The Company also has a disclosure committee and
maintains disclosure controls and procedures designed to
ensure that information required to be disclosed in reports
under the Securities Exchange Act of 1934 is appropriately
reflected and reported within the specified time periods.
The system of internal controls is monitored through self-
assessments and internal audits.
Management is in the process of addressing the requirements
of Section 404 of the Sarbanes-Oxley Act of 2002 associated
with internal controls over financial reporting, which will be
required for future fiscal years beginning with our fiscal year
ending December 25, 2004.
The Company operates with effective corporate governance
from its Board of Directors, and it has a code of business con-
duct and ethics applicable to its directors, officers and
employees. Additionally, the Company operates within spe-
cific grants of authority as delegated by the Board of
Directors. The Board of Directors is comprised of experi-
enced professionals with diverse expertise, who meet the
required standards for independence, and who provide
effective oversight and representation for the Company’s
shareholders. The Board of Directors has a Corporate
Governance and Nominating Committee, Audit Committee
and Compensation Committee, each of which consists solely
of independent directors. The Corporate Governance and
Nominating Committee is responsible for oversight of corpo-
rate governance guidelines, the identification of potential
director candidates, and the evaluation of the performance of
the Board of Directors and management. The Audit
Committee is comprised of directors with the appropriate
financial knowledge to provide effective oversight. The Audit
Committee’s responsibilities include review and approval of
the accounting principles used in the Company’s financial
reporting, as well as a review of internal auditing procedures
and the adequacy of the Company’s internal controls. The
Compensation Committee reviews, and makes recommenda-
tions to the Board of Directors with respect to, the compensa-
tion and benefits of the Company’s employees, including
executive officers and consultants; the administration of the
Company’s employee benefit plans, and the Company’s stock
option grants and other incentive arrangements.
The Audit Committee has engaged independent auditors,
PricewaterhouseCoopers LLP, to audit and render an opinion
regarding the fair presentation of the Company’s consoli-
dated financial statements. Their accompanying report is
based on an audit conducted in accordance with generally
accepted auditing standards which includes a consideration
of the internal control structure and selected tests of internal
controls to the extent they considered necessary to support
their opinion.
The system of internal controls is improved and modified as
necessary as a result of an evolving business environment and
recommendations of the Company’s internal auditors and
independent auditors. In management’s opinion, the consoli-
dated financial statements and other financial information
included in this annual report present fairly, in all material
respects, the financial condition, results of operations and
cash flows of the Company.
David B. Snow, Jr. JoAnn A. ReedChairman, President, & Senior Vice President, Finance
Chief Executive Officer & Chief Financial Officer
’
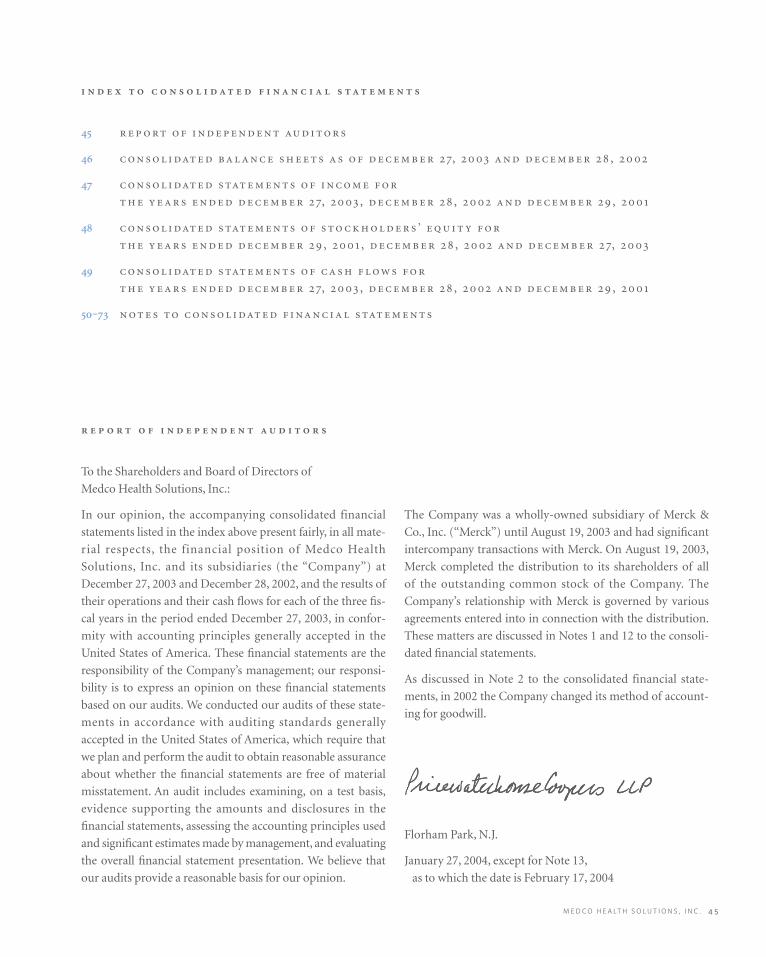
M E D C O H E A LT H S O L U T I O N S , I N C . 4 5
To the Shareholders and Board of Directors of
Medco Health Solutions, Inc.:
In our opinion, the accompanying consolidated financial
statements listed in the index above present fairly, in all mate-
rial respects, the financial position of Medco Health
Solutions, Inc. and its subsidiaries (the “Company”) at
December 27, 2003 and December 28, 2002, and the results of
their operations and their cash flows for each of the three fis-
cal years in the period ended December 27, 2003, in confor-
mity with accounting principles generally accepted in the
United States of America. These financial statements are the
responsibility of the Company’s management; our responsi-
bility is to express an opinion on these financial statements
based on our audits. We conducted our audits of these state-
ments in accordance with auditing standards generally
accepted in the United States of America, which require that
we plan and perform the audit to obtain reasonable assurance
about whether the financial statements are free of material
misstatement. An audit includes examining, on a test basis,
evidence supporting the amounts and disclosures in the
financial statements, assessing the accounting principles used
and significant estimates made by management, and evaluating
the overall financial statement presentation. We believe that
our audits provide a reasonable basis for our opinion.
, ,
, , , ,
’
, , , ,
, , , ,
‒
The Company was a wholly-owned subsidiary of Merck &
Co., Inc. (“Merck”) until August 19, 2003 and had significant
intercompany transactions with Merck. On August 19, 2003,
Merck completed the distribution to its shareholders of all
of the outstanding common stock of the Company. The
Company’s relationship with Merck is governed by various
agreements entered into in connection with the distribution.
These matters are discussed in Notes 1 and 12 to the consoli-
dated financial statements.
As discussed in Note 2 to the consolidated financial state-
ments, in 2002 the Company changed its method of account-
ing for goodwill.
Florham Park, N.J.
January 27, 2004, except for Note 13,
as to which the date is February 17, 2004
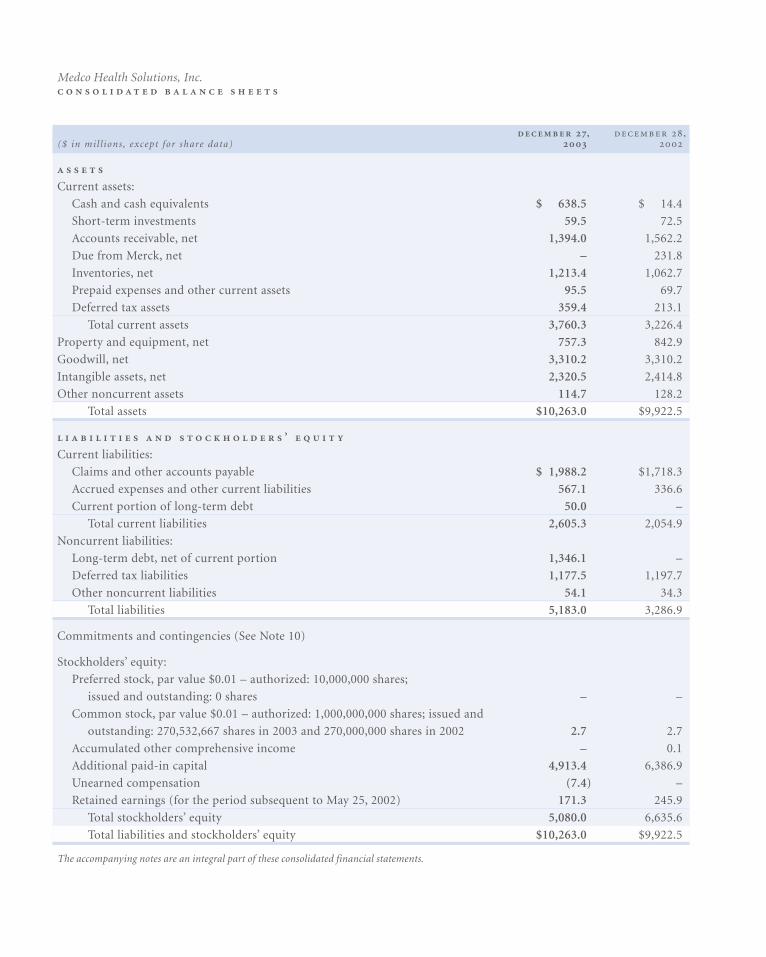
, ,($ in mil l ions , except for share data)
Current assets:
Cash and cash equivalents $ 638.5 $ 14.4
Short-term investments 59.5 72.5
Accounts receivable, net 1,394.0 1,562.2
Due from Merck, net – 231.8
Inventories, net 1,213.4 1,062.7
Prepaid expenses and other current assets 95.5 69.7
Deferred tax assets 359.4 213.1
Total current assets 3,760.3 3,226.4
Property and equipment, net 757.3 842.9
Goodwill, net 3,310.2 3,310.2
Intangible assets, net 2,320.5 2,414.8
Other noncurrent assets 114.7 128.2
Total assets $10,263.0 $9,922.5
’
Current liabilities:
Claims and other accounts payable $ 1,988.2 $1,718.3
Accrued expenses and other current liabilities 567.1 336.6
Current portion of long-term debt 50.0 –
Total current liabilities 2,605.3 2,054.9
Noncurrent liabilities:
Long-term debt, net of current portion 1,346.1 –
Deferred tax liabilities 1,177.5 1,197.7
Other noncurrent liabilities 54.1 34.3
Total liabilities 5,183.0 3,286.9
Commitments and contingencies (See Note 10)
Stockholders’ equity:
Preferred stock, par value $0.01 – authorized: 10,000,000 shares;
issued and outstanding: 0 shares – –
Common stock, par value $0.01 – authorized: 1,000,000,000 shares; issued and
outstanding: 270,532,667 shares in 2003 and 270,000,000 shares in 2002 2.7 2.7
Accumulated other comprehensive income – 0.1
Additional paid-in capital 4,913.4 6,386.9
Unearned compensation (7.4) –
Retained earnings (for the period subsequent to May 25, 2002) 171.3 245.9
Total stockholders’ equity 5,080.0 6,635.6
Total liabilities and stockholders’ equity $10,263.0 $9,922.5
The accompanying notes are an integral part of these consolidated financial statements.
Medco Health Solutions, Inc.
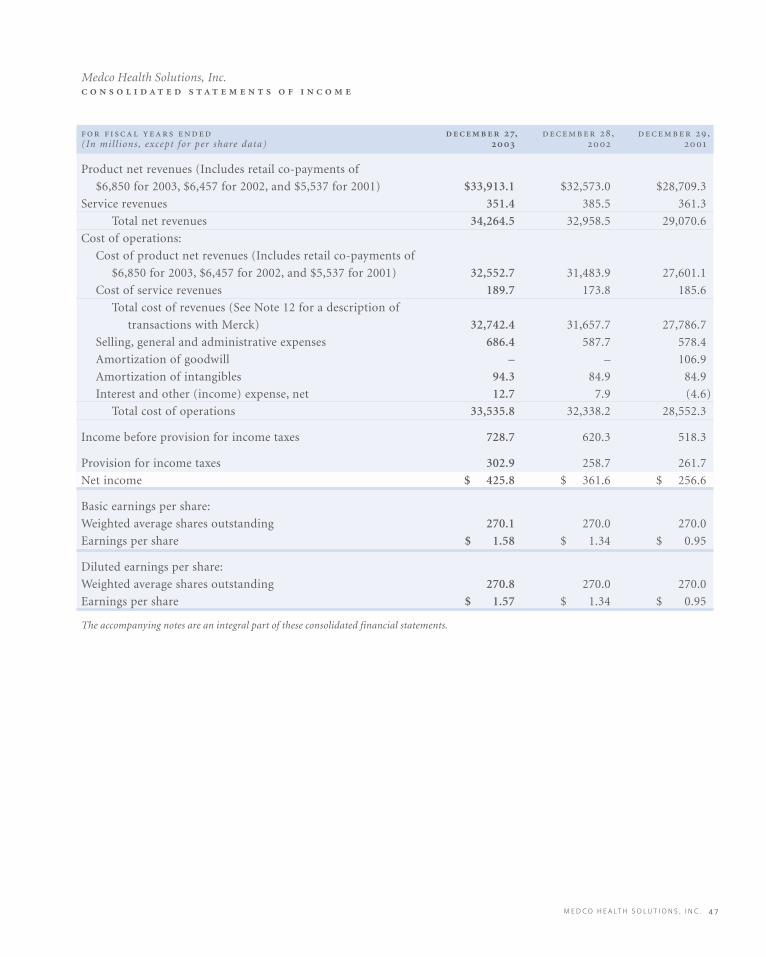
M E D C O H E A LT H S O L U T I O N S , I N C . 4 7
, , ,(In mil l ions , except for per share data)
Product net revenues (Includes retail co-payments of
$6,850 for 2003, $6,457 for 2002, and $5,537 for 2001) $33,913.1 $32,573.0 $28,709.3
Service revenues 351.4 385.5 361.3
Total net revenues 34,264.5 32,958.5 29,070.6
Cost of operations:
Cost of product net revenues (Includes retail co-payments of
$6,850 for 2003, $6,457 for 2002, and $5,537 for 2001) 32,552.7 31,483.9 27,601.1
Cost of service revenues 189.7 173.8 185.6
Total cost of revenues (See Note 12 for a description of
transactions with Merck) 32,742.4 31,657.7 27,786.7
Selling, general and administrative expenses 686.4 587.7 578.4
Amortization of goodwill – – 106.9
Amortization of intangibles 94.3 84.9 84.9
Interest and other (income) expense, net 12.7 7.9 (4.6)
Total cost of operations 33,535.8 32,338.2 28,552.3
Income before provision for income taxes 728.7 620.3 518.3
Provision for income taxes 302.9 258.7 261.7
Net income $ 425.8 $ 361.6 $ 256.6
Basic earnings per share:
Weighted average shares outstanding 270.1 270.0 270.0
Earnings per share $ 1.58 $ 1.34 $ 0.95
Diluted earnings per share:
Weighted average shares outstanding 270.8 270.0 270.0
Earnings per share $ 1.57 $ 1.34 $ 0.95
The accompanying notes are an integral part of these consolidated financial statements.
Medco Health Solutions, Inc.
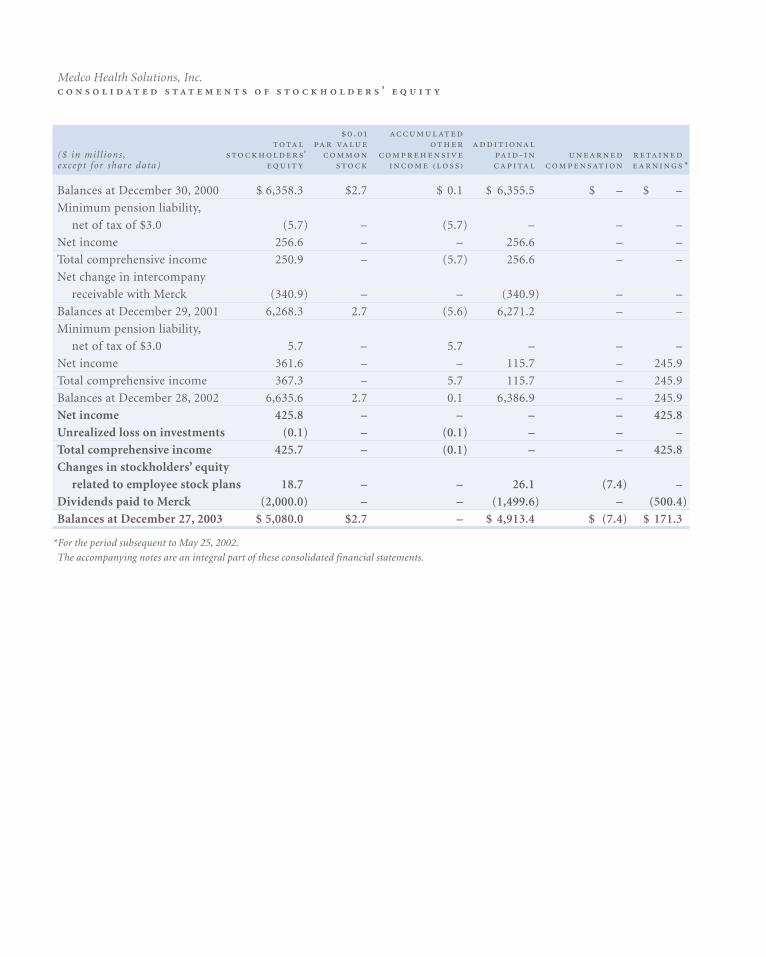
.
($ in mil l ions , ’ - except for share data) ₍ ₎ *
Balances at December 30, 2000 $ 6,358.3 $2.7 $ 0.1 $ 6,355.5 $ – $ –
Minimum pension liability,
net of tax of $3.0 (5.7) – (5.7) – – –
Net income 256.6 – – 256.6 – –
Total comprehensive income 250.9 – (5.7) 256.6 – –
Net change in intercompany
receivable with Merck (340.9) – – (340.9) – –
Balances at December 29, 2001 6,268.3 2.7 (5.6) 6,271.2 – –
Minimum pension liability,
net of tax of $3.0 5.7 – 5.7 – – –
Net income 361.6 – – 115.7 – 245.9
Total comprehensive income 367.3 – 5.7 115.7 – 245.9
Balances at December 28, 2002 6,635.6 2.7 0.1 6,386.9 – 245.9
Net income 425.8 – – – – 425.8
Unrealized loss on investments (0.1) – (0.1) – – –
Total comprehensive income 425.7 – (0.1) – – 425.8
Changes in stockholders’ equity
related to employee stock plans 18.7 – – 26.1 (7.4) –
Dividends paid to Merck (2,000.0) – – (1,499.6) – (500.4)
Balances at December 27, 2003 $ 5,080.0 $2.7 – $ 4,913.4 $ (7.4) $ 171.3
*For the period subsequent to May 25, 2002.
The accompanying notes are an integral part of these consolidated financial statements.
Medco Health Solutions, Inc. ’
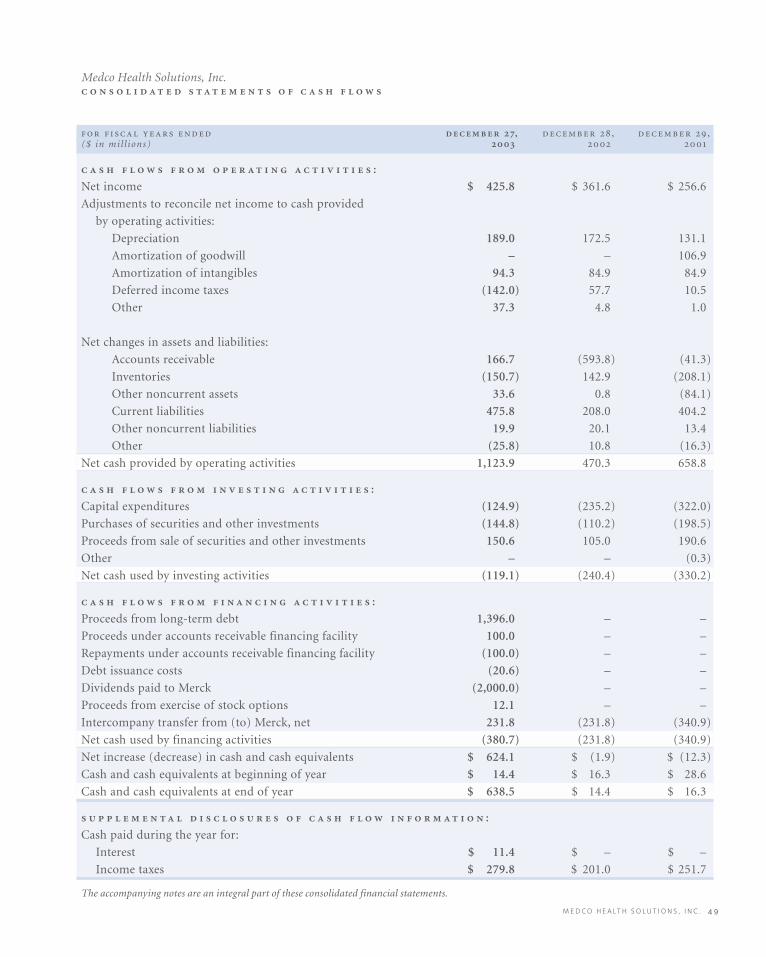
M E D C O H E A LT H S O L U T I O N S , I N C . 4 9
, , ,($ in mil l ions)
:
Net income $ 425.8 $ 361.6 $ 256.6
Adjustments to reconcile net income to cash provided
by operating activities:
Depreciation 189.0 172.5 131.1
Amortization of goodwill – – 106.9
Amortization of intangibles 94.3 84.9 84.9
Deferred income taxes (142.0) 57.7 10.5
Other 37.3 4.8 1.0
Net changes in assets and liabilities:
Accounts receivable 166.7 (593.8) (41.3)
Inventories (150.7) 142.9 (208.1)
Other noncurrent assets 33.6 0.8 (84.1)
Current liabilities 475.8 208.0 404.2
Other noncurrent liabilities 19.9 20.1 13.4
Other (25.8) 10.8 (16.3)
Net cash provided by operating activities 1,123.9 470.3 658.8
:
Capital expenditures (124.9) (235.2) (322.0)
Purchases of securities and other investments (144.8) (110.2) (198.5)
Proceeds from sale of securities and other investments 150.6 105.0 190.6
Other – – (0.3)
Net cash used by investing activities (119.1) (240.4) (330.2)
:
Proceeds from long-term debt 1,396.0 – –
Proceeds under accounts receivable financing facility 100.0 – –
Repayments under accounts receivable financing facility (100.0) – –
Debt issuance costs (20.6) – –
Dividends paid to Merck (2,000.0) – –
Proceeds from exercise of stock options 12.1 – –
Intercompany transfer from (to) Merck, net 231.8 (231.8) (340.9)
Net cash used by financing activities (380.7) (231.8) (340.9)
Net increase (decrease) in cash and cash equivalents $ 624.1 $ (1.9) $ (12.3)
Cash and cash equivalents at beginning of year $ 14.4 $ 16.3 $ 28.6
Cash and cash equivalents at end of year $ 638.5 $ 14.4 $ 16.3
:
Cash paid during the year for:
Interest $ 11.4 $ – $ –
Income taxes $ 279.8 $ 201.0 $ 251.7
The accompanying notes are an integral part of these consolidated financial statements.
Medco Health Solutions, Inc.
.
Medco Health Solutions, Inc., (“Medco” or the “Company”),
provides prescription benefit management (“PBM”) services
and programs for its clients and the members of their phar-
macy benefit plans, as well as for the physicians and pharma-
cies the members use. The Company’s programs and services
help its clients moderate the cost and enhance the quality of
the prescription drug benefits they offer to their members.
The Company accomplishes this primarily by negotiating
competitive rebates and discounts from pharmaceutical
manufacturers, obtaining competitive discounts from retail
pharmacies, and effectively managing prescriptions filled
through its national networks of retail pharmacies or its own
mail order pharmacies.
The Company was previously a wholly-owned subsidiary of
Merck & Co., Inc., (“Merck”). On August 5, 2003, Merck
announced that it had declared a special dividend of all the
outstanding shares of common stock of Medco. On August 19,
2003, Merck stockholders of record as of August 12, 2003
received 0.1206 shares of Medco common stock for every one
share of Merck common stock held (the “separation”) and the
Company was spun off as a separate publicly traded enterprise.
In conjunction with the separation, on August 8, 2003, the
Company received $564.7 million in settlement of the
recorded amount of the net intercompany receivable
due from Merck arising from intercompany transactions
from December 30, 2001 to July 31, 2003. On August 12,
2003, Medco completed an underwritten public offering of
$500 million aggregate principal amount of 10-year senior
notes at a price to the public of 99.195 percent of par value.
In addition, Medco borrowed $900 million in term loans
under a $1,150 million senior secured credit facility, and had
drawn down $100 million under a $500 million accounts
receivable financing facility. See Note 6 for additional infor-
mation. The proceeds from these borrowings, the senior
notes offering and the amount received through the settle-
ment of the net intercompany receivable from Merck were
used to pay $2.0 billion in cash dividends to Merck.
The Company began recording retained earnings subsequent
to May 25, 2002, when it converted from a limited liability
company to a corporation (the “incorporation”). Of the
$2.0 billion in cash dividends paid to Merck, $500.4 mil-
lion, representing the accumulated retained earnings from
May 25, 2002, through August 19, 2003, was applied to
retained earnings and the balance of $1,499.6 million was
applied to additional paid-in capital.
In connection with the separation, Merck and the Company
entered into a series of agreements, including a master sepa-
ration and distribution agreement, an indemnification and
insurance matters agreement, an amended and restated
managed care agreement, a tax responsibility allocation
agreement and other related agreements, which govern the
ongoing relationship between the two companies. See
Note 12 for further information on the ongoing relationship
with Merck.
The consolidated financial statements reflect the historical
results of operations and cash flows of the Company and
include the goodwill and intangible assets pushed down
to the Company’s balance sheet arising from Merck’s acquisi-
tion of the Company on November 18, 1993. For the major-
ity of the period from November 18, 1993 through August 19,
2003, during which the Company was a wholly-owned sub-
sidiary of Merck, Merck provided the Company with various
services, including finance, legal, public affairs, executive
oversight, human resources, procurement and other services.
The historical financial statements include expense alloca-
tions related to these services, which diminished as the
Company prepared for its separation from Merck. The
Company considers these allocations to be reasonable reflec-
tions of the utilization of services provided. The Company
has assumed full responsibility for these services and the
related expenses. The financial information included herein
is not indicative of the consolidated financial position, oper-
ating results, changes in equity and cash flows of the
Company for any future period, or what they would have
been had the Company operated as a separate company prior
to August 19, 2003.
Medco Health Solutions, Inc.
M E D C O H E A LT H S O L U T I O N S , I N C . 5 1
.
. The Company’s fiscal years end on the last
Saturday in December. Fiscal years 2003, 2002 and 2001 each
consist of 52 weeks. Unless otherwise stated, references to
years in the financial statements relate to fiscal years.
. The consolidated
financial statements include the accounts of the Company and
all of its subsidiaries. Investments in affiliates over which the
Company has significant influence, but neither a controlling
interest nor a majority interest in the risks or rewards of the
investee, are accounted for using the equity method. The
Company’s equity investments are not significant.
. Cash equivalents are
comprised of certain highly liquid investments with origi-
nal maturities of less than three months. Cash includes cur-
rency on hand and demand deposits with banks or other
financial institutions.
- . The Company has invest-
ments in certificates of deposit and U.S. government securities
that are carried at fair value and classified as available for sale
with unrealized gains and losses included as a separate com-
ponent of equity, net of tax. These investments, totaling
$59.5 million and $72.5 million as of December 27, 2003 and
December 28, 2002, respectively, have maturities of less than
one year and are held to satisfy the statutory capital and other
requirements for the Company’s insurance subsidiaries.
. The carrying amount of
cash, short-term investments in marketable securities, trade
accounts receivable, bank overdrafts and accounts pay-
able approximated fair value as of December 27, 2003 and
December 28, 2002. The Company estimates fair market
value for these assets based on their market values or esti-
mates of the present value of their cash flows. As of and for
the fiscal year ended December 27, 2003, the Company did
not use derivative financial instruments.
, . Accounts receivable
includes billed and estimated unbilled receivables from clients
and manufacturers. In addition, rebates payable to clients are
estimated and accrued as a reduction in accounts receivable,
net, based upon the prescription drugs dispensed by the phar-
macies in the Company’s retail networks, or dispensed by the
Company’s mail order pharmacies. Unbilled receivables are
billed to clients typically within 14 days based on the contrac-
tual billing schedule agreed upon with each client. Thus, at the
end of any given reporting period, unbilled receivables from
clients will represent up to two weeks of dispensing activity
and will fluctuate at the end of a fiscal month depending on
the timing of these billing cycles. Unbilled receivables from
manufacturers are generally billed beginning 30 days from the
end of each quarter. Accounts receivable, net, are presented net
of allowance for doubtful accounts. As of December 27, 2003
and December 28, 2002, accounts receivable included unbilled
receivables from clients and manufacturers of $1,279.1 million
and $1,265.6 million, respectively. Receivables are presented
net of allowance for doubtful accounts of $6.4 million and
$6.5 million at December 27, 2003 and December 28,
2002, respectively.
, . Inventories in the Company’s mail
order pharmacies, which consist solely of finished product
(primarily prescription drugs), are valued at the lower of
first-in, first-out (FIFO) cost or market.
, . Property and equip-
ment are stated at cost, less accumulated depreciation and
amortization. Depreciation is calculated using the straight-
line method for assets with useful lives ranging from three to
45 years. Leasehold improvements are amortized over the
shorter of the remaining life of the lease or the useful lives of
the assets. The Company complies with the provisions of the
American Institute of Certified Public Accountants Statement
of Position (“SOP”) 98-1, “Accounting for the Costs of
Computer Software Developed or Obtained for Internal Use.”
Certain costs of computer software developed or obtained for
internal use are capitalized and amortized on a straight-line
basis over three to five years. Costs for general and administra-
tive expenses, overhead, maintenance and training, as well as
the cost of software that does not add functionality to the
existing system, are expensed as incurred. Property and equip-
ment are reviewed for impairment whenever events or other
changes in circumstances indicate that the carrying amount may
not be recoverable. When such events occur, the Company
compares the carrying amount of the assets to undiscounted
( )
expected future cash flows derived from the lowest appropriate
asset groupings. If this comparison indicates that there is an
impairment, the amount of the impairment would be calcu-
lated using discounted expected future cash flows.
. Product net revenues consist principally
of sales of prescription drugs to clients, either through the
Company’s network of contractually affiliated retail pharma-
cies or through the Company’s mail order pharmacies, and
are recognized when those prescriptions are dispensed and
received by the members. The Company evaluates client con-
tracts using the indicators of Emerging Issues Task Force
(“EITF”) No. 99-19, “Reporting Gross Revenue as a Principal
vs. Net as an Agent,” to determine whether the Company acts
as a principal or as an agent in the fulfillment of prescriptions
through the retail pharmacy network. Where the Company
acts as a principal, revenues are recognized at the prescrip-
tion price (ingredient cost plus dispensing fee) negotiated
with clients, including the portion of the price allocated by
the client to be settled directly by the member (co-payment),
as well as the Company’s administrative fees (“Gross
Reporting”). This is because the Company (a) has separate
contractual relationships with clients and with pharmacies,
(b) is responsible to validate and economically manage a
claim through its claims adjudication process, (c) commits to
set prescription prices for the pharmacy, including instruct-
ing the pharmacy as to how that price is to be settled (co-pay-
ment requirements), (d) manages the overall prescription
drug relationship with the patients, who are members of
clients’ plans, and (e) has credit risk for the price due from
the client. In limited instances where the Company adjudi-
cates prescriptions at pharmacies that are under contract
directly with the client and there are no financial risks to the
Company, such revenue is recorded at the amount of the
administrative fee earned by the Company for processing the
claim (“Net Reporting”). Rebates, guarantees, and risk-
sharing payments paid to clients and other discounts are
deducted from revenue as they are earned by the client.
Rebates are generally paid to clients subsequent to collec-
tions from pharmaceutical manufacturers. Other contractual
payments made to clients are generally made upon initiation
of contracts as implementation allowances, which may, for
example, be designated by clients as funding for their costs to
transition their plans to the Company or as compensation for
certain data or licensing rights granted by the client to the
Company. The Company considers these payments to be an
integral part of the Company’s pricing of a contract and
believes that they represent only a variability in the timing of
cash flow that does not change the underlying economics of
the contract. Accordingly, these payments are capitalized and
amortized as a reduction of revenue, generally on a straight-
line basis, over the life of the contract where the payments are
refundable upon cancellation of the contract or relate to
noncancelable contracts. Amounts capitalized are assessed
periodically for recoverability based on the profitability of
the contract. During 2003 and for each of 2002 and 2001, the
Company had one client that represented 18%, 16% and
16% of net revenues, respectively.
Service revenues consist principally of sales of prescription
services and data to pharmaceutical manufacturers and
other parties, and administrative fees earned from clients and
other non-product related revenues. Client administrative
fees are earned for services that are comprised of claims pro-
cessing, eligibility management, benefits management, phar-
macy network management and other related customer services.
Service revenues are recorded by the Company when per-
formance occurs and collectibility is assured.
. Cost of product net revenues
includes the cost of inventory dispensed from the mail order
pharmacies, costs incurred in the mail order front-end
prescription order-processing pharmacies and back-end
prescription-dispensing pharmacies, along with associated
depreciation. Cost of product net revenues also includes
ingredient costs of drugs dispensed and professional fees
paid to retail network pharmacies. In addition, cost of prod-
uct net revenues includes the operating costs of the
Company’s call center pharmacies, which primarily respond
to member and retail pharmacy inquiries regarding member
prescriptions as well as physician calls. Cost of product net
revenues also includes an offsetting credit for rebates earned
from pharmaceutical manufacturers whose drugs are
included on the Company’s preferred drug lists, which are
M E D C O H E A LT H S O L U T I O N S , I N C . 5 3
also known as formularies. These rebates generally take the
form of formulary rebates, which are earned based on the
volume of a specific drug dispensed under formularies, or
market share rebates, which are based on the achievement of
contractually specified market share levels for a specific
drug. Rebates receivable from pharmaceutical manufactur-
ers are accrued in the period earned by multiplying esti-
mated rebatable prescription drugs dispensed through the
Company’s retail network and through the Company’s mail
order pharmacies by the contractually agreed manufacturer
rebate amount. Rebates receivable estimates are revised to
actual, with the difference recorded to cost of revenues,
upon billing to the manufacturer, generally 30 to 90 days
subsequent to the end of the applicable quarter. These
billings are not issued until the necessary specific eligible
claims and third party market share data is received and
thoroughly analyzed. Historically, the effect of adjustments
resulting from the reconciliation of rebates recognized and
recorded to actual amounts billed has not been material to
the Company’s results of operations. Cost of service rev-
enues consists principally of labor and operating costs for
delivery of services provided, including member communi-
cation materials.
, . Goodwill of $3,310.2 million at
December 27, 2003 and December 28, 2002, (net of accumu-
lated amortization of $813.4 million through December 29,
2001) primarily represents the push-down of the excess of
acquisition costs over the fair value of the Company’s net
assets from the acquisition of the Company by Merck in 1993
and, to a significantly lesser extent, the Company’s acquisi-
tion of ProVantage Health Services, Inc. (“ProVantage”), in
2000. Until December 29, 2001, goodwill was amortized on a
straight-line basis over periods up to 40 years. Effective
December 30, 2001, the Company adopted the provisions of
Statement of Financial Accounting Standards (“SFAS”)
No. 142, “Goodwill and Other Intangible Assets” (SFAS 142).
Under SFAS 142, the Company ceased amortization of good-
will and tests its goodwill for impairment on an annual basis
using a two-step fair-value based test. The most recent assess-
ment of goodwill impairment was performed as of
September 27, 2003, and the recorded goodwill was deter-
mined not to be impaired. Assuming SFAS 142 had been
adopted for 2001, net income and earnings per share would
have been $363.5 million and $1.35, respectively.
, . Intangible assets reflect the
value of customer relationships of $2,320.5 million at
December 27, 2003 and $2,414.8 million at December 28,
2002, (net of accumulated amortization of $851.7 million at
December 27, 2003 and $757.4 million at December 28,
2002) that arose in connection with the acquisition of the
Company by Merck in 1993 and that have been pushed down
to the balance sheet of the Company. These intangible assets
are recorded at cost and are reviewed for impairment when-
ever events, such as losses of significant clients, or other
changes in circumstances indicate that the carrying amount
may not be recoverable. When these events occur, the carry-
ing amount of the assets is compared to the pre-tax undis-
counted expected future cash flows derived from the lowest
appropriate asset groupings. If this comparison indicates that
there is an impairment, the amount of the impairment
would be calculated using discounted expected future cash
flows. The Company performed an impairment test as of
December 27, 2003, and the intangible assets were deter-
mined not to be impaired. For the years ended December 28,
2002, and December 29, 2001, the intangible assets from the
Merck acquisition were being amortized on a straight-line
basis over a weighted average useful life of 38 years based on
the historical customer retention rate. The Company contin-
ually assesses the amortizable lives of the intangible assets,
taking into account historical client turnover experience,
including recent losses of clients and expected future losses,
to ensure they reflect current circumstances. Effective
December 29, 2002, the Company revised the useful life of its
intangible assets to 35 years and the annual intangible assets
amortization expense was increased by $9.4 million com-
pared to 2002. See Note 13 for further information regarding
a subsequent event impacting the intangible assets.
- . Prior to the separation
from Merck, the Company’s employees had participated in
Merck stock option plans under which employees were
granted options to purchase shares of Merck common stock
at the fair market value on the date of grant. These options
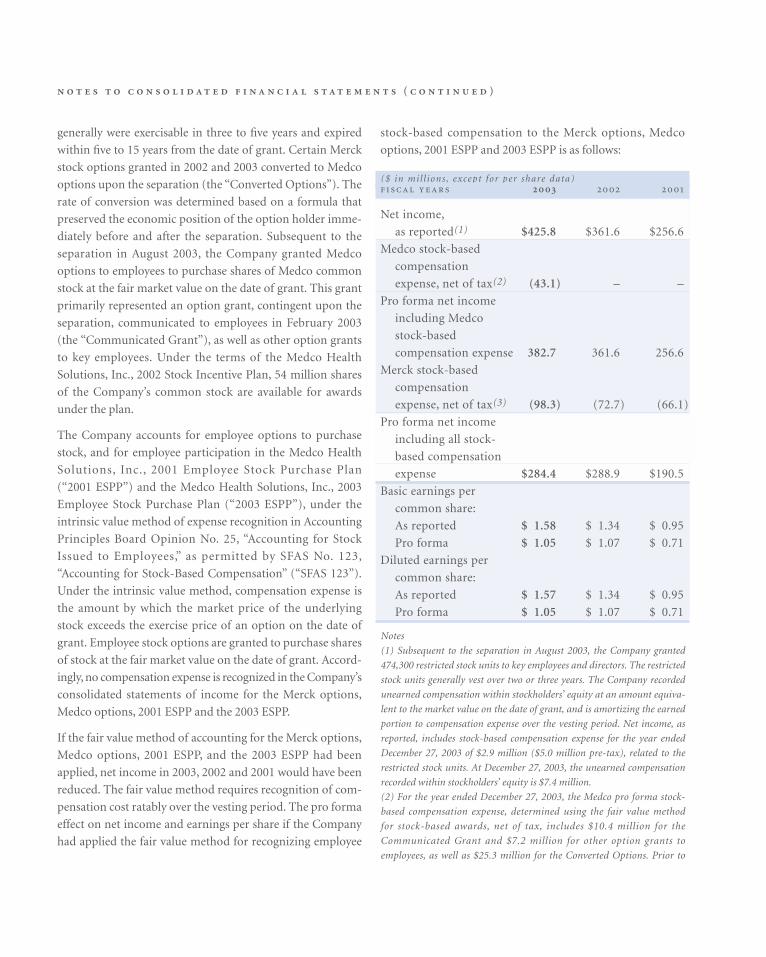
( )
generally were exercisable in three to five years and expired
within five to 15 years from the date of grant. Certain Merck
stock options granted in 2002 and 2003 converted to Medco
options upon the separation (the “Converted Options”). The
rate of conversion was determined based on a formula that
preserved the economic position of the option holder imme-
diately before and after the separation. Subsequent to the
separation in August 2003, the Company granted Medco
options to employees to purchase shares of Medco common
stock at the fair market value on the date of grant. This grant
primarily represented an option grant, contingent upon the
separation, communicated to employees in February 2003
(the “Communicated Grant”), as well as other option grants
to key employees. Under the terms of the Medco Health
Solutions, Inc., 2002 Stock Incentive Plan, 54 million shares
of the Company’s common stock are available for awards
under the plan.
The Company accounts for employee options to purchase
stock, and for employee participation in the Medco Health
Solutions, Inc., 2001 Employee Stock Purchase Plan
(“2001 ESPP”) and the Medco Health Solutions, Inc., 2003
Employee Stock Purchase Plan (“2003 ESPP”), under the
intrinsic value method of expense recognition in Accounting
Principles Board Opinion No. 25, “Accounting for Stock
Issued to Employees,” as permitted by SFAS No. 123,
“Accounting for Stock-Based Compensation” (“SFAS 123”).
Under the intrinsic value method, compensation expense is
the amount by which the market price of the underlying
stock exceeds the exercise price of an option on the date of
grant. Employee stock options are granted to purchase shares
of stock at the fair market value on the date of grant. Accord-
ingly, no compensation expense is recognized in the Company’s
consolidated statements of income for the Merck options,
Medco options, 2001 ESPP and the 2003 ESPP.
If the fair value method of accounting for the Merck options,
Medco options, 2001 ESPP, and the 2003 ESPP had been
applied, net income in 2003, 2002 and 2001 would have been
reduced. The fair value method requires recognition of com-
pensation cost ratably over the vesting period. The pro forma
effect on net income and earnings per share if the Company
had applied the fair value method for recognizing employee
stock-based compensation to the Merck options, Medco
options, 2001 ESPP and 2003 ESPP is as follows:
($ in mil l ions , except for per share data)
Net income,
as reported(1) $425.8 $361.6 $256.6
Medco stock-based
compensation
expense, net of tax(2) (43.1) – –
Pro forma net income
including Medco
stock-based
compensation expense 382.7 361.6 256.6
Merck stock-based
compensation
expense, net of tax(3) (98.3) (72.7) (66.1)
Pro forma net income
including all stock-
based compensation
expense $284.4 $288.9 $190.5
Basic earnings per
common share:
As reported $ 1.58 $ 1.34 $ 0.95
Pro forma $ 1.05 $ 1.07 $ 0.71
Diluted earnings per
common share:
As reported $ 1.57 $ 1.34 $ 0.95
Pro forma $ 1.05 $ 1.07 $ 0.71
Notes
(1) Subsequent to the separation in August 2003, the Company granted
474,300 restricted stock units to key employees and directors. The restricted
stock units generally vest over two or three years. The Company recorded
unearned compensation within stockholders’ equity at an amount equiva-
lent to the market value on the date of grant, and is amortizing the earned
portion to compensation expense over the vesting period. Net income, as
reported, includes stock-based compensation expense for the year ended
December 27, 2003 of $2.9 million ($5.0 million pre-tax), related to the
restricted stock units. At December 27, 2003, the unearned compensation
recorded within stockholders’ equity is $7.4 million.
(2) For the year ended December 27, 2003, the Medco pro forma stock-
based compensation expense, determined using the fair value method
for stock-based awards, net of tax, includes $10.4 million for the
Communicated Grant and $7.2 million for other option grants to
employees, as well as $25.3 million for the Converted Options. Prior to
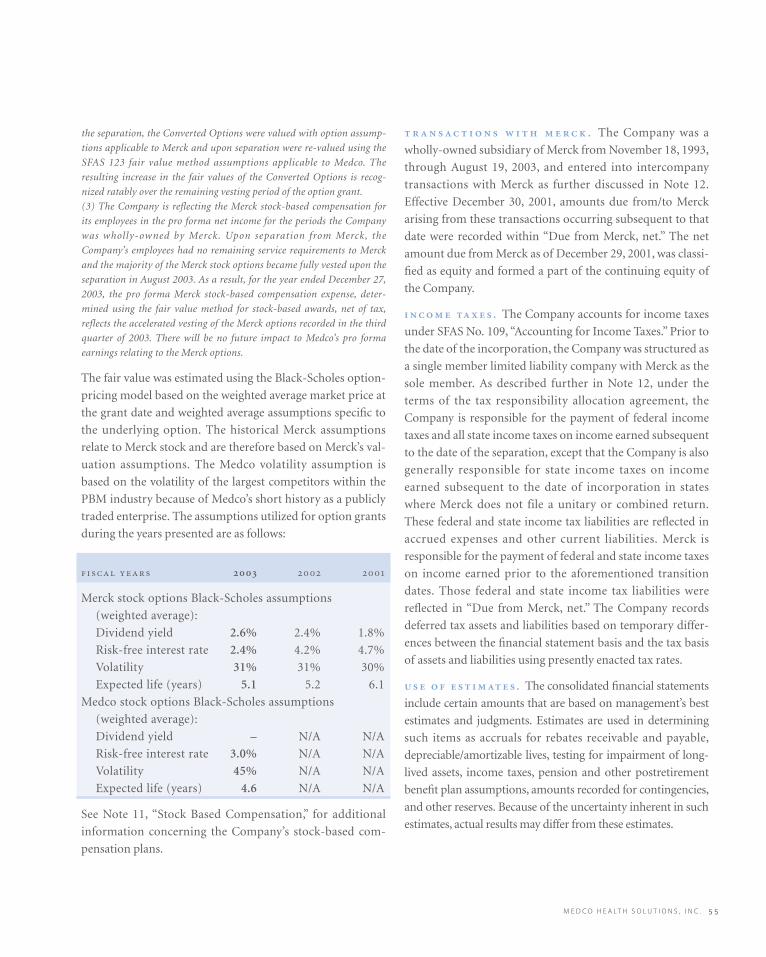
M E D C O H E A LT H S O L U T I O N S , I N C . 5 5
the separation, the Converted Options were valued with option assump-
tions applicable to Merck and upon separation were re-valued using the
SFAS 123 fair value method assumptions applicable to Medco. The
resulting increase in the fair values of the Converted Options is recog-
nized ratably over the remaining vesting period of the option grant.
(3) The Company is reflecting the Merck stock-based compensation for
its employees in the pro forma net income for the periods the Company
was wholly-owned by Merck. Upon separation from Merck, the
Company’s employees had no remaining service requirements to Merck
and the majority of the Merck stock options became fully vested upon the
separation in August 2003. As a result, for the year ended December 27,
2003, the pro forma Merck stock-based compensation expense, deter-
mined using the fair value method for stock-based awards, net of tax,
reflects the accelerated vesting of the Merck options recorded in the third
quarter of 2003. There will be no future impact to Medco’s pro forma
earnings relating to the Merck options.
The fair value was estimated using the Black-Scholes option-
pricing model based on the weighted average market price at
the grant date and weighted average assumptions specific to
the underlying option. The historical Merck assumptions
relate to Merck stock and are therefore based on Merck’s val-
uation assumptions. The Medco volatility assumption is
based on the volatility of the largest competitors within the
PBM industry because of Medco’s short history as a publicly
traded enterprise. The assumptions utilized for option grants
during the years presented are as follows:
Merck stock options Black-Scholes assumptions
(weighted average):
Dividend yield 2.6% 2.4% 1.8%
Risk-free interest rate 2.4% 4.2% 4.7%
Volatility 31% 31% 30%
Expected life (years) 5.1 5.2 6.1
Medco stock options Black-Scholes assumptions
(weighted average):
Dividend yield – N/A N/A
Risk-free interest rate 3.0% N/A N/A
Volatility 45% N/A N/A
Expected life (years) 4.6 N/A N/A
See Note 11, “Stock Based Compensation,” for additional
information concerning the Company’s stock-based com-
pensation plans.
. The Company was a
wholly-owned subsidiary of Merck from November 18, 1993,
through August 19, 2003, and entered into intercompany
transactions with Merck as further discussed in Note 12.
Effective December 30, 2001, amounts due from/to Merck
arising from these transactions occurring subsequent to that
date were recorded within “Due from Merck, net.” The net
amount due from Merck as of December 29, 2001, was classi-
fied as equity and formed a part of the continuing equity of
the Company.
. The Company accounts for income taxes
under SFAS No. 109, “Accounting for Income Taxes.” Prior to
the date of the incorporation, the Company was structured as
a single member limited liability company with Merck as the
sole member. As described further in Note 12, under the
terms of the tax responsibility allocation agreement, the
Company is responsible for the payment of federal income
taxes and all state income taxes on income earned subsequent
to the date of the separation, except that the Company is also
generally responsible for state income taxes on income
earned subsequent to the date of incorporation in states
where Merck does not file a unitary or combined return.
These federal and state income tax liabilities are reflected in
accrued expenses and other current liabilities. Merck is
responsible for the payment of federal and state income taxes
on income earned prior to the aforementioned transition
dates. Those federal and state income tax liabilities were
reflected in “Due from Merck, net.” The Company records
deferred tax assets and liabilities based on temporary differ-
ences between the financial statement basis and the tax basis
of assets and liabilities using presently enacted tax rates.
. The consolidated financial statements
include certain amounts that are based on management’s best
estimates and judgments. Estimates are used in determining
such items as accruals for rebates receivable and payable,
depreciable/amortizable lives, testing for impairment of long-
lived assets, income taxes, pension and other postretirement
benefit plan assumptions, amounts recorded for contingencies,
and other reserves. Because of the uncertainty inherent in such
estimates, actual results may differ from these estimates.
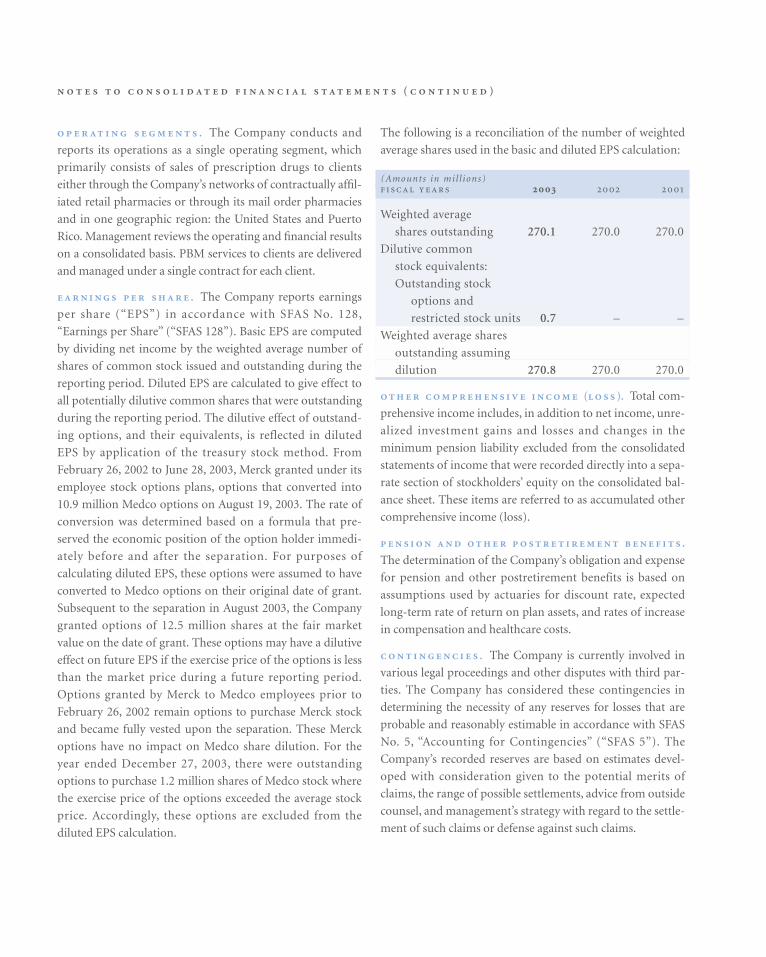
( )
. The Company conducts and
reports its operations as a single operating segment, which
primarily consists of sales of prescription drugs to clients
either through the Company’s networks of contractually affil-
iated retail pharmacies or through its mail order pharmacies
and in one geographic region: the United States and Puerto
Rico. Management reviews the operating and financial results
on a consolidated basis. PBM services to clients are delivered
and managed under a single contract for each client.
. The Company reports earnings
per share (“EPS”) in accordance with SFAS No. 128,
“Earnings per Share” (“SFAS 128”). Basic EPS are computed
by dividing net income by the weighted average number of
shares of common stock issued and outstanding during the
reporting period. Diluted EPS are calculated to give effect to
all potentially dilutive common shares that were outstanding
during the reporting period. The dilutive effect of outstand-
ing options, and their equivalents, is reflected in diluted
EPS by application of the treasury stock method. From
February 26, 2002 to June 28, 2003, Merck granted under its
employee stock options plans, options that converted into
10.9 million Medco options on August 19, 2003. The rate of
conversion was determined based on a formula that pre-
served the economic position of the option holder immedi-
ately before and after the separation. For purposes of
calculating diluted EPS, these options were assumed to have
converted to Medco options on their original date of grant.
Subsequent to the separation in August 2003, the Company
granted options of 12.5 million shares at the fair market
value on the date of grant. These options may have a dilutive
effect on future EPS if the exercise price of the options is less
than the market price during a future reporting period.
Options granted by Merck to Medco employees prior to
February 26, 2002 remain options to purchase Merck stock
and became fully vested upon the separation. These Merck
options have no impact on Medco share dilution. For the
year ended December 27, 2003, there were outstanding
options to purchase 1.2 million shares of Medco stock where
the exercise price of the options exceeded the average stock
price. Accordingly, these options are excluded from the
diluted EPS calculation.
The following is a reconciliation of the number of weighted
average shares used in the basic and diluted EPS calculation:
(Amounts in mil l ions)
Weighted average
shares outstanding 270.1 270.0 270.0
Dilutive common
stock equivalents:
Outstanding stock
options and
restricted stock units 0.7 – –
Weighted average shares
outstanding assuming
dilution 270.8 270.0 270.0
( ). Total com-
prehensive income includes, in addition to net income, unre-
alized investment gains and losses and changes in the
minimum pension liability excluded from the consolidated
statements of income that were recorded directly into a sepa-
rate section of stockholders’ equity on the consolidated bal-
ance sheet. These items are referred to as accumulated other
comprehensive income (loss).
.
The determination of the Company’s obligation and expense
for pension and other postretirement benefits is based on
assumptions used by actuaries for discount rate, expected
long-term rate of return on plan assets, and rates of increase
in compensation and healthcare costs.
. The Company is currently involved in
various legal proceedings and other disputes with third par-
ties. The Company has considered these contingencies in
determining the necessity of any reserves for losses that are
probable and reasonably estimable in accordance with SFAS
No. 5, “Accounting for Contingencies” (“SFAS 5”). The
Company’s recorded reserves are based on estimates devel-
oped with consideration given to the potential merits of
claims, the range of possible settlements, advice from outside
counsel, and management’s strategy with regard to the settle-
ment of such claims or defense against such claims.

M E D C O H E A LT H S O L U T I O N S , I N C . 5 7
. In July
2002, the Financial Accounting Standards Board (“FASB”)
issued SFAS No. 146, “Accounting for Costs Associated with
Exit or Disposal Activities” (“SFAS 146”), which is effective
for exit or disposal activities initiated after December 31,
2002. SFAS 146 requires companies to recognize costs,
including one-time termination benefit plans, associated
with exit or disposal activities when they are incurred rather
than at the date of a commitment to an exit or disposal plan.
The Company adopted this standard on January 1, 2003, and
it did not have a material effect on the results of operations,
cash flows or financial position. The Company provides for
severance in accordance with the SFAS 5 approach under
SFAS No. 112, “Employers’ Accounting for Postemployment
Benefits,” when management decisions to incur severance
costs result in those costs being probable and reasonably
estimable under the Company’s severance plan.
In November 2002, the FASB issued Interpretation No. 45,
“Guarantor’s Accounting and Disclosure Requirements for
Guarantees, Including Indirect Guarantees of Indebtedness
of Others” (“FIN 45”). FIN 45 requires that a liability be
recorded in the guarantor’s balance sheet at fair value upon
issuance of certain guarantees. The recognition provisions of
FIN 45 are effective for guarantees issued or modified after
December 31, 2002. The disclosure requirements of FIN 45
are effective for financial statements of interim or annual
periods ended after December 15, 2002. The Company has
determined that its client performance guarantees and most
of its recent guarantees to Merck under the managed care
agreement and the various distribution agreements are out-
side the scope of FIN 45, since these guarantees relate to the
Company’s future performance under contractual agree-
ments. The fair value of the remaining Merck guarantees was
not material and, as a result, the adoption of FIN 45 did not
have a material impact on the Company’s results of opera-
tions, cash flows or financial position.
In November 2002, the EITF reached a consensus on Issue
No. 00-21, “Revenue Arrangements With Multiple
Deliverables” (“EITF 00-21”), which is effective for contracts
entered into after June 15, 2003. EITF 00-21 establishes the
criteria under which individual components of contractual
arrangements with clients could be identified as “separate
units of accounting” and accounted for as distinct revenue-
generating events under the existing accounting standards
governing revenue recognition, including Staff Accounting
Bulletin (“SAB”) No. 101, “Revenue Recognition in Financial
Statements” (“SAB 101”). Clients who contract with the
Company for pharmaceutical benefits management may also
contract with the Company for administrative and other serv-
ices. These multiple deliverables are generally reflected in a
single contract. Each material component of the contract has
been separately and specifically priced based on its relative
market value, and has historically been accounted for as a sep-
arate unit of accounting for revenue recognition purposes.
Accordingly, the adoption of EITF 00-21 in 2003 did not have
a material impact on the Company’s results of operations,
cash flows or financial position.
In December 2003, the Staff of the Securities and Exchange
Commission issued SAB No. 104, “Revenue Recognition”
(“SAB 104”), which supercedes SAB 101. SAB 104’s primary
purpose is to rescind accounting guidance contained in SAB
101 related to multiple element revenue arrangements,
superceded as a result of the issuance of EITF 00-21. As previ-
ously discussed, the Company’s adoption of EITF 00-21 did
not have a material impact on its results of operations, cash
flows or financial position, and, consequently, the Company’s
revenue recognition policy is in accordance with SAB 104.
In December 2002, the FASB issued SFAS No. 148,
“Accounting for Stock-Based Compensation – Transition and
Disclosure – an amendment to SFAS No. 123” (“SFAS 148”),
which provides alternative methods of transition for compa-
nies voluntarily planning on implementing the fair value
recognition provisions of SFAS 123. SFAS 148 also revises the
disclosure provisions of SFAS 123 to require more prominent
disclosure of the method of accounting for stock-based com-
pensation, and it requires disclosure of pro forma net income
and earnings per share as if the fair value recognition provi-
sions of SFAS 123 had been applied from the original effec-
tive date of SFAS 123. The Company has adopted the
disclosure provisions of SFAS 148.
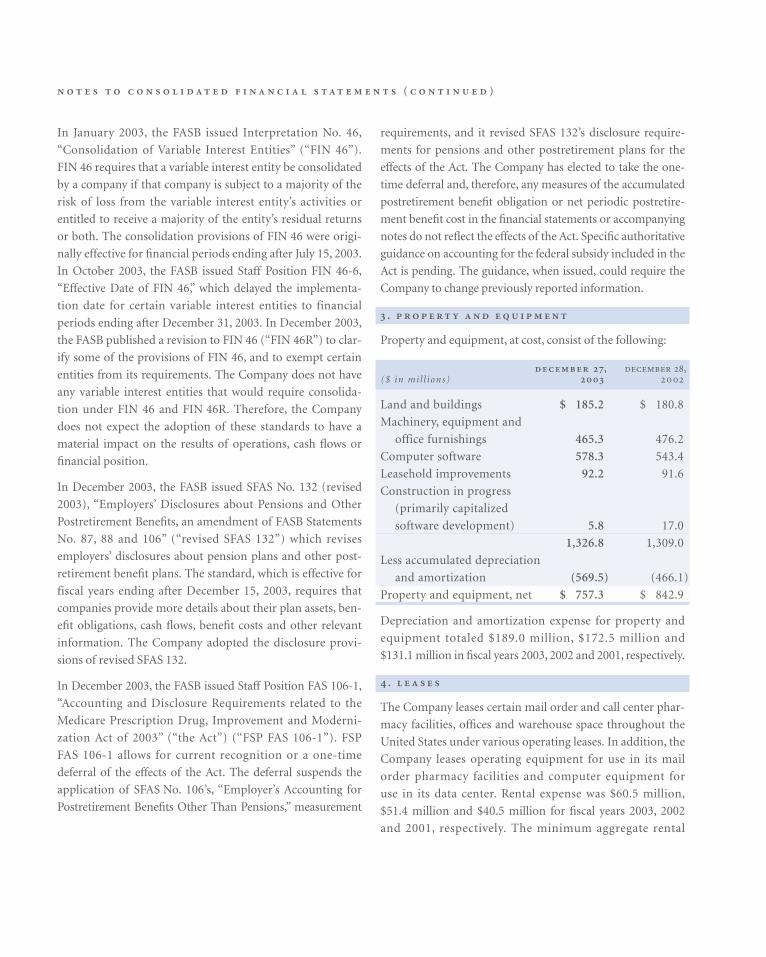
( )
In January 2003, the FASB issued Interpretation No. 46,
“Consolidation of Variable Interest Entities” (“FIN 46”).
FIN 46 requires that a variable interest entity be consolidated
by a company if that company is subject to a majority of the
risk of loss from the variable interest entity’s activities or
entitled to receive a majority of the entity’s residual returns
or both. The consolidation provisions of FIN 46 were origi-
nally effective for financial periods ending after July 15, 2003.
In October 2003, the FASB issued Staff Position FIN 46-6,
“Effective Date of FIN 46,” which delayed the implementa-
tion date for certain variable interest entities to financial
periods ending after December 31, 2003. In December 2003,
the FASB published a revision to FIN 46 (“FIN 46R”) to clar-
ify some of the provisions of FIN 46, and to exempt certain
entities from its requirements. The Company does not have
any variable interest entities that would require consolida-
tion under FIN 46 and FIN 46R. Therefore, the Company
does not expect the adoption of these standards to have a
material impact on the results of operations, cash flows or
financial position.
In December 2003, the FASB issued SFAS No. 132 (revised
2003), “Employers’ Disclosures about Pensions and Other
Postretirement Benefits, an amendment of FASB Statements
No. 87, 88 and 106” (“revised SFAS 132”) which revises
employers’ disclosures about pension plans and other post-
retirement benefit plans. The standard, which is effective for
fiscal years ending after December 15, 2003, requires that
companies provide more details about their plan assets, ben-
efit obligations, cash flows, benefit costs and other relevant
information. The Company adopted the disclosure provi-
sions of revised SFAS 132.
In December 2003, the FASB issued Staff Position FAS 106-1,
“Accounting and Disclosure Requirements related to the
Medicare Prescription Drug, Improvement and Moderni-
zation Act of 2003” (“the Act”) (“FSP FAS 106-1”). FSP
FAS 106-1 allows for current recognition or a one-time
deferral of the effects of the Act. The deferral suspends the
application of SFAS No. 106’s, “Employer’s Accounting for
Postretirement Benefits Other Than Pensions,” measurement
requirements, and it revised SFAS 132’s disclosure require-
ments for pensions and other postretirement plans for the
effects of the Act. The Company has elected to take the one-
time deferral and, therefore, any measures of the accumulated
postretirement benefit obligation or net periodic postretire-
ment benefit cost in the financial statements or accompanying
notes do not reflect the effects of the Act. Specific authoritative
guidance on accounting for the federal subsidy included in the
Act is pending. The guidance, when issued, could require the
Company to change previously reported information.
.
Property and equipment, at cost, consist of the following:
, ,($ in mil l ions)
Land and buildings $ 185.2 $ 180.8
Machinery, equipment and
office furnishings 465.3 476.2
Computer software 578.3 543.4
Leasehold improvements 92.2 91.6
Construction in progress
(primarily capitalized
software development) 5.8 17.0
1,326.8 1,309.0
Less accumulated depreciation
and amortization (569.5) (466.1)
Property and equipment, net $ 757.3 $ 842.9
Depreciation and amortization expense for property and
equipment totaled $189.0 million, $172.5 million and
$131.1 million in fiscal years 2003, 2002 and 2001, respectively.
.
The Company leases certain mail order and call center phar-
macy facilities, offices and warehouse space throughout the
United States under various operating leases. In addition, the
Company leases operating equipment for use in its mail
order pharmacy facilities and computer equipment for
use in its data center. Rental expense was $60.5 million,
$51.4 million and $40.5 million for fiscal years 2003, 2002
and 2001, respectively. The minimum aggregate rental
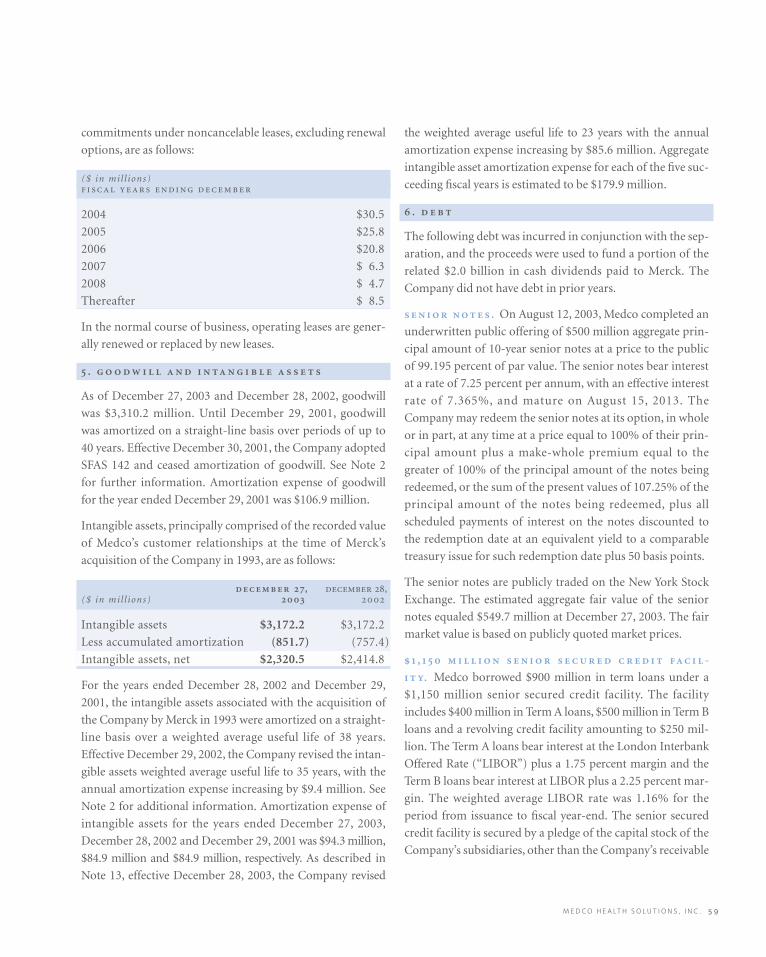
M E D C O H E A LT H S O L U T I O N S , I N C . 5 9
commitments under noncancelable leases, excluding renewal
options, are as follows:
($ in mil l ions)
2004 $30.5
2005 $25.8
2006 $20.8
2007 $ 6.3
2008 $ 4.7
Thereafter $ 8.5
In the normal course of business, operating leases are gener-
ally renewed or replaced by new leases.
.
As of December 27, 2003 and December 28, 2002, goodwill
was $3,310.2 million. Until December 29, 2001, goodwill
was amortized on a straight-line basis over periods of up to
40 years. Effective December 30, 2001, the Company adopted
SFAS 142 and ceased amortization of goodwill. See Note 2
for further information. Amortization expense of goodwill
for the year ended December 29, 2001 was $106.9 million.
Intangible assets, principally comprised of the recorded value
of Medco’s customer relationships at the time of Merck’s
acquisition of the Company in 1993, are as follows:
, ,($ in mil l ions)
Intangible assets $3,172.2 $3,172.2
Less accumulated amortization (851.7) (757.4)
Intangible assets, net $2,320.5 $2,414.8
For the years ended December 28, 2002 and December 29,
2001, the intangible assets associated with the acquisition of
the Company by Merck in 1993 were amortized on a straight-
line basis over a weighted average useful life of 38 years.
Effective December 29, 2002, the Company revised the intan-
gible assets weighted average useful life to 35 years, with the
annual amortization expense increasing by $9.4 million. See
Note 2 for additional information. Amortization expense of
intangible assets for the years ended December 27, 2003,
December 28, 2002 and December 29, 2001 was $94.3 million,
$84.9 million and $84.9 million, respectively. As described in
Note 13, effective December 28, 2003, the Company revised
the weighted average useful life to 23 years with the annual
amortization expense increasing by $85.6 million. Aggregate
intangible asset amortization expense for each of the five suc-
ceeding fiscal years is estimated to be $179.9 million.
.
The following debt was incurred in conjunction with the sep-
aration, and the proceeds were used to fund a portion of the
related $2.0 billion in cash dividends paid to Merck. The
Company did not have debt in prior years.
. On August 12, 2003, Medco completed an
underwritten public offering of $500 million aggregate prin-
cipal amount of 10-year senior notes at a price to the public
of 99.195 percent of par value. The senior notes bear interest
at a rate of 7.25 percent per annum, with an effective interest
rate of 7.365%, and mature on August 15, 2013. The
Company may redeem the senior notes at its option, in whole
or in part, at any time at a price equal to 100% of their prin-
cipal amount plus a make-whole premium equal to the
greater of 100% of the principal amount of the notes being
redeemed, or the sum of the present values of 107.25% of the
principal amount of the notes being redeemed, plus all
scheduled payments of interest on the notes discounted to
the redemption date at an equivalent yield to a comparable
treasury issue for such redemption date plus 50 basis points.
The senior notes are publicly traded on the New York Stock
Exchange. The estimated aggregate fair value of the senior
notes equaled $549.7 million at December 27, 2003. The fair
market value is based on publicly quoted market prices.
, -
. Medco borrowed $900 million in term loans under a
$1,150 million senior secured credit facility. The facility
includes $400 million in Term A loans, $500 million in Term B
loans and a revolving credit facility amounting to $250 mil-
lion. The Term A loans bear interest at the London Interbank
Offered Rate (“LIBOR”) plus a 1.75 percent margin and the
Term B loans bear interest at LIBOR plus a 2.25 percent mar-
gin. The weighted average LIBOR rate was 1.16% for the
period from issuance to fiscal year-end. The senior secured
credit facility is secured by a pledge of the capital stock of the
Company’s subsidiaries, other than the Company’s receivable
( )
subsidiary discussed below and its subsidiaries that are
engaged in insurance-related activities.
Scheduled repayments of amounts outstanding under the
Term A and Term B loans began on December 31, 2003.
Principal payments are scheduled in quarterly installments
with the last payment of the Term A loan scheduled for
June 30, 2008 and the last payment of the Term B loan sched-
uled for June 30, 2010. The fair value of the senior secured
credit facility approximates its carrying value, and was esti-
mated using quoted interbank market prices.
. The
Company, through a wholly-owned subsidiary, entered into a
$500 million, 364-day renewable accounts receivable financ-
ing facility that is collateralized by the Company’s pharma-
ceutical manufacturer accounts receivable. In conjunction
with the separation from Merck, the Company drew down
$100 million under this facility, which was subsequently
repaid in the fourth quarter of 2003.
The Company’s debt as of December 27, 2003, consists of
the following:
,($ in mil l ions)
Short-term debt:
Current portion of long-term debt(1) $ 50.0
Total short-term debt 50.0
Long-term debt:
Term A loans, net of current portion(1) 355.0
Term B loans, net of current portion(1) 495.0
7.25% senior notes due 2013, net of discount 496.1
Total long-term debt 1,346.1
Total debt $1,396.1
(1) The current portion of long-term debt includes $45.0 million associated
with the Term A loans and $5.0 million associated with the Term B loans.
The senior secured credit facility and the accounts receivable
financing facility contain covenants, including, among other
items, limitations on capital expenditures, minimum fixed
charges and total leverage ratios. In addition, the senior
notes contain covenants, including, among other items,
restrictions on additional indebtedness, dividends, share
repurchases, and asset sales and liens. As of December 27,
2003, the Company is in compliance with all covenants.
The aggregate maturities of long-term debt for each of the
next five fiscal years are as follows: 2004, $50.0 million; 2005,
$91.3 million; 2006, $68.8 million; 2007, $112.5 million and
2008, $102.5 million.
.
. The Company and its subsidiaries have various plans
covering substantially all of its employees. The Company
uses its fiscal year end date as the measurement date for the
majority of its plans. The net cost for the Company’s pension
plans, principally the Medco Health Solutions Cash Balance
Retirement Plan, consisted of the following components:
($ in mil l ions)
Service cost $15.6 $13.6 $11.2
Interest cost 5.2 4.4 3.4
Expected return on
plan assets (6.9) (5.7) (5.7)
Net amortization of
actuarial losses 2.2 0.7 –
Net pension cost $16.1 $13.0 $8.9
The Company maintains postretirement healthcare benefit
plans for its employees. The net cost of these postretire-
ment benefits, other than pensions, consisted of the follow-
ing components:
($ in mil l ions)
Service cost $12.9 $12.3 $ 9.2
Interest cost 5.9 4.7 3.4
Amortization of prior
service costs 0.8 2.6 2.6
Net amortization of
actuarial losses 1.8 0.1 –
Net postretirement
benefit cost $21.4 $19.7 $15.2
The cost of healthcare and life insurance benefits for active
employees was $95.1 million in 2003, $104.4 million in 2002
and $88.7 million in 2001.
M E D C O H E A LT H S O L U T I O N S , I N C . 6 1
. The Company’s pension plan asset allocation at December 27, 2003, December 28, 2002 and tar-
get allocation for 2004 by asset category are as follows:
, ,
U.S. equity securities 49–61% 55% 49%
International equity securities 12–18% 16% 21%
Fixed income instruments 25–31% 27% 17%
Real estate – – 4%
Cash and other 1–5% 2% 9%
Total 100% 100%
The Company believes that the portfolio’s equity weighting strategy is consistent with investment goals and risk management
practices applicable to the long-term nature of the plan’s benefit obligation.
. Summarized information about the changes in plan assets
and benefit obligation is as follows:
($ in mil l ions)
Fair value of plan assets at beginning of year $80.5 $52.4 $ – $ –
Actual return on plan assets 22.7 (7.9) – –
Company contributions 0.1 40.7 1.2 0.8
Employee contributions – – 0.3 0.2
Benefits paid (6.8) (4.7) (1.5) (1.0)
Fair value of plan assets at end of year $96.5 $80.5 $ – $ –
Benefit obligation at beginning of year $81.8 $58.8 $ 104.2 $ 60.8
Service cost 15.8 13.6 12.9 12.3
Interest cost 5.2 4.4 5.9 4.7
Employee contributions – – 0.3 0.2
Plan amendment(1) – – $(103.4) –
Actuarial losses (gains) (1.7) 9.7 10.0 27.2
Benefits paid (6.8) (4.7) (1.4) (1.0)
Benefit obligation at end of year $94.3 $81.8 $ 28.5 $104.2
(1) In the fourth quarter of 2003, the Company amended the postretirement health benefit plan. The amendment included changes to age and service
requirements, introduction of a limit (or cap) on company subsidies to be based on 2004 costs, and reduced subsidies for spouses and dependents.
( )
The accumulated benefit obligation for all defined bene-
fit plans was $87.8 million and $78.6 million at December 27,
2003 and December 28, 2002, respectively.
Unrecognized net (loss) gain amounts reflect experience dif-
ferentials relating to differences between expected and actual
returns on plan assets; differences between expected and
actual healthcare cost increases, and the effects of changes in
actuarial assumptions. Expected returns are based on the
market value of assets. Total unrecognized net (loss) gain
amounts in excess of certain thresholds are amortized into
net pension and other postretirement benefit costs over the
average remaining service life of employees.
. Actuarial weighted average assumptions used in determining plan information are as follows:
Weighted average assumptions
used to determine
benefit obligations:
Discount rate 6.00% 6.50% 7.25% 6.00% 6.50% 7.25%
Salary growth rate 4.50% 4.50% 4.50% – – –
Weighted average assumptions
used to determine net cost:
Discount rate 6.00% 6.50% 7.25% 6.00% 6.50% 7.25%
Expected long-term rate
of return on plan assets 8.75% 10.00% 10.00% – – –
Salary growth rate 4.50% 4.50% 4.50% – – –
A reconciliation of the plans’ funded status to the net asset (liability) recognized at year-end 2003 and 2002 is as follows:
($ in mil l ions)
Plan assets in excess of (less than) benefit obligation $ 2.1 $ (1.3) $(28.5) $(104.2)
Unrecognized net loss 13.4 33.7 38.3 30.0
Unrecognized initial benefit obligation – – – –
Unrecognized prior service cost (benefit) – – (63.9) 40.4
Net asset (liability) $15.5 $32.4 $(54.1) $ (33.8)
Recognized as:
Other noncurrent assets $15.5 $32.4 $ – $ –
Other noncurrent liabilities $ – $ – $(54.1) $ (33.8)
Additional Information:
($ in mil l ions)
Decrease in minimum liability included in
other comprehensive income $ – $8.7 $ – $ –
M E D C O H E A LT H S O L U T I O N S , I N C . 6 3
The Company reassesses its benefit plan assumptions on a
regular basis. For 2003, the Company changed its expected
long-term rate of return on plan assets from 10.0% to 8.75%
for pension benefits. For 2004, the Company has further
decreased its expected long-term rate of return on plan assets
from 8.75% to 8.00%.
The expected rate of return for the pension plan represents
the average rate of return to be earned on the plan assets over
the period that the benefits included in the benefit obligation
are to be paid. In developing the expected rate of return, the
Company considers long-term compound annualized
returns of historical market data, as well as historical actual
returns on the Company’s plan assets. Using this reference
information, the Company develops forward-looking return
expectations for each asset category and a weighted average
expected long-term rate of return for a targeted portfolio
allocated across these investment categories.
Actuarial assumptions are based on management’s best esti-
mates and judgment. A reasonably possible change of plus
(minus) 25 basis points in the discount rate assumption, with
other assumptions held constant, would have an estimated
$1.7 million favorable (unfavorable) impact on net pension
and postretirement benefit cost. A reasonably possible
change of plus (minus) 25 basis points in the expected rate of
return assumption, with other assumptions held constant,
would have an estimated $0.2 million favorable (unfavor-
able) impact on net pension cost.
The healthcare cost trend rate for other postretirement benefit
plans for 2004 is 11.5%. Since the plan will be capped based
on 2004 costs, employer liability will not be affected by health-
care cost trend after 2004.
The Company expects to have a minimum pension funding
requirement under the Internal Revenue Code (“IRC”) during
2004. The preceding hypothetical changes in discount rate
and expected rate of return assumptions would not impact
the Company’s funding requirements.
Employer Contributions. The following is a summary of the
Company’s actual contributions for 2002 and 2003, and
expected contributions for 2004:
- ($ in mil l ions)
2002 $40.7 $0.8
2003 – 1.2
2004 (expected) 9.0 1.5
The $9.0 million expected to be contributed to the pension
plans during 2004 is estimated to be needed to satisfy mini-
mum funding requirements, and no additional contributions
are expected to be contributed at Medco’s discretion. The
Company anticipates that the contributions will consist
solely of cash.
Contributions by participants to the other postretirement
benefit plans were $0.3 million and $0.2 million for the years
ending December 27, 2003 and December 28, 2002, respec-
tively. There were no contributions by participants to these
plans for the year ending December 29, 2001.
. The Company participates in a multi-
employer defined benefit retirement plan that covers certain
union employees. The Company made contributions to the
plan of $1.0 million in 2003, $1.0 million in 2002 and
$0.7 million in 2001.
The Company sponsors a defined contribution retirement
plan for all eligible employees, as defined in the plan docu-
ments. This plan is qualified under Section 401(k) of the
IRC. Contributions to the plan are based on employee con-
tributions and a Company match. The Company’s contribu-
tions to the plan were $17.6 million in 2003, $17.9 million in
2002 and $17.4 million in 2001.
.
Effective May 21, 2002, the Company changed its tax status to
that of a corporation, and it provides for and directly pays
federal and state income taxes as discussed in Notes 2 and 12.
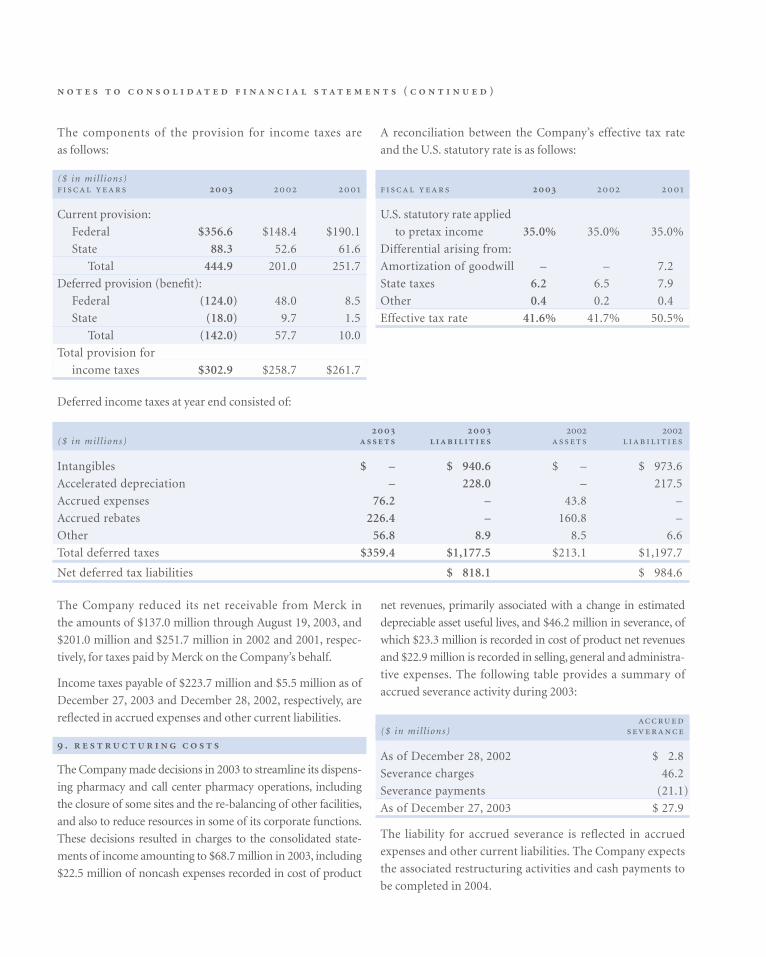
( )
The Company reduced its net receivable from Merck in
the amounts of $137.0 million through August 19, 2003, and
$201.0 million and $251.7 million in 2002 and 2001, respec-
tively, for taxes paid by Merck on the Company’s behalf.
Income taxes payable of $223.7 million and $5.5 million as of
December 27, 2003 and December 28, 2002, respectively, are
reflected in accrued expenses and other current liabilities.
.
The Company made decisions in 2003 to streamline its dispens-
ing pharmacy and call center pharmacy operations, including
the closure of some sites and the re-balancing of other facilities,
and also to reduce resources in some of its corporate functions.
These decisions resulted in charges to the consolidated state-
ments of income amounting to $68.7 million in 2003, including
$22.5 million of noncash expenses recorded in cost of product
net revenues, primarily associated with a change in estimated
depreciable asset useful lives, and $46.2 million in severance, of
which $23.3 million is recorded in cost of product net revenues
and $22.9 million is recorded in selling, general and administra-
tive expenses. The following table provides a summary of
accrued severance activity during 2003:
($ in mil l ions)
As of December 28, 2002 $ 2.8
Severance charges 46.2
Severance payments (21.1)
As of December 27, 2003 $ 27.9
The liability for accrued severance is reflected in accrued
expenses and other current liabilities. The Company expects
the associated restructuring activities and cash payments to
be completed in 2004.
Deferred income taxes at year end consisted of:
($ in mil l ions)
Intangibles $ – $ 940.6 $ – $ 973.6
Accelerated depreciation – 228.0 – 217.5
Accrued expenses 76.2 – 43.8 –
Accrued rebates 226.4 – 160.8 –
Other 56.8 8.9 8.5 6.6
Total deferred taxes $359.4 $1,177.5 $213.1 $1,197.7
Net deferred tax liabilities $ 818.1 $ 984.6
The components of the provision for income taxes are
as follows:
($ in mil l ions)
Current provision:
Federal $356.6 $148.4 $190.1
State 88.3 52.6 61.6
Total 444.9 201.0 251.7
Deferred provision (benefit):
Federal (124.0) 48.0 8.5
State (18.0) 9.7 1.5
Total (142.0) 57.7 10.0
Total provision for
income taxes $302.9 $258.7 $261.7
A reconciliation between the Company’s effective tax rate
and the U.S. statutory rate is as follows:
U.S. statutory rate applied
to pretax income 35.0% 35.0% 35.0%
Differential arising from:
Amortization of goodwill – – 7.2
State taxes 6.2 6.5 7.9
Other 0.4 0.2 0.4
Effective tax rate 41.6% 41.7% 50.5%
M E D C O H E A LT H S O L U T I O N S , I N C . 6 5
.
In the normal course of business, the Company regularly
enters into purchase commitments covering inventory
requirements of its mail order pharmacies for periods of gen-
erally up to one year. These commitments generally reflect the
minimum purchase requirements of these pharmaceutical
manufacturers and distributors. As of December 27, 2003,
contractual obligations for these purchase commitments
totaled $14.8 million for 2004.
The Company and its subsidiaries are parties to a variety of
legal proceedings including several cases in which substantial
amounts of damages are sought.
. On September 29, 2003, the U.S.
Attorney’s Office for the Eastern District of Pennsylvania
filed a complaint alleging violations of the federal False
Claims Act and asserting other legal claims. The complaint
alleges, among other things, that the Company canceled and
later re-entered prescriptions in order to avoid violating con-
tractual guarantees regarding prescription dispensing turn-
around times in its mail order pharmacies; dispensed fewer
pills than reported to the patient and charged clients based
on the reported number of units dispensed; favored the
products of certain manufacturers, including Merck, over
less expensive products; and engaged in improper pharmacy
practices. On December 9, 2003, the U.S. Attorney’s Office
filed an amended complaint, which adds two former employ-
ees of the Company as defendants and, among other addi-
tional legal claims, asserts a claim against the Company
under the Public Contracts Anti-Kickback Act for allegedly
making improper payments to health plans to induce such
plans to select the Company as a PBM for government con-
tracts. The District of Columbia, Commonwealth of Massa-
chusetts, and State of Nevada have intervened in the action.
The U.S. Attorney’s Office’s filing of the complaint and
amended complaint followed its June 23, 2003 filing of a
notice of intervention with respect to two pending qui tam,
or whistleblower, complaints originally filed in February
2000 under the federal False Claims Act and similar state
laws. The qui tam actions are currently pending. In one of the
actions, Merck is named as a defendant.
The U.S. Attorney’s Office seeks, among other things, to
change the Company’s business practices and to impose
monetary damages and fines that could have a materially
adverse impact on the Company’s results of operations and
financial condition. On December 19, 2003, the Company
filed a motion to dismiss the U.S. Attorney’s Office’s com-
plaint and the two qui tam actions discussed above. The
court has not yet ruled on the motion.
On December 22, 2003, the Board of the State Teachers
Retirement System of Ohio (STRS), a former client, filed a
complaint against Merck and the Company in Ohio state
court. STRS alleges, among other things, that the Company
overcharged STRS on mail order dispensing fees; charged
more for generic drugs filled through mail order than retail
pharmacies charge for the same drugs; canceled and
re-entered prescription orders in order to meet contractual
performance guarantees regarding turnaround times; under-
counted pills, and engaged in other unlawful pharmacy prac-
tices. Many of the allegations appear to be taken directly from
the complaint filed by the U.S. Attorney’s Office discussed
above. STRS asserts claims against the Company for breach
of contract, against Merck for tortious interference with con-
tract, and against both Merck and the Company for breach of
fiduciary duties; violation of state consumer protection and
deceptive trade practices laws; unjust enrichment, and fraud.
On April 16, 2003, the Company received a letter from the
Office of the Maine Attorney General seeking information
concerning the Company’s PBM practices. The letter was
written on behalf of Maine and 21 other states, and is in con-
nection with a review of the pharmaceutical industry and
PBM practices. The Company understands that two addi-
tional states have joined the group of states conducting such
review, and that four states (including Ohio) have withdrawn
from the group.
On August 14, 2003, the Company and three of its sub-
sidiaries received an investigative subpoena from the Office
of the Florida Attorney General Medicaid Fraud Control
Unit. The Company has complied with the subpoena. The
subpoena, which provided a list of Florida HMOs, requested
copies of contracts between the Company and any of the
listed HMOs, as well as claims data relating to the Company’s
( )
dispensing of prescription drugs and related services to Medicaid
patients through the Company’s mail order pharmacies.
The Company is cooperating with Maine and the other
states to provide them with more information about the
Company’s business practices. Such cooperation includes
informal discussions with various states from time to time
and responses to requests from certain states for information
specific to those states. The Company cannot predict the out-
come of these investigations or whether any related actions
challenging our business practices will be commenced.
The Company believes that its business practices comply in
all material respects with applicable laws and regulations and
it intends to vigorously defend the actions described above.
Nevertheless, the outcome of the proceedings and requests
for information discussed above is uncertain. The actions
and requests for information are at an early stage, and the
Company is unable to predict whether additional claims and
actions (including actions seeking injunctive relief) will be
asserted or to predict the total relief (including damages and
fines) that could be made. These lawsuits and the investiga-
tions described above arise in an environment of rising costs
for prescription drugs and heightened public scrutiny of the
pharmaceutical industry, including the PBM industry and its
practices. This public scrutiny is characterized by extensive press
coverage; ongoing attention in Congress and in state legisla-
tures, and investigations and public statements by law enforce-
ment officials. These factors contribute to the uncertainty
regarding the possible course and outcome of the litigation
and investigations discussed above.
We are unable to predict the outcome of any of the lawsuits
or investigations described above. In addition, in connec-
tion with the Company’s separation from Merck, the
Company entered into an indemnification and insurance
matters agreement with Merck. To the extent that the
Company is required to indemnify Merck for liabilities aris-
ing out of a lawsuit, an adverse outcome with respect to
Merck could result in the Company making indemnifica-
tion payments in amounts that could be material, in addi-
tion to any damages that the Company is required to pay.
For these reasons, an adverse outcome in one of these suits
or in any proceeding arising from one of these investiga-
tions could result in material fines and damages; material
changes to the Company’s business practices; loss of (or lit-
igation with) clients; and other penalties, and it could have
a material adverse effect on the Company’s business, finan-
cial condition, liquidity and operating results.
. In December 1997, a
lawsuit captioned Gruer v. Merck-Medco Managed Care,
L.L.C. was filed in the U.S. District Court for the Southern
District of New York against Merck and the Company. The
suit alleges that the Company should be treated as a “fiduci-
ary” under the provisions of ERISA and that the Company
has breached fiduciary obligations under ERISA in connec-
tion with the Company’s development and implementation
of formularies, preferred drug listings and intervention pro-
grams. After the Gruer case was filed, six other cases have
been filed in the same court asserting similar claims; one of
these cases was voluntarily dismissed. The plaintiffs in these
cases, who are individual plan members and claim to repre-
sent the interests of six different pharmaceutical benefit plans
for which the Company is the PBM, contend that, in accept-
ing and retaining certain rebates, the Company has failed to
make adequate disclosure and has acted in the Company’s
own best interest and against the interests of the Company’s
clients. The plaintiffs also allege that the Company was
wrongly used to increase Merck’s market share, claiming that
under ERISA the Company’s drug formulary choices and
therapeutic interchange programs were “prohibited trans-
actions” that favor Merck’s products. The plaintiffs have
demanded that Merck and the Company turn over any
unlawfully obtained profits to a trust to be set up for the
benefit plans.
In December 2002, Merck and the Company agreed to settle
the Gruer series of lawsuits on a class action basis to avoid the
significant cost and distraction of protracted litigation.
Merck, the Company, and the plaintiffs in five of these
six cases filed a proposed class action settlement with the
court. On July 31, 2003, the court granted preliminary
approval to the settlement. Under the proposed settlement,
Merck and the Company have agreed to pay $42.5 million,
and the Company has agreed to change or to continue certain
specified business practices for a period of five years. The
proposed settlement would resolve litigation by pharmaceu-
tical benefit plans against Merck and the Company based on
ERISA and similar claims, except with respect to those plans
M E D C O H E A LT H S O L U T I O N S , I N C . 6 7
that affirmatively opt out of the settlement. It does not
involve the release of any potential antitrust claims. The
release of claims under the settlement would cover the period
from December 17, 1994 to the date that the settlement
receives final approval. In September 2003, the Company
paid $38.3 million to an escrow account, representing the
Company’s portion, or 90%, of the proposed settlement. This
payment was charged against accrued expenses and other
current liabilities, as the liability was recorded in prior peri-
ods. On December 11, 2003, the court conducted a hearing
for the purpose of entertaining objections to the settlement,
several of which have been filed, and determining, among
other things, whether the settlement should be finally
approved. At the hearing, the court directed that additional
notices of the settlement be mailed to certain members of the
settlement class. The hearing will continue in or about
April 2004. The settlement becomes final only if and when
the court grants final approval and all appeals have been
exhausted. The plaintiff ’s plan in the sixth case discussed
above has elected to opt out of the settlement.
Similar ERISA-based complaints against the Company and
Merck have been filed in eight additional actions by ERISA
plan participants, purportedly on behalf of their plans, and,
in some of the actions, similarly situated self-funded plans.
The complaints in these actions rely on many of the same
allegations as the Gruer series of lawsuits discussed above.
The ERISA plans themselves, which are not parties to these
lawsuits, have elected to participate in the proposed settle-
ment discussed above. In addition, a proposed class action
complaint against Merck and the Company has been filed
by trustees of another benefit plan in the U.S. District Court
for the Northern District of California. This plan has elected
to opt out of the settlement. These nine cases have been trans-
ferred and consolidated in the Southern District of New York
by order of the Judicial Panel on Multi-district Litigation.
In April 2003, a lawsuit captioned Peabody Energy
Corporation v. Medco Health Solutions, Inc., et al. was filed in
the U.S. District Court for the Eastern District of Missouri.
The complaint, filed by one of the Company’s clients, relies
on allegations similar to those in the ERISA cases discussed
above, in addition to allegations relating specifically to
Peabody. The complaint asserts that the Company breached
fiduciary duties under ERISA, violated a New Jersey con-
sumer protection law, improperly induced the client into
contracting with the Company, and breached the resulting
agreement. The plaintiff seeks compensatory, punitive and
treble damages, as well as rescission and restitution of rev-
enues that were allegedly improperly received by the
Company. On October 28, 2003, the Judicial Panel on Multi-
district Litigation transferred this action to the Southern
District of New York to be consolidated with the ERISA cases
pending against the Company in that court.
In December 2003, Peabody Energy Corporation filed a simi-
lar action against Merck in the U.S. District Court for the
Eastern District of Missouri. The complaint relies on allega-
tions similar to those in the ERISA cases discussed above and
in the case filed by Peabody against the Company. The com-
plaint asserts claims that Merck violated federal and state
racketeering laws, tortiously interfered with Peabody’s con-
tract with the Company, and was unjustly enriched. The
plaintiff seeks, among other things, compensatory damages
of approximately $35 million, treble damages, and restitution
of revenues that were allegedly improperly received by Merck.
In March 2003, a lawsuit captioned American Federation of
State, County and Municipal Employees v. AdvancePCS et. al.,
based on allegations similar to those in the ERISA cases dis-
cussed above, was filed against the Company and other major
PBMs in the Superior Court of California. The theory of lia-
bility in this action is based on a California law prohibiting
unfair business practices. The plaintiff, which purports to sue
on behalf of itself, California non-ERISA health plans, and all
individual participants in such plans, seeks injunctive relief
and disgorgement of revenues that were allegedly improperly
received by the Company. The court recently denied the
defendant PBMs’ motion to dismiss the action.
In June 2002, a lawsuit captioned Miles v. Merck-Medco
Managed Care, L.L.C., based on allegations similar to those in
the ERISA cases discussed above, was filed against Merck and
the Company in the Superior Court of California. The theory
of liability in this action is based on a California law prohibit-
ing unfair business practices. The plaintiff, who purports to
sue on behalf of the general public of California, seeks
injunctive relief and disgorgement of the revenues that were
allegedly improperly received by Merck and the Company.
( )
The Miles case was removed to the U.S. District Court for the
Southern District of California and, pursuant to the Multi-
district Litigation order discussed above, was later transferred
to the Southern District of New York and consolidated with the
ERISA cases pending against Merck and the Company in that
court. The court has not yet ruled on the plaintiff ’s motion to
remand the case back to the California state court.
In October 2002, the Company filed a declaratory judgment
action, captioned Medco Health Solutions, Inc., v. West Virginia
Public Employees Insurance Agency, in the Circuit Court of
Kanawha County, West Virginia, asserting the Company’s
right to retain certain cost savings in accordance with the
Company’s written agreement with the West Virginia Public
Employees Insurance Agency, or PEIA. In November 2002,
the State of West Virginia and PEIA filed a separate lawsuit
against Merck and the Company, also in the Circuit Court of
Kanawha County, West Virginia. This action was premised on
several state law theories, including violations of the West
Virginia Consumer Credit and Protection Act, conspiracy,
tortious interference, unjust enrichment, accounting, fraud
and breach of contract. The State of West Virginia and PEIA
sought civil penalties; compensatory and punitive damages,
and injunctive relief. In March 2003, in the declaratory judg-
ment action, PEIA filed a counterclaim, and the State of West
Virginia, which was joined as a party, filed a third-party com-
plaint against the Company and Merck, raising the same alle-
gations asserted by PEIA and the State of West Virginia in
their November 2002 action described above. The Company
and Merck filed a motion to dismiss the November 2002
action filed by the State of West Virginia and PEIA, and also
filed a motion to dismiss the counterclaim and third-party
complaint filed by the State of West Virginia and PEIA in the
Company’s declaratory judgment action. On November 6,
2003, the court granted the motion to dismiss the Consumer
Protection Act claims and certain other state law claims,
including the claims for conspiracy and tortious interference.
The court also dismissed without prejudice the various fraud
claims. The court denied the motion to dismiss with respect
to the claims for breach of contract, accounting and unjust
enrichment. On December 2, 2003, PEIA filed an amended
counterclaim and third-party complaint against Merck and
the Company, seeking to reassert its fraud claims and restate
certain of its other claims. On December 12, 2003, Merck filed
a motion to dismiss all of the claims against it. The court has
not yet ruled on that motion.
In July 2003, a lawsuit captioned Group Hospitalization and
Medical Services v. Merck-Medco Managed Care, et al., was filed
against the Company in New Jersey state court. In this action,
the Company’s former client, CareFirst Blue Cross Blue Shield,
asserts claims for violation of fiduciary duty under state law,
breach of contract; negligent misrepresentation, unjust
enrichment; violations of certain District of Columbia laws
regarding consumer protection and restraint of trade, and vio-
lation of a New Jersey law prohibiting racketeering. The plain-
tiff demands compensatory damages, punitive damages, treble
damages for certain claims, and restitution.
The Company does not believe that it is a fiduciary under
ERISA, and it believes that its business practices comply with
all applicable laws and regulations. The Company has denied
all allegations of wrongdoing and is vigorously defending all of
the lawsuits described above, although the Company has pro-
posed to settle some of them as described above. Many of these
lawsuits seek damages in unspecified amounts, which could be
material, and some seek treble or punitive damages or restitu-
tion of profits, any of which could be material in amount.
The outcome of each of these lawsuits is uncertain, and an
adverse determination in any one of them could result in
material damages or restitution and could materially limit
the Company’s business practices. In addition, to the extent
that the Company is required to indemnify Merck for liabilities
arising out of a lawsuit, an adverse outcome with respect to
Merck could result in the Company making indemnification
payments in amounts that could be material, in addition to
any damages that the Company is required to pay. For these
reasons, an adverse determination in any one or more of these
lawsuits could have a material adverse effect on the Company’s
business, financial condition, liquidity and operating results.
. On August 15, 2003, a lawsuit
captioned Brady Enterprises, Inc., et al. v. Medco Health
Solutions, Inc., et al., was filed in the U.S. District Court for
the Eastern District of Pennsylvania against Merck and the
Company. The plaintiffs, which seek to represent a national
class of retail pharmacies that have contracted with the

M E D C O H E A LT H S O L U T I O N S , I N C . 6 9
Company, allege that the Company has conspired with, acted
as the common agent for, and used the combined bargaining
power of plan sponsors to restrain competition in the market
for the dispensing and sale of prescription drugs. The plain-
tiffs allege that, through the alleged conspiracy, the Company
has engaged in various forms of anticompetitive conduct,
including, among other things, setting artificially low reim-
bursement rates to such pharmacies. The plaintiffs assert
claims for violation of the Sherman Act and seek treble dam-
ages and injunctive relief. In November 2003, Merck and the
Company filed motions to dismiss the complaint. The court
has not yet ruled on those motions.
On October 1, 2003, a lawsuit captioned North Jackson
Pharmacy, Inc., et al. v. Medco Health Solutions, Inc., et al., was
filed in the U.S. District Court for the Northern District of
Alabama against Merck and the Company. The plaintiffs,
which seek to represent a national class of independent retail
pharmacies that have contracted with the Company, allege in
an amended complaint that the Company has engaged in
price fixing and other unlawful concerted actions with oth-
ers, including other PBMs, to restrain trade in the dispensing
and sale of prescription drugs to customers of retail pharma-
cies who participate in programs or plans that pay for all or
part of the drugs dispensed. The plaintiffs allege that,
through such concerted action, the Company has engaged in
various forms of anticompetitive conduct, including, among
other things, setting reimbursement rates to such pharmacies
at unreasonably low levels. The plaintiffs assert claims for
violation of the Sherman Act and seek treble damages and
injunctive relief.
On January 20, 2004, a lawsuit captioned Alameda Drug
Company, Inc., et al. v. Medco Health Solutions, Inc., et al. was
filed against the Company and Merck in the Superior Court
of California. The plaintiffs, which seek to represent a class of
all California pharmacies that have contracted with the
Company and that have indirectly purchased prescription
drugs from Merck, allege, among other things, that since the
expiration of a 1995 consent injunction entered by the U.S.
District Court for the Northern District of California, if not
earlier, the Company has failed to maintain an Open
Formulary (as defined in the consent injunction), and that
the Company and Merck have failed to prevent nonpublic
information received from competitors of Merck and the
Company from being disclosed to each other. The complaint
also copies verbatim many of the allegations in the Amended
Complaint filed by the U.S. Attorney for the Eastern District
of Pennsylvania, discussed above. The plaintiffs further allege
that, as a result of these alleged practices, the Company has
been able to increase its market share and artificially reduce
the level of reimbursement to the retail pharmacy class mem-
bers, and that the prices of prescription drugs from Merck
and other pharmaceutical manufacturers that do business
with the Company have been fixed and raised above compet-
itive levels. The plaintiffs assert claims for violation of
California antitrust law and California law prohibiting unfair
business practices. The plaintiffs demand, among other
things, compensatory damages, restitution, disgorgement of
unlawfully obtained profits, and injunctive relief.
The Company denies all allegations of wrongdoing and
intends to vigorously defend the Brady, North Jackson
Pharmacy, and Alameda Drug Company cases. However, the
outcome of these lawsuits is uncertain, and an adverse deter-
mination in any of them could result in material damages,
which could be trebled, and could materially limit the
Company’s business practices. In addition, to the extent that
the Company is required to indemnify Merck for liabilities
arising out of a lawsuit, an adverse outcome with respect to
Merck could result in the Company making indemnification
payments in amounts that could be material, in addition to
any damages that the Company is required to pay. For these
reasons, an adverse determination in any of these lawsuits
could have a material adverse effect on the Company’s busi-
ness, financial condition, liquidity and operating results.
There remain approximately five lawsuits on behalf of fewer
than ten plaintiffs, to which the Company is a party, filed by
retail pharmacies against pharmaceutical manufacturers,
wholesalers and other major PBMs, challenging manufac-
turer discounting and rebating practices under various state
and federal antitrust laws, including the Robinson-Patman
Act. These suits, which were a part of a consolidated Multi-
district Litigation, captioned In re Brand Name Prescription
Drug Antitrust Litigation, allege that the Company knowingly
accepted rebates and discounts on purchases of brand-name
( )
prescription drugs in violation of the federal Robinson-
Patman Act. These suits seek damages and to enjoin the
Company from future violations of the Robinson-Patman
Act. Merck has agreed to indemnify the Company for any
monetary liabilities related to these lawsuits. However, any
adverse judgment or injunction could significantly limit the
Company’s ability to obtain discounts and rebates.
. The Company and Merck are
named as defendants in a number of purported class action law-
suits, all relating to the Company’s revenue recognition practices
for retail co-payments paid by members of plans for which the
Company provides PBM services. The class action lawsuits were
consolidated and amended to assert claims against Merck and
the Company and certain of the Company’s officers and direc-
tors relating to the Company’s revenue recognition practices for
retail co-payments, rebates received by the Company, and the
Company’s independent status. The Company and Merck have
filed a motion to dismiss these lawsuits.
On July 31, 2003, a shareholders derivative complaint was
filed in the U.S. District Court for the District of New Jersey
against Merck and the Company, certain of the Company’s
officers and directors, and Arthur Andersen LLP. The lawsuit
is based on allegations relating to the Company’s revenue
recognition practices for retail co-payments, and it further
alleges that certain individual defendants breached their fidu-
ciary duty by failing to prevent such practices from occurring
and also failing to prevent the conduct at issue in the Gruer
complaint and related actions, the antitrust claims pending in
the Northern District of Illinois, and the qui tam actions in
which the U.S. Attorney’s Office for the Eastern District of
Pennsylvania has intervened, each of which is described
above. The complaint seeks monetary damages from Merck
and the Company in an unspecified amount, as well as
injunctive and other relief. Merck and the Company have filed
a motion to dismiss the complaint.
The Company has denied all allegations of wrongdoing and is
vigorously defending each of the lawsuits described above.
These lawsuits seek damages in unspecified amounts, which
could be material. Merck has agreed to indemnify the
Company for a significant portion of any monetary liabilities
related to these lawsuits. However, the Company could be
liable for a material amount of any residual liabilities not
indemnified by Merck, and an adverse determination could
materially limit the Company’s business practices. For these
reasons, an adverse determination in any one or more of these
lawsuits could have a material adverse effect on the Company’s
business, financial condition and operating results.
. In May 2002, a lawsuit cap-
tioned Kessler v. Merck-Medco Managed Care, L.L.C. was filed
in the Superior Court of New Jersey. The plaintiff, who pur-
ported to represent a member class, alleged that the
Company improperly classified Tamoxifen as a brand-name
drug, resulting in a higher co-payment for members. The
complaint asserted claims under the New Jersey Consumer
Fraud Act and for unjust enrichment. In December 2002, a
putative class action lawsuit containing substantially similar
allegations to the Kessler case, captioned Smith v. Medco
Health Solutions, Inc., was filed in the Superior Court of New
Jersey. In June 2003, a putative class action lawsuit containing
substantially similar allegations, captioned Del Greco v.
Medco Health Solutions, Inc., was filed in the U.S. District
Court for the Southern District of New York. The plaintiff in
this action, however, asserted that the Company’s alleged
misclassification of Tamoxifen improperly denied plan bene-
fits and breached an alleged fiduciary duty under ERISA. On
December 5, 2003, the court granted the Company’s motion
for summary judgment in the Smith and Kessler actions and
dismissed all of the claims. On December 5, 2003, the court
in the Del Greco action granted the Company’s motion to dis-
miss with respect to nearly all of the claims, including all
monetary claims. The plaintiff in the Del Greco case has asked
the court to reconsider that ruling, but the court has not yet
ruled on that motion.
The Company has denied all allegations of wrongdoing and
has vigorously defended each of the lawsuits described above.
The outcome of the Del Greco action remains uncertain, and
an adverse determination in that action could result in material
damages and could have a material adverse effect on the
Company’s business, financial condition and operating results.
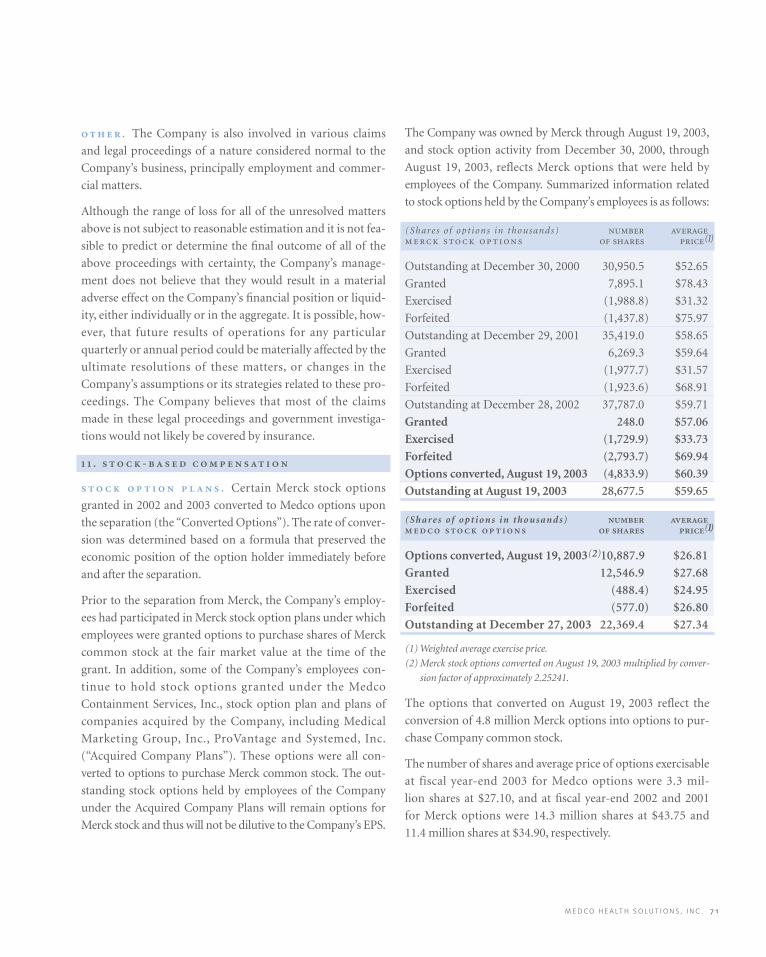
M E D C O H E A LT H S O L U T I O N S , I N C . 7 1
. The Company is also involved in various claims
and legal proceedings of a nature considered normal to the
Company’s business, principally employment and commer-
cial matters.
Although the range of loss for all of the unresolved matters
above is not subject to reasonable estimation and it is not fea-
sible to predict or determine the final outcome of all of the
above proceedings with certainty, the Company’s manage-
ment does not believe that they would result in a material
adverse effect on the Company’s financial position or liquid-
ity, either individually or in the aggregate. It is possible, how-
ever, that future results of operations for any particular
quarterly or annual period could be materially affected by the
ultimate resolutions of these matters, or changes in the
Company’s assumptions or its strategies related to these pro-
ceedings. The Company believes that most of the claims
made in these legal proceedings and government investiga-
tions would not likely be covered by insurance.
. -
. Certain Merck stock options
granted in 2002 and 2003 converted to Medco options upon
the separation (the “Converted Options”). The rate of conver-
sion was determined based on a formula that preserved the
economic position of the option holder immediately before
and after the separation.
Prior to the separation from Merck, the Company’s employ-
ees had participated in Merck stock option plans under which
employees were granted options to purchase shares of Merck
common stock at the fair market value at the time of the
grant. In addition, some of the Company’s employees con-
tinue to hold stock options granted under the Medco
Containment Services, Inc., stock option plan and plans of
companies acquired by the Company, including Medical
Marketing Group, Inc., ProVantage and Systemed, Inc.
(“Acquired Company Plans”). These options were all con-
verted to options to purchase Merck common stock. The out-
standing stock options held by employees of the Company
under the Acquired Company Plans will remain options for
Merck stock and thus will not be dilutive to the Company’s EPS.
The Company was owned by Merck through August 19, 2003,
and stock option activity from December 30, 2000, through
August 19, 2003, reflects Merck options that were held by
employees of the Company. Summarized information related
to stock options held by the Company’s employees is as follows:
(Shares of opt ions in thousands) (1)
Outstanding at December 30, 2000 30,950.5 $52.65
Granted 7,895.1 $78.43
Exercised (1,988.8) $31.32
Forfeited (1,437.8) $75.97
Outstanding at December 29, 2001 35,419.0 $58.65
Granted 6,269.3 $59.64
Exercised (1,977.7) $31.57
Forfeited (1,923.6) $68.91
Outstanding at December 28, 2002 37,787.0 $59.71
Granted 248.0 $57.06
Exercised (1,729.9) $33.73
Forfeited (2,793.7) $69.94
Options converted, August 19, 2003 (4,833.9) $60.39
Outstanding at August 19, 2003 28,677.5 $59.65
(Shares of opt ions in thousands) (1)
Options converted, August 19, 2003(2)10,887.9 $26.81
Granted 12,546.9 $27.68
Exercised (488.4) $24.95
Forfeited (577.0) $26.80
Outstanding at December 27, 2003 22,369.4 $27.34
(1) Weighted average exercise price.
(2) Merck stock options converted on August 19, 2003 multiplied by conver-
sion factor of approximately 2.25241.
The options that converted on August 19, 2003 reflect the
conversion of 4.8 million Merck options into options to pur-
chase Company common stock.
The number of shares and average price of options exercisable
at fiscal year-end 2003 for Medco options were 3.3 mil-
lion shares at $27.10, and at fiscal year-end 2002 and 2001
for Merck options were 14.3 million shares at $43.75 and
11.4 million shares at $34.90, respectively.

( )
. The Company’s
employees currently participate in the 2003 ESPP, whereby
certain employees of Medco are permitted to purchase shares
of Medco stock at a discount to market price. Under the
terms of the 2003 ESPP, 750,000 shares of the Company’s
common stock are available for issuance, and eligible
employees may have up to 10% of gross pay deducted from
their accumulated payroll to purchase shares of Medco com-
mon stock at 85% of the fair market value of a share of
Medco stock on the last day of trading each calendar quarter.
Purchases of Medco stock under the 2003 ESPP for the first
three-month purchase period from October 1, 2003, to
December 26, 2003, were 49,800 shares at a weighted average
price of $35.32.
The 2003 ESPP will terminate at the close of business on
the last day of the fiscal quarter in December 2004 or when
the maximum number of shares has been purchased,
whichever is earlier, or at the discretion of the Company’s
Board of Directors.
From December 30, 2000, through June 27, 2003, the
Company’s employees participated in the 2001 ESPP,
whereby certain employees of Medco were permitted to pur-
chase shares of Merck stock at a discount to market price.
The terms of the 2001 ESPP were substantially the same as
the 2003 ESPP. Purchases of Merck stock under the 2001
ESPP were 0.1 million shares in 2003, 0.3 million shares in
2002 and 0.2 million shares in 2001, and are not dilutive to
the Company’s EPS. The Merck shares purchased under the
2001 ESPP in 2003, 2002 and 2001 were at a weighted average
price of $57.87, $52.62 and $66.02, respectively. The plan
terminated on June 27, 2003, to allow for the implementation
of the new 2003 ESPP.
Had the Company applied the fair value recognition provi-
sions of SFAS 123 to the 2001 ESPP and 2003 ESPP, net
income would have been reduced by $0.7 million in 2003,
$1.3 million in 2002 and $1.4 million in 2001.
.
The Company was a wholly-owned subsidiary of Merck from
November 18, 1993, through August 19, 2003, and it entered
into intercompany transactions with Merck for items such as
the daily transfer of cash collections; cash borrowings to be
used in operations as necessary; mail order inventory trans-
actions; sales of PBM and other services; recording of rebates;
taxes paid by Merck on the Company’s income, and alloca-
tions of corporate charges. Effective December 30, 2001,
amounts due from/to Merck arising from these transactions
were recorded within “Due from Merck, net.” For the major-
ity of the period during which the Company was owned by
Merck, Merck provided the Company with various services,
including finance, legal, public affairs, executive oversight,
human resources, procurement and other services. The his-
torical financial statements include expense allocations
related to these services, which diminished as the Company
prepared for its separation from Merck. These expense allo-
cations amounted to $0.4 million in 2003, all of which was
recorded in the first quarter, and $27.4 million and $26.4 mil-
lion in fiscal 2002 and 2001, respectively. The Company
considers these allocations to be reasonable reflections of the
utilization of services provided. The Company has assumed
full responsibility for these services and the related expenses.
On August 8, 2003, the Company received $564.7 million in
settlement of the recorded amount of the net intercompany
Summarized information about Medco stock options outstanding and exercisable at December 27, 2003 is as follows:
(Shares of opt ions in thousands) (1) (2) (2)
$20 to $25 1,490.8 4.40 $23.70 300.1 $23.02
$25 to $30 19,650.3 8.80 $27.16 3,020.1 $27.51
$30 to $35 682.3 4.93 $33.65 – –
$35 to $40 546.0 4.97 $35.68 – –
Total shares 22,369.4 8.30 $27.34 3,320.2 $27.10
(1) Weighted average contractual life remaining in years.
(2) Weighted average exercise price.
M E D C O H E A LT H S O L U T I O N S , I N C . 7 3
receivable due from Merck arising from intercompany
transactions from December 31, 2001, to July 31, 2003. The
Company completed its separation from Merck on August 19,
2003. As a result, the Company no longer has intercompany
transactions with Merck, and it treats its transactions for
items such as mail order inventory; sales of PBM and other
services, and rebates receivable as third-party transactions.
The Company’s revenues from sales to Merck for PBM and
other services amounted to $78.0 million in fiscal 2003
through the separation from Merck on August 19, 2003,
and $115.2 million and $99.9 million in fiscal 2002 and
2001, respectively.
Prescription drugs purchased from Merck that are dispensed
by the Company’s mail order pharmacies are included in cost
of product net revenues, or in inventory if not yet dispensed.
During the periods prior to the separation, this inventory
from Merck was recorded at a price that management
believes approximated the price that an unrelated third party
would have paid. During fiscal 2001, 2002 and 2003, through
the date of separation, purchases from Merck as a percentage
of the Company’s total cost of revenues remained consis-
tently in the 4% to 5% range. In addition, the Company
records rebates from Merck in cost of revenues based on the
volume of Merck prescription drugs dispensed through its
retail pharmacy network and by its mail order pharmacies.
The following table summarizes the amounts included in
cost of product net revenues:
($ in mil l ions) , , , *
Cost of inventory
purchased from
Merck $ 930.4 $1,415.0 $1,344.7
Gross rebates
recorded from
Merck $(301.1) $ (443.9) $ (439.4)
* Through the separation from Merck on August 19, 2003.
On May 28, 2003, the Company and Merck entered into an
amended and restated managed care agreement, which was
subsequently amended. The amended and restated man-
aged care agreement includes terms related to certain access
obligations for Merck products; a commitment to maintain
Merck market share levels; terms related to formulary access
rebates and market share rebates payable by Merck, as well as
other provisions. In addition, the Company may be required
to pay liquidated damages to Merck if it fails to achieve speci-
fied market share levels.
The Company also entered into a tax responsibility alloca-
tion agreement with Merck. The tax responsibility allocation
agreement includes, among other items, terms for the filing
and payment of income taxes through the separation date.
For the period up to the separation date, Merck incurred fed-
eral taxes on the Company’s income as part of Merck’s con-
solidated tax return, and the Company’s liability for federal
income taxes was reflected in “Due from Merck, net.”
For state income taxes prior to the Company’s incorpora-
tion, Merck was taxed on the Company’s income and the
Company’s liability was reflected in “Due from Merck,
net.” This is also the case for the post-incorporation period
through the separation date in states where Merck filed a uni-
tary or combined tax return. In states where Merck did not
file a unitary or combined tax return, the Company is respon-
sible since incorporation for filing and paying the associated
taxes, with the estimated state tax liability reflected in accrued
expenses and other current liabilities. Subsequent to the sepa-
ration, the Company is responsible for filing its own federal
and state tax returns and making the associated payments.
In addition, the Company entered into an indemnification
and insurance matters agreement, as well as a master separa-
tion and distribution agreement, and other related agree-
ments. The indemnification and insurance matters
agreement covers the Company’s indemnification of Merck
for, among other matters, the outcome of certain types of lit-
igation and claims.
.
In February 2004, the Company was notified of client deci-
sions to transition their business to other PBMs by the end of
2004. These clients were in the Company’s client base at the
time of the Merck acquisition and therefore were included in
the recorded intangible assets. As a result, the Company
revised the weighted average useful life from 35 years to
23 years effective as of the beginning of the 2004 fiscal year,
with the annual intangible asset amortization expense in
2004 increasing over 2003 by $85.6 million to $179.9 million.
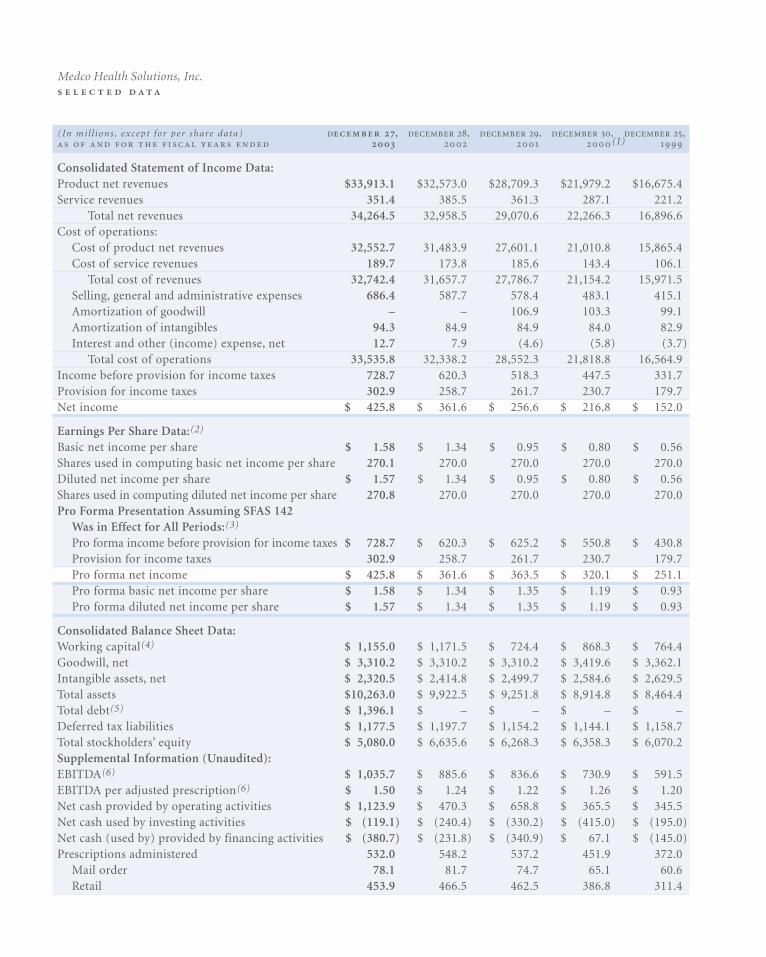
(In mil l ions , except for per share data) , , , , , (1)
Consolidated Statement of Income Data:Product net revenues $33,913.1 $32,573.0 $28,709.3 $21,979.2 $16,675.4Service revenues 351.4 385.5 361.3 287.1 221.2
Total net revenues 34,264.5 32,958.5 29,070.6 22,266.3 16,896.6Cost of operations:
Cost of product net revenues 32,552.7 31,483.9 27,601.1 21,010.8 15,865.4Cost of service revenues 189.7 173.8 185.6 143.4 106.1
Total cost of revenues 32,742.4 31,657.7 27,786.7 21,154.2 15,971.5Selling, general and administrative expenses 686.4 587.7 578.4 483.1 415.1Amortization of goodwill – – 106.9 103.3 99.1Amortization of intangibles 94.3 84.9 84.9 84.0 82.9Interest and other (income) expense, net 12.7 7.9 (4.6) (5.8) (3.7)
Total cost of operations 33,535.8 32,338.2 28,552.3 21,818.8 16,564.9Income before provision for income taxes 728.7 620.3 518.3 447.5 331.7Provision for income taxes 302.9 258.7 261.7 230.7 179.7Net income $ 425.8 $ 361.6 $ 256.6 $ 216.8 $ 152.0
Earnings Per Share Data:(2)
Basic net income per share $ 1.58 $ 1.34 $ 0.95 $ 0.80 $ 0.56Shares used in computing basic net income per share 270.1 270.0 270.0 270.0 270.0Diluted net income per share $ 1.57 $ 1.34 $ 0.95 $ 0.80 $ 0.56Shares used in computing diluted net income per share 270.8 270.0 270.0 270.0 270.0Pro Forma Presentation Assuming SFAS 142
Was in Effect for All Periods:(3)
Pro forma income before provision for income taxes $ 728.7 $ 620.3 $ 625.2 $ 550.8 $ 430.8Provision for income taxes 302.9 258.7 261.7 230.7 179.7Pro forma net income $ 425.8 $ 361.6 $ 363.5 $ 320.1 $ 251.1Pro forma basic net income per share $ 1.58 $ 1.34 $ 1.35 $ 1.19 $ 0.93Pro forma diluted net income per share $ 1.57 $ 1.34 $ 1.35 $ 1.19 $ 0.93
Consolidated Balance Sheet Data:Working capital(4) $ 1,155.0 $ 1,171.5 $ 724.4 $ 868.3 $ 764.4Goodwill, net $ 3,310.2 $ 3,310.2 $ 3,310.2 $ 3,419.6 $ 3,362.1Intangible assets, net $ 2,320.5 $ 2,414.8 $ 2,499.7 $ 2,584.6 $ 2,629.5Total assets $10,263.0 $ 9,922.5 $ 9,251.8 $ 8,914.8 $ 8,464.4Total debt(5) $ 1,396.1 $ – $ – $ – $ – Deferred tax liabilities $ 1,177.5 $ 1,197.7 $ 1,154.2 $ 1,144.1 $ 1,158.7Total stockholders’ equity $ 5,080.0 $ 6,635.6 $ 6,268.3 $ 6,358.3 $ 6,070.2Supplemental Information (Unaudited):EBITDA(6) $ 1,035.7 $ 885.6 $ 836.6 $ 730.9 $ 591.5EBITDA per adjusted prescription(6) $ 1.50 $ 1.24 $ 1.22 $ 1.26 $ 1.20Net cash provided by operating activities $ 1,123.9 $ 470.3 $ 658.8 $ 365.5 $ 345.5Net cash used by investing activities $ (119.1) $ (240.4) $ (330.2) $ (415.0) $ (195.0)Net cash (used by) provided by financing activities $ (380.7) $ (231.8) $ (340.9) $ 67.1 $ (145.0)Prescriptions administered 532.0 548.2 537.2 451.9 372.0
Mail order 78.1 81.7 74.7 65.1 60.6Retail 453.9 466.5 462.5 386.8 311.4
Medco Health Solutions, Inc.
M E D C O H E A LT H S O L U T I O N S , I N C . 7 5
Notes to Selected Historical Consolidated Financial and Operating Data
(1) 53-week fiscal year.
(2) In May 2002, we converted from a limited liability company wholly-owned by Merck to a corporation wholly-owned by Merck and issued
270,000,000 shares of $0.01 par value common stock. The financial information has been revised to retroactively reflect this transaction for all peri-
ods presented.
(3) Effective December 30, 2001, we adopted Statement of Financial Accounting Standards No. 142, “Goodwill and Other Intangible Assets” (“SFAS
142”), under which we ceased amortizing goodwill. This pro forma financial information presents the impact of adopting SFAS 142 as if it had been
adopted for all periods presented. The December 27, 2003, and the December 28, 2002, financial results already reflect the adoption of SFAS 142
and therefore no pro forma adjustment is necessary.
(4) Calculated as current assets less current liabilities.
(5) We had no debt outstanding prior to August 12, 2003.
(6) EBITDA consists of earnings before interest income/expense, taxes, depreciation and amortization. We calculate and use EBITDA and EBITDA per
adjusted prescription as indicators of our ability to generate cash from our reported operating results. These measurements are used in concert with
net income, and cash flow from operations, which measures actual cash generated in the period. In addition, we believe that EBITDA and EBITDA
per adjusted prescription are supplemental measurement tools used by analysts and investors to help evaluate overall operating performance, and the
ability to incur and service debt and make capital expenditures. EBITDA does not represent funds available for our discretionary use and is not
intended to represent or to be used as a substitute for net income or cash flow from operations data as measured under U.S. generally accepted accounting
principles. The items excluded from EBITDA but included in the calculation of our reported net income are significant components of our statement of
income, and must be considered in performing a comprehensive assessment of our overall financial performance. EBITDA, and the associated year-to-
year trends, should not be considered in isolation. Our calculation of EBITDA may not be consistent with calculations of EBITDA used by other compa-
nies. The following table reconciles our reported net income to EBITDA and presents EBITDA per adjusted prescription for each of the respective periods:
($ in mil l ions) , , , , ,
Net income $ 425.8 $361.6 $256.6 $216.8 $152.0
Add (deduct):
Interest and other (income) expense, net 23.7(1) 7.9(2) (4.6) (5.8) (3.7)
Provision for income taxes 302.9 258.7 261.7 230.7 179.7
Depreciation expense 189.0 172.5 131.1 101.9 81.5
Amortization expense 94.3 84.9 191.8 187.3 182.0
EBITDA $1,035.7 $885.6 $836.6 $730.9 $591.5
Adjusted prescriptions(3) 688.2 711.6 686.6 582.1 493.2
EBITDA per adjusted prescription $ 1.50 $ 1.24 $ 1.22 $ 1.26 $ 1.20
(1) Excludes a one-time gain of $11 million from the sale of a minority equity investment in a nonpublic company in the first quarter of 2003.
(2) Includes approximately $11 million of interest rate swap termination costs and debt issuance costs expensed in the second quarter of 2002.
(3) Estimated adjusted prescription volume equals mail order prescriptions multiplied by 3, plus retail prescriptions. The mail order prescriptions are
multiplied by 3 to adjust for the fact that mail order prescriptions include approximately 3 times the amount of product days supplied compared
with retail prescriptions.
( )
Medco Health Solutions, Inc.
As a newly public company, Medco strives to maintain a corporate governance structure that
incorporates the most current legal developments, rules, regulations, and corporate policies.
. , . has served as our President and ChiefExecutive Officer and as a director of our company since March 2003.Mr. Snow was appointed Chairman in June 2003. Mr. Snow came to usfrom WellChoice, Inc. (formerly known as Empire BlueCrossBlueShield), where he held the position of Executive Vice Presidentand Chief Operating Officer beginning in April 1999, and then held theposition of President and Chief Operating Officer from March 2001through January 2003. Mr. Snow served as a director of IMPATH Inc.from 1995 until March 1999. From April 1993 to April 1998, Mr. Snowwas an Executive Vice President at Oxford Health Plans.
. served as Chief Executive Officer of TheLewin Group, Inc., and its predecessors from 1970 to December 1999.In addition, Mr. Lewin has held a number of positions at H&Q LifeSciences Investors since 1992, and H&Q Healthcare Investors since1987, including Chairman and Trustee. He is also a director ofCardioNet, Inc., and a trustee of InterMountain Healthcare, Inc.
. has served as a partner of Cross Atlantic Partners,Inc., a healthcare venture capital firm, since 1994. Previously, Mr. Cassisled the investment team at Salomon Brothers Venture Capital; ran aprivate merchant bank, Tower Hall; was a managing director ofArdshiel Associates; and founded the Johnson and JohnsonDevelopment Corporation in 1973. Mr. Cassis is also a director ofNOMOS Corporation; Preferred Global Health, Ltd.; Medivance, Inc.;and Galt Associates, Inc.
. , .. , ... , the George S. Pepper Professorof Public Health and Preventive Medicine, has been a professor atthe University of Pennsylvania School of Medicine since 1980. Heholds a number of other positions at the School of Medicine, includ-ing Chair of the Department of Biostatistics and Epidemiology,Director of the Center for Clinical Epidemiology and Biostatistics,and most recently, Associate Vice Dean, University of PennsylvaniaSchool of Medicine, and Associate Vice President for IntegratedProgram Development, University of Pennsylvania Health System.Dr. Strom currently serves on the Drug Safety and Risk ManagementCommittee for the U.S. Food and Drug Administration.
. , .. , .. has been a professor atColumbia University since January 2000, and has held a number ofother positions at Columbia University, including Chair of theDepartment of Biomedical Informatics for the College of Physiciansand Surgeons and Director of Medical Informatics Services for NewYork Presbyterian Hospital. From 1979 until 2000, Dr. Shortliffe wasalso a professor at Stanford University School of Medicine and helda number of other positions at that university, including AssociateDean for Information Resources and Technology and Chief of theDivision of General Internal Medicine.
. , . , ... served as a partner of KPMGLLP from July 1982 until he retired in September 2002. Mr. Barker isalso a director of, and serves as Chair of the Audit Committee of,priceline.com. In addition, Mr. Barker is a member of the AmericanInstitute of Certified Public Accountants, the Connecticut Societyof Certified Public Accountants, and the Florida Institute ofCertified Public Accountants.
. , .. has served as the President and ChiefExecutive Officer of the Nellie Mae Education Foundation sinceJuly 1999 and is currently Deputy Chair of the Federal Reserve Bankof Boston. Dr. Wilson was President of California State University,Northridge, from September 1992 to 1999 and also served as a direc-tor for UnionBanCal Corporation from July 1993 to 1999.
, ... has served as Chairman of the Toys“R” Us Children’s Fund since June 2001. Mr. Goldstein was Chairmanof Toys “R” Us, Inc., from February 1998 to June 2001, ChiefExecutive Officer from August 1999 to January 2000, and ViceChairman and Chief Executive Officer from February 1994 toFebruary 1998 . Mr. Goldstein is a lso a director of 4KidsEntertainment, Inc., United Retail Group, Inc., Finlay Enterprises, Inc.,and Galyans Trading, Inc.
Our Board of Directors is composed of experts who bring a wealth of knowledge to Medco, with more than 200 years of collective
experience in such diverse backgrounds as healthcare administration, medical practice, finance, accounting, corporate leadership,
and government service. Of our eight directors, only one, David B. Snow, Jr., Chairman, President, and Chief Executive Officer, is part
of the management team.
Our Board takes an active role in the review of Medco’s performance, oversight of Medco’s current operations, and decision making
for Medco’s future. The PBM industry is characterized by complex and evolving legal, regulatory, and business rules, and our board is
charged with providing guidance to management and active oversight in setting the standards for industry-leading best practices.
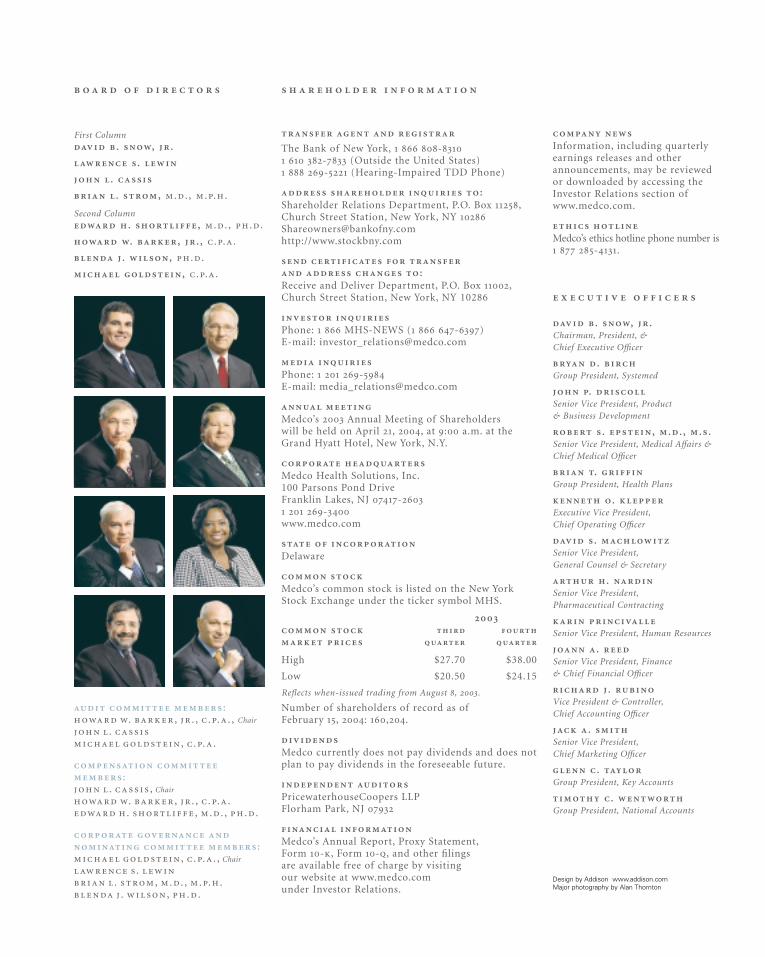
: . , . , .. . , Chair
. , .. .
: . , Chair
. , . , .. . . , . . , . .
: , .. . , Chair
. . , . . , .. . . , . .
First Column . , .
.
.
. , .. , ...
Second Column . , .. , ..
. , . , ...
. , ..
, ...
The Bank of New York, - - (Outside the United States) - (Hearing-Impaired TDD Phone)
:
Shareholder Relations Department, P.O. Box ,Church Street Station, New York, NY [email protected]://www.stockbny.com
:
Receive and Deliver Department, P.O. Box ,Church Street Station, New York, NY 10286
Phone: MHS-NEWS ( -)E-mail: [email protected]
Phone: -E-mail: [email protected]
Medco’s Annual Meeting of Shareholders will be held on April , , at : a.m. at the Grand Hyatt Hotel, New York, N.Y.
Medco Health Solutions, Inc.100 Parsons Pond DriveFranklin Lakes, NJ - -www.medco.com
Delaware
Medco’s common stock is listed on the New YorkStock Exchange under the ticker symbol MHS.
High $27.70 $38.00
Low $20.50 $24.15
Reflects when-issued trading from August , .
Number of shareholders of record as ofFebruary , : ,.
Medco currently does not pay dividends and does notplan to pay dividends in the foreseeable future.
PricewaterhouseCoopers LLPFlorham Park, NJ
Medco’s Annual Report, Proxy Statement,Form -, Form -, and other filingsare available free of charge by visitingour website at www.medco.comunder Investor Relations.
. , .Chairman, President, &Chief Executive Officer
. Group President, Systemed
. Senior Vice President, Product & Business Development
. , .. , . .Senior Vice President, Medical Affairs &Chief Medical Officer
. Group President, Health Plans
. Executive Vice President,Chief Operating Officer
. Senior Vice President,General Counsel & Secretary
. Senior Vice President,Pharmaceutical Contracting
Senior Vice President, Human Resources
. Senior Vice President, Finance & Chief Financial Officer
. Vice President & Controller,Chief Accounting Officer
. Senior Vice President,Chief Marketing Officer
. Group President, Key Accounts
. Group President, National Accounts
Design by Addison www.addison.comMajor photography by Alan Thornton
Information, including quarterly earnings releases and other announcements, may be reviewed or downloaded by accessing theInvestor Relations section ofwww.medco.com.
Medco’s ethics hotline phone number is -.
16.9
22.3
29.1
33.034.334.3
.93*
.56
1.19*
.80
.95
1.35* 1.34
1.571.57
493
582
687712
6886881.20
1.26 1.22 1.24
1.501.50
00
.40
1.20
1.60
99 00 01 02 0303 99 00 01 02 0303 99 00 01 02 0303 99 00 01 02 0303
.80
9
18
27
36
0
200
400
600
800
0
.30
.60
.90
1.20
1.50
(In millions, except per share data)
()
Total net revenues $34,264.5 $32,958.5 4%
Income before provision for income taxes $728.7 $620.3 17%
Net income $425.8 $361.6 18%
Net income per diluted share $1.57 $1.34 17%
Cash and cash equivalents $638.5 $14.4 N/M§
Working capital $1,155.0 $1,171.5 (1%)
Total assets $10,263.0 $9,922.5 3%
Total debt $1,396.1 – N/M§
Adjusted prescription volume† 688.2 711.6 (3%)
Total prescriptions administered 532.0 548.2 (3%)
Mail order 78.1 81.7 (4%)
Retail 453.9 466.5 (3%)
*Assumes Statement of Financial Accounting Standards No. 142, “Goodwill and Other Intangible Assets,” was in effect, whereby goodwill is not amortized.†Estimated adjusted prescription volume equals mail order prescriptions multiplied by 3, plus retail prescriptions. The mail order prescriptions
are multiplied by 3 to adjust for the fact that mail order prescriptions include approximately 3 times the amount of product days supplied compared with
retail prescriptions.‡For a reconciliation of reported net income to EBITDA and a presentation of EBITDA per adjusted prescription, refer to page 36 of the Management’s
Discussion and Analysis included in this annual report.§Not meaningful.
(in billions of dollars)
(in dollars)
†
(in millions of dollars)/ ‡
(in dollars)
Medco Health Solutions, Inc.

© Medco Health Solutions, Inc. , . , .
-
TAIL
OR
ING
SO
LUT
ION
SFO
R O
UR
CU
STO
ME
RS
, P.
8C
HA
IRM
AN
’S L
ET
TE
R,
P.3
AC
HIE
VIN
G R
ES
ULT
SFO
R O
UR
SH
AR
EH
OLD
ER
S,
P.2
0D
EL
IVE
RIN
G W
OR
LD
-CL
AS
S S
ER
VIC
ETO
OU
R C
US
TOM
ER
S’
CU
STO
ME
RS
,P.
14
,
.