Embed Size (px)
Citation preview
7/16/2015 1
FINANCIAL RATIOS & PORTFOLIO MANAGEMENT
Asset Management (Activity or Efficiency)
Liquidity
Leverage
Profitability (Margin)
PORTFOLIO SELECTION & MANAGEMENT
Attributes & Data
EVALUATION • Company level
• Industry level
I – Market index return, Ri – Security return, Rp – Portfolio return
Attributes •Tax favoring •Marketability of securities •Convenience •Risk & Return •Liquidity of portfolio
Data Portfolio of securities
• Stocks
• Bonds • Real estate, Previous stones, Art etc • Convertibles, Warrants
Risk &
Return
Portfolio Class • Cyclical • Defensive • Growth • Cyclical growth
Parameters & Conditions P/E – Price - Earnings D/E – Debt - Equity P/S - Price – Sales BV/MV - Book value / Market value P/BV - Price /Book value ROCE – Return on Capital Employed ROE – Return of Equity Dividend payout (Dividend Per Share] Earnings Per Share (EPS)
Mathematical measures
• Average, • Standard deviation, • Variance • Co-variance • Regression coefficient • Co-relation coefficient
RATIOS
•Measurement of earning •Forecasting of earnings
Return %Expected Return Std deviation Portfolio Std deviation Coefficient of correlation $Beta coefficient Covariance Total Portfolio return
MARKET VALUE RATIOS
Price - Sales & Price - Earnings Performance;
SELECTION
1 Dependent on
i
ii
iii
iv
1. Correctness 2. Completeness 3. Consistency 4. Comparability
Conditions
3. Refers to the agreement with the “Accounting Principles Board (APB or FASB or Others)” i.e. In accordance with US GAAP or similar Accounting standards
NXXXX ....321Portfolio of Securities
Nxxxx ....321
Neeee xxxx ....321
N ....321
ji
ji
xx
ji
x
xxCovr
),(
,
N
i
iiip IXR1
)(
I
Rii
),( ji xxCov$Measures the risk & its diversification on the portfolio of securities % Expected or the Average return
7/16/2015 2
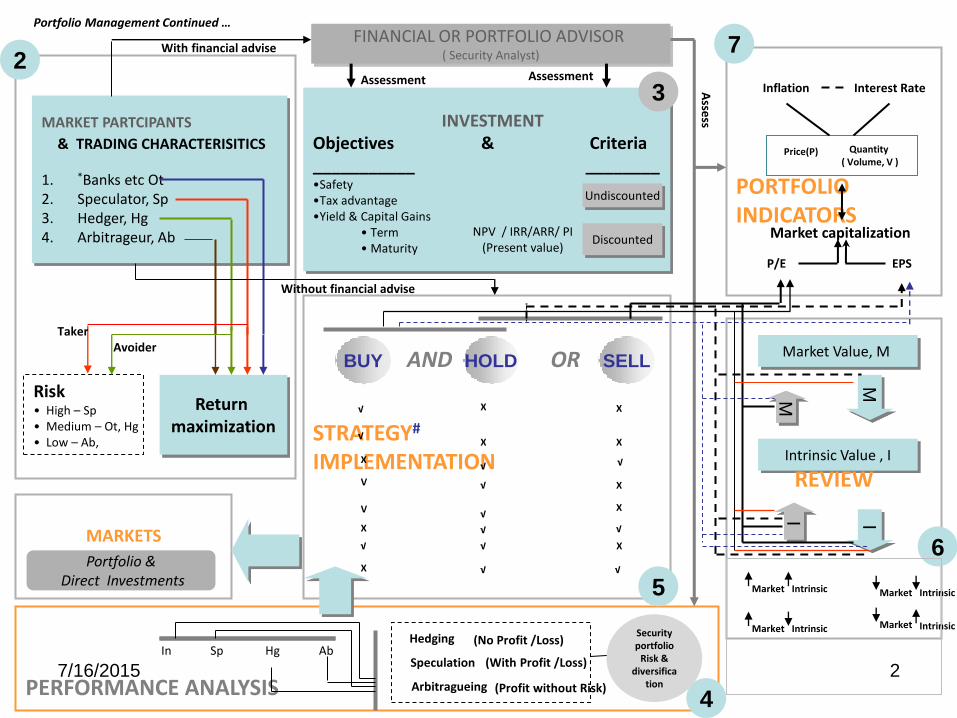
MARKET PARTCIPANTS
1. *Banks etc Ot 2. Speculator, Sp 3. Hedger, Hg 4. Arbitrageur, Ab
Risk • High – Sp • Medium – Ot, Hg • Low – Ab,
Return maximization
INVESTMENT Objectives & Criteria ___________ ________ •Safety •Tax advantage •Yield & Capital Gains
• Term • Maturity
Market Value, M
Intrinsic Value , I
Portfolio Management Continued …
BUY HOLD SELL
STRATEGY# IMPLEMENTATION
REVIEW
PERFORMANCE ANALYSIS
I I
M
M
Undiscounted
Discounted NPV / IRR/ARR/ PI
(Present value)
Price(P) Quantity ( Volume, V )
PORTFOLIO INDICATORS
2
3
4
5
6
FINANCIAL OR PORTFOLIO ADVISOR ( Security Analyst)
7
√
√
√
X
√
V
X
X X
√ √ X
Market Intrinsic Intrinsic Market
Market Intrinsic Market Intrinsic
Hedging
Speculation
MARKETS
Without financial advise
Assessment Assessment
Asse
ss
With financial advise
& TRADING CHARACTERISITICS
In Sp Hg Ab
√ X X
X √ √
V √ X
X √
Portfolio & Direct Investments
AND OR
√
Taker Avoider
Inflation Interest Rate
P/E EPS
Market capitalization
Arbitragueing
Security portfolio
Risk & diversifica
tion
(No Profit /Loss)
(With Profit /Loss)
(Profit without Risk)
7/16/2015 3
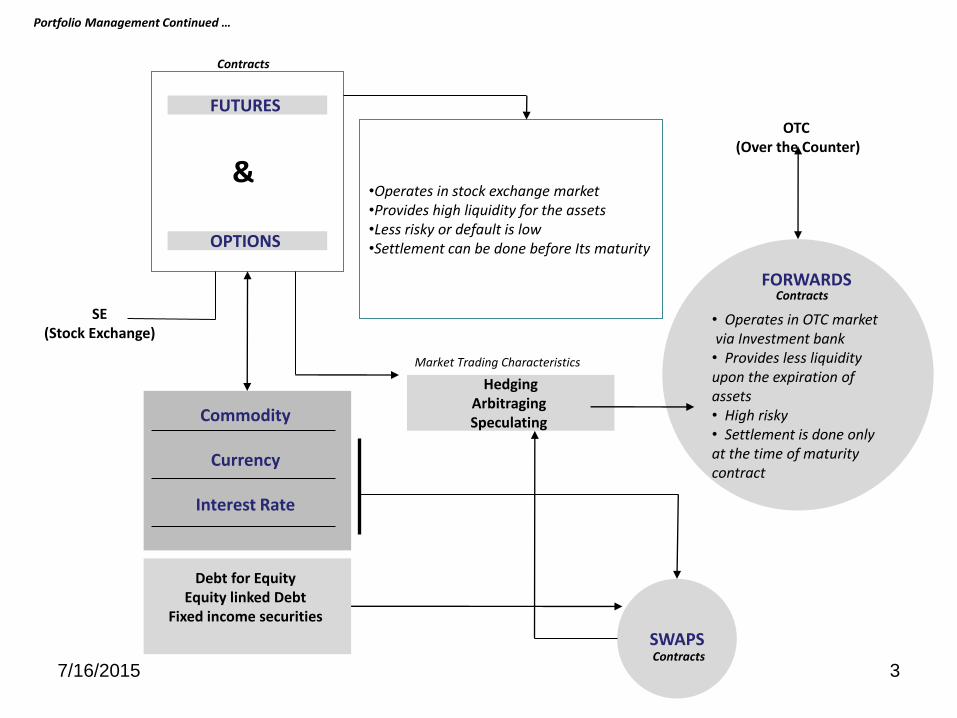
FUTURES
OPTIONS
SE (Stock Exchange)
Commodity
Currency
Interest Rate
•Operates in stock exchange market •Provides high liquidity for the assets •Less risky or default is low •Settlement can be done before Its maturity
FORWARDS • Operates in OTC market via Investment bank • Provides less liquidity upon the expiration of assets • High risky • Settlement is done only at the time of maturity contract
OTC (Over the Counter)
SWAPS
Debt for Equity Equity linked Debt
Fixed income securities
Portfolio Management Continued …
&
Contracts
Contracts
Contracts
Hedging
Arbitraging Speculating
Market Trading Characteristics
7/16/2015 4
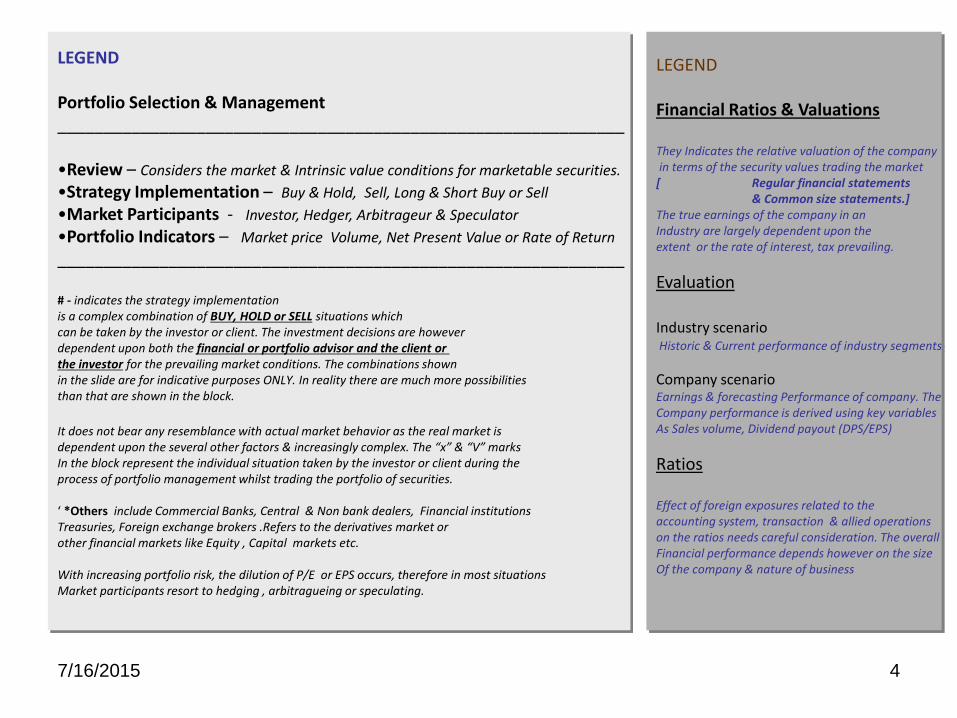
LEGEND Portfolio Selection & Management _____________________________________________________________ •Review – Considers the market & Intrinsic value conditions for marketable securities.
•Strategy Implementation – Buy & Hold, Sell, Long & Short Buy or Sell
•Market Participants - Investor, Hedger, Arbitrageur & Speculator
•Portfolio Indicators – Market price Volume, Net Present Value or Rate of Return
_____________________________________________________________ # - indicates the strategy implementation is a complex combination of BUY, HOLD or SELL situations which can be taken by the investor or client. The investment decisions are however dependent upon both the financial or portfolio advisor and the client or the investor for the prevailing market conditions. The combinations shown in the slide are for indicative purposes ONLY. In reality there are much more possibilities than that are shown in the block.
It does not bear any resemblance with actual market behavior as the real market is dependent upon the several other factors & increasingly complex. The “x” & “V” marks In the block represent the individual situation taken by the investor or client during the process of portfolio management whilst trading the portfolio of securities. ‘ *Others include Commercial Banks, Central & Non bank dealers, Financial institutions Treasuries, Foreign exchange brokers .Refers to the derivatives market or other financial markets like Equity , Capital markets etc. With increasing portfolio risk, the dilution of P/E or EPS occurs, therefore in most situations Market participants resort to hedging , arbitragueing or speculating.
LEGEND Financial Ratios & Valuations They Indicates the relative valuation of the company in terms of the security values trading the market [ Regular financial statements & Common size statements.] The true earnings of the company in an Industry are largely dependent upon the extent or the rate of interest, tax prevailing.
Evaluation Industry scenario Historic & Current performance of industry segments
Company scenario Earnings & forecasting Performance of company. The Company performance is derived using key variables As Sales volume, Dividend payout (DPS/EPS)
Ratios Effect of foreign exposures related to the accounting system, transaction & allied operations on the ratios needs careful consideration. The overall Financial performance depends however on the size Of the company & nature of business