Embed Size (px)
Citation preview
. S T A R B U C K S C O F F E E C O M P A N Y
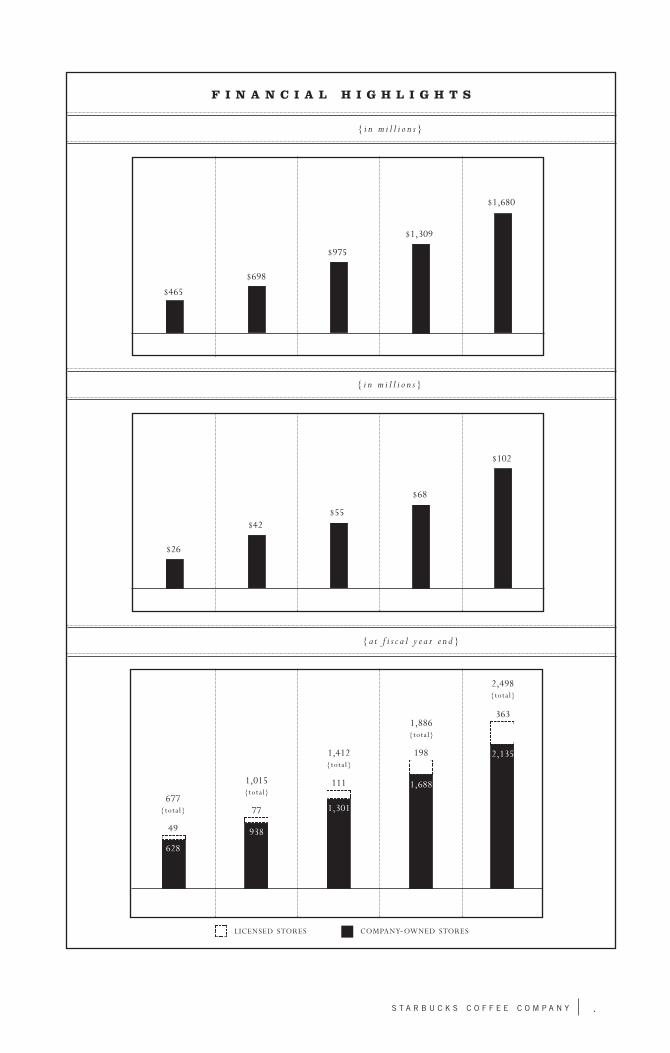
{ i n m i l l i o n s }
COMPANY-OWNED STORESLICENSED STORES
49
$26
628
77938
677{total}
1,015{total}
1,412{total}
1,886{total}
111
1,301
198
2,498{total}
363
1,688
2,135
F I N A N C I A L H I G H L I G H T S
938
{ i n m i l l i o n s }
{ a t f i s c a l y e a r e n d }
$42$55
$68
$102
$465
$698
$975
$1,309
$1,680
B U S I N E S S
Starbucks Corporation and its subsidiaries (collectively “Starbucks” or the “Company”) purchasesand roasts high quality whole bean coffees and sells them, along with fresh, rich-brewed coffees,Italian-style espresso beverages, a variety of pastries and confections, coffee-related accessoriesand equipment and a line of premium teas, primarily through its Company-operated retail stores.In addition to sales through its Company-operated retail stores, Starbucks sells coffee and teaproducts through other channels of distribution (collectively, “specialty operations”). Starbucks,through its joint venture partnerships, also produces and sells bottled Frappuccino® coffee drinkand a line of premium ice creams. The Company’s objective is to establish Starbucks as the most recognized and respected brand in the world. To achieve this goal, the Company plans to continue to rapidly expand its retail operations, grow its specialty operations and selectively pursueother opportunities to leverage the Starbucks brand through the introduction of new products andthe development of new distribution channels.
The Company’s retail goal is to become the leading retailer and brand of coffee in each of its target markets by selling the finest quality coffee and related products and by providing superiorcustomer service, thereby building a high degree of customer loyalty. Starbucks strategy forexpanding its retail business is to increase its market share in existing markets and to open storesin new markets where the opportunity exists to become the leading specialty coffee retailer.As ofOctober 3, 1999, the Company had 2,135 Company-operated stores in 34 states, the District of Columbia, five Canadian provinces and the United Kingdom. Company-operated retail storesaccounted for approximately 85% of net revenues during the fiscal year ended October 3, 1999.
Starbucks specialty operations strive to develop the Starbucks brand outside the Company-operated retail store environment through a number of channels. Starbucks strategy for expanding its specialty operations is to reach customers where they work, travel, shop and dine byestablishing relationships with prominent third parties who share Starbucks values and commitment to quality. These relationships take various forms, including domestic wholesaleaccounts, domestic retail store licensing agreements, grocery channel licensing agreements,domestic joint ventures and international licensing agreements. Starbucks specialty operations alsoinclude direct-to-consumer marketing channels. In certain licensing situations, the licensee is a joint venture in which Starbucks has an equity ownership interest. During fiscal 1999,specialty revenues accounted for approximately 15% of the Company’s net revenues.
. S T A R B U C K S C O F F E E C O M P A N Y
S E L E C T E D F I N A N C I A L D ATA
In thousands, except earnings per share and store operating data
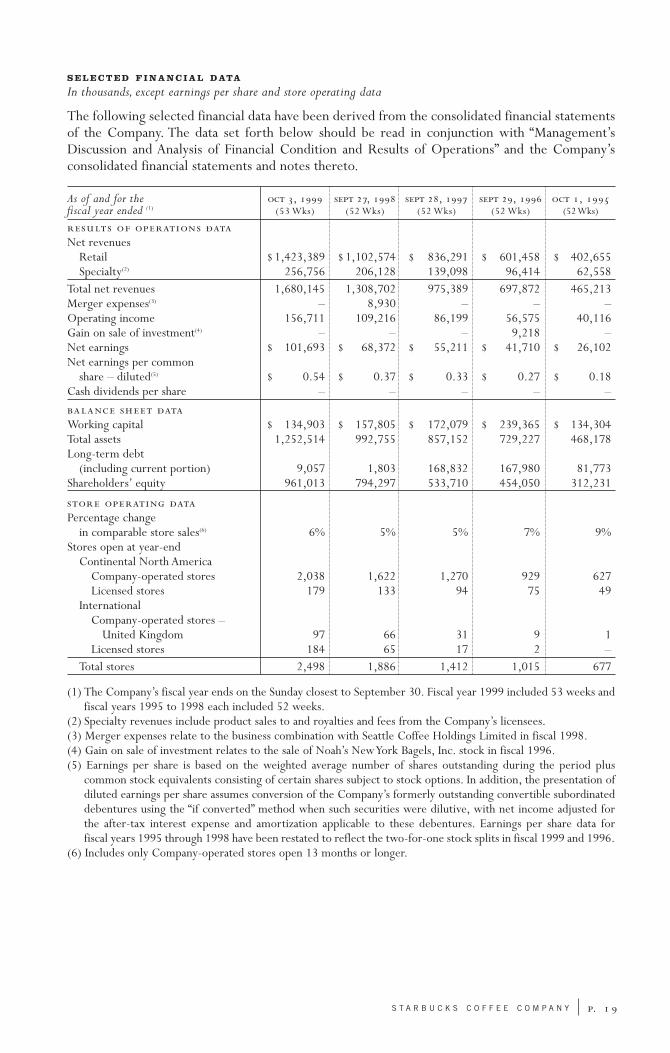
The following selected financial data have been derived from the consolidated financial statementsof the Company. The data set forth below should be read in conjunction with “Management’sDiscussion and Analysis of Financial Condition and Results of Operations” and the Company’s consolidated financial statements and notes thereto.
As of and for the , , , , , fiscal year ended (1) (53 Wks) (52 Wks) (52 Wks) (52 Wks) (52 Wks)
Net revenues
Retail $ 1,423,389 $ 1,102,574 $ 836,291 $ 601,458 $ 402,655Specialty(2) 256,756 206,128 139,098 96,414 62,558
Total net revenues 1,680,145 1,308,702 975,389 697,872 465,213Merger expenses(3) – 8,930 – – –Operating income 156,711 109,216 86,199 56,575 40,116Gain on sale of investment(4) – – – 9,218 –Net earnings $ 101,693 $ 68,372 $ 55,211 $ 41,710 $ 26,102Net earnings per common
share – diluted(5) $ 0.54 $ 0.37 $ 0.33 $ 0.27 $ 0.18Cash dividends per share – – – – –
Working capital $ 134,903 $ 157,805 $ 172,079 $ 239,365 $ 134,304Total assets 1,252,514 992,755 857,152 729,227 468,178Long-term debt
(including current portion) 9,057 1,803 168,832 167,980 81,773Shareholders’ equity 961,013 794,297 533,710 454,050 312,231
Percentage change
in comparable store sales(6) 6% 5% 5% 7% 9%Stores open at year-end
Continental North America Company-operated stores 2,038 1,622 1,270 929 627Licensed stores 179 133 94 75 49
International Company-operated stores –
United Kingdom 97 66 31 9 1Licensed stores 184 65 17 2 –
Total stores 2,498 1,886 1,412 1,015 677
(1) The Company’s fiscal year ends on the Sunday closest to September 30. Fiscal year 1999 included 53 weeks andfiscal years 1995 to 1998 each included 52 weeks.
(2) Specialty revenues include product sales to and royalties and fees from the Company’s licensees.(3) Merger expenses relate to the business combination with Seattle Coffee Holdings Limited in fiscal 1998.(4) Gain on sale of investment relates to the sale of Noah’s New York Bagels, Inc. stock in fiscal 1996.(5) Earnings per share is based on the weighted average number of shares outstanding during the period plus
common stock equivalents consisting of certain shares subject to stock options. In addition, the presentation of diluted earnings per share assumes conversion of the Company’s formerly outstanding convertible subordinateddebentures using the “if converted” method when such securities were dilutive, with net income adjusted for the after-tax interest expense and amortization applicable to these debentures. Earnings per share data for fiscal years 1995 through 1998 have been restated to reflect the two-for-one stock splits in fiscal 1999 and 1996.
(6) Includes only Company-operated stores open 13 months or longer.
. S T A R B U C K S C O F F E E C O M P A N Y
C A U T I O N A RY S TAT E M E N T P U R S U A N T T O T H E P R I VAT ES E C U R I T I E S L I T I G AT I O N R E F O R M A C T O F 1995
Certain statements set forth in this Annual Report, including anticipated store openings, plannedcapital expenditures and trends in or expectations regarding the Company’s operations, specificallyincluding the effect of problems associated with the Year 2000, constitute “forward-looking statements” within the meaning of the Private Securities Litigation Reform Act of 1995. Suchstatements are based on currently available operating, financial and competitive information andare subject to various risks and uncertainties. Actual future results and trends may differ materially depending on a variety of factors, including, but not limited to, coffee and other rawmaterials prices and availability, successful execution of internal performance and expansion plans,the impact of competition, the effect of legal proceedings and other risks detailed herein and inthe Company’s annual and quarterly filings with the Securities and Exchange Commission.
M A N A G E M E N T’S D I S C U S S I O N A N D A N A LY S I S O F F I N A N C I A LC O N D I T I O N A N D R E S U LT S O F O P E R AT I O N S
Starbucks presently derives approximately 85% of net revenues from its Company-operated retail stores. The remaining 15% of net revenues is derived from the Company’s specialty operations, which include sales to wholesale accounts and licensees, royalty and license fee incomeand sales through its direct-to-consumer business and its on-line store at www.starbucks.com.TheCompany’s fiscal year ends on the Sunday closest to September 30. Fiscal year 1999 had 53 weeks,and fiscal years 1998 and 1997 each had 52 weeks.The fiscal year ending on October 1, 2000, willinclude 52 weeks.
The Company’s net revenues increased from $1.3 billion in fiscal 1998 to $1.7 billion in fiscal1999, due primarily to the Company’s store expansion program and comparable store salesincreases. Comparable store sales increased by 6%, 5% and 5% in fiscal 1999, 1998 and 1997,respectively. As part of its expansion strategy of clustering stores in existing markets, Starbuckshas experienced a certain level of cannibalization of existing stores by new stores as store concentration has increased. However, management believes such cannibalization has been justified by the incremental sales and return on new store investments. This cannibalization, as well as increased competition and other factors, may continue to put downward pressure on theCompany’s comparable store sales growth in future periods.
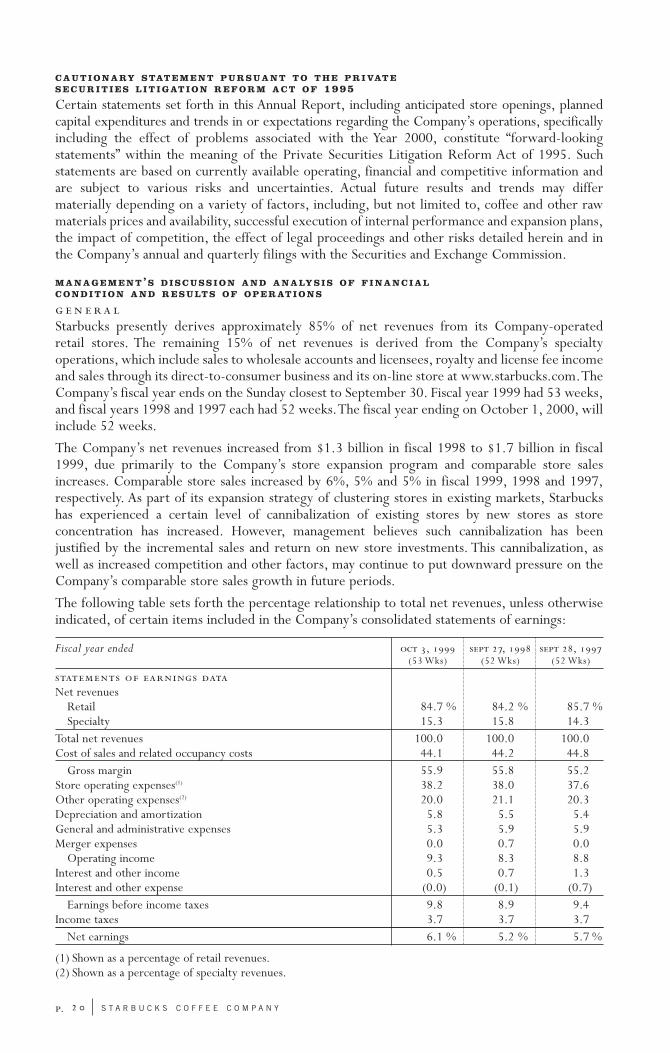
The following table sets forth the percentage relationship to total net revenues, unless otherwiseindicated, of certain items included in the Company’s consolidated statements of earnings:
Fiscal year ended , , , (53 Wks) (52 Wks) (52 Wks)
Net revenues
Retail 84.7 % 84.2 % 85.7 %Specialty 15.3 15.8 14.3
Total net revenues 100.0 100.0 100.0Cost of sales and related occupancy costs 44.1 44.2 44.8
Gross margin 55.9 55.8 55.2Store operating expenses(1) 38.2 38.0 37.6Other operating expenses(2) 20.0 21.1 20.3Depreciation and amortization 5.8 5.5 5.4General and administrative expenses 5.3 5.9 5.9Merger expenses 0.0 0.7 0.0
Operating income 9.3 8.3 8.8Interest and other income 0.5 0.7 1.3Interest and other expense (0.0) (0.1) (0.7)
Earnings before income taxes 9.8 8.9 9.4Income taxes 3.7 3.7 3.7
Net earnings 6.1 % 5.2 % 5.7 %
(1) Shown as a percentage of retail revenues.(2) Shown as a percentage of specialty revenues.
. S T A R B U C K S C O F F E E C O M P A N Y
B U S I N E S S C O M B I N AT I O N S
During the second quarter of fiscal 1999, Starbucks acquired the net assets of Tazo, L.L.C.(“Tazo”), a Portland, Oregon-based tea company that produces premium tea products, and PasquaInc. (“Pasqua”), a San Francisco, California-based roaster and retailer of specialty coffee. Both ofthese acquisitions were accounted for under the purchase method of accounting. The results ofoperations for Tazo and Pasqua are included in the accompanying consolidated financial statementsfrom the dates of acquisition. During the third quarter of fiscal 1998, Starbucks acquired theUnited Kingdom-based Seattle Coffee Holdings Limited (“Seattle Coffee Company”) in a pooling-of-interests transaction (the “Transaction”). In conjunction with the Transaction, Starbucks recordedpre-tax charges of $8.9 million in direct merger costs and $6.6 million in other charges associated with the integration of Seattle Coffee Company. The historical financial statements for the periods prior to the Transaction were restated as though the companies had always been combined.
R E S U LT S O F O P E R AT I O N S – F I S C A L 1999 C O M PA R E D T O F I S C A L 1998
Net revenues increased 28% to $1.7 billion for fiscal 1999, compared to $1.3 billion for fiscal1998. Retail sales increased 29% to $1.4 billion from $1.1 billion.The increase in retail sales wasdue to the addition of new Company-operated stores, comparable store sales growth of 6% and sales for the 53rd week of the fiscal year. Comparable store sales percentages have been calculated excluding the 53rd week of fiscal 1999.The increase in comparable store sales resultedfrom a 5% increase in the number of transactions and a 1% increase in the average dollar value pertransaction. During fiscal 1999, the Company opened 424 stores in continental North America and 36 stores in the United Kingdom. As of fiscal year-end, there were 2,038 Company-operatedstores in continental North America and 97 in the United Kingdom. During fiscal 2000, theCompany expects to open at least 350 Company-operated stores in North America and 50 in theUnited Kingdom.
Specialty revenues increased 25% to $257 million for fiscal 1999 from $206 million for fiscal 1998.The increase was driven primarily by higher sales to licensees and joint ventures and business diningcustomers. Licensees (including those in which the Company is a joint venture partner) opened 44 stores in continental North America and 121 stores in international markets.The Company endedthe year with 179 licensed stores in continental North America and 184 licensed stores in international markets. During fiscal 2000, the Company expects to open at least 200 licensed stores.
Gross margin increased to 55.9% for fiscal 1999 from 55.8% in fiscal 1998.The positive impacton gross margin of lower green coffee costs was partially offset by lower gross margins associatedwith a change in the Company’s strategy for the grocery channel. In late fiscal 1998, the Companysigned a long-term licensing agreement with Kraft Foods, Inc. (“Kraft”) to handle the U.S.distribution, marketing and advertising for Starbucks whole bean and ground coffee in grocery,warehouse club and mass merchandise stores.The transition to Kraft occurred in the first quarterof fiscal 1999.
. S T A R B U C K S C O F F E E C O M P A N Y
Store operating expenses as a percentage of retail sales increased to 38.2% for fiscal 1999 from37.5% for fiscal 1998, excluding costs associated with the Transaction.This was due primarily tohigher payroll-related expenditures resulting from both an increase in average hourly wage ratesand a continuing shift in sales to handcrafted beverages, which are more labor intensive. Includingthe Transaction costs, store operating expenses for fiscal 1998 were 38.0% of retail sales.
Other operating expenses (expenses associated with all operations other than Company-ownedretail stores, including the Company’s share of joint venture profits and losses) were 20.0% of specialty revenues during fiscal 1999, compared to 21.1% for fiscal 1998. This decrease was attributable to lower operating expenses associated with the grocery channel after the transitionto Kraft, partially offset by higher payroll expense supporting other channels.
Depreciation and amortization was 5.8% of net revenues, up from 5.5% of net revenues for fiscal1998, primarily due to depreciation on new information systems put into service in late fiscal1998 and during fiscal 1999. General and administrative expenses were 5.3% of net revenues during fiscal 1999 compared to 5.9% for fiscal 1998, primarily due to proportionately lower payroll-related expenses.
The Company’s effective tax rate for fiscal 1999 was 38.0% compared to 41.2% for fiscal 1998.The effective tax rate in fiscal 1998 was impacted by non-deductible losses of Seattle CoffeeCompany prior to the Transaction. Fiscal 1998’s rate was also affected by Transaction-related costs.Management expects the effective tax rate to be approximately 38% during fiscal 2000.
R E S U LT S O F O P E R AT I O N S – F I S C A L 1998 C O M PA R E D T O F I S C A L 1997
Net revenues increased 34% to $1.3 billion for fiscal 1998, compared to $975 million for fiscal1997. Retail sales increased 32% to $1.1 billion from $836 million.The increase in retail sales wasdue primarily to the addition of new Company-operated stores. In addition, comparable storesales increased 5% for the 52 weeks ended September 27, 1998 compared to the same 52-weekperiod in fiscal 1997. Comparable store sales increases resulted from an increase in the number oftransactions combined with an increase in the average dollar value per transaction.The increase inaverage dollar value per transaction was primarily due to the sales price increases effected duringfiscal 1997. During fiscal 1998, the Company opened 357 stores in continental North America and37 stores in the United Kingdom. By fiscal year-end, there were 1,622 Company-operated storesin continental North America and 66 in the United Kingdom.
Specialty revenues increased 48% to $206 million for fiscal 1998 from $139 million for fiscal1997.The increase was due primarily to increased sales and license fees in the grocery category,increased sales to the Company’s joint ventures and licensees and higher wholesale club sales.The Company sells roasted coffee to its joint venture with Pepsi-Cola Company, a division ofPepsiCo, Inc. (the “North American Coffee Partnership”), for use in the manufacture of its bottledFrappuccino® coffee drink. The Company also sells coffee extract to Dreyer’s Grand Ice Cream, Inc. (“Dreyer’s”) for use in the manufacture of Starbucks branded ice creams sold by theCompany’s joint venture with Dreyer’s (the “Ice Cream Joint Venture”). Licensees (including thosein which the Company is a joint venture partner) opened 45 stores in continental North Americaand 48 stores in international markets.The Company ended the year with 133 licensed stores incontinental North America and 65 licensed stores in international markets.
. S T A R B U C K S C O F F E E C O M P A N Y
Gross margin increased to 55.8% for fiscal 1998 compared to 55.2% for fiscal 1997.This increasewas primarily the result of prior year sales price increases partially offset by higher green coffee costs.
Store operating expenses as a percentage of retail sales increased to 38.0% for fiscal 1998 from37.6% for fiscal 1997.This was due to integration costs associated with the Transaction. Excludingthese costs, store operating expenses for fiscal 1998 would have been 37.5% of retail sales.
Other operating expenses (expenses associated with the Company’s specialty operations, as wellas the Company’s share of joint venture profits and losses) increased to 21.1% of specialty revenues for fiscal 1998 from 20.3% for fiscal 1997. The increase was attributable to higher advertising expenses and higher payroll-related costs for the Company’s international and grocerybusinesses, partially offset by improved results of both the North American Coffee Partnership andthe Ice Cream Joint Venture.
Merger expenses of $8.9 million consisted mainly of investment banking, legal and accounting fees.
Interest and other income for fiscal 1998 was $8.5 million, compared to $12.4 million for fiscal1997.The decrease was primarily due to lower average investment balances.
Interest and other expense for fiscal 1998 was $1.4 million compared to $7.3 million for fiscal1997.The decrease was due to the conversion of the Company’s $165.0 million 41/4% ConvertibleSubordinated Debentures to common stock during the first quarter of fiscal 1998.
The Company’s effective tax rate for fiscal 1998 was 41.2% compared to 39.5% in fiscal 1997.The effective tax rate in both years was impacted by non-deductible losses of Seattle CoffeeCompany prior to the Transaction. Fiscal 1998’s rate was also affected by Transaction-related costs.Excluding the impact of Transaction-related costs, the effective tax rate for fiscal 1998 would havebeen 38.3%.
L I Q U I D I T Y A N D C A P I TA L R E S O U R C E S
The Company ended fiscal 1999 with $117.8 million in total cash and short-term investments.Working capital as of October 3, 1999, totaled $134.9 million compared to $157.8 million at September 27, 1998. Cash and cash equivalents decreased by $35.2 million during fiscal 1999to $66.4 million at October 3, 1999. This decrease was offset by an increase in short-term investments of $29.5 million during the same period.
Cash provided by operating activities for fiscal 1999 totaled $210.6 million and resulted primarilyfrom net earnings before non-cash charges of $210.1 million.
Cash used by investing activities for fiscal 1999 totaled $336.3 million. This included capital additions to property, plant and equipment of $261.8 million related to opening 460 newCompany-operated retail stores and remodeling certain existing stores, purchasing roasting andpackaging equipment for the Company’s roasting and distribution facilities, enhancing informationsystems and expanding existing office space.The purchases of Pasqua and Tazo used $15.7 million.During fiscal 1999, the Company made equity investments of $10.5 million in its internationaljoint ventures. The Company received $5.7 million in distributions from the North AmericanCoffee Partnership and $3.3 million in distributions from the Ice Cream Joint Venture. TheCompany also used $28.3 million to make minority investments in Living.com, Inc. and Talk City,Inc. The Company invested excess cash primarily in short-term, investment-grade marketabledebt securities. The net activity in the Company’s marketable securities portfolio during fiscal1999 provided $34.1 million.
. S T A R B U C K S C O F F E E C O M P A N Y
Cash provided by financing activities for fiscal 1999 totaled $90.5 million. This included $29.9 million of checks issued but not presented for payment, $52.4 million generated from the exer-cise of employee stock options and the related income tax benefit available to the Company upon exercise of such options and $9.4 million generated from the Company’s employee stock purchaseplan.As options granted under the Company’s stock option plans are exercised, the Company will continue to receive proceeds and a tax deduction; however, neither the amounts nor the timingthereof can be predicted.
Cash requirements for fiscal 2000, other than normal operating expenses, are expected to consistprimarily of capital expenditures related to the addition of new Company-operated retail stores.The Company plans to open at least 400 Company-operated stores during fiscal 2000. TheCompany also anticipates incurring additional expenditures for enhancing its production capacityand information systems and remodeling certain existing stores.While there can be no assurancethat current expectations will be realized, management expects capital expenditures for fiscal2000 to be approximately $300 million.
Management believes that existing cash and investments plus cash generated from operationsshould be sufficient to finance capital requirements for its core businesses through fiscal 2000.New joint ventures, other new business opportunities or store expansion rates substantially inexcess of that presently planned may require outside funding.
Y E A R 2000 C O M P L I A N C E
The Year 2000 issue results from computer programs being written using two digits rather thanfour to define the applicable year. Computer programs with time-sensitive software, at theCompany and elsewhere, may recognize a date using “00” as the year 1900 rather than the year2000. This could result in a system failure or miscalculation causing disruptions of operations,including, among other things, a temporary inability to produce and distribute products, processtransactions or engage in similar normal business activities. To address the Year 2000 issue and its risks, the Company formed a cross-functional Task Force, headed by senior management, to evaluate the risks and implement appropriate remediation and contingency plans.
The Company’s preparations for the Year 2000 have been divided into two categories, MIS-supported systems and other systems and issues. “MIS-supported” systems are those telephone andcomputer systems that are acquired, installed and maintained by the Company’s ManagementInformation Systems (“MIS”) department. These systems include all of the software applicationsgenerally available on the Company’s computer network, as well as many applications used by particular departments or in connection with specific functions (for example, payroll and generalaccounting software). Single-user applications and a few specialized systems maintained by certaindepartments within the Company are not considered MIS-supported systems.The Company’s MISdepartment is primarily responsible for addressing Year 2000 compliance issues arising from allMIS-supported systems, while the Year 2000 Task Force is primarily responsible for Year 2000compliance issues arising from non-MIS-supported systems and from relationships with criticalproduct and service providers.
The majority of computer and telephony applications at Starbucks are relatively recent purchasesthat are not expected to be affected by the Year 2000 problem. All of the MIS-supported systemsused at Starbucks have been identified and evaluated. Where necessary, the Company has remediated such systems by installing system upgrades or rewriting code. As the suppliers of telephone and computer systems or software to the Company have worked to address Year 2000issues with their own products, several have uncovered new or additional problems relating totheir systems or software and have so notified the Company. In some cases, these new or additionalissues have necessitated additional remediation or testing of the Company’s systems. As part of the remediation process, the Company’s MIS department has tested each critical system and networked application.
To address issues arising from non-MIS-supported systems or embedded chips and to evaluate the Company’s exposure to third parties’ failures to remediate their Year 2000 problems, the
. S T A R B U C K S C O F F E E C O M P A N Y
Company has identified the critical product and service suppliers for each of its business units anddepartments. The Company has solicited information from these critical suppliers and othersabout their remediation and contingency plans and their ability to meet the Company’s needs inthe Year 2000. By the end of fiscal 1999, the Company had received responses from approximately 93% of these product and service suppliers, virtually all of which indicate that theyare actively addressing the Year 2000 issue. The Company has worked with these suppliers to complete additional remediation steps and is working with all of its critical product and servicesuppliers to develop appropriate contingency plans.The contingency plans include, among otheractions, purchasing additional inventory prior to the end of 1999, identifying alternate sources ofproducts and services and establishing alternate ways to accomplish critical business functions.TheCompany has prepared contingency plans for each of its critical business units or departments andconducted tests of certain critical non-MIS-supported systems. Despite these efforts, there can beno guarantee that the other companies on which the Company relies will be prepared for the Year2000 and that their Year 2000 problems will not have an adverse effect on the Company.
The Company presently believes that the most reasonably likely worst case scenario concerningthe Year 2000 is that certain critical product and service providers will not be Year 2000 compliant and will be unable to deliver products and services in a timely manner.The Companybelieves that its geographically dispersed retail stores and large supplier base will significantly mitigate any adverse impact from suppliers’ delays or failures, but that the Company remains vulnerable to (i) delays in deliveries by a few suppliers who are the sole source of certain productsand services; (ii) disruption of the components of its distribution operations, including ports,trucking and air freight services; and (iii) local or regional retail store shutdowns as a result ofproblems with infrastructure such as power, water and sewer service.To support the Company’sbusiness, particularly the retail stores, in the event that any problems occur, the Company has prepared a Year 2000 event room with backup generator power to monitor the rollover of theCompany’s systems to the new year and address any other Year 2000 issues.
The Company has spent approximately $1.4 million in direct costs for the Year 2000 complianceproject through the end of fiscal 1999 and expects to spend approximately $2.0 million for the project.The total cost of all remediation efforts is management’s best estimate, which is based onnumerous assumptions about future events, including the continued availability of certainresources, third party modification plans and other factors. There can be no guarantee that theseestimates will prove true and actual results could differ significantly from those projected.
C O F F E E P R I C E S, AVA I L A B I L I T Y A N D G E N E R A L R I S K C O N D I T I O N S
The supply and price of coffee are subject to significant volatility. Although most coffee trades in thecommodity market, coffee of the quality sought by the Company tends to trade on a negotiated basisat a substantial premium above commodity coffee prices, depending upon the supply and demand atthe time of purchase. Supply and price can be affected by multiple factors in the producing countries,including weather, political and economic conditions. In addition, green coffee prices have beenaffected in the past, and may be affected in the future, by the actions of certain organizations and associations that have historically attempted to influence commodity prices of green coffee throughagreements establishing export quotas or restricting coffee supplies worldwide. The Company’s ability to raise sales prices in response to rising coffee prices may be limited, and the Company’s profitability could be adversely affected if coffee prices were to rise substantially.
The Company enters into fixed-price purchase commitments in order to secure an adequate supply of quality green coffee and bring greater certainty to the cost of sales in future periods.As of October 3, 1999, the Company had approximately $84 million in fixed-price purchase commitments which, together with existing inventory, is expected to provide an adequate supplyof green coffee for the majority of fiscal 2000. The Company believes, based on relationships established with its suppliers in the past, that the risk of non-delivery on such purchase commit-ments is remote.
. S T A R B U C K S C O F F E E C O M P A N Y
To further reduce its exposure to rising coffee costs, the Company may, from time to time, enterinto futures contracts to hedge price-to-be-established coffee purchase commitments.The specificrisks associated with these activities are described below in “Financial Risk Management.”
In addition to fluctuating coffee prices, management believes that the Company’s future results of operations and earnings could be significantly impacted by other factors such as increased competition within the specialty coffee industry, the Company’s ability to find optimal store locations at favorable lease rates, increased costs associated with opening and operating retailstores and the Company’s continued ability to hire, train and retain qualified personnel.
F I N A N C I A L R I S K M A N A G E M E N T
The Company maintains investment portfolio holdings of various issuers, types and maturities.These securities are classified as available-for-sale and are recorded on the balance sheet at fairvalue with unrealized gains or losses reported as a separate component of accumulated other comprehensive income. As of October 3, 1999, approximately 76% of the total portfolio wasinvested in short-term marketable debt securities with maturities of less than one year. An additional 15% was invested in long-term U.S. Government obligations with maturities of 12 to18 months and the remaining 9% was invested in marketable equity securities.The Company doesnot hedge its interest rate exposure.
The Company is subject to foreign currency exchange rate exposure, primarily related to its foreign retail operations in Canada and the United Kingdom. Historically, this exposure has had aminimal impact on the Company. At the present time, the Company does not hedge foreign currency risk, but may do so in the future.
The Company may, from time to time, enter into futures contracts to hedge price-to-be-fixed coffee purchase commitments with the objective of minimizing cost risk due to market fluctuations.The Company does not hold or issue derivative instruments for trading purposes. In accordancewith Statement of Financial Accounting Standards (“SFAS”) No. 80, “Accounting for FuturesContracts,” these futures contracts meet the hedge criteria and are accounted for as hedges.Accordingly, gains and losses are deferred and recognized as adjustments to the carrying value ofcoffee inventory when purchased and recognized in results of operations as coffee products are sold.Gains and losses are calculated based on the difference between the cost basis and the market valueof the coffee contracts.The market risk related to coffee futures is substantially offset by changesin the costs of coffee purchased.
S E A S O N A L I T Y A N D Q U A RT E R LY R E S U LT S
The Company’s business is subject to seasonal fluctuations. Significant portions of the Company’snet revenues and profits are realized during the first quarter of the Company’s fiscal year, whichincludes the December holiday season. In addition, quarterly results are affected by the timing ofthe opening of new stores, and the Company’s rapid growth may conceal the impact of other seasonal influences. Because of the seasonality of the Company’s business, results for any quarterare not necessarily indicative of the results that may be achieved for the full fiscal year.
N E W A C C O U N T I N G S TA N D A R D S
In June 1998, the Financial Accounting Standards Board (“FASB”) issued SFAS No. 133,“Accounting for Derivative Instruments and Hedging Activities”. This pronouncement will requirethe Company to recognize derivatives on its balance sheet at fair value. Changes in the fair valuesof derivatives that qualify as cash-flow hedges will be recognized in accumulated other comprehensive income until the hedged item is recognized in earnings. The Company is in theprocess of evaluating the impact of this new accounting standard and does not expect that it willhave a significant effect on its results of operations.The FASB subsequently issued SFAS No. 137,“Accounting for Derivative Instruments and Hedging Activities – Deferral of the Effective Date of FASB Statement No. 133”,which postpones initial application until fiscal years beginning afterJune 15, 2000.The Company expects to adopt SFAS No. 133 in fiscal 2001.
. S T A R B U C K S C O F F E E C O M P A N Y
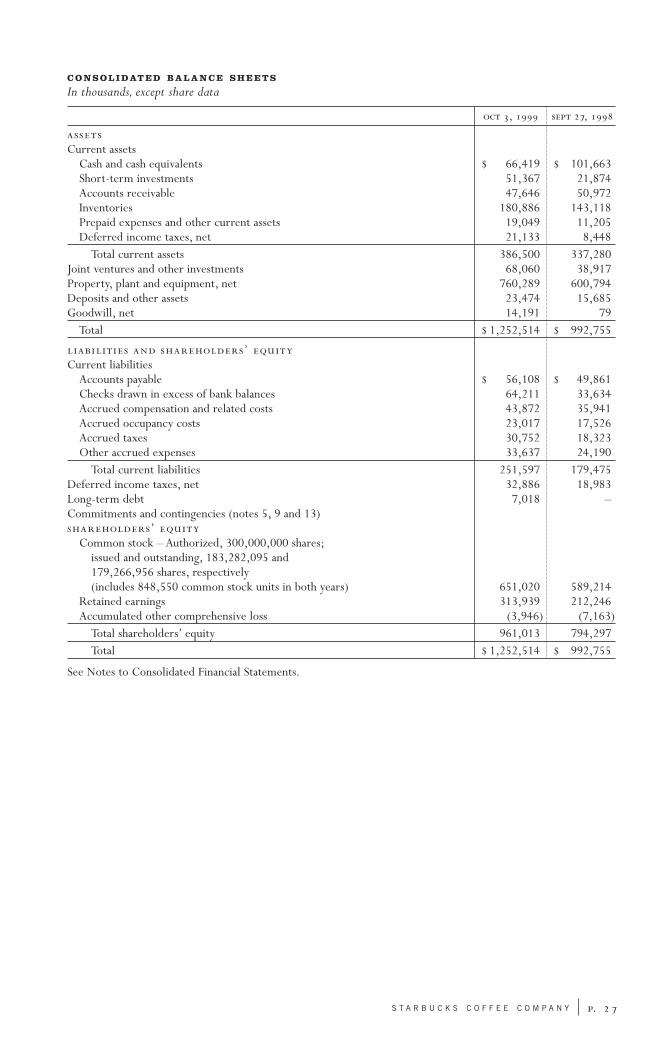
C O N S O L I D AT E D B A L A N C E S H E E T S
In thousands, except share data
, ,
Current assets
Cash and cash equivalents $ 66,419 $ 101,663Short-term investments 51,367 21,874Accounts receivable 47,646 50,972Inventories 180,886 143,118Prepaid expenses and other current assets 19,049 11,205Deferred income taxes, net 21,133 8,448
Total current assets 386,500 337,280Joint ventures and other investments 68,060 38,917Property, plant and equipment, net 760,289 600,794Deposits and other assets 23,474 15,685Goodwill, net 14,191 79
Total $ 1,252,514 $ 992,755
’ Current liabilities
Accounts payable $ 56,108 $ 49,861Checks drawn in excess of bank balances 64,211 33,634Accrued compensation and related costs 43,872 35,941Accrued occupancy costs 23,017 17,526Accrued taxes 30,752 18,323Other accrued expenses 33,637 24,190
Total current liabilities 251,597 179,475Deferred income taxes, net 32,886 18,983Long-term debt 7,018 –Commitments and contingencies (notes 5, 9 and 13)’
Common stock – Authorized, 300,000,000 shares;issued and outstanding, 183,282,095 and 179,266,956 shares, respectively(includes 848,550 common stock units in both years) 651,020 589,214
Retained earnings 313,939 212,246Accumulated other comprehensive loss (3,946) (7,163)
Total shareholders’ equity 961,013 794,297Total $ 1,252,514 $ 992,755
See Notes to Consolidated Financial Statements.
. S T A R B U C K S C O F F E E C O M P A N Y
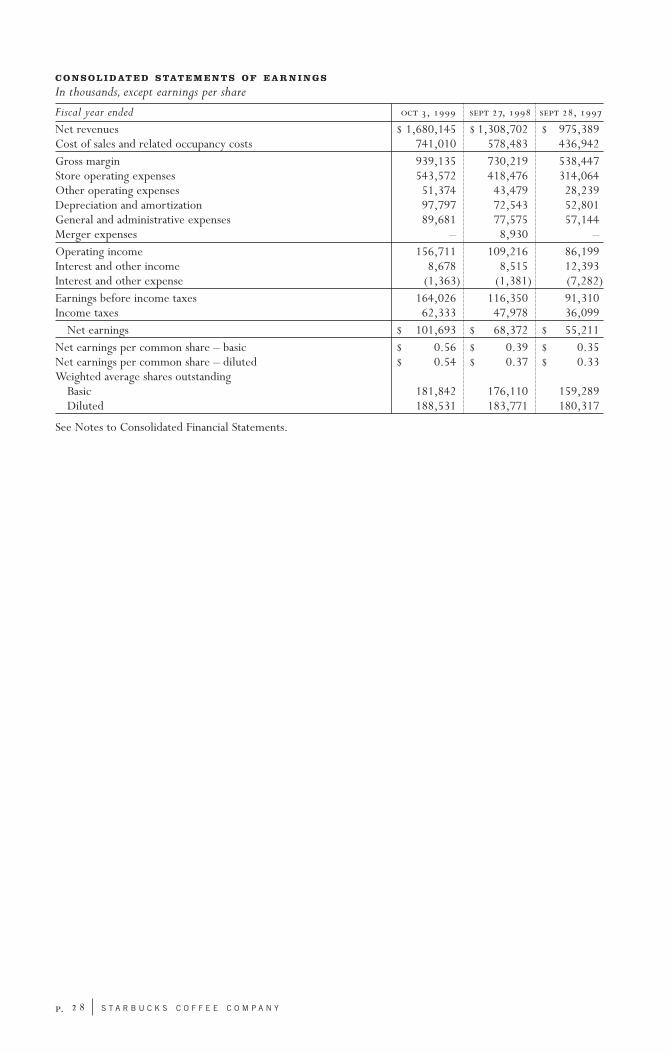
C O N S O L I D AT E D S TAT E M E N T S O F E A R N I N G S
In thousands, except earnings per share
Fiscal year ended , , ,
Net revenues $ 1,680,145 $ 1,308,702 $ 975,389Cost of sales and related occupancy costs 741,010 578,483 436,942Gross margin 939,135 730,219 538,447Store operating expenses 543,572 418,476 314,064Other operating expenses 51,374 43,479 28,239Depreciation and amortization 97,797 72,543 52,801General and administrative expenses 89,681 77,575 57,144Merger expenses – 8,930 –Operating income 156,711 109,216 86,199Interest and other income 8,678 8,515 12,393Interest and other expense (1,363) (1,381) (7,282)Earnings before income taxes 164,026 116,350 91,310Income taxes 62,333 47,978 36,099
Net earnings $ 101,693 $ 68,372 $ 55,211Net earnings per common share – basic $ 0.56 $ 0.39 $ 0.35Net earnings per common share – diluted $ 0.54 $ 0.37 $ 0.33Weighted average shares outstanding
Basic 181,842 176,110 159,289Diluted 188,531 183,771 180,317
See Notes to Consolidated Financial Statements.
. S T A R B U C K S C O F F E E C O M P A N Y
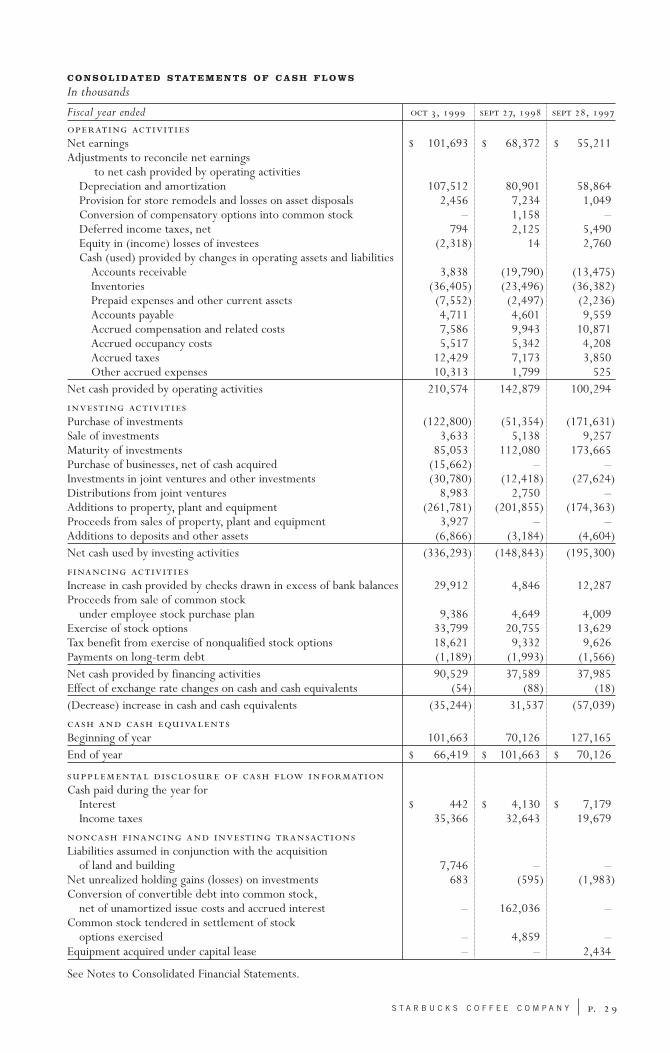
C O N S O L I D AT E D S TAT E M E N T S O F C A S H F L O W S
In thousands
Fiscal year ended , , ,
Net earnings $ 101,693 $ 68,372 $ 55,211Adjustments to reconcile net earnings
to net cash provided by operating activitiesDepreciation and amortization 107,512 80,901 58,864Provision for store remodels and losses on asset disposals 2,456 7,234 1,049Conversion of compensatory options into common stock – 1,158 –Deferred income taxes, net 794 2,125 5,490Equity in (income) losses of investees (2,318) 14 2,760Cash (used) provided by changes in operating assets and liabilities
Accounts receivable 3,838 (19,790) (13,475)Inventories (36,405) (23,496) (36,382)Prepaid expenses and other current assets (7,552) (2,497) (2,236)Accounts payable 4,711 4,601 9,559Accrued compensation and related costs 7,586 9,943 10,871Accrued occupancy costs 5,517 5,342 4,208Accrued taxes 12,429 7,173 3,850Other accrued expenses 10,313 1,799 525
Net cash provided by operating activities 210,574 142,879 100,294 Purchase of investments (122,800) (51,354) (171,631)Sale of investments 3,633 5,138 9,257Maturity of investments 85,053 112,080 173,665Purchase of businesses, net of cash acquired (15,662) – –Investments in joint ventures and other investments (30,780) (12,418) (27,624)Distributions from joint ventures 8,983 2,750 –Additions to property, plant and equipment (261,781) (201,855) (174,363)Proceeds from sales of property, plant and equipment 3,927 – –Additions to deposits and other assets (6,866) (3,184) (4,604)Net cash used by investing activities (336,293) (148,843) (195,300) Increase in cash provided by checks drawn in excess of bank balances 29,912 4,846 12,287Proceeds from sale of common stock
under employee stock purchase plan 9,386 4,649 4,009Exercise of stock options 33,799 20,755 13,629Tax benefit from exercise of nonqualified stock options 18,621 9,332 9,626Payments on long-term debt (1,189) (1,993) (1,566)Net cash provided by financing activities 90,529 37,589 37,985Effect of exchange rate changes on cash and cash equivalents (54) (88) (18)(Decrease) increase in cash and cash equivalents (35,244) 31,537 (57,039) Beginning of year 101,663 70,126 127,165End of year $ 66,419 $ 101,663 $ 70,126
Cash paid during the year for
Interest $ 442 $ 4,130 $ 7,179Income taxes 35,366 32,643 19,679
Liabilities assumed in conjunction with the acquisition
of land and building 7,746 – –Net unrealized holding gains (losses) on investments 683 (595) (1,983)Conversion of convertible debt into common stock,
net of unamortized issue costs and accrued interest – 162,036 –Common stock tendered in settlement of stock
options exercised – 4,859 –Equipment acquired under capital lease – – 2,434
See Notes to Consolidated Financial Statements.
. S T A R B U C K S C O F F E E C O M P A N Y
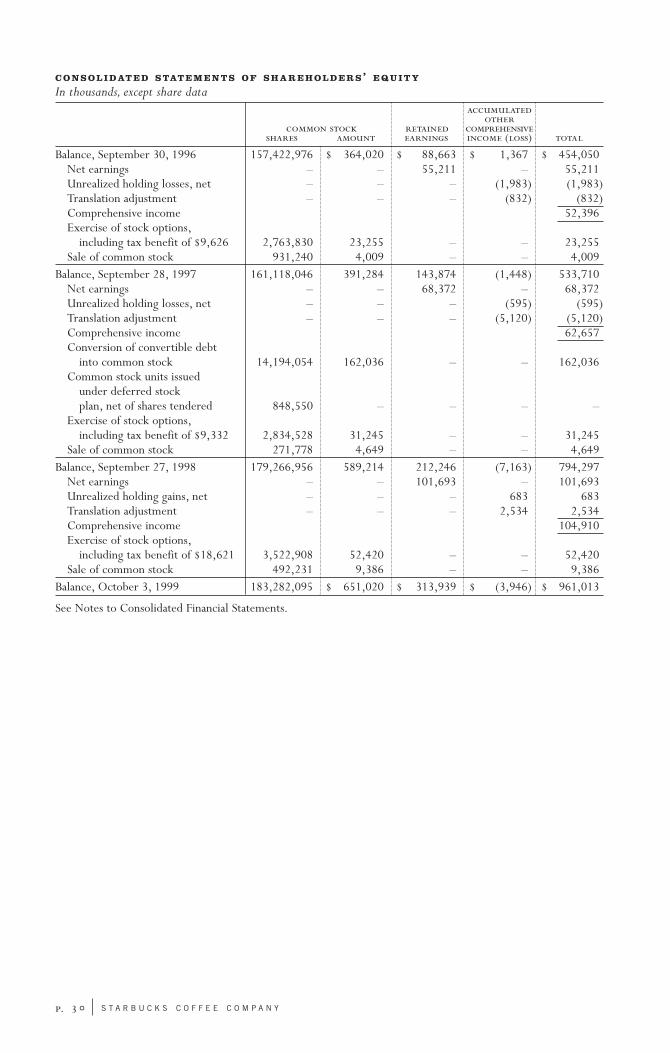
C O N S O L I D AT E D S TAT E M E N T S O F S H A R E H O L D E R S’ E Q U I T Y
In thousands, except share data
()
Balance, September 30, 1996 157,422,976 $ 364,020 $ 88,663 $ 1,367 $ 454,050Net earnings – – 55,211 – 55,211Unrealized holding losses, net – – – (1,983) (1,983)Translation adjustment – – – (832) (832)Comprehensive income 52,396Exercise of stock options,
including tax benefit of $9,626 2,763,830 23,255 – – 23,255Sale of common stock 931,240 4,009 – – 4,009
Balance, September 28, 1997 161,118,046 391,284 143,874 (1,448) 533,710Net earnings – – 68,372 – 68,372Unrealized holding losses, net – – – (595) (595)Translation adjustment – – – (5,120) (5,120)Comprehensive income 62,657Conversion of convertible debt
into common stock 14,194,054 162,036 – – 162,036Common stock units issued
under deferred stock plan, net of shares tendered 848,550 – – – –
Exercise of stock options,including tax benefit of $9,332 2,834,528 31,245 – – 31,245
Sale of common stock 271,778 4,649 – – 4,649Balance, September 27, 1998 179,266,956 589,214 212,246 (7,163) 794,297
Net earnings – – 101,693 – 101,693Unrealized holding gains, net – – – 683 683Translation adjustment – – – 2,534 2,534Comprehensive income 104,910Exercise of stock options,
including tax benefit of $18,621 3,522,908 52,420 – – 52,420Sale of common stock 492,231 9,386 – – 9,386
Balance, October 3, 1999 183,282,095 $ 651,020 $ 313,939 $ (3,946) $ 961,013
See Notes to Consolidated Financial Statements.
. S T A R B U C K S C O F F E E C O M P A N Y
N O T E S T O C O N S O L I D AT E D F I N A N C I A L S TAT E M E N T S
Years ended October 3, 1999, September 27, 1998 and September 28, 1997
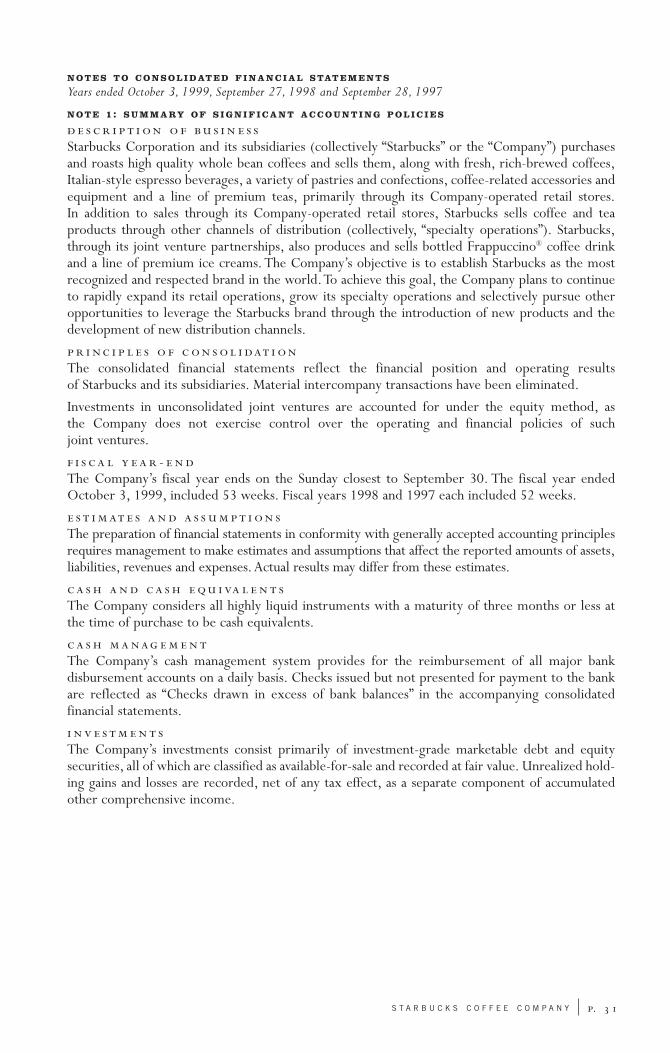
N O T E 1: S U M M A RY O F S I G N I F I C A N T A C C O U N T I N G P O L I C I E S
Starbucks Corporation and its subsidiaries (collectively “Starbucks” or the “Company”) purchasesand roasts high quality whole bean coffees and sells them, along with fresh, rich-brewed coffees,Italian-style espresso beverages, a variety of pastries and confections, coffee-related accessories andequipment and a line of premium teas, primarily through its Company-operated retail stores.In addition to sales through its Company-operated retail stores, Starbucks sells coffee and tea products through other channels of distribution (collectively, “specialty operations”). Starbucks,through its joint venture partnerships, also produces and sells bottled Frappuccino® coffee drinkand a line of premium ice creams. The Company’s objective is to establish Starbucks as the most recognized and respected brand in the world.To achieve this goal, the Company plans to continueto rapidly expand its retail operations, grow its specialty operations and selectively pursue otheropportunities to leverage the Starbucks brand through the introduction of new products and thedevelopment of new distribution channels.
The consolidated financial statements reflect the financial position and operating results of Starbucks and its subsidiaries. Material intercompany transactions have been eliminated.
Investments in unconsolidated joint ventures are accounted for under the equity method, as the Company does not exercise control over the operating and financial policies of such joint ventures.
- The Company’s fiscal year ends on the Sunday closest to September 30. The fiscal year endedOctober 3, 1999, included 53 weeks. Fiscal years 1998 and 1997 each included 52 weeks.
The preparation of financial statements in conformity with generally accepted accounting principlesrequires management to make estimates and assumptions that affect the reported amounts of assets,liabilities, revenues and expenses. Actual results may differ from these estimates.
The Company considers all highly liquid instruments with a maturity of three months or less atthe time of purchase to be cash equivalents.
The Company’s cash management system provides for the reimbursement of all major bank disbursement accounts on a daily basis. Checks issued but not presented for payment to the bankare reflected as “Checks drawn in excess of bank balances” in the accompanying consolidated financial statements.
The Company’s investments consist primarily of investment-grade marketable debt and equitysecurities, all of which are classified as available-for-sale and recorded at fair value. Unrealized hold-ing gains and losses are recorded, net of any tax effect, as a separate component of accumulatedother comprehensive income.
. S T A R B U C K S C O F F E E C O M P A N Y
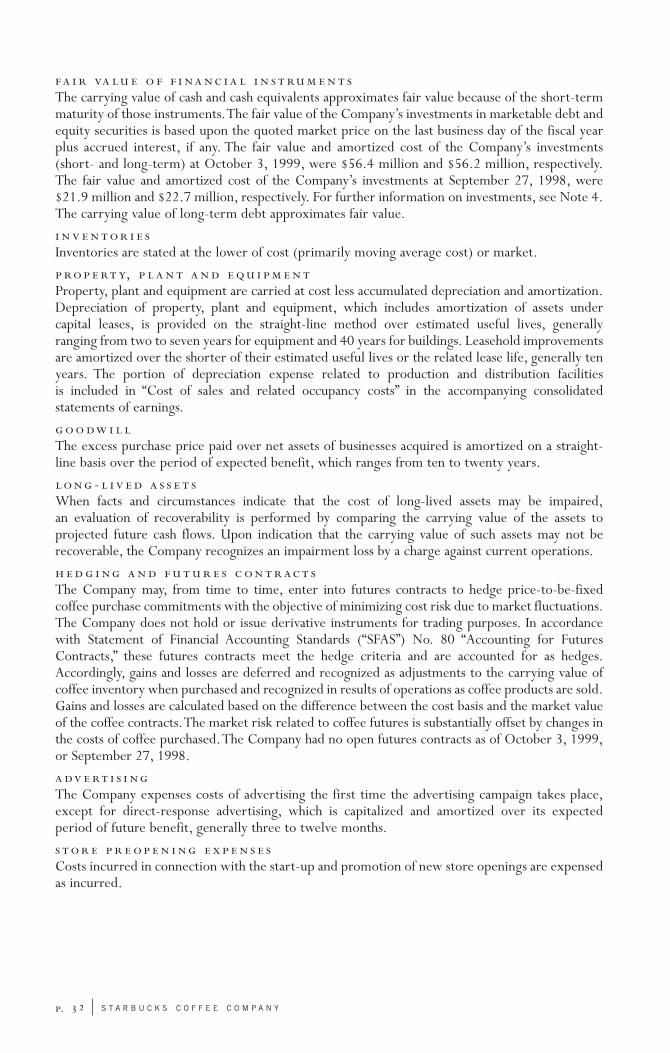
The carrying value of cash and cash equivalents approximates fair value because of the short-termmaturity of those instruments.The fair value of the Company’s investments in marketable debt andequity securities is based upon the quoted market price on the last business day of the fiscal yearplus accrued interest, if any. The fair value and amortized cost of the Company’s investments(short- and long-term) at October 3, 1999, were $56.4 million and $56.2 million, respectively.The fair value and amortized cost of the Company’s investments at September 27, 1998, were$21.9 million and $22.7 million, respectively. For further information on investments, see Note 4.The carrying value of long-term debt approximates fair value.
Inventories are stated at the lower of cost (primarily moving average cost) or market.
, Property, plant and equipment are carried at cost less accumulated depreciation and amortization.Depreciation of property, plant and equipment, which includes amortization of assets under capital leases, is provided on the straight-line method over estimated useful lives, generally ranging from two to seven years for equipment and 40 years for buildings. Leasehold improvementsare amortized over the shorter of their estimated useful lives or the related lease life, generally tenyears. The portion of depreciation expense related to production and distribution facilities is included in “Cost of sales and related occupancy costs” in the accompanying consolidated statements of earnings.
The excess purchase price paid over net assets of businesses acquired is amortized on a straight-line basis over the period of expected benefit, which ranges from ten to twenty years.
- When facts and circumstances indicate that the cost of long-lived assets may be impaired,an evaluation of recoverability is performed by comparing the carrying value of the assets to projected future cash flows. Upon indication that the carrying value of such assets may not be recoverable, the Company recognizes an impairment loss by a charge against current operations.
The Company may, from time to time, enter into futures contracts to hedge price-to-be-fixed coffee purchase commitments with the objective of minimizing cost risk due to market fluctuations.The Company does not hold or issue derivative instruments for trading purposes. In accordancewith Statement of Financial Accounting Standards (“SFAS”) No. 80 “Accounting for FuturesContracts,” these futures contracts meet the hedge criteria and are accounted for as hedges.Accordingly, gains and losses are deferred and recognized as adjustments to the carrying value ofcoffee inventory when purchased and recognized in results of operations as coffee products are sold.Gains and losses are calculated based on the difference between the cost basis and the market valueof the coffee contracts.The market risk related to coffee futures is substantially offset by changes inthe costs of coffee purchased.The Company had no open futures contracts as of October 3, 1999,or September 27, 1998.
The Company expenses costs of advertising the first time the advertising campaign takes place,except for direct-response advertising, which is capitalized and amortized over its expected period of future benefit, generally three to twelve months.
Costs incurred in connection with the start-up and promotion of new store openings are expensed as incurred.
. S T A R B U C K S C O F F E E C O M P A N Y
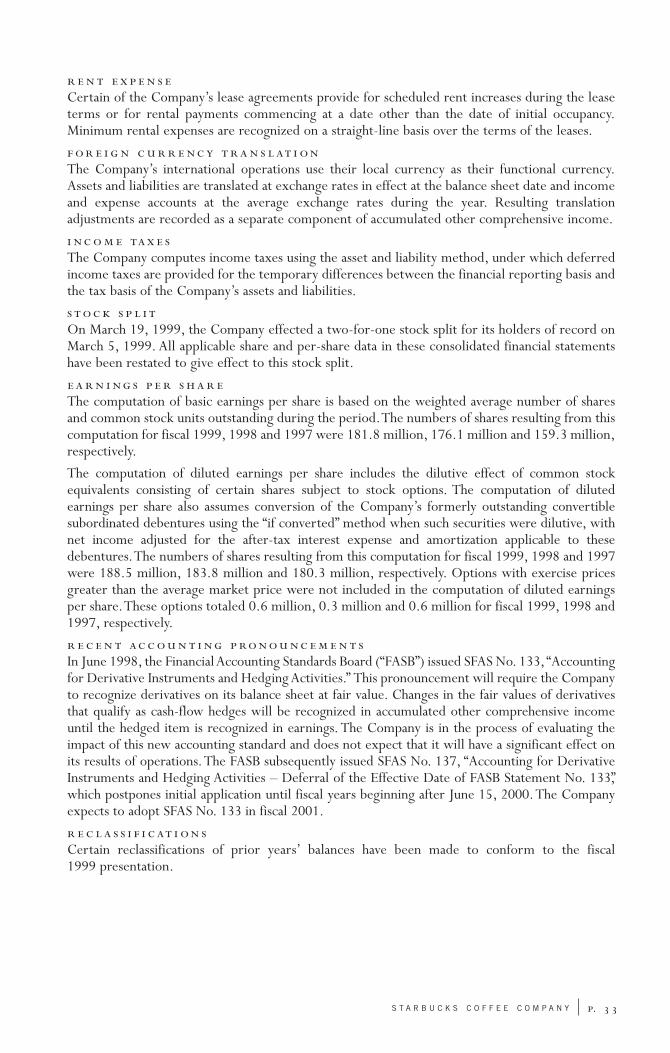
Certain of the Company’s lease agreements provide for scheduled rent increases during the leaseterms or for rental payments commencing at a date other than the date of initial occupancy.Minimum rental expenses are recognized on a straight-line basis over the terms of the leases.
The Company’s international operations use their local currency as their functional currency.Assets and liabilities are translated at exchange rates in effect at the balance sheet date and incomeand expense accounts at the average exchange rates during the year. Resulting translation adjustments are recorded as a separate component of accumulated other comprehensive income.
The Company computes income taxes using the asset and liability method, under which deferredincome taxes are provided for the temporary differences between the financial reporting basis andthe tax basis of the Company’s assets and liabilities.
On March 19, 1999, the Company effected a two-for-one stock split for its holders of record onMarch 5, 1999. All applicable share and per-share data in these consolidated financial statementshave been restated to give effect to this stock split.
The computation of basic earnings per share is based on the weighted average number of sharesand common stock units outstanding during the period.The numbers of shares resulting from thiscomputation for fiscal 1999, 1998 and 1997 were 181.8 million, 176.1 million and 159.3 million,respectively.
The computation of diluted earnings per share includes the dilutive effect of common stock equivalents consisting of certain shares subject to stock options. The computation of diluted earnings per share also assumes conversion of the Company’s formerly outstanding convertible subordinated debentures using the “if converted” method when such securities were dilutive, withnet income adjusted for the after-tax interest expense and amortization applicable to these debentures.The numbers of shares resulting from this computation for fiscal 1999, 1998 and 1997were 188.5 million, 183.8 million and 180.3 million, respectively. Options with exercise pricesgreater than the average market price were not included in the computation of diluted earnings per share.These options totaled 0.6 million, 0.3 million and 0.6 million for fiscal 1999, 1998 and1997, respectively.
In June 1998, the Financial Accounting Standards Board (“FASB”) issued SFAS No. 133, “Accountingfor Derivative Instruments and Hedging Activities.” This pronouncement will require the Companyto recognize derivatives on its balance sheet at fair value. Changes in the fair values of derivativesthat qualify as cash-flow hedges will be recognized in accumulated other comprehensive incomeuntil the hedged item is recognized in earnings. The Company is in the process of evaluating theimpact of this new accounting standard and does not expect that it will have a significant effect onits results of operations.The FASB subsequently issued SFAS No. 137, “Accounting for DerivativeInstruments and Hedging Activities – Deferral of the Effective Date of FASB Statement No. 133”,which postpones initial application until fiscal years beginning after June 15, 2000.The Companyexpects to adopt SFAS No. 133 in fiscal 2001.
Certain reclassifications of prior years’ balances have been made to conform to the fiscal 1999 presentation.
. S T A R B U C K S C O F F E E C O M P A N Y
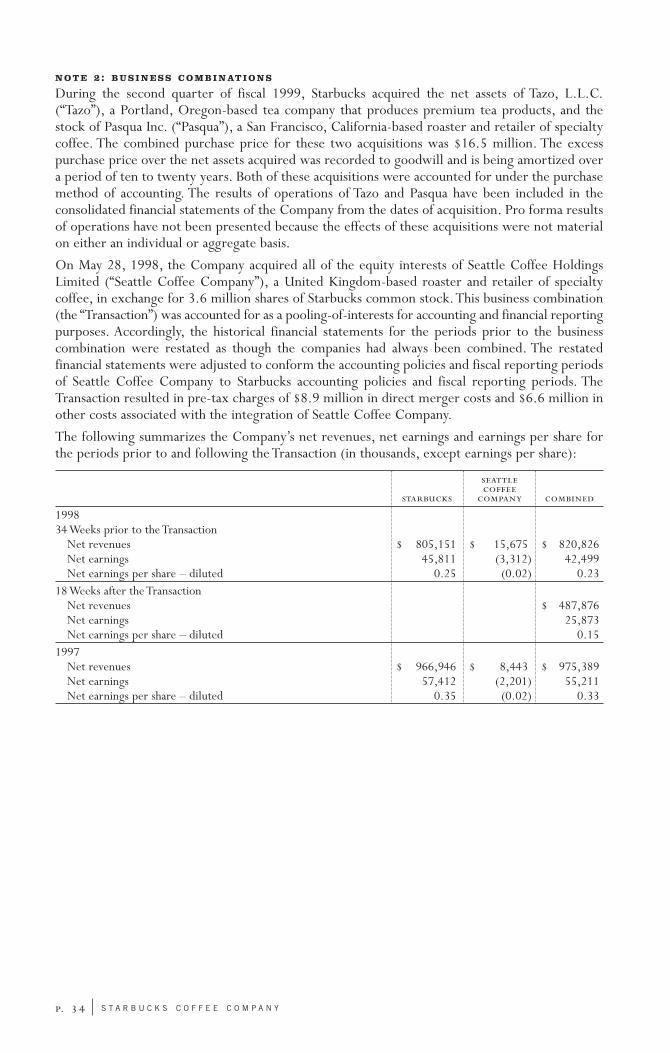
N O T E 2: B U S I N E S S C O M B I N AT I O N S
During the second quarter of fiscal 1999, Starbucks acquired the net assets of Tazo, L.L.C.(“Tazo”), a Portland, Oregon-based tea company that produces premium tea products, and thestock of Pasqua Inc. (“Pasqua”), a San Francisco, California-based roaster and retailer of specialtycoffee. The combined purchase price for these two acquisitions was $16.5 million. The excess purchase price over the net assets acquired was recorded to goodwill and is being amortized overa period of ten to twenty years. Both of these acquisitions were accounted for under the purchasemethod of accounting. The results of operations of Tazo and Pasqua have been included in the consolidated financial statements of the Company from the dates of acquisition. Pro forma resultsof operations have not been presented because the effects of these acquisitions were not materialon either an individual or aggregate basis.
On May 28, 1998, the Company acquired all of the equity interests of Seattle Coffee HoldingsLimited (“Seattle Coffee Company”), a United Kingdom-based roaster and retailer of specialtycoffee, in exchange for 3.6 million shares of Starbucks common stock.This business combination(the “Transaction”) was accounted for as a pooling-of-interests for accounting and financial reportingpurposes. Accordingly, the historical financial statements for the periods prior to the businesscombination were restated as though the companies had always been combined. The restated financial statements were adjusted to conform the accounting policies and fiscal reporting periodsof Seattle Coffee Company to Starbucks accounting policies and fiscal reporting periods. TheTransaction resulted in pre-tax charges of $8.9 million in direct merger costs and $6.6 million inother costs associated with the integration of Seattle Coffee Company.
The following summarizes the Company’s net revenues, net earnings and earnings per share forthe periods prior to and following the Transaction (in thousands, except earnings per share):
199834 Weeks prior to the Transaction
Net revenues $ 805,151 $ 15,675 $ 820,826Net earnings 45,811 (3,312) 42,499Net earnings per share – diluted 0.25 (0.02) 0.23
18 Weeks after the TransactionNet revenues $ 487,876Net earnings 25,873Net earnings per share – diluted 0.15
1997Net revenues $ 966,946 $ 8,443 $ 975,389Net earnings 57,412 (2,201) 55,211Net earnings per share – diluted 0.35 (0.02) 0.33
. S T A R B U C K S C O F F E E C O M P A N Y
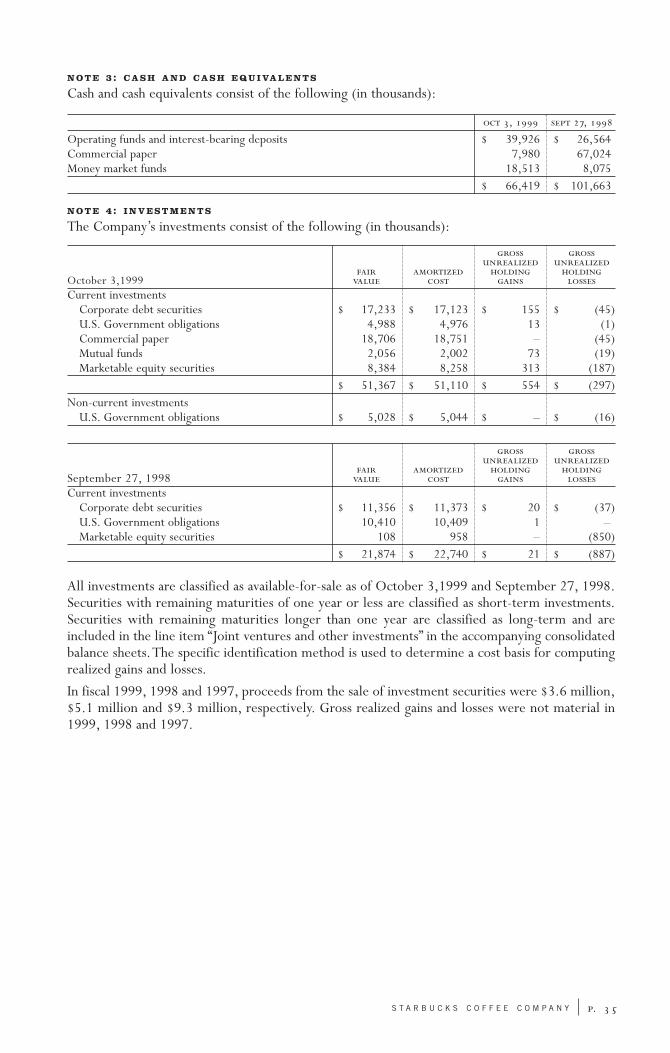
N O T E 3: C A S H A N D C A S H E Q U I VA L E N T S
Cash and cash equivalents consist of the following (in thousands):
, ,
Operating funds and interest-bearing deposits $ 39,926 $ 26,564Commercial paper 7,980 67,024Money market funds 18,513 8,075
$ 66,419 $ 101,663
N O T E 4: I N V E S T M E N T S
The Company’s investments consist of the following (in thousands):
October 3,1999
Current investmentsCorporate debt securities $ 17,233 $ 17,123 $ 155 $ (45)U.S. Government obligations 4,988 4,976 13 (1)Commercial paper 18,706 18,751 – (45)Mutual funds 2,056 2,002 73 (19)Marketable equity securities 8,384 8,258 313 (187)
$ 51,367 $ 51,110 $ 554 $ (297)Non-current investments
U.S. Government obligations $ 5,028 $ 5,044 $ – $ (16)
September 27, 1998
Current investmentsCorporate debt securities $ 11,356 $ 11,373 $ 20 $ (37)U.S. Government obligations 10,410 10,409 1 –Marketable equity securities 108 958 – (850)
$ 21,874 $ 22,740 $ 21 $ (887)
All investments are classified as available-for-sale as of October 3,1999 and September 27, 1998.Securities with remaining maturities of one year or less are classified as short-term investments.Securities with remaining maturities longer than one year are classified as long-term and areincluded in the line item “Joint ventures and other investments” in the accompanying consolidatedbalance sheets.The specific identification method is used to determine a cost basis for computingrealized gains and losses.
In fiscal 1999, 1998 and 1997, proceeds from the sale of investment securities were $3.6 million,$5.1 million and $9.3 million, respectively. Gross realized gains and losses were not material in1999, 1998 and 1997.
. S T A R B U C K S C O F F E E C O M P A N Y
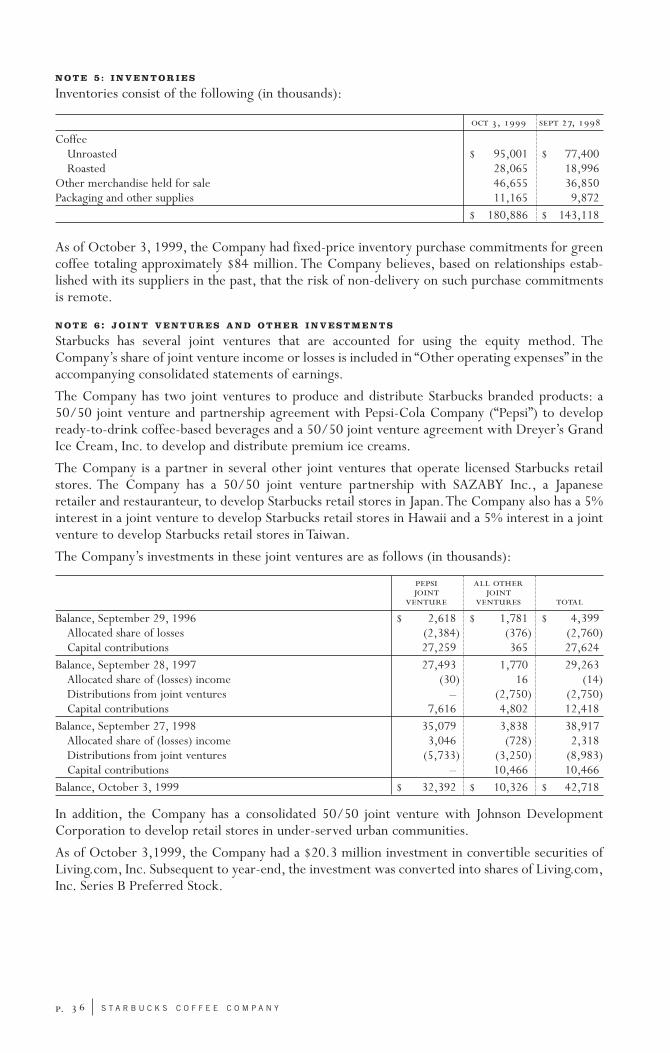
N O T E 5: I N V E N T O R I E S
Inventories consist of the following (in thousands):
, ,
CoffeeUnroasted $ 95,001 $ 77,400Roasted 28,065 18,996
Other merchandise held for sale 46,655 36,850Packaging and other supplies 11,165 9,872
$ 180,886 $ 143,118
As of October 3, 1999, the Company had fixed-price inventory purchase commitments for greencoffee totaling approximately $84 million. The Company believes, based on relationships estab-lished with its suppliers in the past, that the risk of non-delivery on such purchase commitmentsis remote.
N O T E 6: J O I N T V E N T U R E S A N D O T H E R I N V E S T M E N T S
Starbucks has several joint ventures that are accounted for using the equity method. TheCompany’s share of joint venture income or losses is included in “Other operating expenses” in theaccompanying consolidated statements of earnings.
The Company has two joint ventures to produce and distribute Starbucks branded products: a50/50 joint venture and partnership agreement with Pepsi-Cola Company (“Pepsi”) to developready-to-drink coffee-based beverages and a 50/50 joint venture agreement with Dreyer’s GrandIce Cream, Inc. to develop and distribute premium ice creams.
The Company is a partner in several other joint ventures that operate licensed Starbucks retailstores. The Company has a 50/50 joint venture partnership with SAZABY Inc., a Japanese retailer and restauranteur, to develop Starbucks retail stores in Japan.The Company also has a 5% interest in a joint venture to develop Starbucks retail stores in Hawaii and a 5% interest in a jointventure to develop Starbucks retail stores in Taiwan.
The Company’s investments in these joint ventures are as follows (in thousands):
Balance, September 29, 1996 $ 2,618 $ 1,781 $ 4,399Allocated share of losses (2,384) (376) (2,760)Capital contributions 27,259 365 27,624
Balance, September 28, 1997 27,493 1,770 29,263Allocated share of (losses) income (30) 16 (14)Distributions from joint ventures – (2,750) (2,750)Capital contributions 7,616 4,802 12,418
Balance, September 27, 1998 35,079 3,838 38,917 Allocated share of (losses) income 3,046 (728) 2,318Distributions from joint ventures (5,733) (3,250) (8,983)Capital contributions – 10,466 10,466
Balance, October 3, 1999 $ 32,392 $ 10,326 $ 42,718
In addition, the Company has a consolidated 50/50 joint venture with Johnson DevelopmentCorporation to develop retail stores in under-served urban communities.
As of October 3,1999, the Company had a $20.3 million investment in convertible securities ofLiving.com, Inc. Subsequent to year-end, the investment was converted into shares of Living.com,Inc. Series B Preferred Stock.
. S T A R B U C K S C O F F E E C O M P A N Y
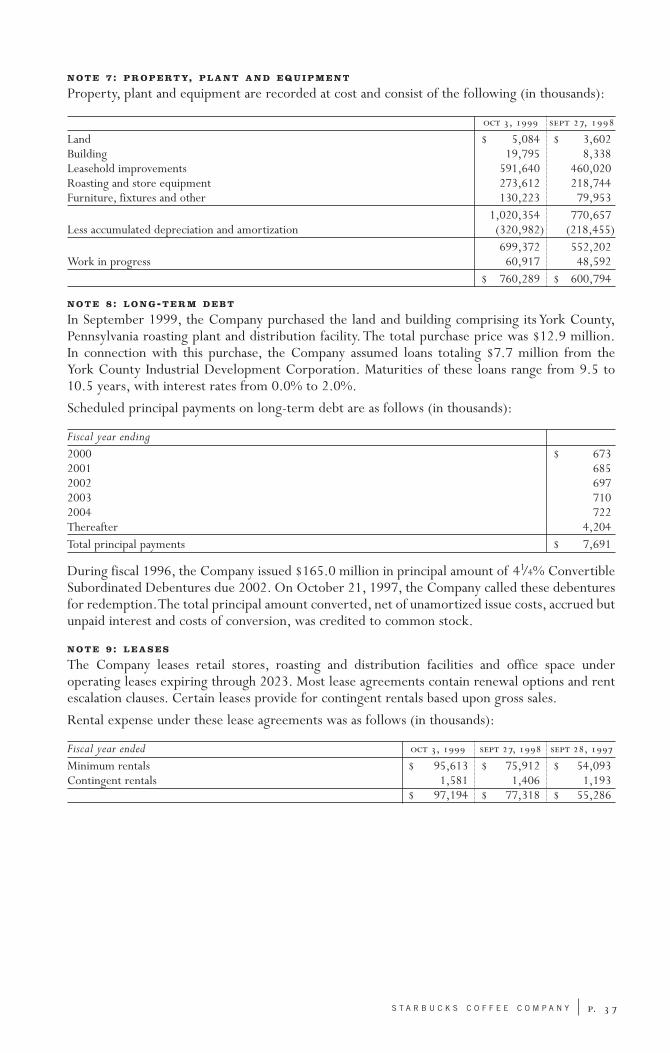
N O T E 7: P R O P E RT Y, P L A N T A N D E Q U I P M E N T
Property, plant and equipment are recorded at cost and consist of the following (in thousands):
, ,
Land $ 5,084 $ 3,602Building 19,795 8,338Leasehold improvements 591,640 460,020Roasting and store equipment 273,612 218,744Furniture, fixtures and other 130,223 79,953
1,020,354 770,657Less accumulated depreciation and amortization (320,982) (218,455)
699,372 552,202Work in progress 60,917 48,592
$ 760,289 $ 600,794
N O T E 8: L O N G-T E R M D E B T
In September 1999, the Company purchased the land and building comprising its York County,Pennsylvania roasting plant and distribution facility. The total purchase price was $12.9 million.In connection with this purchase, the Company assumed loans totaling $7.7 million from the York County Industrial Development Corporation. Maturities of these loans range from 9.5 to10.5 years, with interest rates from 0.0% to 2.0%.
Scheduled principal payments on long-term debt are as follows (in thousands):
Fiscal year ending2000 $ 6732001 6852002 6972003 7102004 722Thereafter 4,204Total principal payments $ 7,691
During fiscal 1996, the Company issued $165.0 million in principal amount of 41/4% ConvertibleSubordinated Debentures due 2002. On October 21, 1997, the Company called these debenturesfor redemption.The total principal amount converted, net of unamortized issue costs, accrued butunpaid interest and costs of conversion, was credited to common stock.
N O T E 9: L E A S E S
The Company leases retail stores, roasting and distribution facilities and office space under operating leases expiring through 2023. Most lease agreements contain renewal options and rentescalation clauses. Certain leases provide for contingent rentals based upon gross sales.
Rental expense under these lease agreements was as follows (in thousands):
Fiscal year ended , , ,
Minimum rentals $ 95,613 $ 75,912 $ 54,093Contingent rentals 1,581 1,406 1,193
$ 97,194 $ 77,318 $ 55,286
. S T A R B U C K S C O F F E E C O M P A N Y
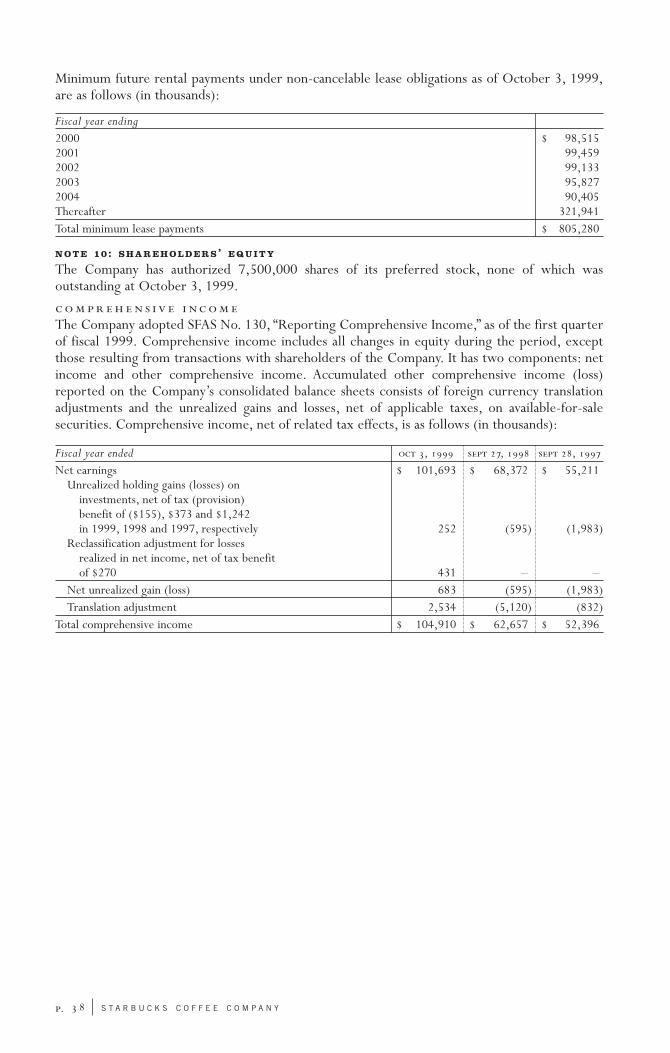
Minimum future rental payments under non-cancelable lease obligations as of October 3, 1999,are as follows (in thousands):
Fiscal year ending2000 $ 98,5152001 99,4592002 99,1332003 95,8272004 90,405Thereafter 321,941Total minimum lease payments $ 805,280
N O T E 10: S H A R E H O L D E R S’ E Q U I T Y
The Company has authorized 7,500,000 shares of its preferred stock, none of which was outstanding at October 3, 1999.
The Company adopted SFAS No. 130, “Reporting Comprehensive Income,” as of the first quarterof fiscal 1999. Comprehensive income includes all changes in equity during the period, exceptthose resulting from transactions with shareholders of the Company. It has two components: netincome and other comprehensive income. Accumulated other comprehensive income (loss)reported on the Company’s consolidated balance sheets consists of foreign currency translationadjustments and the unrealized gains and losses, net of applicable taxes, on available-for-sale securities. Comprehensive income, net of related tax effects, is as follows (in thousands):
Fiscal year ended , , ,
Net earnings $ 101,693 $ 68,372 $ 55,211Unrealized holding gains (losses) on
investments, net of tax (provision) benefit of ($155), $373 and $1,242in 1999, 1998 and 1997, respectively 252 (595) (1,983)
Reclassification adjustment for lossesrealized in net income, net of tax benefitof $270 431 – –
Net unrealized gain (loss) 683 (595) (1,983)Translation adjustment 2,534 (5,120) (832)
Total comprehensive income $ 104,910 $ 62,657 $ 52,396
. S T A R B U C K S C O F F E E C O M P A N Y
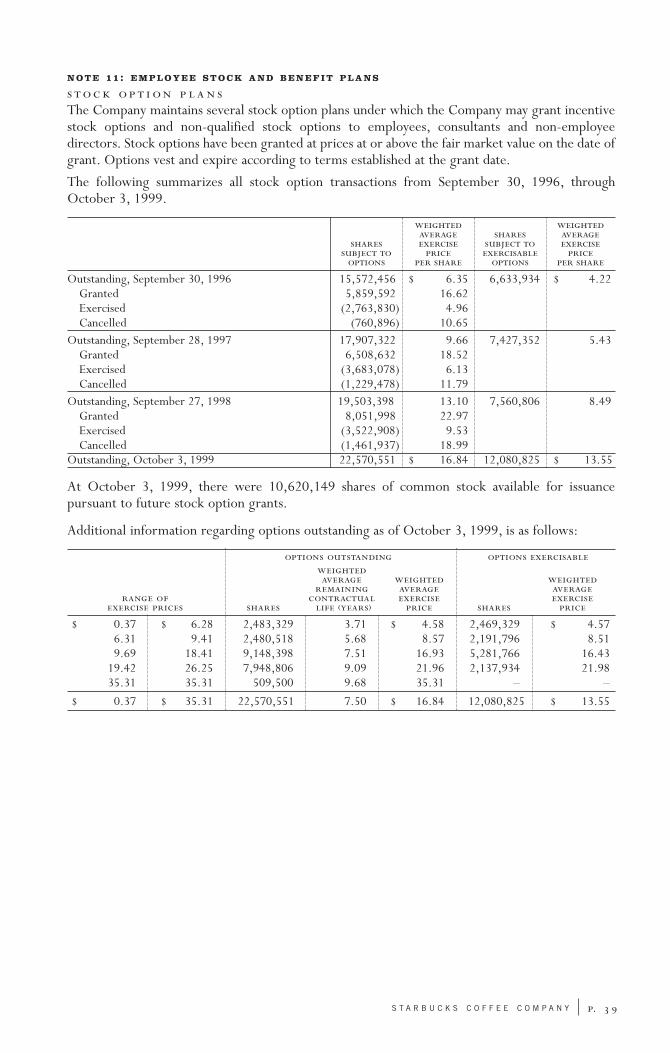
N O T E 11: E M P L O Y E E S T O C K A N D B E N E F I T P L A N S
The Company maintains several stock option plans under which the Company may grant incentivestock options and non-qualified stock options to employees, consultants and non-employee directors. Stock options have been granted at prices at or above the fair market value on the date ofgrant. Options vest and expire according to terms established at the grant date.
The following summarizes all stock option transactions from September 30, 1996, throughOctober 3, 1999.
Outstanding, September 30, 1996 15,572,456 $ 6.35 6,633,934 $ 4.22Granted 5,859,592 16.62Exercised (2,763,830) 4.96Cancelled (760,896) 10.65
Outstanding, September 28, 1997 17,907,322 9.66 7,427,352 5.43Granted 6,508,632 18.52Exercised (3,683,078) 6.13Cancelled (1,229,478) 11.79
Outstanding, September 27, 1998 19,503,398 13.10 7,560,806 8.49Granted 8,051,998 22.97Exercised (3,522,908) 9.53Cancelled (1,461,937) 18.99
Outstanding, October 3, 1999 22,570,551 $ 16.84 12,080,825 $ 13.55
At October 3, 1999, there were 10,620,149 shares of common stock available for issuance pursuant to future stock option grants.
Additional information regarding options outstanding as of October 3, 1999, is as follows:
⁽⁾
$ 0.37 $ 6.28 2,483,329 3.71 $ 4.58 2,469,329 $ 4.576.31 9.41 2,480,518 5.68 8.57 2,191,796 8.519.69 18.41 9,148,398 7.51 16.93 5,281,766 16.43
19.42 26.25 7,948,806 9.09 21.96 2,137,934 21.9835.31 35.31 509,500 9.68 35.31 – –
$ 0.37 $ 35.31 22,570,551 7.50 $ 16.84 12,080,825 $ 13.55
. S T A R B U C K S C O F F E E C O M P A N Y
The Company has an employee stock purchase plan which provides that eligible employees may contribute up to 10% of their base earnings, up to $25,000 annually, toward the quarterly purchase of the Company’s common stock. The employee’s purchase price is 85% of the lesser of the fair market value of the stock on the first business day or the last business day of the quarterly offering period. No compensation expense is recorded in connection with the plan.Thetotal number of shares issuable under the plan is 8,000,000. There were 492,231 shares issuedunder the plan during fiscal 1999 at prices ranging from $14.05 to $25.18.There were 271,778shares issued under the plan during fiscal 1998 at prices ranging from $15.99 to $19.58. Therewere 185,492 shares issued under the plan during fiscal 1997 at prices ranging from $11.79 to$12.86. Of the 18,555 employees eligible to participate, 4,972 were participants in the plan as ofOctober 3, 1999.
The Company has a Deferred Stock Plan for certain key employees that enables participants in theplan to defer receipt of ownership of common shares from the exercise of non-qualified stockoptions. The minimum deferral period is five years. As of October 3, 1999, receipt of 848,550shares was deferred under the terms of this plan. The rights to receive these shares, representedby common stock units, are included in the calculation of basic and diluted earnings per share ascommon stock equivalents.
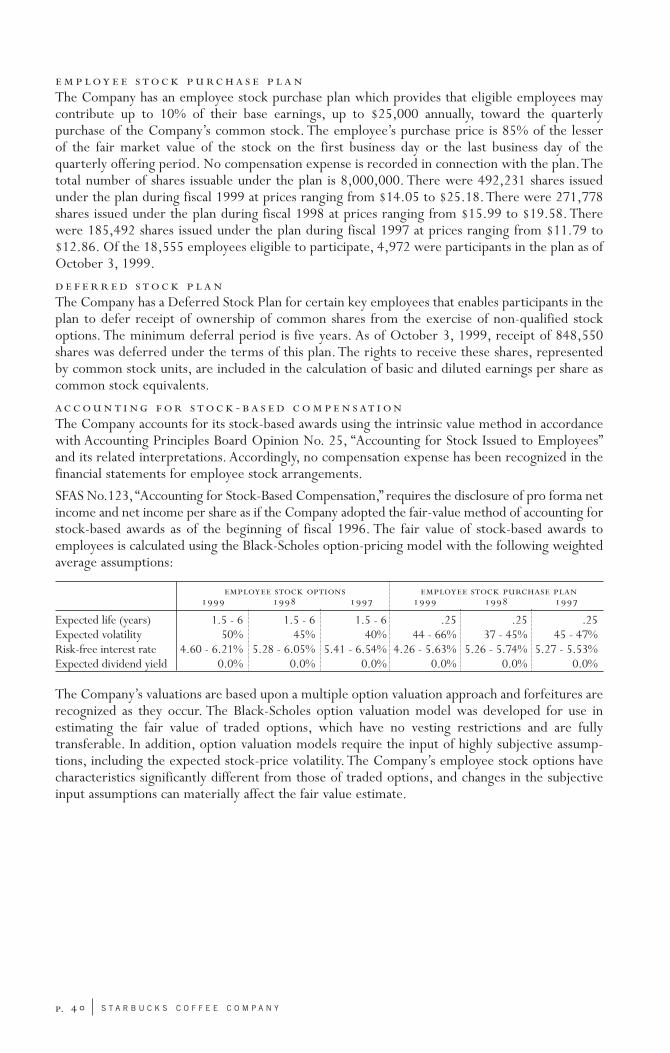
- The Company accounts for its stock-based awards using the intrinsic value method in accordancewith Accounting Principles Board Opinion No. 25, “Accounting for Stock Issued to Employees”and its related interpretations. Accordingly, no compensation expense has been recognized in thefinancial statements for employee stock arrangements.
SFAS No.123, “Accounting for Stock-Based Compensation,” requires the disclosure of pro forma netincome and net income per share as if the Company adopted the fair-value method of accounting forstock-based awards as of the beginning of fiscal 1996. The fair value of stock-based awards toemployees is calculated using the Black-Scholes option-pricing model with the following weightedaverage assumptions:
Expected life (years) 1.5 - 6 1.5 - 6 1.5 - 6 .25 .25 .25Expected volatility 50% 45% 40% 44 - 66% 37 - 45% 45 - 47%Risk-free interest rate 4.60 - 6.21% 5.28 - 6.05% 5.41 - 6.54% 4.26 - 5.63% 5.26 - 5.74% 5.27 - 5.53%Expected dividend yield 0.0% 0.0% 0.0% 0.0% 0.0% 0.0%
The Company’s valuations are based upon a multiple option valuation approach and forfeitures arerecognized as they occur. The Black-Scholes option valuation model was developed for use in estimating the fair value of traded options, which have no vesting restrictions and are fully transferable. In addition, option valuation models require the input of highly subjective assump-tions, including the expected stock-price volatility. The Company’s employee stock options havecharacteristics significantly different from those of traded options, and changes in the subjectiveinput assumptions can materially affect the fair value estimate.
. S T A R B U C K S C O F F E E C O M P A N Y
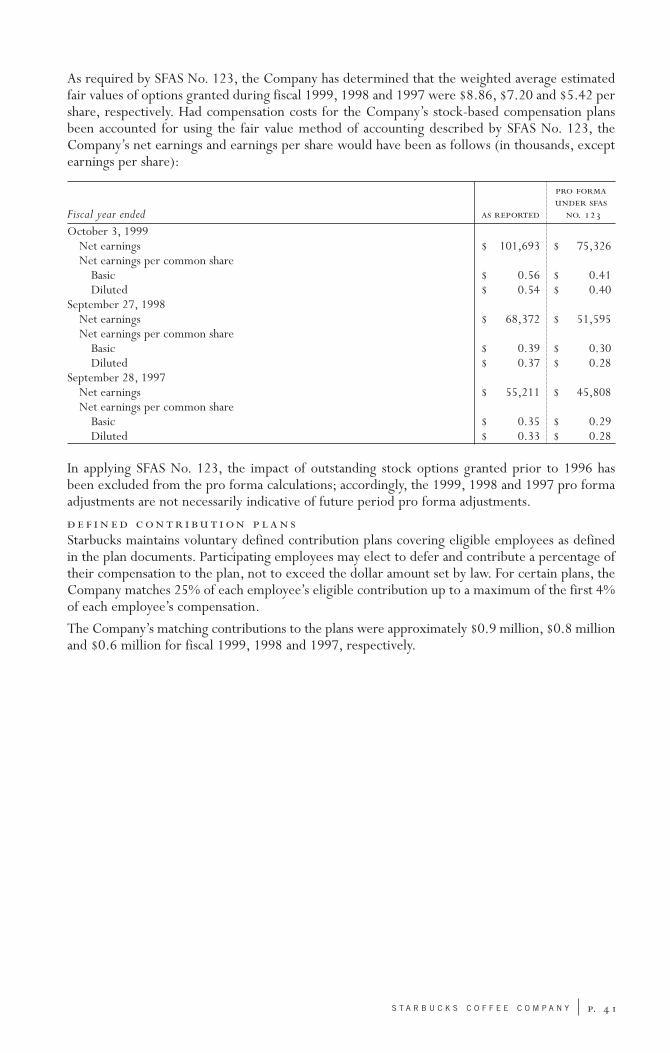
As required by SFAS No. 123, the Company has determined that the weighted average estimatedfair values of options granted during fiscal 1999, 1998 and 1997 were $8.86, $7.20 and $5.42 pershare, respectively. Had compensation costs for the Company’s stock-based compensation plansbeen accounted for using the fair value method of accounting described by SFAS No. 123, theCompany’s net earnings and earnings per share would have been as follows (in thousands, exceptearnings per share):
Fiscal year ended .
October 3, 1999Net earnings $ 101,693 $ 75,326Net earnings per common share
Basic $ 0.56 $ 0.41Diluted $ 0.54 $ 0.40
September 27, 1998Net earnings $ 68,372 $ 51,595Net earnings per common share
Basic $ 0.39 $ 0.30Diluted $ 0.37 $ 0.28
September 28, 1997Net earnings $ 55,211 $ 45,808Net earnings per common share
Basic $ 0.35 $ 0.29Diluted $ 0.33 $ 0.28
In applying SFAS No. 123, the impact of outstanding stock options granted prior to 1996 has been excluded from the pro forma calculations; accordingly, the 1999, 1998 and 1997 pro forma adjustments are not necessarily indicative of future period pro forma adjustments.
Starbucks maintains voluntary defined contribution plans covering eligible employees as definedin the plan documents. Participating employees may elect to defer and contribute a percentage oftheir compensation to the plan, not to exceed the dollar amount set by law. For certain plans, theCompany matches 25% of each employee’s eligible contribution up to a maximum of the first 4%of each employee’s compensation.
The Company’s matching contributions to the plans were approximately $0.9 million, $0.8 millionand $0.6 million for fiscal 1999, 1998 and 1997, respectively.
. S T A R B U C K S C O F F E E C O M P A N Y
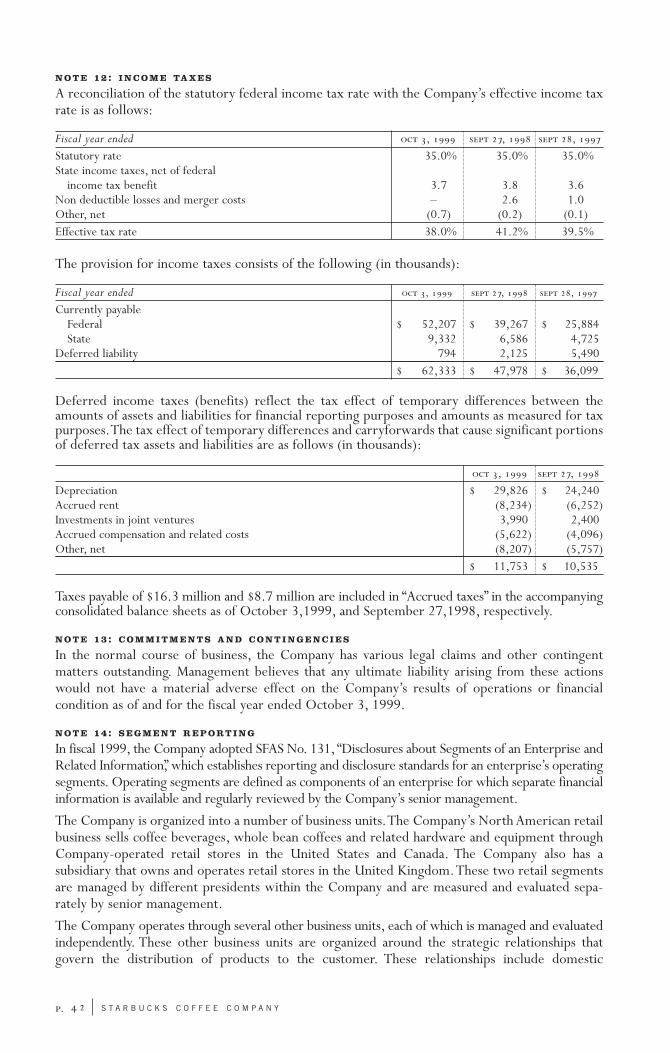
N O T E 12: I N C O M E TA X E S
A reconciliation of the statutory federal income tax rate with the Company’s effective income taxrate is as follows:
Fiscal year ended , , ,
Statutory rate 35.0% 35.0% 35.0%State income taxes, net of federal
income tax benefit 3.7 3.8 3.6Non deductible losses and merger costs – 2.6 1.0Other, net (0.7) (0.2) (0.1)Effective tax rate 38.0% 41.2% 39.5%
The provision for income taxes consists of the following (in thousands):
Fiscal year ended , , ,
Currently payableFederal $ 52,207 $ 39,267 $ 25,884State 9,332 6,586 4,725
Deferred liability 794 2,125 5,490$ 62,333 $ 47,978 $ 36,099
Deferred income taxes (benefits) reflect the tax effect of temporary differences between theamounts of assets and liabilities for financial reporting purposes and amounts as measured for taxpurposes.The tax effect of temporary differences and carryforwards that cause significant portionsof deferred tax assets and liabilities are as follows (in thousands):
, ,
Depreciation $ 29,826 $ 24,240Accrued rent (8,234) (6,252)Investments in joint ventures 3,990 2,400Accrued compensation and related costs (5,622) (4,096)Other, net (8,207) (5,757)
$ 11,753 $ 10,535
Taxes payable of $16.3 million and $8.7 million are included in “Accrued taxes” in the accompanyingconsolidated balance sheets as of October 3,1999, and September 27,1998, respectively.
N O T E 13: C O M M I T M E N T S A N D C O N T I N G E N C I E S
In the normal course of business, the Company has various legal claims and other contingent matters outstanding. Management believes that any ultimate liability arising from these actionswould not have a material adverse effect on the Company’s results of operations or financial condition as of and for the fiscal year ended October 3, 1999.
N O T E 14: S E G M E N T R E P O RT I N G
In fiscal 1999, the Company adopted SFAS No. 131, “Disclosures about Segments of an Enterprise andRelated Information”, which establishes reporting and disclosure standards for an enterprise’s operatingsegments. Operating segments are defined as components of an enterprise for which separate financialinformation is available and regularly reviewed by the Company’s senior management.
The Company is organized into a number of business units.The Company’s North American retailbusiness sells coffee beverages, whole bean coffees and related hardware and equipment throughCompany-operated retail stores in the United States and Canada. The Company also has a subsidiary that owns and operates retail stores in the United Kingdom.These two retail segmentsare managed by different presidents within the Company and are measured and evaluated sepa-rately by senior management.
The Company operates through several other business units, each of which is managed and evaluatedindependently. These other business units are organized around the strategic relationships that govern the distribution of products to the customer. These relationships include domestic
. S T A R B U C K S C O F F E E C O M P A N Y
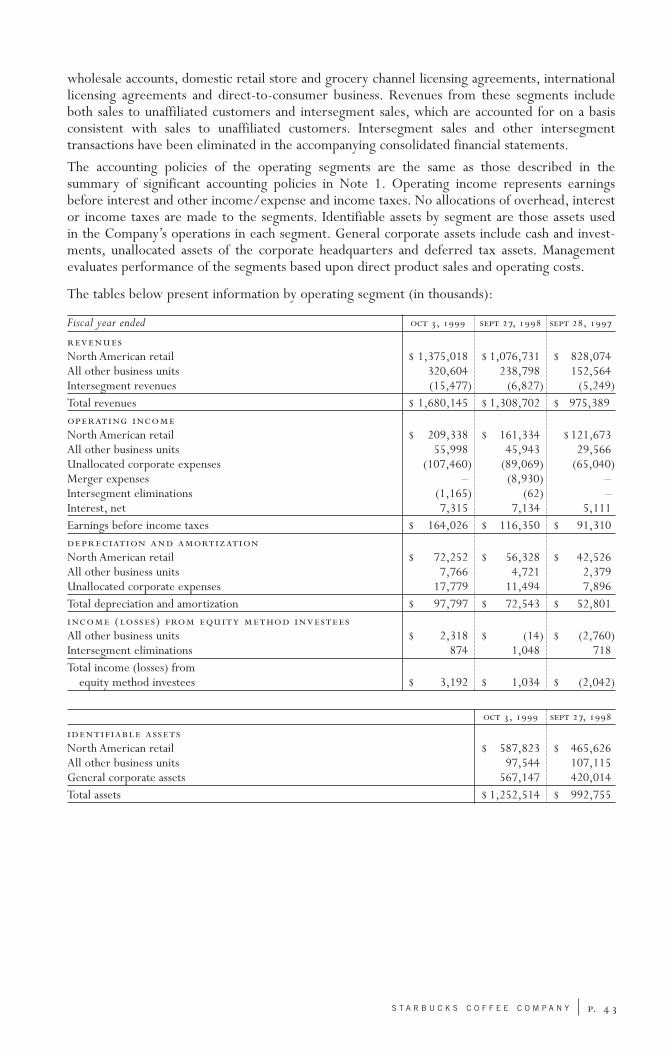
wholesale accounts, domestic retail store and grocery channel licensing agreements, internationallicensing agreements and direct-to-consumer business. Revenues from these segments includeboth sales to unaffiliated customers and intersegment sales, which are accounted for on a basisconsistent with sales to unaffiliated customers. Intersegment sales and other intersegment transactions have been eliminated in the accompanying consolidated financial statements.
The accounting policies of the operating segments are the same as those described in the summary of significant accounting policies in Note 1. Operating income represents earningsbefore interest and other income/expense and income taxes. No allocations of overhead, interestor income taxes are made to the segments. Identifiable assets by segment are those assets used in the Company’s operations in each segment. General corporate assets include cash and invest-ments, unallocated assets of the corporate headquarters and deferred tax assets. Management evaluates performance of the segments based upon direct product sales and operating costs.
The tables below present information by operating segment (in thousands):
Fiscal year ended , , ,
North American retail $ 1,375,018 $ 1,076,731 $ 828,074All other business units 320,604 238,798 152,564Intersegment revenues (15,477) (6,827) (5,249)Total revenues $ 1,680,145 $ 1,308,702 $ 975,389 North American retail $ 209,338 $ 161,334 $ 121,673All other business units 55,998 45,943 29,566Unallocated corporate expenses (107,460) (89,069) (65,040)Merger expenses – (8,930) –Intersegment eliminations (1,165) (62) –Interest, net 7,315 7,134 5,111Earnings before income taxes $ 164,026 $ 116,350 $ 91,310 North American retail $ 72,252 $ 56,328 $ 42,526All other business units 7,766 4,721 2,379Unallocated corporate expenses 17,779 11,494 7,896Total depreciation and amortization $ 97,797 $ 72,543 $ 52,801 () All other business units $ 2,318 $ (14) $ (2,760)Intersegment eliminations 874 1,048 718Total income (losses) from
equity method investees $ 3,192 $ 1,034 $ (2,042)
, ,
North American retail $ 587,823 $ 465,626All other business units 97,544 107,115General corporate assets 567,147 420,014Total assets $ 1,252,514 $ 992,755
. S T A R B U C K S C O F F E E C O M P A N Y
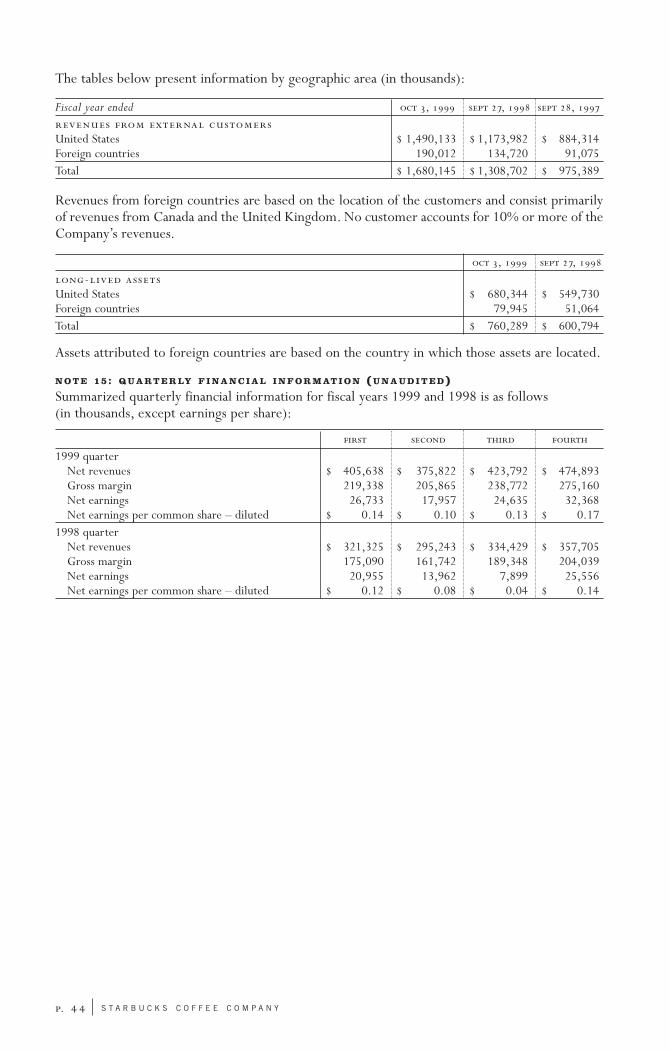
The tables below present information by geographic area (in thousands):
Fiscal year ended , , ,
United States $ 1,490,133 $ 1,173,982 $ 884,314Foreign countries 190,012 134,720 91,075Total $ 1,680,145 $ 1,308,702 $ 975,389
Revenues from foreign countries are based on the location of the customers and consist primarilyof revenues from Canada and the United Kingdom. No customer accounts for 10% or more of theCompany’s revenues.
, ,
- United States $ 680,344 $ 549,730Foreign countries 79,945 51,064Total $ 760,289 $ 600,794
Assets attributed to foreign countries are based on the country in which those assets are located.
N O T E 15: Q U A RT E R LY F I N A N C I A L I N F O R M AT I O N (U N A U D I T E D)Summarized quarterly financial information for fiscal years 1999 and 1998 is as follows (in thousands, except earnings per share):
1999 quarterNet revenues $ 405,638 $ 375,822 $ 423,792 $ 474,893Gross margin 219,338 205,865 238,772 275,160Net earnings 26,733 17,957 24,635 32,368Net earnings per common share – diluted $ 0.14 $ 0.10 $ 0.13 $ 0.17
1998 quarterNet revenues $ 321,325 $ 295,243 $ 334,429 $ 357,705Gross margin 175,090 161,742 189,348 204,039Net earnings 20,955 13,962 7,899 25,556Net earnings per common share – diluted $ 0.12 $ 0.08 $ 0.04 $ 0.14
. S T A R B U C K S C O F F E E C O M P A N Y
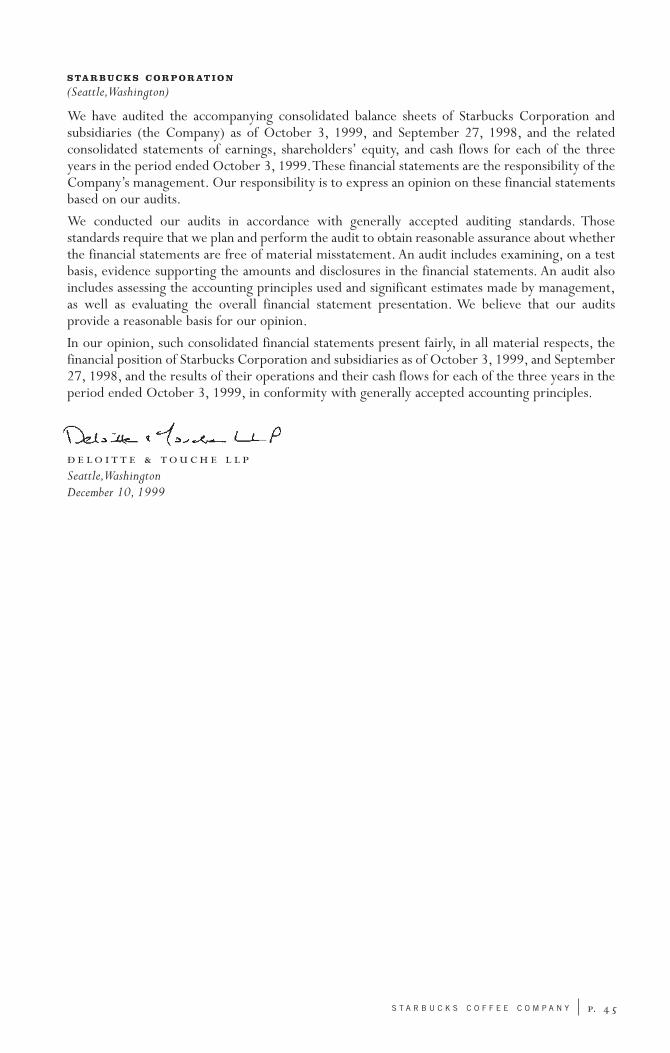
S TA R B U C K S C O R P O R AT I O N
(Seattle,Washington)
We have audited the accompanying consolidated balance sheets of Starbucks Corporation and subsidiaries (the Company) as of October 3, 1999, and September 27, 1998, and the related consolidated statements of earnings, shareholders’ equity, and cash flows for each of the threeyears in the period ended October 3, 1999.These financial statements are the responsibility of theCompany’s management. Our responsibility is to express an opinion on these financial statementsbased on our audits.
We conducted our audits in accordance with generally accepted auditing standards. Those standards require that we plan and perform the audit to obtain reasonable assurance about whetherthe financial statements are free of material misstatement. An audit includes examining, on a testbasis, evidence supporting the amounts and disclosures in the financial statements. An audit alsoincludes assessing the accounting principles used and significant estimates made by management,as well as evaluating the overall financial statement presentation. We believe that our audits provide a reasonable basis for our opinion.
In our opinion, such consolidated financial statements present fairly, in all material respects, thefinancial position of Starbucks Corporation and subsidiaries as of October 3, 1999, and September27, 1998, and the results of their operations and their cash flows for each of the three years in theperiod ended October 3, 1999, in conformity with generally accepted accounting principles.
Seattle,WashingtonDecember 10, 1999
. S T A R B U C K S C O F F E E C O M P A N Y
M A N A G E M E N T’S R E S P O N S I B I L I T Y F O R F I N A N C I A L R E P O RT I N G
The management of Starbucks Corporation is responsible for the preparation and integrity of thefinancial statements included in this Annual Report to Shareholders.The financial statements havebeen prepared in conformity with generally accepted accounting principles and include amountsbased on management’s best judgment where necessary. Financial information included elsewherein this Annual Report is consistent with these financial statements.
Management maintains a system of internal controls and procedures designed to provide reasonableassurance that transactions are executed in accordance with proper authorization, that transactionsare properly recorded in the Company’s records, that assets are safeguarded and that accountabilityfor assets is maintained. The concept of reasonable assurance is based on the recognition that the cost of maintaining our system of internal accounting controls should not exceed benefitsexpected to be derived from the system. Internal controls and procedures are periodicallyreviewed and revised, when appropriate, due to changing circumstances and requirements.
Independent auditors are appointed by the Company’s Board of Directors and ratified by theCompany’s shareholders to audit the financial statements in accordance with generally acceptedauditing standards and to independently assess the fair presentation of the Company’s financialposition, results of operations and cash flows.Their report appears in this Annual Report.
The Audit Committee, all of whose members are outside directors, is responsible for monitoringthe Company’s accounting and reporting practices.The Audit Committee meets periodically withmanagement and the independent auditors to ensure that each is properly discharging its responsibilities.The independent auditors have full and free access to the Committee without thepresence of management to discuss the results of their audits, the adequacy of internal accountingcontrols and the quality of financial reporting.
chairman and president and executive vice president,chief executive officer chief operating officer chief financial officer and
chief administrative officer
. S T A R B U C K S C O F F E E C O M P A N Y. S T A R B U C K S C O F F E E C O M P A N Y
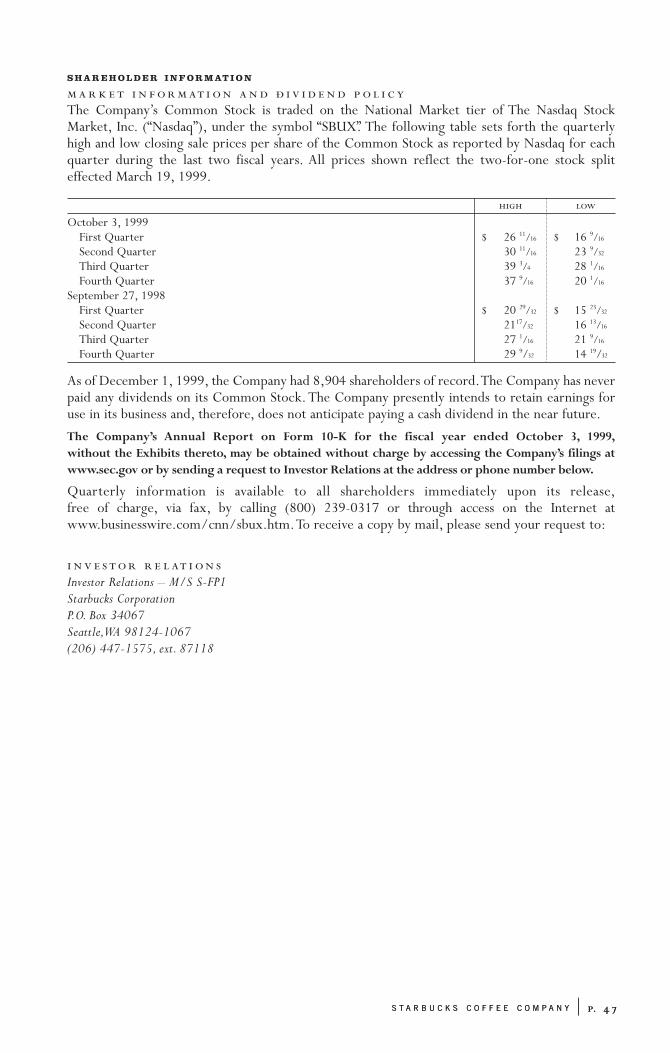
. S T A R B U C K S C O F F E E C O M P A N Y
S H A R E H O L D E R I N F O R M AT I O N
The Company’s Common Stock is traded on the National Market tier of The Nasdaq StockMarket, Inc. (“Nasdaq”), under the symbol “SBUX”. The following table sets forth the quarterlyhigh and low closing sale prices per share of the Common Stock as reported by Nasdaq for each quarter during the last two fiscal years. All prices shown reflect the two-for-one stock split effected March 19, 1999.
October 3, 1999First Quarter $ 26 11/16 $ 16 9/16
Second Quarter 30 11/16 23 9/32
Third Quarter 39 3/4 28 1/16
Fourth Quarter 37 9/16 20 1/16
September 27, 1998First Quarter $ 20 29/32 $ 15 23/32
Second Quarter 2117/32 16 13/16
Third Quarter 27 1/16 21 9/16
Fourth Quarter 29 9/32 14 19/32
As of December 1, 1999, the Company had 8,904 shareholders of record.The Company has neverpaid any dividends on its Common Stock. The Company presently intends to retain earnings foruse in its business and, therefore, does not anticipate paying a cash dividend in the near future.
The Company’s Annual Report on Form 10-K for the fiscal year ended October 3, 1999,without the Exhibits thereto, may be obtained without charge by accessing the Company’s filings atwww.sec.gov or by sending a request to Investor Relations at the address or phone number below.
Quarterly information is available to all shareholders immediately upon its release,free of charge, via fax, by calling (800) 239-0317 or through access on the Internet at www.businesswire.com/cnn/sbux.htm.To receive a copy by mail, please send your request to:
Investor Relations – M/S S-FP1Starbucks CorporationP.O. Box 34067Seattle,WA 98124-1067(206) 447-1575, ext. 87118
. S T A R B U C K S C O F F E E C O M P A N Y
. S T A R B U C K S C O F F E E C O M P A N Y
BOARD OF DIRECTORS
Howard SchultzStarbucks Corporation,chairman of the board and chief executive officer
Orin C. SmithStarbucks Corporation,president and chief operating officer
Arlen I. PrenticeKibble & Prentice,co-chairman and chief executive officer
Barbara BassGerson Bakar Foundation,president
Craig J. FoleyWickham Capital Corp.,president
Craig E. WeatherupThe Pepsi Bottling Group,chairman and chief executive officer
Gregory B. MaffeiMicrosoft Corporation,senior vice president and chief financial officer
Howard P. Behardirector
James G. Shennan, Jr.Trinity Ventures,general partner
EXECUTIVE OFFICERS
Presidents
John B. Richardspresident,North American Operations
Paul D. Davispresident, Retail North America
Peter Maslenpresident, Starbucks CoffeeInternational, Inc.
Executive Vice Presidents
Deidra Wagerexecutive vice president, Retail
Eduardo R. Garciaexecutive vice president, Supply Chainand Coffee Operations
Michael Caseyexecutive vice president, chief financialofficer and chief administrative officer
Senior Vice Presidents
Arthur Rubinfeldsenior vice president, Store Development
Bruce Craigsenior vice president, Retail FieldOperations
David W. Frostsenior vice president,New Business Development
David Olsensenior vice president
Deborah Gillottisenior vice president and general manager, Starbucks X
Engle Saezsenior vice president,Retail Marketing and Product Management
Howard Wollnersenior vice president,Administrationand Strategic Alliance Management
James Allingsenior vice president, Business Alliances
Mark Wesleysenior vice president, Store Developmentand Asset Management
Mary Williamssenior vice president, Coffee
Michael T. Sweeneysenior vice president and president,Starbucks Coffee Company (UK) Limited
Pedro Y.K. Mansenior vice president and president,Starbucks Coffee Asia Pacific Ltd.
Sharon Elliottsenior vice president, Human Resources
Shelley B. Lanzasenior vice president, Law and CorporateAffairs, and general counsel
Wanda Herndonsenior vice president, Communicationsand Public Affairs
Secretary of Corporation
G. Scott Greenburgsecretary
© 2000 Starbucks Coffee Company.All rights reserved. Printed in the USA.This annual report is printed using soy-based inks and paper containing 20% (blue) and 10% (white) post-consumer material.
B O A R D O F D I R E C T O R S A N D E X E C U T I V E O F F I C E R S