Embed Size (px)
Citation preview
Financial Results for Q4 and Full Year 2014
CEO Karl-Henrik Sundström and CFO Seppo Parvi 4 February 2015
It should be noted that certain statements herein which are not historical facts, including, without
limitation those regarding expectations for market growth and developments; expectations for growth
and profitability; and statements preceded by “believes”, “expects”, “anticipates”, “foresees”, or similar
expressions, are forward-looking statements within the meaning of the United States Private Securities
Litigation Reform Act of 1995. Since these statements are based on current plans. estimates and
projections, they involve risks and uncertainties which may cause actual results to materially differ from
those expressed in such forward-looking statements. Such factors include, but are not limited to: (1)
operating factors such as continued success of manufacturing activities and the achievement of
efficiencies therein, continued success of product development, acceptance of new products or services
by the Group’s targeted customers, success of the existing and future collaboration arrangements,
changes in business strategy or development plans or targets, changes in the degree of protection
created by the Group’s patents and other intellectual property rights, the availability of capital on
acceptable terms; (2) industry conditions, such as strength of product demand, intensity of competition,
prevailing and future global market prices for the Group’s products and the pricing pressures thereto.
price fluctuations in raw materials, financial condition of the customers and the competitors of the
Group, the potential introduction of competing products and technologies by competitors; and (3)
general economic conditions, such as rates of economic growth in the Group’s principal geographic
markets or fluctuations in exchange and interest rates.
Stora Enso Q4 and Full Year 2014 Results 2 4 February 2015
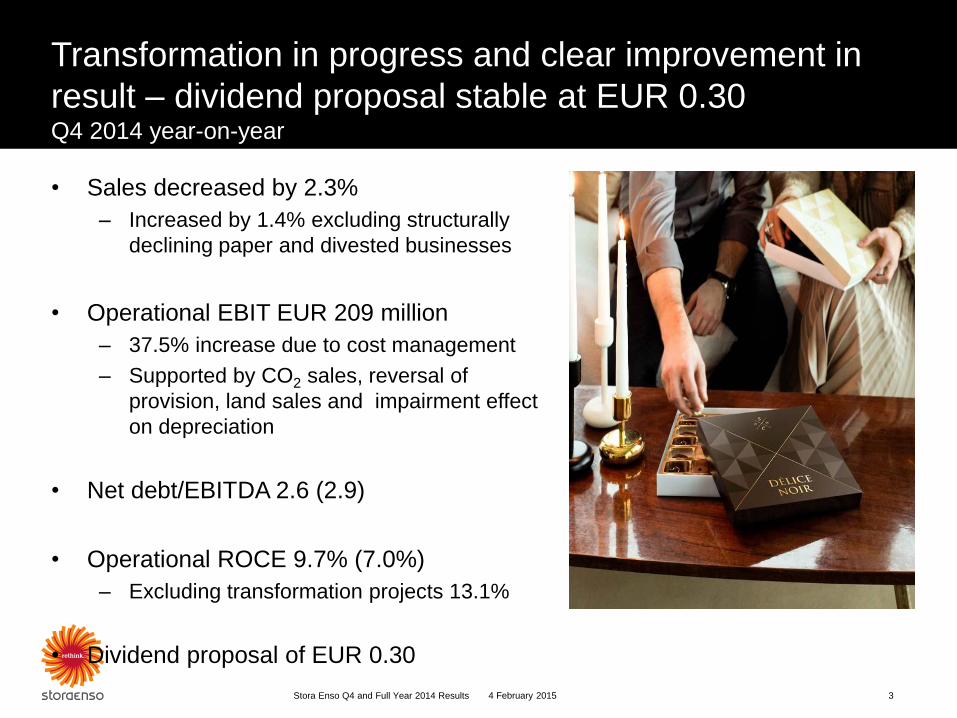
Transformation in progress and clear improvement in
result – dividend proposal stable at EUR 0.30 Q4 2014 year-on-year
• Sales decreased by 2.3%
– Increased by 1.4% excluding structurally
declining paper and divested businesses
• Operational EBIT EUR 209 million
– 37.5% increase due to cost management
– Supported by CO2 sales, reversal of
provision, land sales and impairment effect
on depreciation
• Net debt/EBITDA 2.6 (2.9)
• Operational ROCE 9.7% (7.0%)
– Excluding transformation projects 13.1%
• Dividend proposal of EUR 0.30
4 February 2015 Stora Enso Q4 and Full Year 2014 Results 3
1000
1100
1200
1300
1400
1500
1600
13Q4 14Q4
1000
1200
1400
1600
1800
2000
2200
2400
2600
2800
13Q4 14Q44000
5000
6000
7000
8000
9000
10000
11000
2013 2014
4000
4500
5000
5500
6000
6500
2013 2014
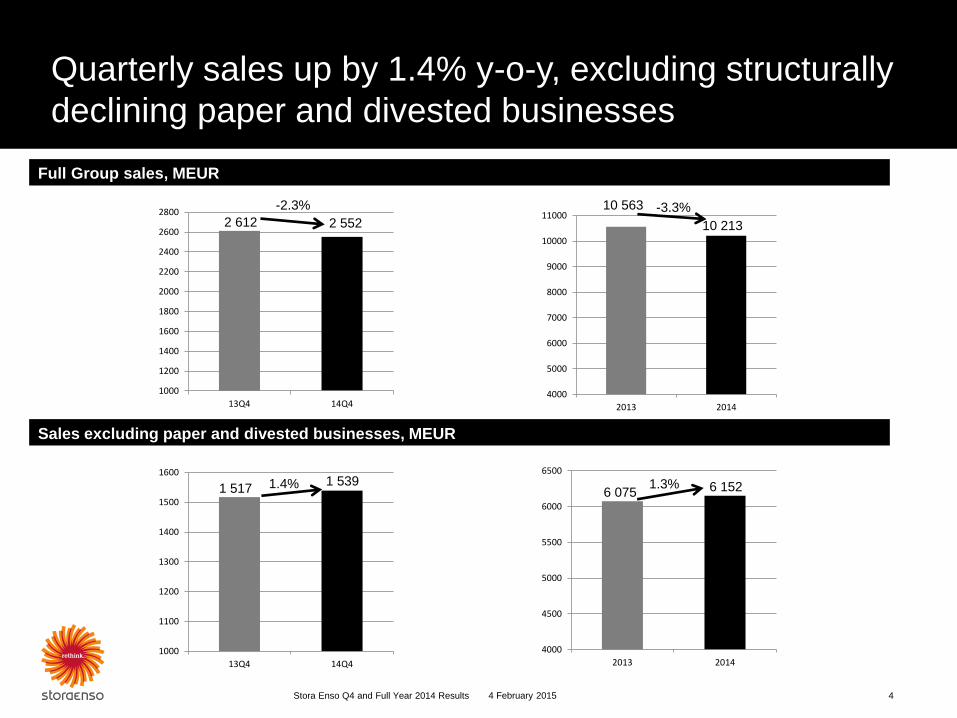
Quarterly sales up by 1.4% y-o-y, excluding structurally
declining paper and divested businesses
4 February 2015 Stora Enso Q4 and Full Year 2014 Results 4
1.4% 1.3%
-3.3% -2.3%
2 612 2 552
10 563
10 213
1 517 1 539
6 075 6 152
Full Group sales, MEUR
Sales excluding paper and divested businesses, MEUR
0
100
200
300
400
500
600
700
800
900
13Q4 14Q4 2013 2014
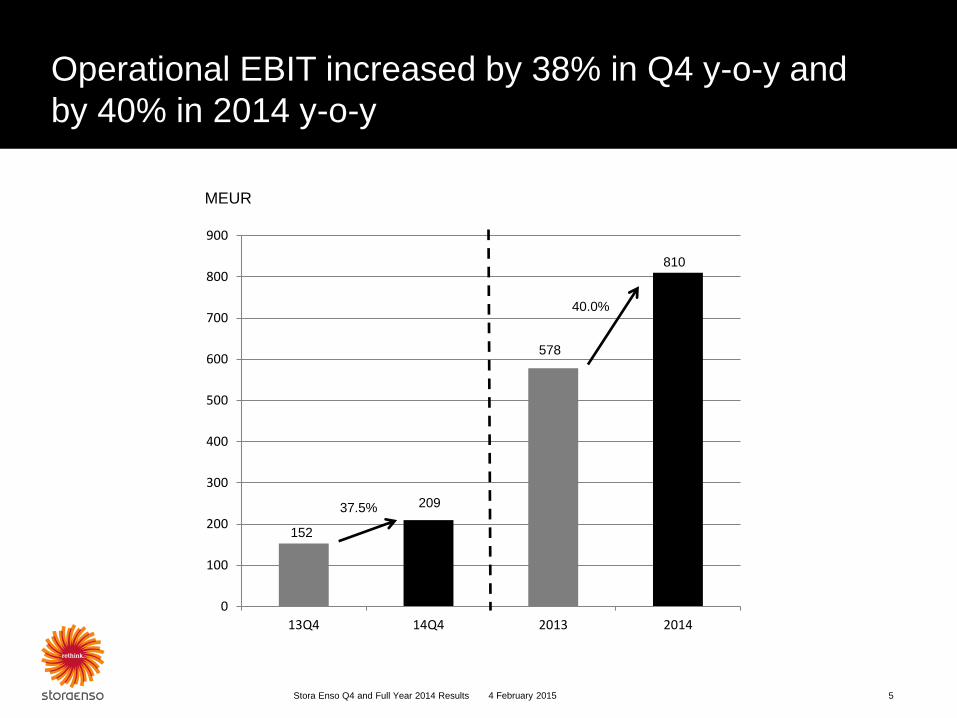
Operational EBIT increased by 38% in Q4 y-o-y and
by 40% in 2014 y-o-y
Stora Enso Q4 and Full Year 2014 Results 5
MEUR
4 February 2015
37.5%
40.0%
152
209
578
810
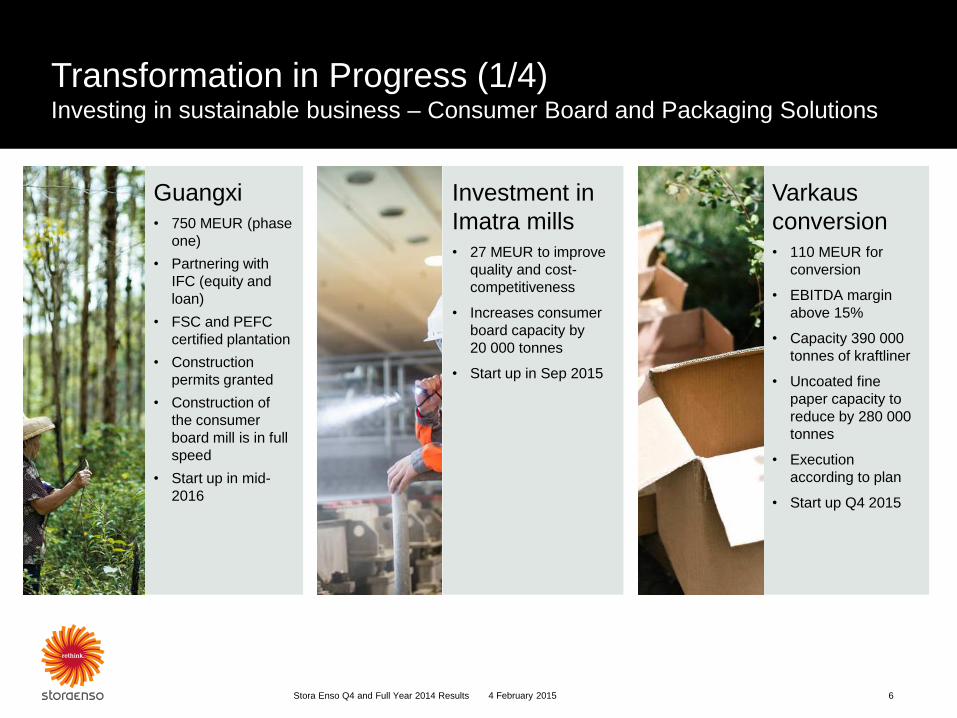
Transformation in Progress (1/4) Investing in sustainable business – Consumer Board and Packaging Solutions
4 February 2015 Stora Enso Q4 and Full Year 2014 Results 6
Guangxi • 750 MEUR (phase
one)
• Partnering with
IFC (equity and
loan)
• FSC and PEFC
certified plantation
• Construction
permits granted
• Construction of
the consumer
board mill is in full
speed
• Start up in mid-
2016
Varkaus
conversion • 110 MEUR for
conversion
• EBITDA margin
above 15%
• Capacity 390 000
tonnes of kraftliner
• Uncoated fine
paper capacity to
reduce by 280 000
tonnes
• Execution
according to plan
• Start up Q4 2015
Investment in
Imatra mills • 27 MEUR to improve
quality and cost-
competitiveness
• Increases consumer
board capacity by
20 000 tonnes
• Start up in Sep 2015
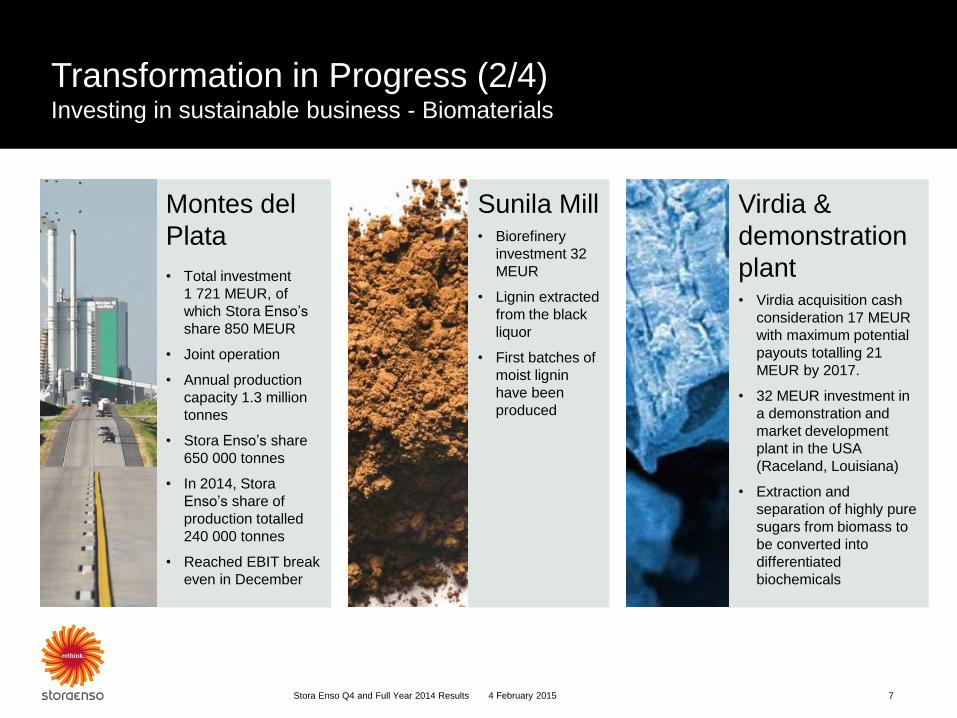
Transformation in Progress (2/4) Investing in sustainable business - Biomaterials
4 February 2015 Stora Enso Q4 and Full Year 2014 Results 7
Montes del
Plata
• Total investment
1 721 MEUR, of
which Stora Enso’s
share 850 MEUR
• Joint operation
• Annual production
capacity 1.3 million
tonnes
• Stora Enso’s share
650 000 tonnes
• In 2014, Stora
Enso’s share of
production totalled
240 000 tonnes
• Reached EBIT break
even in December
Virdia &
demonstration
plant • Virdia acquisition cash
consideration 17 MEUR
with maximum potential
payouts totalling 21
MEUR by 2017.
• 32 MEUR investment in
a demonstration and
market development
plant in the USA
(Raceland, Louisiana)
• Extraction and
separation of highly pure
sugars from biomass to
be converted into
differentiated
biochemicals
Sunila Mill • Biorefinery
investment 32
MEUR
• Lignin extracted
from the black
liquor
• First batches of
moist lignin
have been
produced
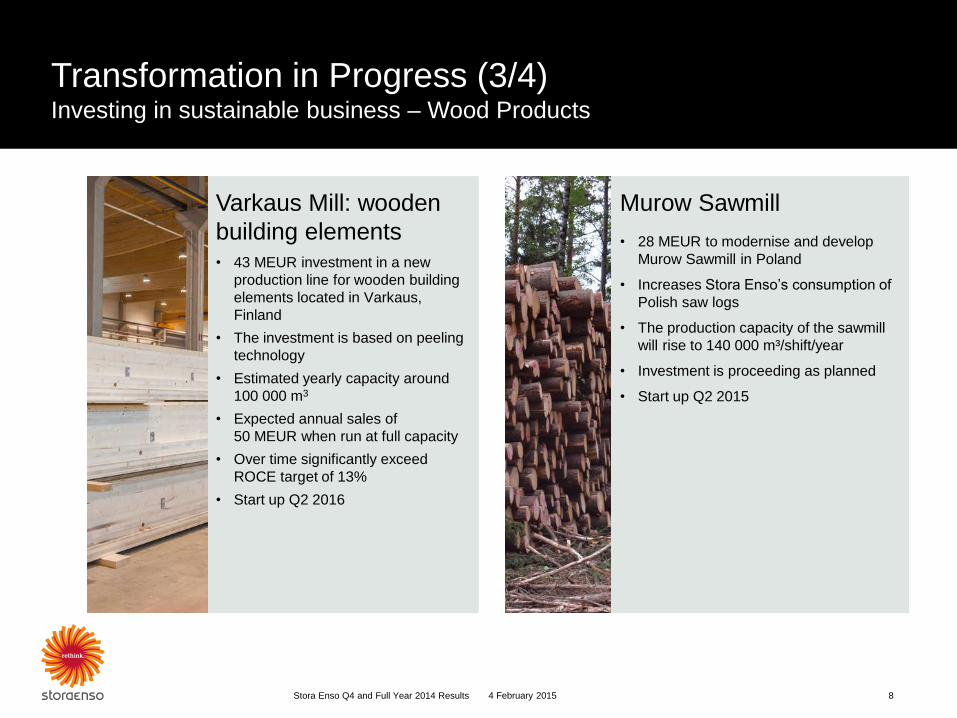
Transformation in Progress (3/4) Investing in sustainable business – Wood Products
4 February 2015 Stora Enso Q4 and Full Year 2014 Results 8
Varkaus Mill: wooden
building elements • 43 MEUR investment in a new
production line for wooden building
elements located in Varkaus,
Finland
• The investment is based on peeling
technology
• Estimated yearly capacity around
100 000 m3
• Expected annual sales of
50 MEUR when run at full capacity
• Over time significantly exceed
ROCE target of 13%
• Start up Q2 2016
Murow Sawmill
• 28 MEUR to modernise and develop
Murow Sawmill in Poland
• Increases Stora Enso’s consumption of
Polish saw logs
• The production capacity of the sawmill
will rise to 140 000 m³/shift/year
• Investment is proceeding as planned
• Start up Q2 2015
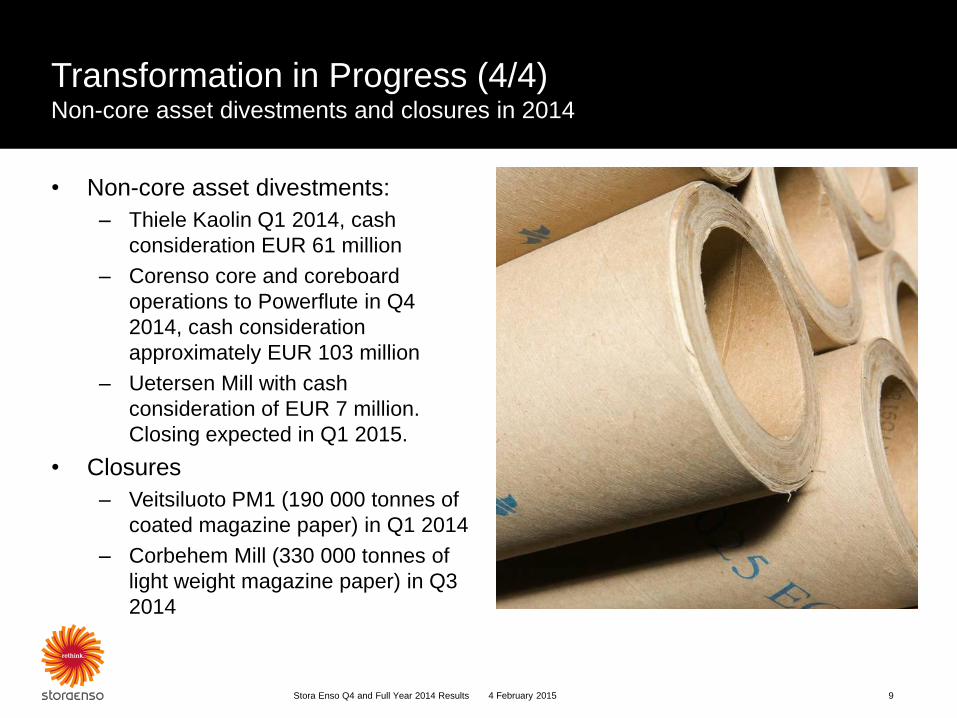
Transformation in Progress (4/4) Non-core asset divestments and closures in 2014
• Non-core asset divestments:
– Thiele Kaolin Q1 2014, cash
consideration EUR 61 million
– Corenso core and coreboard
operations to Powerflute in Q4
2014, cash consideration
approximately EUR 103 million
– Uetersen Mill with cash
consideration of EUR 7 million.
Closing expected in Q1 2015.
• Closures
– Veitsiluoto PM1 (190 000 tonnes of
coated magazine paper) in Q1 2014
– Corbehem Mill (330 000 tonnes of
light weight magazine paper) in Q3
2014
4 February 2015 Stora Enso Q4 and Full Year 2014 Results 9
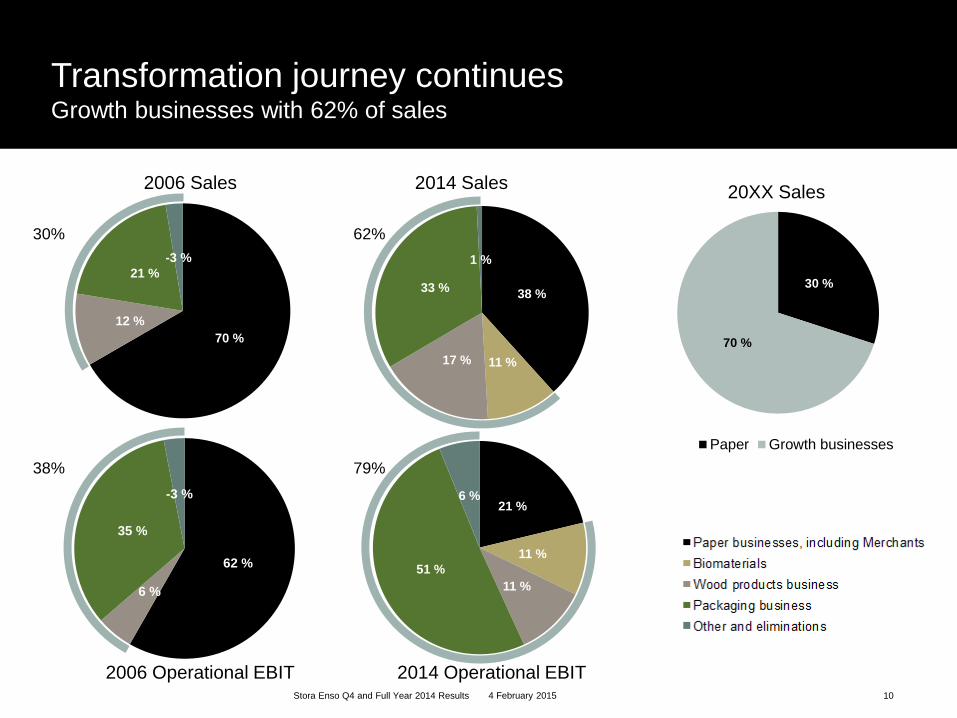
38 %
11 %17 %
33 %
1 %
30 %
70 %
Paper Growth businesses
21 %
11 %
11 %
51 %
6 %
Transformation journey continues Growth businesses with 62% of sales
20XX Sales
62 %
6 %
35 %
-3 %
70 %
12 %
21 %
-3 %
2006 Sales
Stora Enso Q4 and Full Year 2014 Results 10 4 February 2015
2014 Operational EBIT 2006 Operational EBIT
2014 Sales
62%
79%
30%
38%
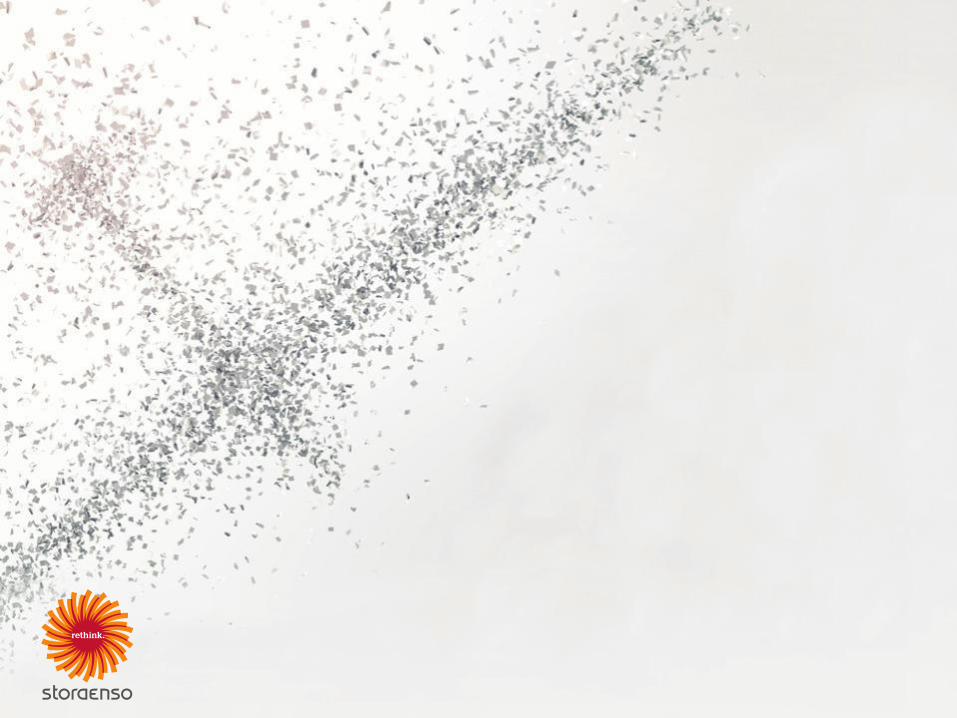
Summary financials Q4 2014 and 2014
EUR million
Q4/14
Q4/13
Change
%
Change
%
2014
2013
Change
Q4 14 /
Q4 13 Q3/14
Q4 14 /
Q3 14
%
14/13
Sales 2 552 2 612 -2.3% 2 514 1.5% 10 213 10 563 -3.3%
Operational EBITDA 308 260 18.5% 333 -7.5% 1 269 1 090 16.4%
Operational EBITDA, % 12.1% 10.0% 13.2% 12.4 % 10.3%
Operational EBIT 209 152 37.5% 210 -0.5% 810 578 40.1%
Operational EBIT margin, % 8.2% 5.8% 8.4% 7.9% 5.5%
Profit before tax excl. NRI 32 111 -71.2% 116 -72.4% 399 350 14.0%
EPS excl. NRI, EUR 0.06 0.15 0.12 0.40 0.40
EPS (basic), EUR -0.15 -0.18 0.15 0.13 -0.07
Operational ROCE, % 9.7% 7.0% 9.7% 9.5% 6.5%
Operational ROCE, % excl.
transformation investments 13.1% 9.0% 13.0% 12.7% 8.1%
Cash Flow from Operations 442 462 -4.3% 257 72.0% 1 139 1 252 -9.0%
Net debt/last 12 months’
operational EBITDA 2.6 2.9 2.8 2.6 2.9
12 Stora Enso Q4 and Full Year 2014 Results 4 February 2015
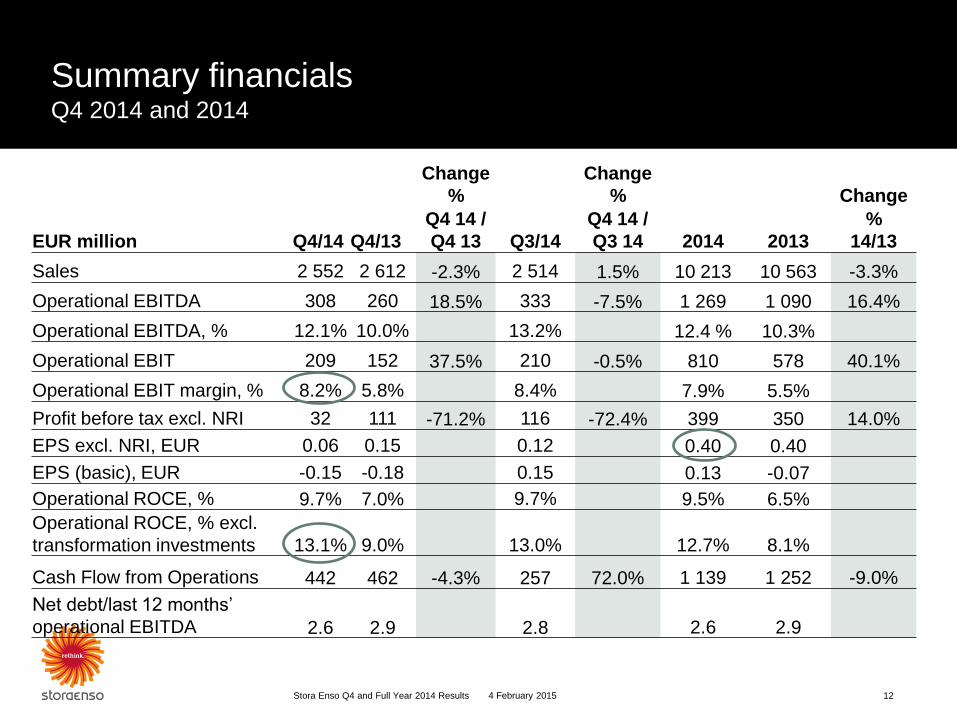
Reconciliation of operational profitability
4 February 2015 Stora Enso Q4 and Full Year 2014 Results 13
EUR million
2014
Q4
2014
Q3
2014
Q2
2014
Q1
2013
Q4
2013
Q3
2013
Q2
2013
Q1
Operational EBITDA 308 333 326 302 260 319 257 254
Equity accounted
investments (EAI),
operational 35 17 17 19 28 22 21 20
Depreciation and
impairment excl NRI -134 -140 -134 -139 -136 -157 -154 -156
Operational EBIT 209 210 209 182 152 184 124 118
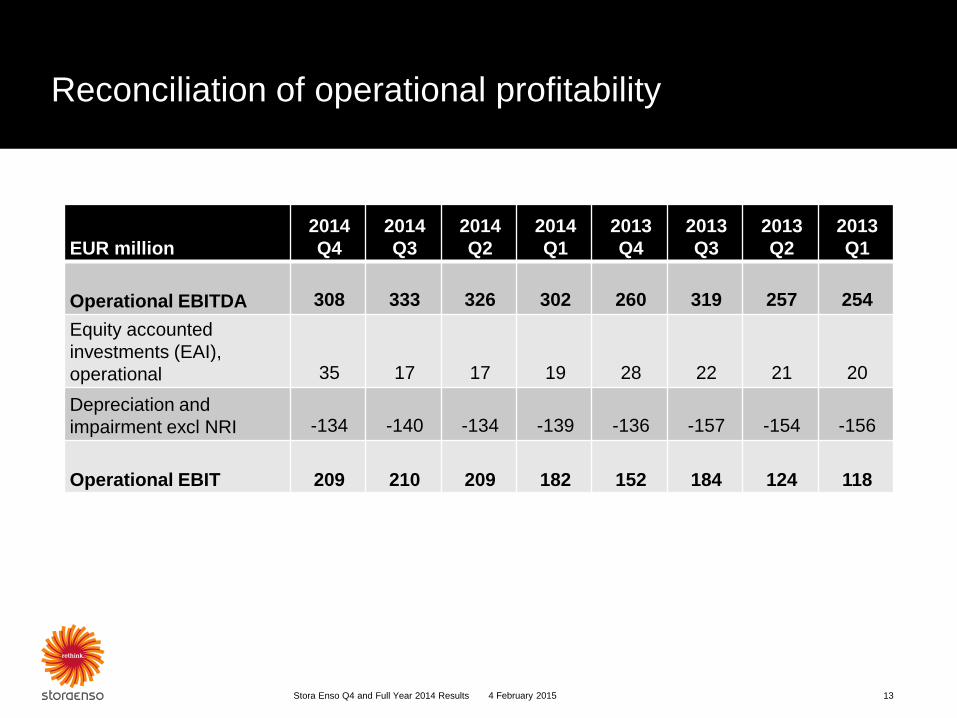
Cash flow from operations
4 February 2015 Stora Enso Q4 and Full Year 2014 Results 14
0%
2%
4%
6%
8%
10%
12%
14%
16%
18%
20%
0
50
100
150
200
250
300
350
400
450
500
13Q1 13Q2 13Q3 13Q4 14Q1 14Q2 14Q3 14Q4
Cash flow from operations, MEUR Cash flow to sales
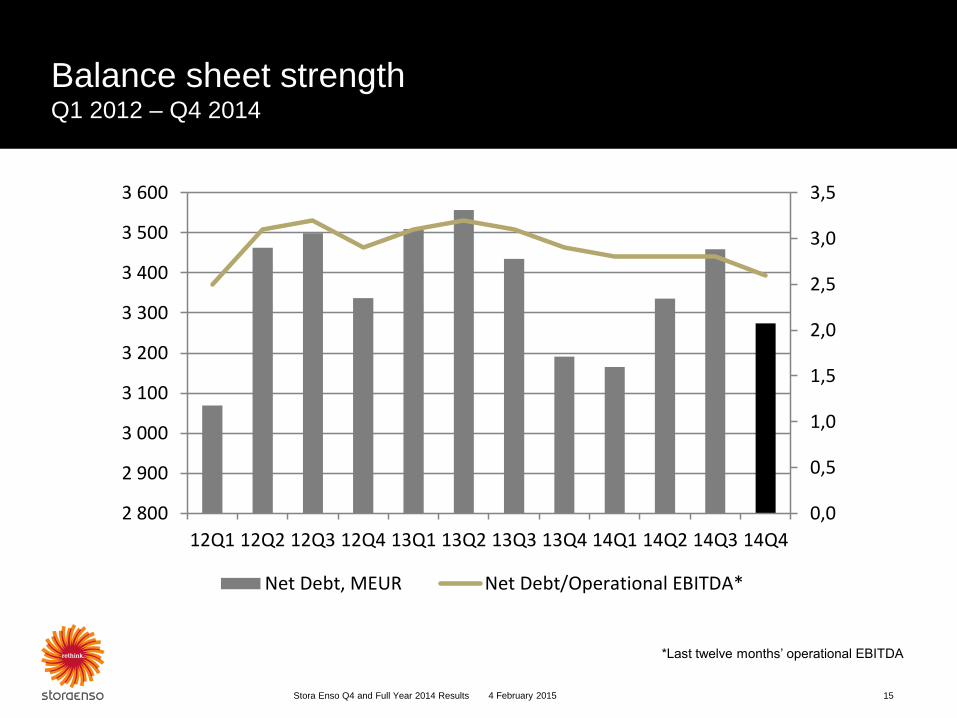
Balance sheet strength Q1 2012 – Q4 2014
Stora Enso Q4 and Full Year 2014 Results 15
*Last twelve months’ operational EBITDA
4 February 2015
0,0
0,5
1,0
1,5
2,0
2,5
3,0
3,5
2 800
2 900
3 000
3 100
3 200
3 300
3 400
3 500
3 600
12Q1 12Q2 12Q3 12Q4 13Q1 13Q2 13Q3 13Q4 14Q1 14Q2 14Q3 14Q4
Net Debt, MEUR Net Debt/Operational EBITDA*
0
500
1000
1500
2000
2500
3000
3500
4000
13Q4 14Q4 2013 2014
Sales, MEUR
0
50
100
150
200
250
300
350
400
450
13Q4 14Q4 2013 2014
Operational EBIT, MEUR
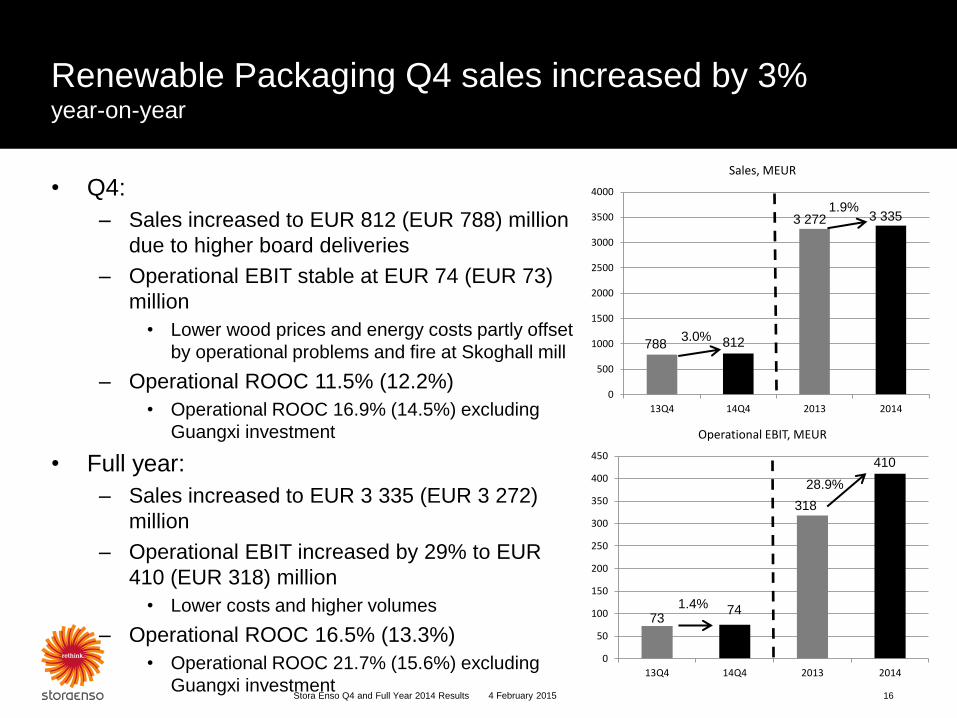
Renewable Packaging Q4 sales increased by 3% year-on-year
16 Stora Enso Q4 and Full Year 2014 Results
• Q4:
– Sales increased to EUR 812 (EUR 788) million
due to higher board deliveries
– Operational EBIT stable at EUR 74 (EUR 73)
million
• Lower wood prices and energy costs partly offset
by operational problems and fire at Skoghall mill
– Operational ROOC 11.5% (12.2%)
• Operational ROOC 16.9% (14.5%) excluding
Guangxi investment
• Full year:
– Sales increased to EUR 3 335 (EUR 3 272)
million
– Operational EBIT increased by 29% to EUR
410 (EUR 318) million
• Lower costs and higher volumes
– Operational ROOC 16.5% (13.3%)
• Operational ROOC 21.7% (15.6%) excluding
Guangxi investment
4 February 2015
3.0%
1.9%
28.9%
1.4%
788 812
3 272 3 335
410
318
74 73
0
10
20
30
40
50
60
70
80
90
100
13Q4 14Q4 2013 2014
Operational EBIT, MEUR
0
200
400
600
800
1000
1200
13Q4 14Q4 2013 2014
Sales, MEUR
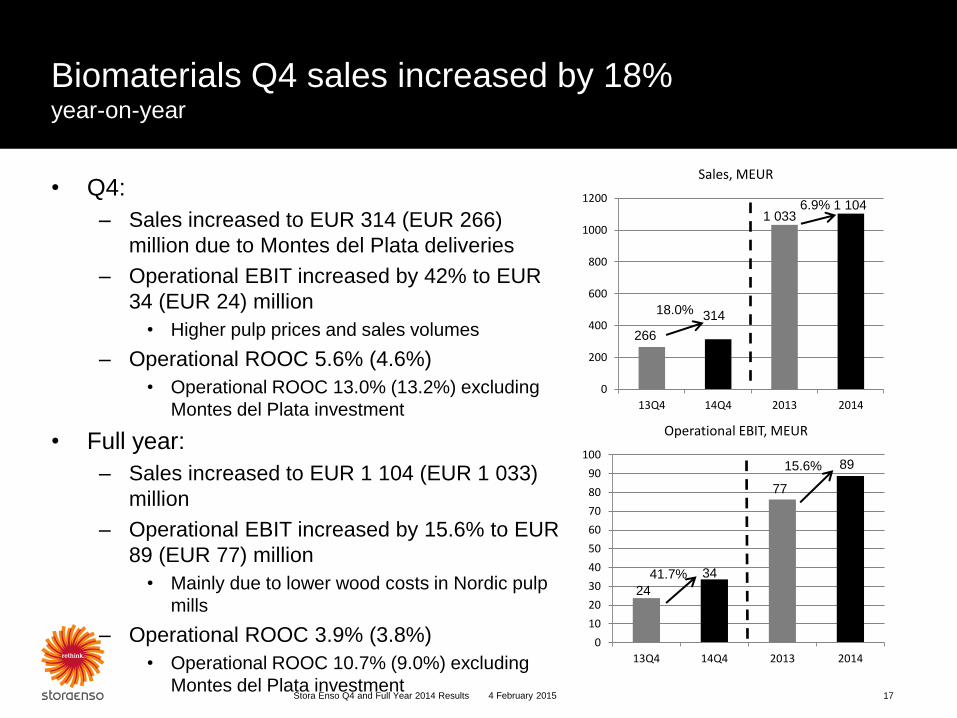
Biomaterials Q4 sales increased by 18% year-on-year
• Q4:
– Sales increased to EUR 314 (EUR 266)
million due to Montes del Plata deliveries
– Operational EBIT increased by 42% to EUR
34 (EUR 24) million
• Higher pulp prices and sales volumes
– Operational ROOC 5.6% (4.6%)
• Operational ROOC 13.0% (13.2%) excluding
Montes del Plata investment
• Full year:
– Sales increased to EUR 1 104 (EUR 1 033)
million
– Operational EBIT increased by 15.6% to EUR
89 (EUR 77) million
• Mainly due to lower wood costs in Nordic pulp
mills
– Operational ROOC 3.9% (3.8%)
• Operational ROOC 10.7% (9.0%) excluding
Montes del Plata investment 4 February 2015 Stora Enso Q4 and Full Year 2014 Results 17
18.0%
6.9%
41.7%
15.6%
266
314
1 033 1 104
89
77
34
24
0
10
20
30
40
50
60
70
80
90
100
13Q4 14Q4 2013 2014
Mill
ion
s
Operational EBIT, MEUR
0
200
400
600
800
1000
1200
1400
1600
1800
2000
13Q4 14Q4 2013 2014
Mill
ion
s
Sales, MEUR
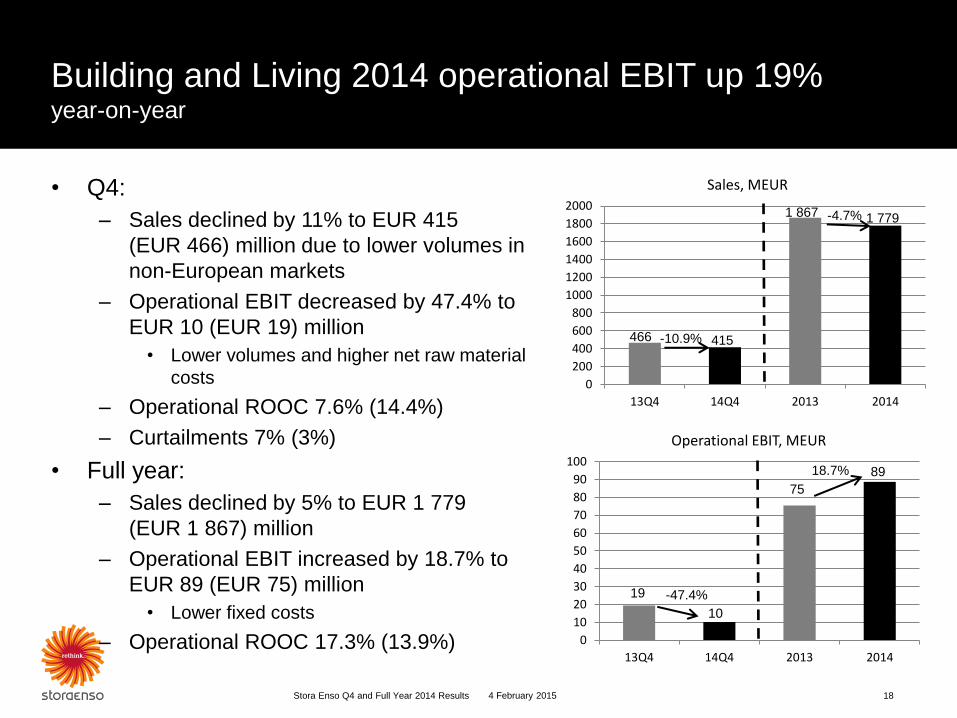
Building and Living 2014 operational EBIT up 19% year-on-year
• Q4:
– Sales declined by 11% to EUR 415
(EUR 466) million due to lower volumes in
non-European markets
– Operational EBIT decreased by 47.4% to
EUR 10 (EUR 19) million
• Lower volumes and higher net raw material
costs
– Operational ROOC 7.6% (14.4%)
– Curtailments 7% (3%)
• Full year:
– Sales declined by 5% to EUR 1 779
(EUR 1 867) million
– Operational EBIT increased by 18.7% to
EUR 89 (EUR 75) million
• Lower fixed costs
– Operational ROOC 17.3% (13.9%)
4 February 2015 Stora Enso Q4 and Full Year 2014 Results 18
-10.9%
-4.7%
-47.4%
18.7%
466
1 867 1 779
19
10
75
415
89
0
50
100
150
200
250
300
350
400
13Q4 14Q4 2013 2014
Operational EBITDA, MEUR
0
500
1000
1500
2000
2500
3000
3500
4000
4500
5000
13Q4 14Q4 2013 2014
Sales, MEUR
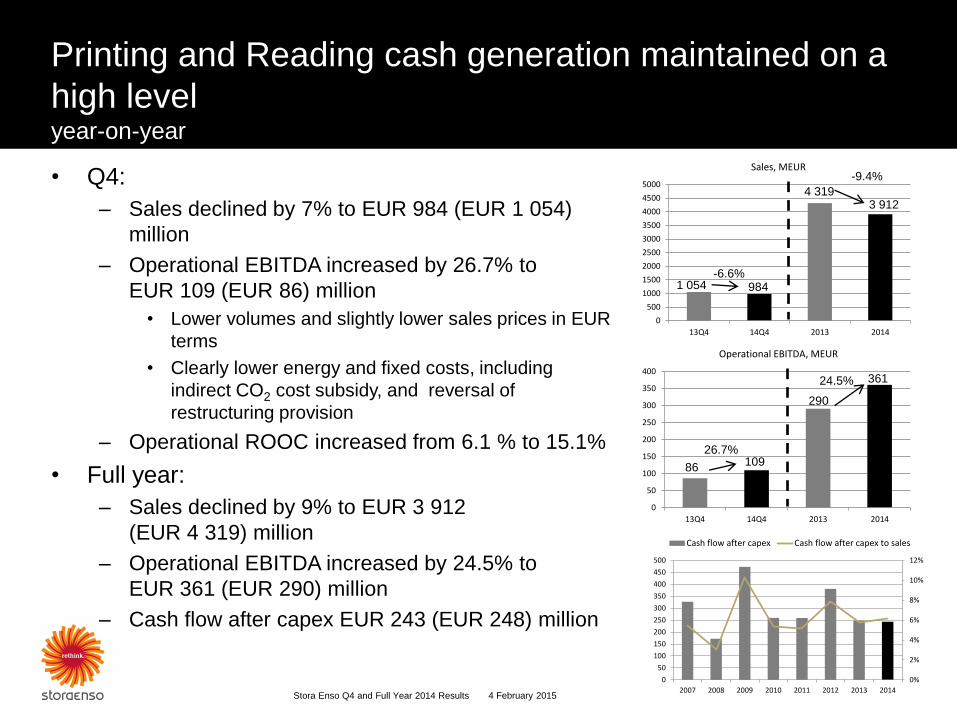
Printing and Reading cash generation maintained on a
high level year-on-year
• Q4:
– Sales declined by 7% to EUR 984 (EUR 1 054)
million
– Operational EBITDA increased by 26.7% to
EUR 109 (EUR 86) million
• Lower volumes and slightly lower sales prices in EUR
terms
• Clearly lower energy and fixed costs, including
indirect CO2 cost subsidy, and reversal of
restructuring provision
– Operational ROOC increased from 6.1 % to 15.1%
• Full year:
– Sales declined by 9% to EUR 3 912
(EUR 4 319) million
– Operational EBITDA increased by 24.5% to
EUR 361 (EUR 290) million
– Cash flow after capex EUR 243 (EUR 248) million
Stora Enso Q4 and Full Year 2014 Results 19 4 February 2015
-6.6%
-9.4%
26.7%
24.5%
4 319 3 912
984 1 054
86 109
290
361
0%
2%
4%
6%
8%
10%
12%
0
50
100
150
200
250
300
350
400
450
500
2007 2008 2009 2010 2011 2012 2013 2014
Cash flow after capex Cash flow after capex to sales
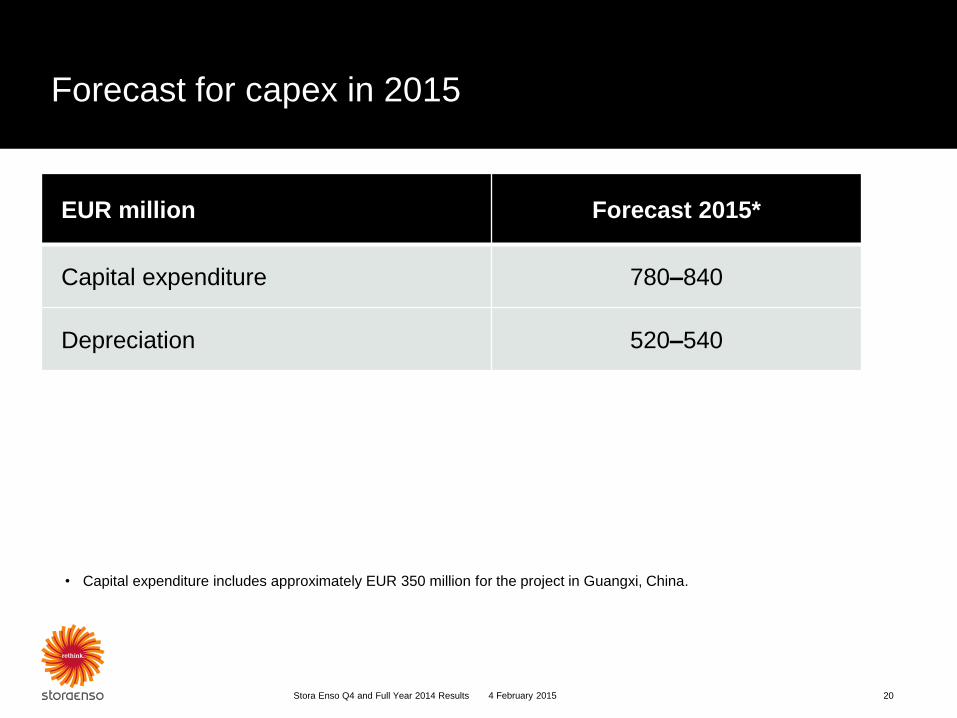
Forecast for capex in 2015
EUR million Forecast 2015*
Capital expenditure 780–840
Depreciation 520–540
• Capital expenditure includes approximately EUR 350 million for the project in Guangxi, China.
20 Stora Enso Q4 and Full Year 2014 Results 4 February 2015

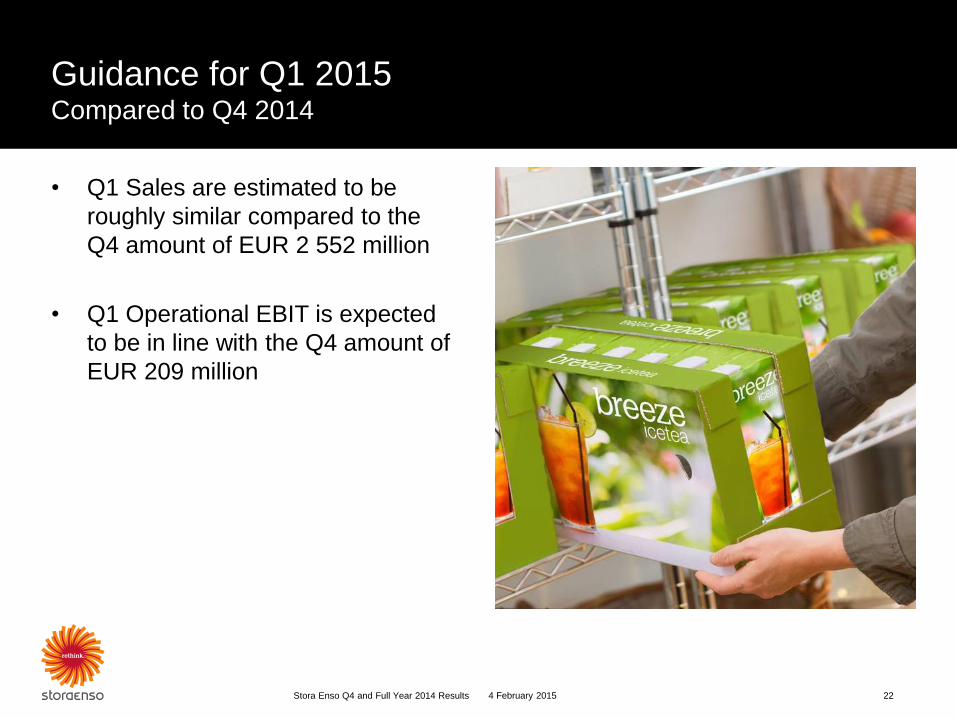
Guidance for Q1 2015 Compared to Q4 2014
• Q1 Sales are estimated to be
roughly similar compared to the
Q4 amount of EUR 2 552 million
• Q1 Operational EBIT is expected
to be in line with the Q4 amount of
EUR 209 million
4 February 2015 Stora Enso Q4 and Full Year 2014 Results 22
-1,2
-1
-0,8
-0,6
-0,4
-0,2
0
0,2
0,4
0,6
0,8
1
2007 2008* 2009* 2010 2011 2012 2013 2014**
Earnings and distribution per share
Earnings per share (basic) Dividend per share
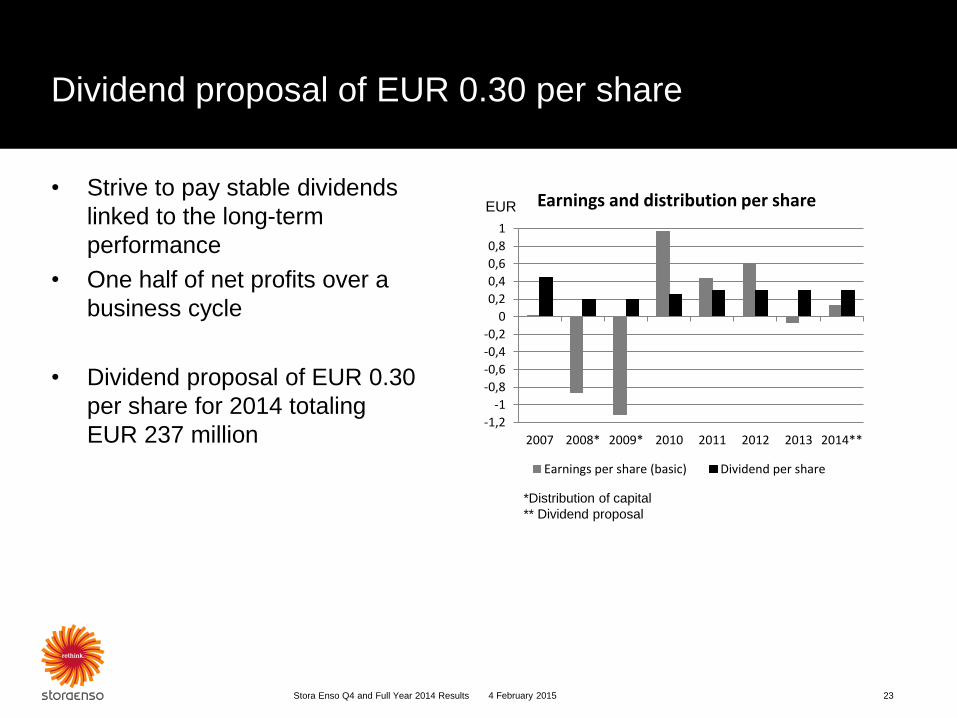
Dividend proposal of EUR 0.30 per share
• Strive to pay stable dividends
linked to the long-term
performance
• One half of net profits over a
business cycle
• Dividend proposal of EUR 0.30
per share for 2014 totaling
EUR 237 million
Stora Enso Q4 and Full Year 2014 Results 23
EUR
4 February 2015
*Distribution of capital
** Dividend proposal
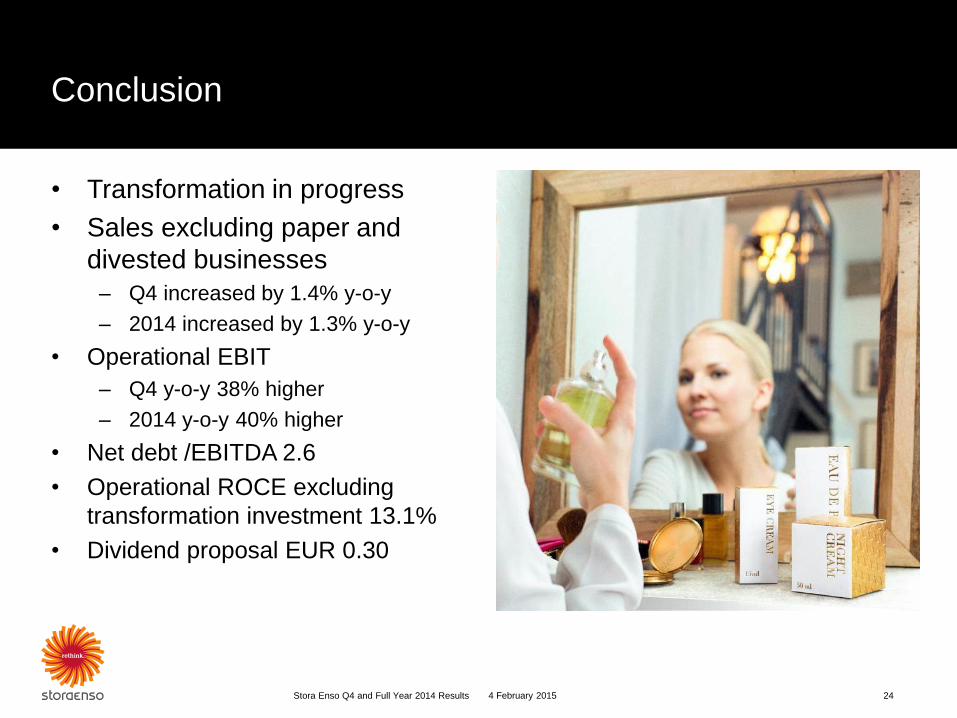
Conclusion
• Transformation in progress
• Sales excluding paper and
divested businesses
– Q4 increased by 1.4% y-o-y
– 2014 increased by 1.3% y-o-y
• Operational EBIT
– Q4 y-o-y 38% higher
– 2014 y-o-y 40% higher
• Net debt /EBITDA 2.6
• Operational ROCE excluding
transformation investment 13.1%
• Dividend proposal EUR 0.30
4 February 2015 Stora Enso Q4 and Full Year 2014 Results 24
Capital Markets Day (CMD)
Welcome to CMD
on 28th of May 2015
in London
4 February 2015 Stora Enso Q4 and Full Year 2014 Results 25
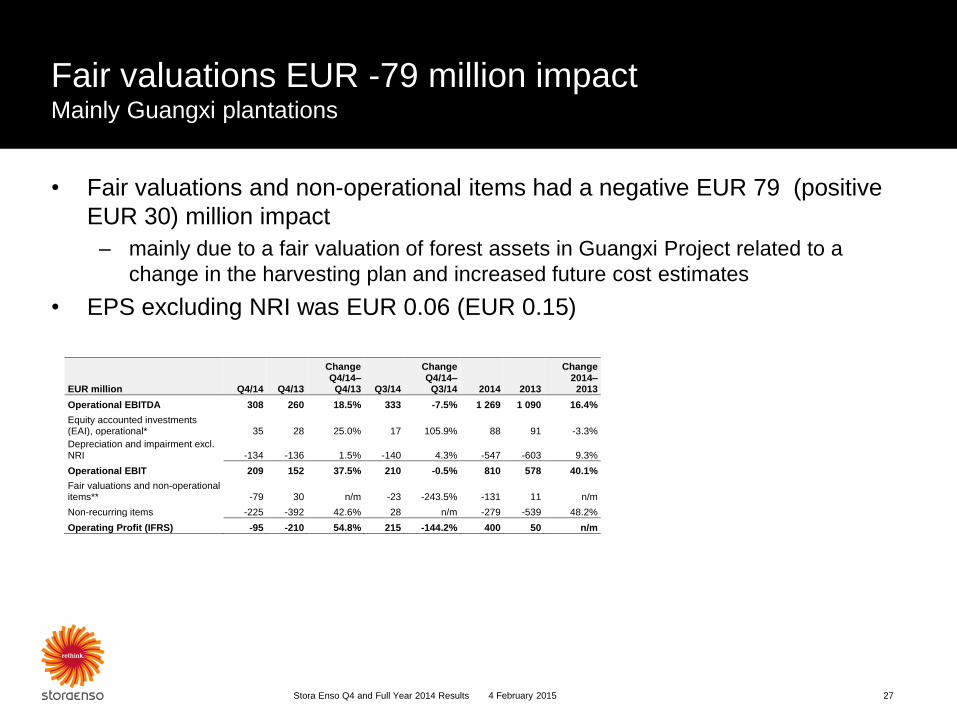
Fair valuations EUR -79 million impact Mainly Guangxi plantations
• Fair valuations and non-operational items had a negative EUR 79 (positive
EUR 30) million impact
– mainly due to a fair valuation of forest assets in Guangxi Project related to a
change in the harvesting plan and increased future cost estimates
• EPS excluding NRI was EUR 0.06 (EUR 0.15)
4 February 2015 Stora Enso Q4 and Full Year 2014 Results 27
EUR million Q4/14 Q4/13
Change Q4/14–
Q4/13 Q3/14
Change Q4/14–
Q3/14 2014 2013
Change 2014–
2013
Operational EBITDA 308 260 18.5% 333 -7.5% 1 269 1 090 16.4%
Equity accounted investments (EAI), operational* 35 28 25.0% 17 105.9% 88 91 -3.3%
Depreciation and impairment excl. NRI -134 -136 1.5% -140 4.3% -547 -603 9.3%
Operational EBIT 209 152 37.5% 210 -0.5% 810 578 40.1%
Fair valuations and non-operational items** -79 30 n/m -23 -243.5% -131 11 n/m
Non-recurring items -225 -392 42.6% 28 n/m -279 -539 48.2%
Operating Profit (IFRS) -95 -210 54.8% 215 -144.2% 400 50 n/m
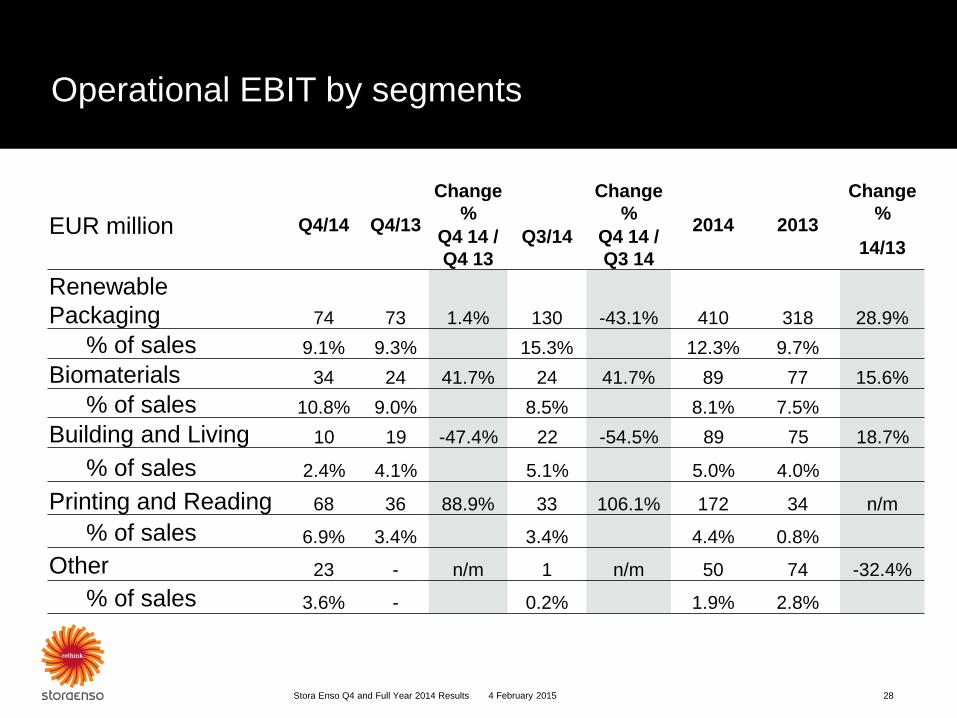
Operational EBIT by segments
EUR million Q4/14 Q4/13
Change
%
Change
% 2014 2013
Change
%
Q4 14 /
Q4 13
Q3/14
Q4 14 /
Q3 14 14/13
Renewable
Packaging 74 73 1.4% 130 -43.1% 410 318 28.9%
% of sales 9.1% 9.3% 15.3% 12.3% 9.7%
Biomaterials 34 24 41.7% 24 41.7% 89 77 15.6%
% of sales 10.8% 9.0% 8.5% 8.1% 7.5%
Building and Living 10 19 -47.4% 22 -54.5% 89 75 18.7%
% of sales 2.4% 4.1% 5.1% 5.0% 4.0%
Printing and Reading 68 36 88.9% 33 106.1% 172 34 n/m
% of sales 6.9% 3.4% 3.4% 4.4% 0.8%
Other 23 - n/m 1 n/m 50 74 -32.4%
% of sales 3.6% - 0.2% 1.9% 2.8%
28 Stora Enso Q4 and Full Year 2014 Results 4 February 2015
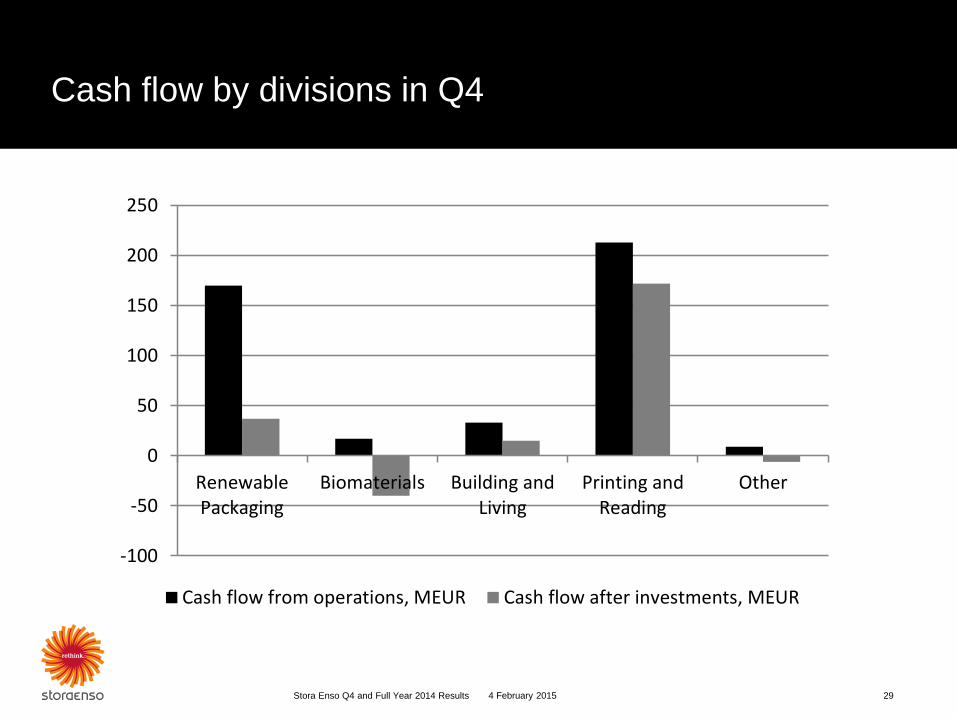
Cash flow by divisions in Q4
4 February 2015 Stora Enso Q4 and Full Year 2014 Results 29
-100
-50
0
50
100
150
200
250
RenewablePackaging
Biomaterials Building andLiving
Printing andReading
Other
Cash flow from operations, MEUR Cash flow after investments, MEUR
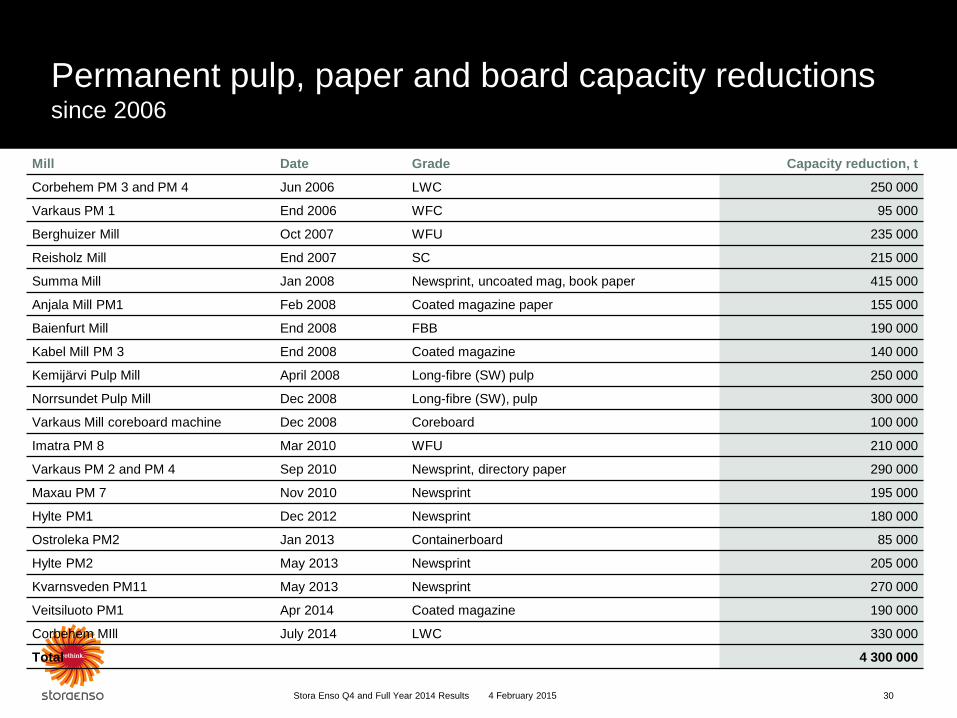
Permanent pulp, paper and board capacity reductions since 2006
Stora Enso Q4 and Full Year 2014 Results 30
Mill Date Grade Capacity reduction, t
Corbehem PM 3 and PM 4 Jun 2006 LWC 250 000
Varkaus PM 1 End 2006 WFC 95 000
Berghuizer Mill Oct 2007 WFU 235 000
Reisholz Mill End 2007 SC 215 000
Summa Mill Jan 2008 Newsprint, uncoated mag, book paper 415 000
Anjala Mill PM1 Feb 2008 Coated magazine paper 155 000
Baienfurt Mill End 2008 FBB 190 000
Kabel Mill PM 3 End 2008 Coated magazine 140 000
Kemijärvi Pulp Mill April 2008 Long-fibre (SW) pulp 250 000
Norrsundet Pulp Mill Dec 2008 Long-fibre (SW), pulp 300 000
Varkaus Mill coreboard machine Dec 2008 Coreboard 100 000
Imatra PM 8 Mar 2010 WFU 210 000
Varkaus PM 2 and PM 4 Sep 2010 Newsprint, directory paper 290 000
Maxau PM 7 Nov 2010 Newsprint 195 000
Hylte PM1 Dec 2012 Newsprint 180 000
Ostroleka PM2 Jan 2013 Containerboard 85 000
Hylte PM2 May 2013 Newsprint 205 000
Kvarnsveden PM11 May 2013 Newsprint 270 000
Veitsiluoto PM1 Apr 2014 Coated magazine 190 000
Corbehem MIll July 2014 LWC 330 000
Total 4 300 000
4 February 2015
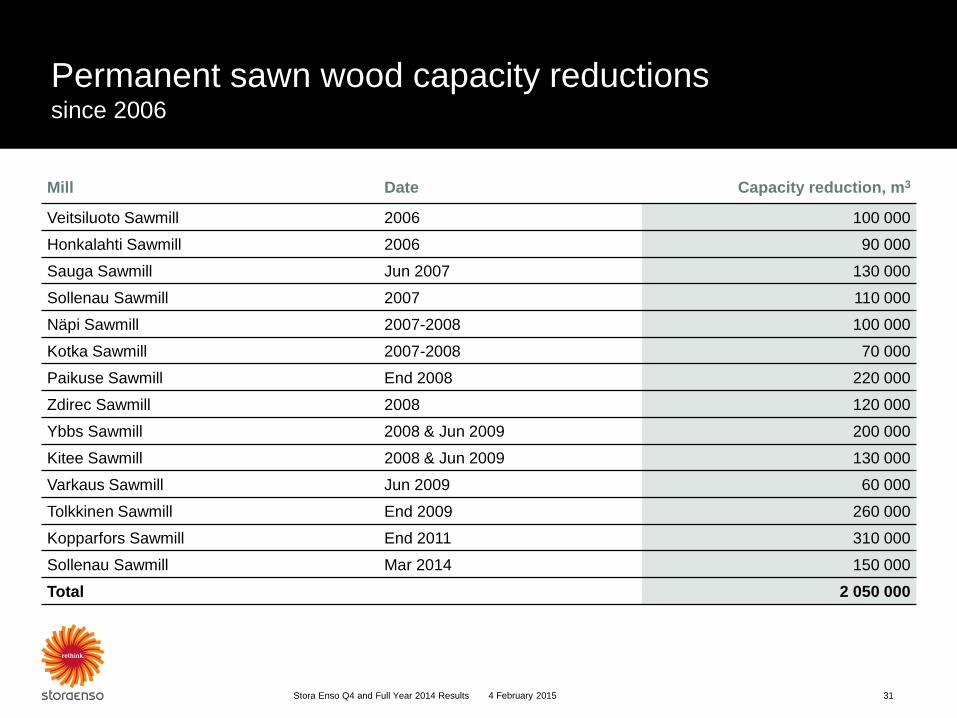
Permanent sawn wood capacity reductions since 2006
Stora Enso Q4 and Full Year 2014 Results 31
Mill Date Capacity reduction, m3
Veitsiluoto Sawmill 2006 100 000
Honkalahti Sawmill 2006 90 000
Sauga Sawmill Jun 2007 130 000
Sollenau Sawmill 2007 110 000
Näpi Sawmill 2007-2008 100 000
Kotka Sawmill 2007-2008 70 000
Paikuse Sawmill End 2008 220 000
Zdirec Sawmill 2008 120 000
Ybbs Sawmill 2008 & Jun 2009 200 000
Kitee Sawmill 2008 & Jun 2009 130 000
Varkaus Sawmill Jun 2009 60 000
Tolkkinen Sawmill End 2009 260 000
Kopparfors Sawmill End 2011 310 000
Sollenau Sawmill Mar 2014 150 000
Total 2 050 000
4 February 2015
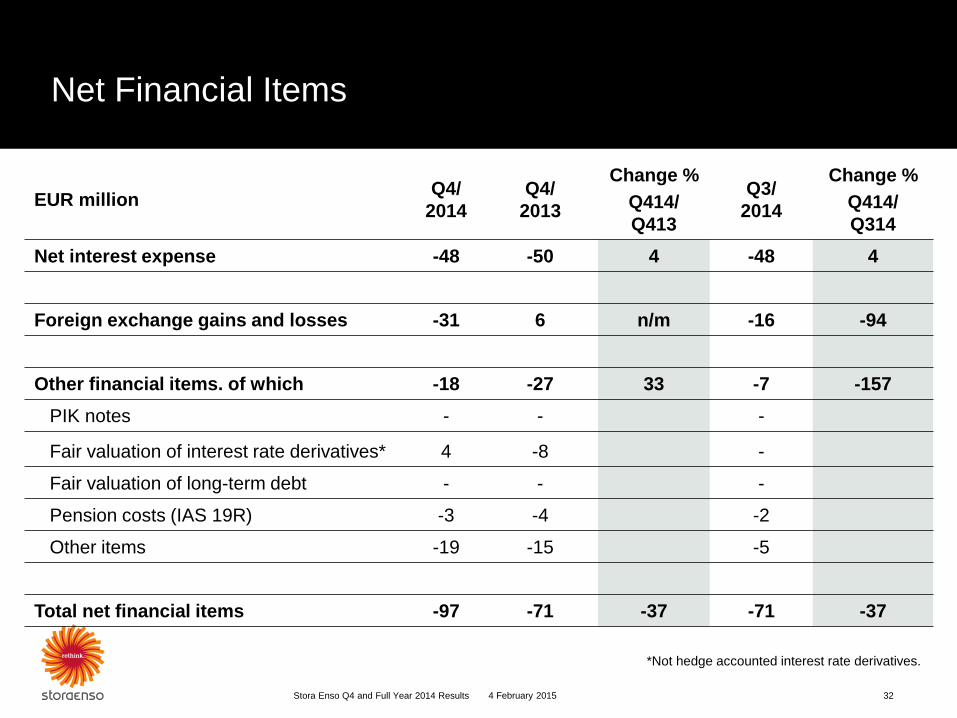
Net Financial Items
4 February 2015 Stora Enso Q4 and Full Year 2014 Results 32
EUR million Q4/
2014
Q4/
2013
Change %
Q414/
Q413
Q3/
2014
Change %
Q414/
Q314
Net interest expense -48 -50 4 -48 4
Foreign exchange gains and losses -31 6 n/m -16 -94
Other financial items. of which -18 -27 33 -7 -157
PIK notes - - -
Fair valuation of interest rate derivatives* 4 -8 -
Fair valuation of long-term debt - - -
Pension costs (IAS 19R) -3 -4 -2
Other items -19 -15 -5
Total net financial items -97 -71 -37 -71 -37
*Not hedge accounted interest rate derivatives.
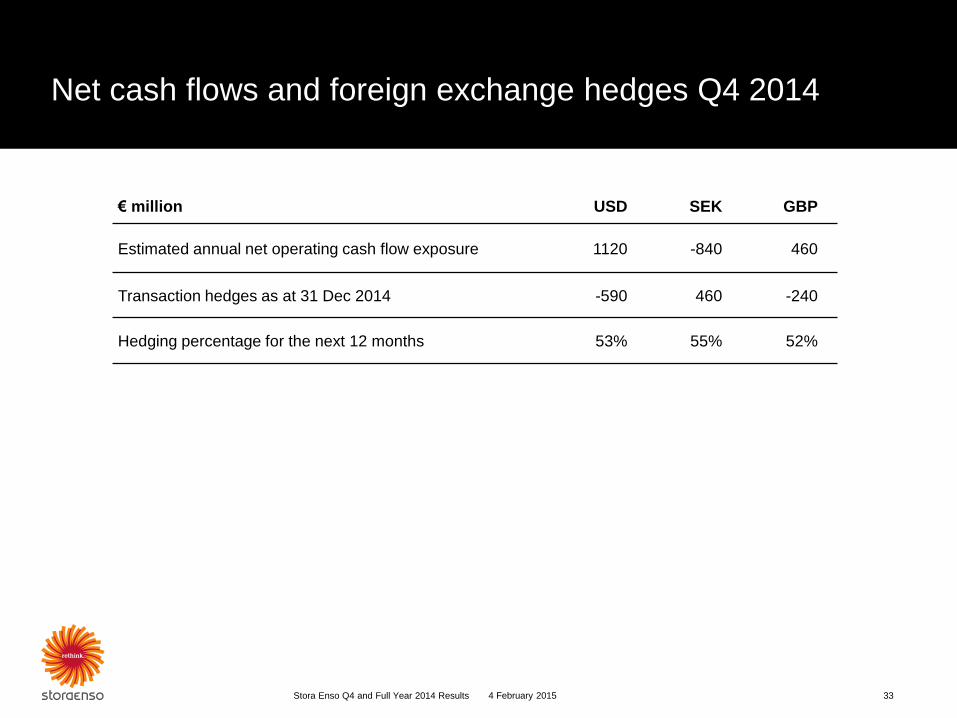
Net cash flows and foreign exchange hedges Q4 2014
Stora Enso Q4 and Full Year 2014 Results 33 4 February 2015
€ million USD SEK GBP
Estimated annual net operating cash flow exposure 1120 -840 460
Transaction hedges as at 31 Dec 2014 -590 460 -240
Hedging percentage for the next 12 months 53% 55% 52%
0
2
4
6
8
10
12
14
16
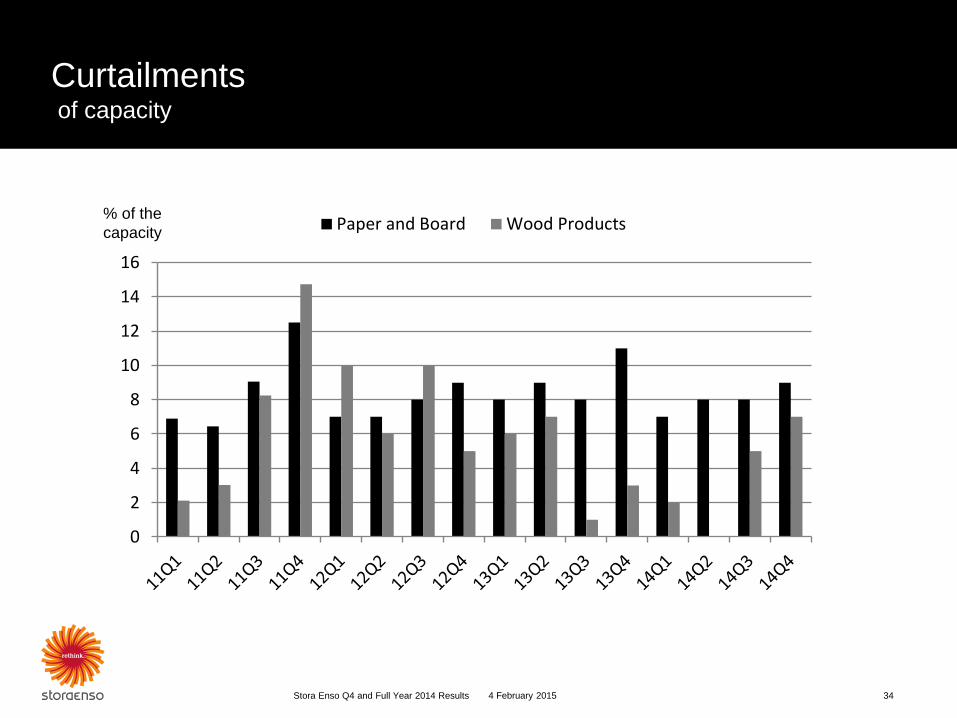
Paper and Board Wood Products
Curtailments of capacity
34 Stora Enso Q4 and Full Year 2014 Results
% of the
capacity
4 February 2015
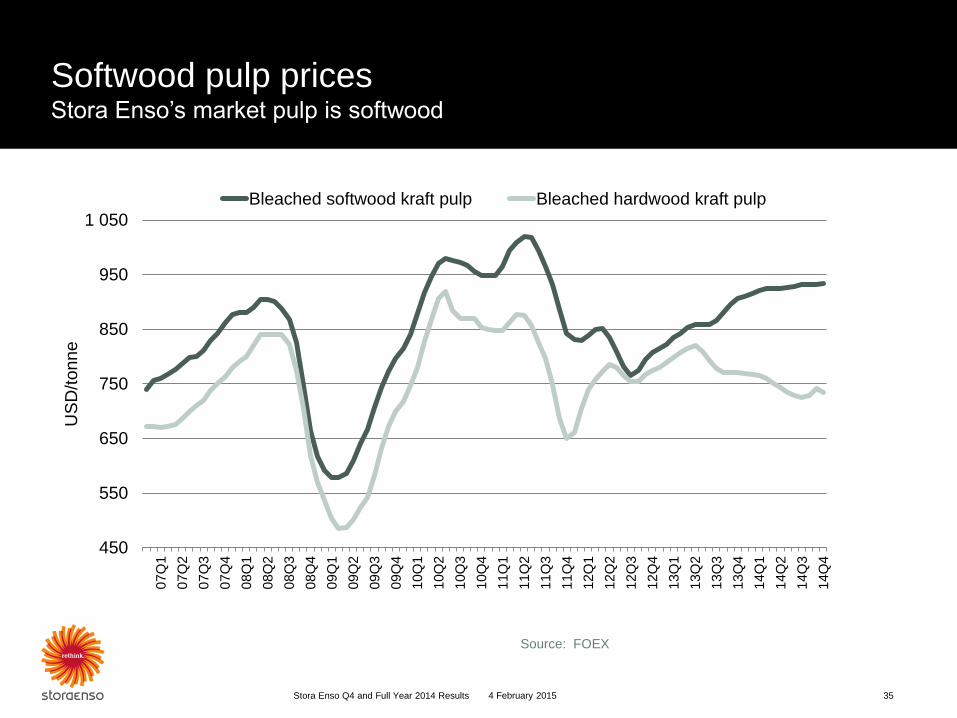
Softwood pulp prices Stora Enso’s market pulp is softwood
Stora Enso Q4 and Full Year 2014 Results 35
Source: FOEX
4 February 2015
450
550
650
750
850
950
1 050
07Q
1
07Q
2
07Q
3
07Q
4
08Q
1
08Q
2
08Q
3
08Q
4
09Q
1
09Q
2
09Q
3
09Q
4
10Q
1
10Q
2
10Q
3
10Q
4
11Q
1
11Q
2
11Q
3
11Q
4
12Q
1
12Q
2
12Q
3
12Q
4
13Q
1
13Q
2
13Q
3
13Q
4
14Q
1
14Q
2
14Q
3
14Q
4
US
D/t
onne
Bleached softwood kraft pulp Bleached hardwood kraft pulp
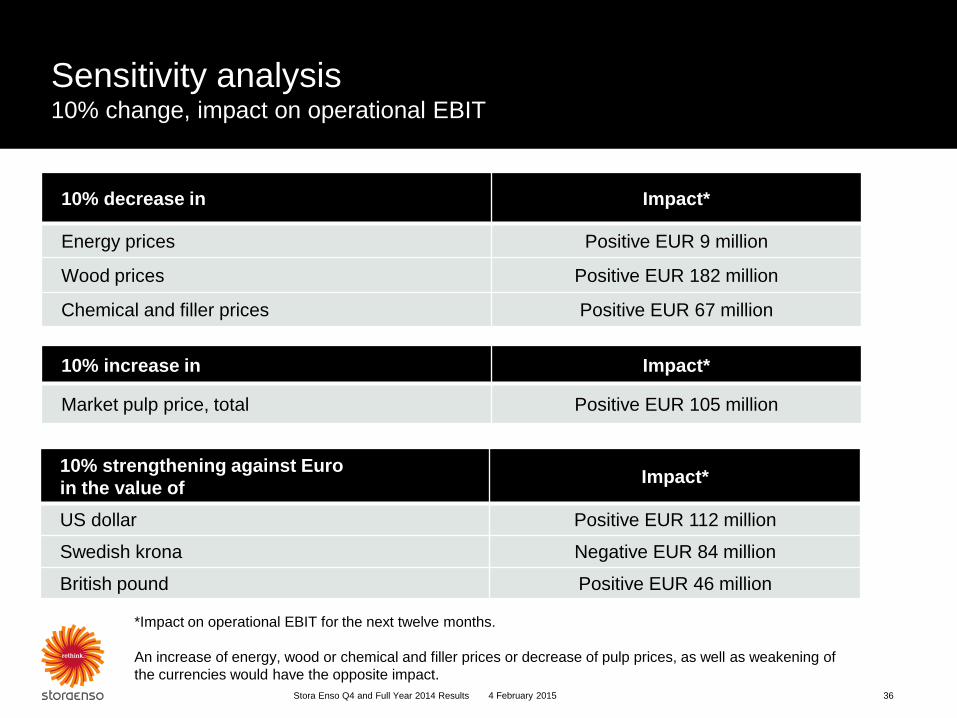
Sensitivity analysis 10% change, impact on operational EBIT
4 February 2015 Stora Enso Q4 and Full Year 2014 Results 36
10% increase in Impact*
Market pulp price, total Positive EUR 105 million
*Impact on operational EBIT for the next twelve months.
An increase of energy, wood or chemical and filler prices or decrease of pulp prices, as well as weakening of
the currencies would have the opposite impact.
10% decrease in Impact*
Energy prices Positive EUR 9 million
Wood prices Positive EUR 182 million
Chemical and filler prices Positive EUR 67 million
10% strengthening against Euro
in the value of Impact*
US dollar Positive EUR 112 million
Swedish krona Negative EUR 84 million
British pound Positive EUR 46 million
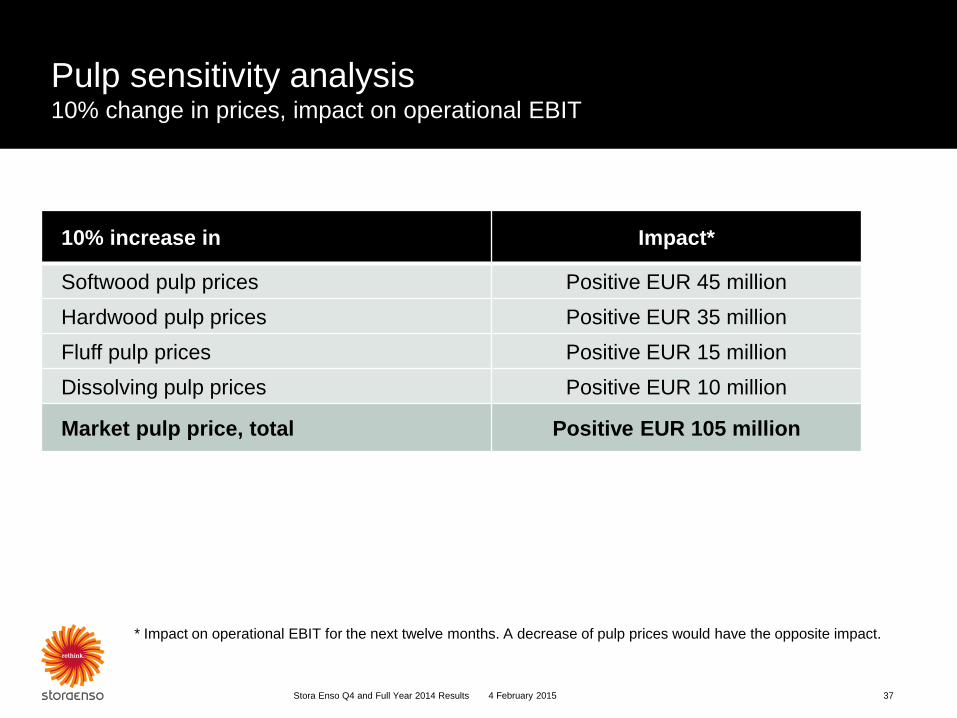
Pulp sensitivity analysis 10% change in prices, impact on operational EBIT
4 February 2015 Stora Enso Q4 and Full Year 2014 Results 37
10% increase in Impact*
Softwood pulp prices Positive EUR 45 million
Hardwood pulp prices Positive EUR 35 million
Fluff pulp prices Positive EUR 15 million
Dissolving pulp prices Positive EUR 10 million
Market pulp price, total Positive EUR 105 million
* Impact on operational EBIT for the next twelve months. A decrease of pulp prices would have the opposite impact.
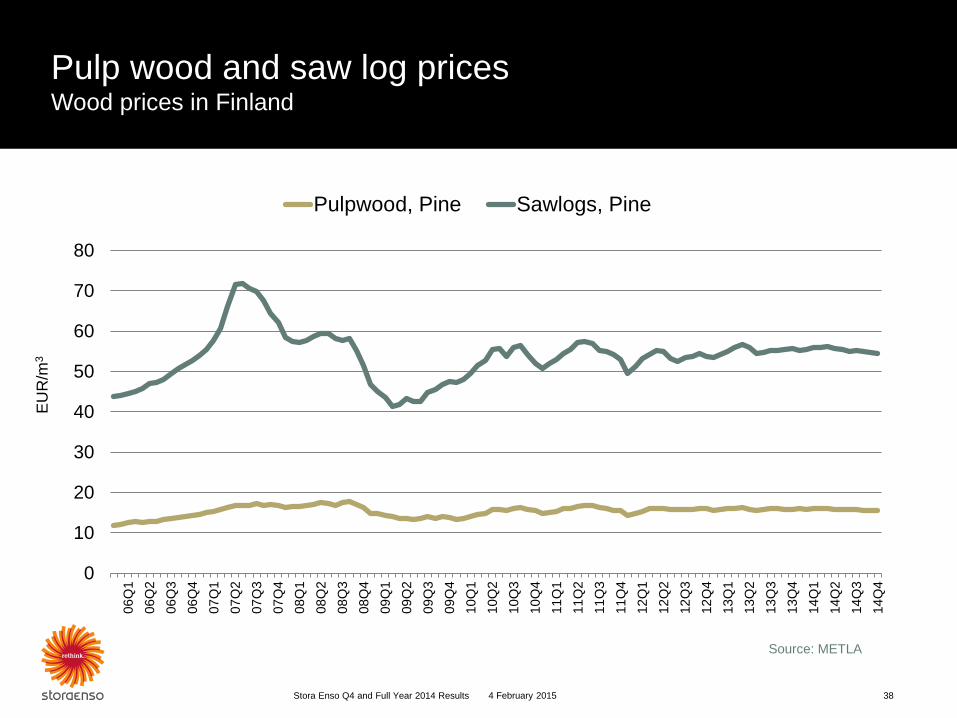
Pulp wood and saw log prices Wood prices in Finland
Source: METLA
38 Stora Enso Q4 and Full Year 2014 Results 4 February 2015
0
10
20
30
40
50
60
70
80
06
Q1
06
Q2
06
Q3
06
Q4
07
Q1
07
Q2
07
Q3
07
Q4
08
Q1
08
Q2
08
Q3
08
Q4
09
Q1
09
Q2
09
Q3
09
Q4
10
Q1
10
Q2
10
Q3
10
Q4
11
Q1
11
Q2
11
Q3
11
Q4
12
Q1
12
Q2
12
Q3
12
Q4
13
Q1
13
Q2
13
Q3
13
Q4
14
Q1
14
Q2
14
Q3
14
Q4
EU
R/m
3
Pulpwood, Pine Sawlogs, Pine
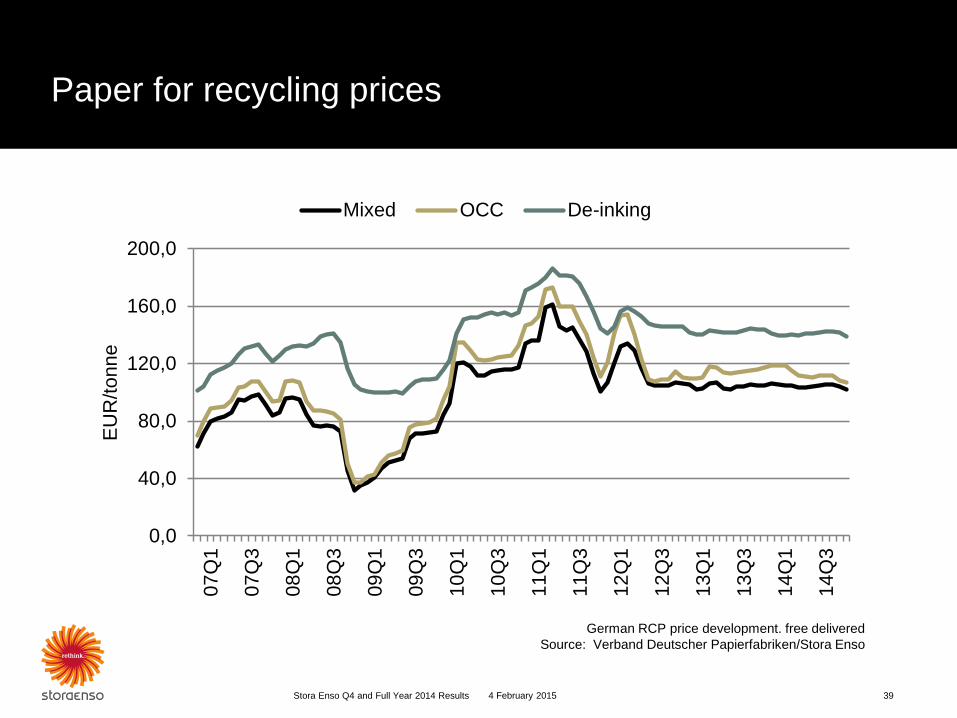
Paper for recycling prices
Stora Enso Q4 and Full Year 2014 Results 39
German RCP price development. free delivered
Source: Verband Deutscher Papierfabriken/Stora Enso
4 February 2015
0,0
40,0
80,0
120,0
160,0
200,0
07
Q1
07
Q3
08
Q1
08
Q3
09
Q1
09
Q3
10
Q1
10
Q3
11
Q1
11
Q3
12
Q1
12
Q3
13
Q1
13
Q3
14
Q1
14
Q3
EU
R/tonne
Mixed OCC De-inking
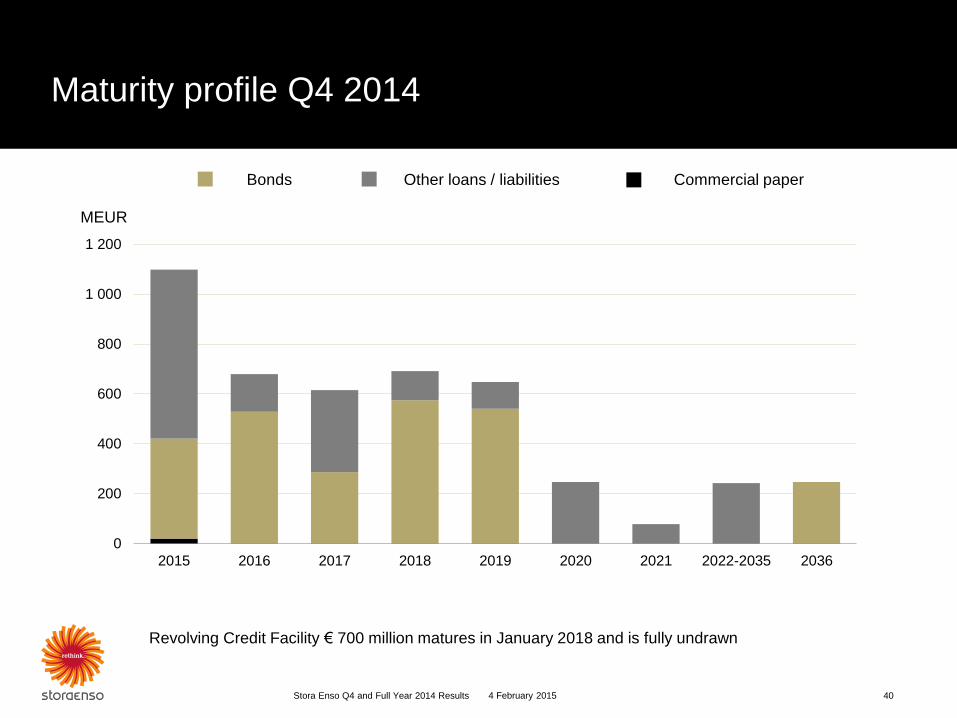
MEUR
Other loans / liabilities Bonds Commercial paper
Revolving Credit Facility € 700 million matures in January 2018 and is fully undrawn
Maturity profile Q4 2014
4 February 2015 Stora Enso Q4 and Full Year 2014 Results 40
0
200
400
600
800
1 000
1 200
2015 2016 2017 2018 2019 2020 2021 2022-2035 2036
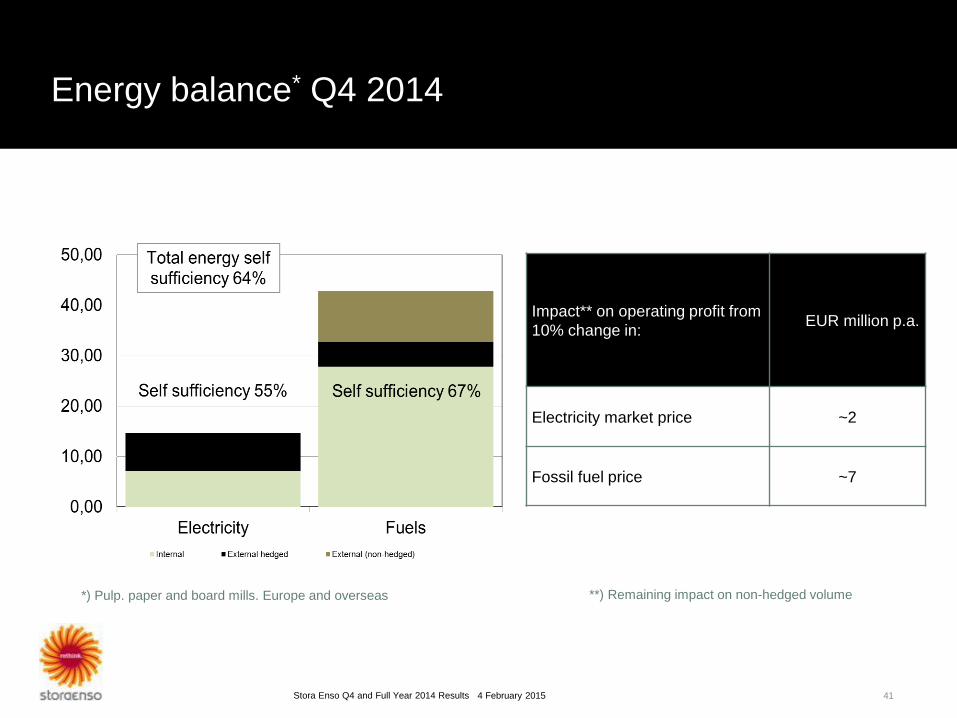
Energy balance* Q4 2014
Impact** on operating profit from
10% change in: EUR million p.a.
Electricity market price ~2
Fossil fuel price ~7
**) Remaining impact on non-hedged volume
4 February 2015 Stora Enso Q4 and Full Year 2014 Results
*) Pulp. paper and board mills. Europe and overseas
41
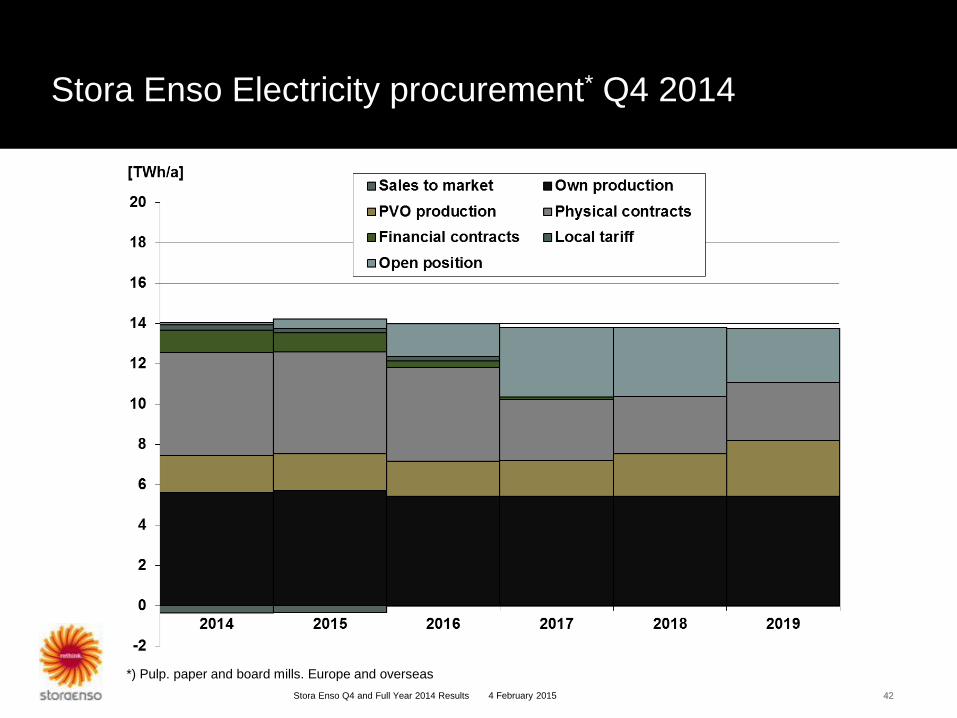
Stora Enso Electricity procurement* Q4 2014
4 February 2015 Stora Enso Q4 and Full Year 2014 Results
*) Pulp. paper and board mills. Europe and overseas
42 42
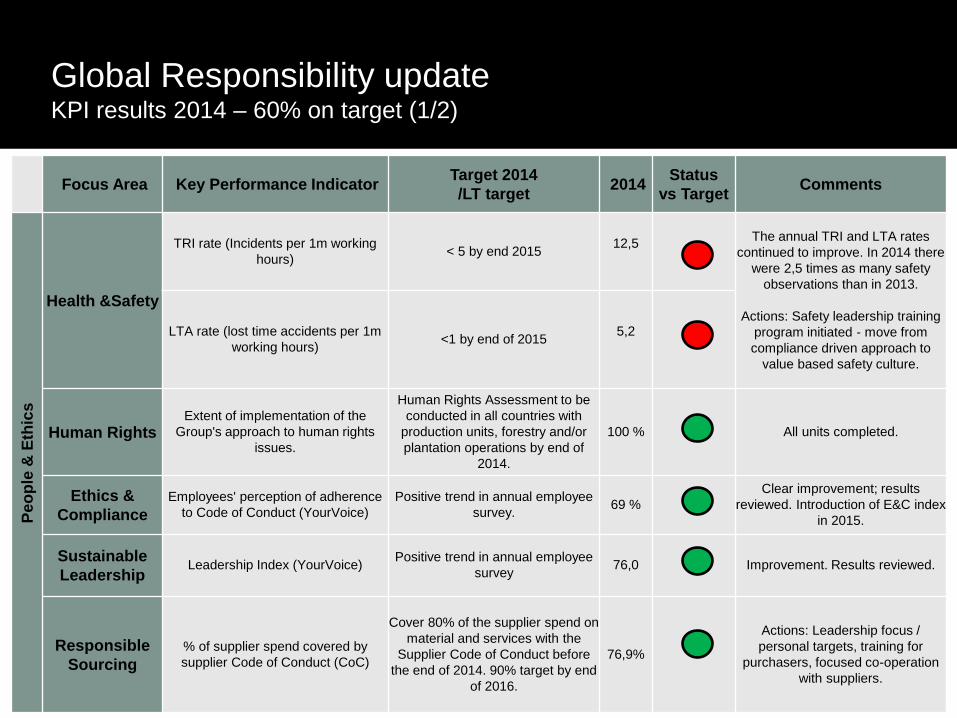
Global Responsibility update KPI results 2014 – 60% on target (1/2)
4 February 2015 Stora Enso Q4 and Full Year 2014 Results 43
Focus Area Key Performance Indicator Target 2014
/LT target 2014
Status
vs Target
Comments
Pe
op
le &
Eth
ics
Health &Safety
TRI rate (Incidents per 1m working
hours) < 5 by end 2015
12,5
The annual TRI and LTA rates
continued to improve. In 2014 there
were 2,5 times as many safety
observations than in 2013.
Actions: Safety leadership training
program initiated - move from
compliance driven approach to
value based safety culture.
LTA rate (lost time accidents per 1m
working hours) <1 by end of 2015
5,2
Human Rights Extent of implementation of the
Group's approach to human rights
issues.
Human Rights Assessment to be
conducted in all countries with
production units, forestry and/or
plantation operations by end of
2014.
100 % All units completed.
Ethics &
Compliance
Employees' perception of adherence
to Code of Conduct (YourVoice)
Positive trend in annual employee
survey. 69 %
Clear improvement; results
reviewed. Introduction of E&C index
in 2015.
Sustainable
Leadership Leadership Index (YourVoice)
Positive trend in annual employee
survey 76,0 Improvement. Results reviewed.
Responsible
Sourcing
% of supplier spend covered by
supplier Code of Conduct (CoC)
Cover 80% of the supplier spend on
material and services with the
Supplier Code of Conduct before
the end of 2014. 90% target by end
of 2016.
76,9%
Actions: Leadership focus /
personal targets, training for
purchasers, focused co-operation
with suppliers.
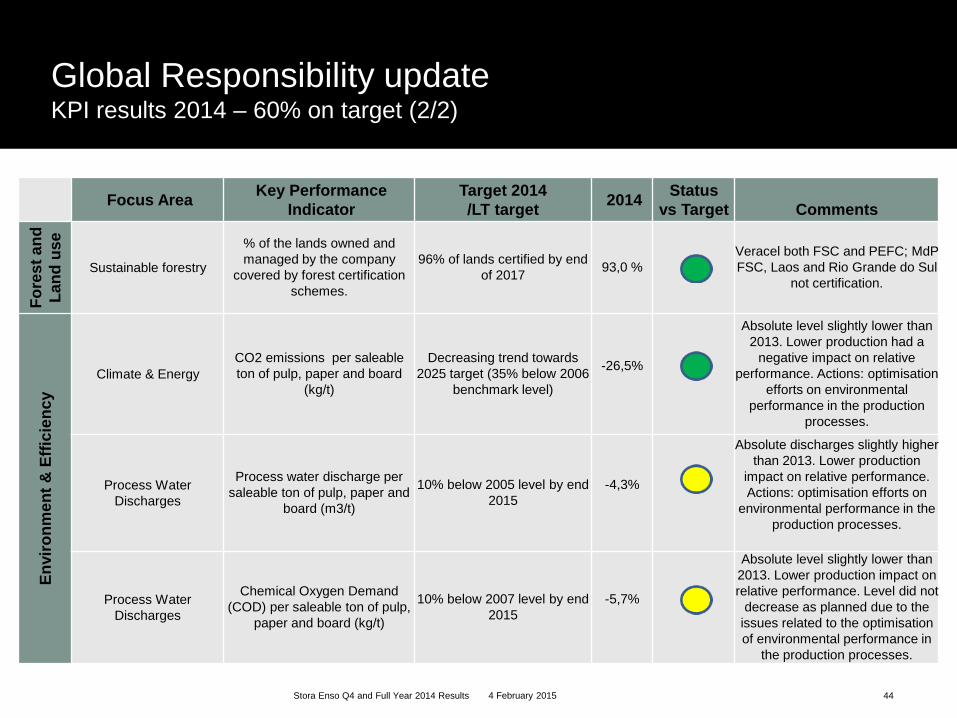
Global Responsibility update KPI results 2014 – 60% on target (2/2)
Focus Area Key Performance
Indicator
Target 2014
/LT target 2014
Status
vs Target
Comments
Fo
res
t a
nd
Lan
d u
se
Sustainable forestry
% of the lands owned and
managed by the company
covered by forest certification
schemes.
96% of lands certified by end
of 2017 93,0 %
Veracel both FSC and PEFC; MdP
FSC, Laos and Rio Grande do Sul
not certification.
En
vir
on
me
nt
& E
ffic
ien
cy
Climate & Energy CO2 emissions per saleable
ton of pulp, paper and board
(kg/t)
Decreasing trend towards
2025 target (35% below 2006
benchmark level)
-26,5%
Absolute level slightly lower than
2013. Lower production had a
negative impact on relative
performance. Actions: optimisation
efforts on environmental
performance in the production
processes.
Process Water
Discharges
Process water discharge per
saleable ton of pulp, paper and
board (m3/t)
10% below 2005 level by end
2015
-4,3%
Absolute discharges slightly higher
than 2013. Lower production
impact on relative performance.
Actions: optimisation efforts on
environmental performance in the
production processes.
Process Water
Discharges
Chemical Oxygen Demand
(COD) per saleable ton of pulp,
paper and board (kg/t)
10% below 2007 level by end
2015
-5,7%
Absolute level slightly lower than
2013. Lower production impact on
relative performance. Level did not
decrease as planned due to the
issues related to the optimisation
of environmental performance in
the production processes.
4 February 2015 Stora Enso Q4 and Full Year 2014 Results 44