Embed Size (px)
Citation preview
THAILAND’S ECONOMY
WHAT LIES AHEAD?
KIRIDA BHAOPICHITR
SENIOR ECONOMIST
1
16 June 2015
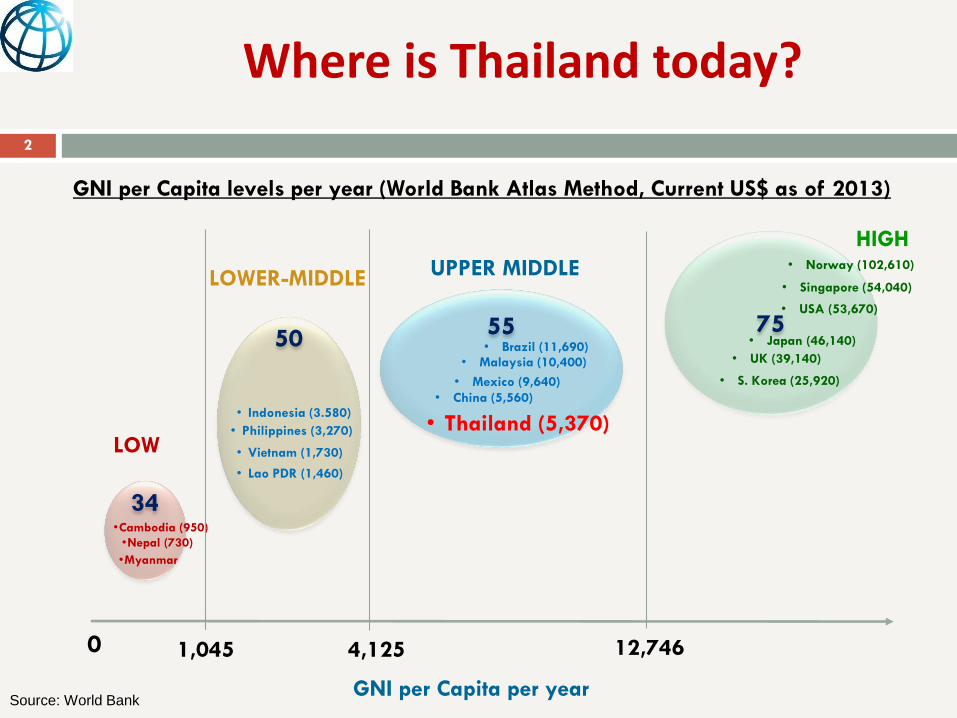
Where is Thailand today?
2
GNI per Capita levels per year (World Bank Atlas Method, Current US$ as of 2013)
Source: World Bank
0
34
1,045 12,746
50
4,125
55
LOW
LOWER-MIDDLE UPPER MIDDLE
HIGH
•Cambodia (950)
•Nepal (730)
• Philippines (3,270)
•Myanmar
• Thailand (5,370)
• Lao PDR (1,460)
• Malaysia (10,400)
• Vietnam (1,730)
• China (5,560) • Indonesia (3.580)
75
• S. Korea (25,920)
• USA (53,670)
• Singapore (54,040)
• UK (39,140)
• Japan (46,140)
• Norway (102,610)
• Mexico (9,640)
• Brazil (11,690)
GNI per Capita per year
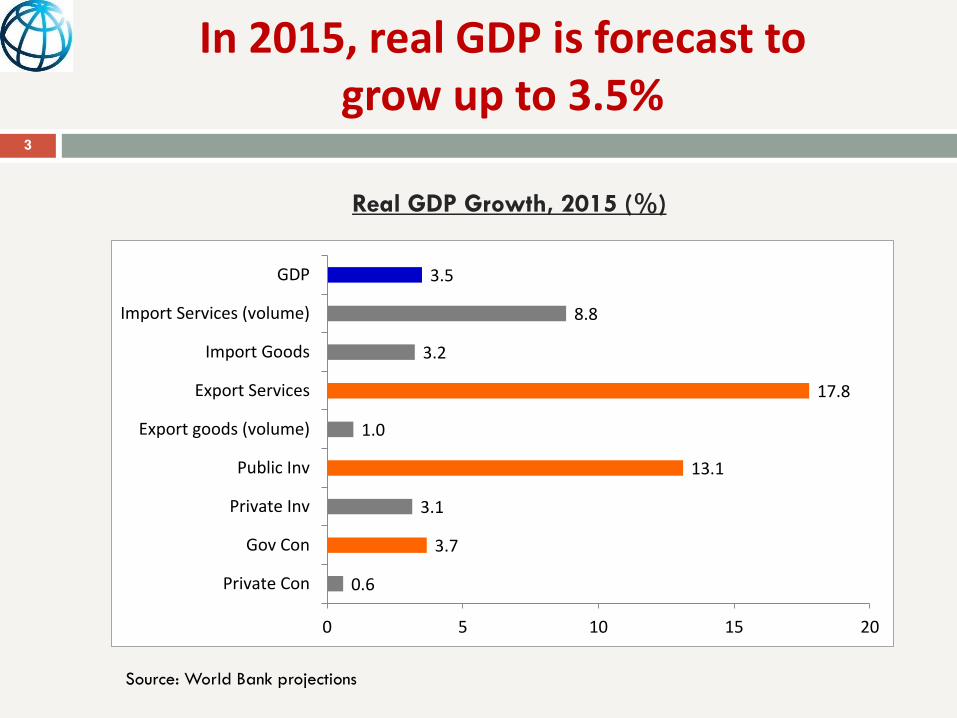
In 2015, real GDP is forecast to grow up to 3.5%
3
0.6
3.7
3.1
13.1
1.0
17.8
3.2
8.8
3.5
0 5 10 15 20
Private Con
Gov Con
Private Inv
Public Inv
Export goods (volume)
Export Services
Import Goods
Import Services (volume)
GDP
Source: World Bank projections
Real GDP Growth, 2015 (%)
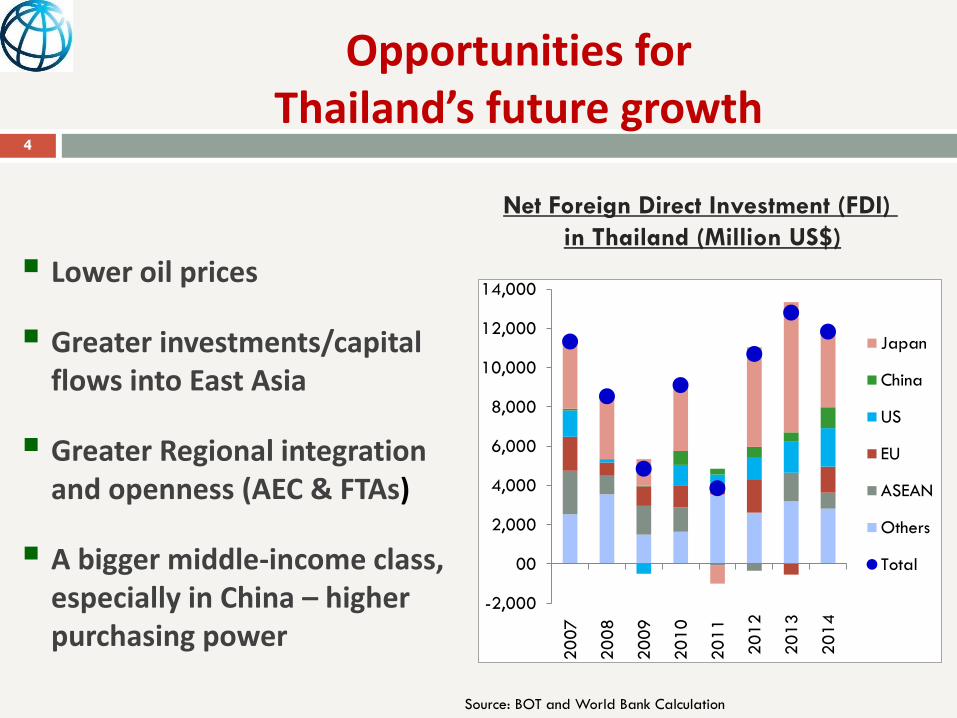
Opportunities for Thailand’s future growth
Lower oil prices
Greater investments/capital flows into East Asia
Greater Regional integration and openness (AEC & FTAs)
A bigger middle-income class, especially in China – higher purchasing power
4
Net Foreign Direct Investment (FDI)
in Thailand (Million US$)
Source: BOT and World Bank Calculation
-2,000
00
2,000
4,000
6,000
8,000
10,000
12,000
14,000
20
07
20
08
20
09
20
10
20
11
20
12
20
13
20
14
Japan
China
US
EU
ASEAN
Others
Total
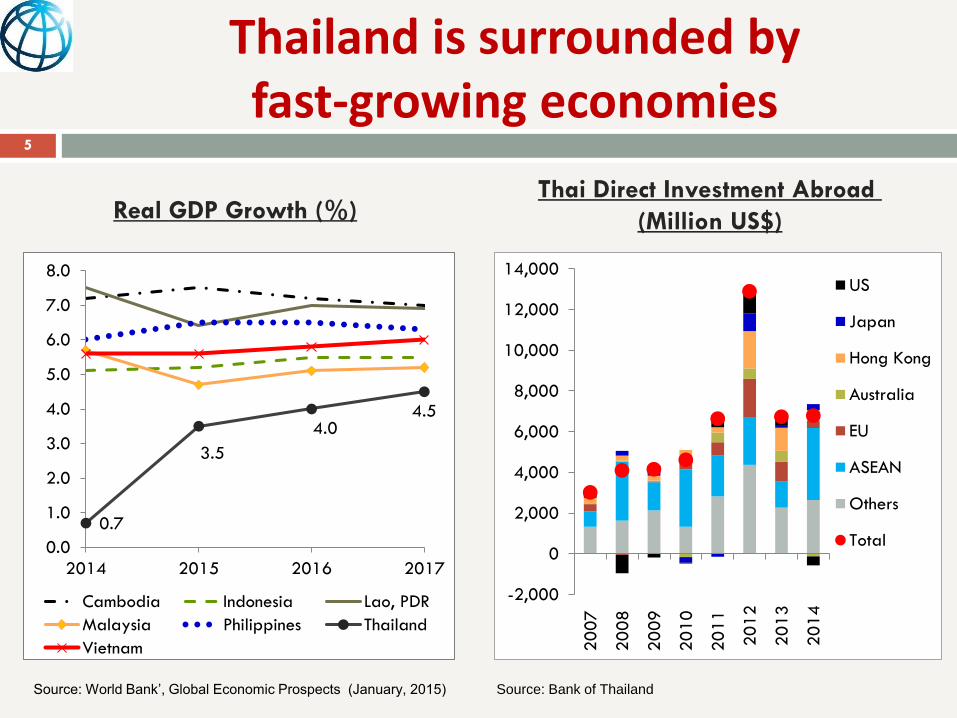
Thailand is surrounded by fast-growing economies
5
0.7
3.5
4.0 4.5
0.0
1.0
2.0
3.0
4.0
5.0
6.0
7.0
8.0
2014 2015 2016 2017
Cambodia Indonesia Lao, PDR
Malaysia Philippines Thailand
Vietnam
Source: World Bank’, Global Economic Prospects (January, 2015)
Real GDP Growth (%)
-2,000
0
2,000
4,000
6,000
8,000
10,000
12,000
14,000
20
07
20
08
20
09
20
10
20
11
20
12
20
13
20
14
US
Japan
Hong Kong
Australia
EU
ASEAN
Others
Total
Thai Direct Investment Abroad
(Million US$)
Source: Bank of Thailand
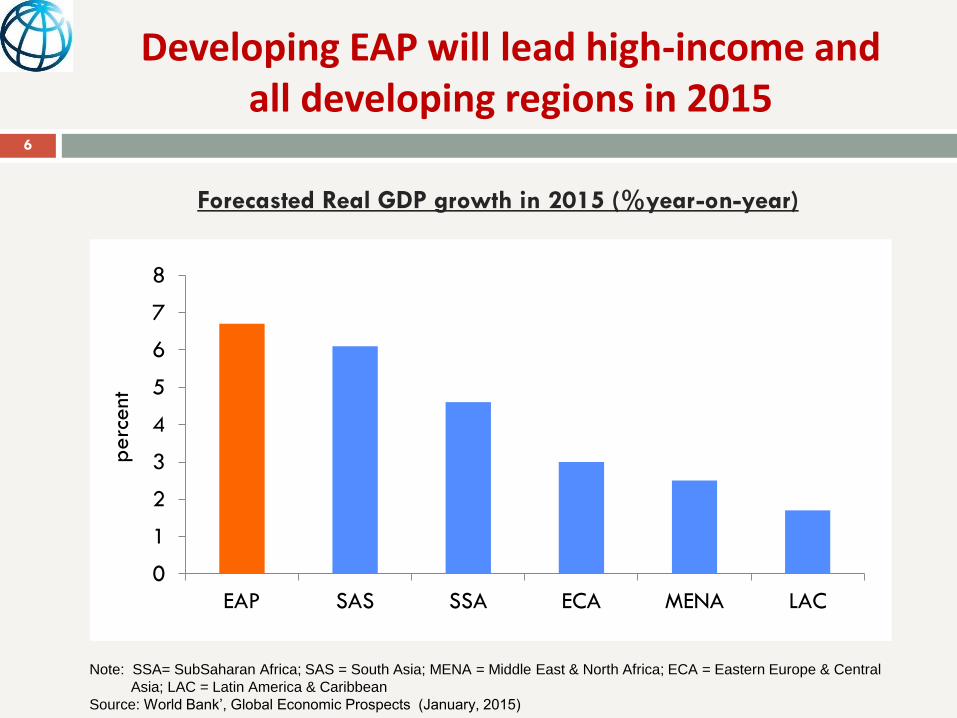
Developing EAP will lead high-income and all developing regions in 2015
6
Note: SSA= SubSaharan Africa; SAS = South Asia; MENA = Middle East & North Africa; ECA = Eastern Europe & Central
Asia; LAC = Latin America & Caribbean
Source: World Bank’, Global Economic Prospects (January, 2015)
Forecasted Real GDP growth in 2015 (%year-on-year)
0
1
2
3
4
5
6
7
8
EAP SAS SSA ECA MENA LAC
perc
ent
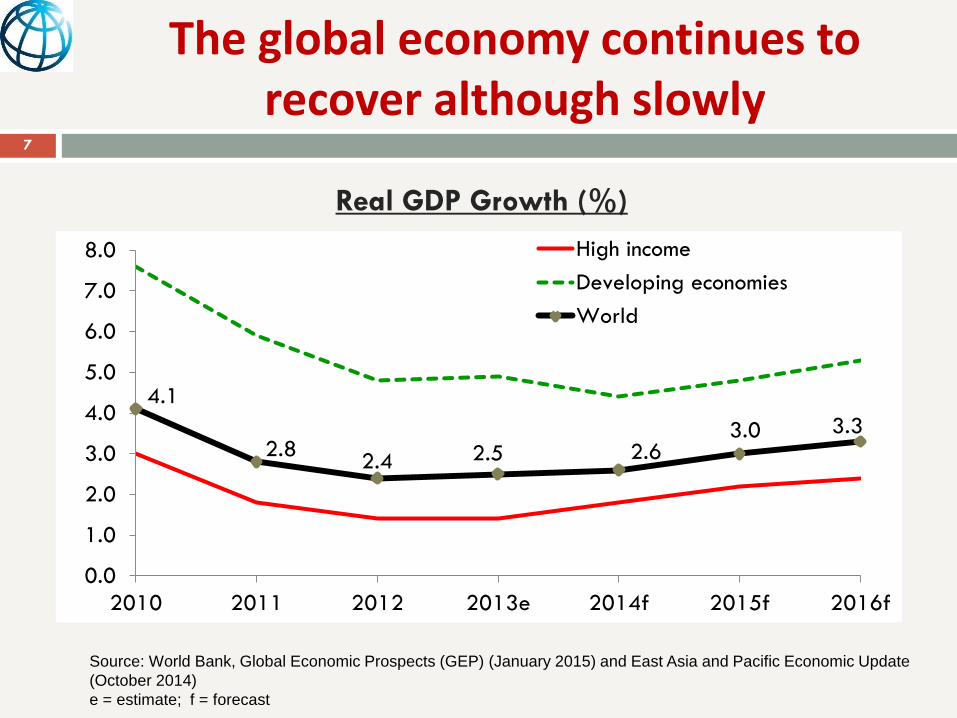
The global economy continues to recover although slowly
Source: World Bank, Global Economic Prospects (GEP) (January 2015) and East Asia and Pacific Economic Update
(October 2014)
e = estimate; f = forecast
7
Real GDP Growth (%)
4.1
2.8 2.4 2.5 2.6
3.0 3.3
0.0
1.0
2.0
3.0
4.0
5.0
6.0
7.0
8.0
2010 2011 2012 2013e 2014f 2015f 2016f
High income
Developing economies
World
8
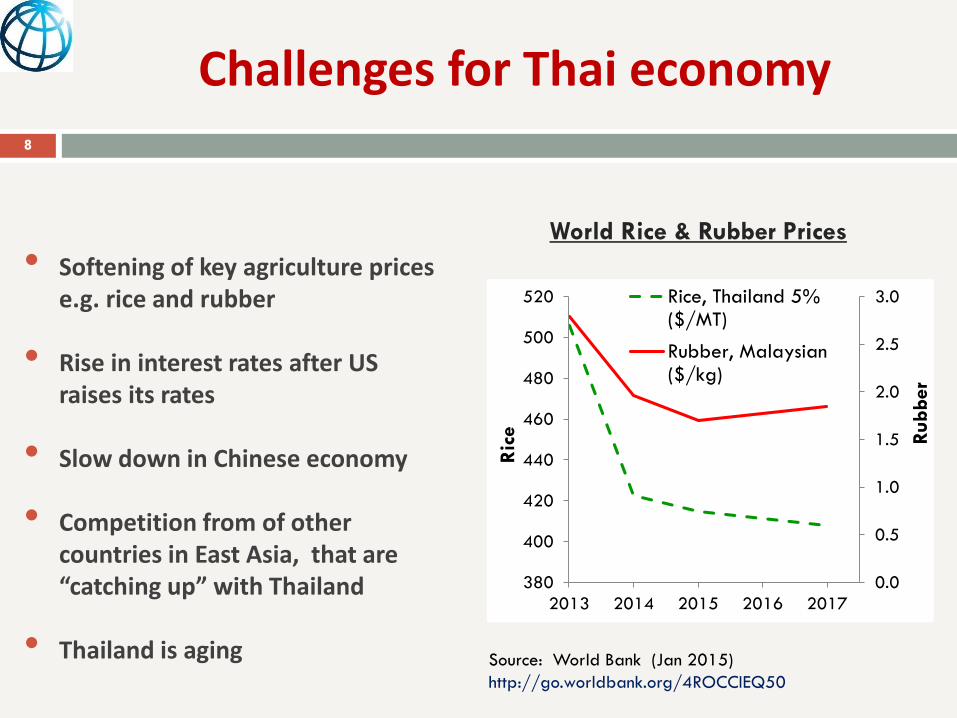
Challenges for Thai economy
Source: World Bank (Jan 2015)
http://go.worldbank.org/4ROCCIEQ50
World Rice & Rubber Prices
0.0
0.5
1.0
1.5
2.0
2.5
3.0
380
400
420
440
460
480
500
520
2013 2014 2015 2016 2017
Rub
ber
Ric
e
Rice, Thailand 5%($/MT)
Rubber, Malaysian($/kg)
• Softening of key agriculture prices e.g. rice and rubber
• Rise in interest rates after US
raises its rates
• Slow down in Chinese economy • Competition from of other
countries in East Asia, that are “catching up” with Thailand
• Thailand is aging
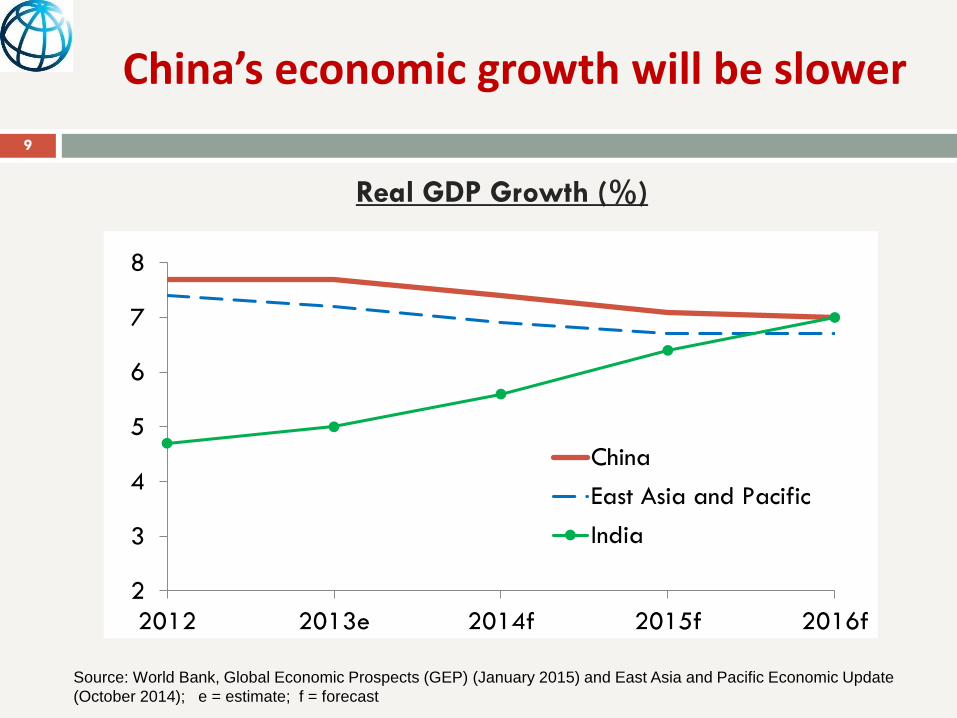
China’s economic growth will be slower
9
2
3
4
5
6
7
8
2012 2013e 2014f 2015f 2016f
China
East Asia and Pacific
India
Source: World Bank, Global Economic Prospects (GEP) (January 2015) and East Asia and Pacific Economic Update
(October 2014); e = estimate; f = forecast
Real GDP Growth (%)
0
10
20
30
40
50
60
70
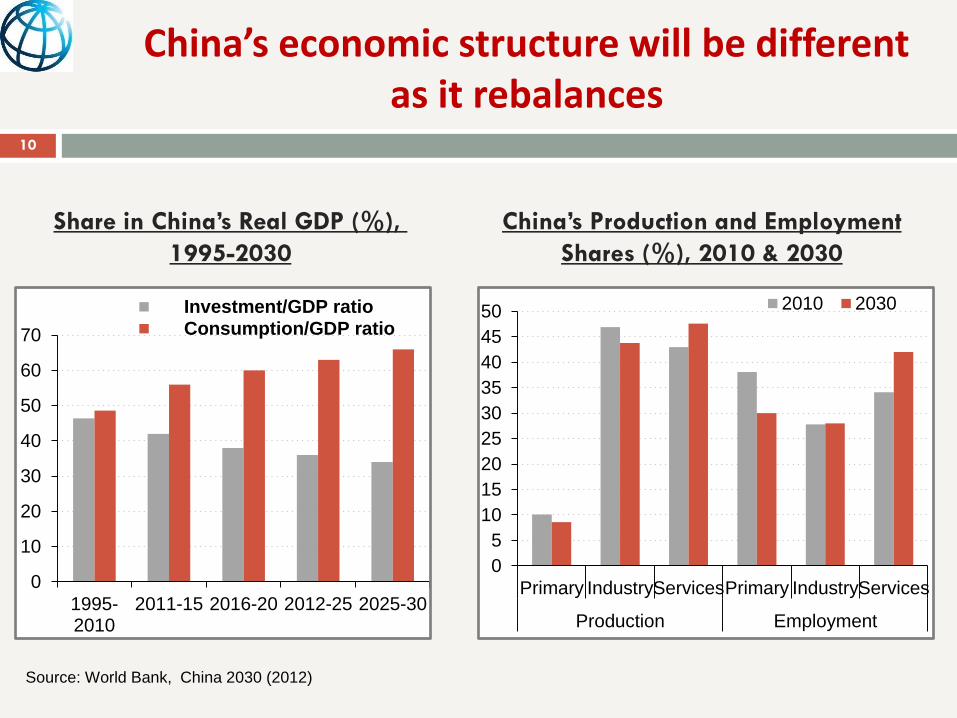
1995-2010
2011-15 2016-20 2012-25 2025-30
Investment/GDP ratio Consumption/GDP ratio
Source: World Bank, China 2030 (2012)
Share in China’s Real GDP (%),
1995-2030
China’s economic structure will be different as it rebalances
0
5
10
15
20
25
30
35
40
45
50
Primary IndustryServicesPrimary IndustryServices
Production Employment
2010 2030
China’s Production and Employment
Shares (%), 2010 & 2030
10
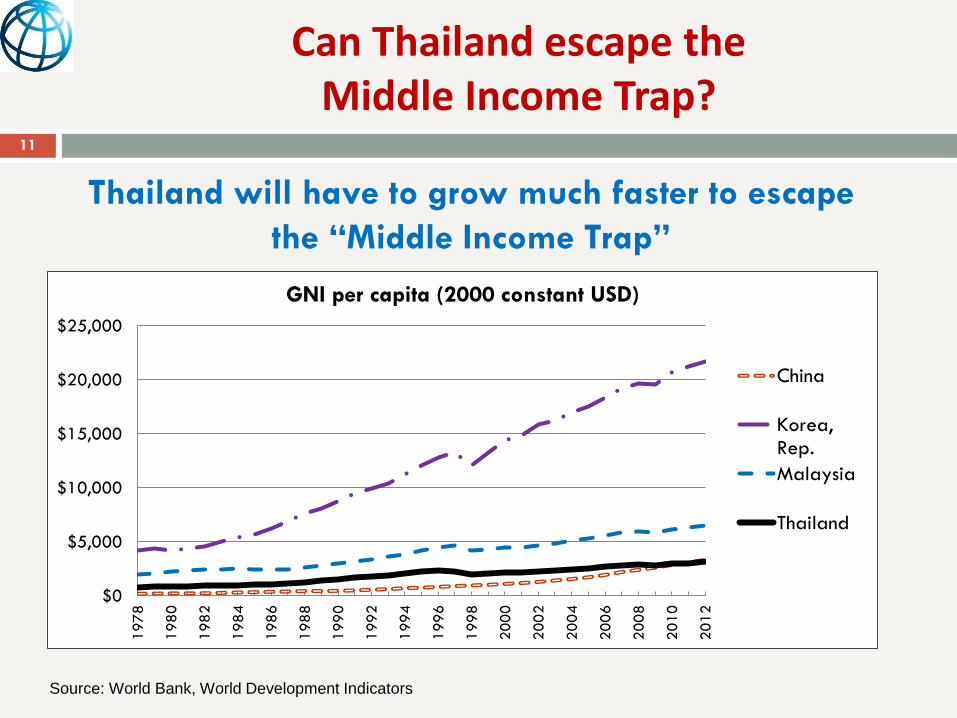
Can Thailand escape the Middle Income Trap?
11
Thailand will have to grow much faster to escape
the “Middle Income Trap”
Source: World Bank, World Development Indicators
$0
$5,000
$10,000
$15,000
$20,000
$25,000
197
8
198
0
198
2
198
4
198
6
198
8
199
0
199
2
199
4
199
6
199
8
200
0
200
2
200
4
200
6
200
8
201
0
201
2
GNI per capita (2000 constant USD)
China
Korea,Rep.
Malaysia
Thailand
-15
-10
-5
0
5
10
15
20
Q1/20
13
Q2/20
13
Q3/20
13
Q4/20
13
Q1/20
14
Q2/20
14
Q3/20
14
Q4/20
14
Q1/20
15
% Y
OY
Indonesia Philippines Vietnam
Malaysia Thailand
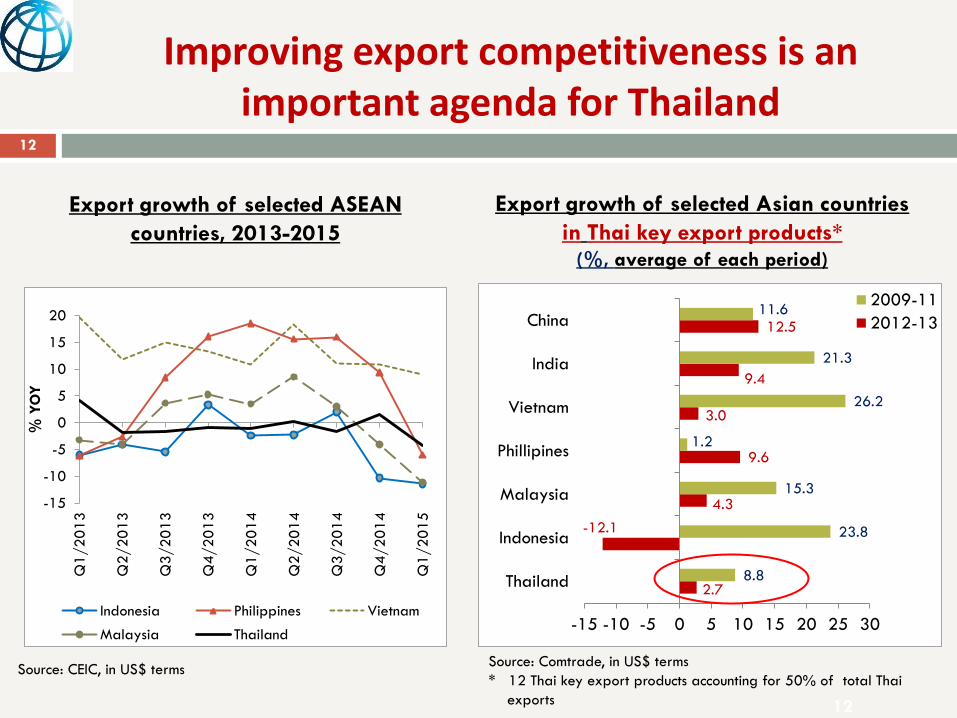
Improving export competitiveness is an important agenda for Thailand
Source: Comtrade, in US$ terms
* 12 Thai key export products accounting for 50% of total Thai
exports 12
Export growth of selected Asian countries
in Thai key export products* (%, average of each period)
Export growth of selected ASEAN
countries, 2013-2015
2.7
-12.1
4.3
9.6
3.0
9.4
12.5
8.8
23.8
15.3
1.2
26.2
21.3
11.6
-15 -10 -5 0 5 10 15 20 25 30
Thailand
Indonesia
Malaysia
Phillipines
Vietnam
India
China2009-11
2012-13
Source: CEIC, in US$ terms
12
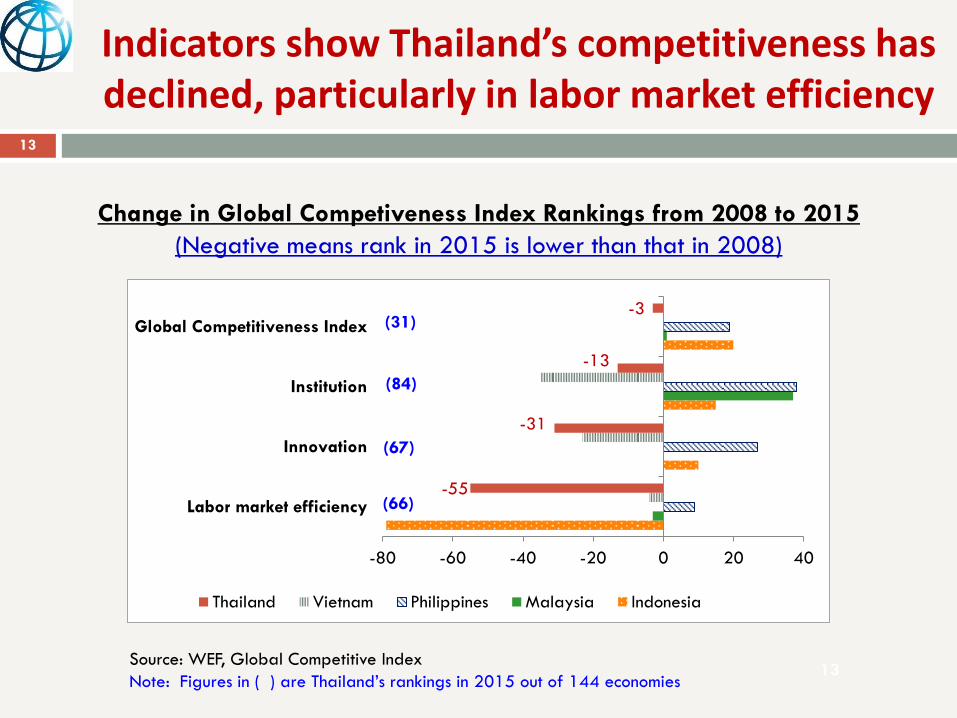
Indicators show Thailand’s competitiveness has declined, particularly in labor market efficiency
Change in Global Competiveness Index Rankings from 2008 to 2015
(Negative means rank in 2015 is lower than that in 2008)
Source: WEF, Global Competitive Index
Note: Figures in ( ) are Thailand’s rankings in 2015 out of 144 economies 13
-55
-31
-13
-3
-80 -60 -40 -20 0 20 40
Labor market efficiency
Innovation
Institution
Global Competitiveness Index
Thailand Vietnam Philippines Malaysia Indonesia
(84)
(67)
(66)
(31)
13
-10
-5
0
5
10
15
20
25
30
200
5
200
6
200
7
200
8
200
9
201
0
201
1
201
2
201
3
201
4
Perc
ent
Thailand Philippines Vietnam
China Indonesia
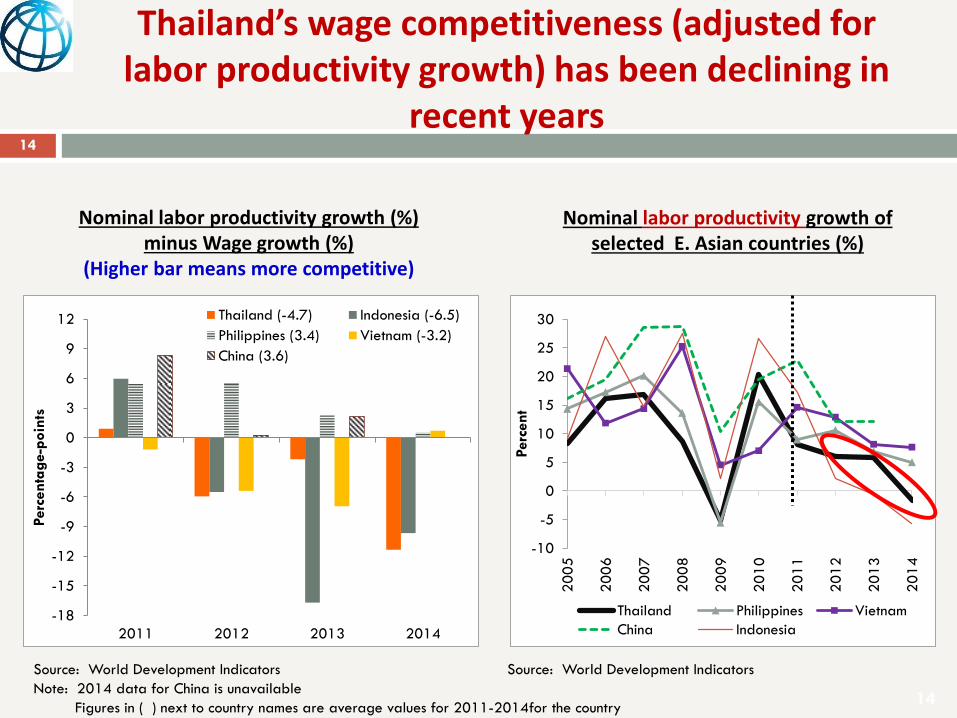
Thailand’s wage competitiveness (adjusted for labor productivity growth) has been declining in
recent years
14
Source: World Development Indicators
Note: 2014 data for China is unavailable
Figures in ( ) next to country names are average values for 2011-2014for the country
Nominal labor productivity growth (%) minus Wage growth (%)
(Higher bar means more competitive)
Source: World Development Indicators
Nominal labor productivity growth of selected E. Asian countries (%)
-18
-15
-12
-9
-6
-3
0
3
6
9
12
2011 2012 2013 2014
Perc
enta
ge-p
oin
ts
Thailand (-4.7) Indonesia (-6.5)
Philippines (3.4) Vietnam (-3.2)
China (3.6)
14
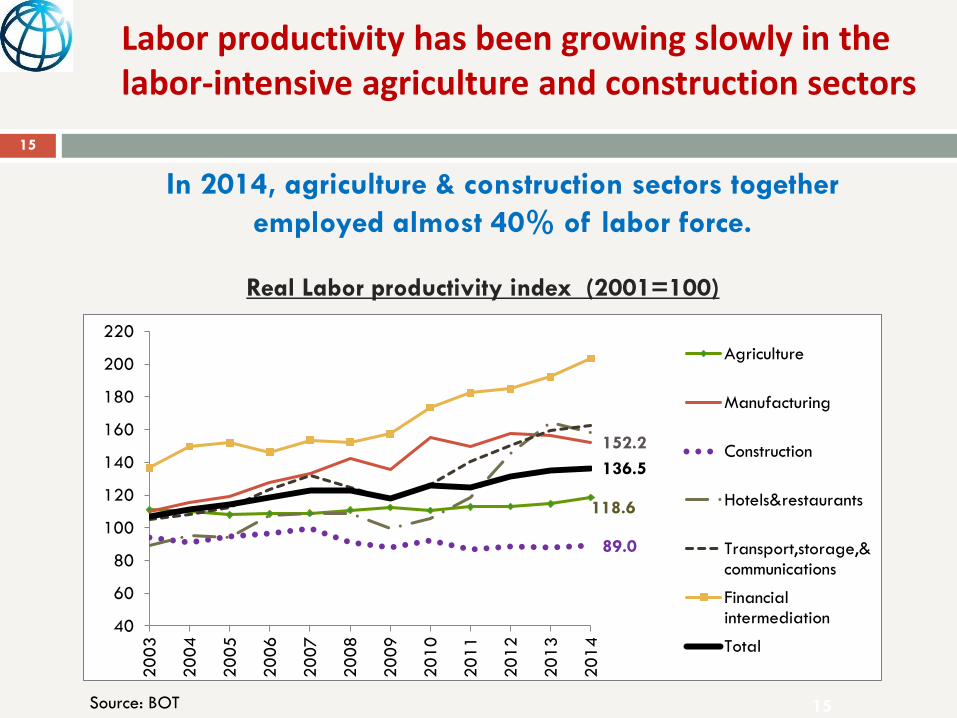
Labor productivity has been growing slowly in the labor-intensive agriculture and construction sectors
Real Labor productivity index (2001=100)
Source: BOT
118.6
152.2
89.0
136.5
40
60
80
100
120
140
160
180
200
220
20
03
20
04
20
05
20
06
20
07
20
08
20
09
20
10
20
11
20
12
20
13
20
14
Agriculture
Manufacturing
Construction
Hotels&restaurants
Transport,storage,&communications
Financialintermediation
Total
In 2014, agriculture & construction sectors together
employed almost 40% of labor force.
15
15
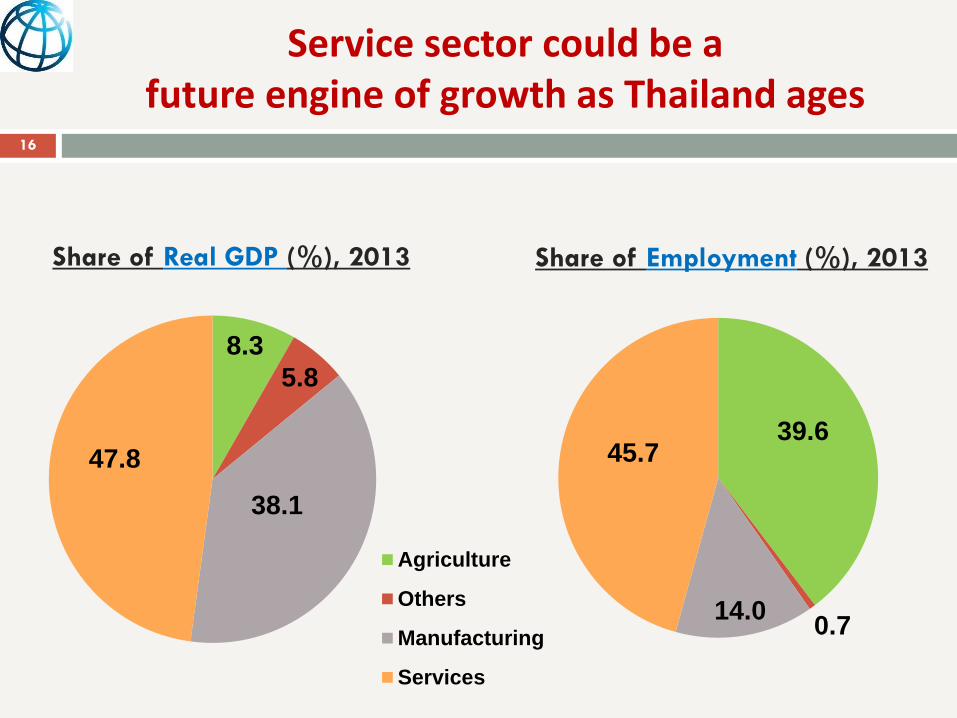
8.3
5.8
38.1
47.8
Agriculture
Others
Manufacturing
Services
Service sector could be a future engine of growth as Thailand ages
16
Share of Real GDP (%), 2013 Share of Employment (%), 2013
39.6
0.7 14.0
45.7
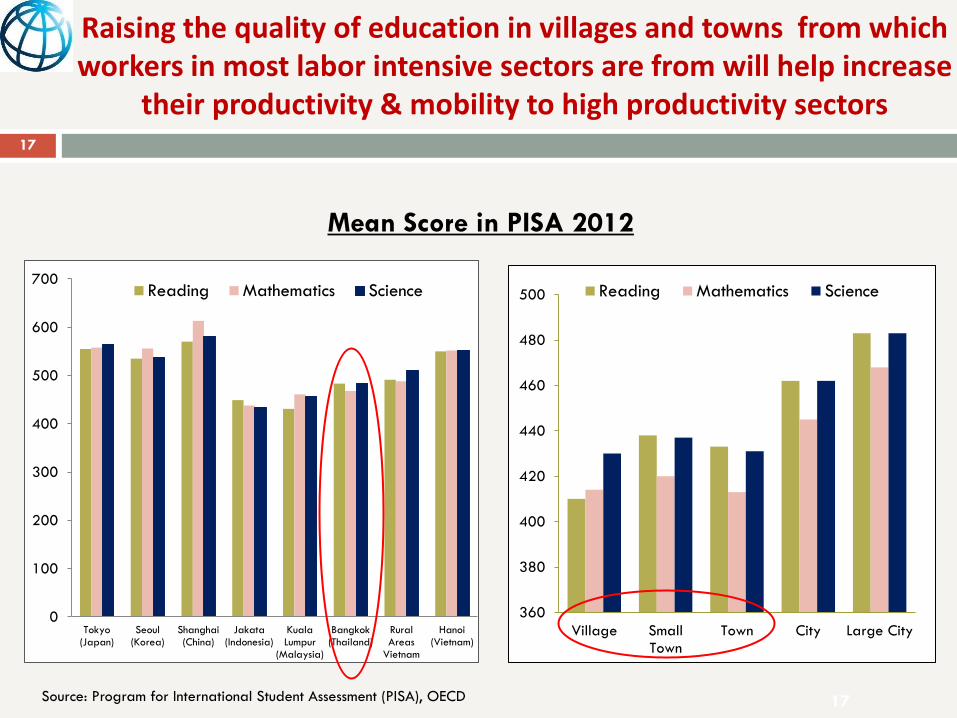
Raising the quality of education in villages and towns from which workers in most labor intensive sectors are from will help increase
their productivity & mobility to high productivity sectors
360
380
400
420
440
460
480
500
Village SmallTown
Town City Large City
Reading Mathematics Science
Mean Score in PISA 2012
Source: Program for International Student Assessment (PISA), OECD 17
0
100
200
300
400
500
600
700
Tokyo(Japan)
Seoul(Korea)
Shanghai(China)
Jakata(Indonesia)
KualaLumpur
(Malaysia)
Bangkok(Thailand)
RuralAreas
Vietnam
Hanoi(Vietnam)
Reading Mathematics Science
17
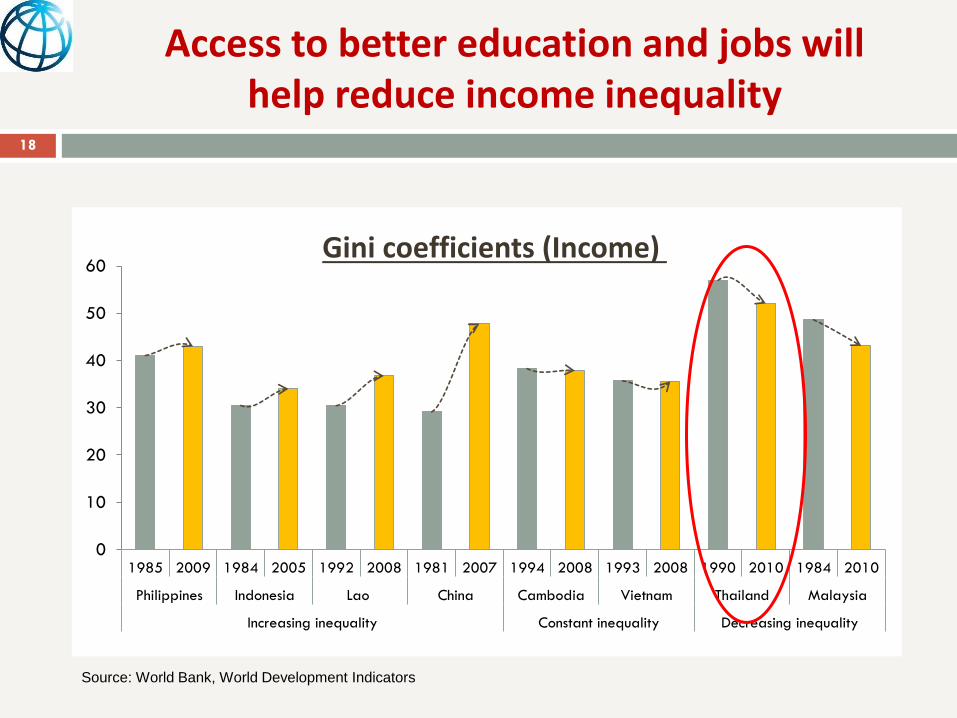
Access to better education and jobs will help reduce income inequality
18
0
10
20
30
40
50
60
1985 2009 1984 2005 1992 2008 1981 2007 1994 2008 1993 2008 1990 2010 1984 2010
Philippines Indonesia Lao China Cambodia Vietnam Thailand Malaysia
Increasing inequality Constant inequality Decreasing inequality
Source: World Bank, World Development Indicators
Gini coefficients (Income)
Thank You
All World Bank data and reports
can be downloaded at
www.worldbank.org
www.facebook.com/WorldbankThailand