Embed Size (px)
Citation preview
2016 VAESE Benchmarking Report
Voluntary Alumni Engagement in Support of Education
Survey conducted by Alumni Access® A division of TriQuest® and Access Development®
2 - 2016 VAESE Benchmarking Report | Alumni Access® 1-888-878-6178
Voluntary Alumni Engagement in Support of Education
© 2016 Alumni Access® Access Development®
Creative Commons Attribution-ShareAlike (CC BY-SA)
This license permits remixing, repurposing and building upon this work, even for commercial purposes, providing “Alumni Access®, VAESE Alumni Benchmarking Study” is clearly and obviously credited. Any new creation that
references, or is derived, in whole or in part, from this work, must also be licensed using the identical terms, even if intended for commercial use. All other for-profit use requests must contact:
VAESE Study Permissions: Access Development, 1012 W. Beardsley Place, S.L.C., UT 84119 | Phone: 866-714-7251
1-888-878-6178 2016 VAESE Benchmarking Report | Alumni Access® - 3
CONTENTS
FOREWORD ....................................................................................................................................4
INTRODUCTION ............................................................................................................................ 5
THE STATE OF ALUMNI RELATIONS IN HIGHER EDUCATION ................................................6
ANALYSIS: KEY TAKEAWAYS FROM THE VAESE SURVEY ...................................................... 7
EXECUTIVE SUMMARY OF KEY STATISTICS.............................................................................12
COMPARATIVE SURVEY DATA ....................................................................................................16

4 - 2016 VAESE Benchmarking Report | Alumni Access® 1-888-878-6178
Foreword
Welcome to the inaugural VAESE (Voluntary Alumni Engagement in Support of Education) study, the first global, comprehensive benchmarking study of higher education alumni relations practices. Its aim is to capture a snapshot of alumni programs engagement activities, while offering empirical data that can be used to enhance constituent engagement in higher education.
A coalition of alumni relations professionals, representing institutions worldwide, have collaborated on this survey to help ensure that it addresses the most pertinent questions that matter most to alumni professionals and decision makers.
This study includes over 50 questions from a wide variety of topics related to alumni engagement, administration, and programming. It offers a wealth of information about existing practices, and the wide-ranging methods used to attract, engage, and cultivate a lifelong relationship with alumni and their alma mater.
We are pleased to report 469 responses in this inaugural study. The vast majority of respondents (97%) are from the United States, but responses were received from Canada and Europe as well. We have limited responses to only those higher education institutions employing a minimum of one part-time alumni relations/engagement personnel. Wherever possible, we have combined responses from the same institution, or selected responses from the highest ranking executive, in efforts of avoiding bias in favor of one institution, or one type of institution. When considering the total number of institutions that meet this criteria, our overall margin of error is a respectable 4% +/-.
As we continue this study in the coming years, we invite alumni professionals to contribute their expertise to improve the study, and enhance its relevance to their circumstances.
1-888-878-6178 2016 VAESE Benchmarking Report | Alumni Access® - 5
Introduction
Professionals working in alumni relations are often required to wear many hats. One day might involve setting up chairs or stuffing envelopes, the next day may require analyzing email click rates or editing the alumni e-newsletter.
Alumni professionals tackle engagement objectives in vastly different ways, given their varied resources and circumstances.
As this profession evolves and matures, so will the need to establish benchmarks for the industry. Without meaningful and reliable data, administrators and decision makers must look to peer institutions for any type of relevant information they can find. However, that information may not always be relevant or helpful when making important business decisions.
Alumni professionals are uniquely collaborative. We openly share ideas, collateral, internal studies and even failures with our peers. And while we all see the potential benefits of an industry-wide study, launching a comprehensive study like this is likely too burdensome for any one person, alumni group or institution to tackle, and that's why this VAESE study is the first of its kind.
This study was commissioned by Alumni Access, and conducted independently by Access Development. A key objective of this study is to increase the body of reliable data that alumni relations professionals can use to better do their jobs. After developing the study tool and executing the survey, we are keeping our promise and sharing the results with all interested advancement professionals, under a relatively unrestrictive Creative Commons license, that permits remixing, repurposing and building upon this work.
The VAESE study looks at many facets of voluntary alumni engagement, and includes these important topics:
1. Organizational structures2. Staffing3. Technology4. Marketing & communication5. Membership6. Programming
We are pleased with the results of this inaugural effort. Many new and enlightening discoveries are contained in this report. We hope you will find it useful.
6 - 2016 VAESE Benchmarking Report | Alumni Access® 1-888-878-6178
The State of Alumni Relations in Higher Education
The state of worldwide alumni relations is generally healthy. Outside of the United States, the profession is fast becoming recognized as a necessary tool to help institutions thrive. Clearly the profession is well established in the U.K. and Canada, and is growing rapidly in Europe, Asia and Australia.
Within the United States, organizations are reporting overall growth in their budgets and staffing. Many institutions have become quite adept at executing many of the technical challenges associated with alumni engagement, such as database management, email communication, social media and membership marketing.
Yet the data reveals a wide gap between the “haves” and “have-nots.”
Institutions with over 100,000 alumni report incremental growth in their budgets and staffing over the past five years, but smaller institutions (especially private schools) report a stagnation or decline in their growth rate of both staff and budgets.
Smaller shops also face a unique challenge because they are often asked to balance both fundraising and engagement responsibilities. From executive administrators on down to alumni engagement personnel, their performance evaluations are frequently tied to fundraising metrics, which are far easier to measure than engagement. Consequently, short-term pressures of raising money can often take precedence over lifelong engagement.
The data also reveals significant room for growth when it comes to things like adopting mobile platforms, delivering meaningful alumni benefits, managing opt-out rates, and engaging GOLDs and young alumni. It appears that many organizations have a persistent dependence on affinity partner income at the expense of offering compelling value that will attract and engage their alumni constituents.
1-888-878-6178 2016 VAESE Benchmarking Report | Alumni Access® - 7
Analysis: Key Takeaways From the VAESE Survey
While future VAESE data will be needed to better identify long-term trends, the study shows a few important developments worth noting:
• The integration of alumni relations with fundraising/development/advancement operations is becomingthe norm.
• When alumni relations and fundraising operationsintegrate, lifelong alumni engagement efforts may suffer.
• Dues-paying alumni organizations appear to be on the decline.
• The “Alumni Professional’s Anxiety Index” reveals themost pressing issues for alumni relations professionals.
1 The integration of alumni relations with fundraising/development/advancement is becoming the norm.
68% of alumni organizations report being fully integrated or are working toward integration with fundraising/development. Just 5% of alumni organizations report their opposition to integrating their alumni engagement programs with fundraising/development.
Furthermore, the data shows that just 11% of senior alumni relations executives report directly to the President/Chancellor of the institution. When the top alumni relations executive has frequent access to the institution’s top decision maker, greater emphasis can be given to promote both engagement AND fundraising goals when needed.
The majority of alumni relations executives (70%) report to the Vice President/Vice Chancellor, who often has oversight responsibilities for a much larger staffed fundraising operation. And roughly 4% of senior alumni relations executives have dual reporting responsibilities, reporting to both an institutional executive (Vice President/Vice Chancellor) as well as to a foundation executive/board or directors.
Private institutions have a much higher rate of integration than public institutions (76% vs. 54%). Smaller schools with under 100K alumni are also more integrated (70%) than are schools with more than 100K alumni (56%).
When controlling for the total alumni population, alumni offices that are not integrated with fundraising tend to have more staff (65% more, as measured by FTE’s) than alumni programs that are integrated with fundraising.
8 - 2016 VAESE Benchmarking Report | Alumni Access® 1-888-878-6178
Interestingly enough, for alumni organizations with a
dues-paying structure, only 35% are integrated with their
fundraising office, while 73% of schools with a non dues-
paying organization are fully integrated.
2 When alumni relations and fundraising operations integrate, lifelong alumni engagement efforts may suffer.
With the increasing number of institutions integrating alumni relations and development, the data reveals an increasing number of engagement programs that appear to be taking a back seat to the demands of fundraising. Soliciting alumni without regard for timing, cultivation, prior engagement or willingness to give, can have a considerable impact on long-term engagement. This can be especially evident for new graduates whose desire to stay connected with their alma mater is often at its peak. But they are asked to contribute in the only manner they are least capable of giving, a cash contribution. Many would gladly give time, talent or otherwise engage in ways that don’t require a cash contribution, but are rarely asked.
Cultivating a lifelong relationship requires trust and reciprocation over time. However, far too many institutions don’t seem interested in waiting. Cultivation appears to have become subordinate to short-term demands to raise money. In many cases, it appears that gift solicitation is the primary method of cultivating lifelong engagement. Here are a few pertinent stats:
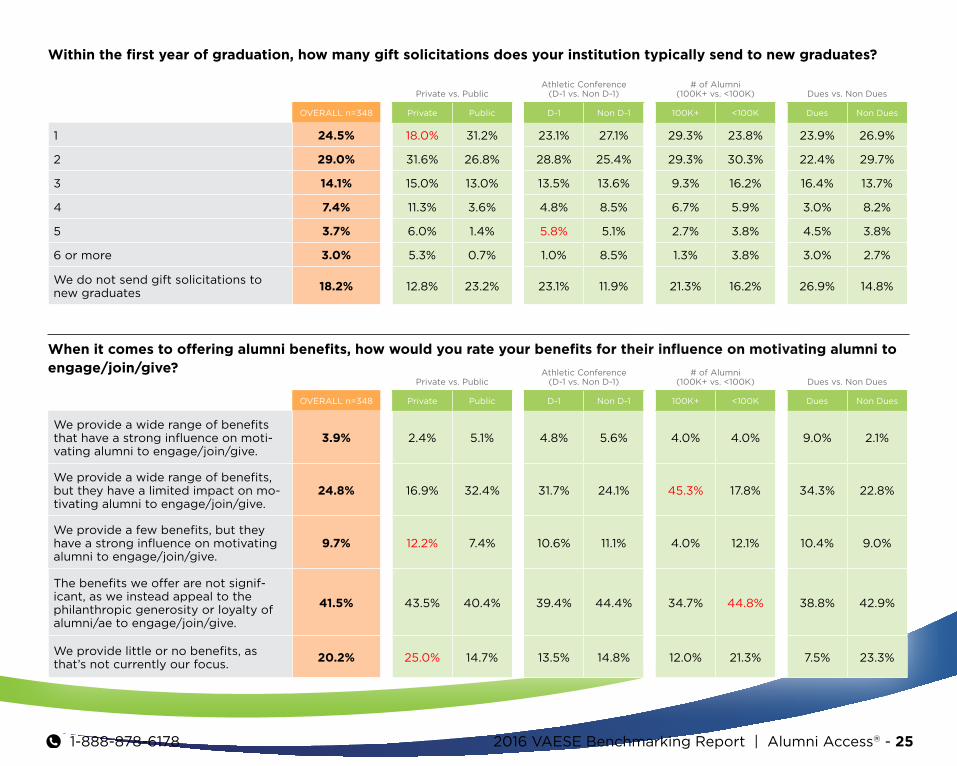
• 82% of institutions send at least one gift solicitationto new grads within the first year of graduation.
But at many institutions, it doesn’t stop with just one solicitation:
• Nearly one-third of schools (30%) send three or moregift solicitations to new graduates during their firstyear as alums.
• And, 7% of schools send five or more solicitations tonew graduates during their first year.
Unrestrained soliciting of alumni can be considered by some to be over-zealous fundraising. Especially if no other efforts are made to attract and engage these new graduates. The evidence at many institutions clearly shows that offering benefits to alumni is not a priority!
62% of alumni organizations are “not focused on offering alumni any significant benefits,” or instead “appeal to the philanthropic generosity or loyalty of alumni/ae to (get them to) engage, join, or give.”
1-888-878-6178 2016 VAESE Benchmarking Report | Alumni Access® - 9
Unfortunately, many institutions admit to being less focused on offering alumni benefits, and are instead trying to cash in on the accumulated loyalty that still exists with their alumni.
Organizations relying primarily on alumni “philanthropic generosity” or “loyalty” will find that these wane over time. This is manifested by the number of alumni who end their relationship with their alma mater, and opt-out of contact with the school.
These statistics indicate a potentially troubling trend:
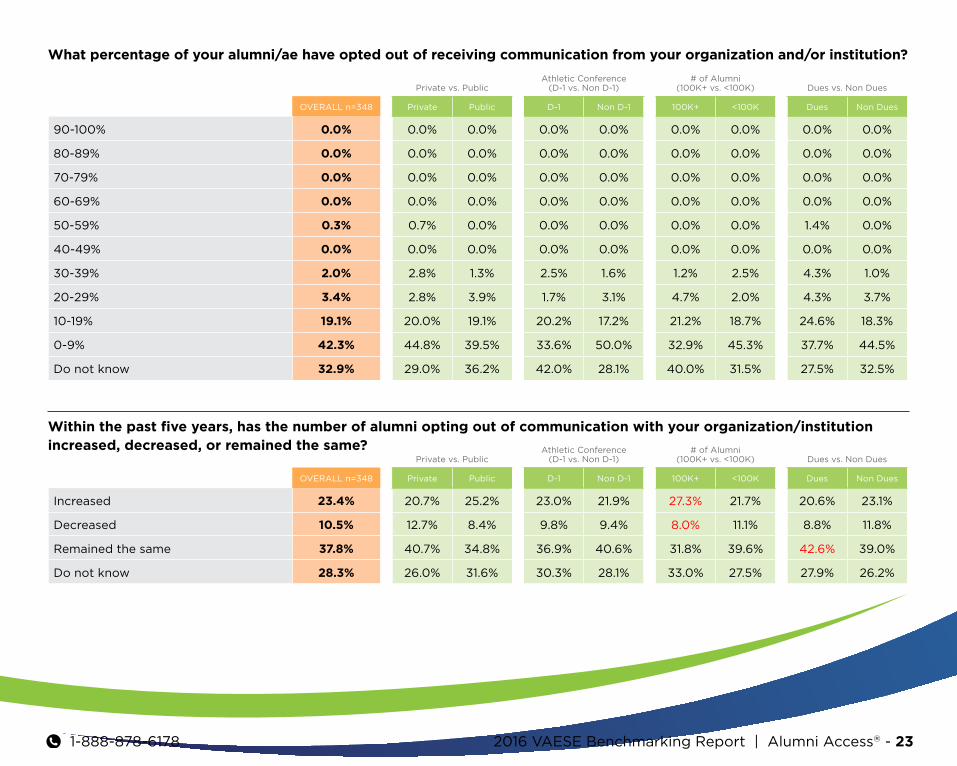
* One in four institutions have seen at least 10% of theiralumni stop all contact with their alma mater, and 6%have even suffered between 20-39% of their alumniopting out of being contacted.
* Opt-out rates have not improved, and are gettingworse at 41% of U.S. institutions.
* 33% of respondents admit they don’t track alumniopt-out rates.
With overall opt-out rates appearing to increase, and with one in three schools unaware of their opt-out rates, the overall trend doesn’t look promising.
Expecting perpetual alumni loyalty is not realistic or financially sustainable, especially if opt-out rates don’t improve. If an institution is truly focused on establishing lifelong relationship with their alumni, then greater focus needs to be made on delivering ongoing incentives to entice ongoing engagement.
3Dues-paying alumni organizations may on the decline.
The VAESE survey reveals some interesting stats about dues-paying alumni organizations. They appear to be a diminishing breed.
Only 22% of respondent institutions have a paid alumni membership program; about 4% have a tiered benefits model for both alumni and non-alumni. That leaves 74% of institutions with a non dues-paying structure.
While each school has their unique needs and challenges, a dues-paying structure is not suited for all types of institutions. Clearly the size of the institution and its alumni budget has much to do with the success rate of dues-paying programs. Another important indicator that may predict success is an affiliation with a Division 1 (D-1) NCAA conference. Larger, D-1 institutions with an annual budget over $1 million have, on average, 9% of their alumni database paying dues. However, smaller organizations with an annual budget under $1 million see just 3.7% of alumni willing to pay dues to their alumni association.
10 - 2016 VAESE Benchmarking Report | Alumni Access® 1-888-878-6178
The apparent drawbacks seen by smaller schools with a dues-paying structure have led many to investigate the feasibility of implementing such a program. Of all institutions who have studied the pros and cons of implementing a dues-paying model over the past five years, 66% have rejected it. Just 8% have approved or implemented a dues-paying model. Alumni organizations generally seem to be rejecting the dues-paying model, but this is especially true among organizations with less than 100,000 addressable alumni.
That’s not to say that a dues-paying structure isn’t a valuable tool for numerous schools, many of which are hugely successful at engaging their alumni with a dues-paying program. But each school has their unique needs and challenges; a dues-paying structure is suited for some, but not for all.
Another interesting tidbit of data indicates the correlation of dues-paying organizations with the number of alumni who opt-out of receiving communication from the school. Dues-paying organizations, on average, see 12.4% of their alumni opt-out of contact with the institution. For non dues-paying organizations, their opt-out rate is 9.2%.
Dues-paying organizations are 63% more likely to have alumni opt-out rates above 30%.
It is also worth noting that after controlling for the size of the alumni database, organizations with a dues-paying structure have 58% more clerical personnel than non dues paying organizations. This is likely a reflection of the increased need for administrative processing capacity among dues-paying organizations.
4The “Alumni Professional’s Anxiety Index” reveals the most pressing issues for alumni relations professionals.
The Alumni Professional’s Anxiety Index is a tool used to measure how alumni professionals feel about their work in alumni relations. It’s a metric that will have both immediate relevance and increased meaning over time as we compare the results from year to year.
Once we have year-over-year data, we will calculate responses to a series of questions relating to alumni professionals most pressing fears and concerns, and arrive at a numerical measurement we can use going forward.
The index will be tabulated based on these three broad categories:
1-888-878-6178 2016 VAESE Benchmarking Report | Alumni Access® - 11
Institutional Support: This score relates to general concerns about the institution’s willingness and ability to sustain the alumni organization and its programming, such as budgets, staffing, and fears of reorganization. It also reveals the level to which alumni professionals feel their institution is invested in the work of alumni relations, and whether they sense their work is being embraced or neglected by administrators.
Organizational Concerns: This score relates to concerns about the alumni organization itself, and the worries they have related to leadership, alumni engagement, the ongoing demands of technology, and sharing of workloads among staff members.
Job Security: This score relates to questions about employment, the fear of losing their job, whether they lose sleep about work-related issues, and their personal future in alumni relations.
In the short term, this tool will help us identify pressing issues common among all organizations. It will also help us determine if those issues are consistent among segments of alumni relations professionals. Over time, the Anxiety Index will be an indicator of how the overall mood is changing, and it may help identify and explain certain trends in programming and engagement.
The questions associated with Alumni Professional’s Anxiety Index offers the following insights:
1. Overwhelmingly, the most common issue causing anxietyamong alumni relations professionals is “not havingenough staff to complete necessary tasks.” Roughly threeout of four respondents—or 74%— report that beingunder-staffed is either “very” or “somewhat concerning.”
2. Another significant issue is a general lack of engagementamong their alumni. 68% of respondents report thatdisengaged alumni is their most pressing concern.
3. Alumni professionals are most concerned about whetherthey are receiving sufficient institutional support. Themost frequent concerns relate to budget cuts (the thirdmost mentioned issue), the potential for reorganization,and that alumni engagement efforts are being neglectedby the institution.
4. Job satisfaction appears to be of least concern foralumni professionals. Most alumni professionals seem toenjoy what they do. Relatively few are losing sleep overtheir job, as just 12% report fear of losing their job as asignificant concern.
5. One more impressive result points to how well we getalong with our co-workers. Most organizations aren’tfacing significant issues with fellow employees whoare not pulling their weight. Only 18% are “very” or“somewhat concerned” about the work ethic of theirfellow employees.
12 - 2016 VAESE Benchmarking Report | Alumni Access® 1-888-878-6178
Executive Summary of Key Statistics
This study looks at the many facets of alumni engagement. We’ve pulled the most pertinent statistics as it relates to these relevant topics:
1. Organizational structures
2. Staffing
3. Technology
4. Marketing and Communication
5. Membership
6. Programming
1-888-878-6178 2016 VAESE Benchmarking Report | Alumni Access® - 13
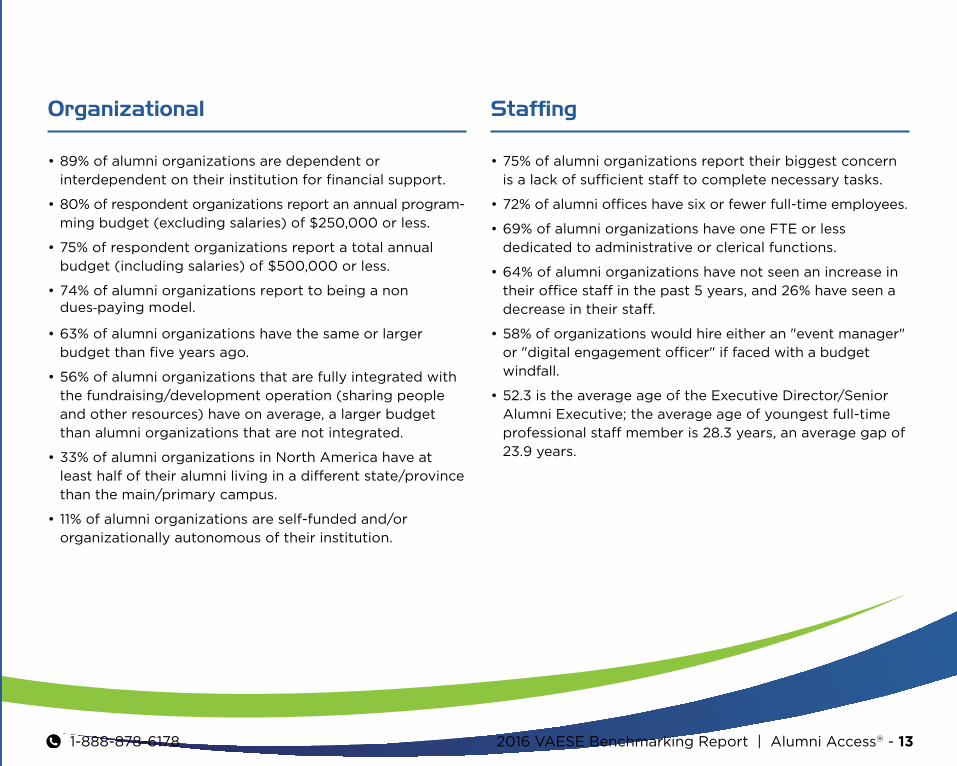
Organizational
• 89% of alumni organizations are dependent orinterdependent on their institution for financial support.
• 80% of respondent organizations report an annual program- ming budget (excluding salaries) of $250,000 or less.
• 75% of respondent organizations report a total annualbudget (including salaries) of $500,000 or less.
• 74% of alumni organizations report to being a non dues-paying model.
• 63% of alumni organizations have the same or largerbudget than five years ago.
• 56% of alumni organizations that are fully integrated withthe fundraising/development operation (sharing peopleand other resources) have on average, a larger budgetthan alumni organizations that are not integrated.
• 33% of alumni organizations in North America have atleast half of their alumni living in a different state/provincethan the main/primary campus.
• 11% of alumni organizations are self-funded and/ororganizationally autonomous of their institution.
Staffing
• 75% of alumni organizations report their biggest concernis a lack of sufficient staff to complete necessary tasks.
• 72% of alumni offices have six or fewer full-time employees.
• 69% of alumni organizations have one FTE or lessdedicated to administrative or clerical functions.
• 64% of alumni organizations have not seen an increase intheir office staff in the past 5 years, and 26% have seen adecrease in their staff.
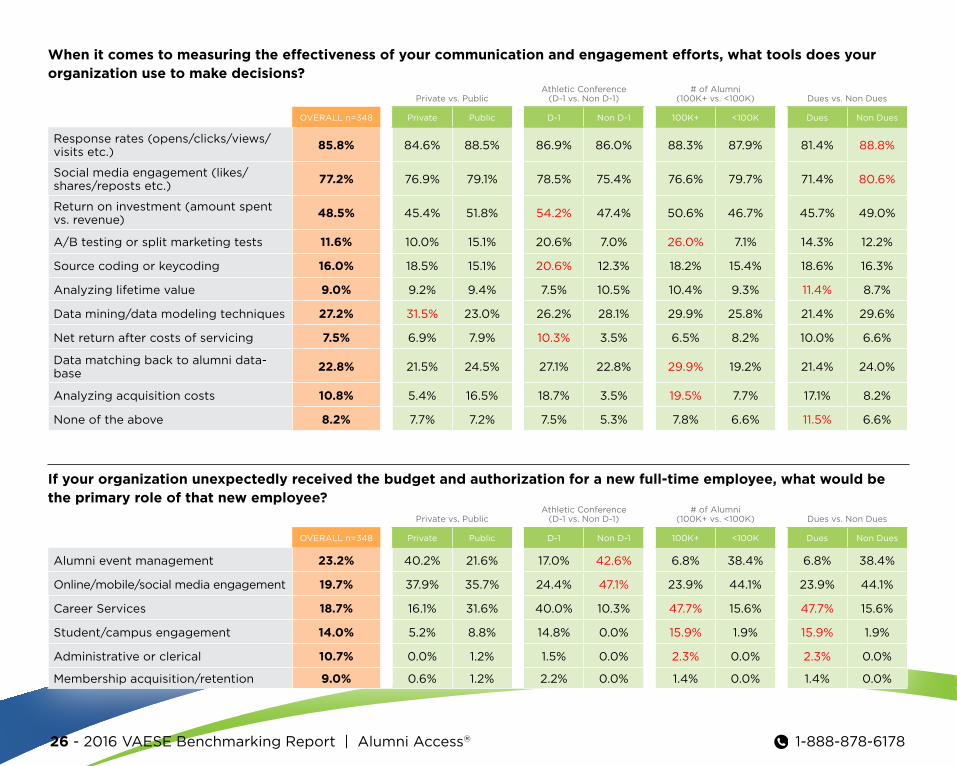
• 58% of organizations would hire either an "event manager"or "digital engagement officer" if faced with a budgetwindfall.
• 52.3 is the average age of the Executive Director/SeniorAlumni Executive; the average age of youngest full-timeprofessional staff member is 28.3 years, an average gap of23.9 years.
14 - 2016 VAESE Benchmarking Report | Alumni Access® 1-888-878-6178
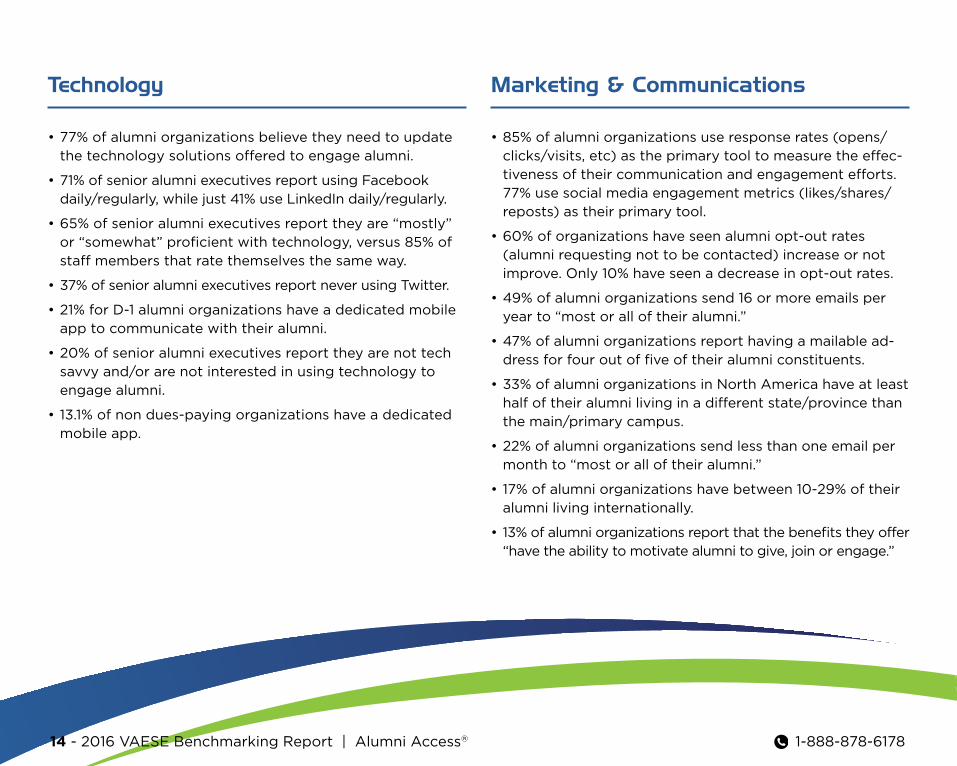
Technology
• 77% of alumni organizations believe they need to updatethe technology solutions offered to engage alumni.
• 71% of senior alumni executives report using Facebookdaily/regularly, while just 41% use LinkedIn daily/regularly.
• 65% of senior alumni executives report they are “mostly”or “somewhat” proficient with technology, versus 85% ofstaff members that rate themselves the same way.
• 37% of senior alumni executives report never using Twitter.
• 21% for D-1 alumni organizations have a dedicated mobileapp to communicate with their alumni.
• 20% of senior alumni executives report they are not techsavvy and/or are not interested in using technology toengage alumni.
• 13.1% of non dues-paying organizations have a dedicatedmobile app.
Marketing & Communications
• 85% of alumni organizations use response rates (opens/clicks/visits, etc) as the primary tool to measure the effec-tiveness of their communication and engagement efforts.77% use social media engagement metrics (likes/shares/reposts) as their primary tool.
• 60% of organizations have seen alumni opt-out rates(alumni requesting not to be contacted) increase or notimprove. Only 10% have seen a decrease in opt-out rates.
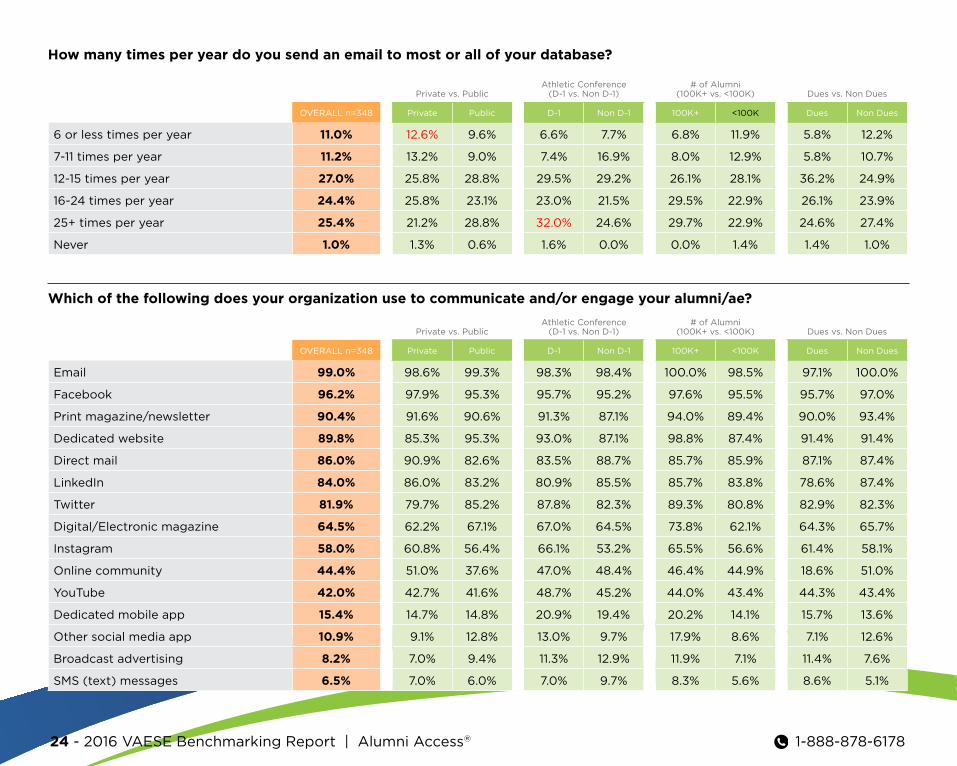
• 49% of alumni organizations send 16 or more emails peryear to “most or all of their alumni.”
• 47% of alumni organizations report having a mailable ad-dress for four out of five of their alumni constituents.
• 33% of alumni organizations in North America have at leasthalf of their alumni living in a different state/province thanthe main/primary campus.
• 22% of alumni organizations send less than one email permonth to “most or all of their alumni.”
• 17% of alumni organizations have between 10-29% of theiralumni living internationally.
• 13% of alumni organizations report that the benefits they offer“have the ability to motivate alumni to give, join or engage.”
1-888-878-6178 2016 VAESE Benchmarking Report | Alumni Access® - 15
Membership
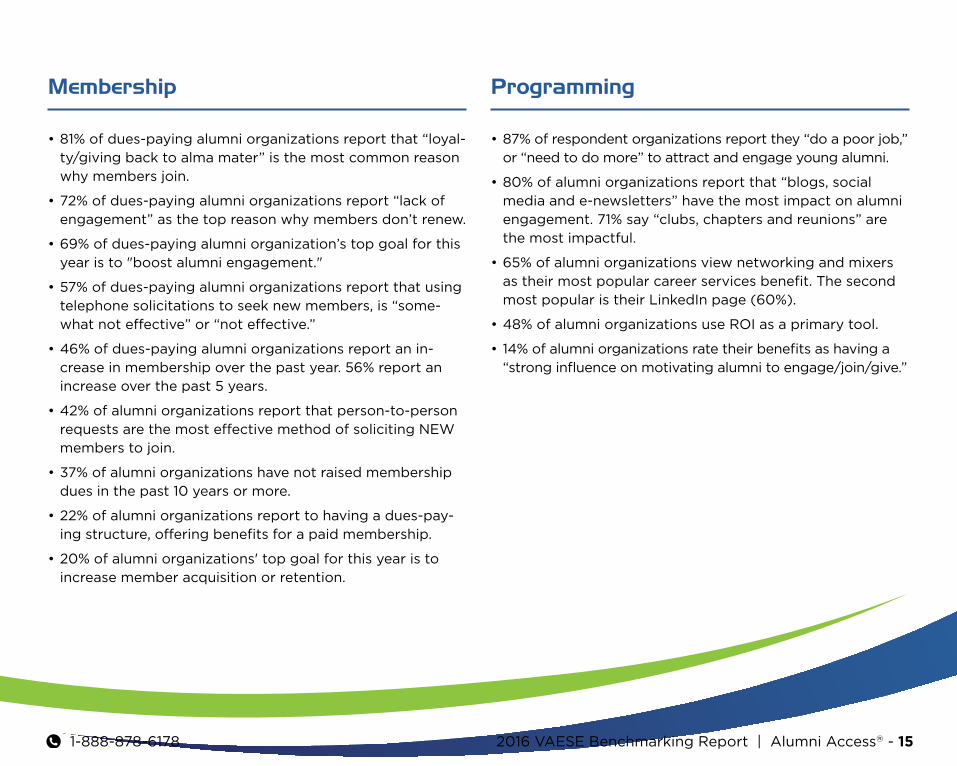
• 81% of dues-paying alumni organizations report that “loyal-ty/giving back to alma mater” is the most common reasonwhy members join.
• 72% of dues-paying alumni organizations report “lack ofengagement” as the top reason why members don’t renew.
• 69% of dues-paying alumni organization’s top goal for thisyear is to "boost alumni engagement."
• 57% of dues-paying alumni organizations report that usingtelephone solicitations to seek new members, is “some-what not effective” or “not effective.”
• 46% of dues-paying alumni organizations report an in-crease in membership over the past year. 56% report anincrease over the past 5 years.
• 42% of alumni organizations report that person-to-personrequests are the most effective method of soliciting NEWmembers to join.
• 37% of alumni organizations have not raised membershipdues in the past 10 years or more.
• 22% of alumni organizations report to having a dues-pay-ing structure, offering benefits for a paid membership.
• 20% of alumni organizations' top goal for this year is toincrease member acquisition or retention.
Programming
• 87% of respondent organizations report they “do a poor job,”or “need to do more” to attract and engage young alumni.
• 80% of alumni organizations report that “blogs, socialmedia and e-newsletters” have the most impact on alumniengagement. 71% say “clubs, chapters and reunions” arethe most impactful.
• 65% of alumni organizations view networking and mixersas their most popular career services benefit. The secondmost popular is their LinkedIn page (60%).
• 48% of alumni organizations use ROI as a primary tool.
• 14% of alumni organizations rate their benefits as having a“strong influence on motivating alumni to engage/join/give.”
16 - 2016 VAESE Benchmarking Report | Alumni Access® 1-888-878-6178
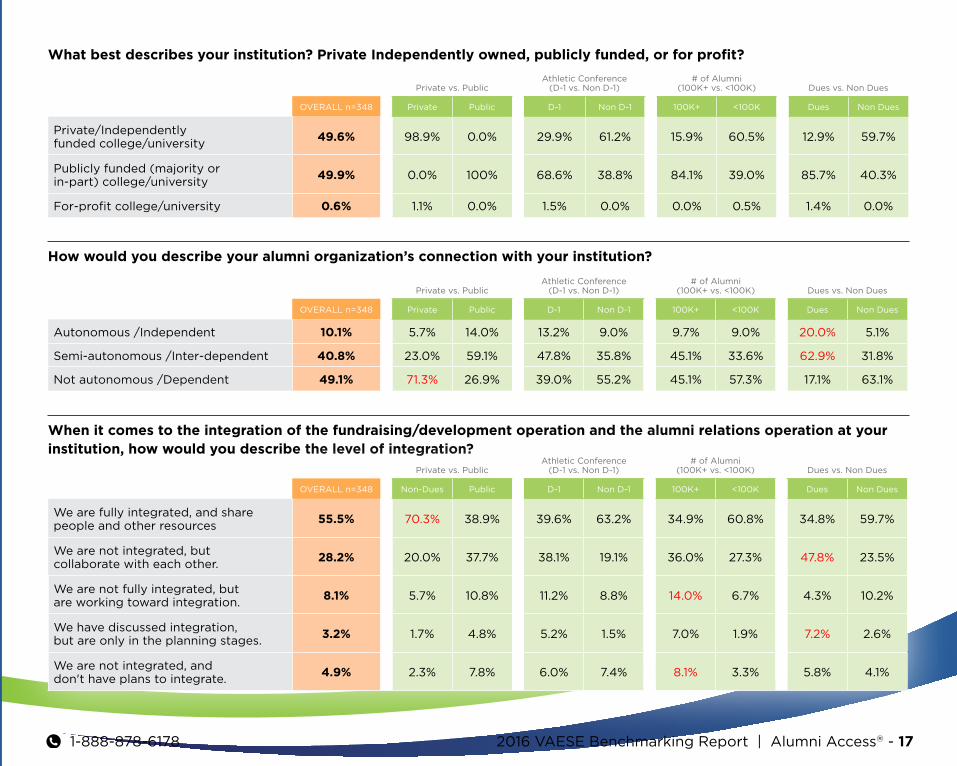
What best describes your institution? Private Independently owned, publicly funded, or for profit?
Private vs. PublicAthletic Conference
(D-1 vs. Non D-1)# of Alumni
(100K+ vs. <100K) Dues vs. Non Dues
OVERALL n=348 Private Public D-1 Non D-1 100K+ <100K Dues Non Dues
Private/Independently funded college/university
49.6% 98.9% 0.0% 29.9% 61.2% 15.9% 60.5% 12.9% 59.7%
Publicly funded (majority or in-part) college/university
49.9% 0.0% 100% 68.6% 38.8% 84.1% 39.0% 85.7% 40.3%
For-profit college/university 0.6% 1.1% 0.0% 1.5% 0.0% 0.0% 0.5% 1.4% 0.0%
How would you describe your alumni organization’s connection with your institution?
Private vs. PublicAthletic Conference
(D-1 vs. Non D-1)# of Alumni
(100K+ vs. <100K) Dues vs. Non Dues
OVERALL n=348 Private Public D-1 Non D-1 100K+ <100K Dues Non Dues
Autonomous /Independent 10.1% 5.7% 14.0% 13.2% 9.0% 9.7% 9.0% 20.0% 5.1%
Semi-autonomous /Inter-dependent 40.8% 23.0% 59.1% 47.8% 35.8% 45.1% 33.6% 62.9% 31.8%
Not autonomous /Dependent 49.1% 71.3% 26.9% 39.0% 55.2% 45.1% 57.3% 17.1% 63.1%
When it comes to the integration of the fundraising/development operation and the alumni relations operation at your institution, how would you describe the level of integration?
Private vs. PublicAthletic Conference
(D-1 vs. Non D-1)# of Alumni
(100K+ vs. <100K) Dues vs. Non Dues
OVERALL n=348 Non-Dues Public D-1 Non D-1 100K+ <100K Dues Non Dues
We are fully integrated, and share people and other resources
55.5% 70.3% 38.9% 39.6% 63.2% 34.9% 60.8% 34.8% 59.7%
We are not integrated, but collaborate with each other.
28.2% 20.0% 37.7% 38.1% 19.1% 36.0% 27.3% 47.8% 23.5%
We are not fully integrated, but are working toward integration.
8.1% 5.7% 10.8% 11.2% 8.8% 14.0% 6.7% 4.3% 10.2%
We have discussed integration, but are only in the planning stages.
3.2% 1.7% 4.8% 5.2% 1.5% 7.0% 1.9% 7.2% 2.6%
We are not integrated, and don't have plans to integrate.
4.9% 2.3% 7.8% 6.0% 7.4% 8.1% 3.3% 5.8% 4.1%
Comparative Survey Data
In addition to offering the overall survey results, we have segmented the data into four pertinent segments. They include:
Private vs. Public: Identifies the type of institution as it relates to being a private or non-government owned/funded institution versus a publicly owned/funded institution. For the purposes of this specific comparison, we’ve excluded the very small percentage of for-profit institutions.
Athletic Conference: Identifies institutions associated with a NCAA Division 1 intercollegiate athletic conference for a majority of their student athletes, versus all other institutions, regardless of their NCAA, NAIA or other athletic conference affiliation.
Total Alumni: Identifies institutions that report to having 100,000 or more total alumni, versus those with less than 100,000 total alumni.
Dues-Paying Organizations vs. Non Dues-Paying: Identifies institutions that offer benefits for alumni paying a membership fee versus non dues-paying model in which alumni have equal access to alumni benefits/programming. For the purposes of this specific comparison, we’ve excluded the very small percentage of institutions offering a tiered benefits model for both donors and alumni.
1-888-878-6178 2016 VAESE Benchmarking Report | Alumni Access® - 17
What best describes your institution? Private Independently owned, publicly funded, or for profit?
Private vs. PublicAthletic Conference
(D-1 vs. Non D-1)# of Alumni
(100K+ vs. <100K) Dues vs. Non Dues
OVERALL n=348 Private Public D-1 Non D-1 100K+ <100K Dues Non Dues
Private/Independently funded college/university
49.6% 98.9% 0.0% 29.9% 61.2% 15.9% 60.5% 12.9% 59.7%
Publicly funded (majority or in-part) college/university
49.9% 0.0% 100% 68.6% 38.8% 84.1% 39.0% 85.7% 40.3%
For-profit college/university 0.6% 1.1% 0.0% 1.5% 0.0% 0.0% 0.5% 1.4% 0.0%
How would you describe your alumni organization’s connection with your institution?
Private vs. PublicAthletic Conference
(D-1 vs. Non D-1)# of Alumni
(100K+ vs. <100K) Dues vs. Non Dues
OVERALL n=348 Private Public D-1 Non D-1 100K+ <100K Dues Non Dues
Autonomous /Independent 10.1% 5.7% 14.0% 13.2% 9.0% 9.7% 9.0% 20.0% 5.1%
Semi-autonomous /Inter-dependent 40.8% 23.0% 59.1% 47.8% 35.8% 45.1% 33.6% 62.9% 31.8%
Not autonomous /Dependent 49.1% 71.3% 26.9% 39.0% 55.2% 45.1% 57.3% 17.1% 63.1%
When it comes to the integration of the fundraising/development operation and the alumni relations operation at your institution, how would you describe the level of integration?
Private vs. PublicAthletic Conference
(D-1 vs. Non D-1)# of Alumni
(100K+ vs. <100K) Dues vs. Non Dues
OVERALL n=348 Non-Dues Public D-1 Non D-1 100K+ <100K Dues Non Dues
We are fully integrated, and share people and other resources
55.5% 70.3% 38.9% 39.6% 63.2% 34.9% 60.8% 34.8% 59.7%
We are not integrated, but collaborate with each other.
28.2% 20.0% 37.7% 38.1% 19.1% 36.0% 27.3% 47.8% 23.5%
We are not fully integrated, but are working toward integration.
8.1% 5.7% 10.8% 11.2% 8.8% 14.0% 6.7% 4.3% 10.2%
We have discussed integration, but are only in the planning stages.
3.2% 1.7% 4.8% 5.2% 1.5% 7.0% 1.9% 7.2% 2.6%
We are not integrated, and don't have plans to integrate.
4.9% 2.3% 7.8% 6.0% 7.4% 8.1% 3.3% 5.8% 4.1%
18 - 2016 VAESE Benchmarking Report | Alumni Access® 1-888-878-6178
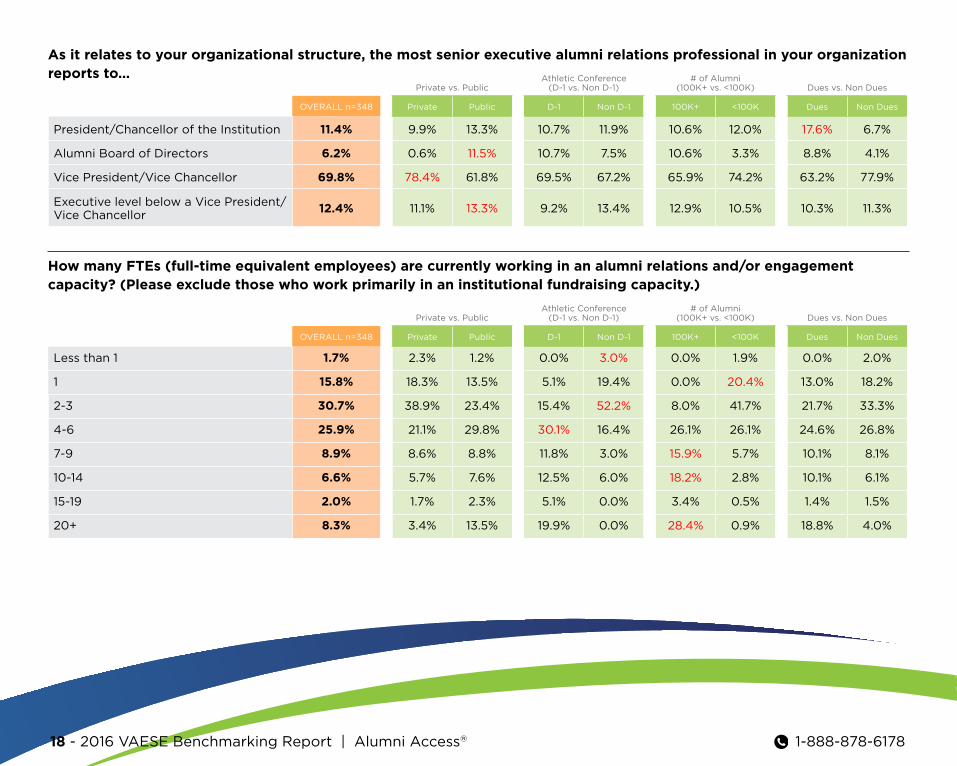
As it relates to your organizational structure, the most senior executive alumni relations professional in your organization reports to…
Private vs. PublicAthletic Conference
(D-1 vs. Non D-1)# of Alumni
(100K+ vs. <100K) Dues vs. Non Dues
OVERALL n=348 Private Public D-1 Non D-1 100K+ <100K Dues Non Dues
President/Chancellor of the Institution 11.4% 9.9% 13.3% 10.7% 11.9% 10.6% 12.0% 17.6% 6.7%
Alumni Board of Directors 6.2% 0.6% 11.5% 10.7% 7.5% 10.6% 3.3% 8.8% 4.1%
Vice President/Vice Chancellor 69.8% 78.4% 61.8% 69.5% 67.2% 65.9% 74.2% 63.2% 77.9%
Executive level below a Vice President/Vice Chancellor
12.4% 11.1% 13.3% 9.2% 13.4% 12.9% 10.5% 10.3% 11.3%
How many FTEs (full-time equivalent employees) are currently working in an alumni relations and/or engagement capacity? (Please exclude those who work primarily in an institutional fundraising capacity.)
Private vs. PublicAthletic Conference
(D-1 vs. Non D-1)# of Alumni
(100K+ vs. <100K) Dues vs. Non Dues
OVERALL n=348 Private Public D-1 Non D-1 100K+ <100K Dues Non Dues
Less than 1 1.7% 2.3% 1.2% 0.0% 3.0% 0.0% 1.9% 0.0% 2.0%
1 15.8% 18.3% 13.5% 5.1% 19.4% 0.0% 20.4% 13.0% 18.2%
2-3 30.7% 38.9% 23.4% 15.4% 52.2% 8.0% 41.7% 21.7% 33.3%
4-6 25.9% 21.1% 29.8% 30.1% 16.4% 26.1% 26.1% 24.6% 26.8%
7-9 8.9% 8.6% 8.8% 11.8% 3.0% 15.9% 5.7% 10.1% 8.1%
10-14 6.6% 5.7% 7.6% 12.5% 6.0% 18.2% 2.8% 10.1% 6.1%
15-19 2.0% 1.7% 2.3% 5.1% 0.0% 3.4% 0.5% 1.4% 1.5%
20+ 8.3% 3.4% 13.5% 19.9% 0.0% 28.4% 0.9% 18.8% 4.0%
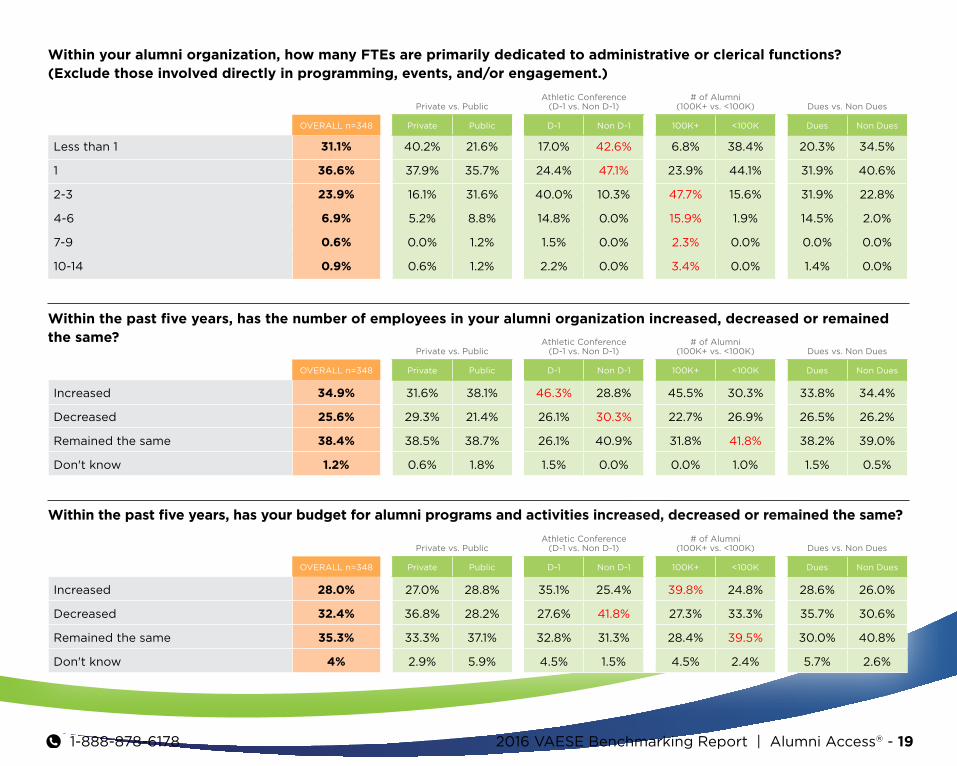
Within your alumni organization, how many FTEs are primarily dedicated to administrative or clerical functions? (Exclude those involved directly in programming, events, and/or engagement.)
Private vs. PublicAthletic Conference
(D-1 vs. Non D-1)# of Alumni
(100K+ vs. <100K) Dues vs. Non Dues
OVERALL n=348 Private Public D-1 Non D-1 100K+ <100K Dues Non Dues
Less than 1 31.1% 40.2% 21.6% 17.0% 42.6% 6.8% 38.4% 20.3% 34.5%
1 36.6% 37.9% 35.7% 24.4% 47.1% 23.9% 44.1% 31.9% 40.6%
2-3 23.9% 16.1% 31.6% 40.0% 10.3% 47.7% 15.6% 31.9% 22.8%
4-6 6.9% 5.2% 8.8% 14.8% 0.0% 15.9% 1.9% 14.5% 2.0%
7-9 0.6% 0.0% 1.2% 1.5% 0.0% 2.3% 0.0% 0.0% 0.0%
10-14 0.9% 0.6% 1.2% 2.2% 0.0% 3.4% 0.0% 1.4% 0.0%
Within the past five years, has the number of employees in your alumni organization increased, decreased or remained the same?
Private vs. PublicAthletic Conference
(D-1 vs. Non D-1)# of Alumni
(100K+ vs. <100K) Dues vs. Non Dues
OVERALL n=348 Private Public D-1 Non D-1 100K+ <100K Dues Non Dues
Increased 34.9% 31.6% 38.1% 46.3% 28.8% 45.5% 30.3% 33.8% 34.4%
Decreased 25.6% 29.3% 21.4% 26.1% 30.3% 22.7% 26.9% 26.5% 26.2%
Remained the same 38.4% 38.5% 38.7% 26.1% 40.9% 31.8% 41.8% 38.2% 39.0%
Don't know 1.2% 0.6% 1.8% 1.5% 0.0% 0.0% 1.0% 1.5% 0.5%
Within the past five years, has your budget for alumni programs and activities increased, decreased or remained the same?
Private vs. PublicAthletic Conference
(D-1 vs. Non D-1)# of Alumni
(100K+ vs. <100K) Dues vs. Non Dues
OVERALL n=348 Private Public D-1 Non D-1 100K+ <100K Dues Non Dues
Increased 28.0% 27.0% 28.8% 35.1% 25.4% 39.8% 24.8% 28.6% 26.0%
Decreased 32.4% 36.8% 28.2% 27.6% 41.8% 27.3% 33.3% 35.7% 30.6%
Remained the same 35.3% 33.3% 37.1% 32.8% 31.3% 28.4% 39.5% 30.0% 40.8%
Don't know 4% 2.9% 5.9% 4.5% 1.5% 4.5% 2.4% 5.7% 2.6%
1-888-878-6178 2016 VAESE Benchmarking Report | Alumni Access® - 19
Within your alumni organization, how many FTEs are primarily dedicated to administrative or clerical functions? (Exclude those involved directly in programming, events, and/or engagement.)
Private vs. PublicAthletic Conference
(D-1 vs. Non D-1)# of Alumni
(100K+ vs. <100K) Dues vs. Non Dues
OVERALL n=348 Private Public D-1 Non D-1 100K+ <100K Dues Non Dues
Less than 1 31.1% 40.2% 21.6% 17.0% 42.6% 6.8% 38.4% 20.3% 34.5%
1 36.6% 37.9% 35.7% 24.4% 47.1% 23.9% 44.1% 31.9% 40.6%
2-3 23.9% 16.1% 31.6% 40.0% 10.3% 47.7% 15.6% 31.9% 22.8%
4-6 6.9% 5.2% 8.8% 14.8% 0.0% 15.9% 1.9% 14.5% 2.0%
7-9 0.6% 0.0% 1.2% 1.5% 0.0% 2.3% 0.0% 0.0% 0.0%
10-14 0.9% 0.6% 1.2% 2.2% 0.0% 3.4% 0.0% 1.4% 0.0%
Within the past five years, has the number of employees in your alumni organization increased, decreased or remained the same?
Private vs. PublicAthletic Conference
(D-1 vs. Non D-1)# of Alumni
(100K+ vs. <100K) Dues vs. Non Dues
OVERALL n=348 Private Public D-1 Non D-1 100K+ <100K Dues Non Dues
Increased 34.9% 31.6% 38.1% 46.3% 28.8% 45.5% 30.3% 33.8% 34.4%
Decreased 25.6% 29.3% 21.4% 26.1% 30.3% 22.7% 26.9% 26.5% 26.2%
Remained the same 38.4% 38.5% 38.7% 26.1% 40.9% 31.8% 41.8% 38.2% 39.0%
Don't know 1.2% 0.6% 1.8% 1.5% 0.0% 0.0% 1.0% 1.5% 0.5%
Within the past five years, has your budget for alumni programs and activities increased, decreased or remained the same?
Private vs. PublicAthletic Conference
(D-1 vs. Non D-1)# of Alumni
(100K+ vs. <100K) Dues vs. Non Dues
OVERALL n=348 Private Public D-1 Non D-1 100K+ <100K Dues Non Dues
Increased 28.0% 27.0% 28.8% 35.1% 25.4% 39.8% 24.8% 28.6% 26.0%
Decreased 32.4% 36.8% 28.2% 27.6% 41.8% 27.3% 33.3% 35.7% 30.6%
Remained the same 35.3% 33.3% 37.1% 32.8% 31.3% 28.4% 39.5% 30.0% 40.8%
Don't know 4% 2.9% 5.9% 4.5% 1.5% 4.5% 2.4% 5.7% 2.6%
20 - 2016 VAESE Benchmarking Report | Alumni Access® 1-888-878-6178
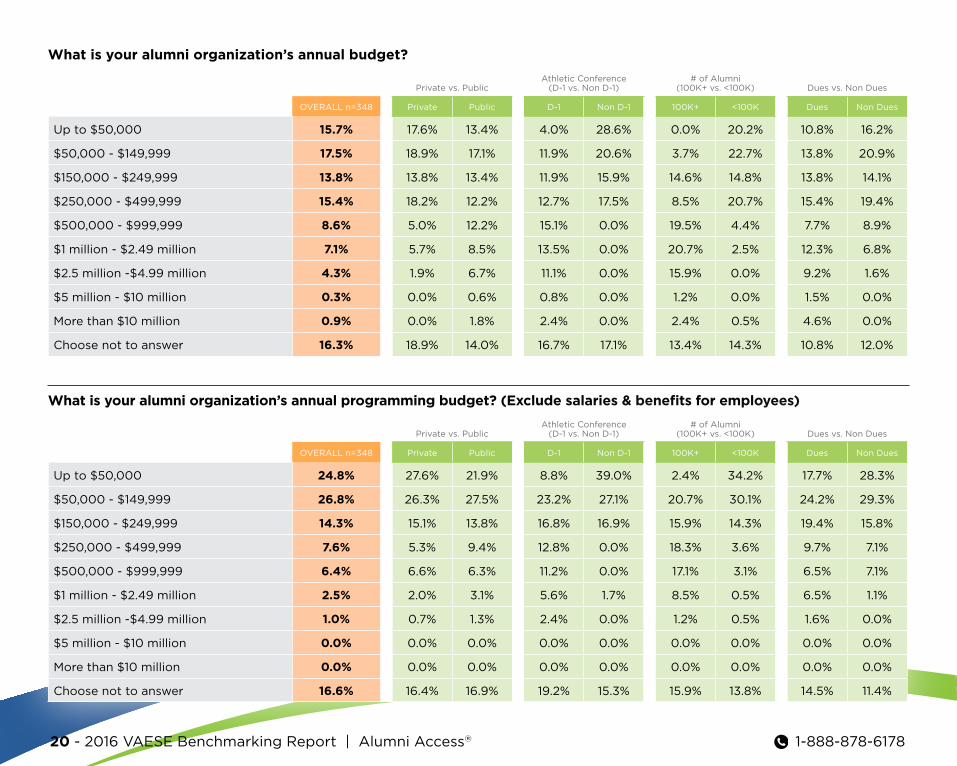
What is your alumni organization’s annual budget?
Private vs. PublicAthletic Conference
(D-1 vs. Non D-1)# of Alumni
(100K+ vs. <100K) Dues vs. Non Dues
OVERALL n=348 Private Public D-1 Non D-1 100K+ <100K Dues Non Dues
Up to $50,000 15.7% 17.6% 13.4% 4.0% 28.6% 0.0% 20.2% 10.8% 16.2%
$50,000 - $149,999 17.5% 18.9% 17.1% 11.9% 20.6% 3.7% 22.7% 13.8% 20.9%
$150,000 - $249,999 13.8% 13.8% 13.4% 11.9% 15.9% 14.6% 14.8% 13.8% 14.1%
$250,000 - $499,999 15.4% 18.2% 12.2% 12.7% 17.5% 8.5% 20.7% 15.4% 19.4%
$500,000 - $999,999 8.6% 5.0% 12.2% 15.1% 0.0% 19.5% 4.4% 7.7% 8.9%
$1 million - $2.49 million 7.1% 5.7% 8.5% 13.5% 0.0% 20.7% 2.5% 12.3% 6.8%
$2.5 million -$4.99 million 4.3% 1.9% 6.7% 11.1% 0.0% 15.9% 0.0% 9.2% 1.6%
$5 million - $10 million 0.3% 0.0% 0.6% 0.8% 0.0% 1.2% 0.0% 1.5% 0.0%
More than $10 million 0.9% 0.0% 1.8% 2.4% 0.0% 2.4% 0.5% 4.6% 0.0%
Choose not to answer 16.3% 18.9% 14.0% 16.7% 17.1% 13.4% 14.3% 10.8% 12.0%
What is your alumni organization’s annual programming budget? (Exclude salaries & benefits for employees)
Private vs. PublicAthletic Conference
(D-1 vs. Non D-1)# of Alumni
(100K+ vs. <100K) Dues vs. Non Dues
OVERALL n=348 Private Public D-1 Non D-1 100K+ <100K Dues Non Dues
Up to $50,000 24.8% 27.6% 21.9% 8.8% 39.0% 2.4% 34.2% 17.7% 28.3%
$50,000 - $149,999 26.8% 26.3% 27.5% 23.2% 27.1% 20.7% 30.1% 24.2% 29.3%
$150,000 - $249,999 14.3% 15.1% 13.8% 16.8% 16.9% 15.9% 14.3% 19.4% 15.8%
$250,000 - $499,999 7.6% 5.3% 9.4% 12.8% 0.0% 18.3% 3.6% 9.7% 7.1%
$500,000 - $999,999 6.4% 6.6% 6.3% 11.2% 0.0% 17.1% 3.1% 6.5% 7.1%
$1 million - $2.49 million 2.5% 2.0% 3.1% 5.6% 1.7% 8.5% 0.5% 6.5% 1.1%
$2.5 million -$4.99 million 1.0% 0.7% 1.3% 2.4% 0.0% 1.2% 0.5% 1.6% 0.0%
$5 million - $10 million 0.0% 0.0% 0.0% 0.0% 0.0% 0.0% 0.0% 0.0% 0.0%
More than $10 million 0.0% 0.0% 0.0% 0.0% 0.0% 0.0% 0.0% 0.0% 0.0%
Choose not to answer 16.6% 16.4% 16.9% 19.2% 15.3% 15.9% 13.8% 14.5% 11.4%
1-888-878-6178 2016 VAESE Benchmarking Report | Alumni Access® - 21
What is your alumni organization’s annual budget?
Private vs. PublicAthletic Conference
(D-1 vs. Non D-1)# of Alumni
(100K+ vs. <100K) Dues vs. Non Dues
OVERALL n=348 Private Public D-1 Non D-1 100K+ <100K Dues Non Dues
Up to $50,000 15.7% 17.6% 13.4% 4.0% 28.6% 0.0% 20.2% 10.8% 16.2%
$50,000 - $149,999 17.5% 18.9% 17.1% 11.9% 20.6% 3.7% 22.7% 13.8% 20.9%
$150,000 - $249,999 13.8% 13.8% 13.4% 11.9% 15.9% 14.6% 14.8% 13.8% 14.1%
$250,000 - $499,999 15.4% 18.2% 12.2% 12.7% 17.5% 8.5% 20.7% 15.4% 19.4%
$500,000 - $999,999 8.6% 5.0% 12.2% 15.1% 0.0% 19.5% 4.4% 7.7% 8.9%
$1 million - $2.49 million 7.1% 5.7% 8.5% 13.5% 0.0% 20.7% 2.5% 12.3% 6.8%
$2.5 million -$4.99 million 4.3% 1.9% 6.7% 11.1% 0.0% 15.9% 0.0% 9.2% 1.6%
$5 million - $10 million 0.3% 0.0% 0.6% 0.8% 0.0% 1.2% 0.0% 1.5% 0.0%
More than $10 million 0.9% 0.0% 1.8% 2.4% 0.0% 2.4% 0.5% 4.6% 0.0%
Choose not to answer 16.3% 18.9% 14.0% 16.7% 17.1% 13.4% 14.3% 10.8% 12.0%
What is your alumni organization’s annual programming budget? (Exclude salaries & benefits for employees)
Private vs. PublicAthletic Conference
(D-1 vs. Non D-1)# of Alumni
(100K+ vs. <100K) Dues vs. Non Dues
OVERALL n=348 Private Public D-1 Non D-1 100K+ <100K Dues Non Dues
Up to $50,000 24.8% 27.6% 21.9% 8.8% 39.0% 2.4% 34.2% 17.7% 28.3%
$50,000 - $149,999 26.8% 26.3% 27.5% 23.2% 27.1% 20.7% 30.1% 24.2% 29.3%
$150,000 - $249,999 14.3% 15.1% 13.8% 16.8% 16.9% 15.9% 14.3% 19.4% 15.8%
$250,000 - $499,999 7.6% 5.3% 9.4% 12.8% 0.0% 18.3% 3.6% 9.7% 7.1%
$500,000 - $999,999 6.4% 6.6% 6.3% 11.2% 0.0% 17.1% 3.1% 6.5% 7.1%
$1 million - $2.49 million 2.5% 2.0% 3.1% 5.6% 1.7% 8.5% 0.5% 6.5% 1.1%
$2.5 million -$4.99 million 1.0% 0.7% 1.3% 2.4% 0.0% 1.2% 0.5% 1.6% 0.0%
$5 million - $10 million 0.0% 0.0% 0.0% 0.0% 0.0% 0.0% 0.0% 0.0% 0.0%
More than $10 million 0.0% 0.0% 0.0% 0.0% 0.0% 0.0% 0.0% 0.0% 0.0%
Choose not to answer 16.6% 16.4% 16.9% 19.2% 15.3% 15.9% 13.8% 14.5% 11.4%
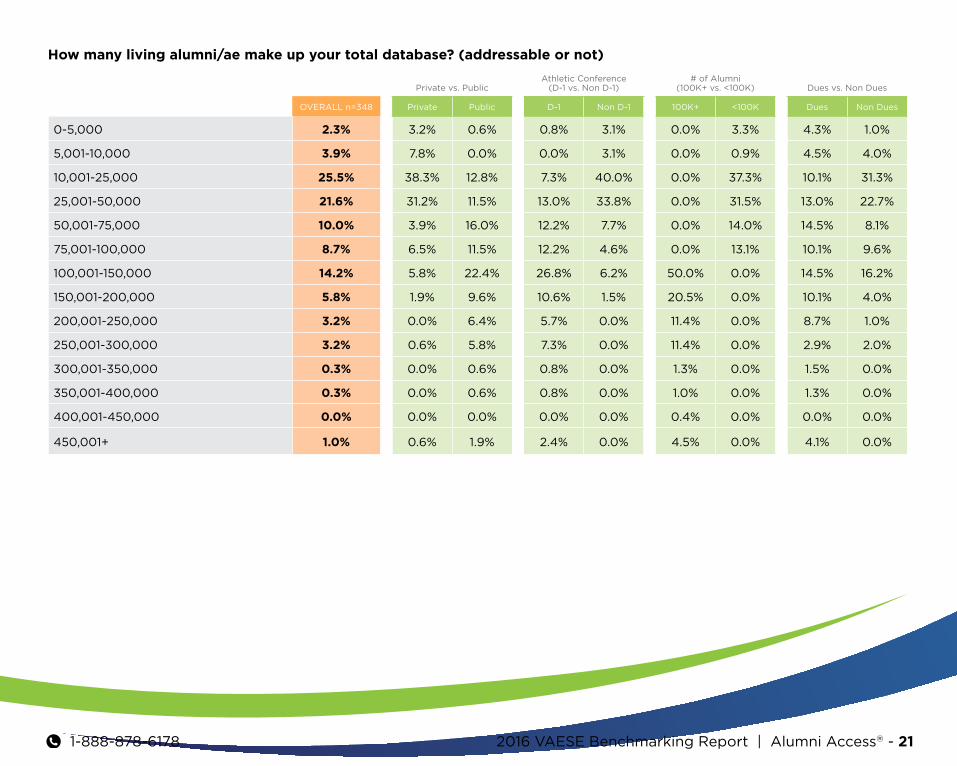
How many living alumni/ae make up your total database? (addressable or not)
Private vs. PublicAthletic Conference
(D-1 vs. Non D-1)# of Alumni
(100K+ vs. <100K) Dues vs. Non Dues
OVERALL n=348 Private Public D-1 Non D-1 100K+ <100K Dues Non Dues
0-5,000 2.3% 3.2% 0.6% 0.8% 3.1% 0.0% 3.3% 4.3% 1.0%
5,001-10,000 3.9% 7.8% 0.0% 0.0% 3.1% 0.0% 0.9% 4.5% 4.0%
10,001-25,000 25.5% 38.3% 12.8% 7.3% 40.0% 0.0% 37.3% 10.1% 31.3%
25,001-50,000 21.6% 31.2% 11.5% 13.0% 33.8% 0.0% 31.5% 13.0% 22.7%
50,001-75,000 10.0% 3.9% 16.0% 12.2% 7.7% 0.0% 14.0% 14.5% 8.1%
75,001-100,000 8.7% 6.5% 11.5% 12.2% 4.6% 0.0% 13.1% 10.1% 9.6%
100,001-150,000 14.2% 5.8% 22.4% 26.8% 6.2% 50.0% 0.0% 14.5% 16.2%
150,001-200,000 5.8% 1.9% 9.6% 10.6% 1.5% 20.5% 0.0% 10.1% 4.0%
200,001-250,000 3.2% 0.0% 6.4% 5.7% 0.0% 11.4% 0.0% 8.7% 1.0%
250,001-300,000 3.2% 0.6% 5.8% 7.3% 0.0% 11.4% 0.0% 2.9% 2.0%
300,001-350,000 0.3% 0.0% 0.6% 0.8% 0.0% 1.3% 0.0% 1.5% 0.0%
350,001-400,000 0.3% 0.0% 0.6% 0.8% 0.0% 1.0% 0.0% 1.3% 0.0%
400,001-450,000 0.0% 0.0% 0.0% 0.0% 0.0% 0.4% 0.0% 0.0% 0.0%
450,001+ 1.0% 0.6% 1.9% 2.4% 0.0% 4.5% 0.0% 4.1% 0.0%
22 - 2016 VAESE Benchmarking Report | Alumni Access® 1-888-878-6178
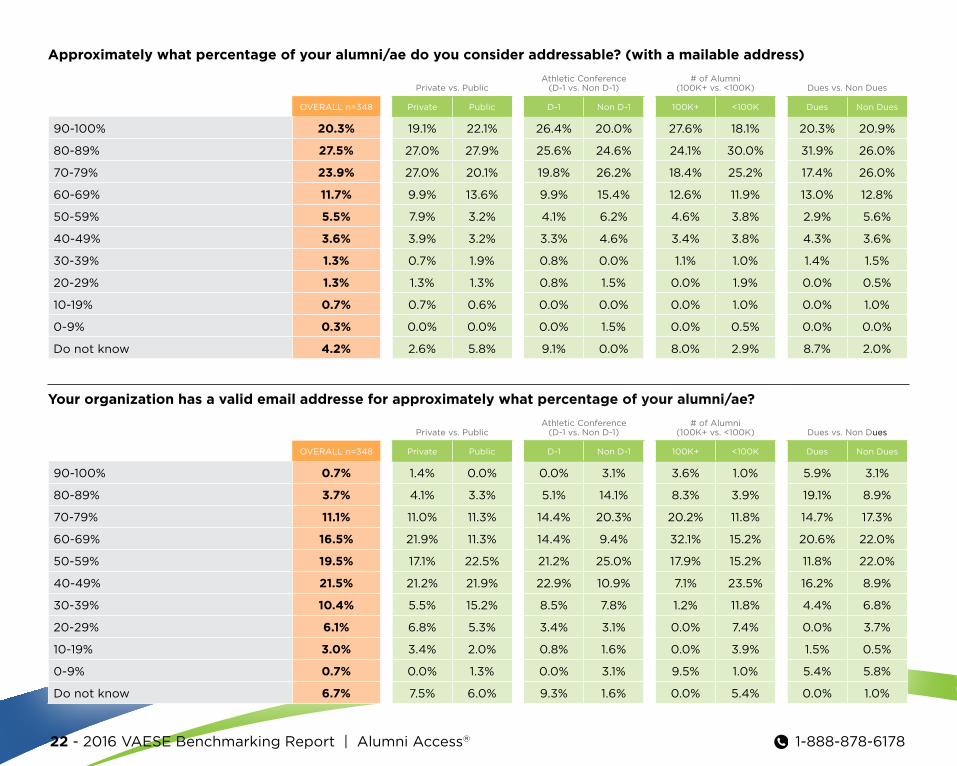
Approximately what percentage of your alumni/ae do you consider addressable? (with a mailable address)
Private vs. PublicAthletic Conference
(D-1 vs. Non D-1)# of Alumni
(100K+ vs. <100K) Dues vs. Non Dues
OVERALL n=348 Private Public D-1 Non D-1 100K+ <100K Dues Non Dues
90-100% 20.3% 19.1% 22.1% 26.4% 20.0% 27.6% 18.1% 20.3% 20.9%
80-89% 27.5% 27.0% 27.9% 25.6% 24.6% 24.1% 30.0% 31.9% 26.0%
70-79% 23.9% 27.0% 20.1% 19.8% 26.2% 18.4% 25.2% 17.4% 26.0%
60-69% 11.7% 9.9% 13.6% 9.9% 15.4% 12.6% 11.9% 13.0% 12.8%
50-59% 5.5% 7.9% 3.2% 4.1% 6.2% 4.6% 3.8% 2.9% 5.6%
40-49% 3.6% 3.9% 3.2% 3.3% 4.6% 3.4% 3.8% 4.3% 3.6%
30-39% 1.3% 0.7% 1.9% 0.8% 0.0% 1.1% 1.0% 1.4% 1.5%
20-29% 1.3% 1.3% 1.3% 0.8% 1.5% 0.0% 1.9% 0.0% 0.5%
10-19% 0.7% 0.7% 0.6% 0.0% 0.0% 0.0% 1.0% 0.0% 1.0%
0-9% 0.3% 0.0% 0.0% 0.0% 1.5% 0.0% 0.5% 0.0% 0.0%
Do not know 4.2% 2.6% 5.8% 9.1% 0.0% 8.0% 2.9% 8.7% 2.0%
Your organization has a valid email addresse for approximately what percentage of your alumni/ae?
Private vs. PublicAthletic Conference
(D-1 vs. Non D-1)# of Alumni
(100K+ vs. <100K) Dues vs. Non Dues
OVERALL n=348 Private Public D-1 Non D-1 100K+ <100K Dues Non Dues
90-100% 0.7% 1.4% 0.0% 0.0% 3.1% 3.6% 1.0% 5.9% 3.1%
80-89% 3.7% 4.1% 3.3% 5.1% 14.1% 8.3% 3.9% 19.1% 8.9%
70-79% 11.1% 11.0% 11.3% 14.4% 20.3% 20.2% 11.8% 14.7% 17.3%
60-69% 16.5% 21.9% 11.3% 14.4% 9.4% 32.1% 15.2% 20.6% 22.0%
50-59% 19.5% 17.1% 22.5% 21.2% 25.0% 17.9% 15.2% 11.8% 22.0%
40-49% 21.5% 21.2% 21.9% 22.9% 10.9% 7.1% 23.5% 16.2% 8.9%
30-39% 10.4% 5.5% 15.2% 8.5% 7.8% 1.2% 11.8% 4.4% 6.8%
20-29% 6.1% 6.8% 5.3% 3.4% 3.1% 0.0% 7.4% 0.0% 3.7%
10-19% 3.0% 3.4% 2.0% 0.8% 1.6% 0.0% 3.9% 1.5% 0.5%
0-9% 0.7% 0.0% 1.3% 0.0% 3.1% 9.5% 1.0% 5.4% 5.8%
Do not know 6.7% 7.5% 6.0% 9.3% 1.6% 0.0% 5.4% 0.0% 1.0%
1-888-878-6178 2016 VAESE Benchmarking Report | Alumni Access® - 23
Approximately what percentage of your alumni/ae do you consider addressable? (with a mailable address)
Private vs. PublicAthletic Conference
(D-1 vs. Non D-1)# of Alumni
(100K+ vs. <100K) Dues vs. Non Dues
OVERALL n=348 Private Public D-1 Non D-1 100K+ <100K Dues Non Dues
90-100% 20.3% 19.1% 22.1% 26.4% 20.0% 27.6% 18.1% 20.3% 20.9%
80-89% 27.5% 27.0% 27.9% 25.6% 24.6% 24.1% 30.0% 31.9% 26.0%
70-79% 23.9% 27.0% 20.1% 19.8% 26.2% 18.4% 25.2% 17.4% 26.0%
60-69% 11.7% 9.9% 13.6% 9.9% 15.4% 12.6% 11.9% 13.0% 12.8%
50-59% 5.5% 7.9% 3.2% 4.1% 6.2% 4.6% 3.8% 2.9% 5.6%
40-49% 3.6% 3.9% 3.2% 3.3% 4.6% 3.4% 3.8% 4.3% 3.6%
30-39% 1.3% 0.7% 1.9% 0.8% 0.0% 1.1% 1.0% 1.4% 1.5%
20-29% 1.3% 1.3% 1.3% 0.8% 1.5% 0.0% 1.9% 0.0% 0.5%
10-19% 0.7% 0.7% 0.6% 0.0% 0.0% 0.0% 1.0% 0.0% 1.0%
0-9% 0.3% 0.0% 0.0% 0.0% 1.5% 0.0% 0.5% 0.0% 0.0%
Do not know 4.2% 2.6% 5.8% 9.1% 0.0% 8.0% 2.9% 8.7% 2.0%
Your organization has a valid email addresse for approximately what percentage of your alumni/ae?
Private vs. PublicAthletic Conference
(D-1 vs. Non D-1)# of Alumni
(100K+ vs. <100K) Dues vs. Non Dues
OVERALL n=348 Private Public D-1 Non D-1 100K+ <100K Dues Non Dues
90-100% 0.7% 1.4% 0.0% 0.0% 3.1% 3.6% 1.0% 5.9% 3.1%
80-89% 3.7% 4.1% 3.3% 5.1% 14.1% 8.3% 3.9% 19.1% 8.9%
70-79% 11.1% 11.0% 11.3% 14.4% 20.3% 20.2% 11.8% 14.7% 17.3%
60-69% 16.5% 21.9% 11.3% 14.4% 9.4% 32.1% 15.2% 20.6% 22.0%
50-59% 19.5% 17.1% 22.5% 21.2% 25.0% 17.9% 15.2% 11.8% 22.0%
40-49% 21.5% 21.2% 21.9% 22.9% 10.9% 7.1% 23.5% 16.2% 8.9%
30-39% 10.4% 5.5% 15.2% 8.5% 7.8% 1.2% 11.8% 4.4% 6.8%
20-29% 6.1% 6.8% 5.3% 3.4% 3.1% 0.0% 7.4% 0.0% 3.7%
10-19% 3.0% 3.4% 2.0% 0.8% 1.6% 0.0% 3.9% 1.5% 0.5%
0-9% 0.7% 0.0% 1.3% 0.0% 3.1% 9.5% 1.0% 5.4% 5.8%
Do not know 6.7% 7.5% 6.0% 9.3% 1.6% 0.0% 5.4% 0.0% 1.0%
What percentage of your alumni/ae have opted out of receiving communication from your organization and/or institution?
Private vs. PublicAthletic Conference
(D-1 vs. Non D-1)# of Alumni
(100K+ vs. <100K) Dues vs. Non Dues
OVERALL n=348 Private Public D-1 Non D-1 100K+ <100K Dues Non Dues
90-100% 0.0% 0.0% 0.0% 0.0% 0.0% 0.0% 0.0% 0.0% 0.0%
80-89% 0.0% 0.0% 0.0% 0.0% 0.0% 0.0% 0.0% 0.0% 0.0%
70-79% 0.0% 0.0% 0.0% 0.0% 0.0% 0.0% 0.0% 0.0% 0.0%
60-69% 0.0% 0.0% 0.0% 0.0% 0.0% 0.0% 0.0% 0.0% 0.0%
50-59% 0.3% 0.7% 0.0% 0.0% 0.0% 0.0% 0.0% 1.4% 0.0%
40-49% 0.0% 0.0% 0.0% 0.0% 0.0% 0.0% 0.0% 0.0% 0.0%
30-39% 2.0% 2.8% 1.3% 2.5% 1.6% 1.2% 2.5% 4.3% 1.0%
20-29% 3.4% 2.8% 3.9% 1.7% 3.1% 4.7% 2.0% 4.3% 3.7%
10-19% 19.1% 20.0% 19.1% 20.2% 17.2% 21.2% 18.7% 24.6% 18.3%
0-9% 42.3% 44.8% 39.5% 33.6% 50.0% 32.9% 45.3% 37.7% 44.5%
Do not know 32.9% 29.0% 36.2% 42.0% 28.1% 40.0% 31.5% 27.5% 32.5%
Within the past five years, has the number of alumni opting out of communication with your organization/institution increased, decreased, or remained the same?
Private vs. PublicAthletic Conference
(D-1 vs. Non D-1)# of Alumni
(100K+ vs. <100K) Dues vs. Non Dues
OVERALL n=348 Private Public D-1 Non D-1 100K+ <100K Dues Non Dues
Increased 23.4% 20.7% 25.2% 23.0% 21.9% 27.3% 21.7% 20.6% 23.1%
Decreased 10.5% 12.7% 8.4% 9.8% 9.4% 8.0% 11.1% 8.8% 11.8%
Remained the same 37.8% 40.7% 34.8% 36.9% 40.6% 31.8% 39.6% 42.6% 39.0%
Do not know 28.3% 26.0% 31.6% 30.3% 28.1% 33.0% 27.5% 27.9% 26.2%
24 - 2016 VAESE Benchmarking Report | Alumni Access® 1-888-878-6178
How many times per year do you send an email to most or all of your database?
Private vs. PublicAthletic Conference
(D-1 vs. Non D-1)# of Alumni
(100K+ vs. <100K) Dues vs. Non Dues
OVERALL n=348 Private Public D-1 Non D-1 100K+ <100K Dues Non Dues
6 or less times per year 11.0% 12.6% 9.6% 6.6% 7.7% 6.8% 11.9% 5.8% 12.2%
7-11 times per year 11.2% 13.2% 9.0% 7.4% 16.9% 8.0% 12.9% 5.8% 10.7%
12-15 times per year 27.0% 25.8% 28.8% 29.5% 29.2% 26.1% 28.1% 36.2% 24.9%
16-24 times per year 24.4% 25.8% 23.1% 23.0% 21.5% 29.5% 22.9% 26.1% 23.9%
25+ times per year 25.4% 21.2% 28.8% 32.0% 24.6% 29.7% 22.9% 24.6% 27.4%
Never 1.0% 1.3% 0.6% 1.6% 0.0% 0.0% 1.4% 1.4% 1.0%
Which of the following does your organization use to communicate and/or engage your alumni/ae?
Private vs. PublicAthletic Conference
(D-1 vs. Non D-1)# of Alumni
(100K+ vs. <100K) Dues vs. Non Dues
OVERALL n=348 Private Public D-1 Non D-1 100K+ <100K Dues Non Dues
Email 99.0% 98.6% 99.3% 98.3% 98.4% 100.0% 98.5% 97.1% 100.0%
Facebook 96.2% 97.9% 95.3% 95.7% 95.2% 97.6% 95.5% 95.7% 97.0%
Print magazine/newsletter 90.4% 91.6% 90.6% 91.3% 87.1% 94.0% 89.4% 90.0% 93.4%
Dedicated website 89.8% 85.3% 95.3% 93.0% 87.1% 98.8% 87.4% 91.4% 91.4%
Direct mail 86.0% 90.9% 82.6% 83.5% 88.7% 85.7% 85.9% 87.1% 87.4%
LinkedIn 84.0% 86.0% 83.2% 80.9% 85.5% 85.7% 83.8% 78.6% 87.4%
Twitter 81.9% 79.7% 85.2% 87.8% 82.3% 89.3% 80.8% 82.9% 82.3%
Digital/Electronic magazine 64.5% 62.2% 67.1% 67.0% 64.5% 73.8% 62.1% 64.3% 65.7%
Instagram 58.0% 60.8% 56.4% 66.1% 53.2% 65.5% 56.6% 61.4% 58.1%
Online community 44.4% 51.0% 37.6% 47.0% 48.4% 46.4% 44.9% 18.6% 51.0%
YouTube 42.0% 42.7% 41.6% 48.7% 45.2% 44.0% 43.4% 44.3% 43.4%
Dedicated mobile app 15.4% 14.7% 14.8% 20.9% 19.4% 20.2% 14.1% 15.7% 13.6%
Other social media app 10.9% 9.1% 12.8% 13.0% 9.7% 17.9% 8.6% 7.1% 12.6%
Broadcast advertising 8.2% 7.0% 9.4% 11.3% 12.9% 11.9% 7.1% 11.4% 7.6%
SMS (text) messages 6.5% 7.0% 6.0% 7.0% 9.7% 8.3% 5.6% 8.6% 5.1%
Within the first year of graduation, how many gift solicitations does your institution typically send to new graduates?
Private vs. PublicAthletic Conference
(D-1 vs. Non D-1)# of Alumni
(100K+ vs. <100K) Dues vs. Non Dues
OVERALL n=348 Private Public D-1 Non D-1 100K+ <100K Dues Non Dues
1 24.5% 18.0% 31.2% 23.1% 27.1% 29.3% 23.8% 23.9% 26.9%
2 29.0% 31.6% 26.8% 28.8% 25.4% 29.3% 30.3% 22.4% 29.7%
3 14.1% 15.0% 13.0% 13.5% 13.6% 9.3% 16.2% 16.4% 13.7%
4 7.4% 11.3% 3.6% 4.8% 8.5% 6.7% 5.9% 3.0% 8.2%
5 3.7% 6.0% 1.4% 5.8% 5.1% 2.7% 3.8% 4.5% 3.8%
6 or more 3.0% 5.3% 0.7% 1.0% 8.5% 1.3% 3.8% 3.0% 2.7%
We do not send gift solicitations to new graduates
18.2% 12.8% 23.2% 23.1% 11.9% 21.3% 16.2% 26.9% 14.8%
When it comes to offering alumni benefits, how would you rate your benefits for their influence on motivating alumni to engage/join/give?
Private vs. PublicAthletic Conference
(D-1 vs. Non D-1)# of Alumni
(100K+ vs. <100K) Dues vs. Non Dues
OVERALL n=348 Private Public D-1 Non D-1 100K+ <100K Dues Non Dues
We provide a wide range of benefits that have a strong influence on moti-vating alumni to engage/join/give.
3.9% 2.4% 5.1% 4.8% 5.6% 4.0% 4.0% 9.0% 2.1%
We provide a wide range of benefits, but they have a limited impact on mo-tivating alumni to engage/join/give.
24.8% 16.9% 32.4% 31.7% 24.1% 45.3% 17.8% 34.3% 22.8%
We provide a few benefits, but they have a strong influence on motivating alumni to engage/join/give.
9.7% 12.2% 7.4% 10.6% 11.1% 4.0% 12.1% 10.4% 9.0%
The benefits we offer are not signif-icant, as we instead appeal to the philanthropic generosity or loyalty of alumni/ae to engage/join/give.
41.5% 43.5% 40.4% 39.4% 44.4% 34.7% 44.8% 38.8% 42.9%
We provide little or no benefits, as that’s not currently our focus.
20.2% 25.0% 14.7% 13.5% 14.8% 12.0% 21.3% 7.5% 23.3%
1-888-878-6178 2016 VAESE Benchmarking Report | Alumni Access® - 25
Within the first year of graduation, how many gift solicitations does your institution typically send to new graduates?
Private vs. PublicAthletic Conference
(D-1 vs. Non D-1)# of Alumni
(100K+ vs. <100K) Dues vs. Non Dues
OVERALL n=348 Private Public D-1 Non D-1 100K+ <100K Dues Non Dues
1 24.5% 18.0% 31.2% 23.1% 27.1% 29.3% 23.8% 23.9% 26.9%
2 29.0% 31.6% 26.8% 28.8% 25.4% 29.3% 30.3% 22.4% 29.7%
3 14.1% 15.0% 13.0% 13.5% 13.6% 9.3% 16.2% 16.4% 13.7%
4 7.4% 11.3% 3.6% 4.8% 8.5% 6.7% 5.9% 3.0% 8.2%
5 3.7% 6.0% 1.4% 5.8% 5.1% 2.7% 3.8% 4.5% 3.8%
6 or more 3.0% 5.3% 0.7% 1.0% 8.5% 1.3% 3.8% 3.0% 2.7%
We do not send gift solicitations to new graduates
18.2% 12.8% 23.2% 23.1% 11.9% 21.3% 16.2% 26.9% 14.8%
When it comes to offering alumni benefits, how would you rate your benefits for their influence on motivating alumni to engage/join/give?
Private vs. PublicAthletic Conference
(D-1 vs. Non D-1)# of Alumni
(100K+ vs. <100K) Dues vs. Non Dues
OVERALL n=348 Private Public D-1 Non D-1 100K+ <100K Dues Non Dues
We provide a wide range of benefits that have a strong influence on moti-vating alumni to engage/join/give.
3.9% 2.4% 5.1% 4.8% 5.6% 4.0% 4.0% 9.0% 2.1%
We provide a wide range of benefits, but they have a limited impact on mo-tivating alumni to engage/join/give.
24.8% 16.9% 32.4% 31.7% 24.1% 45.3% 17.8% 34.3% 22.8%
We provide a few benefits, but they have a strong influence on motivating alumni to engage/join/give.
9.7% 12.2% 7.4% 10.6% 11.1% 4.0% 12.1% 10.4% 9.0%
The benefits we offer are not signif-icant, as we instead appeal to the philanthropic generosity or loyalty of alumni/ae to engage/join/give.
41.5% 43.5% 40.4% 39.4% 44.4% 34.7% 44.8% 38.8% 42.9%
We provide little or no benefits, as that’s not currently our focus.
20.2% 25.0% 14.7% 13.5% 14.8% 12.0% 21.3% 7.5% 23.3%
26 - 2016 VAESE Benchmarking Report | Alumni Access® 1-888-878-6178
When it comes to measuring the effectiveness of your communication and engagement efforts, what tools does your organization use to make decisions?
Private vs. PublicAthletic Conference
(D-1 vs. Non D-1)# of Alumni
(100K+ vs. <100K) Dues vs. Non Dues
OVERALL n=348 Private Public D-1 Non D-1 100K+ <100K Dues Non Dues
Response rates (opens/clicks/views/visits etc.)
85.8% 84.6% 88.5% 86.9% 86.0% 88.3% 87.9% 81.4% 88.8%
Social media engagement (likes/shares/reposts etc.)
77.2% 76.9% 79.1% 78.5% 75.4% 76.6% 79.7% 71.4% 80.6%
Return on investment (amount spent vs. revenue)
48.5% 45.4% 51.8% 54.2% 47.4% 50.6% 46.7% 45.7% 49.0%
A/B testing or split marketing tests 11.6% 10.0% 15.1% 20.6% 7.0% 26.0% 7.1% 14.3% 12.2%
Source coding or keycoding 16.0% 18.5% 15.1% 20.6% 12.3% 18.2% 15.4% 18.6% 16.3%
Analyzing lifetime value 9.0% 9.2% 9.4% 7.5% 10.5% 10.4% 9.3% 11.4% 8.7%
Data mining/data modeling techniques 27.2% 31.5% 23.0% 26.2% 28.1% 29.9% 25.8% 21.4% 29.6%
Net return after costs of servicing 7.5% 6.9% 7.9% 10.3% 3.5% 6.5% 8.2% 10.0% 6.6%
Data matching back to alumni data-base
22.8% 21.5% 24.5% 27.1% 22.8% 29.9% 19.2% 21.4% 24.0%
Analyzing acquisition costs 10.8% 5.4% 16.5% 18.7% 3.5% 19.5% 7.7% 17.1% 8.2%
None of the above 8.2% 7.7% 7.2% 7.5% 5.3% 7.8% 6.6% 11.5% 6.6%
If your organization unexpectedly received the budget and authorization for a new full-time employee, what would be the primary role of that new employee?
Private vs. PublicAthletic Conference
(D-1 vs. Non D-1)# of Alumni
(100K+ vs. <100K) Dues vs. Non Dues
OVERALL n=348 Private Public D-1 Non D-1 100K+ <100K Dues Non Dues
Alumni event management 23.2% 40.2% 21.6% 17.0% 42.6% 6.8% 38.4% 6.8% 38.4%
Online/mobile/social media engagement 19.7% 37.9% 35.7% 24.4% 47.1% 23.9% 44.1% 23.9% 44.1%
Career Services 18.7% 16.1% 31.6% 40.0% 10.3% 47.7% 15.6% 47.7% 15.6%
Student/campus engagement 14.0% 5.2% 8.8% 14.8% 0.0% 15.9% 1.9% 15.9% 1.9%
Administrative or clerical 10.7% 0.0% 1.2% 1.5% 0.0% 2.3% 0.0% 2.3% 0.0%
Membership acquisition/retention 9.0% 0.6% 1.2% 2.2% 0.0% 1.4% 0.0% 1.4% 0.0%
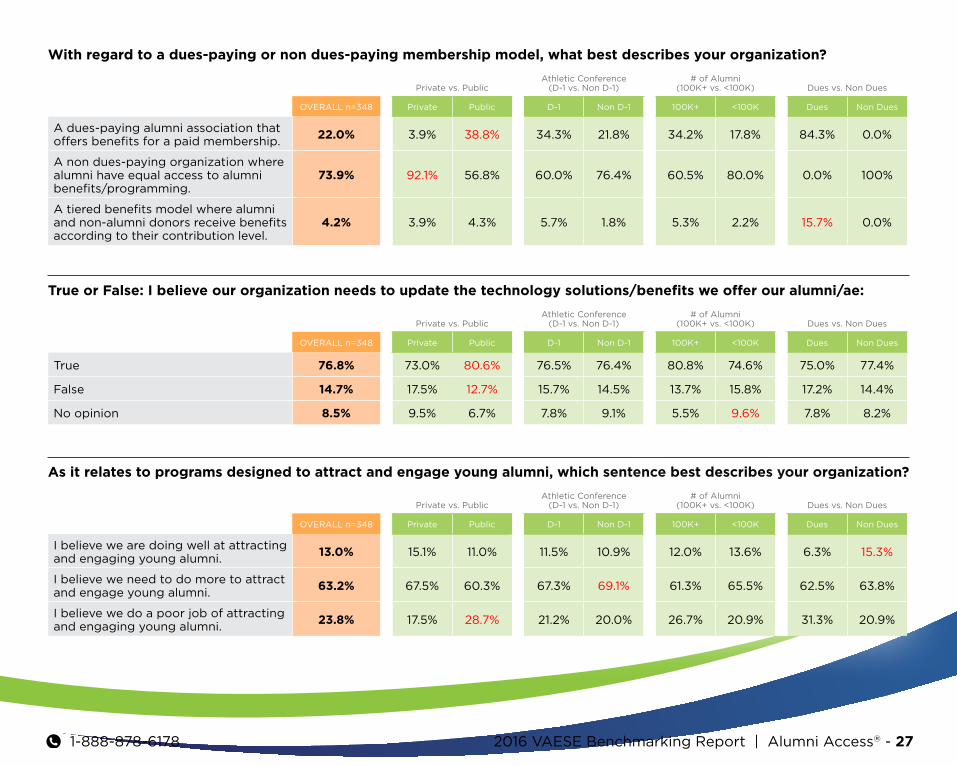
With regard to a dues-paying or non dues-paying membership model, what best describes your organization?
Private vs. PublicAthletic Conference
(D-1 vs. Non D-1)# of Alumni
(100K+ vs. <100K) Dues vs. Non Dues
OVERALL n=348 Private Public D-1 Non D-1 100K+ <100K Dues Non Dues
A dues-paying alumni association that offers benefits for a paid membership.
22.0% 3.9% 38.8% 34.3% 21.8% 34.2% 17.8% 84.3% 0.0%
A non dues-paying organization where alumni have equal access to alumni benefits/programming.
73.9% 92.1% 56.8% 60.0% 76.4% 60.5% 80.0% 0.0% 100%
A tiered benefits model where alumniand non-alumni donors receive benefitsaccording to their contribution level.
4.2% 3.9% 4.3% 5.7% 1.8% 5.3% 2.2% 15.7% 0.0%
True or False: I believe our organization needs to update the technology solutions/benefits we offer our alumni/ae:
Private vs. PublicAthletic Conference
(D-1 vs. Non D-1)# of Alumni
(100K+ vs. <100K) Dues vs. Non Dues
OVERALL n=348 Private Public D-1 Non D-1 100K+ <100K Dues Non Dues
True 76.8% 73.0% 80.6% 76.5% 76.4% 80.8% 74.6% 75.0% 77.4%
False 14.7% 17.5% 12.7% 15.7% 14.5% 13.7% 15.8% 17.2% 14.4%
No opinion 8.5% 9.5% 6.7% 7.8% 9.1% 5.5% 9.6% 7.8% 8.2%
As it relates to programs designed to attract and engage young alumni, which sentence best describes your organization?
Private vs. PublicAthletic Conference
(D-1 vs. Non D-1)# of Alumni
(100K+ vs. <100K) Dues vs. Non Dues
OVERALL n=348 Private Public D-1 Non D-1 100K+ <100K Dues Non Dues
I believe we are doing well at attracting and engaging young alumni.
13.0% 15.1% 11.0% 11.5% 10.9% 12.0% 13.6% 6.3% 15.3%
I believe we need to do more to attract and engage young alumni.
63.2% 67.5% 60.3% 67.3% 69.1% 61.3% 65.5% 62.5% 63.8%
I believe we do a poor job of attracting and engaging young alumni.
23.8% 17.5% 28.7% 21.2% 20.0% 26.7% 20.9% 31.3% 20.9%
1-888-878-6178 2016 VAESE Benchmarking Report | Alumni Access® - 27
When it comes to measuring the effectiveness of your communication and engagement efforts, what tools does your organization use to make decisions?
Private vs. PublicAthletic Conference
(D-1 vs. Non D-1)# of Alumni
(100K+ vs. <100K) Dues vs. Non Dues
OVERALL n=348 Private Public D-1 Non D-1 100K+ <100K Dues Non Dues
Response rates (opens/clicks/views/visits etc.)
85.8% 84.6% 88.5% 86.9% 86.0% 88.3% 87.9% 81.4% 88.8%
Social media engagement (likes/shares/reposts etc.)
77.2% 76.9% 79.1% 78.5% 75.4% 76.6% 79.7% 71.4% 80.6%
Return on investment (amount spent vs. revenue)
48.5% 45.4% 51.8% 54.2% 47.4% 50.6% 46.7% 45.7% 49.0%
A/B testing or split marketing tests 11.6% 10.0% 15.1% 20.6% 7.0% 26.0% 7.1% 14.3% 12.2%
Source coding or keycoding 16.0% 18.5% 15.1% 20.6% 12.3% 18.2% 15.4% 18.6% 16.3%
Analyzing lifetime value 9.0% 9.2% 9.4% 7.5% 10.5% 10.4% 9.3% 11.4% 8.7%
Data mining/data modeling techniques 27.2% 31.5% 23.0% 26.2% 28.1% 29.9% 25.8% 21.4% 29.6%
Net return after costs of servicing 7.5% 6.9% 7.9% 10.3% 3.5% 6.5% 8.2% 10.0% 6.6%
Data matching back to alumni data-base
22.8% 21.5% 24.5% 27.1% 22.8% 29.9% 19.2% 21.4% 24.0%
Analyzing acquisition costs 10.8% 5.4% 16.5% 18.7% 3.5% 19.5% 7.7% 17.1% 8.2%
None of the above 8.2% 7.7% 7.2% 7.5% 5.3% 7.8% 6.6% 11.5% 6.6%
If your organization unexpectedly received the budget and authorization for a new full-time employee, what would be the primary role of that new employee?
Private vs. PublicAthletic Conference
(D-1 vs. Non D-1)# of Alumni
(100K+ vs. <100K) Dues vs. Non Dues
OVERALL n=348 Private Public D-1 Non D-1 100K+ <100K Dues Non Dues
Alumni event management 23.2% 40.2% 21.6% 17.0% 42.6% 6.8% 38.4% 6.8% 38.4%
Online/mobile/social media engagement 19.7% 37.9% 35.7% 24.4% 47.1% 23.9% 44.1% 23.9% 44.1%
Career Services 18.7% 16.1% 31.6% 40.0% 10.3% 47.7% 15.6% 47.7% 15.6%
Student/campus engagement 14.0% 5.2% 8.8% 14.8% 0.0% 15.9% 1.9% 15.9% 1.9%
Administrative or clerical 10.7% 0.0% 1.2% 1.5% 0.0% 2.3% 0.0% 2.3% 0.0%
Membership acquisition/retention 9.0% 0.6% 1.2% 2.2% 0.0% 1.4% 0.0% 1.4% 0.0%
With regard to a dues-paying or non dues-paying membership model, what best describes your organization?
Private vs. PublicAthletic Conference
(D-1 vs. Non D-1)# of Alumni
(100K+ vs. <100K) Dues vs. Non Dues
OVERALL n=348 Private Public D-1 Non D-1 100K+ <100K Dues Non Dues
A dues-paying alumni association that offers benefits for a paid membership.
22.0% 3.9% 38.8% 34.3% 21.8% 34.2% 17.8% 84.3% 0.0%
A non dues-paying organization where alumni have equal access to alumni benefits/programming.
73.9% 92.1% 56.8% 60.0% 76.4% 60.5% 80.0% 0.0% 100%
A tiered benefits model where alumni and non-alumni donors receive benefits according to their contribution level.
4.2% 3.9% 4.3% 5.7% 1.8% 5.3% 2.2% 15.7% 0.0%
True or False: I believe our organization needs to update the technology solutions/benefits we offer our alumni/ae:
Private vs. PublicAthletic Conference
(D-1 vs. Non D-1)# of Alumni
(100K+ vs. <100K) Dues vs. Non Dues
OVERALL n=348 Private Public D-1 Non D-1 100K+ <100K Dues Non Dues
True 76.8% 73.0% 80.6% 76.5% 76.4% 80.8% 74.6% 75.0% 77.4%
False 14.7% 17.5% 12.7% 15.7% 14.5% 13.7% 15.8% 17.2% 14.4%
No opinion 8.5% 9.5% 6.7% 7.8% 9.1% 5.5% 9.6% 7.8% 8.2%
As it relates to programs designed to attract and engage young alumni, which sentence best describes your organization?
Private vs. PublicAthletic Conference
(D-1 vs. Non D-1)# of Alumni
(100K+ vs. <100K) Dues vs. Non Dues
OVERALL n=348 Private Public D-1 Non D-1 100K+ <100K Dues Non Dues
I believe we are doing well at attracting and engaging young alumni.
13.0% 15.1% 11.0% 11.5% 10.9% 12.0% 13.6% 6.3% 15.3%
I believe we need to do more to attract and engage young alumni.
63.2% 67.5% 60.3% 67.3% 69.1% 61.3% 65.5% 62.5% 63.8%
I believe we do a poor job of attracting and engaging young alumni.
23.8% 17.5% 28.7% 21.2% 20.0% 26.7% 20.9% 31.3% 20.9%
28 - 2016 VAESE Benchmarking Report | Alumni Access® 1-888-878-6178
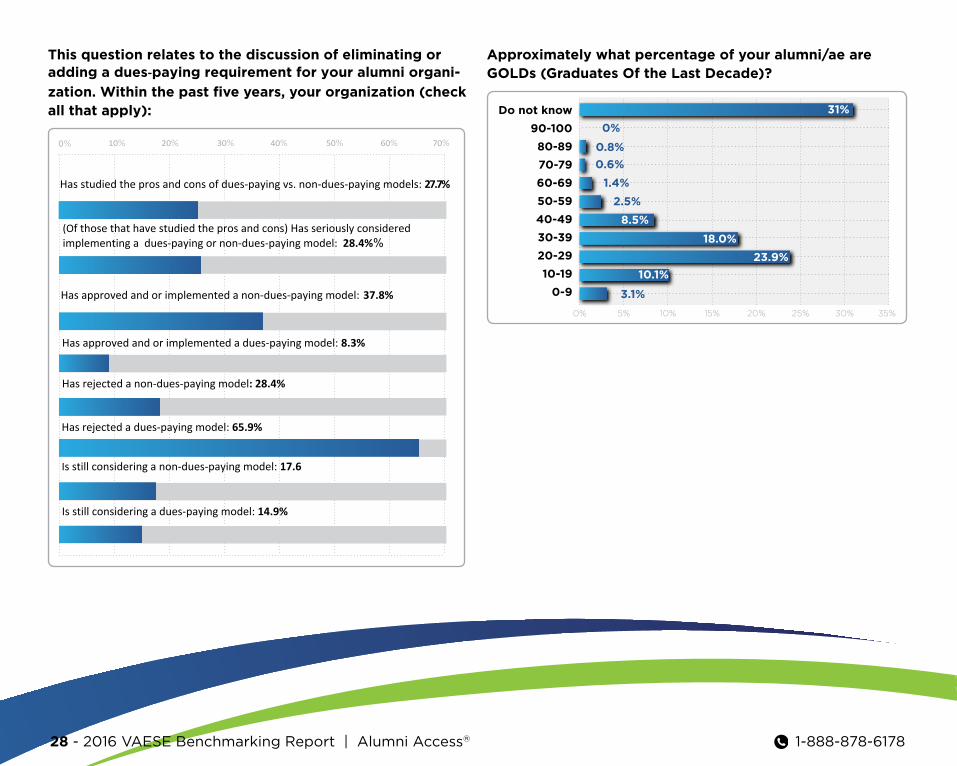
This question relates to the discussion of eliminating or adding a dues-paying requirement for your alumni organi-
zation. Within the past five years, your organization (check all that apply):
0% 10% 20% 30% 40% 50% 60% 70%
Has studied the pros and cons of dues-paying vs. non-dues-paying models: 27.7%
(Of those that have studied the pros and cons) Has seriously considered implementing a dues-paying or non-dues-paying model: 28.4%%
Has approved and or implemented a non-dues-paying model: 37.8%
Has approved and or implemented a dues-paying model: 8.3%
Has rejected a non-dues-paying model: 28.4%
Has rejected a dues-paying model: 65.9%
Is still considering a non-dues-paying model: 17.6
Is still considering a dues-paying model: 14.9%
Approximately what percentage of your alumni/ae are GOLDs (Graduates Of the Last Decade)?
0% 5% 10% 15% 20% 25% 30% 35%
Do not know
90-100
80-89
70-79
60-69
50-59
40-49
30-39
20-29
10-19
0-9
31%
0%
0.8%
0.6%
1.4%
2.5%
3.1%
8.5%
18.0%
23.9%
10.1%
1-888-878-6178 2016 VAESE Benchmarking Report | Alumni Access® - 29
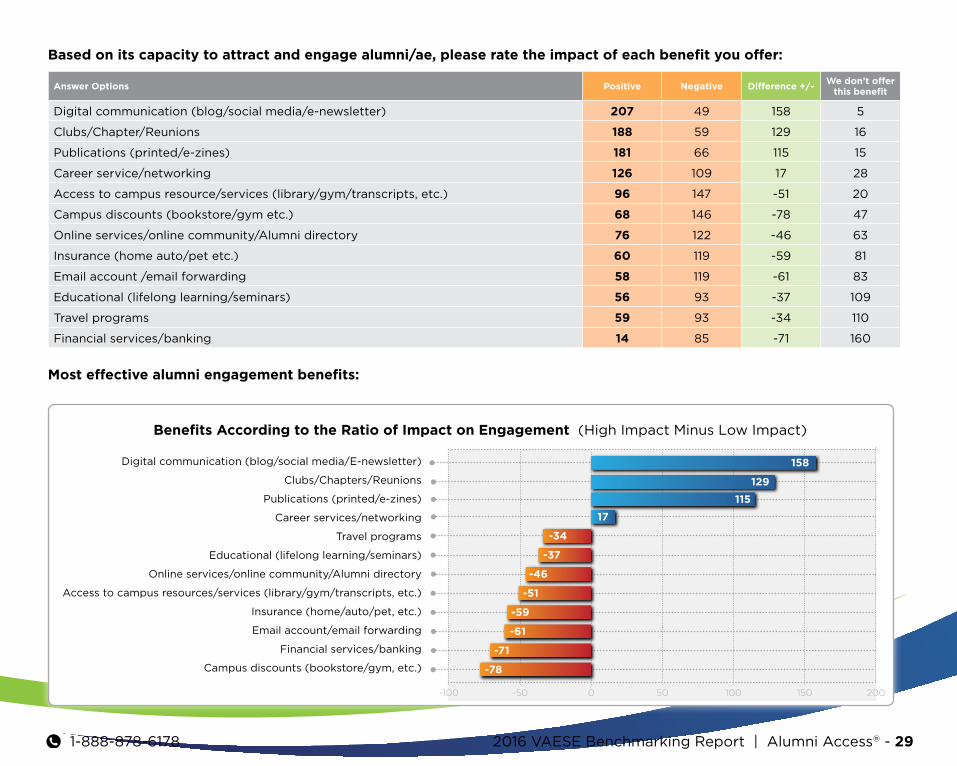
Based on its capacity to attract and engage alumni/ae, please rate the impact of each benefit you offer:
Answer Options Positive Negative Difference +/-We don’t offer
this benefit
Digital communication (blog/social media/e-newsletter) 207 49 158 5
Clubs/Chapter/Reunions 188 59 129 16
Publications (printed/e-zines) 181 66 115 15
Career service/networking 126 109 17 28
Access to campus resource/services (library/gym/transcripts, etc.) 96 147 -51 20
Campus discounts (bookstore/gym etc.) 68 146 -78 47
Online services/online community/Alumni directory 76 122 -46 63
Insurance (home auto/pet etc.) 60 119 -59 81
Email account /email forwarding 58 119 -61 83
Educational (lifelong learning/seminars) 56 93 -37 109
Travel programs 59 93 -34 110
Financial services/banking 14 85 -71 160
Most effective alumni engagement benefits:
Benefits According to the Ratio of Impact on Engagement (High Impact Minus Low Impact)
-100 -50 0 50 100 150 200
158Digital communication (blog/social media/E-newsletter)
129Clubs/Chapters/Reunions
115Publications (printed/e-zines)
17Career services/networking
-34Travel programs
-37Educational (lifelong learning/seminars)
-46Online services/online community/Alumni directory
-51 Access to campus resources/services (library/gym/transcripts, etc.)
-59Insurance (home/auto/pet, etc.)
-61Email account/email forwarding
-71Financial services/banking
-78Campus discounts (bookstore/gym, etc.)
30 - 2016 VAESE Benchmarking Report | Alumni Access® 1-888-878-6178
Dues-paying alumni organizations
The following data relates to those organizations that offer a dues-paying structure. The survey reveals that approximately 22% of alumni organizations are dues-paying. Consequently, the number of available respondents will limit our overall confidence in the results. Despite the margin of error being 11.7%, it appears that the survey sample reflects a wide range of established dues-paying organizations, which may help bolster our level of confidence in the results.
1-888-878-6178 2016 VAESE Benchmarking Report | Alumni Access® - 31
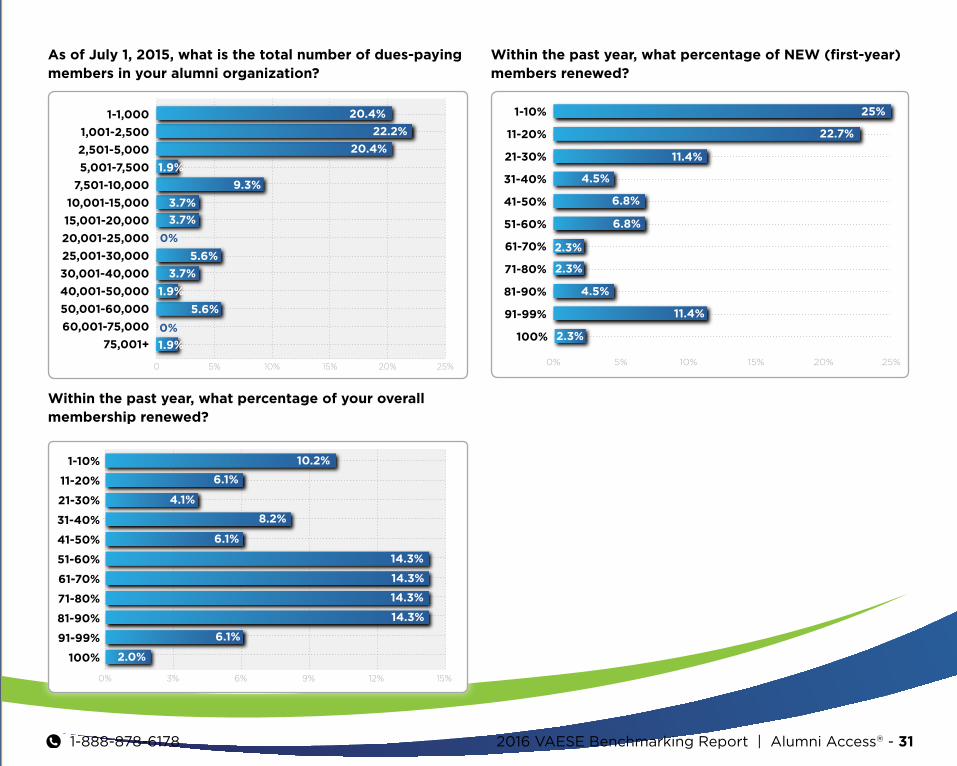
As of July 1, 2015, what is the total number of dues-paying members in your alumni organization?
0 5% 10% 15% 20% 25%
75,001+
60,001-75,000
50,001-60,000
40,001-50,000
30,001-40,000
25,001-30,000
20,001-25,000
15,001-20,000
10,001-15,000
7,501-10,000
5,001-7,500
2,501-5,000
1,001-2,500
1-1,000 20.4%
22.2%
20.4%
1.9%
1.9%
1.9%
9.3%
3.7%
3.7%
3.7%
5.6%
5.6%
0%
0%
Within the past year, what percentage of your overall membership renewed?
0% 3% 6% 9% 12% 15%
91-99%
100%
81-90%
71-80%
61-70%
51-60%
41-50%
31-40%
21-30%
11-20%
1-10% 10.2%
6.1%
4.1%
8.2%
6.1%
14.3%
14.3%
14.3%
14.3%
6.1%
2.0%
Within the past year, what percentage of NEW (first-year) members renewed?
0% 5% 10% 15% 20% 25%
1-10% 25%
11-20% 22.7%
21-30% 11.4%
91-99% 11.4%
31-40% 4.5%
81-90% 4.5%
41-50% 6.8%
51-60% 6.8%
61-70% 2.3%
100% 2.3%
71-80% 2.3%
32 - 2016 VAESE Benchmarking Report | Alumni Access® 1-888-878-6178
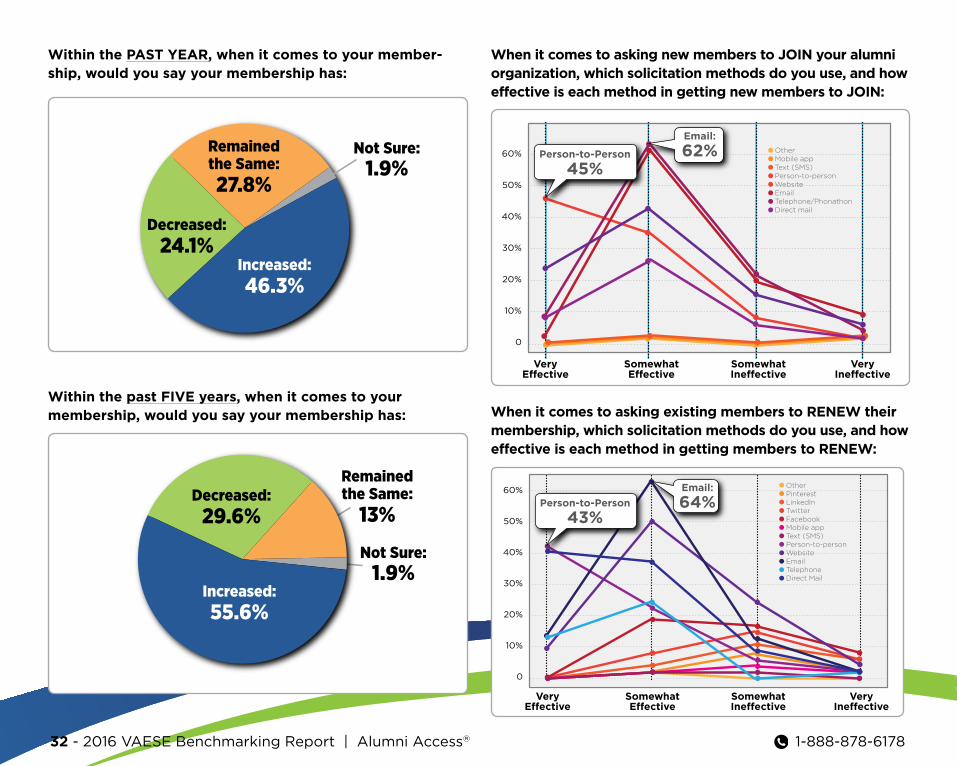
Within the PAST YEAR, when it comes to your member-ship, would you say your membership has:
Decreased:24.1%
Increased:46.3%
Remainedthe Same:27.8%
Not Sure:1.9%
Within the past FIVE years, when it comes to your membership, would you say your membership has:
Remainedthe Same:
13%
Not Sure:1.9%
Decreased:29.6%
Increased:55.6%
When it comes to asking new members to JOIN your alumni organization, which solicitation methods do you use, and how effective is each method in getting new members to JOIN:
VeryIneffective
SomewhatIneffective
SomewhatEffective
VeryEffective
0
10%
20%
30%
40%
50%
60% OtherMobile appText (SMS)Person-to-personWebsiteEmailTelephone/PhonathonDirect mail
Email:
62%Person-to-Person
45%
When it comes to asking existing members to RENEW their membership, which solicitation methods do you use, and how effective is each method in getting members to RENEW:
VeryIneffective
SomewhatIneffective
SomewhatEffective
VeryEffective
0
10%
20%
30%
40%
50%
60%OtherPinterestLinkedInTwitterFacebookMobile appText (SMS)Person-to-personWebsiteEmailTelephoneDirect Mail
Person-to-Person
43%
Email:
64%
1-888-878-6178 2016 VAESE Benchmarking Report | Alumni Access® - 33
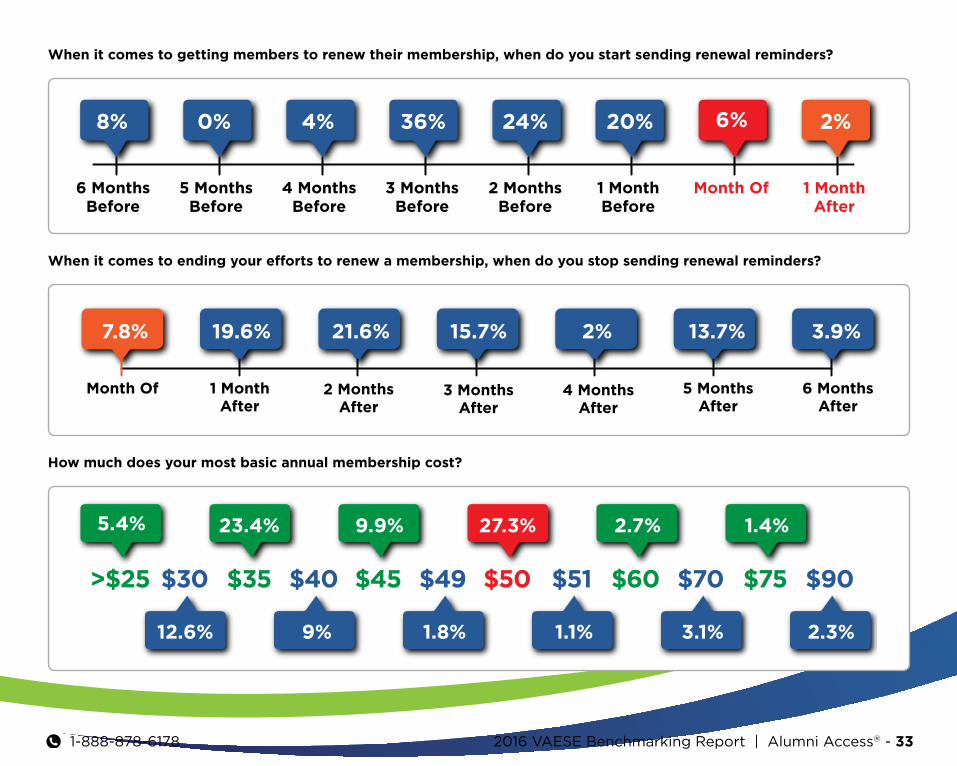
When it comes to getting members to renew their membership, when do you start sending renewal reminders?
2%6%20%24%36%4%0%8%
6 MonthsBefore
5 MonthsBefore
4 MonthsBefore
3 MonthsBefore
2 MonthsBefore
1 MonthBefore
Month Of 1 MonthAfter
When it comes to ending your efforts to renew a membership, when do you stop sending renewal reminders?
Month Of
7.8%
1 MonthAfter
19.6%
2 MonthsAfter
21.6%
3 MonthsAfter
15.7%
4 MonthsAfter
2%
5 MonthsAfter
13.7%
6 MonthsAfter
3.9%
How much does your most basic annual membership cost?
5.4%
>$25
12.6%
$30
23.4%
$35
9%
$40
9.9%
$45
1.8%
$49
27.3%
$50
1.1%
$51
2.7%
$60
3.1%
$70
1.4%
$75
2.3%
$90
34 - 2016 VAESE Benchmarking Report | Alumni Access® 1-888-878-6178
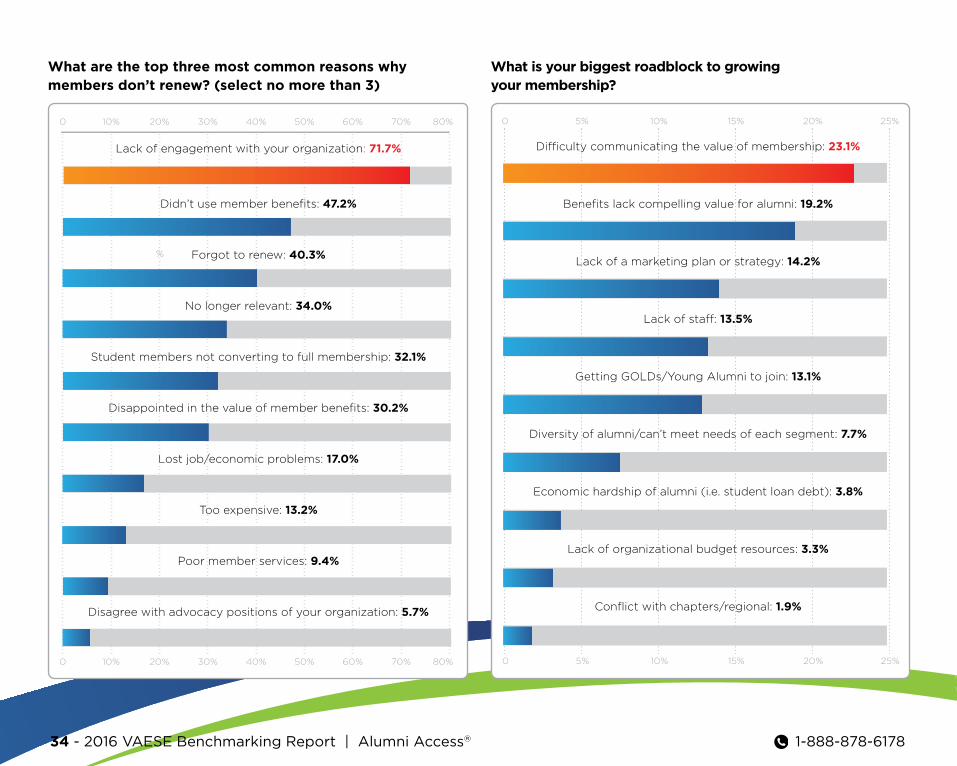
What are the top three most common reasons why members don’t renew? (select no more than 3)
Lack of engagement with your organization: 71.7%
Didn’t use member benefits: 47.2%
Forgot to renew: 40.3%
No longer relevant: 34.0%
Student members not converting to full membership: 32.1%
Disappointed in the value of member benefits: 30.2%
Lost job/economic problems: 17.0%
Too expensive: 13.2%
Poor member services: 9.4%
Disagree with advocacy positions of your organization: 5.7%
0 10% 20% 30% 40% 50% 60% 70% 80%
0 10% 20% 30% 40% 50% 60% 70% 80%
What is your biggest roadblock to growing your membership?
Difficulty communicating the value of membership: 23.1%
Benefits lack compelling value for alumni: 19.2%
Lack of a marketing plan or strategy: 14.2%
Lack of staff: 13.5%
Getting GOLDs/Young Alumni to join: 13.1%
Diversity of alumni/can’t meet needs of each segment: 7.7%
Economic hardship of alumni (i.e. student loan debt): 3.8%
Lack of organizational budget resources: 3.3%
Conflict with chapters/regional: 1.9%
0 5% 10% 15% 20% 25%
0 5% 10% 15% 20% 25%
%
1-888-878-6178 2016 VAESE Benchmarking Report | Alumni Access® - 35
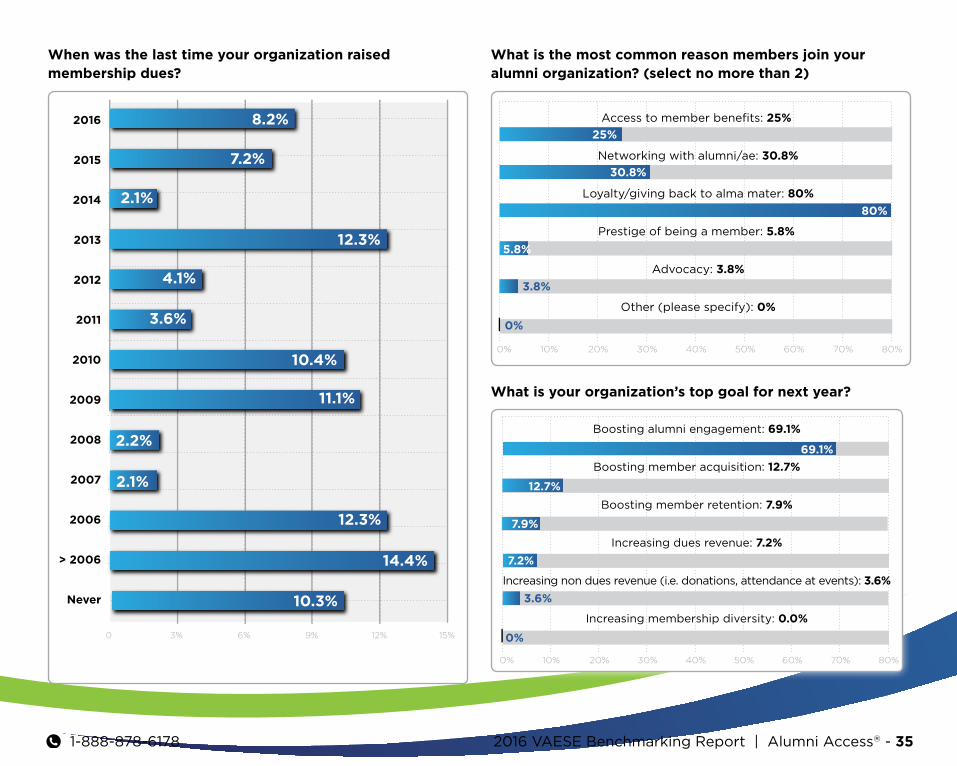
When was the last time your organization raised membership dues?
0 3% 6% 9% 12% 15%
2016
2015
2014
2013
2012
2011
2010
2009
2008
2007
2006
> 2006
Never 10.3%
14.4%
12.3%
2.1%
2.2%
11.1%
10.4%
3.6%
4.1%
12.3%
2.1%
7.2%
8.2%
What is the most common reason members join your alumni organization? (select no more than 2)
0% 10% 20% 30% 40% 50% 60% 70% 80%
Access to member benefits: 25%
Networking with alumni/ae: 30.8%
Loyalty/giving back to alma mater: 80%
Prestige of being a member: 5.8%
Advocacy: 3.8%
Other (please specify): 0%
25%
30.8%
80%
5.8%
3.8%
0%
What is your organization’s top goal for next year?
0% 10% 20% 30% 40% 50% 60% 70% 80%
Boosting alumni engagement: 69.1%
Boosting member acquisition: 12.7%
Boosting member retention: 7.9%
Increasing dues revenue: 7.2%
Increasing non dues revenue (i.e. donations, attendance at events): 3.6%
Increasing membership diversity: 0.0%
69.1%
12.7%
7.9%
7.2%
3.6%
0%
About Alumni Access:
Alumni Access is America’s Premier Alumni Discount Network. This turn-key alumni benefit program offers a proven, ongoing alumni engagement platform for alumni that livie anywhere in the U.S. With over 200,000 participating merchants, these discounts aren’t the same deals available to anyone online – these are private, in-store offers at popular national and local merchants. And because these retailers want to attract an educated and affluent audience like college alumni, they offer their deepest discounts, providing these VIP discounts are behind a password protected website.
Alumni Access delivers 25-50% off, BOGO, and 2-for-1 discounts at restaurants, retailers, major theme parks, and on movies, auto service, travel bookings and more, and all for less than a penny per alum.
GET CONNECTED WITH US:
Alumni Benefits | Alumni Access
1-888-878-6178 Email: [email protected]