Embed Size (px)
Citation preview
I recently read that the most popular indicator by traders that use the
Bloomberg Professional Terminal is the RSI (Relative Strength Index).
This is the first time that I've been aware of an objective measure of the
popularity of any trading indicator.
This is much better than the usual "most traders use X" or "Hedge Funds
use X" you read when people are talking about trading indicators.
I will repeat what I have said in many trading posts...an indicator just
indicates and you must also be tuned into price action and price structure.
If an indicator indicates a buy but long term resistance is directly overhead, a
winning trade is not the higher probability result unless there is
strength on the break.
Netpicks designs all of its trading systems with an eye towards keeping
the big picture as well as the chart story in mind. Anybody who attempts to sell you a trading system where you
just plug and play ignores the "indicators just indicate" truth.
1978 saw an article published in Commodities Magazine by Welles
Wilder where the RSI was introduced to the public. It was followed up in a
book by Wilder called New Concepts In Technical Trading Systems.
Its a bounded momentum oscillator that fluctuates between a top level of
100 and a bottom level of 0 which allows traders to use it as an
overbought/oversold indicator. The popular settings to measure the
OB/OS of an instrument is 80/20 & 70/30.
The RSI oscillates using a calculation that compares the relative strength of gains in price of days that close above previous days close (up days) to the price loss on days that close below previous days close (down days).
To aid in that calculation, Wilder suggested a look back period indicator
setting of 14 be used. Like virtually every trading indicator, you can tweak look backs and OS/OB levels and again like every indicator, there is no magic
setting that is going to produce a "holy grail" in terms of trading success.
When changing the look back period for your trading instrument, try to line up RSI turning points at the 80/20 or
70/30 lines with the turns in the market.
If you choose to optimize, you may want to test if the time spent doing so actually equates to a significant (and proven) edge to your trading system
A longer look back will ease off on the volatility of the RSI where a shorter
look back will see more volatility in the indicator.
The bottom line is we are using the relative strength indicator to "indicate"
the strength in the market as well as the potential for a turn in the market.
In the original article by Welder in 1978, the usage of the RSI in terms of
oversold/overbought was not the focus. Many traders actually use these levels for trading but it is important to know that this was not originally the
prime usage.
I am using a look back period of 14 and the oversold and overbought levels are
30/70.
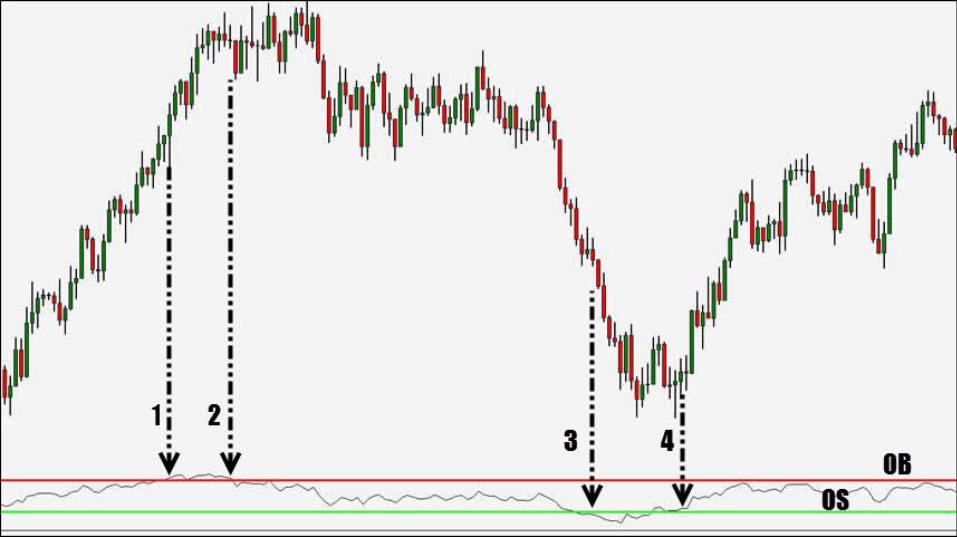
It is easy to see that if you were to start looking to short once we went
overbought at #1, you would be very disappointed. Even when we dip
below at #2, price remains in a range and would easily chop an undisciplined
trader to pieces.

Price eventually drops and we enter the oversold area at #3. At oversold
levels, the market is theoretically ripe for a reversal but the market
continued falling even though we were OS and even when the RSI was starting
to angle upwards.
Remember that a market in OB/OS can also be considered a strong market
and looking for a trade simply because the RSI points to either of those
conditions does not mean a trade is imminent.
The safest way to play OB/OS levels is to wait until the RSI changes from that
state and then look for your trading setups.
FACT: BLINDLY TRADING OS/OB LEVELS AS INDICATED BY THE RSI IS NOT A FULLY
DEVELOPED TRADING PLAN. THE MARKET CAN STAY IN THOSE STATES FOR A WHILE
AND CONTINUALLY ATTEMPTING TO TRADE IN THE OPPOSITE DIRECTION CAN
END WITH YOUR ACCOUNT BEING CHURNED TO ZERO.
DIVERGENCE This was the first introduction to the RSI back in 1978. Quite simply, we are looking for the indicator to diverge from price.
If the market is in an uptrend, we are comparing highs in price to the highs in the RSI.
If in a downtrend, we compare the lows
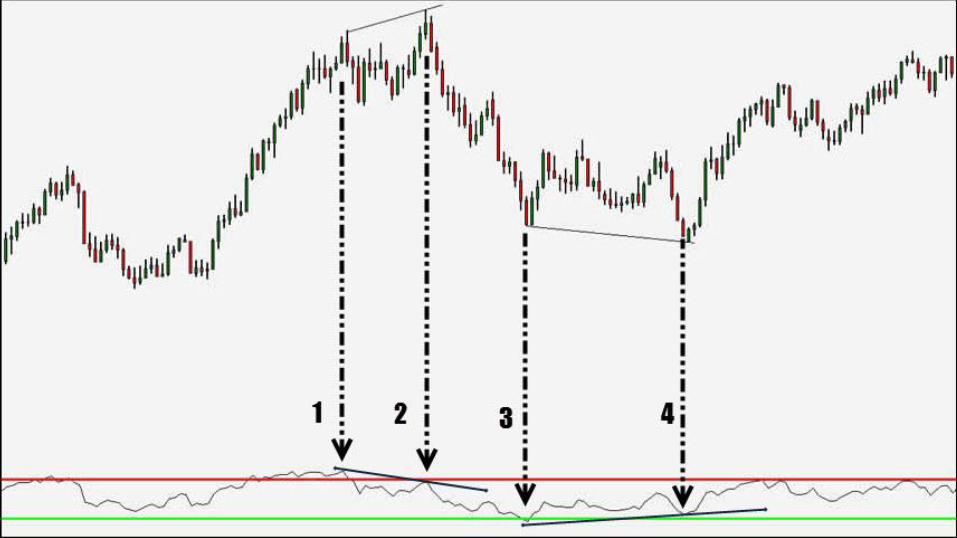
This chart is in a uptrend in price and the RSI plots the instrument into the overbought area. We know we don't simply take a short position until we
have something to short against.
Think of having a confluence of factors coming into play to support the trade.
Price puts in a high at #1 in both price and on the indicator. At #2, we have
divergence. Price has pushed to a new high yet the RSI plots a lower high.
Is there a shorting opportunity?
Price puts in a high while we are indicating an overbought condition
Price puts in a higher price high but a lower RSI high and has left the OB
zone
Price has breached a potential resistance area
Reversal candle indicating a failure test of the high
After price travels down, the RSI pokes into oversold at #3 and exits on the next candle. This can have you on alert for a long trade but we need
something else to back us in the trade.
Ranging price action ends with a push down to the top of the OS area at #4. Price breaks the previous swing low
but the RSI puts in a higher high.
You can simply reverse what we saw in the shorting opportunity to give you a
potential trade to the upside
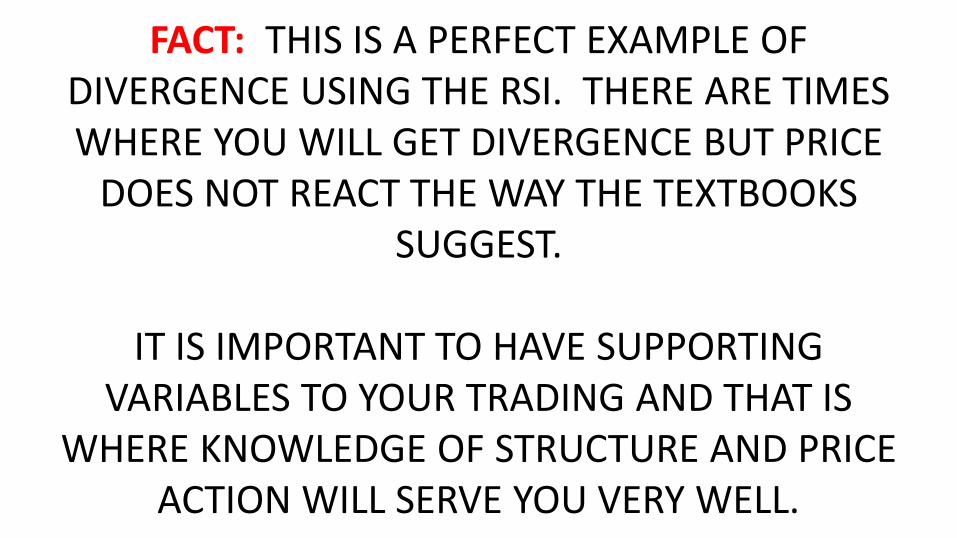
FACT: THIS IS A PERFECT EXAMPLE OF DIVERGENCE USING THE RSI. THERE ARE TIMES WHERE YOU WILL GET DIVERGENCE BUT PRICE
DOES NOT REACT THE WAY THE TEXTBOOKS SUGGEST.
IT IS IMPORTANT TO HAVE SUPPORTING
VARIABLES TO YOUR TRADING AND THAT IS WHERE KNOWLEDGE OF STRUCTURE AND PRICE
ACTION WILL SERVE YOU VERY WELL.
FAILURE SWINGS This is an interesting use of the relative strength indicator and may appeal to some traders.
We don't use the price portion of the chart and we just focus on the swings of the RSI. That's the idea however
you may find it easier on the psyche to align these signals with what price is
telling you.
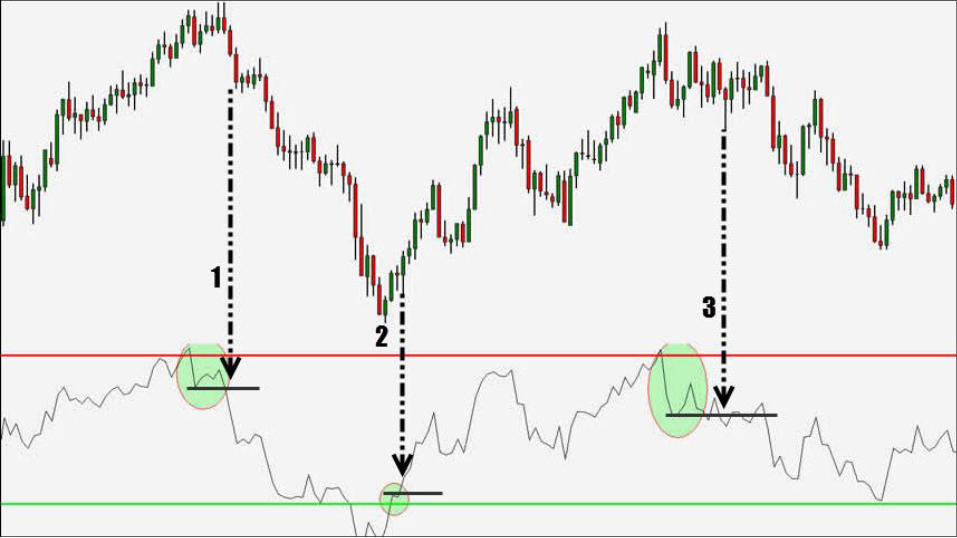
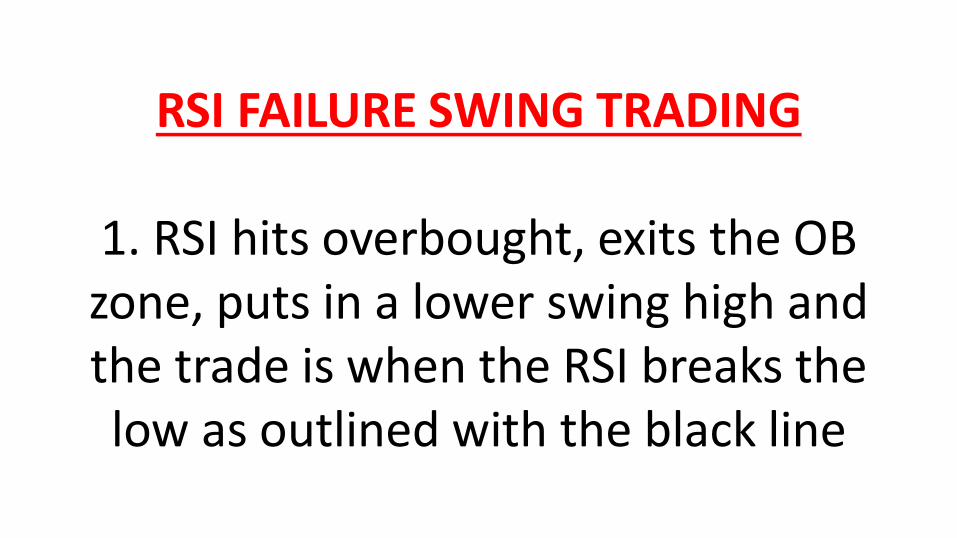
RSI FAILURE SWING TRADING
1. RSI hits overbought, exits the OB zone, puts in a lower swing high and the trade is when the RSI breaks the low as outlined with the black line
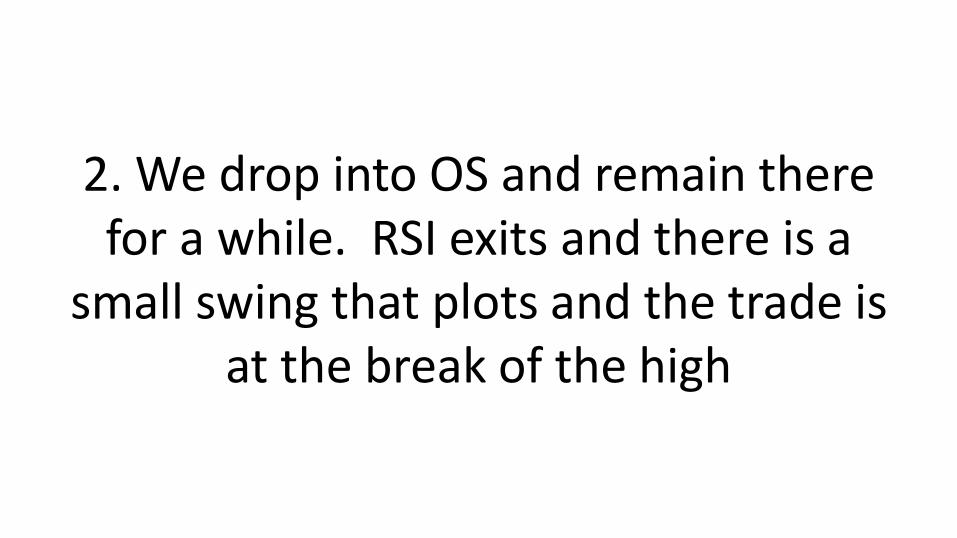
2. We drop into OS and remain there for a while. RSI exits and there is a
small swing that plots and the trade is at the break of the high
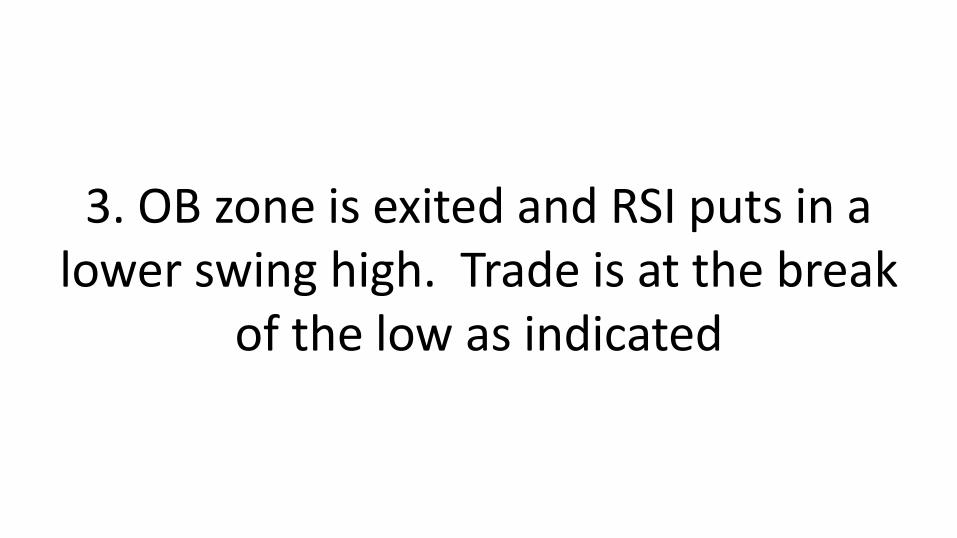
3. OB zone is exited and RSI puts in a lower swing high. Trade is at the break
of the low as indicated
The first trade has you short and you will sit through some sideways price action. Given the momentum move
down and then lack of immediate follow-through, this could frustrate
many traders.

The second trade works right from the outset in that there is direct action in
your favor. Proper trade management would be vital especially since price
was in a down trend when you entered.
Third trade would be extremely painful to sit through. You enter in a range and even when it eventually breaks,
price exhibits a strong rally back to the same zone.
FACT: YOU MAY WANT TO DO EXTENSIVE TESTING ON THIS TYPE OF
TRADING. EVEN FROM THIS BRIEF EXAMPLE, YOU CAN IMAGINE THE
HOST OF ISSUES THAT COULD CROP UP THAT MAY BE AVOIDED IF YOU WERE
TUNED INTO PRICE ACTION AND IMPORTANT STRUCTURES.
The relative strength index has quite a few uses that while not perfect, does have potential in a well thought out
trading system.
I am not surprised that it's popular but like most indicators (if not all), it is not
plug it in and let it trade for you.
The simplicity and apparent robustness can be intriguing for
further testing.
Perhaps there is merit to slightly optimizing so the OS/OB of the
indicator lines us with recent swings in the market. This would probably be something you'd want to do on the
higher time frame charts (daily, weekly) as intra-day has many more
swings to contend with.
There are other popular look back periods on the RSI such as 9 and 25
but again, this is something you'd want to test before implementing it in your
trading. I must continue to say that no
indicator, regardless of the hype and promise, is foolproof.
You certainly can design some extremely powerful trading systems
using them but ensure that structure such as important swing levels
(support and resistance) and other structures as well as price action, is
taken into account.