Embed Size (px)
Citation preview
39 Adrenal Masses on Magnetic Resonance Imaging
CLINICAL IMAGAGINGAN ATLAS OF DIFFERENTIAL DAIGNOSIS
EISENBERG
DR. Muhammad Bin Zulfiqar PGR-FCPS III SIMS/SHL
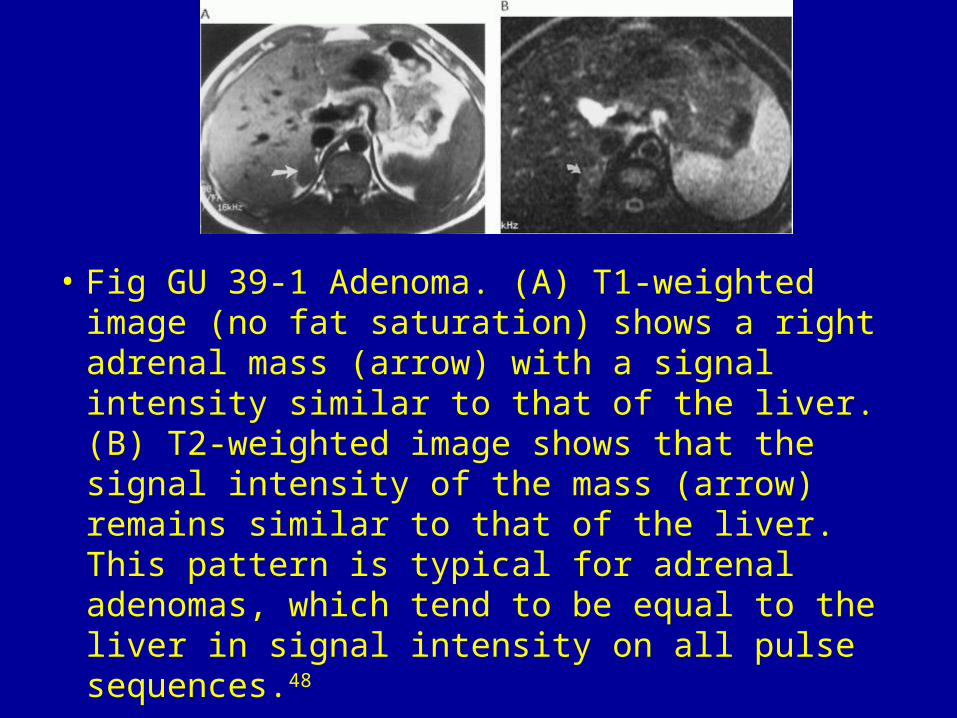
• Fig GU 39-1 Adenoma. (A) T1-weighted image (no fat saturation) shows a right adrenal mass (arrow) with a signal intensity similar to that of the liver. (B) T2-weighted image shows that the signal intensity of the mass (arrow) remains similar to that of the liver. This pattern is typical for adrenal adenomas, which tend to be equal to the liver in signal intensity on all pulse sequences.48
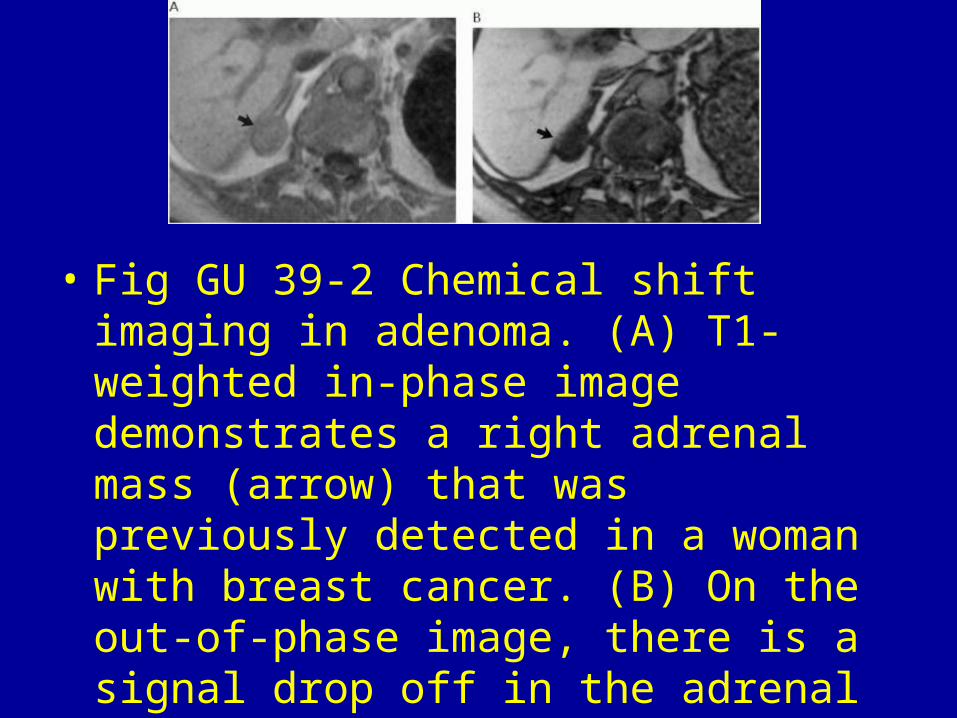
• Fig GU 39-2 Chemical shift imaging in adenoma. (A) T1-weighted in-phase image demonstrates a right adrenal mass (arrow) that was previously detected in a woman with breast cancer. (B) On the out-of-phase image, there is a signal drop off in the adrenal gland (arrow), which is diagnostic of an adenoma.49
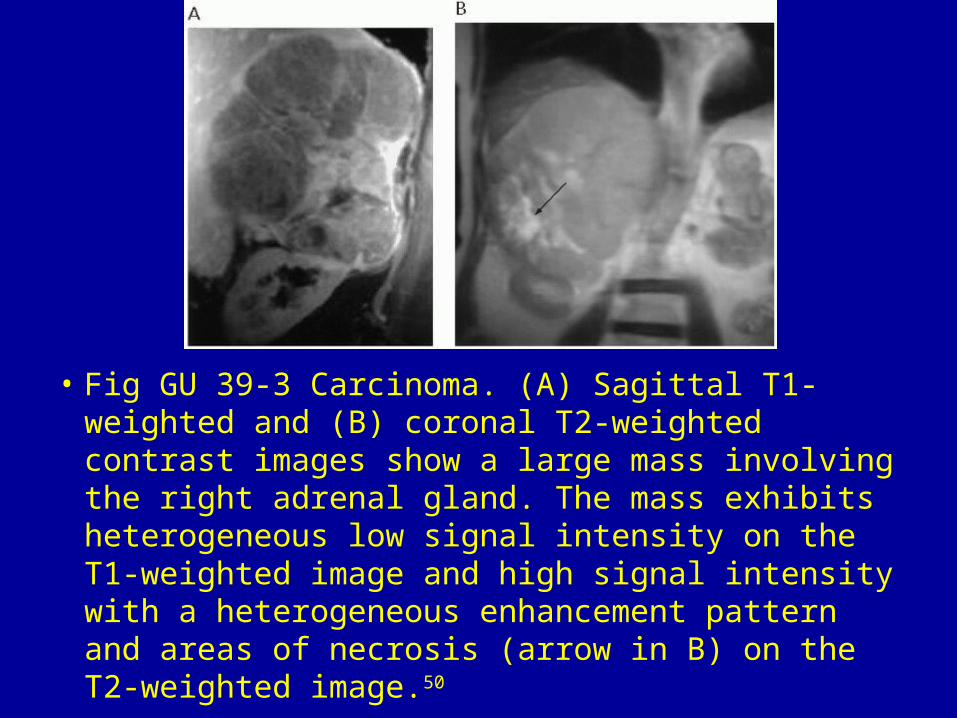
• Fig GU 39-3 Carcinoma. (A) Sagittal T1-weighted and (B) coronal T2-weighted contrast images show a large mass involving the right adrenal gland. The mass exhibits heterogeneous low signal intensity on the T1-weighted image and high signal intensity with a heterogeneous enhancement pattern and areas of necrosis (arrow in B) on the T2-weighted image.50
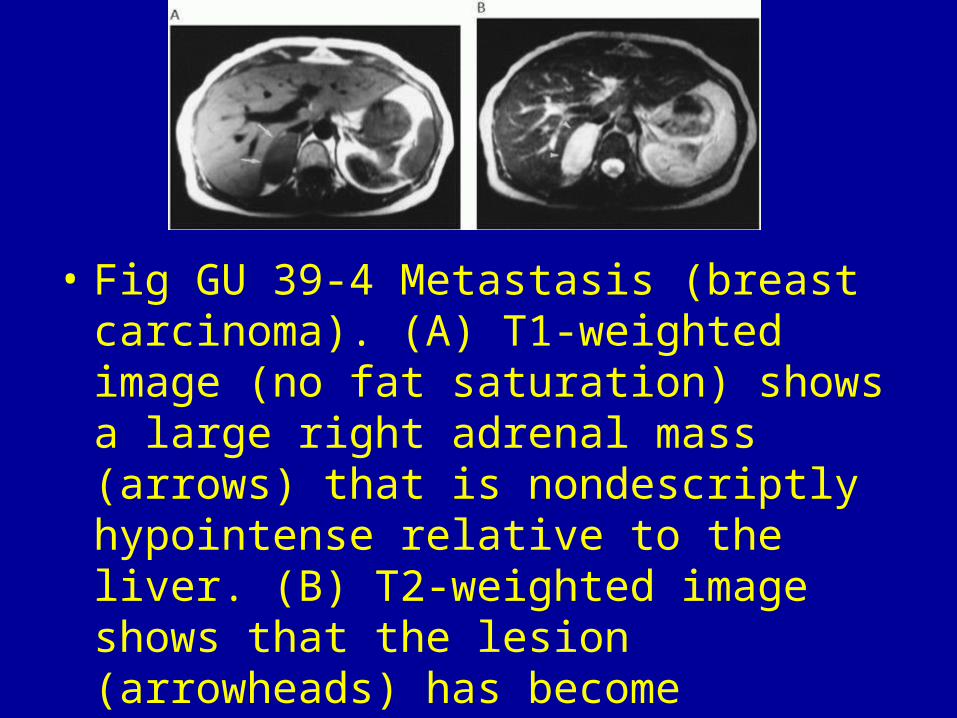
• Fig GU 39-4 Metastasis (breast carcinoma). (A) T1-weighted image (no fat saturation) shows a large right adrenal mass (arrows) that is nondescriptly hypointense relative to the liver. (B) T2-weighted image shows that the lesion (arrowheads) has become hyperintense relative to the liver, conforming with the typical appearance of an adrenal metastasis.48
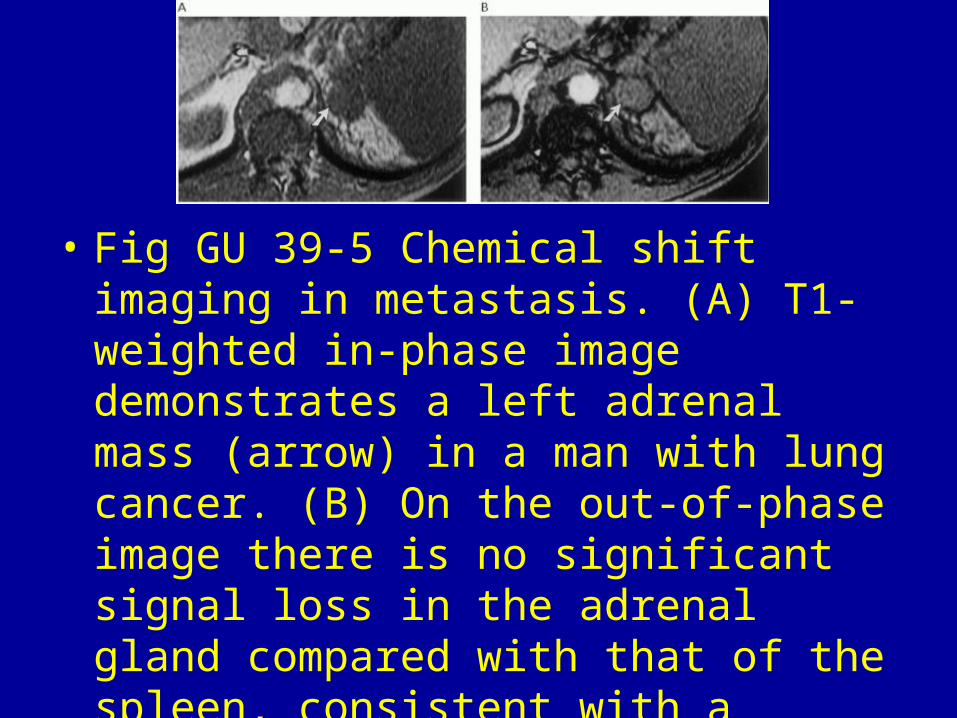
• Fig GU 39-5 Chemical shift imaging in metastasis. (A) T1-weighted in-phase image demonstrates a left adrenal mass (arrow) in a man with lung cancer. (B) On the out-of-phase image there is no significant signal loss in the adrenal gland compared with that of the spleen, consistent with a metastasis.49
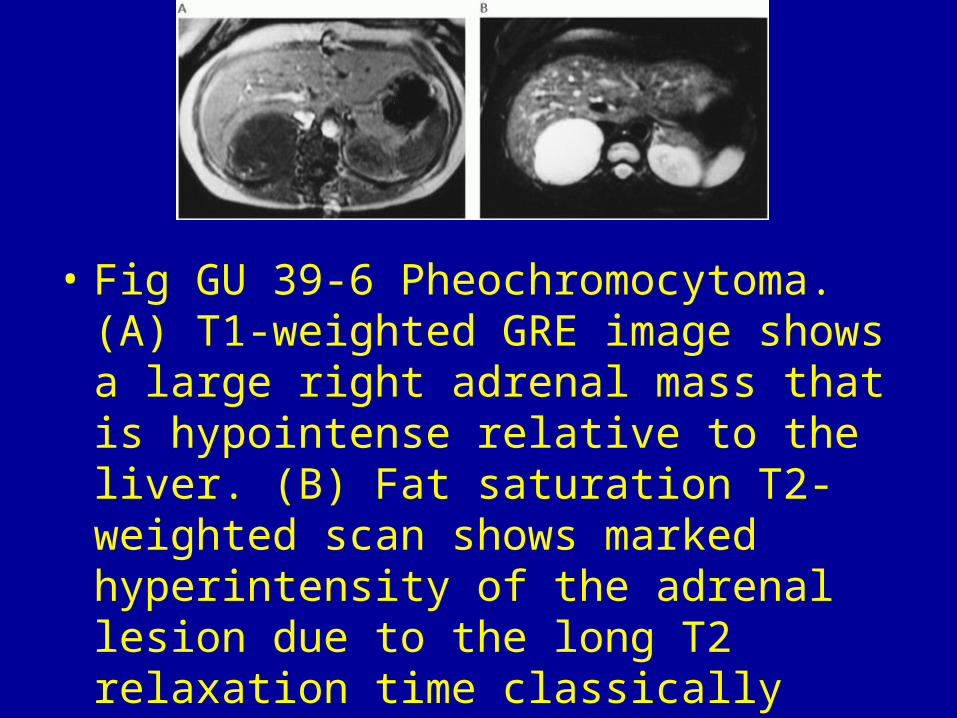
• Fig GU 39-6 Pheochromocytoma. (A) T1-weighted GRE image shows a large right adrenal mass that is hypointense relative to the liver. (B) Fat saturation T2-weighted scan shows marked hyperintensity of the adrenal lesion due to the long T2 relaxation time classically reported for pheochromocytomas.48
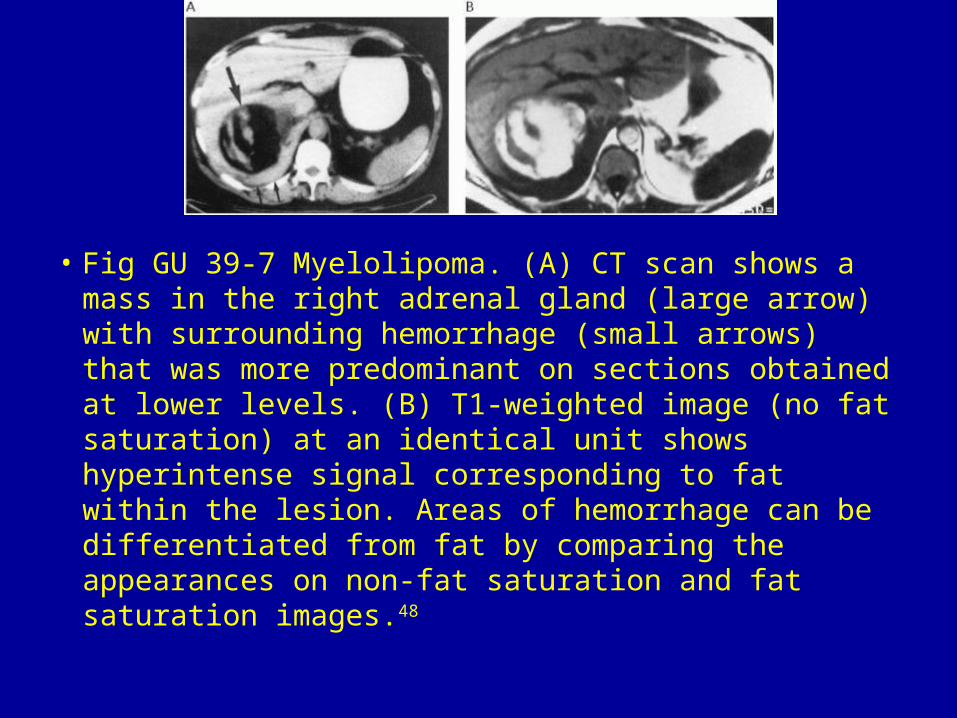
• Fig GU 39-7 Myelolipoma. (A) CT scan shows a mass in the right adrenal gland (large arrow) with surrounding hemorrhage (small arrows) that was more predominant on sections obtained at lower levels. (B) T1-weighted image (no fat saturation) at an identical unit shows hyperintense signal corresponding to fat within the lesion. Areas of hemorrhage can be differentiated from fat by comparing the appearances on non-fat saturation and fat saturation images.48
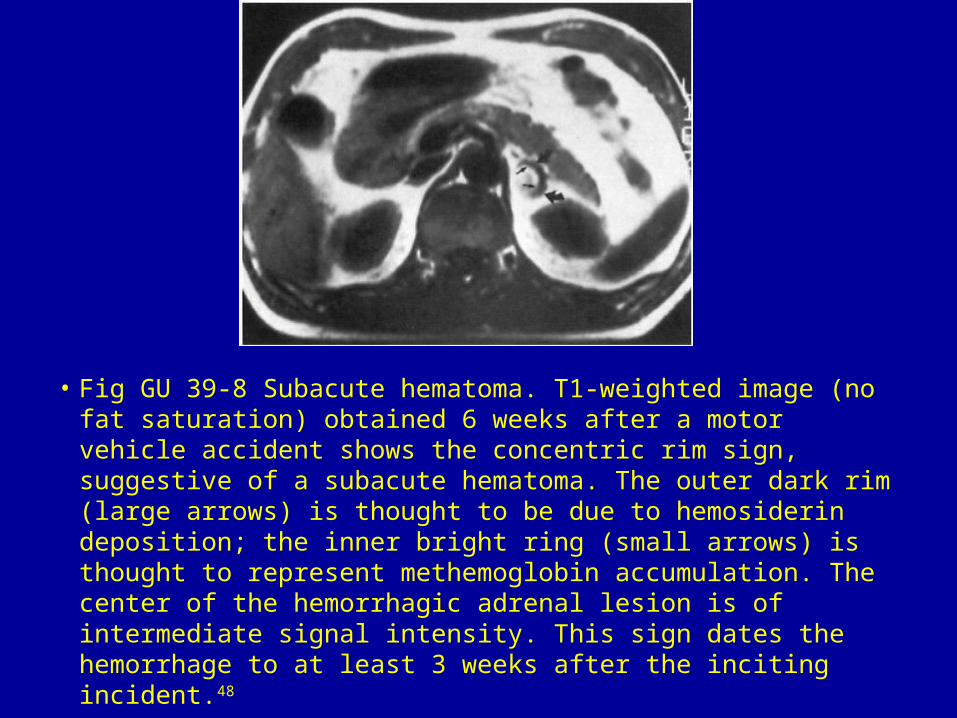
• Fig GU 39-8 Subacute hematoma. T1-weighted image (no fat saturation) obtained 6 weeks after a motor vehicle accident shows the concentric rim sign, suggestive of a subacute hematoma. The outer dark rim (large arrows) is thought to be due to hemosiderin deposition; the inner bright ring (small arrows) is thought to represent methemoglobin accumulation. The center of the hemorrhagic adrenal lesion is of intermediate signal intensity. This sign dates the hemorrhage to at least 3 weeks after the inciting incident.48
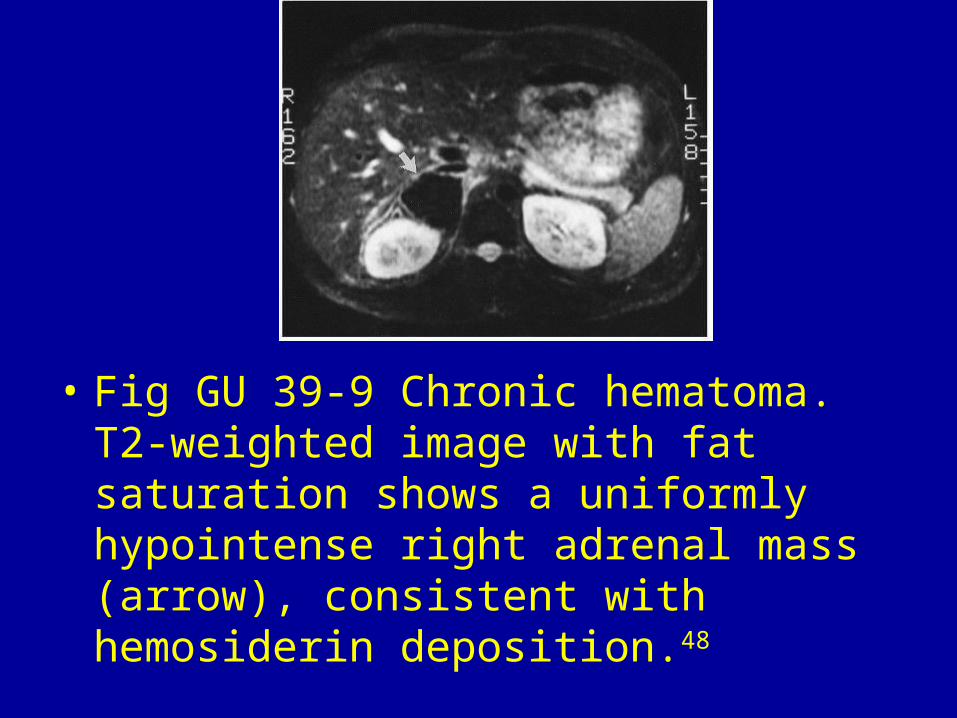
• Fig GU 39-9 Chronic hematoma. T2-weighted image with fat saturation shows a uniformly hypointense right adrenal mass (arrow), consistent with hemosiderin deposition.48
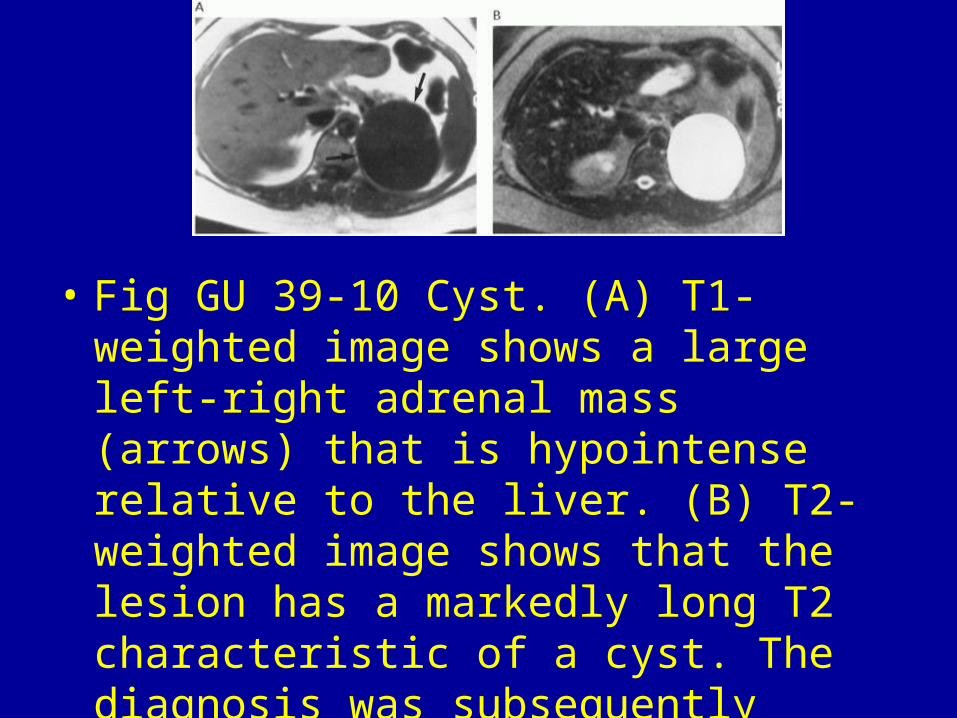
• Fig GU 39-10 Cyst. (A) T1-weighted image shows a large left-right adrenal mass (arrows) that is hypointense relative to the liver. (B) T2-weighted image shows that the lesion has a markedly long T2 characteristic of a cyst. The diagnosis was subsequently confirmed by ultrasound.44
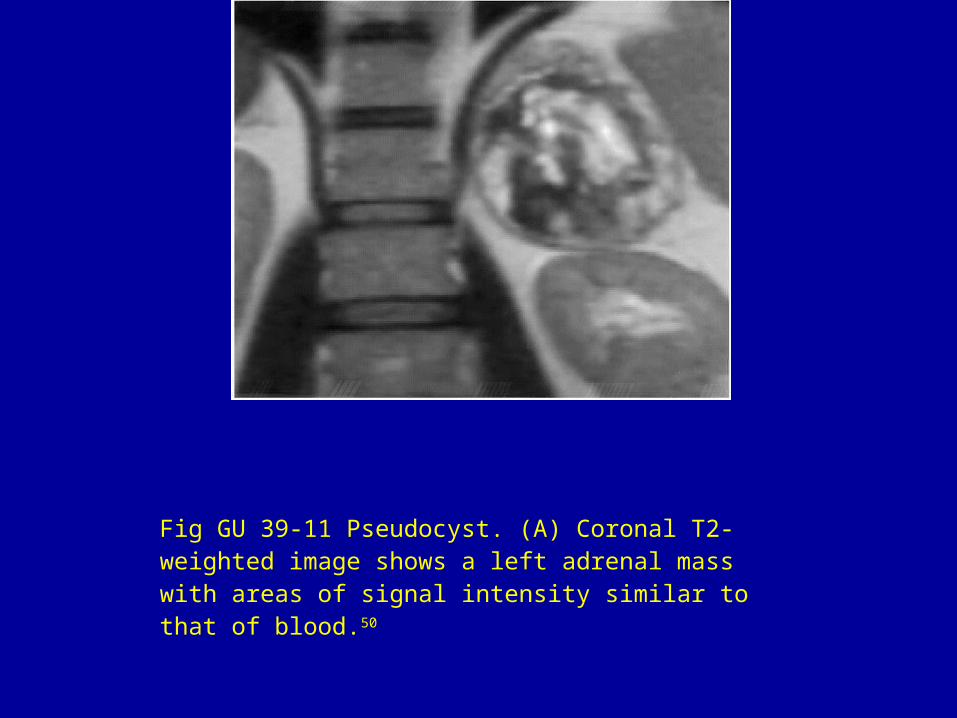
Fig GU 39-11 Pseudocyst. (A) Coronal T2-weighted image shows a left adrenal mass with areas of signal intensity similar to that of blood.50
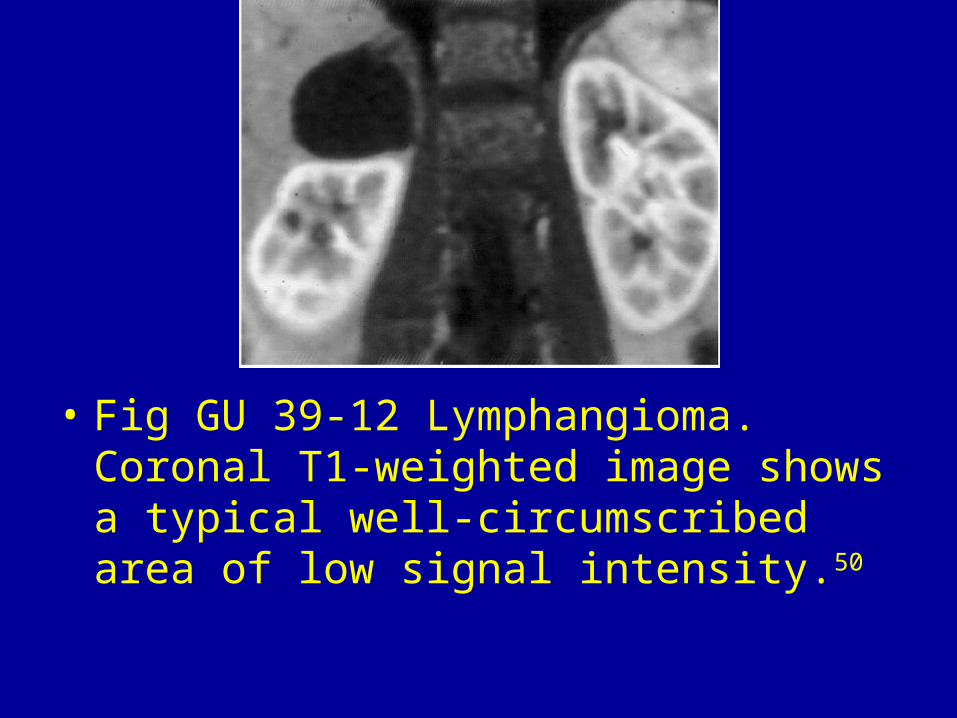
• Fig GU 39-12 Lymphangioma. Coronal T1-weighted image shows a typical well-circumscribed area of low signal intensity.50
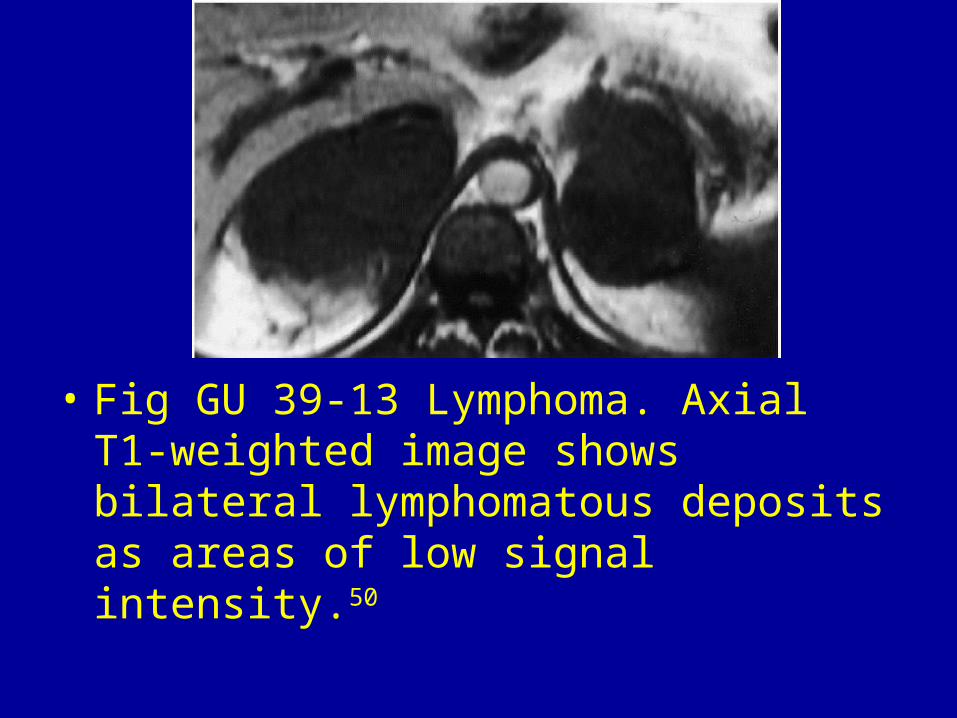
• Fig GU 39-13 Lymphoma. Axial T1-weighted image shows bilateral lymphomatous deposits as areas of low signal intensity.50
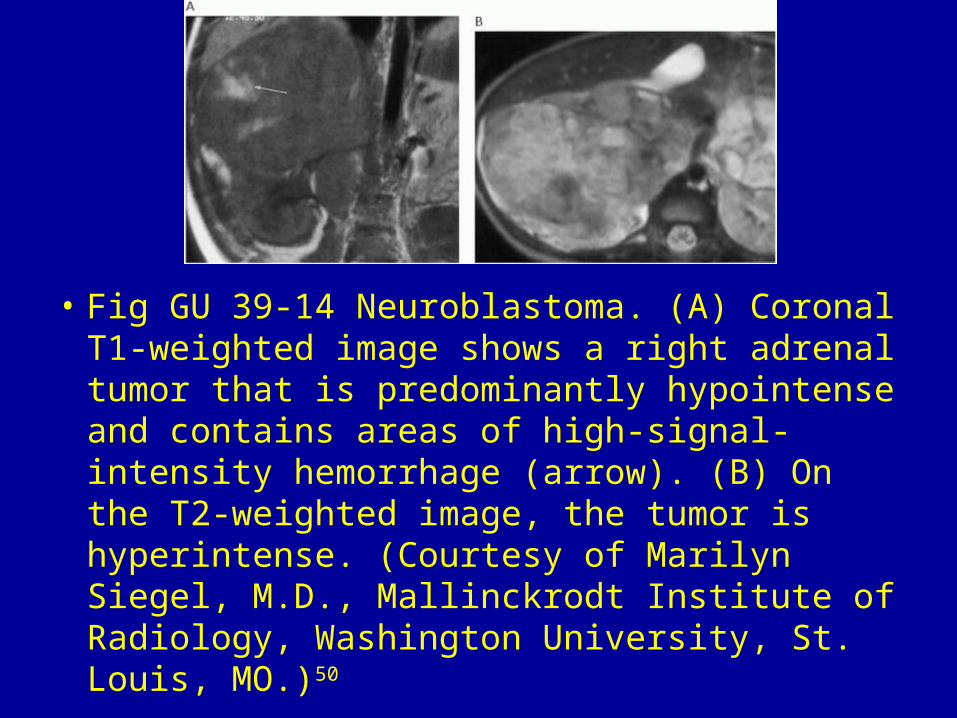
• Fig GU 39-14 Neuroblastoma. (A) Coronal T1-weighted image shows a right adrenal tumor that is predominantly hypointense and contains areas of high-signal-intensity hemorrhage (arrow). (B) On the T2-weighted image, the tumor is hyperintense. (Courtesy of Marilyn Siegel, M.D., Mallinckrodt Institute of Radiology, Washington University, St. Louis, MO.)50