Embed Size (px)
Citation preview
Basic Concepts and Principles of Epidemiology
Dr. Dharmendra GahwaiMD(Community Medicine)
Assistant ProfessorDeptt. Of Community Medicine,
CIMS, Bilaspur (C.G.)
• Epidemiology is the basic science of Preventive and Social Medicine.
• Epidemiology is scientific discipline of public health to study diseases in the community to acquire knowledge for health care of the society. (prevention, control and treatment).
• Epidemiological principles and methods are applied in – - Clinical research, - Disease prevention, - Health promotion,- Health protection and - Health services research.
• The results of epidemiological studies are also used by other scientists, including health economists, health policy analysts, and health services managers.
MODERN EPIDEMIOLOGY
- Infectious disease Epidemiology.- Chronic disease Epidemiology.- Clinical Epidemiology.- Genetic Epidemiology.- Occupational Epidemiology.- Cancer Epidemiology.- Neuro-Epidemilogy.
Definition
“The study of the distribution and determinants of health-related states or events in specified populations, and the application of this study to the prevention and control of health problems” .
As defined by John M. Last (1988)
Ultimate Aim of Epidemiology
• 1. To eliminate or reduce the health problems of community.
• 2. To promote the health and well-being of society as a whole.
Aims & Objectives of Epidemiology
1. To describe the distribution and magnitude of health and disease problems in human population.
2. To identify etiological factors (risk factors) in the pathogenesis of disease.
3. To provide data essential to the planning, implementation and evaluation of services for the prevention, control and treatment of disease and setting priorities among those services.
(Acc. to International Epidemiological Association)
Distribution• Distribution of disease occurs in a PATTERN.• PATTERN- Time, Place, Person .
• PATTERN – Hypothesis for Causative/Risk factor – Etiological Hypothesis.
• Descriptive Epidemiology.
Determinants
• Identifying the causes and risk factors for diseases.
• Testing the Hypothesis – (Biostatistics)
• Analytical Epidemiology
Scope of Epidemiology
• 1. Causation of the disease.• 2. Natural history of the disease.• 3. Health status of the population.• 4. Evaluation of Interventions.
1. Causation of the disease.
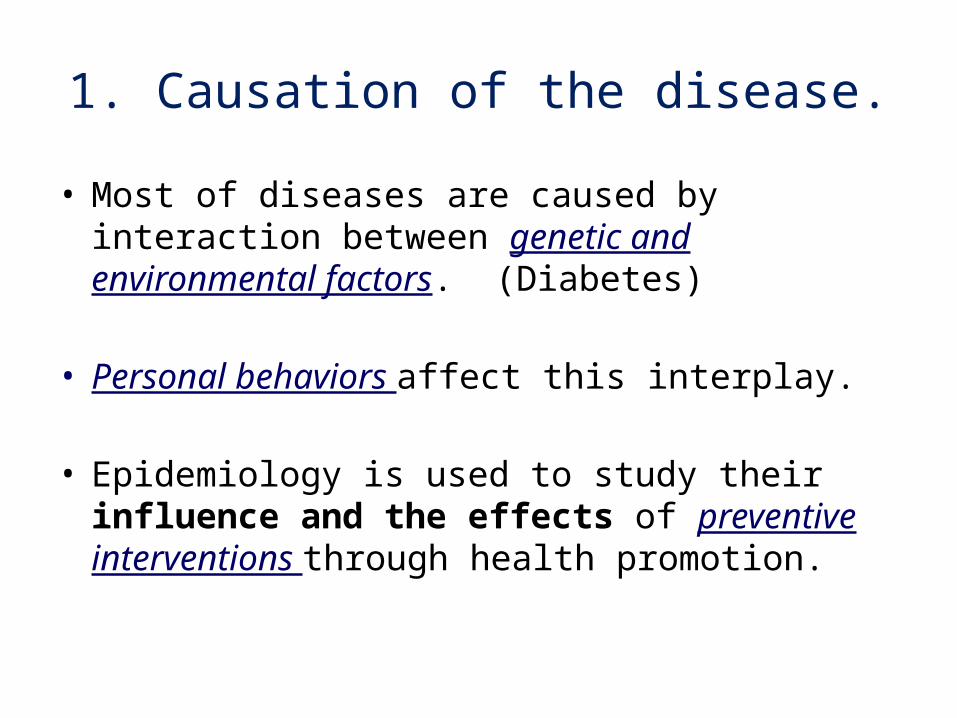
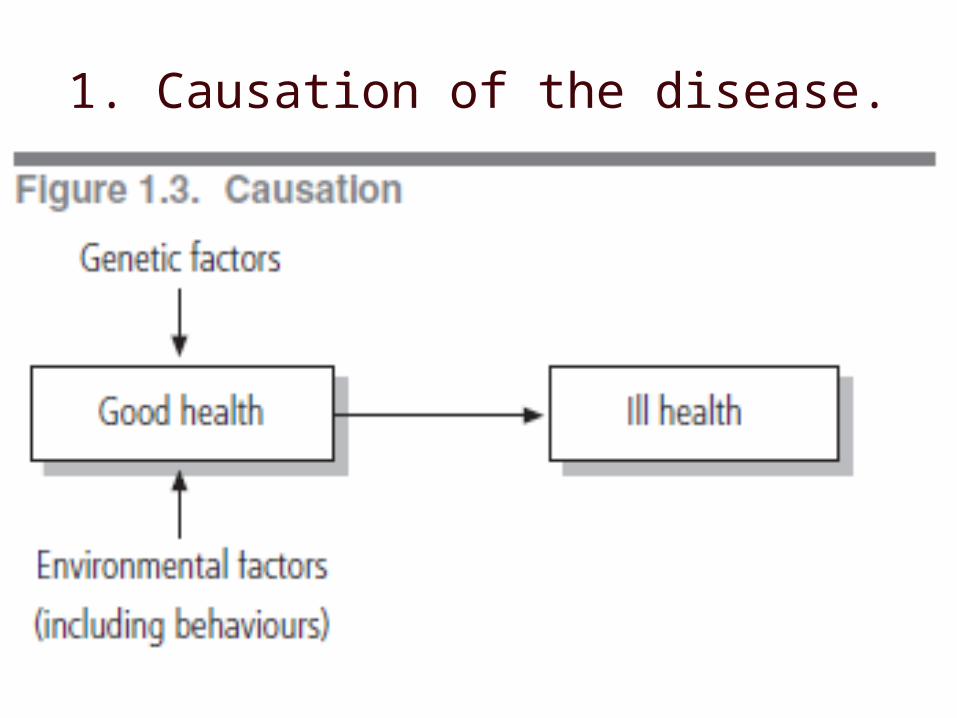
• Most of diseases are caused by interaction between genetic and environmental factors. (Diabetes)
• Personal behaviors affect this interplay.
• Epidemiology is used to study their influence and the effects of preventive interventions through health promotion.
1. Causation of the disease.

2. Natural history of the disease
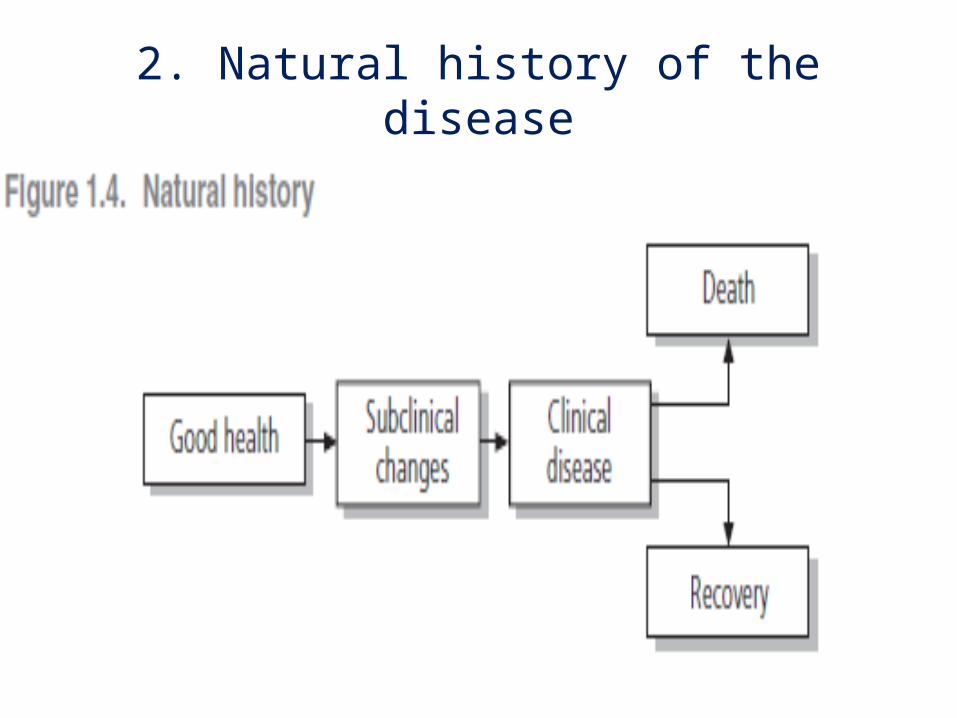
Epidemiology is also concerned with the course and outcome (natural history) of diseases in individuals and groups.
2. Natural history of the disease
3. Health status of the population
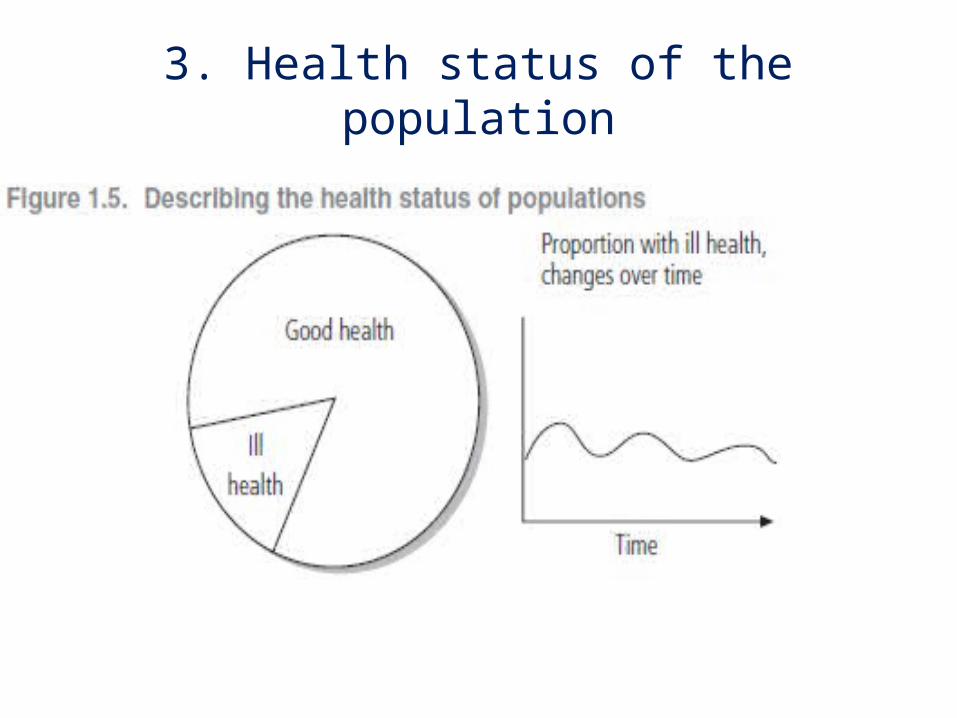
• Epidemiology is often used to describe the health status of population.
• Knowledge of the disease burden in populations is
essential for health authorities.
• To use limited resources to the best possible effect by identifying priority health programmes for prevention and care.
3. Health status of the population
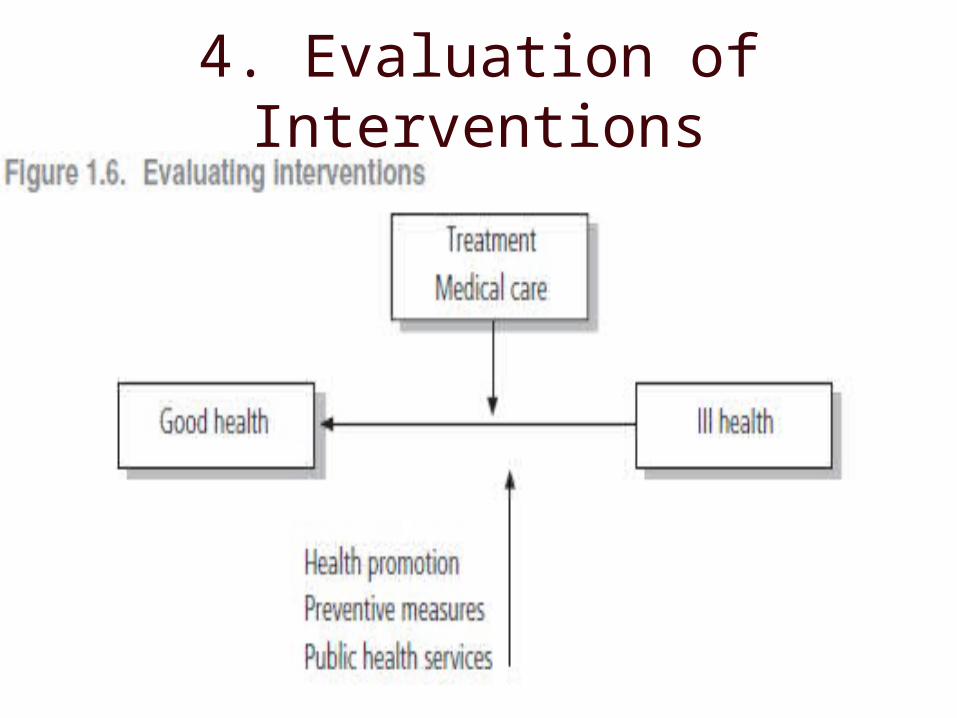
4. Evaluation of Interventions• To evaluate the effectiveness and efficiency of
health services.
• This means determining things such as –- Impact of Contraceptive use on Population Control.- the efficiency of sanitation measures to control
diarrheal diseases and - the impact of reducing lead additives in petrol.
4. Evaluation of Interventions
• Applying epidemiological principles and methods to problems encountered in the practice of medicine has led to the development of-
“Clinical Epidemiology”
Applications of epidemiology in public health
1. Preventing disease and promoting health.
2. Community health assessment (Community Diagnosis) and priority setting.
3. Improving diagnosis, treatment and prognosis of clinical diseases.
4. Evaluating health interventions and programmes.
Epidemiology and public health
• Public health, refers to collective actions to improve population health.
• Epidemiology, one of the tools for improving public health, is used in several ways.
Epidemiology & Clinical Medicine
• 1. In Clinical Medicine the unit of study is a ‘case’, but in the Epidemiology the unit of study is ‘defined population’ or ‘population at risk’.
• Physician is concerned with the disease in the individual patient, whereas Epidemiologist is concern with the disease pattern in entire population.
• So, the Epidemiology is concern with the both Sick & Healthy.
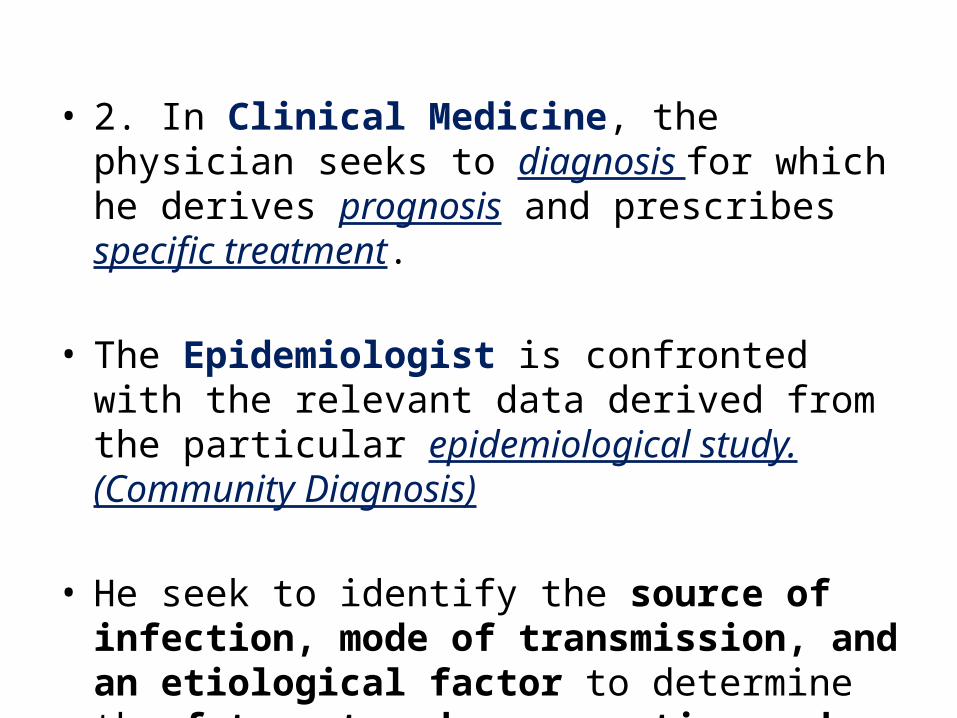
• 2. In Clinical Medicine, the physician seeks to diagnosis for which he derives prognosis and prescribes specific treatment.
• The Epidemiologist is confronted with the relevant data derived from the particular epidemiological study. (Community Diagnosis)
• He seek to identify the source of infection, mode of transmission, and an etiological factor to determine the future trends, prevention and control measure.
• 3. In Clinical Medicine patient comes to the Doctor.
• Epidemiologist, goes to the community to find out the disease pattern and suspected causal factors in the question.
Epidemiological approach
• 1. Asking questions.
• 2. Making Comparisons.
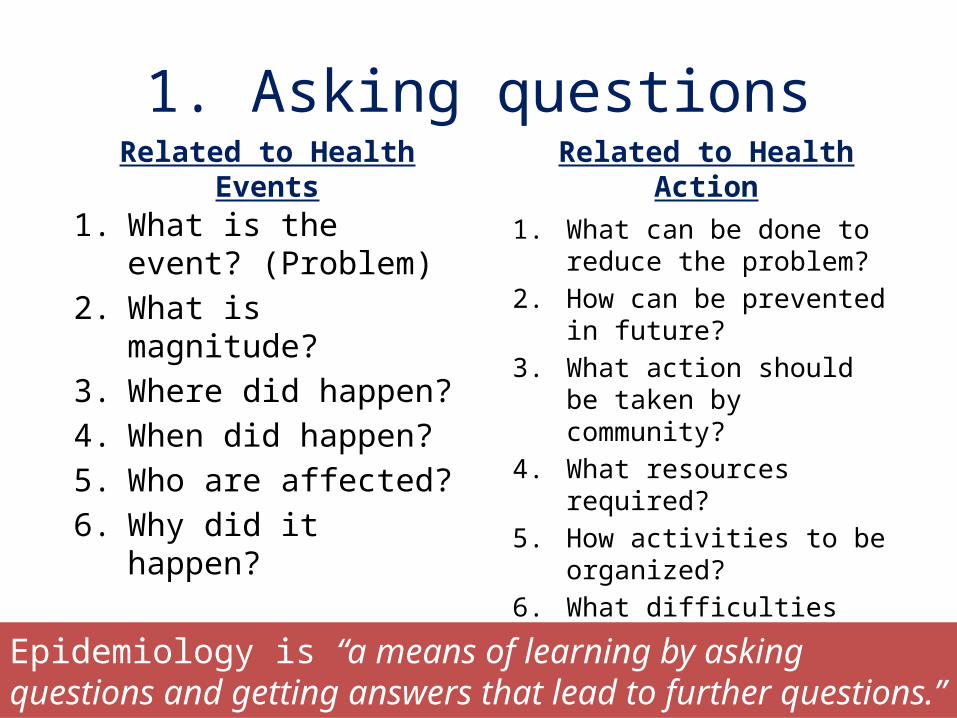
1. Asking questionsRelated to Health Events
1. What is the event? (Problem)
2. What is magnitude?3. Where did happen?4. When did happen?5. Who are affected?6. Why did it happen?
Related to Health Action1. What can be done to reduce
the problem?2. How can be prevented in
future?3. What action should be taken
by community?4. What resources required?5. How activities to be
organized?6. What difficulties may arise?
Epidemiology is “a means of learning by asking questions and getting answers that lead to further questions.”
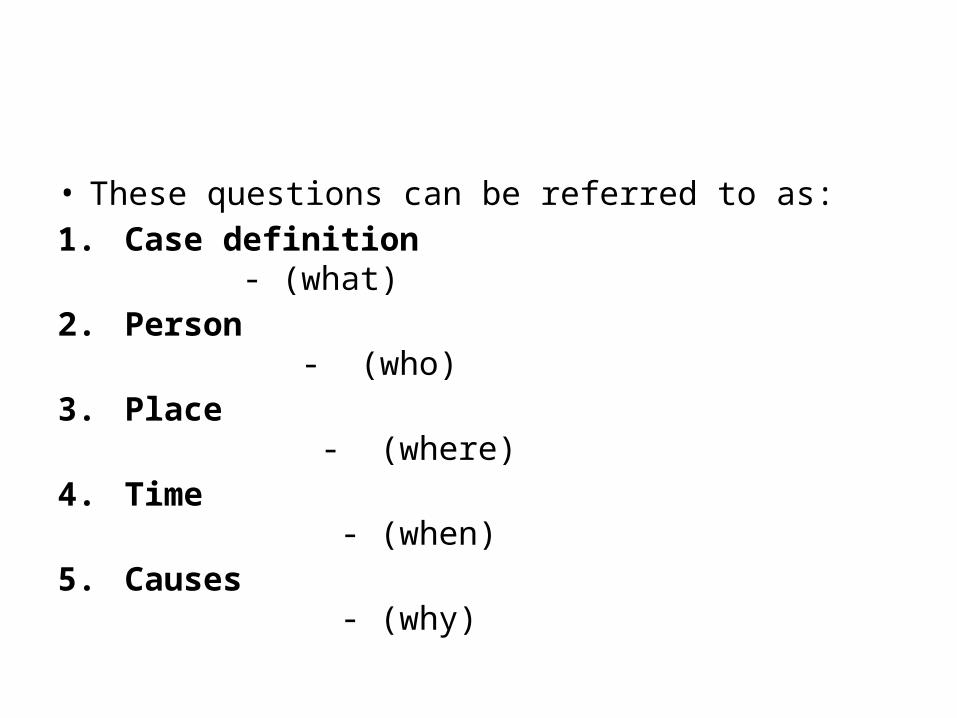
• These questions can be referred to as:1. Case definition - (what)2. Person - (who)3. Place - (where)4. Time - (when) 5. Causes - (why)
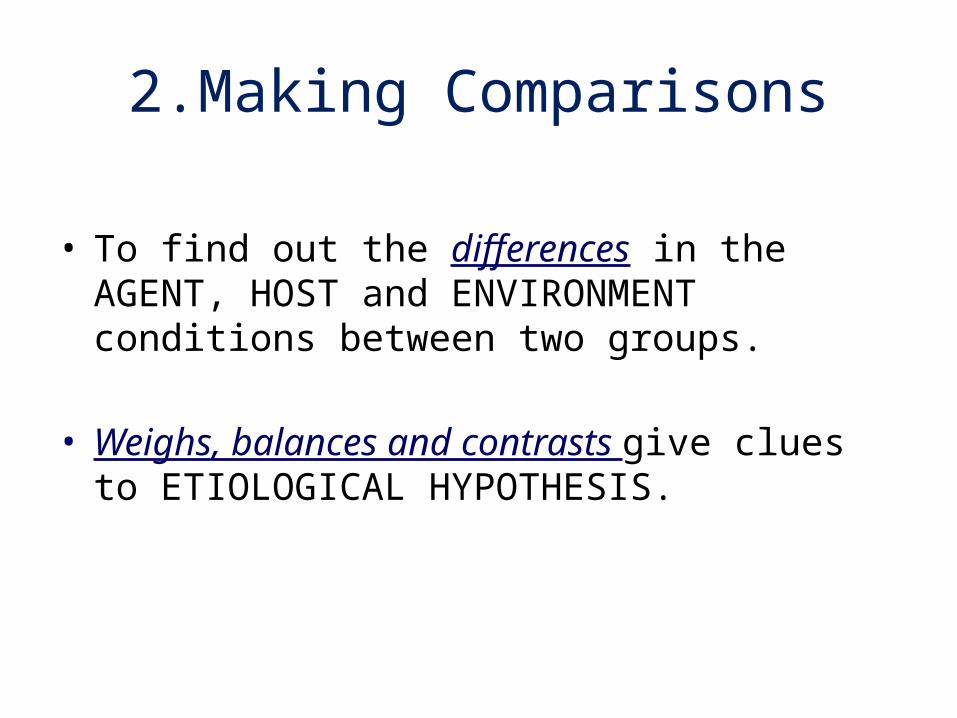
2.Making Comparisons
• To find out the differences in the AGENT, HOST and ENVIRONMENT conditions between two groups.
• Weighs, balances and contrasts give clues to ETIOLOGICAL HYPOTHESIS.
Basic Measurements in Epidemiology
Defining health and disease
Definition – “health is a state of complete physical, mental, and
social well-being and not merely the absence of disease or infirmity”
(WHO in 1948)
• This definition – criticized because of the difficulty in defining and measuring well-being – remains an ideal.
• The World Health Assembly resolved in 1977 that all people should attain a level of health permitting them to lead socially and economically productive lives by the year 2000. (Health for All by 2000)
• Practical definitions of health and disease are needed in epidemiology, which concentrates on aspects of health that are easily measurable and amenable to improvement.
• Definitions of health states used by epidemiologists tend to be simple, for example,
“disease present” or “disease absent”
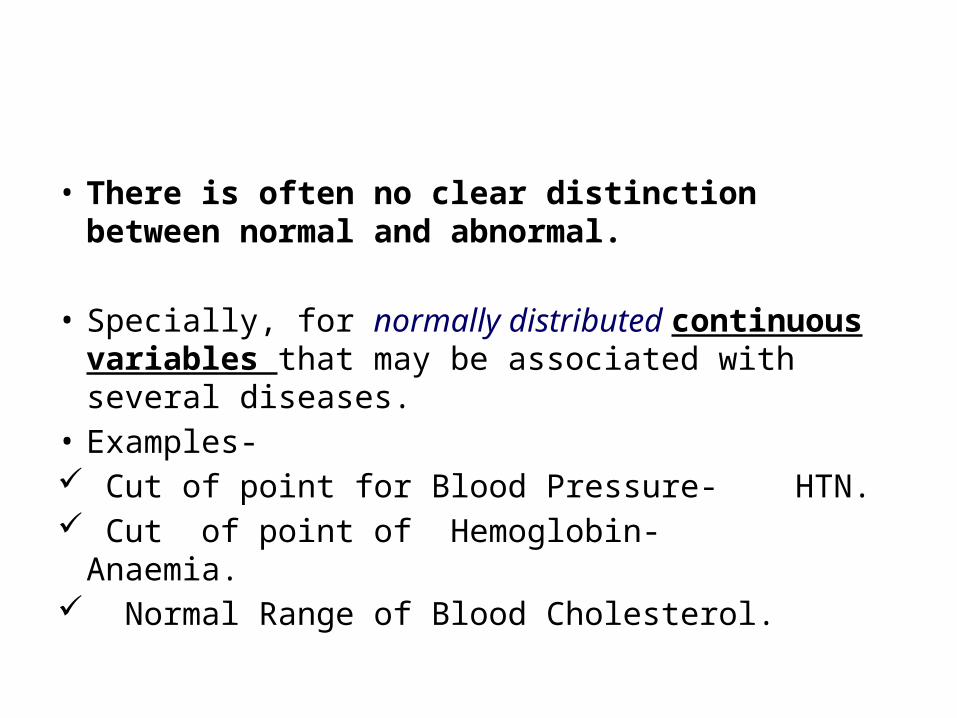
• There is often no clear distinction between normal and abnormal.
• Specially, for normally distributed continuous variables that may be associated with several diseases.
• Examples- Cut of point for Blood Pressure- HTN. Cut of point of Hemoglobin- Anaemia. Normal Range of Blood Cholesterol.
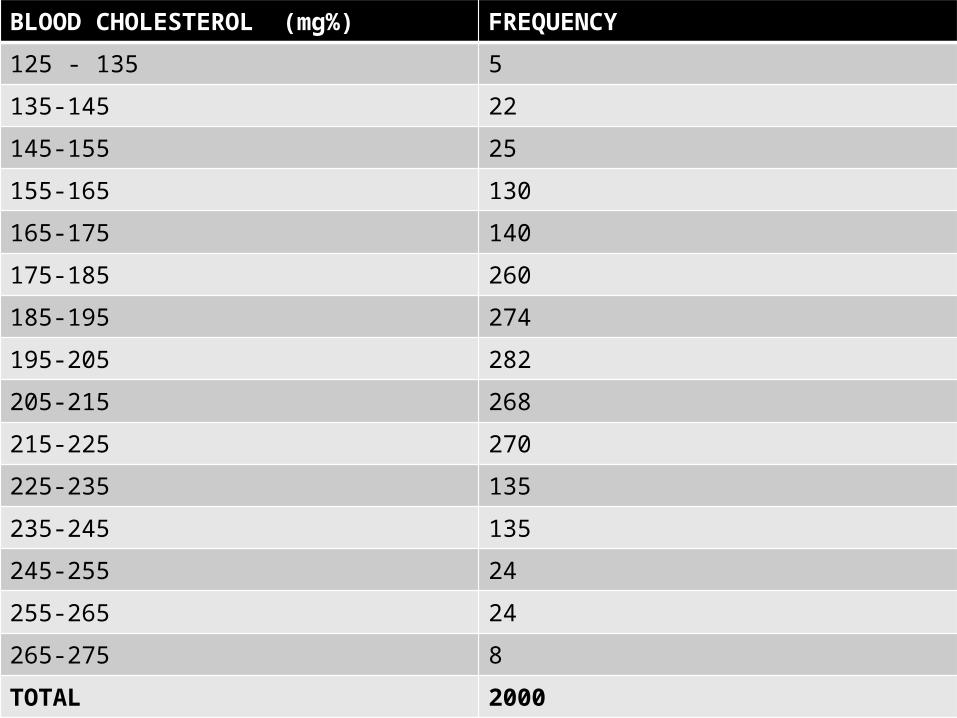
BLOOD CHOLESTEROL (mg%) FREQUENCY
125 - 135 5
135-145 22
145-155 25
155-165 130
165-175 140
175-185 260
185-195 274
195-205 282
205-215 268
215-225 270
225-235 135
235-245 135
245-255 24
255-265 24
265-275 8
TOTAL 2000
MEASURING DISEASE FREQUENCY
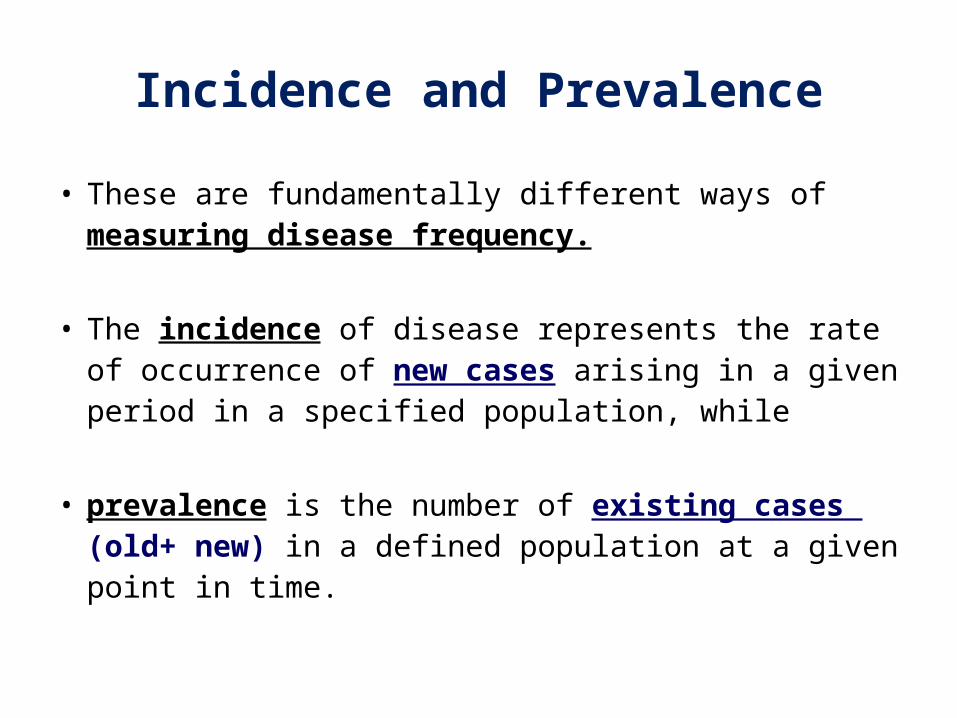
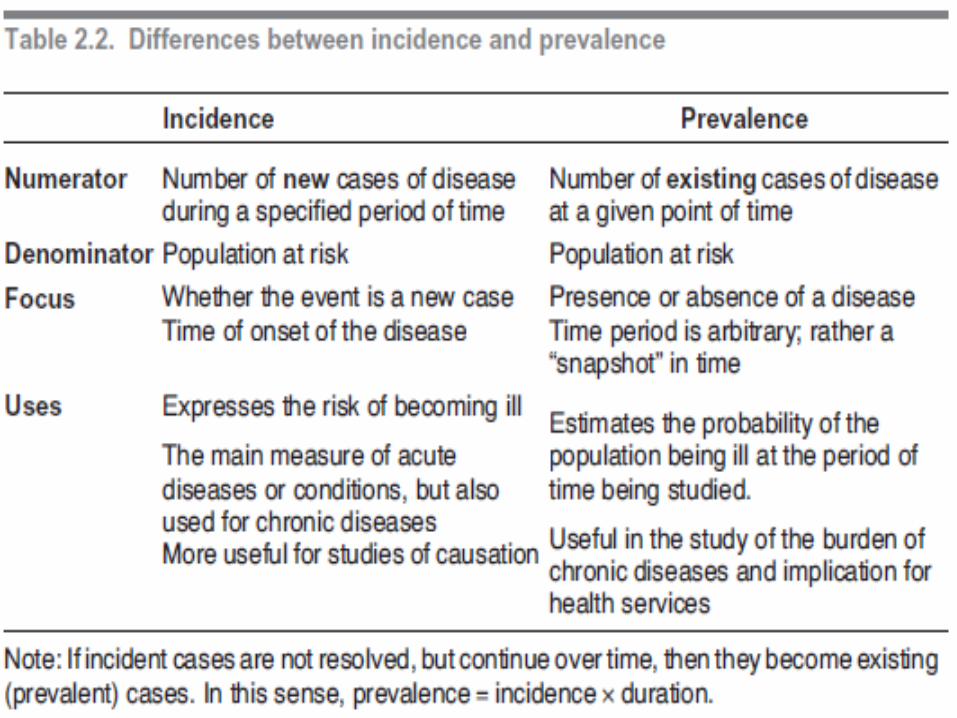
Incidence and Prevalence
• These are fundamentally different ways of measuring disease frequency.
• The incidence of disease represents the rate of occurrence of new cases arising in a given period in a specified population, while
• prevalence is the number of existing cases (old+ new) in a defined population at a given point in time.
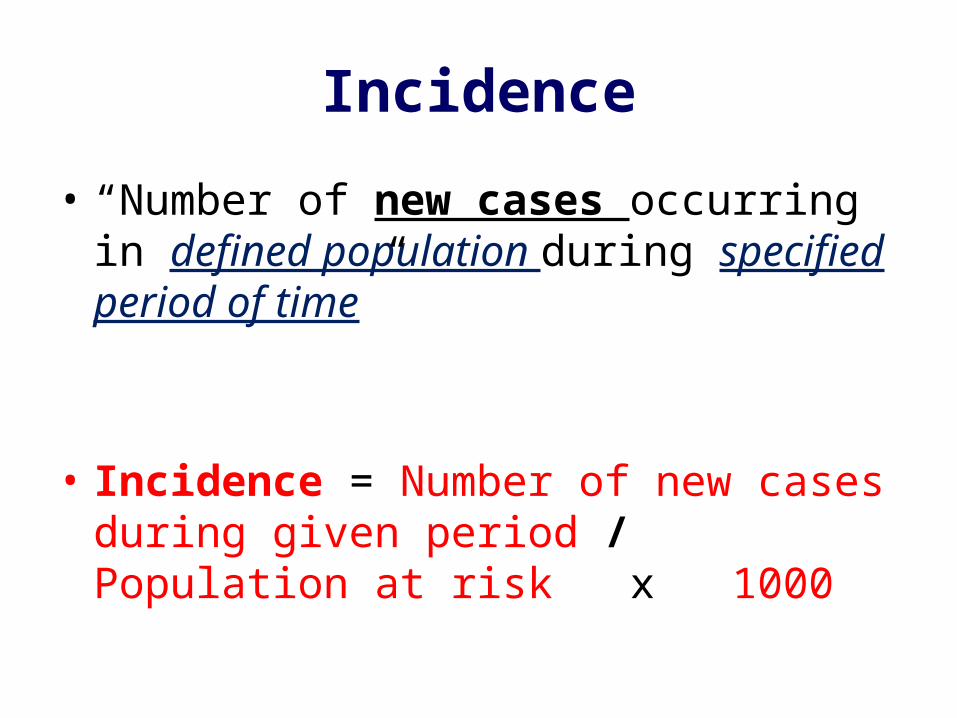
Incidence
• “Number of new cases occurring in defined population during specified period of time”
• Incidence = Number of new cases during given period / Population at risk x 1000
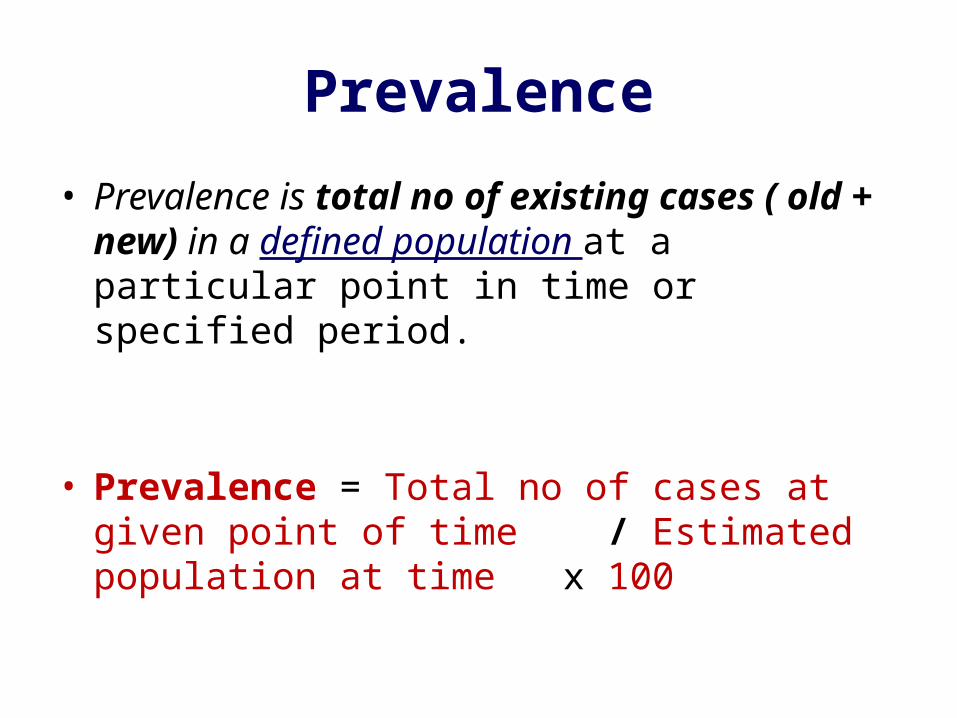
Prevalence• Prevalence is total no of existing cases ( old + new)
in a defined population at a particular point in time or specified period.
• Prevalence = Total no of cases at given point of time / Estimated population at time x 100
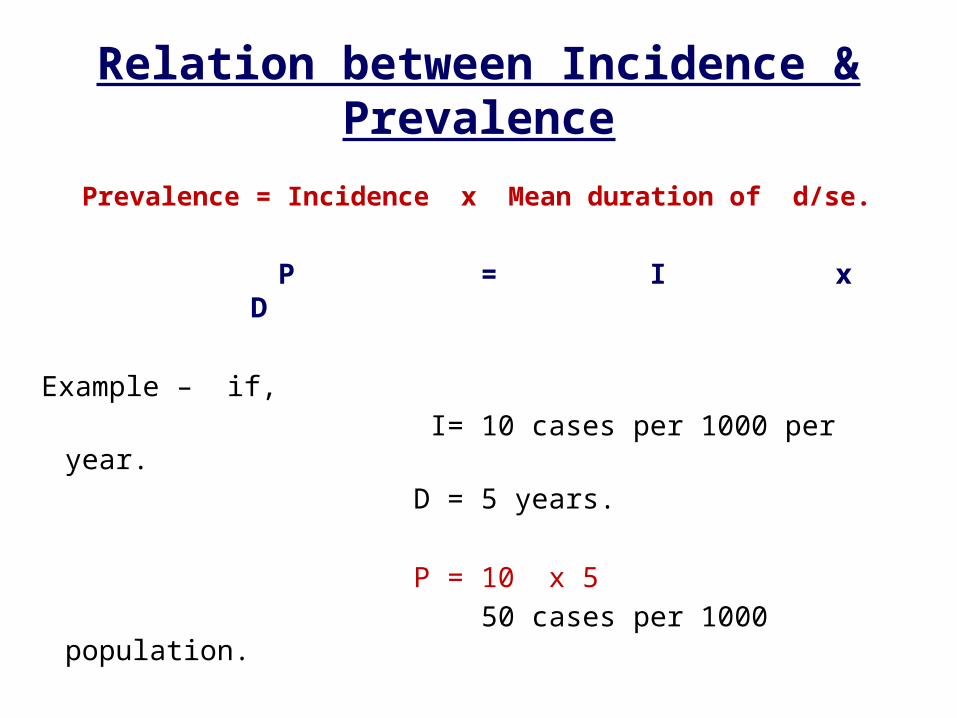
Relation between Incidence & Prevalence
Prevalence = Incidence x Mean duration of d/se. P = I x D
Example – if, I= 10 cases per 1000 per year. D = 5 years. P = 10 x 5 50 cases per 1000 population.
• 1. Point Prevalence
Prevalence for given point of time.
• 2. Period Prevalence Prevalence for specified period.
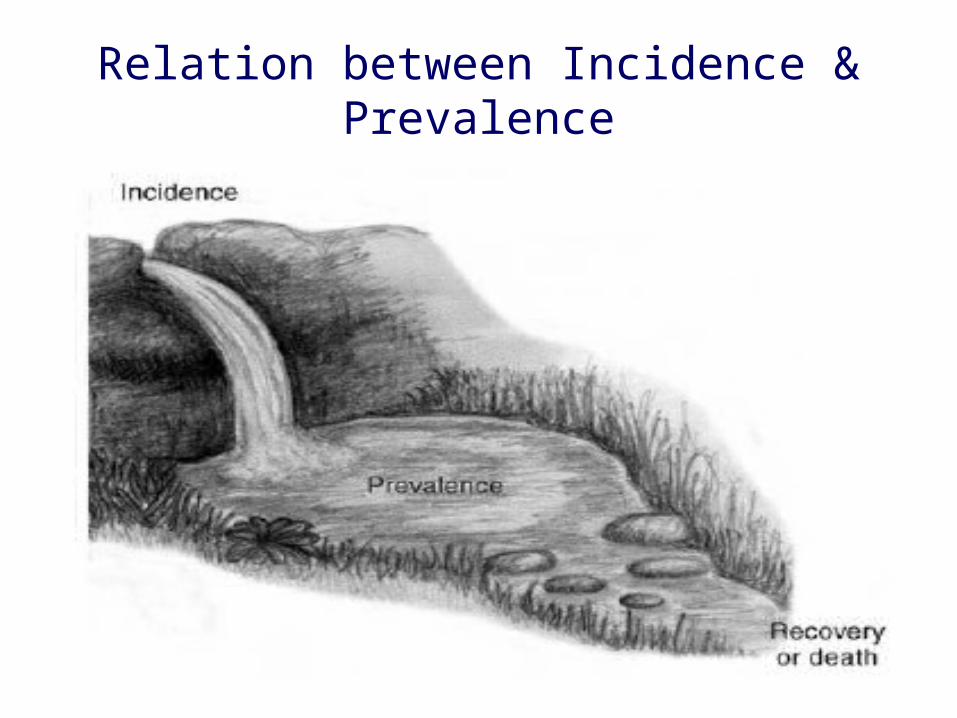
Relation between Incidence & Prevalence
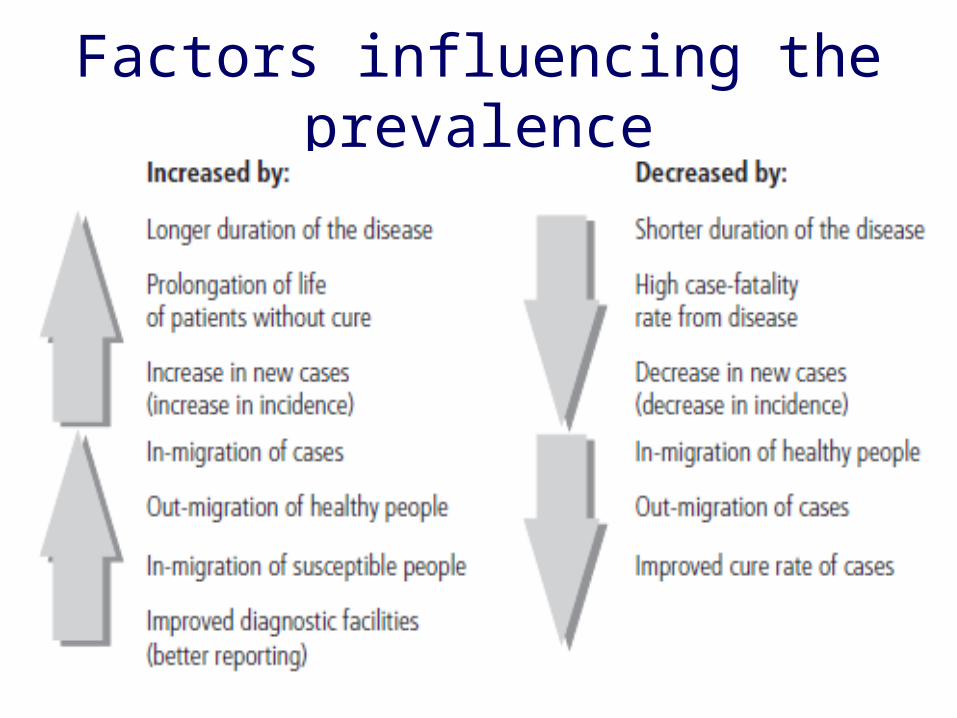
Factors influencing the prevalence
TOOLS OF MEASUREMENTS
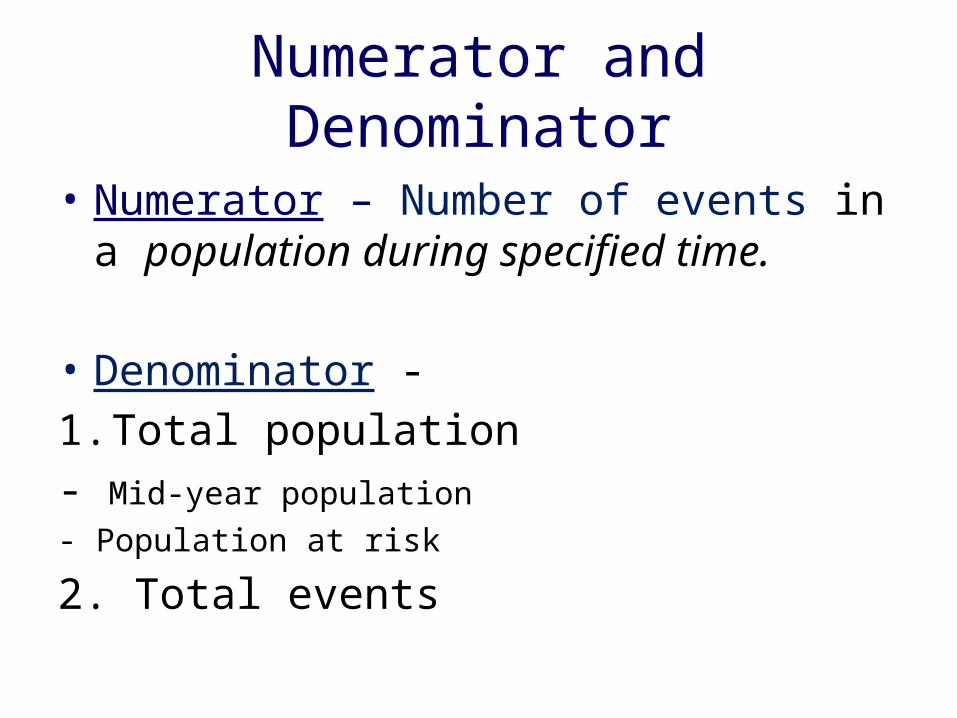
Numerator and Denominator
• Numerator – Number of events in a population during specified time.
• Denominator - 1. Total population- Mid-year population- Population at risk
2. Total events
Tools of Measurements
Basic tools are -
• 1. Rate
• 2. Ratio
• 3. Proportion
• Used for expression of disease magnitude.
Rate• A “Rate” measures the occurrence of some specific event in
a population during given time period.
• Example –
Death Rate = total no of death in 1 yr / Mid-year population x 1000.
ELEMENTS – Numerator, Denominator, time & multiplier.
Ratio
• Ratio measures the relationship of size of two random quantities.
• Numerator is not component of denominator. • Ratio = x / y
• Example- - Sex – Ratio- Doctor Population Ratio.
Proportion
• Proportion is ratio which indicates the relation in a magnitude of a part of whole.
• The Numerator is always part of Denominator.
• Usually expressed in percentage.
SCOPE OF MEASUREMENTS IN EPIDEMIOLOGY
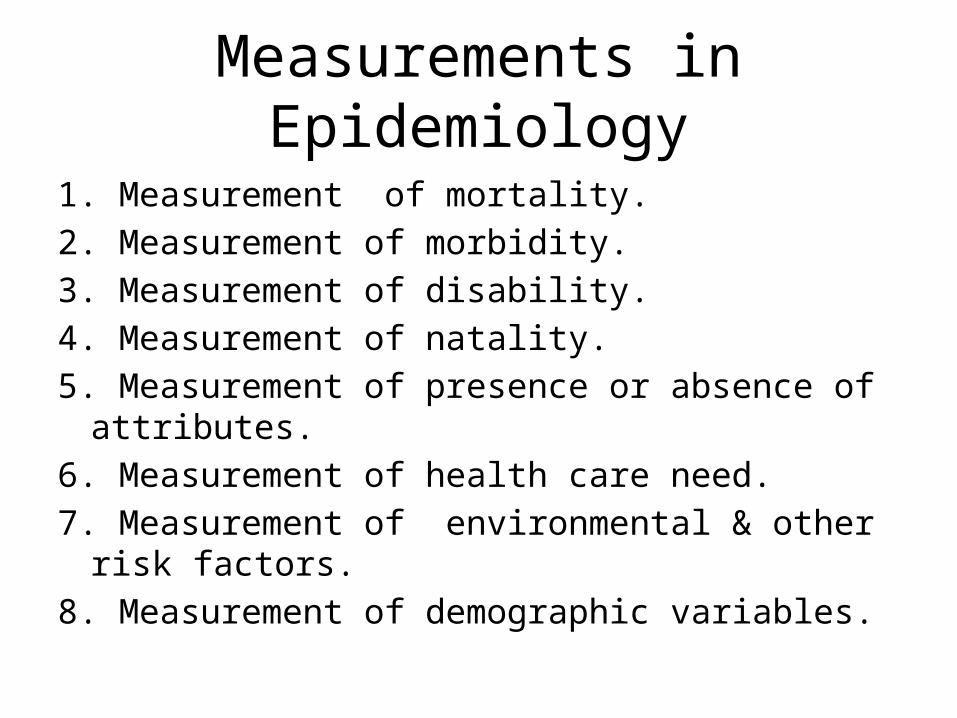
Measurements in Epidemiology
1. Measurement of mortality.2. Measurement of morbidity.3. Measurement of disability.4. Measurement of natality.5. Measurement of presence or absence of attributes.6. Measurement of health care need.7. Measurement of environmental & other risk factors.8. Measurement of demographic variables.

EPIDEMIOLOGIC RESEARCH METHODS
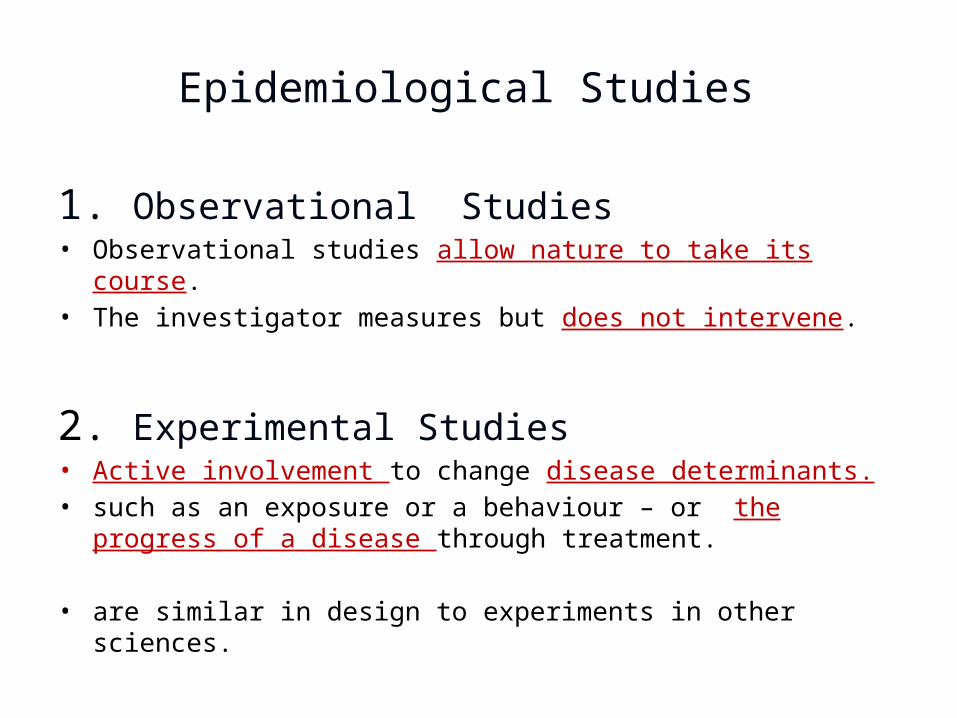
Epidemiological Studies
1. Observational Studies• Observational studies allow nature to take its course.• The investigator measures but does not intervene.
2. Experimental Studies• Active involvement to change disease determinants.• such as an exposure or a behaviour – or the progress of a disease through
treatment. • are similar in design to experiments in other sciences.
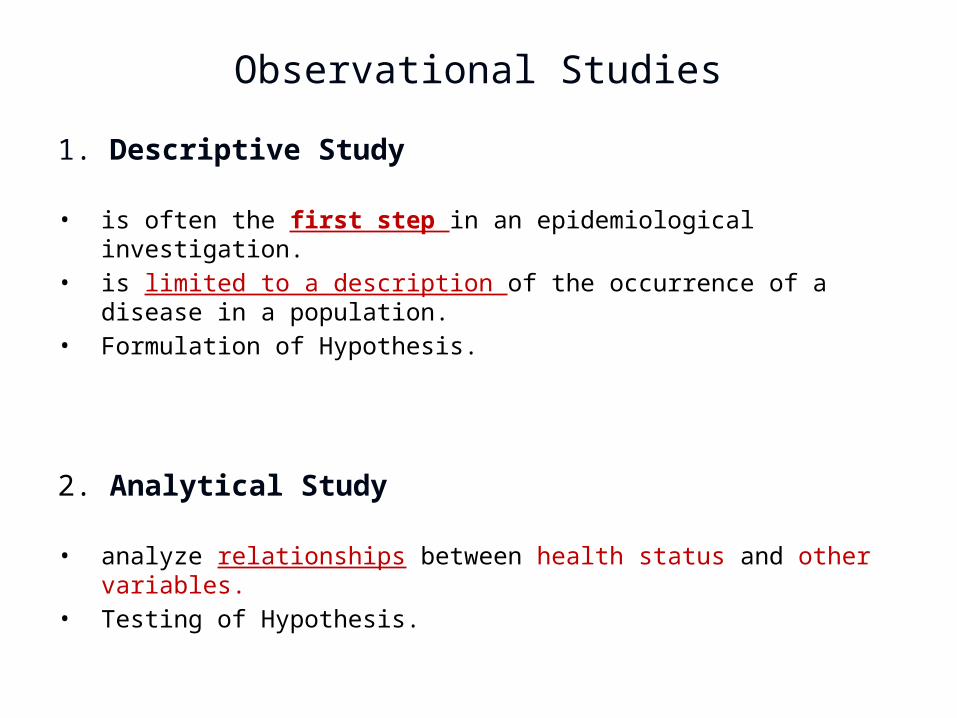
Observational Studies
1. Descriptive Study
• is often the first step in an epidemiological investigation.• is limited to a description of the occurrence of a disease in a population.• Formulation of Hypothesis.
2. Analytical Study
• analyze relationships between health status and other variables.• Testing of Hypothesis.
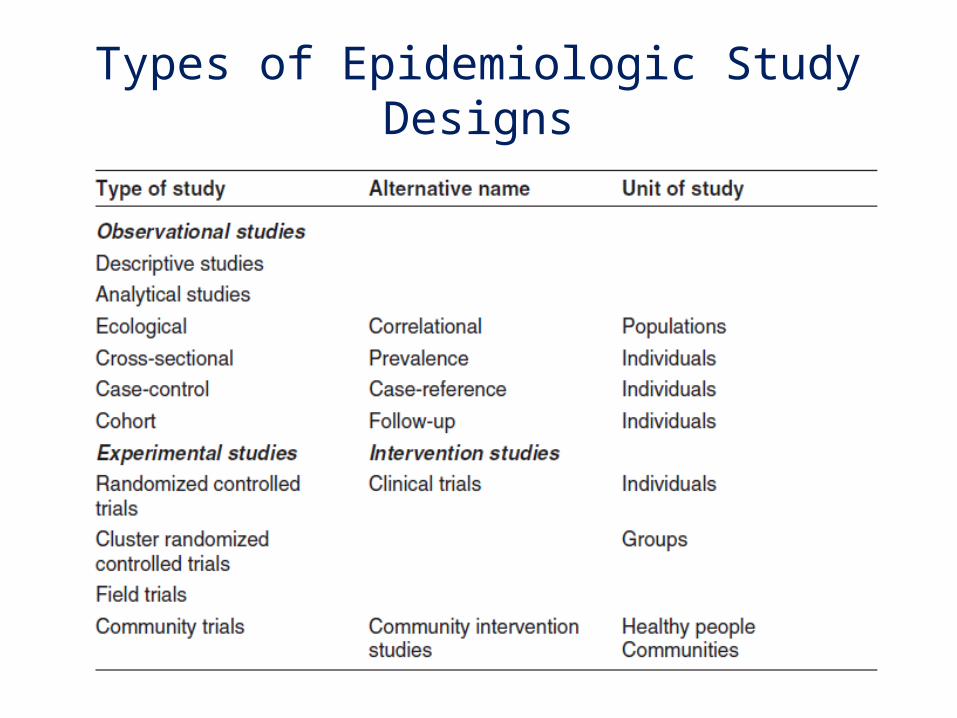
Types of Epidemiologic Study Designs
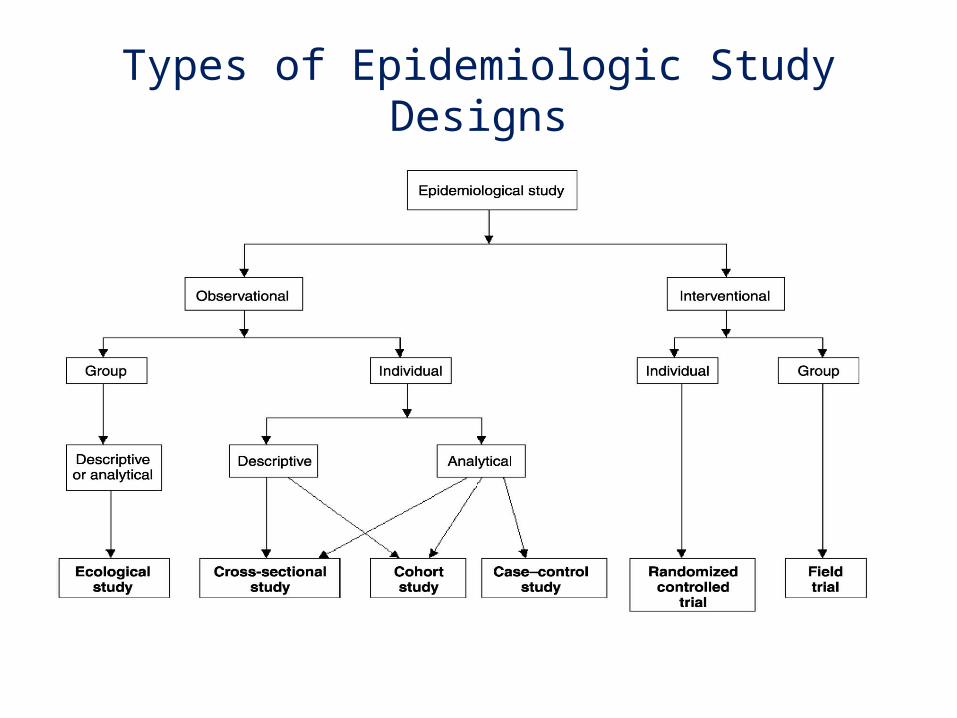
Types of Epidemiologic Study Designs
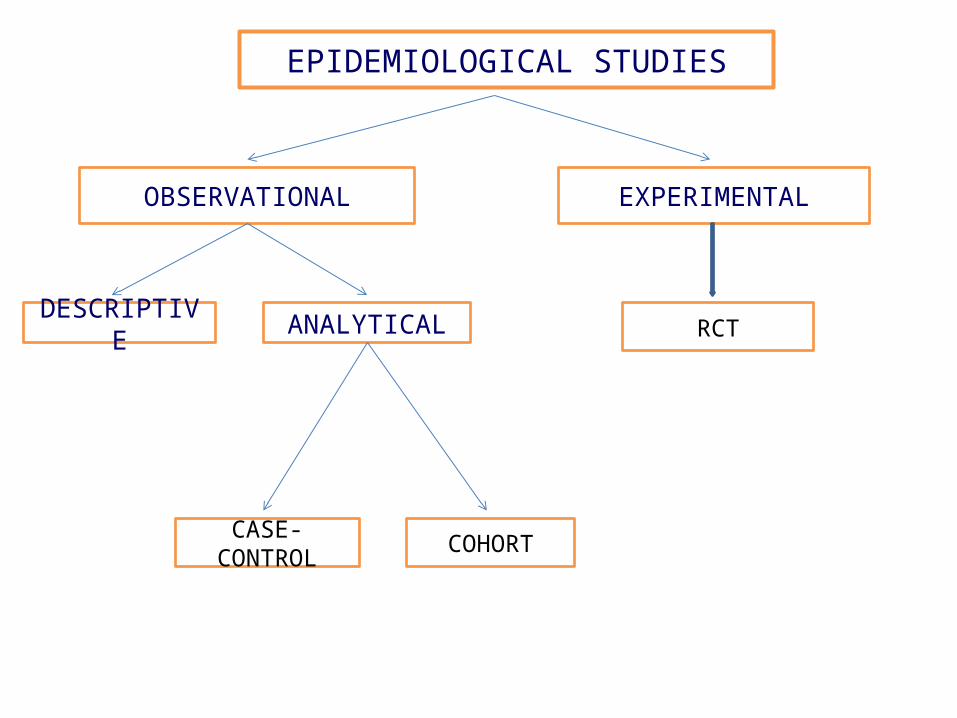
OBSERVATIONAL EXPERIMENTAL
DESCRIPTIVE ANALYTICAL
CASE-CONTROL COHORT
EPIDEMIOLOGICAL STUDIES
RCT
OBSERVATIONAL - EPIDEMIOLOGY
Descriptive Epidemiologic Studies
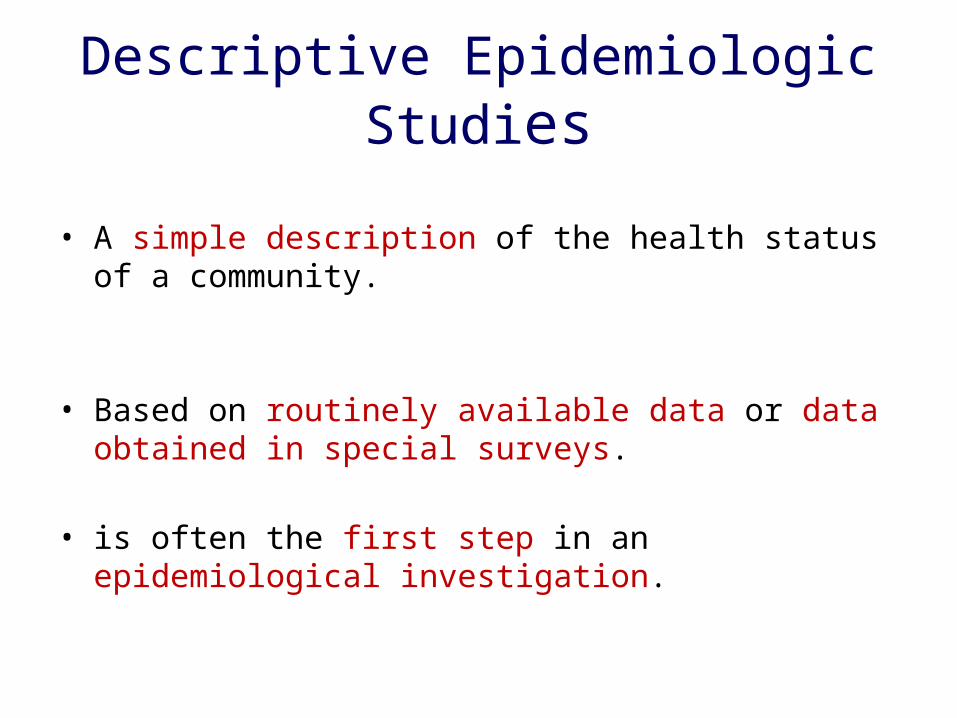
• A simple description of the health status of a community.
• Based on routinely available data or data obtained in special surveys.
• is often the first step in an epidemiological investigation.
Procedure in Descriptive Studies
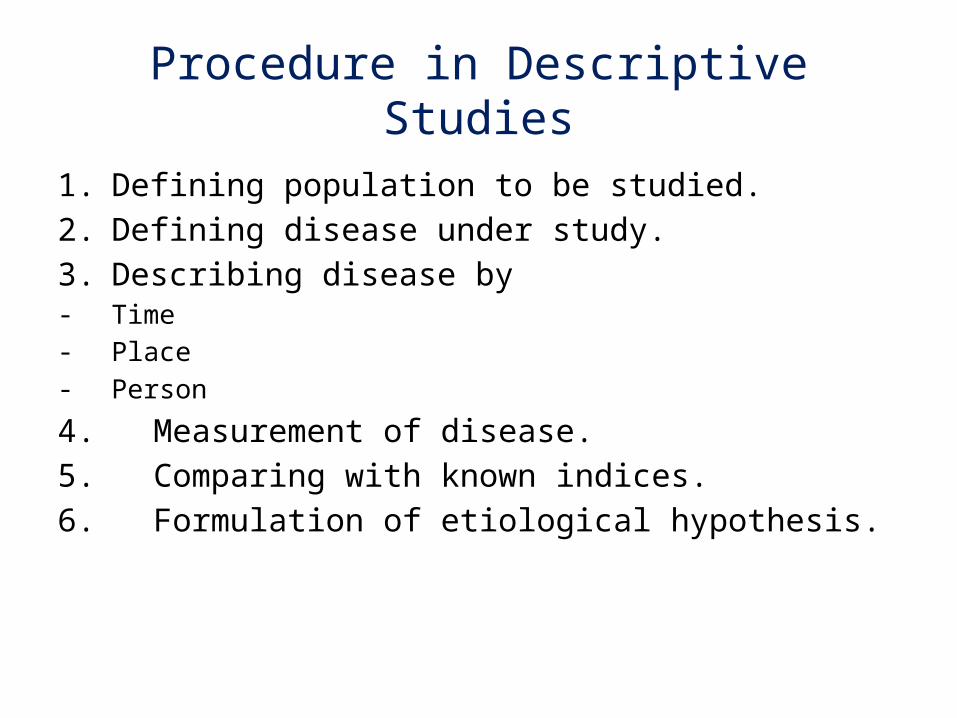
1. Defining population to be studied.2. Defining disease under study.3. Describing disease by - Time- Place- Person
4. Measurement of disease.5. Comparing with known indices.6. Formulation of etiological hypothesis.
1. Defining population to be studied.
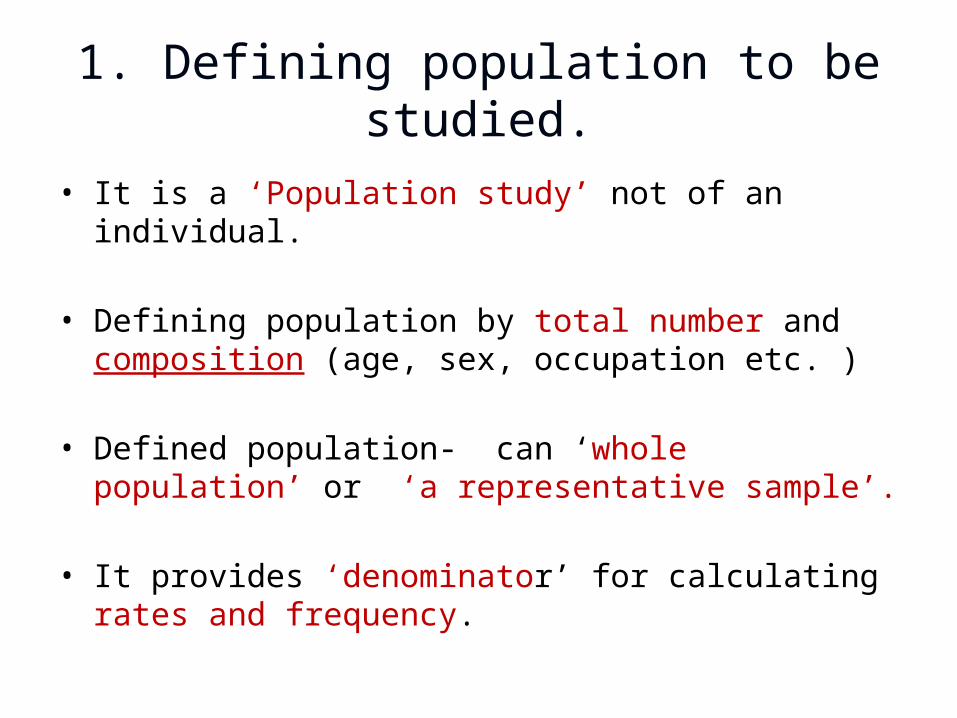
• It is a ‘Population study’ not of an individual. • Defining population by total number and composition (age,
sex, occupation etc. )
• Defined population- can ‘whole population’ or ‘a representative sample’.
• It provides ‘denominator’ for calculating rates and frequency.
2. Defining disease under study.
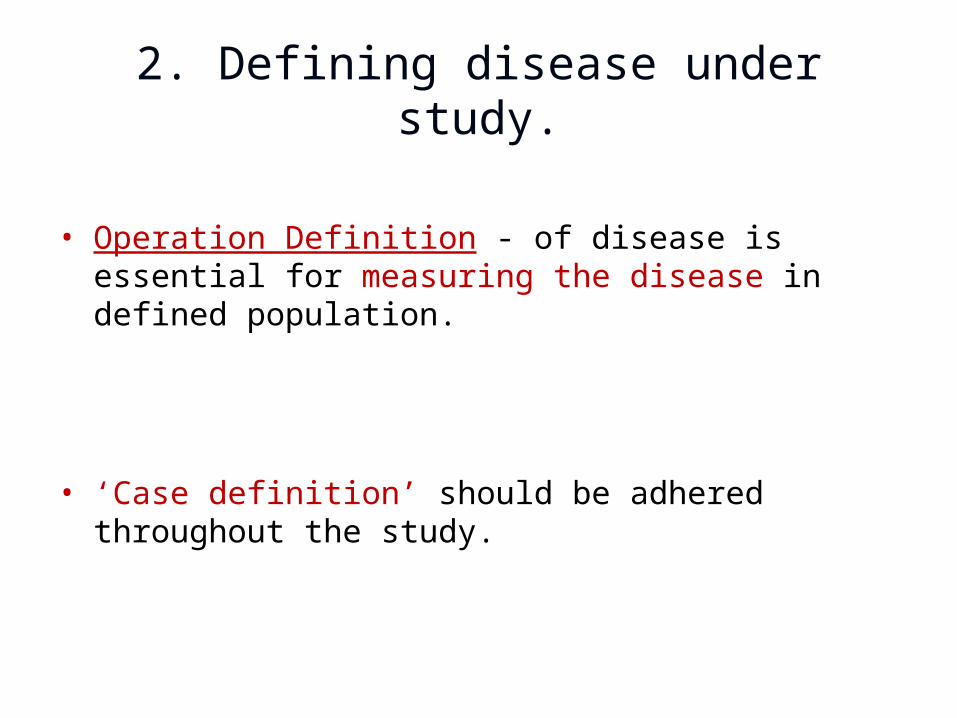
• Operation Definition - of disease is essential for measuring the disease in defined population.
• ‘Case definition’ should be adhered throughout the study.
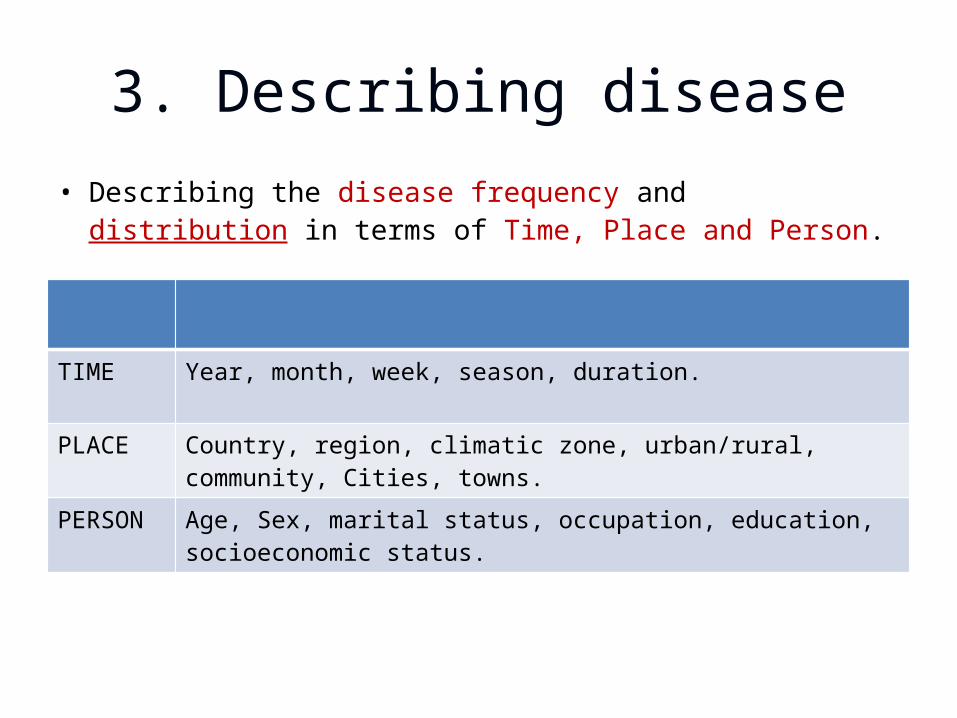
3. Describing disease
TIME Year, month, week, season, duration.
PLACE Country, region, climatic zone, urban/rural, community, Cities, towns.
PERSON Age, Sex, marital status, occupation, education, socioeconomic status.
• Describing the disease frequency and distribution in terms of Time, Place and Person.
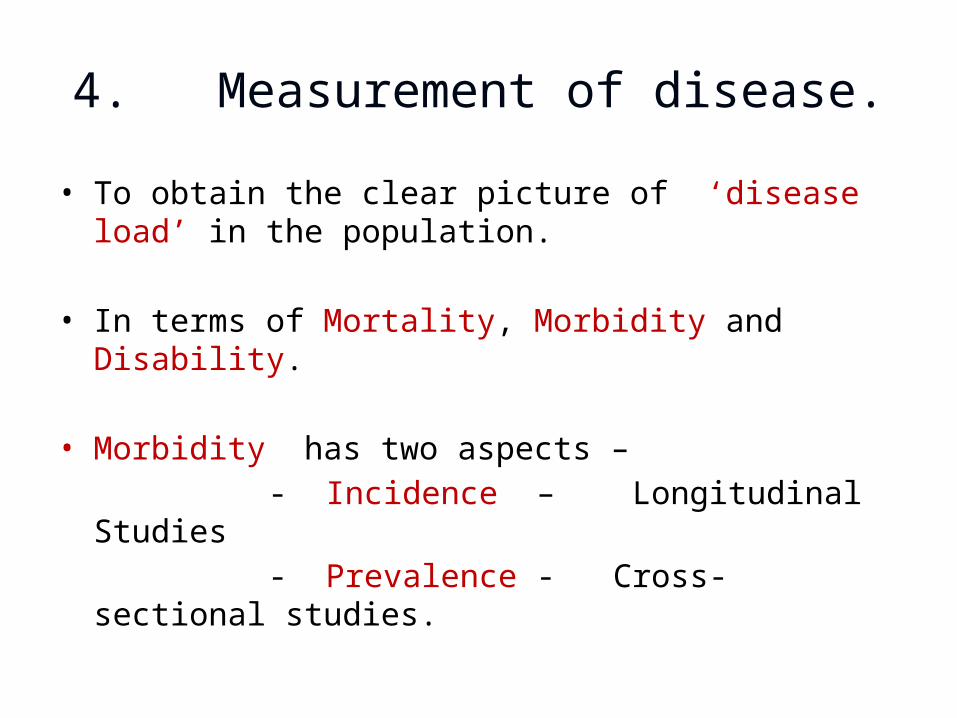
4. Measurement of disease.• To obtain the clear picture of ‘disease load’ in the population.
• In terms of Mortality, Morbidity and Disability.
• Morbidity has two aspects – - Incidence – Longitudinal Studies - Prevalence - Cross-sectional studies.
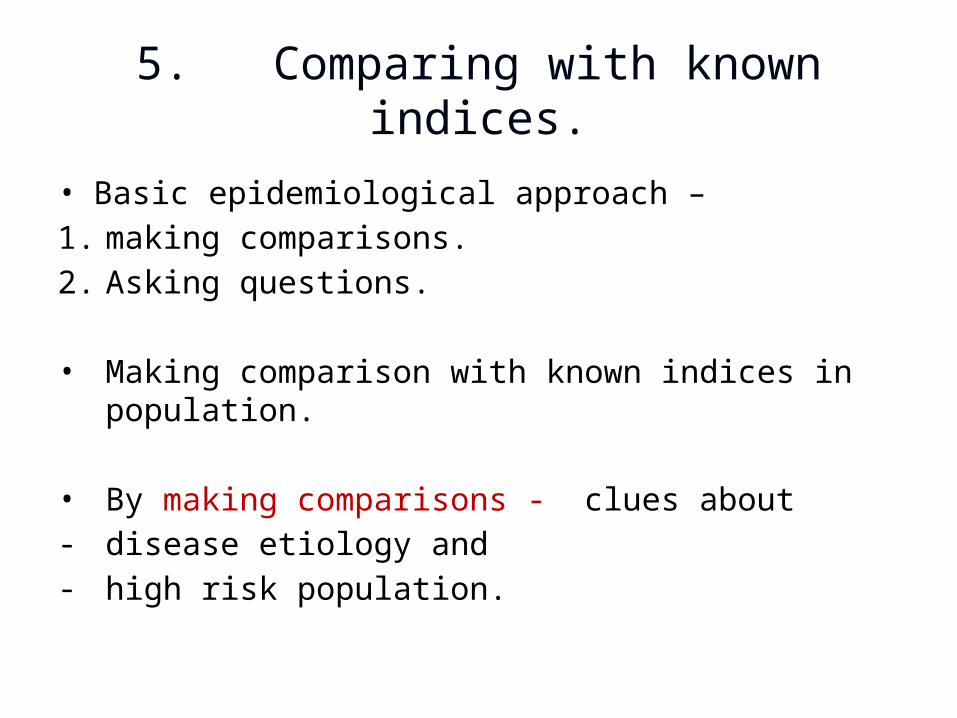
5. Comparing with known indices.
• Basic epidemiological approach – 1. making comparisons.2. Asking questions.
• Making comparison with known indices in population.
• By making comparisons - clues about - disease etiology and - high risk population.
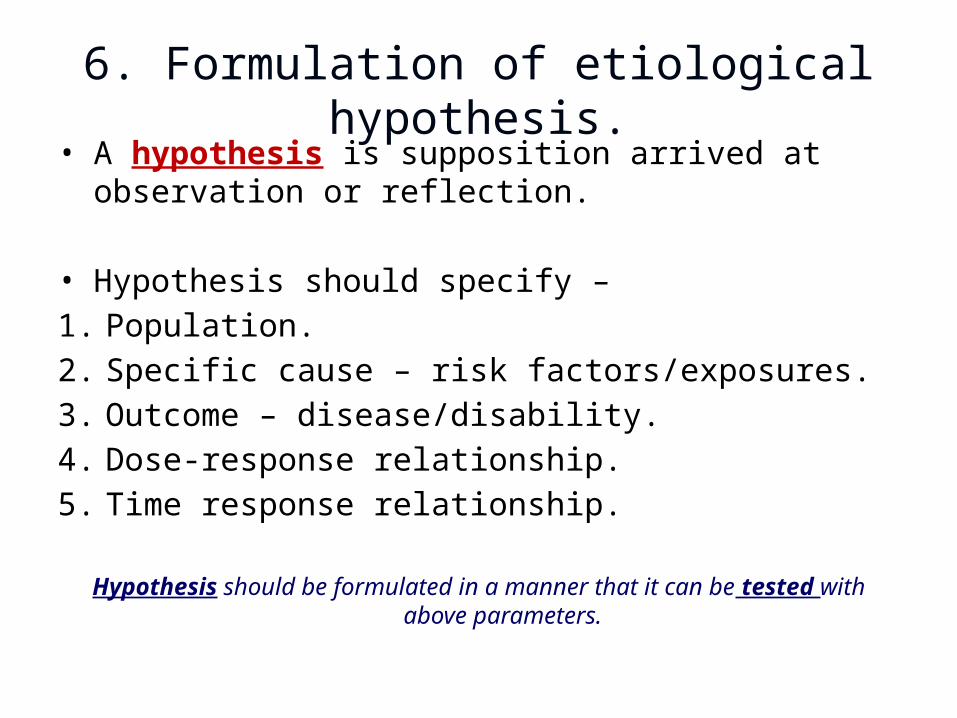
6. Formulation of etiological hypothesis.• A hypothesis is supposition arrived at observation or
reflection.
• Hypothesis should specify –1. Population.2. Specific cause – risk factors/exposures.3. Outcome – disease/disability.4. Dose-response relationship.5. Time response relationship.
Hypothesis should be formulated in a manner that it can be tested with above parameters.
• Hypothesis- “Cigarette smoking causes lung cancer”
• Improved- “Smoking 30-40 Cigarette /day for 20 years of causes lung
cancer in 10% of smokers.”
TESTING OF HYPOTHESIS ‘Hypothesis’ can be accepted or rejected by using the techniques of
Analytical Epidemiology
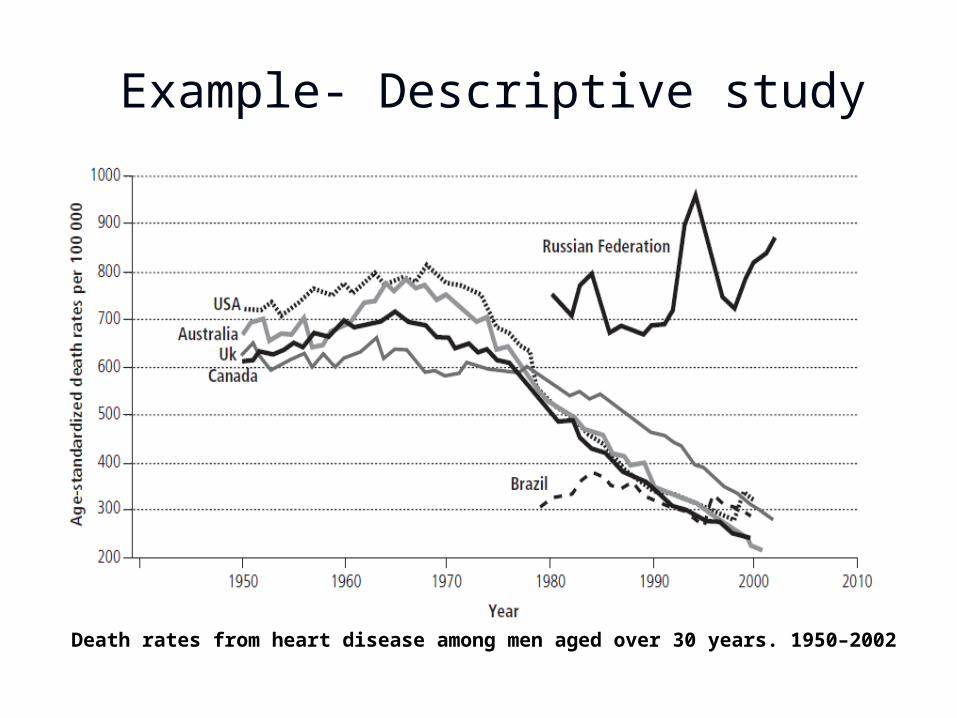
Example- Descriptive study
Death rates from heart disease among men aged over 30 years. 1950–2002
Uses of Descriptive Epidemiology
1. Provide data of magnitude of problem- disease load.
2. Provide clues for etiology.
3. Provide background data for planning, organizing and evaluating the preventive and curative services.
4. Contributes to research.
ANALYTICAL EPIDEMIOLOGY
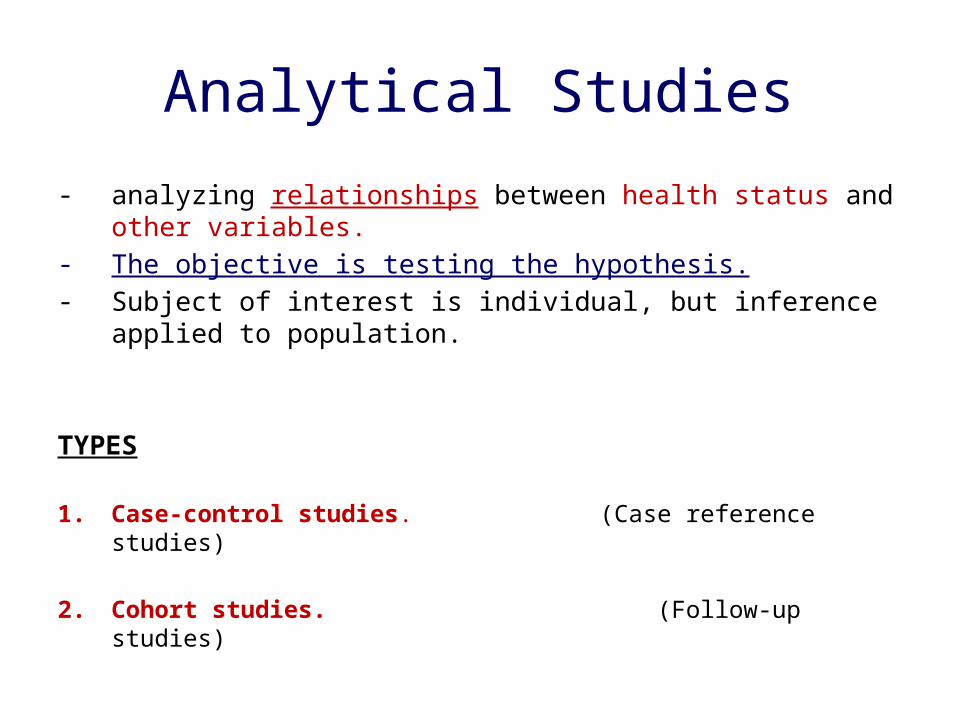
Analytical Studies- analyzing relationships between health status and other variables.- The objective is testing the hypothesis.- Subject of interest is individual, but inference applied to population.
TYPES
1. Case-control studies. (Case reference studies)
2. Cohort studies. (Follow-up studies)
1. Case-control studies. 2. Cohort studies.
By analytical studies we can determine-
3. Statistical association. (between disease and suspected factor)4. Strength of association.
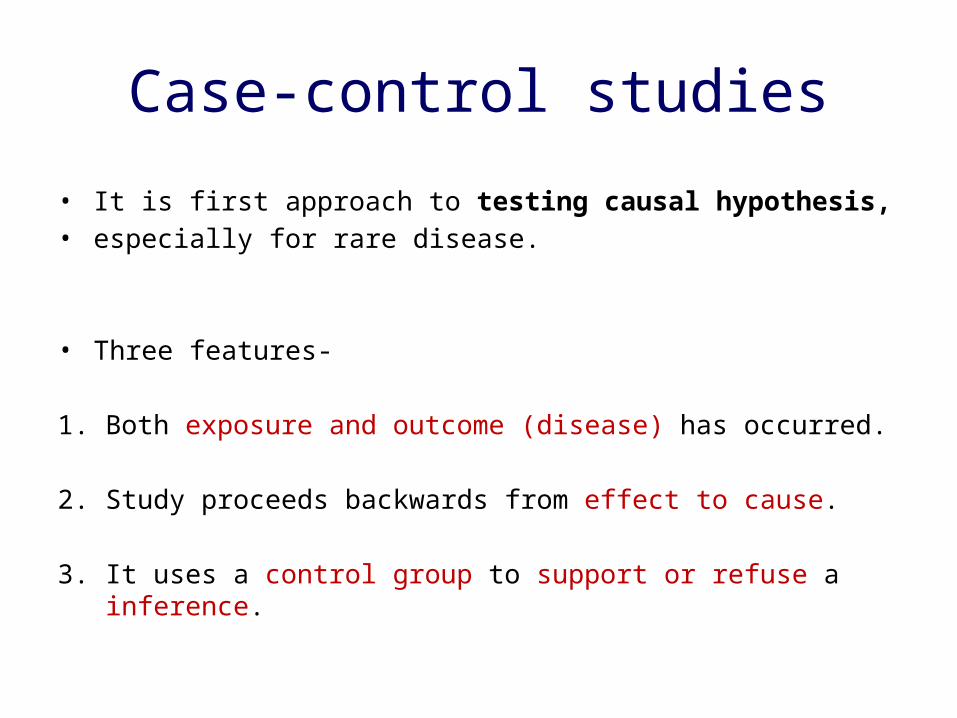
Case-control studies
• It is first approach to testing causal hypothesis,• especially for rare disease.
• Three features-
1. Both exposure and outcome (disease) has occurred.
2. Study proceeds backwards from effect to cause.
3. It uses a control group to support or refuse a inference.
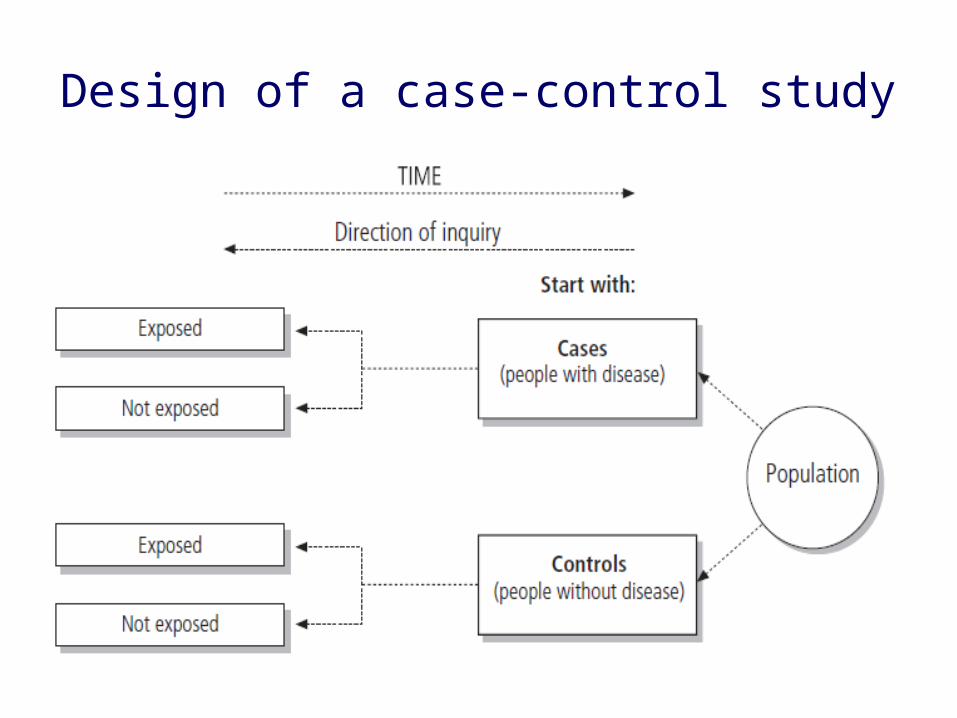
Design of a case-control study
Basic steps in Case-control study
1. Selection of cases and controls.
2. Matching.
3. Measurement of exposure.
4. Analysis and interpretation.
1. Selection of cases and controls
• CASES - Case definition – (Diagnostic criteria and Eligibility criteria.)- Source of Cases – (Hospital or General population)
• CONTROLS- Free from the disease under study.- Similar to the cases in all other aspects.- Source- Hospital, Relative, Neighbourhood, General population
2. Matching.
• Matching is process by we selecting controls in a manner that they are similar to cases in all variables.
• Matching is essential for comparability and for elimination of confounding bias.
• A Confounding factor is a factor which associated with both exposure and disease and unequally distributed in study and control groups.
• Exm- 1. Alcohol in esophageal cancer, smoking is confounding factor. 2. Age for steroid contraceptive are causative in Breast cancer.
• Matching procedure –- Group matching (Strata matching).- Pair matching.
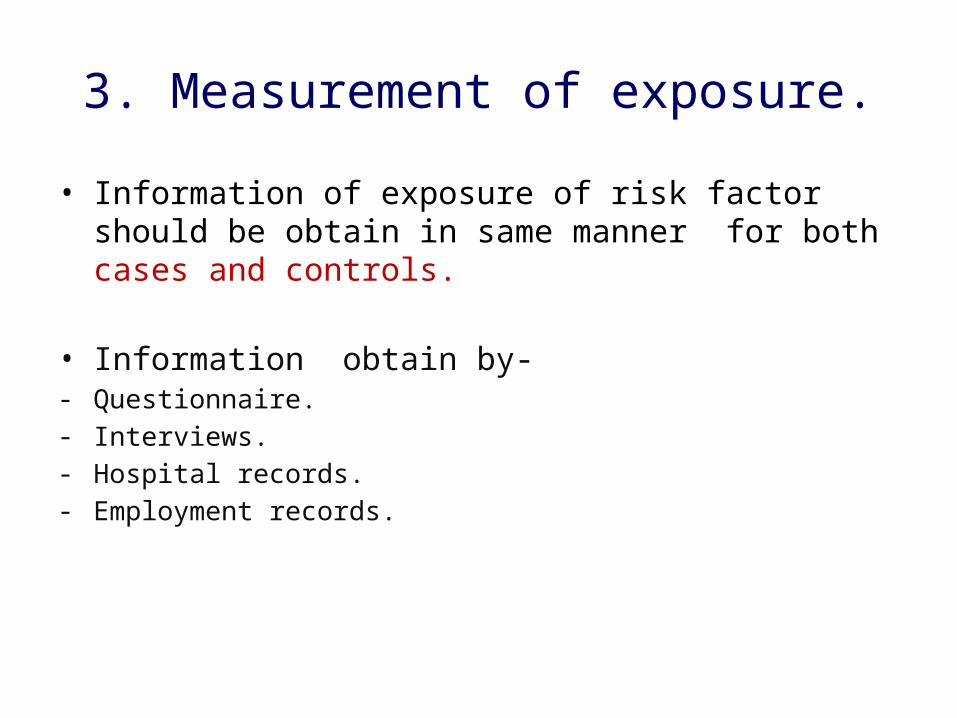
3. Measurement of exposure.
• Information of exposure of risk factor should be obtain in same manner for both cases and controls.
• Information obtain by- - Questionnaire.- Interviews.- Hospital records.- Employment records.
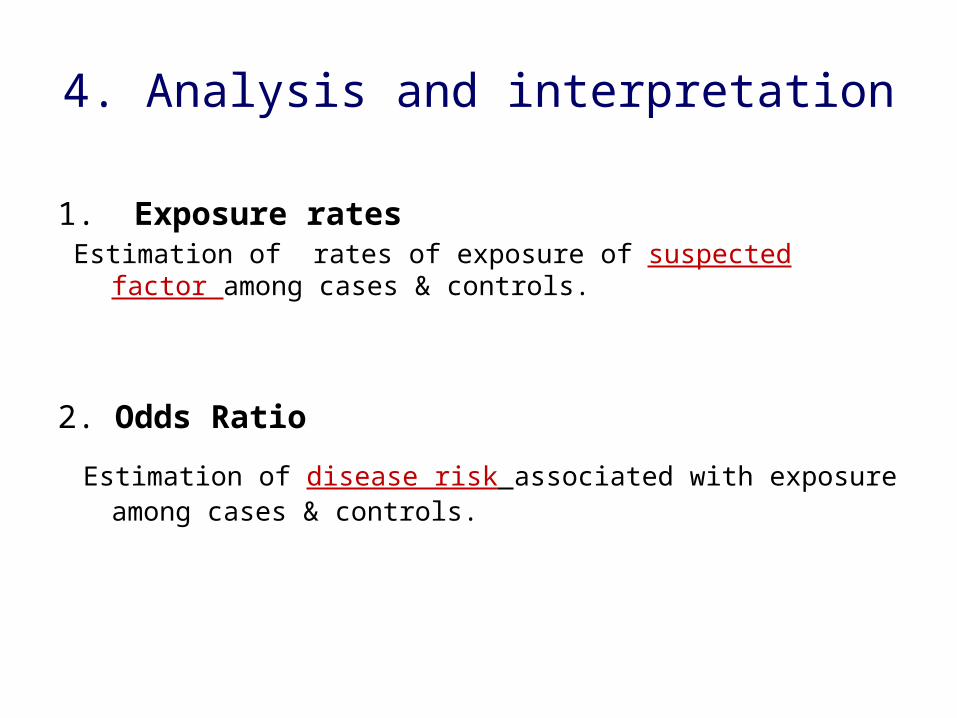
4. Analysis and interpretation
1. Exposure rates Estimation of rates of exposure of suspected factor among cases & controls.
2. Odds Ratio
Estimation of disease risk associated with exposure among cases & controls.
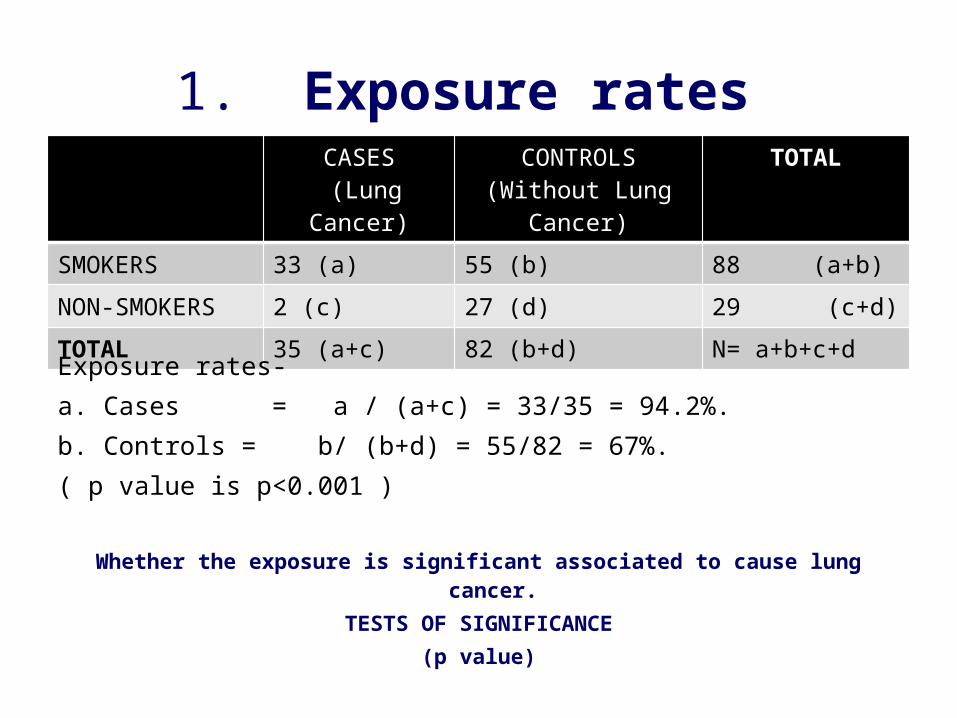
1. Exposure rates CASES
(Lung Cancer)CONTROLS
(Without Lung Cancer)TOTAL
SMOKERS 33 (a) 55 (b) 88 (a+b)
NON-SMOKERS 2 (c) 27 (d) 29 (c+d)
TOTAL 35 (a+c) 82 (b+d) N= a+b+c+d
Exposure rates- a. Cases = a / (a+c) = 33/35 = 94.2%.b. Controls = b/ (b+d) = 55/82 = 67%.( p value is p<0.001 )
Whether the exposure is significant associated to cause lung cancer.TESTS OF SIGNIFICANCE
(p value)
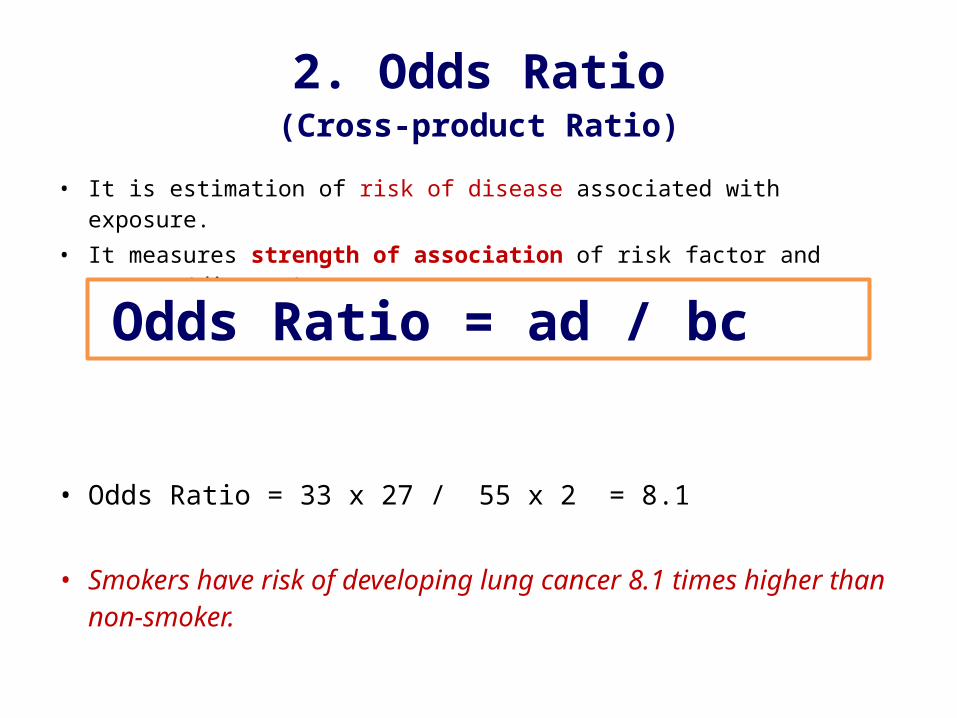
2. Odds Ratio(Cross-product Ratio)
• It is estimation of risk of disease associated with exposure.• It measures strength of association of risk factor and outcome(disease).
• Odds Ratio = 33 x 27 / 55 x 2 = 8.1
• Smokers have risk of developing lung cancer 8.1 times higher than non-smoker.
Odds Ratio = ad / bc
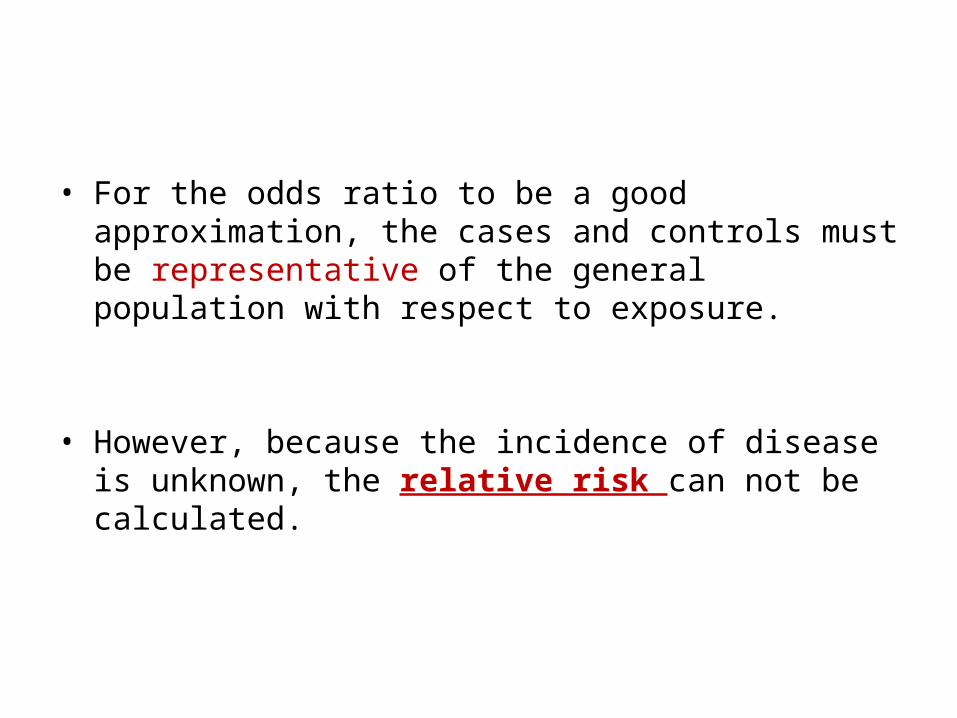
• For the odds ratio to be a good approximation, the cases and controls must be representative of the general population with respect to exposure.
• However, because the incidence of disease is unknown, the relative risk can not be calculated.
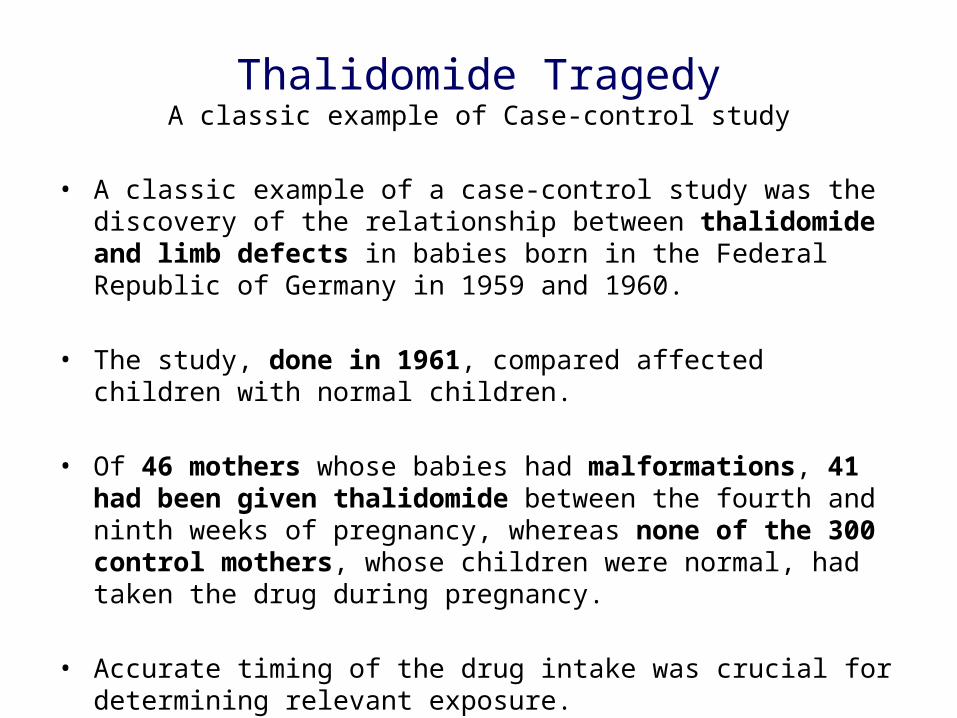
Thalidomide TragedyA classic example of Case-control study
• A classic example of a case-control study was the discovery of the relationship between thalidomide and limb defects in babies born in the Federal Republic of Germany in 1959 and 1960.
• The study, done in 1961, compared affected children with normal children.
• Of 46 mothers whose babies had malformations, 41 had been given thalidomide between the fourth and ninth weeks of pregnancy, whereas none of the 300 control mothers, whose children were normal, had taken the drug during pregnancy.
• Accurate timing of the drug intake was crucial for determining relevant exposure.
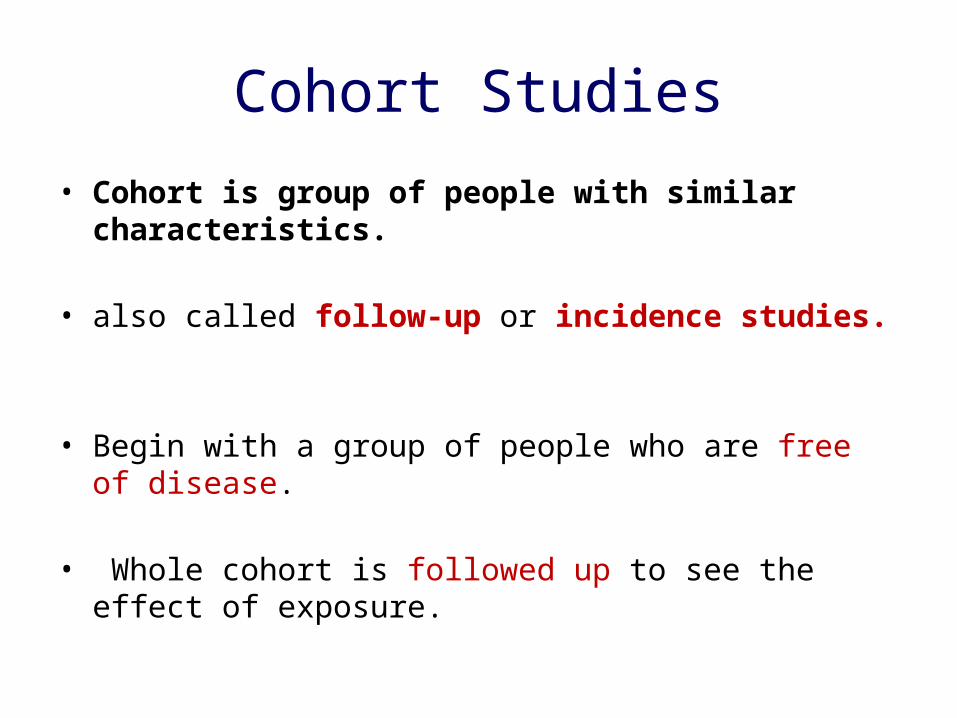
Cohort Studies• Cohort is group of people with similar characteristics.
• also called follow-up or incidence studies.
• Begin with a group of people who are free of disease.
• Whole cohort is followed up to see the effect of exposure.
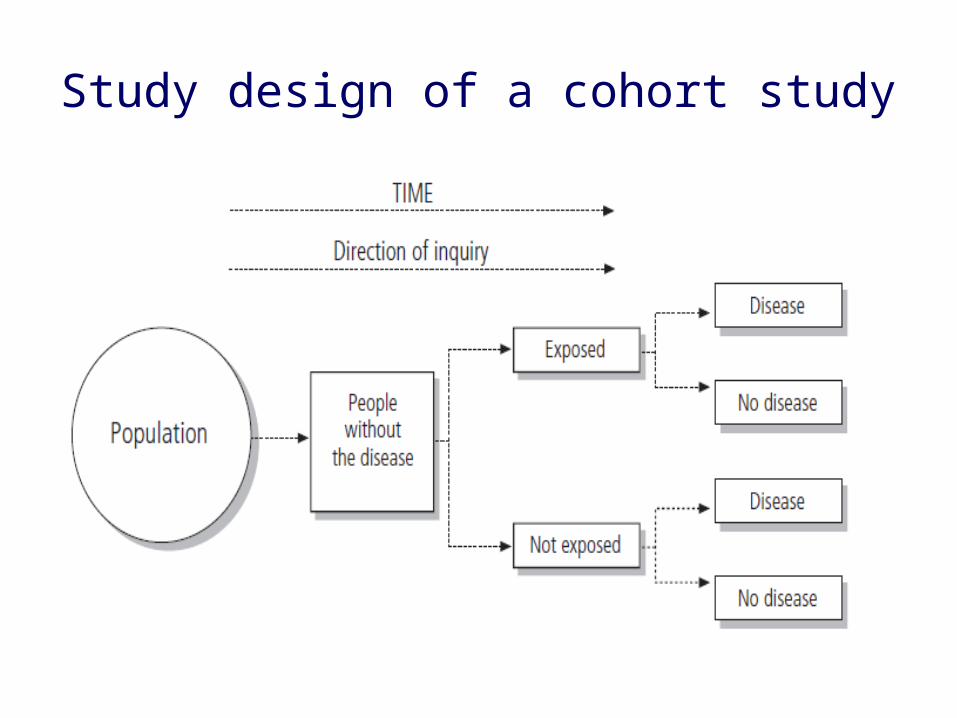
Study design of a cohort study
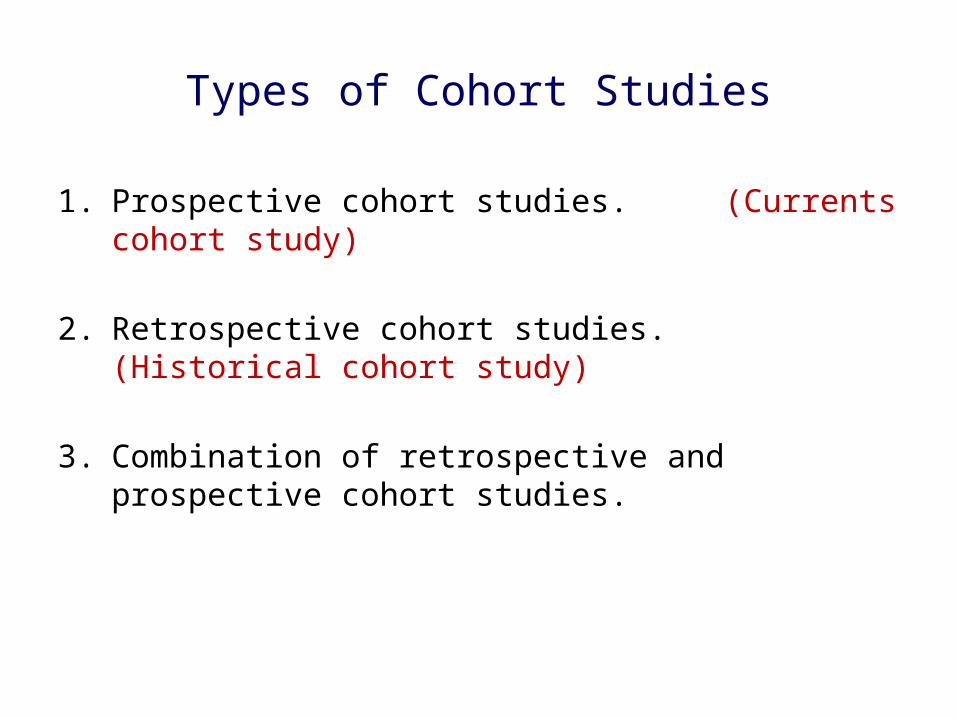
Types of Cohort Studies
1. Prospective cohort studies. (Currents cohort study)
2. Retrospective cohort studies. (Historical cohort study)
3. Combination of retrospective and prospective cohort studies.
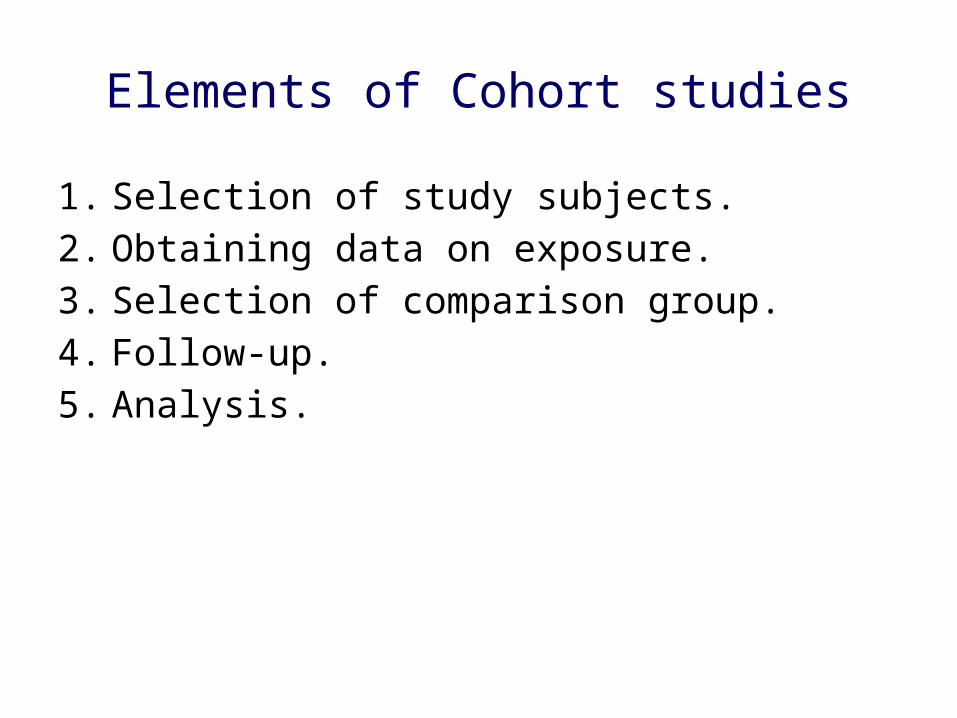
Elements of Cohort studies
1. Selection of study subjects.2. Obtaining data on exposure.3. Selection of comparison group.4. Follow-up.5. Analysis.
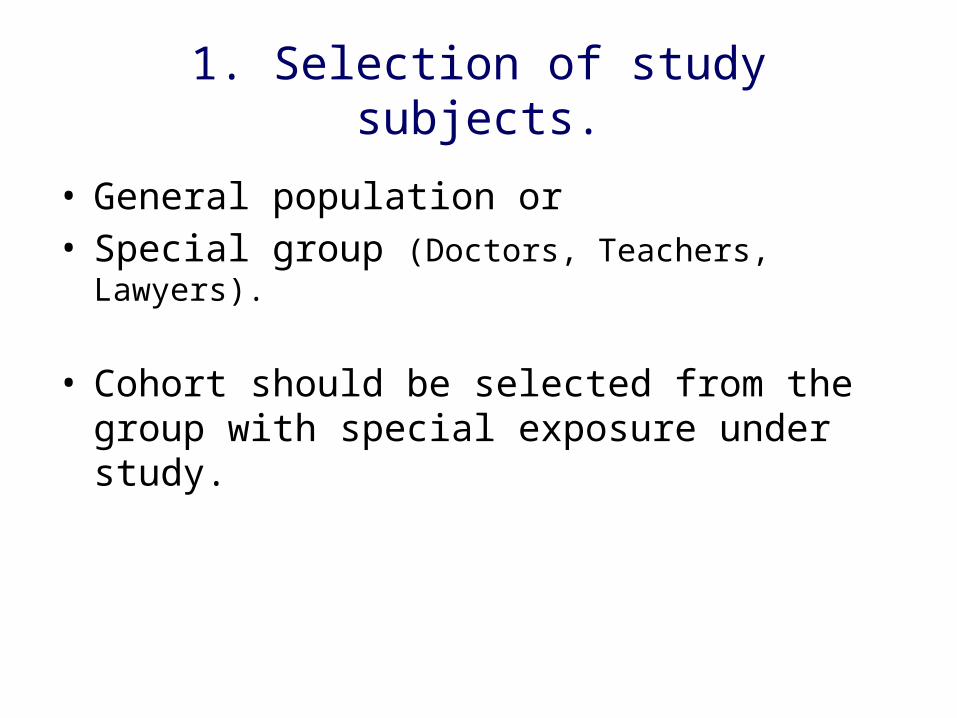
1. Selection of study subjects.
• General population or • Special group (Doctors, Teachers, Lawyers).
• Cohort should be selected from the group with special exposure under study.
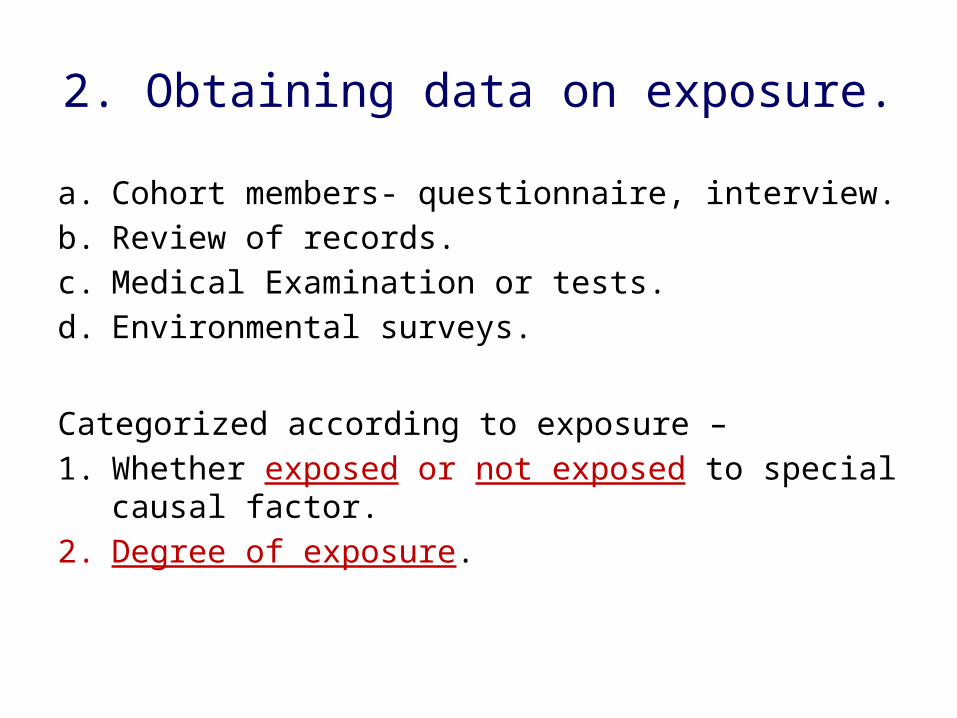
2. Obtaining data on exposure.
a. Cohort members- questionnaire, interview.b. Review of records.c. Medical Examination or tests.d. Environmental surveys.
Categorized according to exposure – 1. Whether exposed or not exposed to special causal factor.2. Degree of exposure.
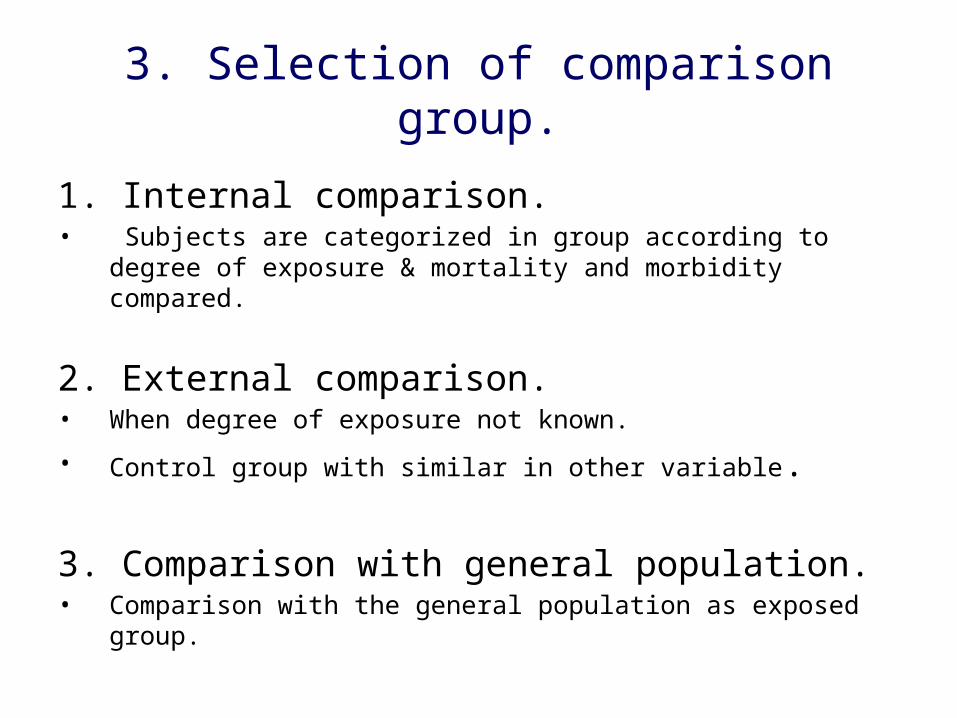
3. Selection of comparison group.
1. Internal comparison.• Subjects are categorized in group according to degree of exposure &
mortality and morbidity compared.
2. External comparison.• When degree of exposure not known.
• Control group with similar in other variable.
3. Comparison with general population.• Comparison with the general population as exposed group.
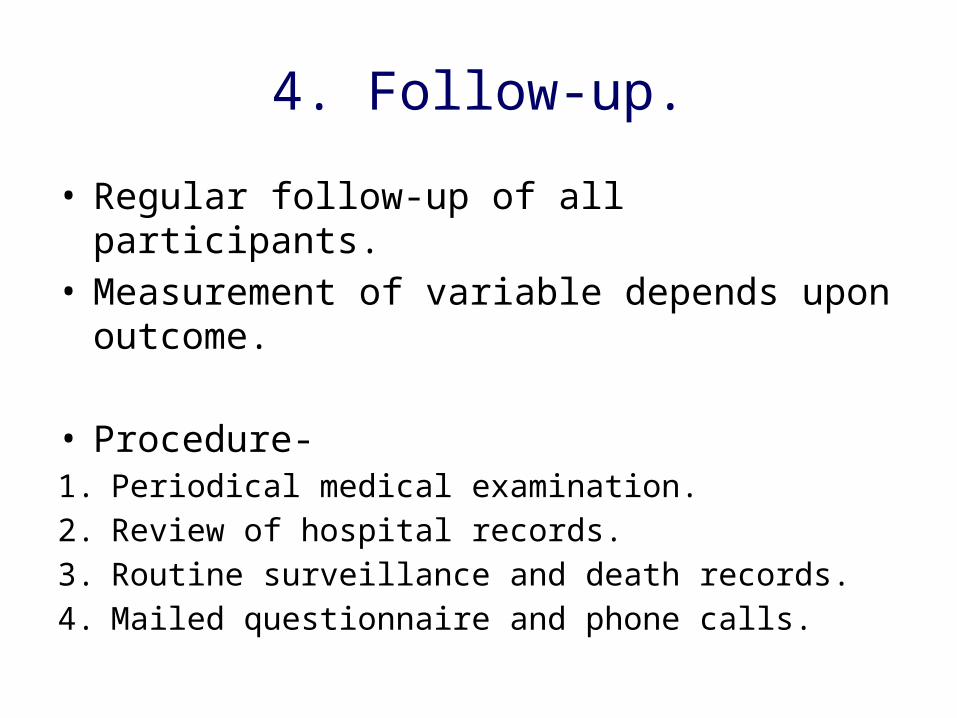
4. Follow-up.
• Regular follow-up of all participants.• Measurement of variable depends upon outcome.
• Procedure- 1. Periodical medical examination.2. Review of hospital records.3. Routine surveillance and death records.4. Mailed questionnaire and phone calls.
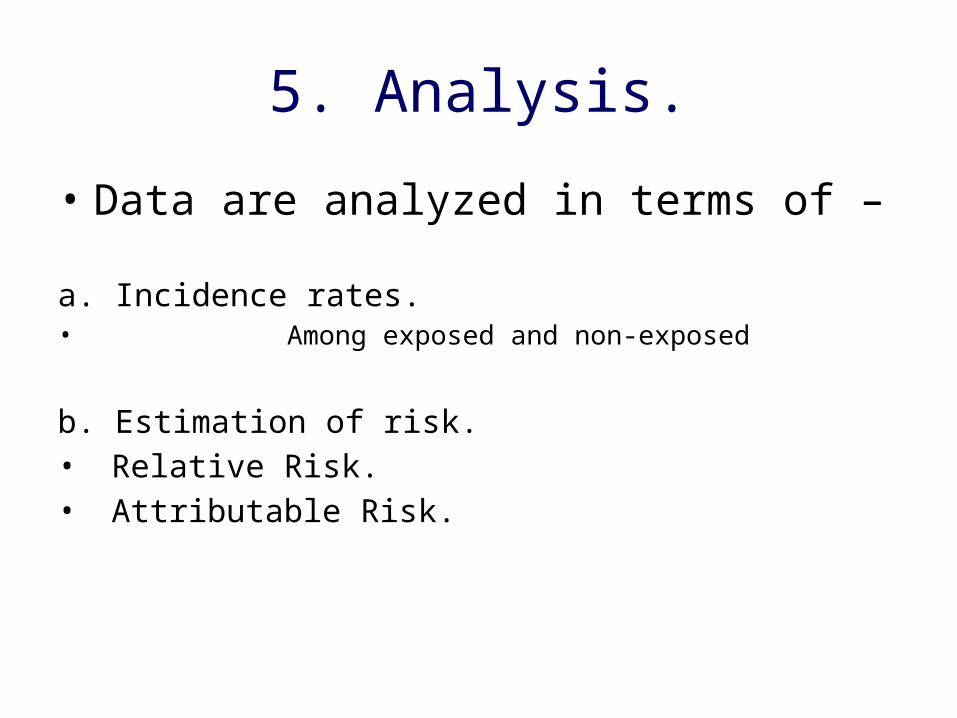
5. Analysis.
• Data are analyzed in terms of –
a. Incidence rates.• Among exposed and non-exposed
b. Estimation of risk.• Relative Risk.• Attributable Risk.
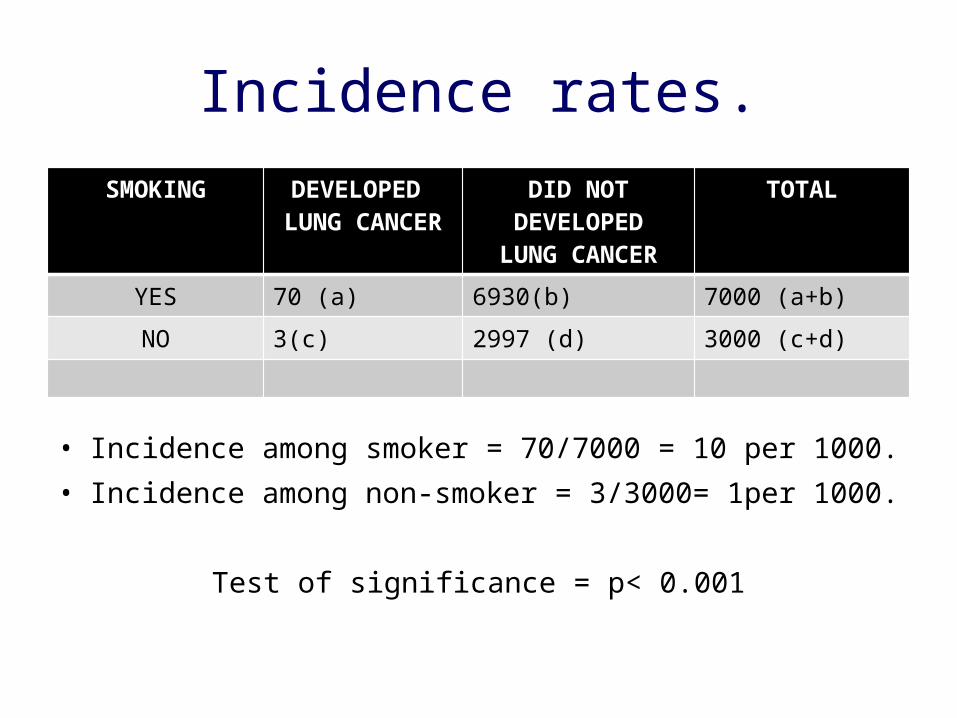
Incidence rates.SMOKING DEVELOPED
LUNG CANCERDID NOT DEVELOPED
LUNG CANCERTOTAL
YES 70 (a) 6930(b) 7000 (a+b)
NO 3(c) 2997 (d) 3000 (c+d)
• Incidence among smoker = 70/7000 = 10 per 1000.• Incidence among non-smoker = 3/3000= 1per 1000.
Test of significance = p< 0.001
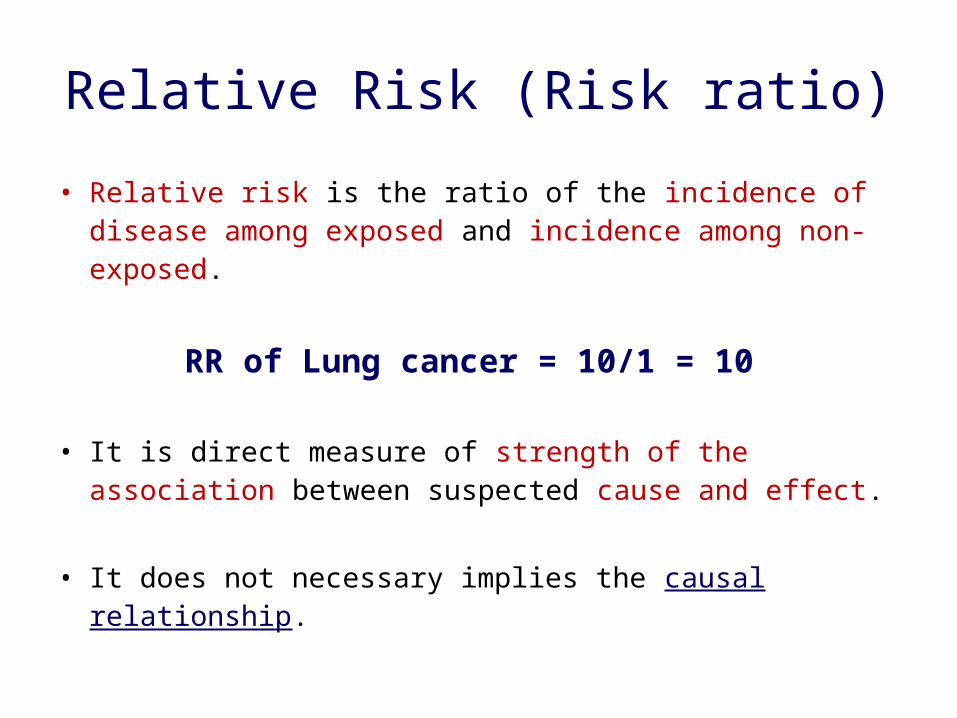
Relative Risk (Risk ratio)
• Relative risk is the ratio of the incidence of disease among exposed and incidence among non-exposed.
RR of Lung cancer = 10/1 = 10
• It is direct measure of strength of the association between suspected cause and effect.
• It does not necessary implies the causal relationship.
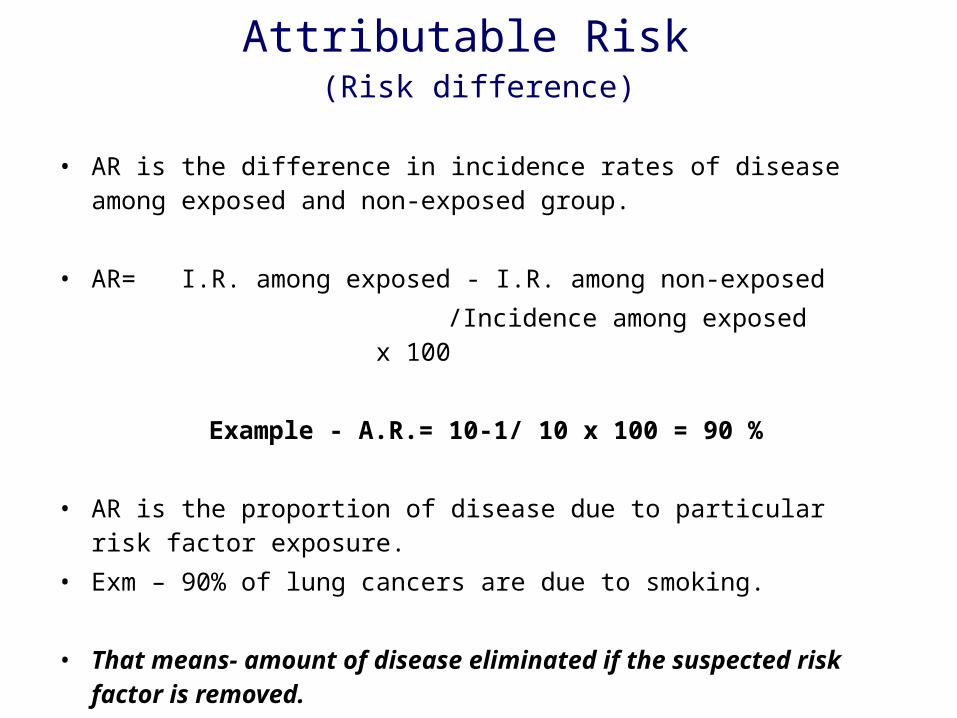
Attributable Risk (Risk difference)
• AR is the difference in incidence rates of disease among exposed and non-exposed group.
• AR= I.R. among exposed - I.R. among non-exposed /Incidence among exposed x 100
Example - A.R.= 10-1/ 10 x 100 = 90 %
• AR is the proportion of disease due to particular risk factor exposure.• Exm – 90% of lung cancers are due to smoking.
• That means- amount of disease eliminated if the suspected risk factor is removed.
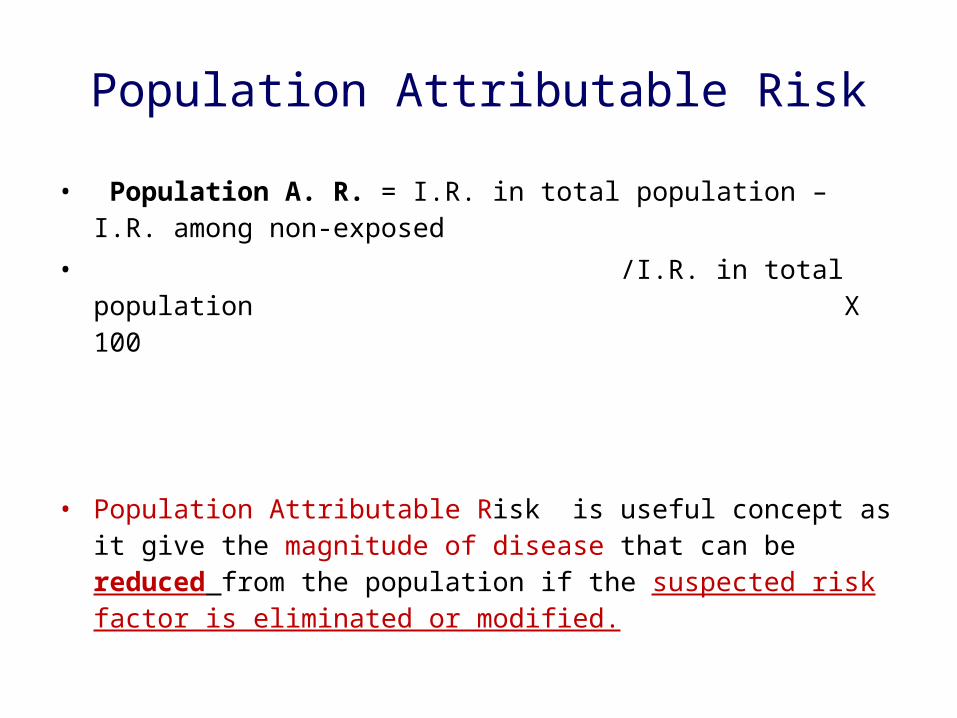
Population Attributable Risk
• Population A. R. = I.R. in total population – I.R. among non-exposed • /I.R. in total population X 100
• Population Attributable Risk is useful concept as it give the magnitude of disease that can be reduced from the population if the suspected risk factor is eliminated or modified.
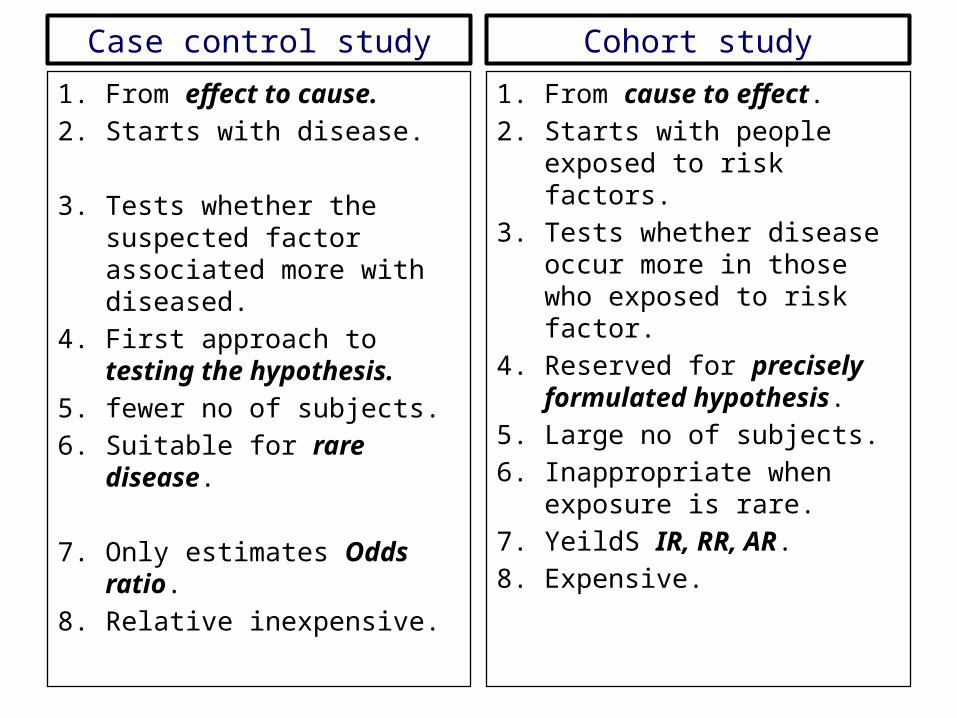
Case control study1. From effect to cause.2. Starts with disease.
3. Tests whether the suspected factor associated more with diseased.
4. First approach to testing the hypothesis.
5. fewer no of subjects.6. Suitable for rare disease.
7. Only estimates Odds ratio.8. Relative inexpensive.
Cohort study1. From cause to effect.2. Starts with people exposed to
risk factors.3. Tests whether disease occur
more in those who exposed to risk factor.
4. Reserved for precisely formulated hypothesis.
5. Large no of subjects.6. Inappropriate when exposure is
rare.7. YeildS IR, RR, AR.8. Expensive.
EXPERIMENTAL EPIDEMIOLOGY
• Interventional or experimental study involves attempting to change a variable in subjects under study..
• This could mean the elimination of a dietary factor thought to cause allergy, or testing a new treatment on a selected group of patients.
• The effects of an intervention are measured by comparing the outcome in the experimental group with that in a control group.
Objectives of Experimental Studies
1. To provide ‘scientific proof’ for etiology of disease and risk factor which may allow modification of occurrence of disease.
2. To provide a method of measurement for effectiveness and efficiency of therapeutic / preventive measure for disease.
3. To provide method to measurement for the efficiency health services for prevention, control and treatment of disease.
Types of Experimental Studies
1. Randomized Control Trials.
2. Field Trials & Community Trials.
Randomized Control Trials(RCT)
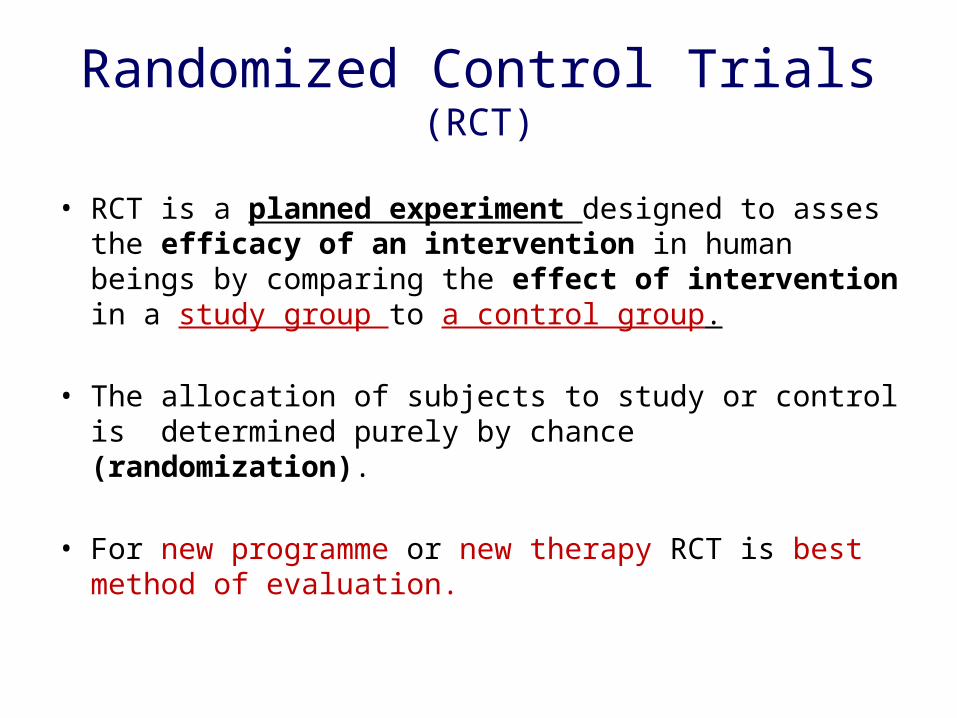
• RCT is a planned experiment designed to asses the efficacy of an intervention in human beings by comparing the effect of intervention in a study group to a control group.
• The allocation of subjects to study or control is determined purely by chance (randomization).
• For new programme or new therapy RCT is best method of evaluation.
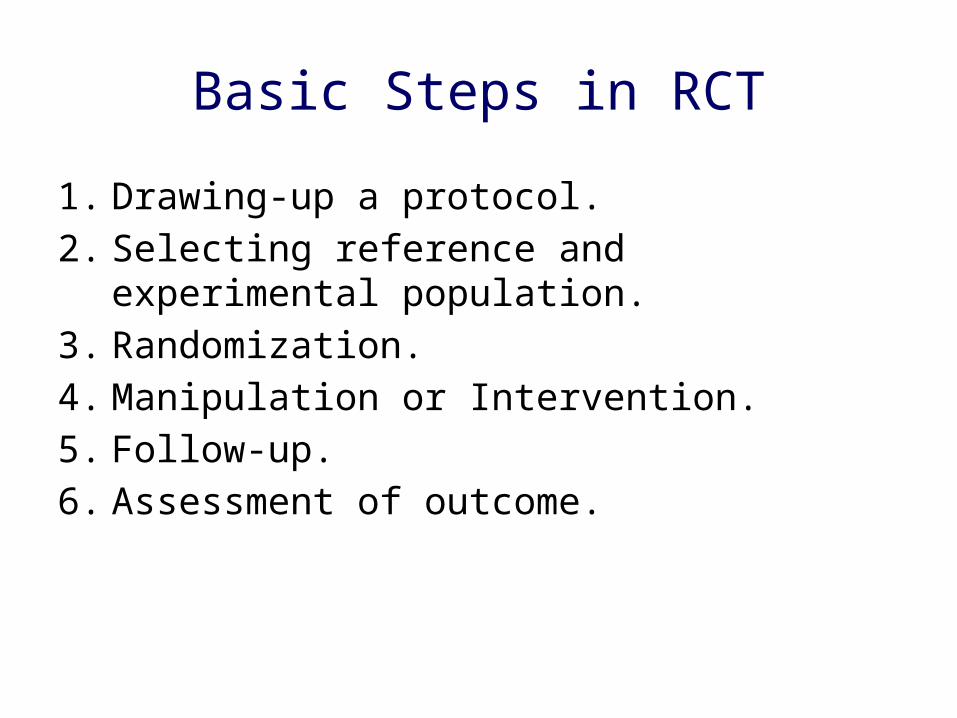
Basic Steps in RCT
1. Drawing-up a protocol.2. Selecting reference and experimental population.3. Randomization.4. Manipulation or Intervention.5. Follow-up.6. Assessment of outcome.
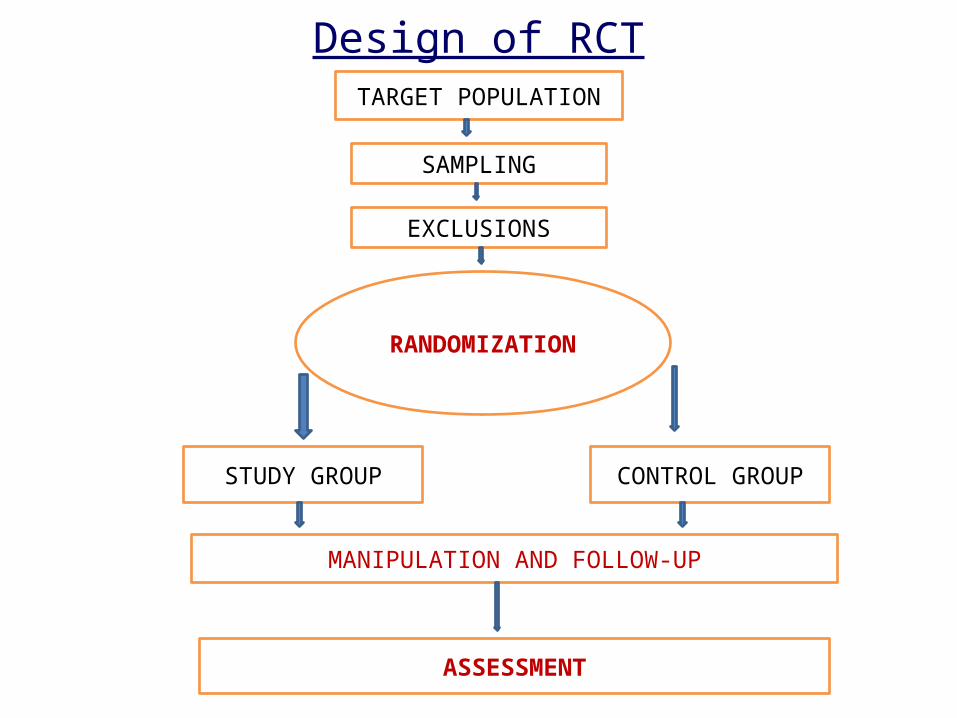
Design of RCTTARGET POPULATION
SAMPLING
EXCLUSIONS
RANDOMIZATION
STUDY GROUP CONTROL GROUP
MANIPULATION AND FOLLOW-UP
ASSESSMENT
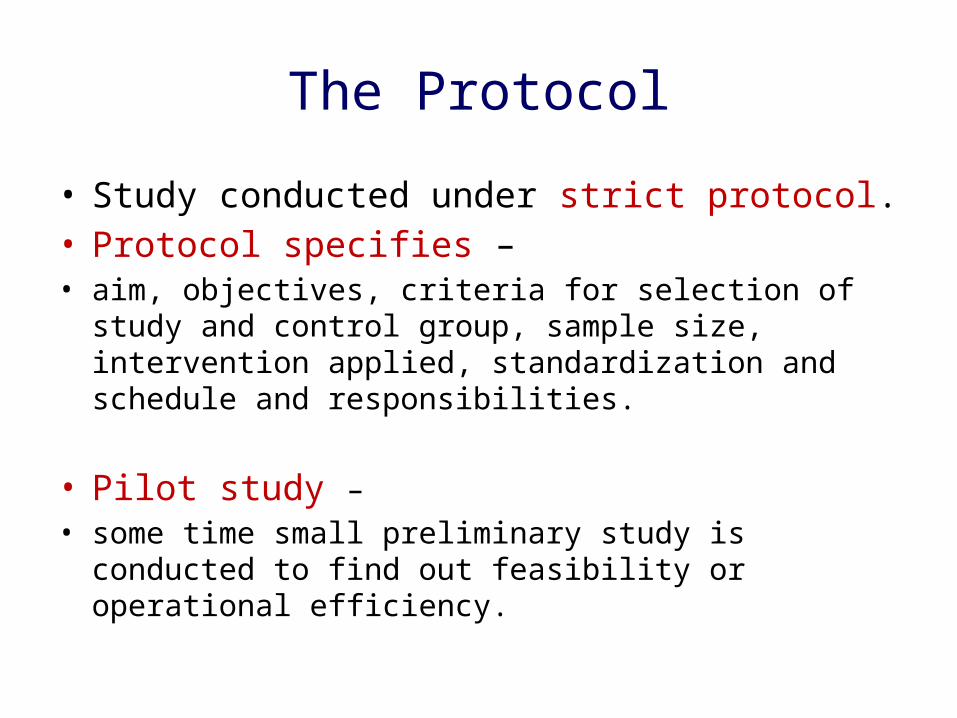
The Protocol
• Study conducted under strict protocol.• Protocol specifies –• aim, objectives, criteria for selection of study and control
group, sample size, intervention applied, standardization and schedule and responsibilities.
• Pilot study – • some time small preliminary study is conducted to find out
feasibility or operational efficiency.
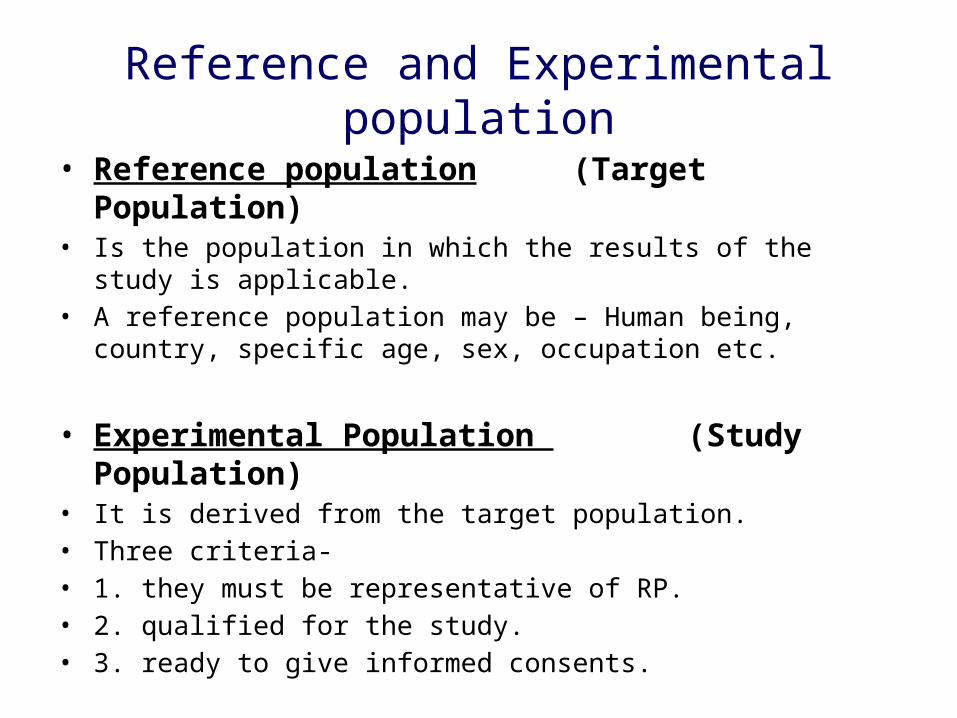
Reference and Experimental population• Reference population (Target Population)• Is the population in which the results of the study is applicable.• A reference population may be – Human being, country, specific age, sex,
occupation etc.
• Experimental Population (Study Population)• It is derived from the target population.• Three criteria- • 1. they must be representative of RP.• 2. qualified for the study.• 3. ready to give informed consents.
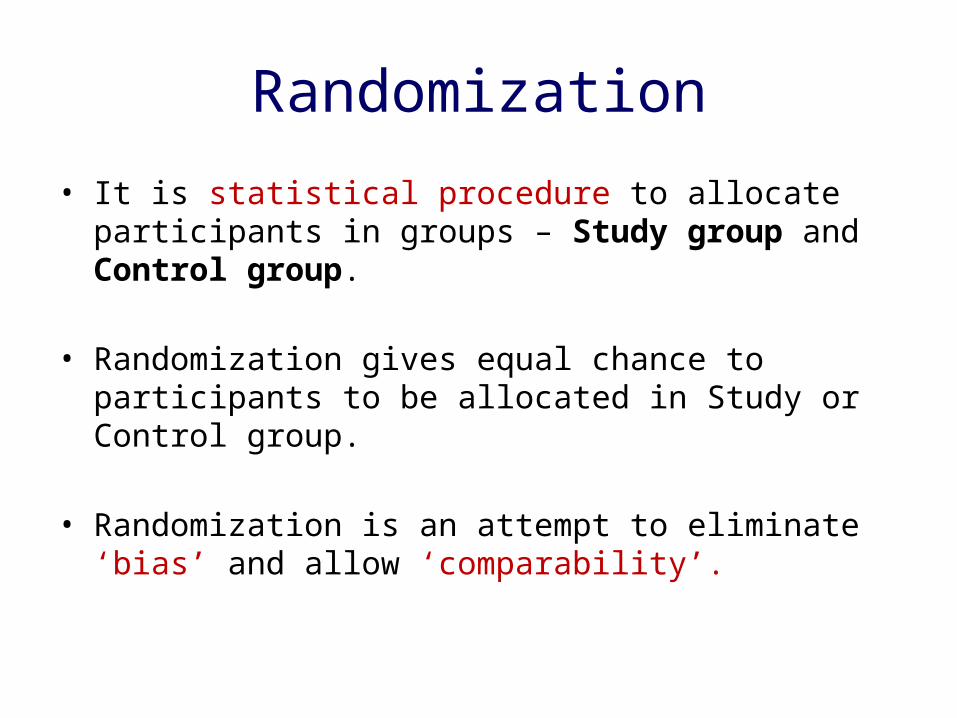
Randomization• It is statistical procedure to allocate participants in groups –
Study group and Control group.
• Randomization gives equal chance to participants to be allocated in Study or Control group.
• Randomization is an attempt to eliminate ‘bias’ and allow ‘comparability’.
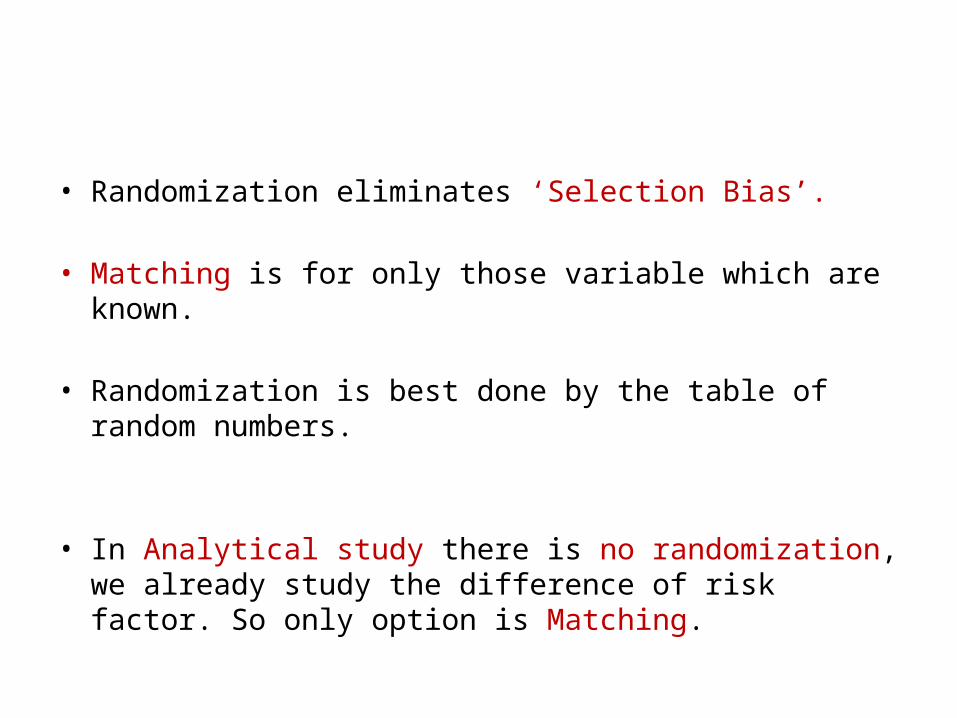
• Randomization eliminates ‘Selection Bias’.
• Matching is for only those variable which are known.
• Randomization is best done by the table of random numbers.
• In Analytical study there is no randomization, we already study the difference of risk factor. So only option is Matching.
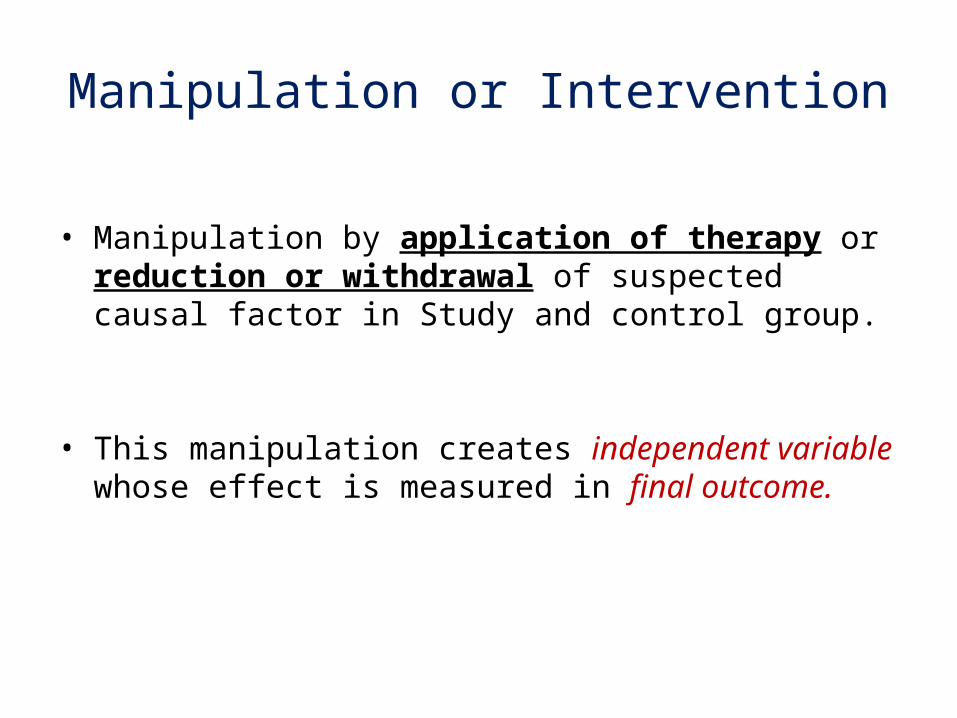
Manipulation or Intervention
• Manipulation by application of therapy or reduction or withdrawal of suspected causal factor in Study and control group.
• This manipulation creates independent variable whose effect is measured in final outcome.
Follow-up
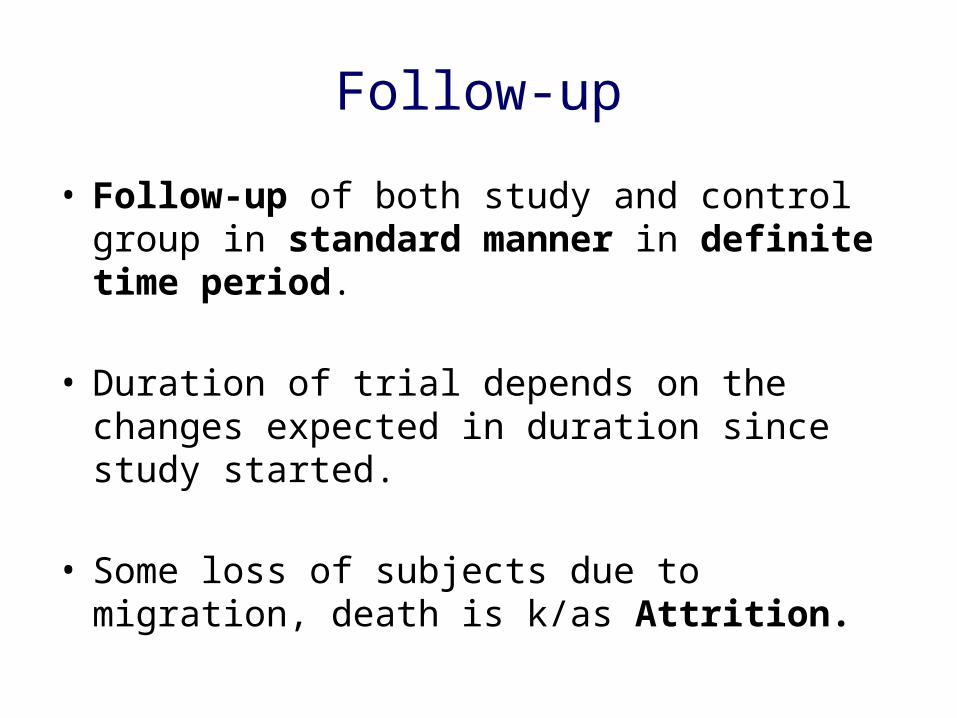
• Follow-up of both study and control group in standard manner in definite time period.
• Duration of trial depends on the changes expected in duration since study started.
• Some loss of subjects due to migration, death is k/as Attrition.
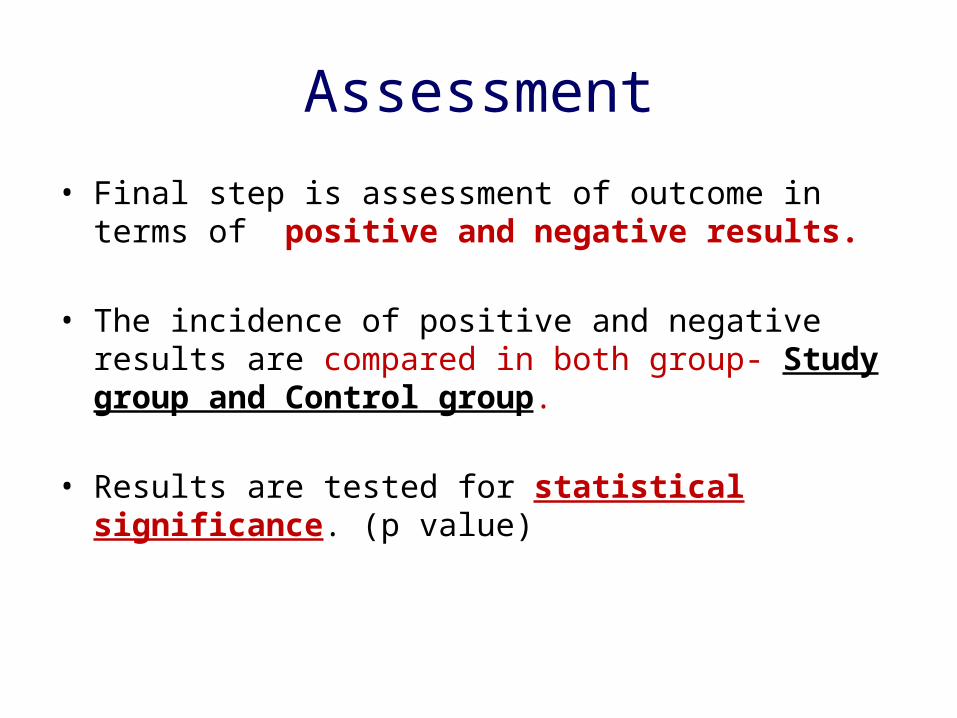
Assessment• Final step is assessment of outcome in terms of positive and
negative results.
• The incidence of positive and negative results are compared in both group- Study group and Control group.
• Results are tested for statistical significance. (p value)
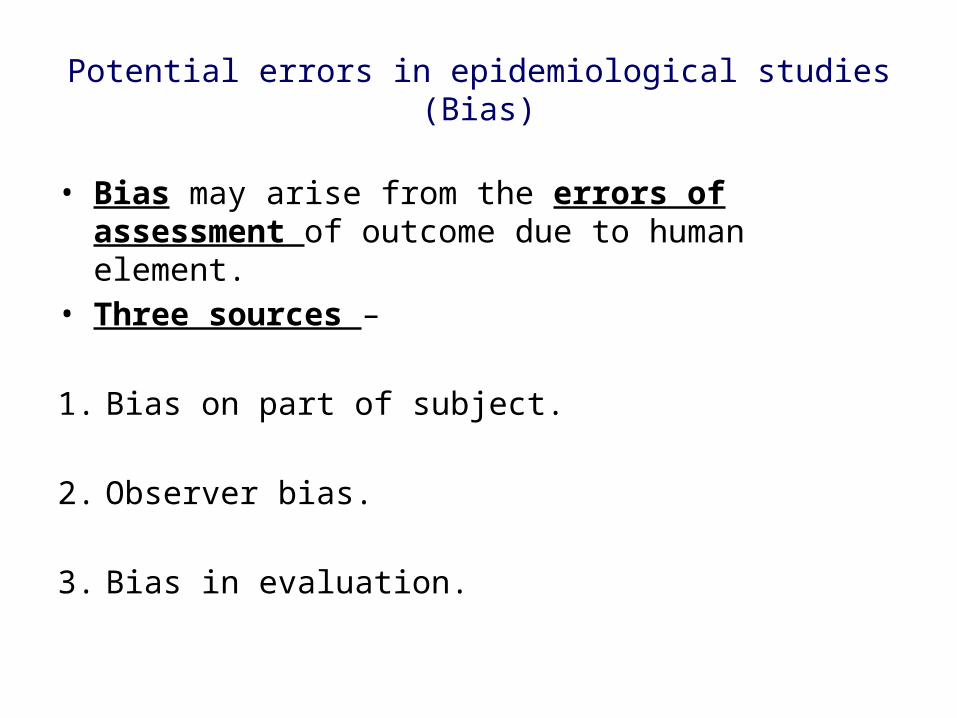
Potential errors in epidemiological studies(Bias)
• Bias may arise from the errors of assessment of outcome due to human element.
• Three sources –
1. Bias on part of subject.
2. Observer bias.
3. Bias in evaluation.
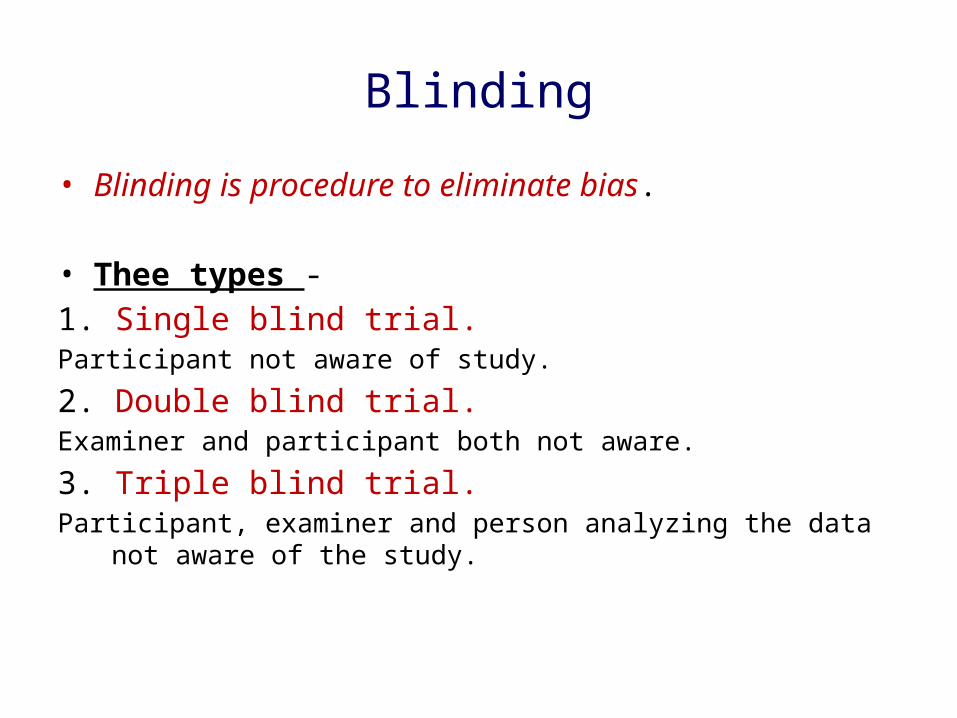
Blinding
• Blinding is procedure to eliminate bias.
• Thee types - 1. Single blind trial.Participant not aware of study.
2. Double blind trial.Examiner and participant both not aware.
3. Triple blind trial.Participant, examiner and person analyzing the data not aware of the study.
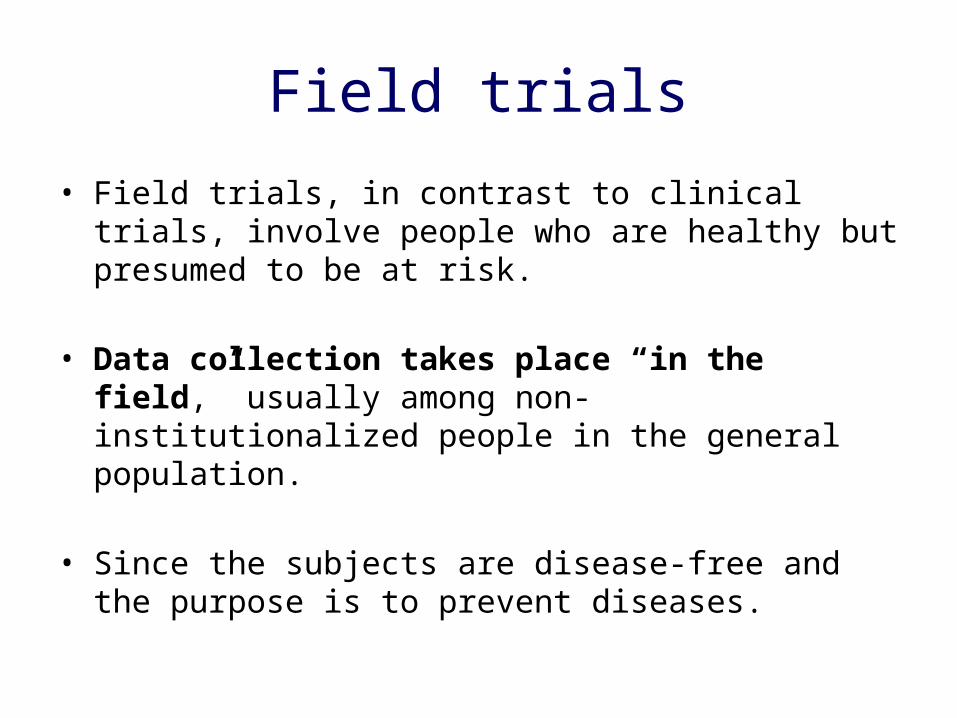
Field trials• Field trials, in contrast to clinical trials, involve people who
are healthy but presumed to be at risk.
• Data collection takes place “in the field,” usually among non-institutionalized people in the general population.
• Since the subjects are disease-free and the purpose is to prevent diseases.
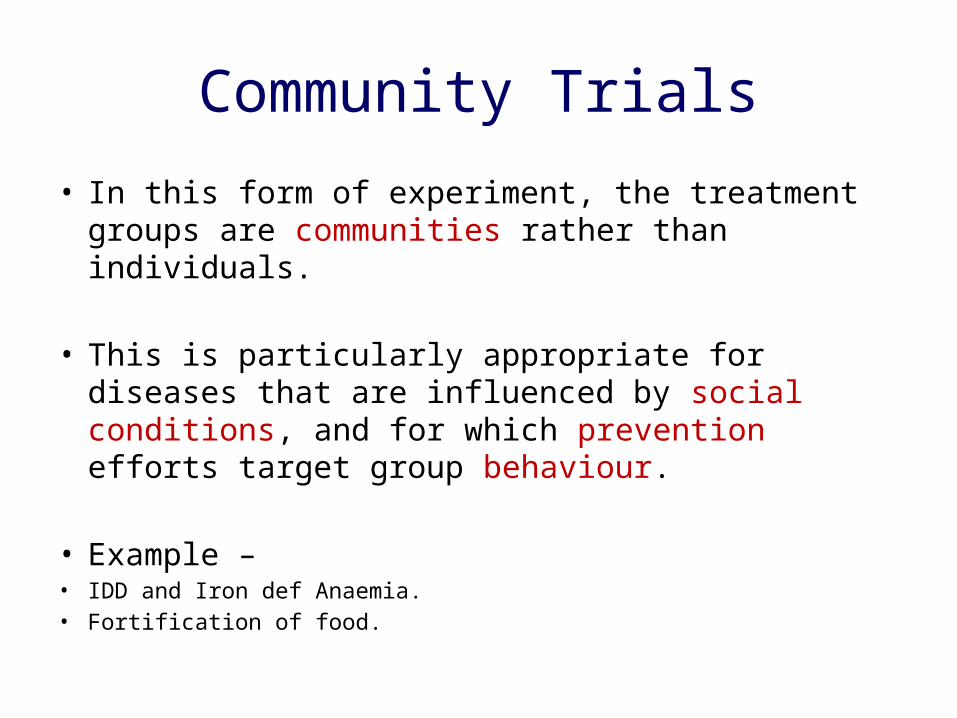
Community Trials
• In this form of experiment, the treatment groups are communities rather than individuals.
• This is particularly appropriate for diseases that are influenced by social conditions, and for which prevention efforts target group behaviour.
• Example – • IDD and Iron def Anaemia. • Fortification of food.
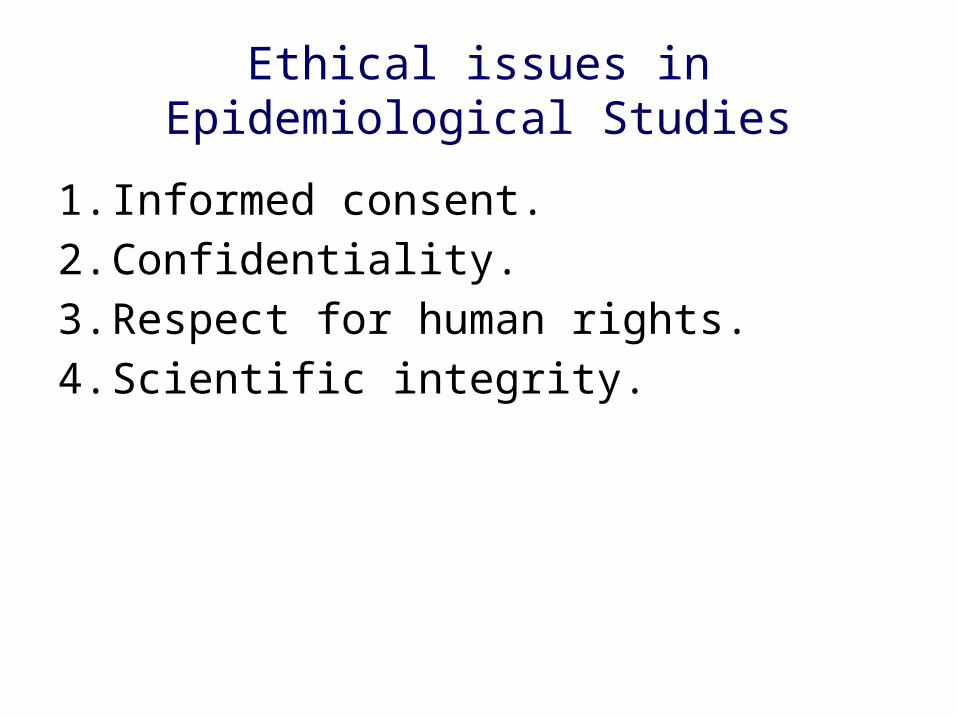
Ethical issues in Epidemiological Studies
1. Informed consent.2. Confidentiality.3. Respect for human rights.4. Scientific integrity.
ASSOCIATION AND CAUSATION
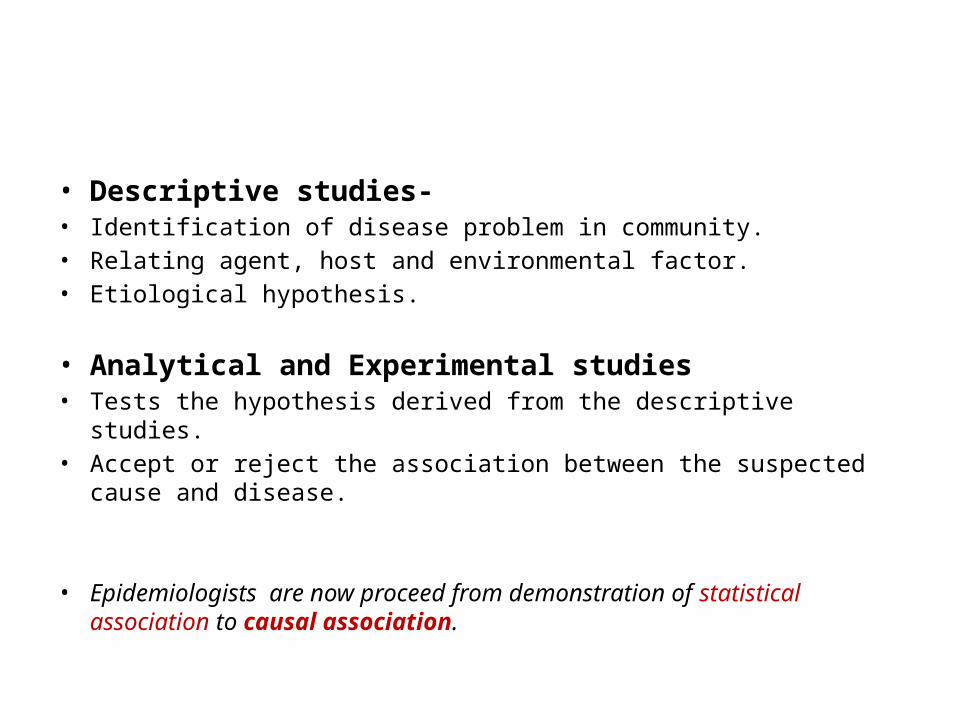
• Descriptive studies- • Identification of disease problem in community.• Relating agent, host and environmental factor.• Etiological hypothesis.
• Analytical and Experimental studies• Tests the hypothesis derived from the descriptive studies.• Accept or reject the association between the suspected cause and disease.
• Epidemiologists are now proceed from demonstration of statistical association to causal association.
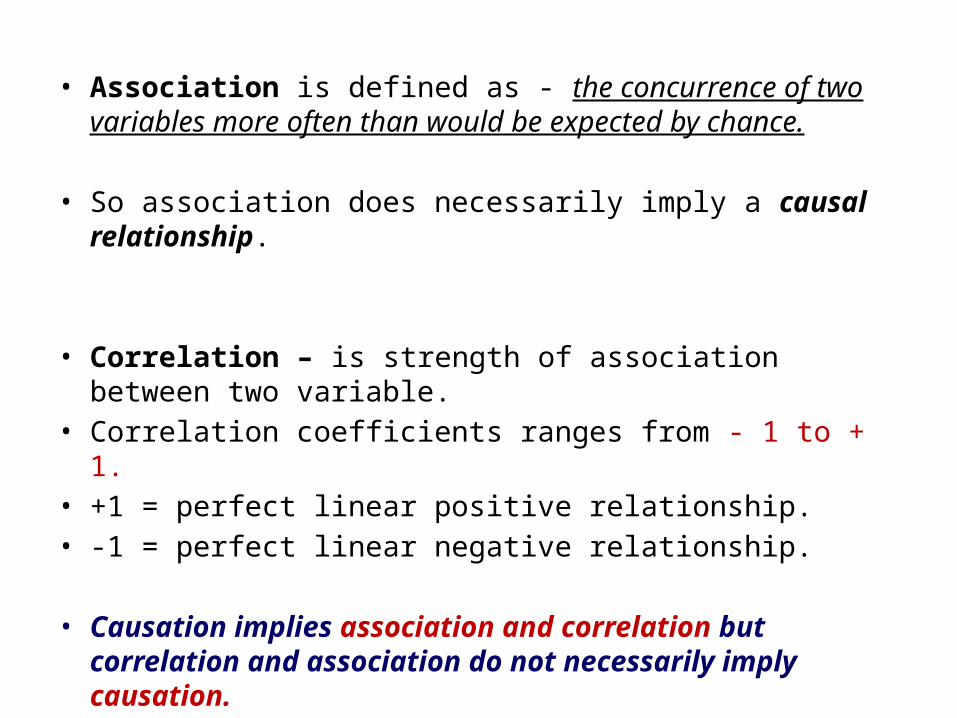
• Association is defined as - the concurrence of two variables more often than would be expected by chance.
• So association does necessarily imply a causal relationship.
• Correlation – is strength of association between two variable.• Correlation coefficients ranges from - 1 to + 1. • +1 = perfect linear positive relationship.• -1 = perfect linear negative relationship.
• Causation implies association and correlation but correlation and association do not necessarily imply causation.
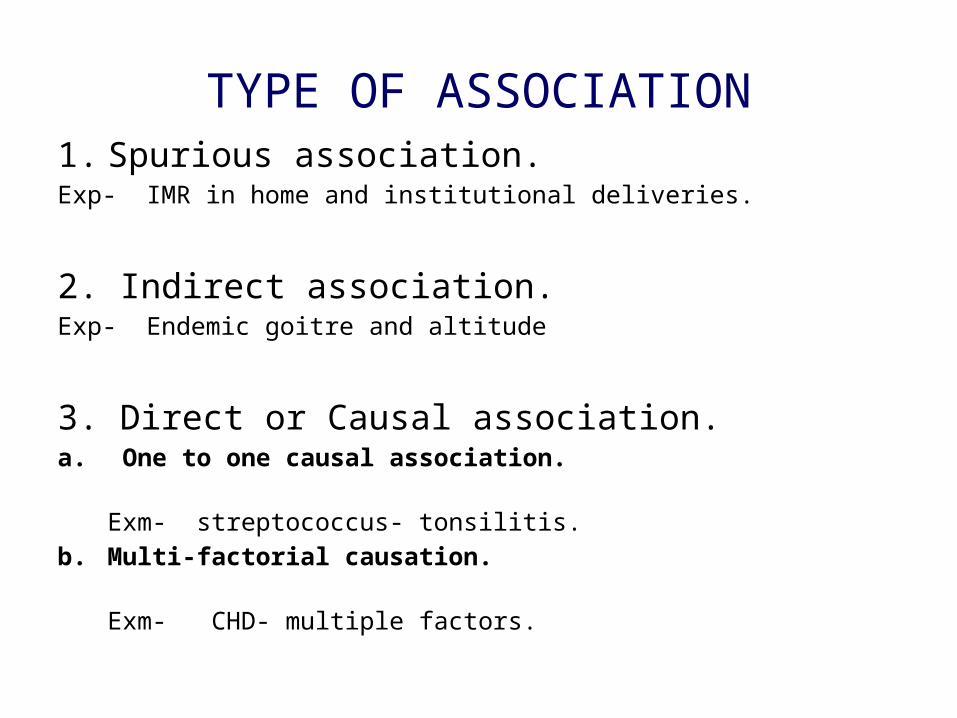
TYPE OF ASSOCIATION1. Spurious association.Exp- IMR in home and institutional deliveries.
2. Indirect association.Exp- Endemic goitre and altitude
3. Direct or Causal association.a. One to one causal association. Exm- streptococcus- tonsilitis.b. Multi-factorial causation. Exm- CHD- multiple factors.

THANK YOU