Embed Size (px)
Citation preview
T R E N D S
TRENDS
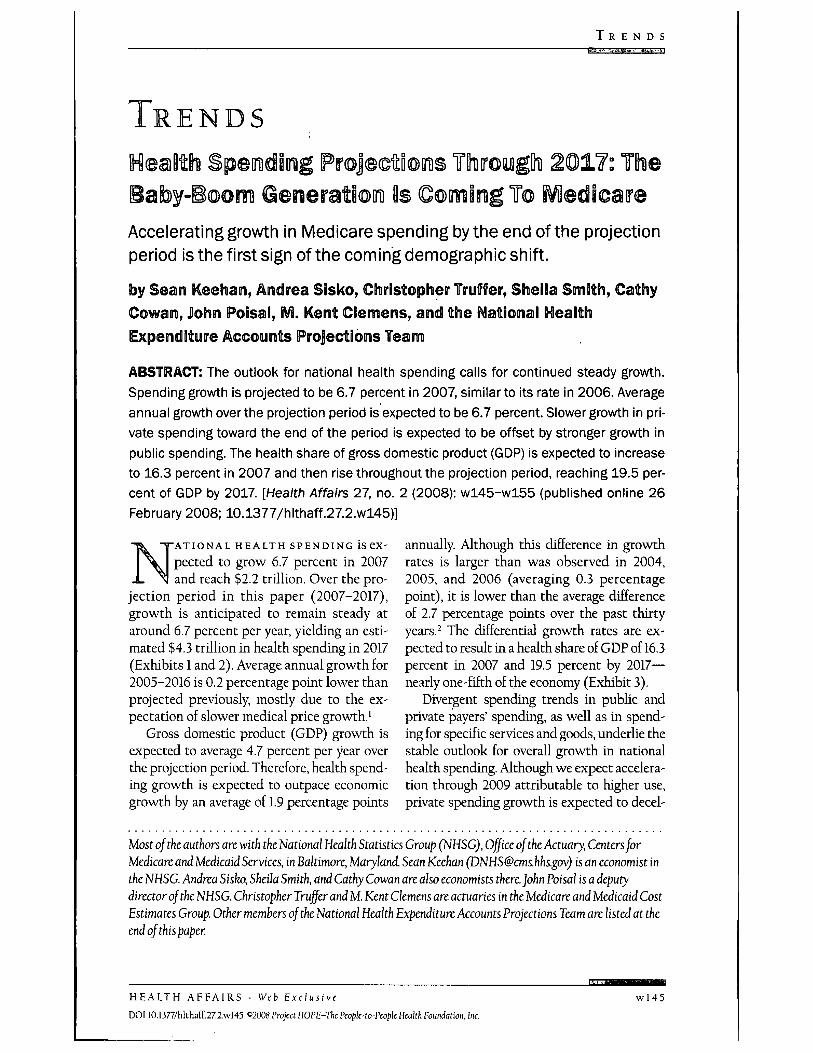
Accelerating growth in Medicare spending bythe end ofthe projectionperiod is the first sign of the coming demographic shift.
by Sean E eehan, Andrea Sisko, Christopher Truffer, Sheila Smith, CathyCowan, John Poisal, IVi. Kent Clemens, and the Nationai IKIeaithExpenditure Accounts Projections Team
ABSTRACT: The outlook for national health spending calls for continued steady growth.Spending growth is projected to be 6.7 percent in 2007, similar to its rate in 2006. Averageannual growth over the projection period is expected to be 6.7 percent. Slower growth in pri-vate spending toward the end of the period is expected to be offset by stronger growth inpublic spending. The health share of gross domestic product (GDP) is expected to increaseto 16.3 percent in 2007 and then rise throughout the projection period, reaching 19.5 per-cent of GDP by 2017. [Health Affairs 27, no. 2 (2008): wl45-wl55 (published online 26February 2008; 10.1377/hlthaff.27.2.wl45)]
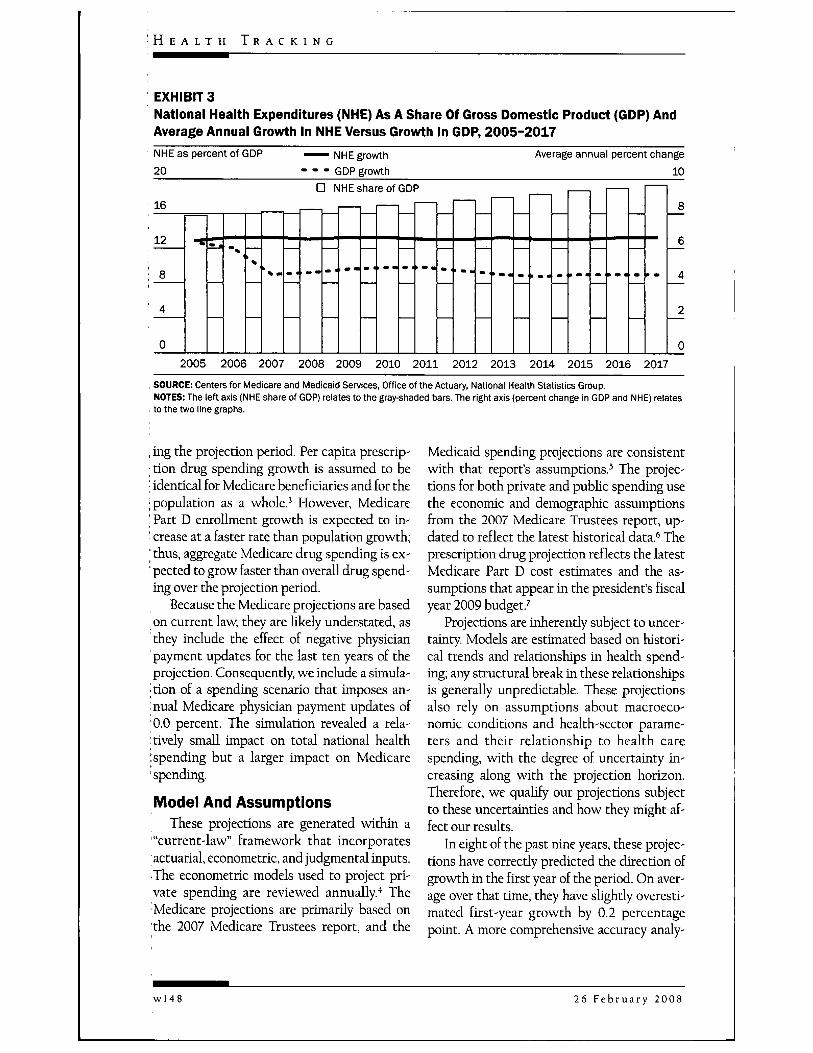
annually. Although this difference in growthrates is larger than was observed in 2004,2005, and 2006 (averaging 0.3 percentagepoint), it is lower than the average differenceof 2.7 percentage points over the past thirtyyears.-' The differential growth rates are ex-pected to result in a health share of GDP of 16.3percent in 2007 and 19.5 percent by 2017—nearly one-fifth of the economy (Exhibit 3).
Divergent spending trends in pubhc andprivate payers' spending, as well as in spend-ing for specific services and goods, underlie thestable outlook for overall growth in nationalhealth spending. Although we expect accelera-tion through 2009 attributable to higher use,private spending growth is expected to deed-
ATIONAL HEALTH SPENDINGpected to grow 6.7 percent in 2007and reach $2.2 trillion. Over the pro-
jection period in this paper (2007-2017),growth is anticipated to remain steady ataround 6.7 percent per year, yielding an esti-mated $4.3 trillion in health spending in 2017(Exhibits 1 and 2). Average annual growth for2005-2016 is 0.2 percentage point lower thanprojected previously, mostly due to the ex-pectation of slower medical price growth.'
Gross domestic product (GDP) growth isexpected to average 4.7 percent per year overthe projection period. Therefore, health spend-ing growth is expected to outpace economicgrowth by an average of 1.9 percentage points
Most ofthe authors are with the National Health Statistics Group (NHSG), Office ofthe Actuary, Centers forMedicare and Medicaid Services, in Baltimore, Maryland. Sean Keehan ([email protected]) is an economist inthe NHSG. Andrea Sisko, Sheila Smith, and Cathy Cowan are also economists there.]ohn Poisal is a deputydirector ofthe NHSG. Christopher Truffer and M. Kent Clemens are actuaries in the Medicare and Medicaid CostEstimates Group. Other members ofthe National Health Expenditure Accounts Projections Team are listed at theend of this paper.
H E A L T H A F F A I R S - Weh Exclusive
DOI 10.1377/hlthaff.27.2.wl45 C2008 Project HOPE-Thc Ptopk-to-Pcopk Health Eoundation, Inc.
wl45
H E A L T H T R A C K I N G
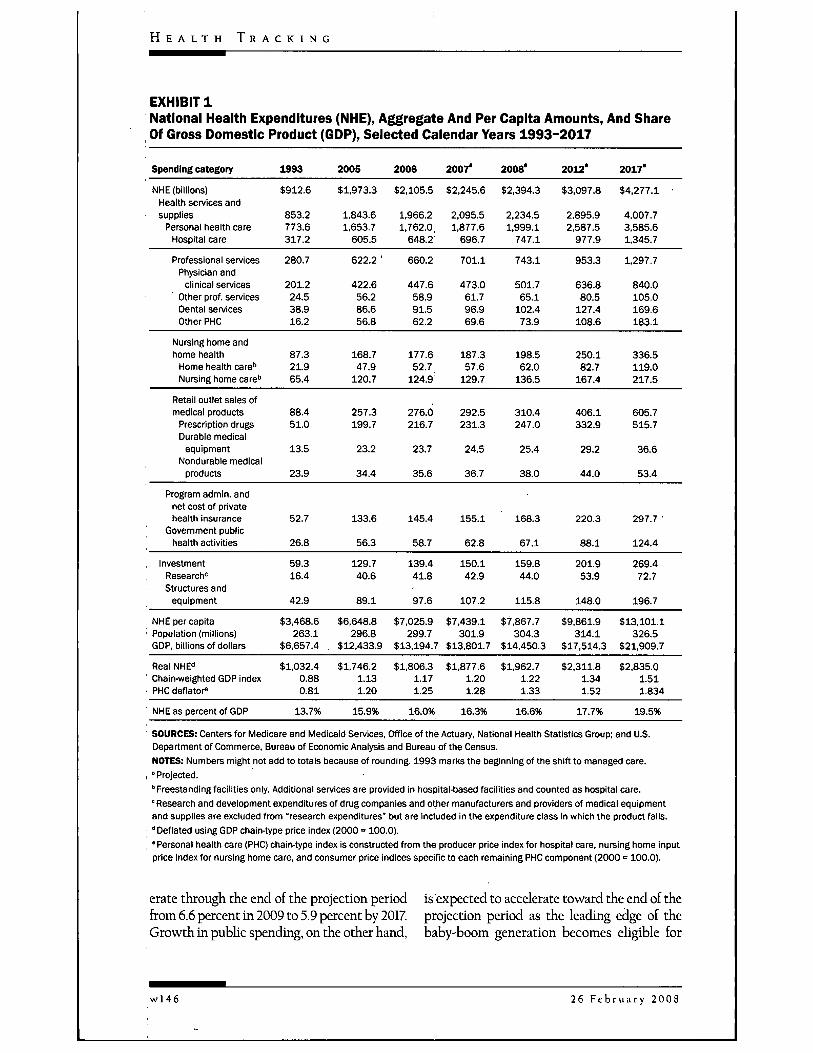
EXHIBIT 1National Health Expenditures (NHE), Aggregate And Per Capita Amounts, And ShareOf Gross Domestic Product (GDP), Selected Calendar Years 1993-2017
Spending category 1993 2005 2006 2007' 2008° 2012* 2017"
NHE (billions)Health services andsupplies
Personal heaith careHospitai care
Professionai servicesPhysician and
clinical servicesOther prof, servicesDentai servicesOther PHC
$912.6
853.2773.6317.2
280.7
201.224.538.916.2
$1,973.3 $2,105.5 $2,245.6 $2,394.3 $3,097.8 $4,277.1
1.843.6 1.966.2 2,095.5 2,234.51.653.7 1,762.0, 1,877.6 1,999.1
605.5 648.2 696.7 747.1
2,895.92,587.5
977.9
953.3
636.880.5
127.4108.6
4,007.73,585.61.345.7
1,297.7
840.0105.0169.6183.1
622.2 ' 660.2 701.1 743.1
422.6 447.6 473.0 501.756.2 58.9 61.7 65.186.6 91.5 96.9 102.456.8 62.2 69.6 73.9
Nursing home andhome heaith
Home heaith care''Nursing home care''
87.321.965.4
168.747.9
120.7
177.652.7
124.9
187.357.6
129.7
198.562.0
136.5
250.182.7
167.4
336.5119.0217.5
Retail outlet sales ofmedicai products
Prescription drugsDurabie medicai
equipmentNondurabie medicai
products
Program admin, andnet cost of privateheaith insurance
Government publicheaith activities
88.451.0
13.5
23.9
52.7
26.8
257.3199.7
23.2
34.4
133.6
56.3
276.0216.7
23.7
35.6
145.4
58.7
292.5231.3
24.5
36.7
155.1
62.8
310.4247.0
25.4
38.0
168.3
67.1
406.1332.9
29.2
44.0
220.3
88.1
605.7515.7
36.6
53.4
297.7 •
124.4
investmentResearch"Structures and
equipment
NHE per capitaPopuiation (millions)GDP, biiiionsof doiiars
Reai NHE"Chain-weighted GDP indexPHC deflator*
NHE as percent of GDP
59.316.4
42.9
$3,468.6263.1
$6,657.4 ,
$1,032.40.880.81
13.7%
129.740.6
89.1
$6,648.8296.8
$12,433.9
$1,746.21.131.20
15.9%
139.441.8
97.6
$7,025.9299.7
$13,194.7
$1,806.31.171.25
16.0%
150.142.9
107.2
$7,439.1301.9
$13,801.7
$1,877.61.201.28
16.3%
159.844.0
115.8
$7,867.7304.3
$14,450.3
$1,962.71.221.33
16.6%
201.953.9
148.0
$9,861.9314.1
$17,514.3
$2,311.81.341.52
17.7%
269.472.7
196.7
$13,101.1326.5
$21,909.7
$2,835.01.511.834
19.5%
SOURCES: Centers for Medicare and Medicaid Services, Office of the Actuary, National Health Statistics Group; and U.S.Department of Commerce, Bureau of Economic Analysis and Bureau of the Census.NOTES: Numbers might not add to totals because of rounding. 1993 marks the beginning of the shift to managed care.
I "Projected." Freestanding faciiities oniy. Additionai services are provided in hospitai-based faciiities and counted as hospital care.' Research and development expenditures of drug companies and other manufacturers and providers of medicai equipmentand suppiies are excluded from "research expenditures* but are included in the expenditure class in which the product falis."Deflated using GDP chain-type price index (2000 = 100.0).
, 'Personal health care (PHC) chain-type index is constructed from the producer price index for hospital care, nursing home inputprice index for nursing home care, and consumer price indices specific to each remaining PHC component (2000 = 100.0).
erate through the end of the projection period is expected to accelerate toward the end of thefrom 6.6 percent in 2009 to 5.9 percent by 2017. projection period as the leading edge of theGrowth in public spending, on the other hand, baby-boom generation becomes eligible for
w l 4 6 26 F e b r u a r y 2 0 0 8
T R E N D S
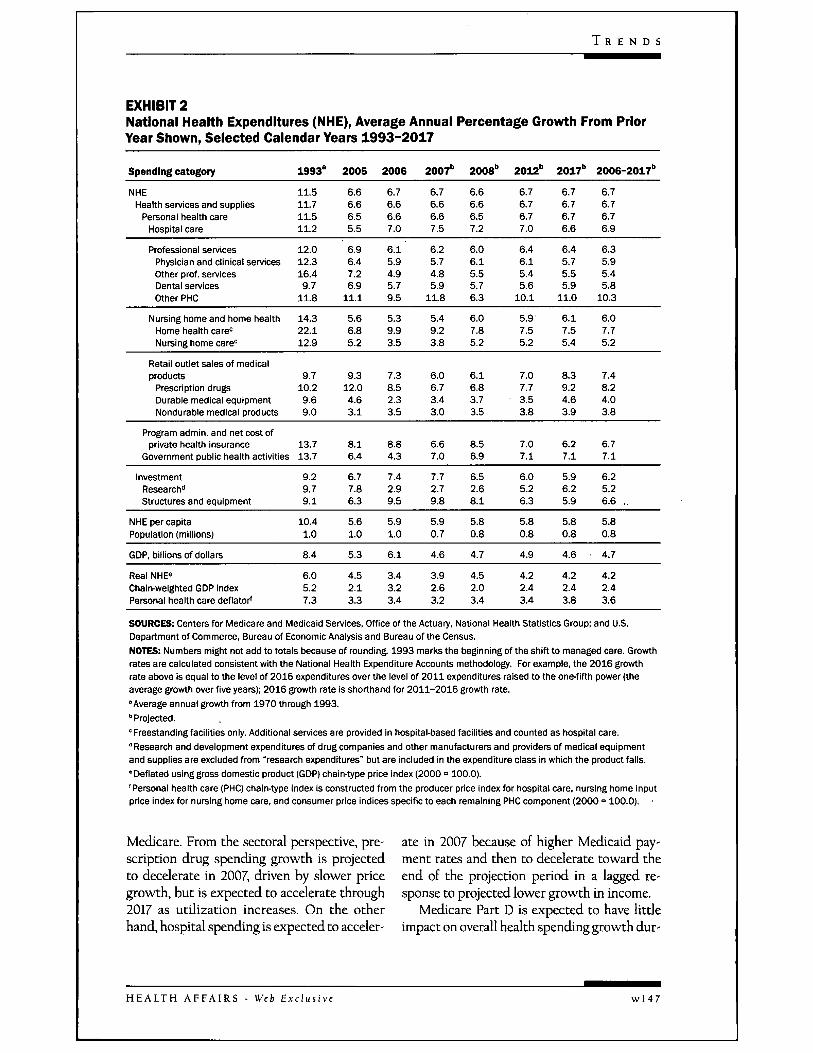
EXHIBIT 2National Health Expenditures (NHE), Average Annual Percentage Growth From PriorYear Shown, Seiected Calendar Years 1993-2017
Spending category
NHEHealth services and supplies
Personai heaith careHospitai care
1993°
11.511.711.511.2
2005
6.66.66.55.5
2006
6.76.66.67.0
2007"
6.76.66.67.5
2008"
6.66.66.57.2
2012"
6.76.76.77.0
2017"
6.76.76.76.6
2006-2017"
6.76.76.76.9
Professionai services 12.0Physician and clinical services 12.3Other prof, services 16.4Dentai services 9.7Other PHC 11.8
6.96.47.26.9
11.1
6.15.94.95.79.5
6.25.74.85.9
11.8
6.06.15.55.76.3
6.46.15.45.6
10.1
6.45.75.55.9
11.0
6.35.95.45.8
10.3
Nursing home and home heaith 14.3 5.6 5.3 5.4 6.0 5.9' 6.1 6.0Home health care= 22.1 6.8 9.9 9.2 7.8 7.5 7.5 7.7Nursing home care" 12.9 5.2 3.5 3.8 5.2 5.2 5.4 5.2
Retali outiet saies of medicalproducts 9.7
Prescription drugs 10.2Durabie medicai equipment 9.6Nondurable medicai products 9.0
9.312.04.63.1
7.38.52.33.5
6.06.73.43.0
6.16.83.73.5
7.07.73.53.8
8.39.24.63.9
7.48.24.03.8
Program admin, and net cost ofprivate heaith insurance
Government pubiic heaith activities
InvestmentResearch"Structures and equipment
NHE per capitaPopuiation (miiiions)
GDP, biiiionsof doiiars
Reai NHE°Chain-weighted GDP indexPersonal heaith care defiator'
13.713.7
9.29.79.1
10.41.0
8.4
6.05.27.3
8.16.4
6.77.86.3
5.61.0
5.3
4.52.13.3
8.84.3
7.42.99.5
5.91.0
6.1
3.43.23.4
6.67.0
7.72.79.8
5.90.7
4.6
3.92.63.2
8.56.9
6.52.68.1
5.80.8
4.7
4.52.03.4
7.07.1
6.05.26.3
5.80.8
4.9
4.22.43.4
6.27.1
5.96.25.9
5.80.8
4.6
4.22.43.8
6.77.1
6.25.26.6 ,
5.80.8
4.7
4.22.43.6
SOURCES: Centers for iVIedicare and Medicaid Services. Office ofthe Actuary, Nationai Heaith Statistics Group; and U.S.Department of Commerce, Bureau of Economic Anaiysis and Bureau ofthe Census.NOTES: Numbers might not add to totais because of rounding. 1993 mari<s the beginning of the shift to managed care. Growthrates are caicuiated consistent with the Nationai Heaith Expenditure Accounts methodology. For example, the 2016 growthrate above is equal to the levei of 2016 expenditures over the ievei of 2011 expertditures raised to the one-fifth power (theaverage growth over five years); 2016 growth rate is shorthand for 2011-2016 growth rate.'Average annuai growth from 1970 through 1993."Projected.° Freestanding faciiities oniy. Additionai services are provided in hospital-based facilities and counted as hospital care." Research and deveiopment expenditures of drug companies and other manufacturers and providers of medical equipmentand suppiies are exciuded from "research expenditures' but are inciuded in the expenditure ciass in which the product falis.• Defiated using gross domestic product (GDP) chain-type price index (2000 = 100.0).'Personal heaith care (PHC) chain-type index is constructed from the producer price index for hospitai care, nursing home inputprice index for nursing home care, and consumer price indices specific to each remaining PHC component (2000 = 100.0).
Medicare. From the sectoral perspective, pre- ate in 2007 because of higher Medicaid pay-scription drug spending growth is projected ment rates and then to decelerate toward theto decelerate in 2007, driven by slower price end of the projection period in a lagged re-growth, but is expected to accelerate through sponse to projected lower growth in income.2017 as utilization increases. On the other Medicare Part D is expected to have littlehand, hospital spending is expected to acceler- impact on overall health spending growth dur-
H E A L T H A F F A I R S - Web Exclusive w l 4 7
H E A L T H T R A C K I N G
EXHIBIT 3National Health Expenditures (NHE) As A Share Of Gross Domestic Product (GDP) AndAverage Annual Growth In NHE Versus Growth In GDP, 2005-2017NHE as percent of GDP NHE growth Average annua20 - - - GDP growth
n NHE share of GDP16
12
8
4
0
percen
—
tchange10
8
6
/I
2
02005 2006 2007 2008 2009 2010 2011 2012 2013 2014 2015 2016 2017
, SOURCE: Centers for Medicare and Medicaid Services, Office of the Actuary. Nationai Heaith Statistics Group.NOTES: The left axis (NHE share of GDP) reiates to the gray-shaded bars. The right axis (percent change in GDP and NHE) relates
I to the two iine graphs.
, ing the projection period. Per capita prescrip-• tion drug spending growth is assumed to be; identical for Medicare beneficiaries and for the; population as a whole.' However, Medicare' Part D enrollment growth is expected to in-' crease at a faster rate than population growth;' thus, aggregate Medicare drug spending is ex-: pected to grow faster than overall drug spend-ing over the projection period.
Because the Medicare projections are basedon current law, they are Kkely understated, asthey include the effect of negative physicianpayment updates for the last ten years of theprojection. Consequently, we include a simula-; tion of a spending scenario that imposes an-nual Medicare physician payment updates of0.0 percent. The simulation revealed a rela-:tively small impact on total national health; spending but a larger impact on Medicare'spending.
Model And AssumptionsThese projections are generated within a
"current-law" framework that incorporatesactuarial, econometric, and judgmental Inputs.The econometric models used to project pri-vate spending are reviewed annually."* TheMedicare projections are primarily based onthe 2007 Medicare Trustees report, and the
Medicaid spending projections are consistentwdth that report's assumptions.' The projec-tions for both private and pubUc spending usethe economic and demographic assumptionsfrom the 2007 Medicare Trustees report, up-dated to reflect the latest historical data.* Theprescription drug projection reflects the latestMedicare Part D cost estimates and the as-sumptions that appear in the president's fiscalyear 2009 budget.^
Projections are inherently subject to uncer-tainty Models are estimated based on histori-cal trends and relationships in health spend-ing; any structural break in these relationshipsis generally unpredictable. These projectionsalso rely on assumptions about macroeco-nomic conditions and health-sector parame-ters and their relationship to health carespending, with the degree of uncertainty in-creasing along with the projection horizon.Therefore, we qualify our projections subjectto these uncertainties and how they might af-fect our results.
In eight of the past nine years, these projec-tions have correctly predicted the direction ofgrowth in the first year of the period. On aver-age over that time, they have shghtly overesti-mated first-year growth by 0.2 percentagepoint. A more comprehensive accuracy analy-
26 F e b r u a r y 2008
T R E N D S
sis is on the Web site of the Centers for Medi-care and Medicaid Services (CMS).^
Factors Contributing To GrowthThe primary drivers of personal health care
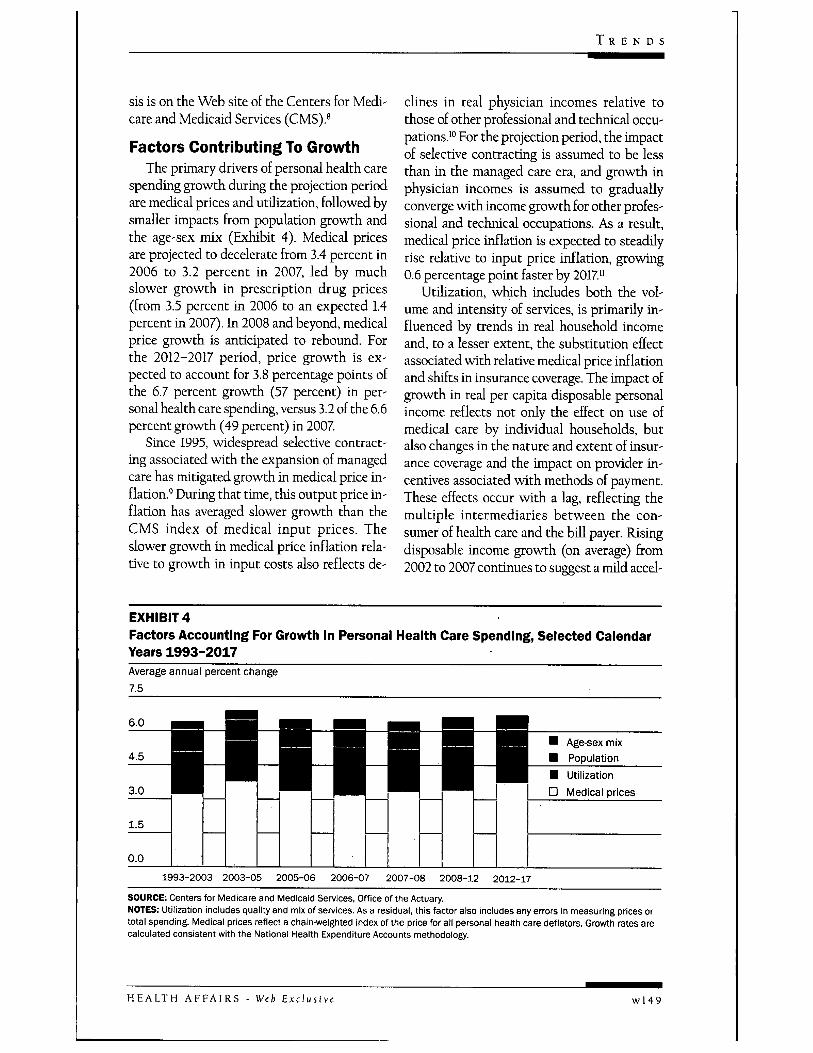
spending growth during the projection periodare medical prices and utihzation, followed bysmaller impacts from population growth andthe age-sex mix (Exhibit 4). Medical pricesare projected to decelerate from 3.4 percent in2006 to 3.2 percent in 2007, led by muchslower growth in prescription drug prices(from 3.5 percent in 2006 to an expected 1.4percent in 2007). In 2008 and beyond, medicalprice growth is anticipated to rebound. Eorthe 2012-2017 period, price growth is ex-pected to account for 3.8 percentage points ofthe 6.7 percent growth (57 percent) in per-sonal health care spending, versus 3.2 of the 6.6percent growth (49 percent) in 2007
Since 1995, widespread selective contract-ing associated with the expansion of managedcare has mitigated growth in medical price in-flation.' During that time, this output price in-flation has averaged slower growth than theCMS index of medical input prices. Theslower growth in medical price inflation rela-tive to growth in input costs also reflects de-
clines in real physician incomes relative tothose of other professional and technical occu-pations.'" Eor the projection period, the impactof selective contracting is assumed to be lessthan in the managed care era, and growth inphysician incomes is assumed to graduallyconverge with income growth for other profes-sional and technical occupations. As a result,medical price inflation is expected to steadilyrise relative to input price inflation, growing0.6 percentage point faster by 2017"
Udlization, which includes both the vol-ume and intensity of services, is primarily in-fluenced by trends in real household incomeand, to a lesser extent, the substitution effectassociated with relative medical price inflationand shifts in insurance coverage. The impact ofgrowth in real per capita disposable personalincome reflects not only the effect on use ofmedical care by individual households, butalso changes in the nature and extent of insur-ance coverage and the impact on provider in-centives associated with methods of payment.These effects occur with a lag, reflecting themultiple intermediaries between the con-sumer of health care and the bill payer. Risingdisposable income growth (on average) from2002 to 2007 continues to suggest a mild accel-
EXHIBIT4Factors Accounting For Growth In Personal Health Care Spending, Selected CalendarYears 1993-2017Average annual percent change ~7.5
6.0
4.5Age-sex mixPopulation
3.0
1.5
0.0
• - • • UtilizationD Medical prices
1993-2003 2003-05 2005-06 2006-07 2007-08 2008-12 2012-17
SOURCE: Centers for Medicare and Medicaid Services. Office of the Actuary.NOTES: Utilization includes quality and mix of services. As a residual, this factor also includes any errors in measuring prices ortotai spending. Medicai prices refiect a chain-weighted index of the price for all personal health care deflators. Growth rates arecalculated consistent with the National Health Expenditure Accounts methodology.
H E A L T H A F F A I R S - Web Exclusive w l 4 9
H E A L T H T R A C K I N G
eration in utilization through 2007. However,the expectation of slower disposable incomegrowth from 2008 to 2017 is the primary driverfor the slowing growth in udlizadon towardthe end of the projection period.'^
The impact of the population aging is ex-; pected to account for a relatively small share of' future health care spending growth on a perenrollee basis but to have a substantial influ-
: ence on the public share of spending growth,as the leading edge of the baby-boom genera-tion becomes eligible for Medicare." The effectof the changing age-mix of the population isexpected to account for 0.4 percentage pointof growth in 2007 and 0.6 percentage point in', 2017. The effect of population growth on' spending growth is expected to be constant' throughout the projection period, adding 0.8' percentage point annually. By comparison,I Medicare enrollment growth alone is pro-jected to contribute 2.9 percentage points togrowth in Medicare spending by 2017
Total spending growth expected over the: entire period is slightly slower than last year's,driven primarily by reestimation of the model
' for real per capita spending; lower historical' data for spending, prices, and input costs; andlower projections of medical price inflation.Contributing to the lower price growth ismonthly employer payroll data from the Cur-rent Employment Survey, which show a sharpdeceleration in average hourly earnings for thehealth sector in 2007, particularly for non-supervisory hospital employees." Also, theprices for one key physician input cost, mal-
, practice insurance premiums, are projected to; grow more slowly than in the recent past and; contribute to reduced medical price inflation.'^
Funding Outlook, By Payer• Medicare. In 2007, Medicare spending
: growth is projected to slow to 6.5 percent, fol-lowing 18.7 percent growth in 2006 associated
: with the introduction of Medicare Part D (Ex-hibit 5). This expected deceleration is also in-fluenced by a smaller increase in Medicare Ad-vantage (MA) plan payments as a result of riskadjustments and is expected to produceslower growth across most sectors, including
physicians and prescription drugs.'* After2007, Medicare spending growth is antici-pated to rebound, then accelerate to a greaterdegree in the last half of the projection period,driven by higher growth in Medicare enroll-ment. Medicare spending is expected to ac-count for just over one-fifth (20.7 percent) ofnational health spending by 2017
Medicare enrollment is projected to con-tinue to shift from fee-for-service (FFS) to-ward managed care over the next decade. By2017, 275 percent of eligible Medicare benefi-ciaries are expected to enroll in an MA plan,compared to 16.4 percent in 2006. This ex-pected shift is driven in part by the increasedavailability of new plans and added benefits inMA plans, such as lower cost sharing.
The Medicare spending growth pattern forphysician services reflects the physician pay-ment updates required in current law underthe Sustainable Growth Rate (SGR) system.The SGR system mandates the adjustment offuture physician payment updates for any dif-ferences between past target and actualspending levels.''' Since 2003, scheduled nega-tive updates have been avoided through legis-lative changes; however, the resulting higheractual physician spending has not been ac-companied by a higher physician spending tar-get, which leads to projected physician pay-ment cuts over the projection period. Sincethese projections assume no legislativechanges to the physician payment system, thephysician projections are likely understated.
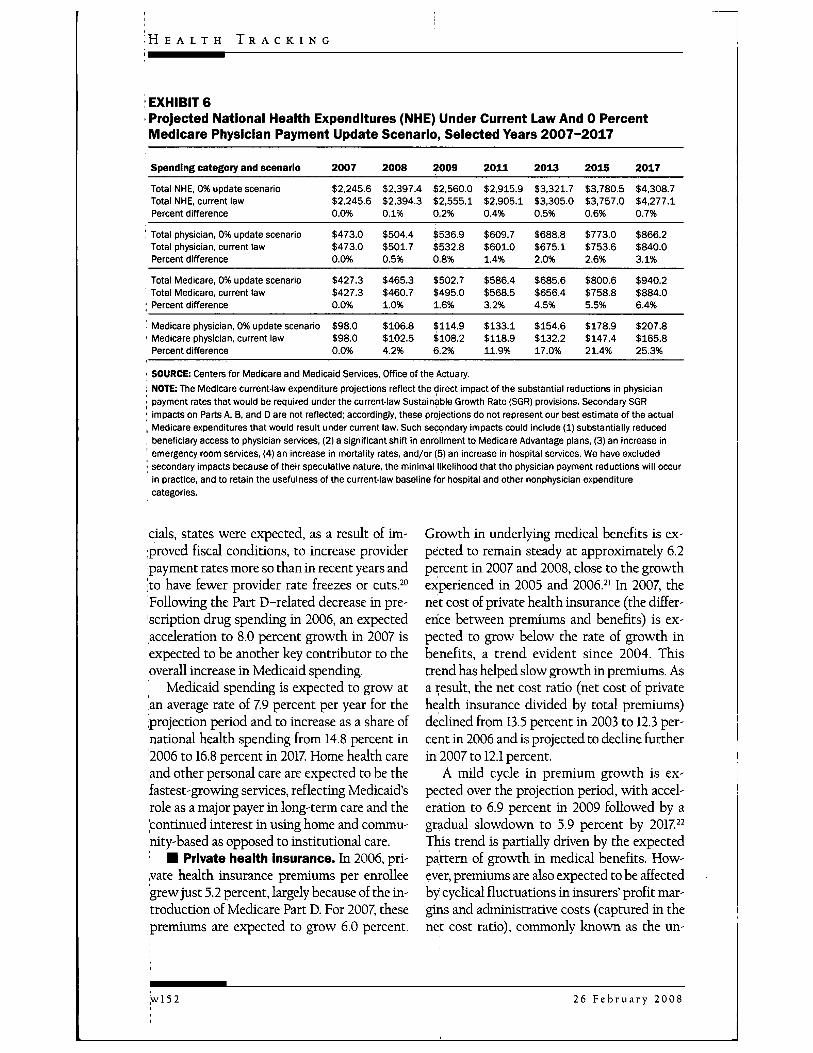
Given the high probability of legislative in-tervention to prevent the SGR-mandated phy-sician payment cuts, the effects of alternativepayment update scenarios were explored in asupplemental memo to the 2007 MedicareTrustees report.'^ Based on this analysis, thepotential impact of a 0.0 percent update sce-natio on the NHE projections was examined."Such an update for 2008-2017 would yield to-tal Medicare spending that is 6.4 percenthigher and Medicare physician spending thatis 25.3 percent higher in 2017 than anticipatedunder current-law assumptions (Exhibit 6).The projected effect on aggregate healthspending measures, however, would be
wl50 26 F e b r u a r y 2008
T R E N D S
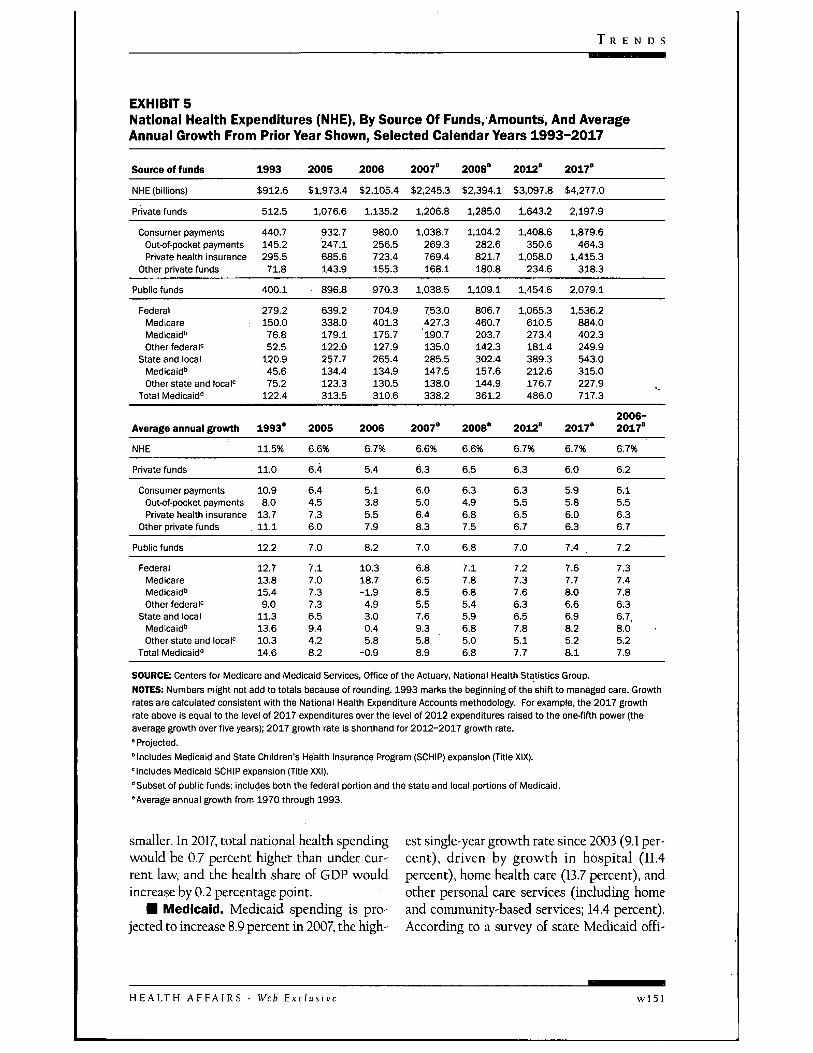
EXHIBIT 5National Health Expenditures (NHE), By Source Of Funds.'Amounts, And AverageAnnual Growth From Prior Year Shown, Selected Caiendar Years 1993-2017
Source of funds
NHE (billions)
Private funds
Consumer paymentsOutof-pocket paymentsPrivate health insurance
Other private funds
Public funds
1993
$912.6
512.5
440.7145.2295.571.8
400.1
2005
$1,973.4
1,076.6
932.7247.1685.6143.9
896.8
2006
$2,105.4
1.135.2
980.0256.5723.4155.3
970.3
2007'
$2,245.3
1.206.8
1,038.7269.3769.4168.1
1.038.5
2008°
$2,394.1
1,285.0
1,104.2282.6821.7180.8
1,109.1
2012'
$3,097.8
1,643.2
1,408.6350.6
1.058.0234.6
1.454.6
2017'
$4,277.0
2,197.9
1,879.6464.3
1.415.3318.3
2.079.1
FederalMedicareMedicaid''Other federai'
State and iocaiMedicaid"Other state and locai'=
Total Medicaid"
279.2150.076.852.5
120.945.675.2
122.4
639.2338.0179.1122.0257.7134.4123.3313.5
704.9401.3175.7127.9265.4134.9130.5310.6
753.0427.3' 190.7135.0285.5147.5138.0338.2
806.7460.7203.7142.3302.4157.6144.9361.2
1.065.3610.5273.4181.4389.3212.6176.7486.0
1.536.2884.0402.3249.9543.0315.0227.9717.3
Average annual growth
NHE
Private funds
Consumer paymentsOutK)f-pocket paymentsPrivate heaith insurance
Other private funds
Pubiic funds
1993°
11.5%
11.0
10.98.0
13.711.1
12.2
2005
6.6%
6.4
6.44.57.36.0
7.0
2006
6.7%
5.4
5.13.85.57.9
8.2
2007°
6.6%
6.3
6.05.06.48.3
7.0
2008°
6.6%
6.5
6.34.96.87.5
6.8
2012°
6.7%
6.3
6.35.56.56.7
7.0
2017°
6.7%
6.0
5.95.86.06.3
7.4
2006-2017°
6.7%
6.2
6.15.56.36.7
7.2
FederalMedicareMedicaid"Other federai"
State and iocaiMedicaid"Other state and iocai'
Totai Medicaid"
12.713.815.49.0
11.313.610.314.6
7.17.07.37.36.59.44.28.2
10.318.7-1.94.93.00.45.8
-0.9
6.86.58.55.57.69.35.88.9
7.17.86.85.45.96.85.06.8
7.27.37.66.36.57.85.17.7
7.67.78.06.66.98.25.28.1
7.37.47.86.36.7,8.05.27.9
SOURCE: Centers for Medicare and Medicaid Services, Office of the Actuary, Nationai Heaith Statistics Group.NOTES: Numbers might not add to totais because of rounding. 1993 marks the beginning of the shift to managed care. Growthrates are calculated consistent with the Nationai Heaith Expenditure Accounts methodology. For example, the 2017 growthrate above is equal to the levei of 2017 expenditures over the level of 2012 expenditures raised to the one-fifth power (theaverage growth over five years); 2017 growth rate is shorthand for 2012-2017 growth rate.' Projected.'Includes Medicaid and State Chiidren's Health Insurance Program (SCHIP) expansion (Titie XiX).'inciudes Medicaid SCHIP expansion (Title XXI)."Subset of pubiic funds; inciudes both the federai portion and the state and iocai portions of Medicaid."Average annuai grovrth from 1970 through 1993.
smaller. In 2017, total national health spendingwould be 0.7 percent higher than under cur-rent law, and the health share of GDP wouldincrease by 0.2 percentage point.
• Medicaid. Medicaid spending is pro-jected to increase 8.9 percent in 2007, the high-
est single-year growth rate since 2003 (9.1 per-cent), driven by growth in hospital (11.4percent), home health care (13.7 percent), andother personal care services (including homeand community-based services; 14.4 percent).According to a survey of state Medicaid offi-
H E A L T H A F F A I R S - Web Exclusi w l 5 1
H E A L T H T R A C K I N G
; EXHIBIT 6' Projected National Health Expenditures (NHE) Under Current Law And 0 PercentIVIedicare Physician Payment Update Scenario, Selected Years 2007-2017
Spending category and scenario
Total NHE, 0% update scenarioTotal NHE, current lawPercent difference
Total physician, 0% update scenarioTotal physician, current lawPercent difference
Totai Medicare, 0% update scenarioTotai iVIedicare, current lawPercent difference
Medicare physician, 0% update scenarioMedicare physician, current iawPercent difference
2007
$2,245.6$2,245.60.0%
$473.0$473.00.0%
$427.3$427.30.0%
$98.0$98.00.0%
2008
$2,397.4$2,394.30.1%
$504.4$501.70.5%
$465.3$460.71.0%
$106.8$102.54.2%
2009
$2,560.0$2,555.10.2%
$536.9$532.80.8%
$502.7$495.01.6%
$114.9$108.26.2%
2011
$2,915.9$2,905.10.4%
$609.7$601.01.4%
$586.4$568.53.2%
$133.1$118.911.9%
2013
$3,321.7$3,305.00.5%
$688.8$675.12.0%
$685.6$656.44.5%
$154.6$132.217.0%
2015
$3,780.5$3,757.00.6%
$773.0$753.62.6%
$800.6$758.85.5%
$178.9$147.421.4%
2017
$4,308.7$4,277.10.7%
$866.2$840.03.1%
$940.2$884.06.4%
$207.8$165.825.3%
' SOURCE: Centers for Medicare and Medicaid Services. Office of the Actuary.; NOTE: The Medicare current-law expenditure projections refiect the direct impact of the substantial reductions in physician• payment rates that wouid be required under the current-law Sustainabie Growth Rate (SGR) provisions. Secondary SGRI impacts on Parts A, B, and D are not reflected; accordingly, these projections do not represent our best estimate of the actual, Medicare expenditures that wouid resuit under current law. Such secondary Impacts couid inciude (1) substantiaily reduced, beneficiary access to physician services, (2) a significant shift in enroiiment to Medicare Advantage pians, (3) an Increase in' emergency room services, (4) an increase in mortaiity rates, and/or (5) an increase in hospitai services. We have exciuded' secondary impacts because of their speculative nature, the minimal likelihood that the physician payment reductions wiii occur
in practice, and to retain the usefuiness ofthe current-iaw baseline for hospitai and other nonphysician expenditurecategories.
cials, states were expected, as a result of im-proved fiscal conditions, to increase providerpayment rates more so than in recent years andjto have fewer provider rate freezes or cuts.- "Following the Part D-related decrease in pre-'scription drug spending in 2006, an expectedacceleration to 8.0 percent growth in 2007 isexpected to be another key contributor to theoverall increase in Medicaid spending.
Medicaid spending is expected to grow atan average rate of 7.9 percent per year for theprojection period and to increase as a share ofnational health spending from 14.8 percent in'2006 to 16.8 percent in 2017 Home health careand other personal care are expected to be thefastest-growing services, reflecting Medicaid'srole as a major payer in long-term care and the'continued interest in using home and commu-nity-based as opposed to institutional care.
• Private health Insurance. In 2006, pri-yate health insurance premiums per enrolleegrew just 5.2 percent, largely because of the in-troduction of Medicare Part D. For 2007, thesepremiums are expected to grow 6.0 percent.
Growth in underlying medical benefits is ex-pected to remain steady at approximately 6.2percent in 2007 and 2008, close to the growthexperienced in 2005 and 2006. ' In 2007, thenet cost of private health insurance (the differ-en!ce between premiums and benefits) is ex-pected to grow below the rate of growth inbenefits, a trend evident since 2004. Thistrend has helped slow growth in premiums. Asa result, the net cost ratio (net cost of privatehealth insurance divided by total premiums)dedined from 13.5 percent in 2003 to 12.3 per-cent in 2006 and is projected to decline furtherin 2007 to 12.1 percent.
A nuld cycle in premium growth is ex-pected over the projection period, with accel-eration to 6.9 percent in 2009 followed by agradual slowdown to 5.9 percent by 2017. -This trend is partially driven by the expectedpattern of growth in medical benefits. How-ever, premiums are also expected to be affectedby cyclical fluctuations in insurers' profit mar-gins and administrative costs (captured in thenet cost ratio), commonly known as the un-
26 F e b r u a r y 2008
T R E N D S
derwriting cycle. ' A milder underwriting cy-cle is expected as better information systemsdampen the variation caused by sequential un-der- and overprediction of medical trends.
D Out-of-pocket spending. The growth inout-of-pocket payments is projected to con-tinue to remain below that of the growth inboth aggregate national health spending andprivate health insurance spending in 2007 (Ex-hibit 5). Over the remainder of the period andin response to projected slowing economicgrowth, employers could shift more costs toemployees through benefit buy-downs and in-creased cost sharing, resulting in a conver-gence of the growth rates for out-of-pocketand private insurance spending.^'' The impactof consumer-directed health plans on out-of-pocket spending has been, and is expected toremain, minor.
fVOedical Services SpendingOutlook, By Sector
D Prescription drugs. Aggregate pre-scription drug spending growth is expected tobe 6.7 percent in 2007 a slowdown of 1.8 per-centage points (Exhibit 2). This decelerationis directly related to drug price growth, whichis expected to decelerate 2.1 percentage pointsto 1.4 percent. The comparatively low pricegrowth can be attributed mainly to factors re-lating to generic drugs: (1) generic equivalentsof many top-selling drugs have become avail-able; (2) the prices of the generic forms ofZocor and Zoloft fell sharply at the beginningof 2007, when their six-month exclusivity pe-riods ended; and (3) price competition forgenerics in retail outlets has intensified.- ^ Pre-scription drug use is expected to accelerateslightly in 2007 partially due to the effect ofMedicare beneficiaries' having Part D coveragefor all of 2007 (some only had coverage for asfew as eight months in 2006).
Drug spending growth is expected to re-main about the same in 2008 as in 2007, al-though its composition is expected to change.Price growth is projected to rebound some-what from its 2007 rate, while use is projectedto decelerate slightly. From 2008 to 2017, pricegrowth is expected to average 3.7 percent.
with a gradual acceleration in utilizationgrowth. Lower treatment guidelines are likelyto underlie higher use in some specific thera-peutic classes (such as cholesterol and highblood pressure).2* Also, expanding indicationscould increase utilization growth, especiallyamong specialty drugs that are priced muchhigher than nonspecialty drugs.- ' Contribu-tions to higher spending growth resultingfrom recent increases in utilization have beenmoderated by corresponding growth in the ge-neric dispensing rate. Since growth in genericuse is expected to level off during the projec-tion period, the impact of rising utilizationrates could become increasingly more influen-tial on total spending growth. Finally, despitethe recent difficulties facing drug manufactur-ers on new drug approvals, the number of newdrugs coming onto the market is expected tomildly accelerate over the projection period,partially offsetting spending declines for drugsthat lose patent protection.
D Hospitals. Overall hospital spendinggrowth is expected to be 7.5 percent in 2007,an increase of 0.4 percentage point (Exhibit 2).Higher reimbursement rates are expected tocause Medicaid spending for hospital care toaccelerate sharply to 11.4 percent in 2007.- ^Medicare spending growth, on the other hand,is projected to remain at 5.1 percent in 2007, aresult of continued projected slower inpatientuse and the risk adjustments to MA rates.Growth in hospital spending by private payersis expected to decelerate in 2007 partially as aresult of slowing hospital price growth.
Total hospital spending growth is then pro-jected to gradually slow from 72 percent in2008 and eventually fall to 6.4 percent by 2017,as the expected slowdown in private spendinggrowth outpaces faster public spendinggrowth. Private hospital spending growth isexpected to remain relatively stable through2011 and then decelerate over the remainder ofthe projection period, to 5.6 percent in 2017Medicare spending growth, conversely, is ex-pected to accelerate from 71 percent in 2011 to8.0 percent by 2017 The slowdown in privatespending growth and the acceleration inMedicare spending growth coincide with the
H E A L T H A F F A I R S - Web Exclusi^ w l 5 3
H E A L T H T R A C K I N G
period in which the leading edge of the baby-boom generation will become eligible for Medi-care. In 2008 and beyond, Medicaid spendinggrowth rates for hospital care are expected toincrease 6.5 percent per year, on average.
• Physician services. Spending for physi-cian and clinical services is expected to con-tinue its recent decelerating trend and slow0.2 percentage point to 5.7 percent in 2007(Exhibit 2). For the entire projection period,physician spending growth is anticipated toaverage 5.9 percent per year, compared to the6.6 percent average armual growth rate during1995-2006. In the 0.0 percent Medicare physi-cian payment update scenario, average annualgrowth for the period projects to 6.2 percent.Several developments are anticipated to havecompeting effects on the pattern of growth inphysician spending. For instance, projectedshortages of primary care physicians and thecontinued mergers of practices are expected toapply upward pressures, while possiblechanges to benefit structure in the form ofhigher cost-sharing requirements are antici-pated to mitigate spending grov^h.^'' Medicaid as a share of physician spending
is expected to increase slightly over the projec-tion period from 71 percent in 2006 to 79 per-cent by 2017. Conversely, under current law.Medicare's share of physician spending is an-ticipated to decrease from 20.6 percent in 2006tp 19.7 percent in 2017 However, using the 0.0percent Medicare physician payment updatescenario, the share of physician spending paidby Medicare would be expected to increase to24.0 percent by 2017
• Long-term care. Home health carespending is projected to grow 9.2 percent in2007, a slowdown of 0.7 percentage point (Ex-hibit 2). Despite this expectation of slowingg|rowth, home health is sdll projected to beamong the fastest-growing health care sectorsin 2007 and over the projection period, withanticipated average growth of 11 percent peryear. Medicare and Medicaid are expected todrive this rapid expansion as the public shareof home health care is expected to increasefrom 75 percent in 2006 to 84 percent in 2017
Nursing home spending growth is pro-
jected to increase 0.4 percentage point in 2007to 3.8 percent and then to accelerate to an av-erage annual growth rate of 5.3 percentthrough 2017. Medicaid is expected to remainthe largest payer, paying for about 43 percentof all such care during the projection period.The impact of the baby-boom generation onnursing home spending is likely to be small,even at the end of the projection period, sincenursing home use is highest for people ageeighty-five and older and the oldest babyboomers v dU be just seventy-one in 2017'°
Concluding CommentsWith the implementation of Medicare Part
D behind us, a focal point of the next ten yearswill be the impending movement of the babyboomers into Medicare. Expected trends laterin the projection period, such as acceleratinggrowth in Medicare enrollment, are a first signof this shift. Although the difference in ratesbetween health spending growth and overalleconomic growth is projected to be lower overthe next decade than the previous thirty years,on average, cost pressures continue to mount.As a result, health is projected to consume anexpanding share of the economy, which meansthat pohcymakers, insurers, and the publicwall face increasingly difficult decisions aboutthe way health care is dehvered and paid for.
The authors thank the other members ofthe NationalHealth Expenditure Accounts Projections Team:Jonathan Cylus and Kevin Lyons. The opinionsexpressed here are the authors' and not necessarilythose ofthe Centers for Medicare and MedicaidServices. The authors also thank Richard Foster,Stephen Heffler, Aaron Catlin, Cathy Curtis, MarkFreeland, and Micah Hartman.
NOTES1. J. Poisal et al., "Health Spending Projections
Through 2016: Modest Changes Obscure Part D'sImpact," Health Affairs 26, no. 2 (2007); w242-w253 (published online 21 February 2007;iO.B77/hltha£f.26.2.w242).
2. A. Catlin et al., "National Health Spending in2006; A Year of Change for Prescription Drugs,"Health Affairs 27, no. 1 (2008); 14-29.
3. Boards of Trustees, 2007 Annual Report ofthe Boards
wl54 26 February 2008
T R E N D S
of Trustees ofthe Federal Hospital Insurance and FederalSupplementary Medical Insurance Trust Funds, 23 April2007, http;//www.cms.hhs.gov/ReportsTrusrFunds/downloads/tr2007pdf (accessed 23 Janu-ary 2008).
4. For a description of the projections model, seeCMS, "Projections of National Health Expendi-tures; Methodology and Model Spedficadon," 21February 2007, http;//www.cms.hhs.gov/NationalHealthExpendData/downloads/projections-methodology.pdf (accessed 23 Janu-ary 2008).
5. Boards of Trustees, 2007 Annual Report6. Available historical data (as of December 2007)
and updated near-term forecasts are used totransition to the 2007 Medicare Trustees reportassumptions.
7. OMB, "Budget of the United States Government,Fiscal Year 2009," http;//wwvwvhitehouse.gov/omb/budget (accessed 23 January 2008).
8. CMS, "Projection Accuracy of National HealthExpenditures," http;//www.cms.hhs.gov/NationalHealthExpendData/03_NationalHealthAccountsProjected.aspi ^TopOfPage (accessed 23January 2008).
9. S. EoUand, A. Goodman, and M. Stano, The Eco-nomics of Health andHealth Care, 5th ed. (Upper Sad-dle River, NJ.; Pearson Education, 2007), 244.
10. Real physician income measures are largely ex-cluded from our input price measures. See H.T.Tu and P. Ginsburg, "Losing Ground; PhysicianIncome, 1995-2003" (Washington; Center forStudying Health System Change, June 2006).
11. This compares to an output price to input pricedifferential of 1.6 percentage points from 1980through 1995 and -0.3 percentage point from1995 through 2006.
12. Growth in real disposable personal income rosefrom 2.5 percent in 2002 to 3.2 percent in 2007Growth is expected to slow fot the rest of theprojection period, ending at 2.3 percent by 2017which is 0.5 percentage point below its averageover the past thirty years.
13. M. Hartman ec al., "U.S. Health Spending by Age,Selected Years through 2004," Health Ajfairs 27, no.1 (2008); wl-wl2 (published online 6 November2007; 10.1377/hIthaff.271.wl).
14. BLS, "B-16. Average Hours and Earnings of Pro-duction and Nonsupervisory Workers on PrivateNonfarm Payrolls by Detailed Industry," ftp;//ftp.bls.gov/pub/suppl/EMPSITCESEEB16.TXT (ac-cessed 19 February 2008).
15. Global Insight Inc., ''3rd Qtr 2007;@USMACRO/CONTROL0807@CISSIM/TL0807SIM" (Contract no. GS-1OF-O318K, HSM-500-2006-00037G, prepared for the CMS, 2007).
16. This is a one-year adjustment that is not ex-pected to affect future MA enrollment trends.
17 M.K. Clemens, "Estimated Sustainable GrowthRate and Conversion Factor, for Medicare Pay-ments to Physicians in 2007," November 2006,http;//www.cms.hhs.gov/SustainableG RatesConEact/Dovraloads/sgr2007f.pdf (accessed 23January 2008).
18. M.K. Clemens, "Projected Medicare Part B Ex-penditures under Two Illustrative Scenarioswith Alternative Physician Payment Updates,"April 2007, http;//www.cms.hhs.gov/ReportsTrustFunds/downloads/AlternativePhysicianUpdate.pdf (accessed 23 January 2008).
19. See note in Exhibit 6.20. V. Smith et al., "As Tough Times Wane, States Act
to Improve Medicaid Coverage and Quality; Re-sults from a Fifty-State Medicaid Budget Surveyfor State Fiscal Years 2007 and 2008," October2007 http;//www.kff.org/medicaid/7699.cfm (ac-cessed 23 January 2008).
21. See Mercer, "U.S. Employers' Health BenefitCosts Continues to Rise at Twice the InflationRate," Press Release, 19 November 2007 http;//www.mercer.com/press release/detaOs.jhtml/dynamic/idContent/1287790 (accessed 23 Janu-ary 2008); and Henry J. Kaiser Family Founda-tion/Health Research and Educational Trust, Em-ployer Health Benefits: 2007 Annual Survey, September2007, http;//www.kff.org/insurance/7672/index.cfm (accessed 23 January 2008).
22. Ibid.23. A. Rosenblatt, "The Underwriting Cycle; The
Rule of Six," Health Affairs 23, no. 6 (2004); 103-106.
24. P. Fronsdn, "The Future of Employment-BasedHealth Benefits; Have Employers Reached a Tip-ping Point?" EBRI Issue Brief no. 312 (Washing-ton; EBRI, December 2007).
25. S. Rubenstein, "Why Generic Doesn't AlwaysMean Cheap," Wall Street journal 13 March 2007;and S. Saul, "Helped by Generics, Inflation ofDrug Costs Slows," New York Times, 21 September2007
26. Medco Health Solutions, 2007 Drug Trend Report(Franklin Lakes, NJ.; Medco, 2007), 38-40.
27 CVS Caremark, Trends Rx Report 2007(Woonsocket, R.I.; CVS, 2007), 27-30.
28. Smith et al., "As Tough Tmies Wane."29. H. Pham and P. Ginsbuig, "Unhealthy Trends;
The Future of Physician Services," Health Affairs26, no. 4 (2007); 1586-1598.
30. Hartman et al., "U.S. Health Spending by Age."
H E A L T H A F F A I R S - Web Exclusive w l 5 5