Embed Size (px)
Citation preview

The Susquehanna River Needs a Strong WIP
Heal the Susquehanna and
We Heal the Chesapeake
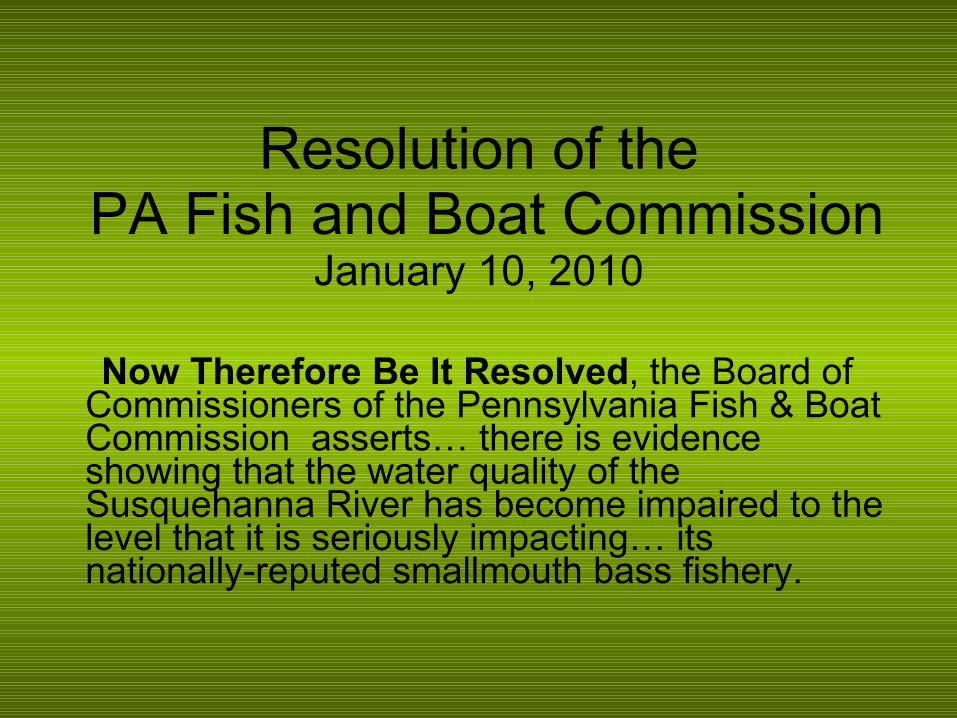
Resolution of the PA Fish and Boat Commission
January 10, 2010
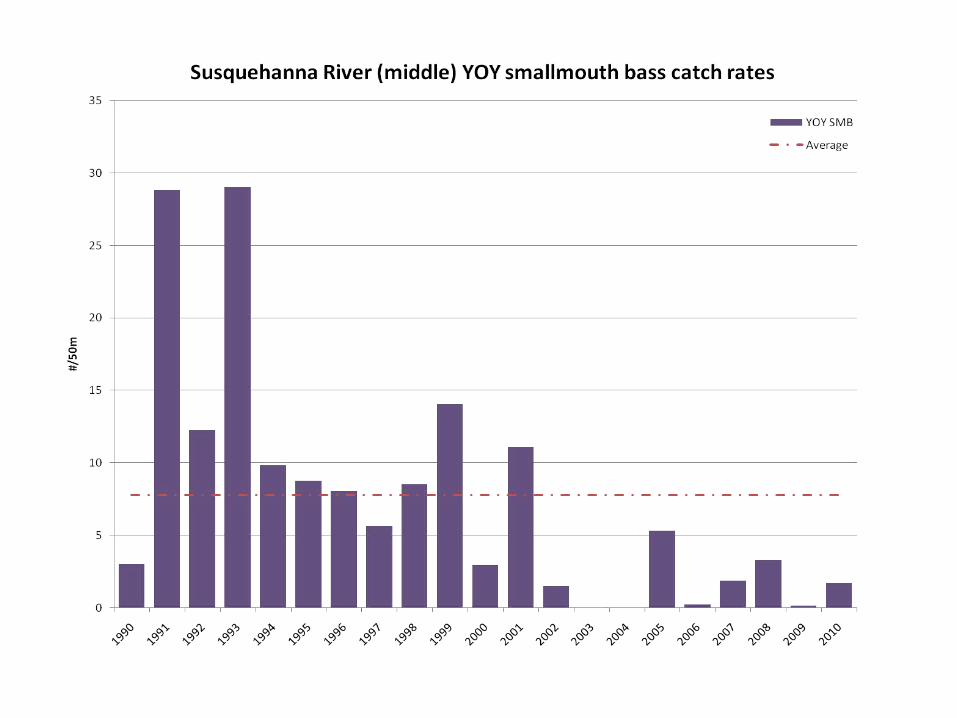
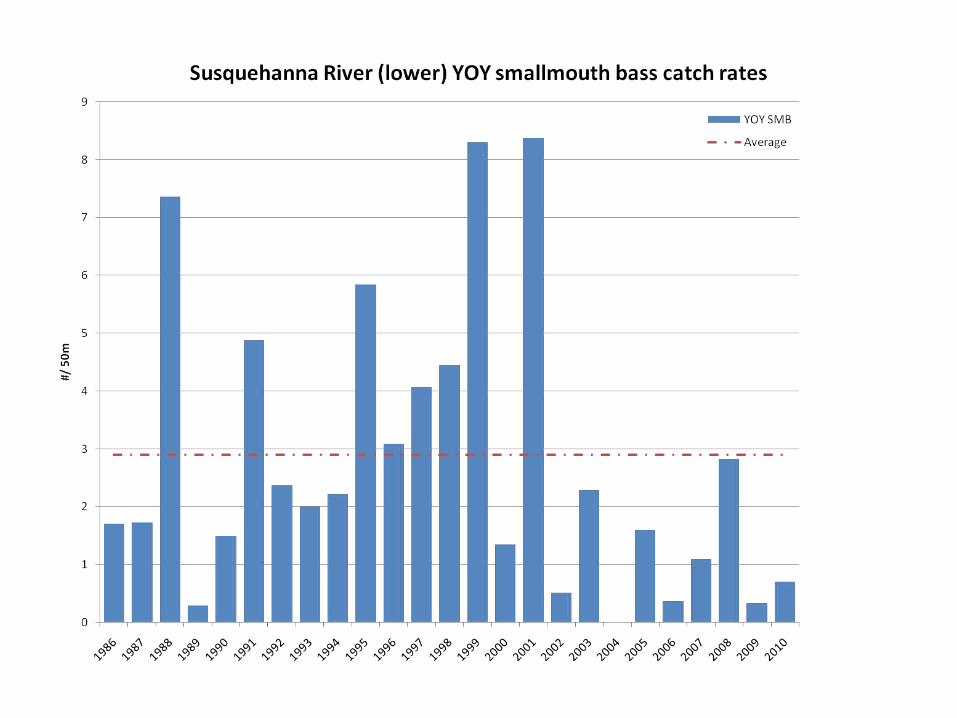
Now Therefore Be It Resolved, the Board of Commissioners of the Pennsylvania Fish & Boat Commission asserts… there is evidence showing that the water quality of the Susquehanna River has become impaired to the level that it is seriously impacting… its nationally-reputed smallmouth bass fishery.
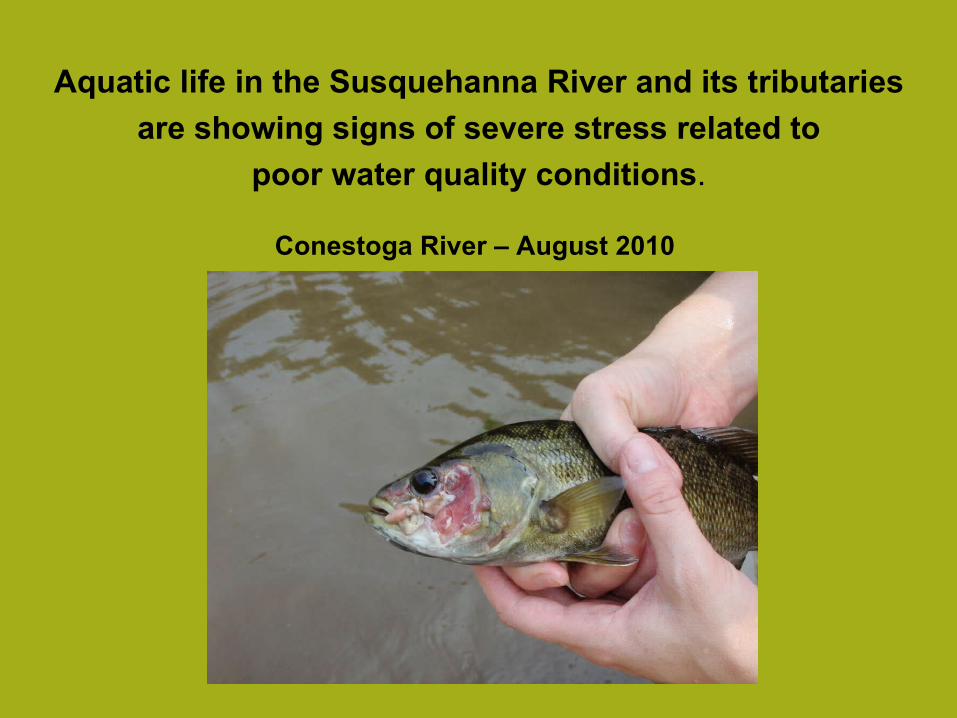
Aquatic life in the Susquehanna River and its tributaries
are showing signs of severe stress related to
poor water quality conditions.
Conestoga River – August 2010
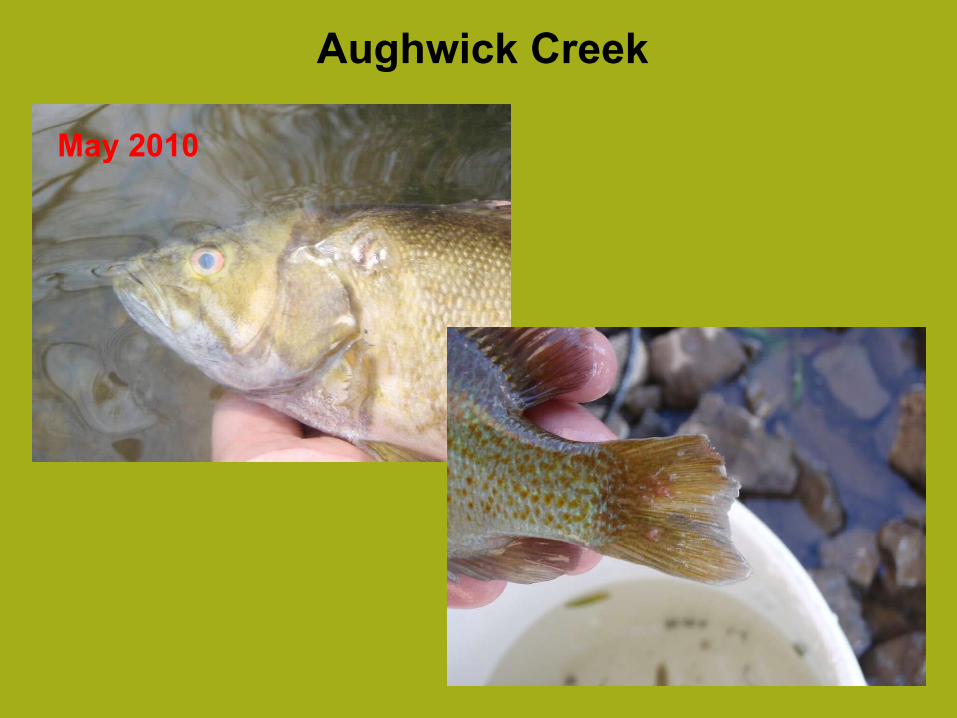
Aughwick Creek
May 2010
July 2010
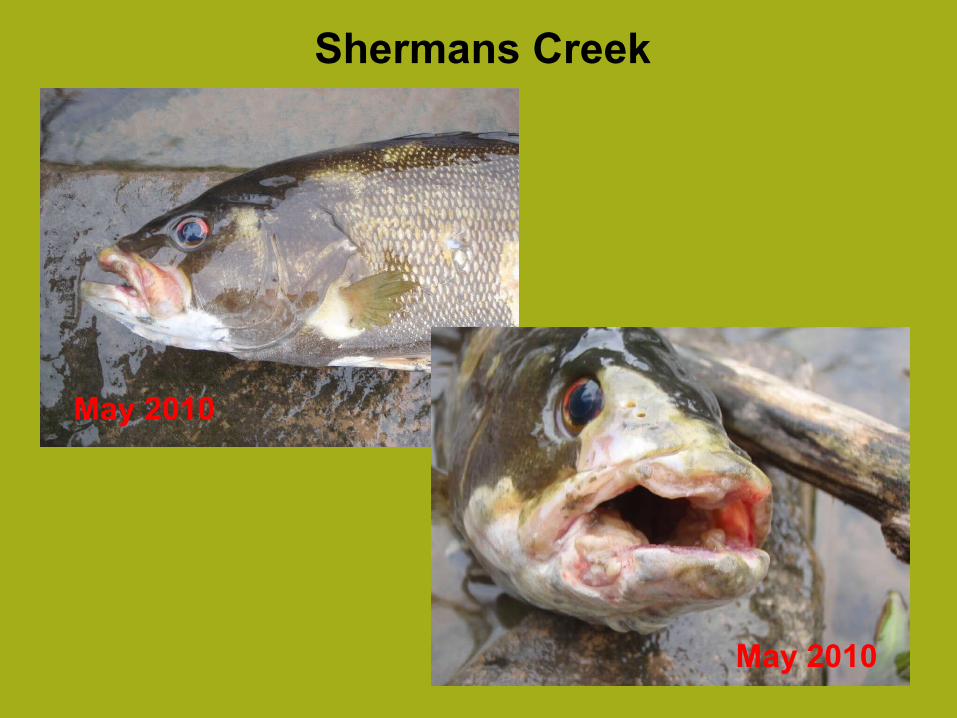
Shermans Creek
May 2010
May 2010
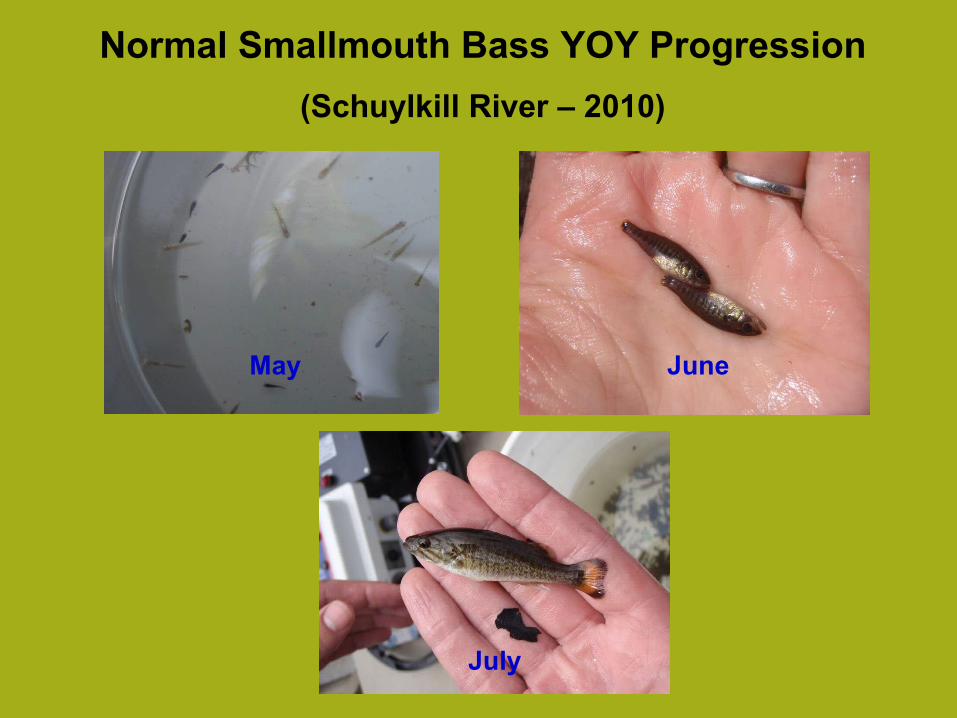
Normal Smallmouth Bass YOY Progression
(Schuylkill River – 2010)
June
July
May
June
July
July
May
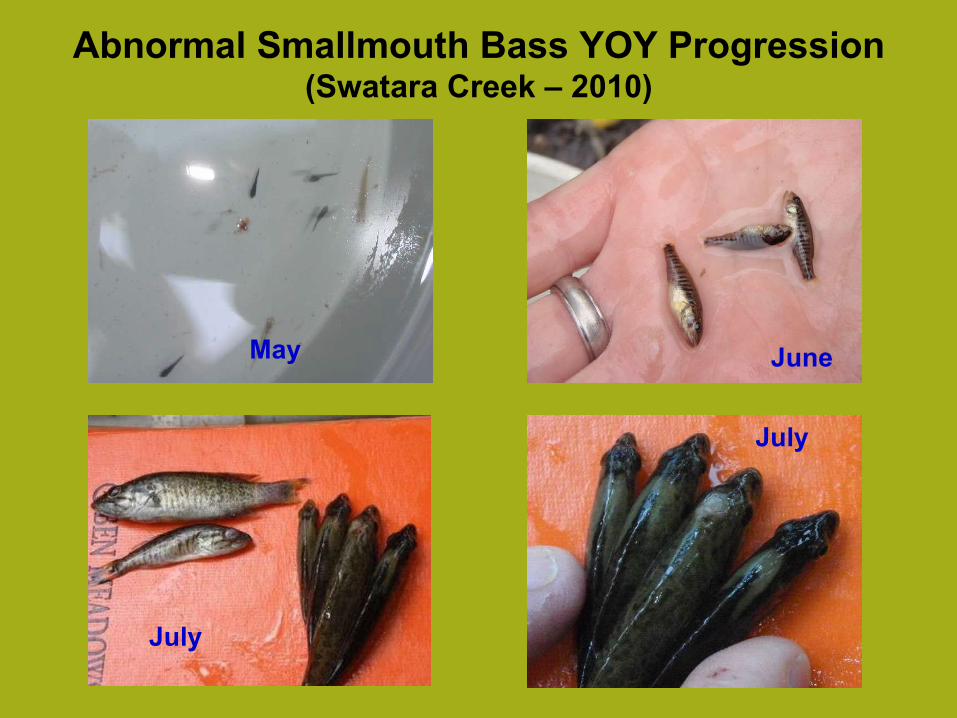
Abnormal Smallmouth Bass YOY Progression(Swatara Creek – 2010)
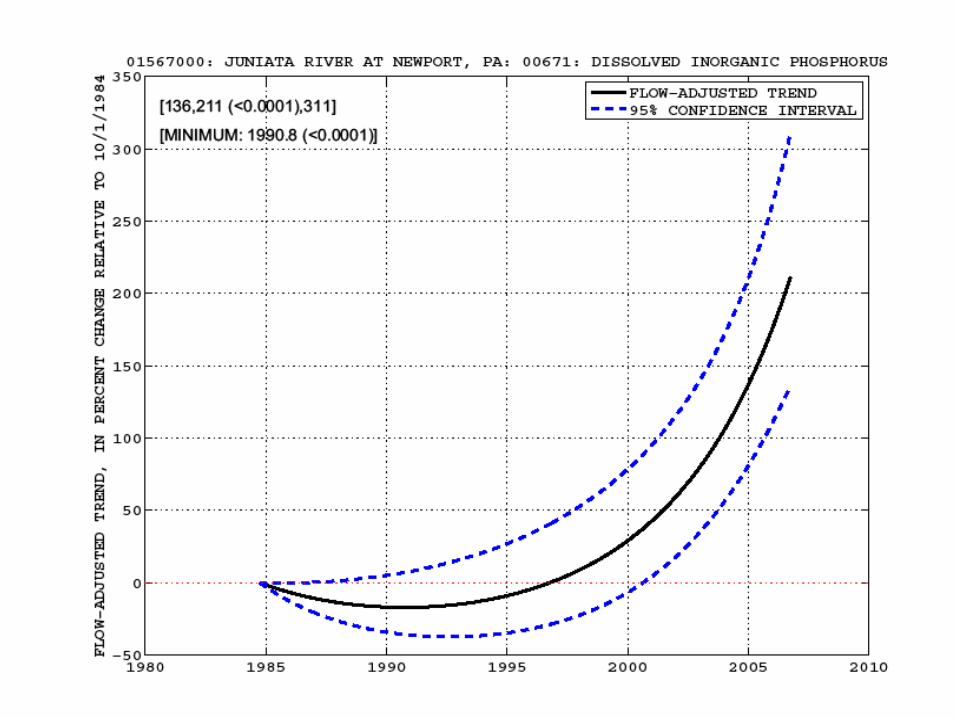
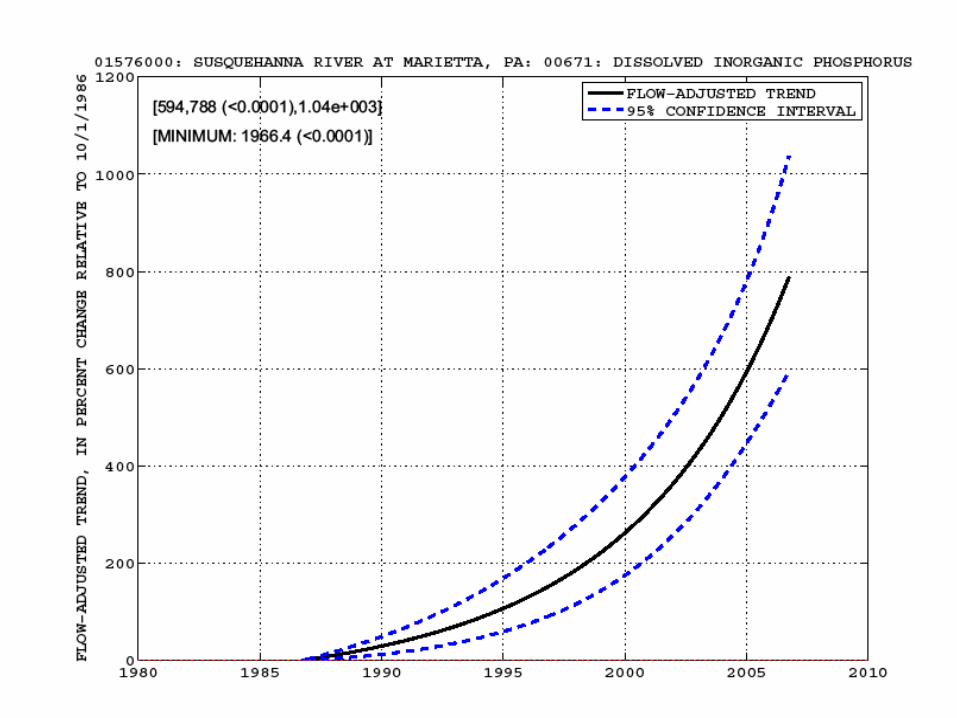
U.S. Geological Survey Open-File Report
2007-1372 By
Michael J. Langland, Douglas L. Moyer, and
Joel Blomquist
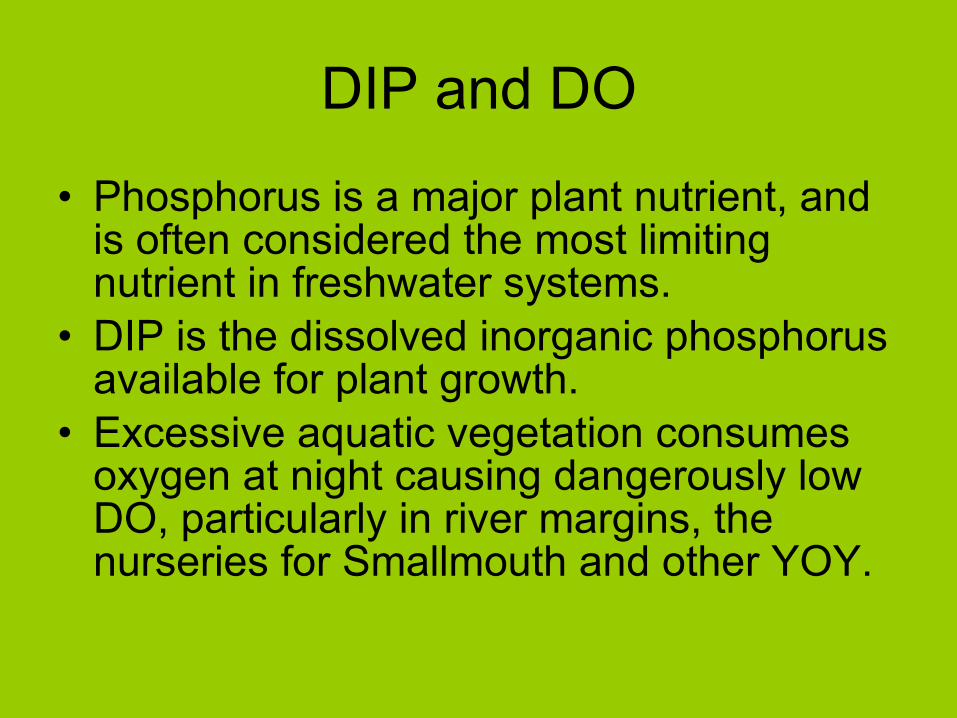
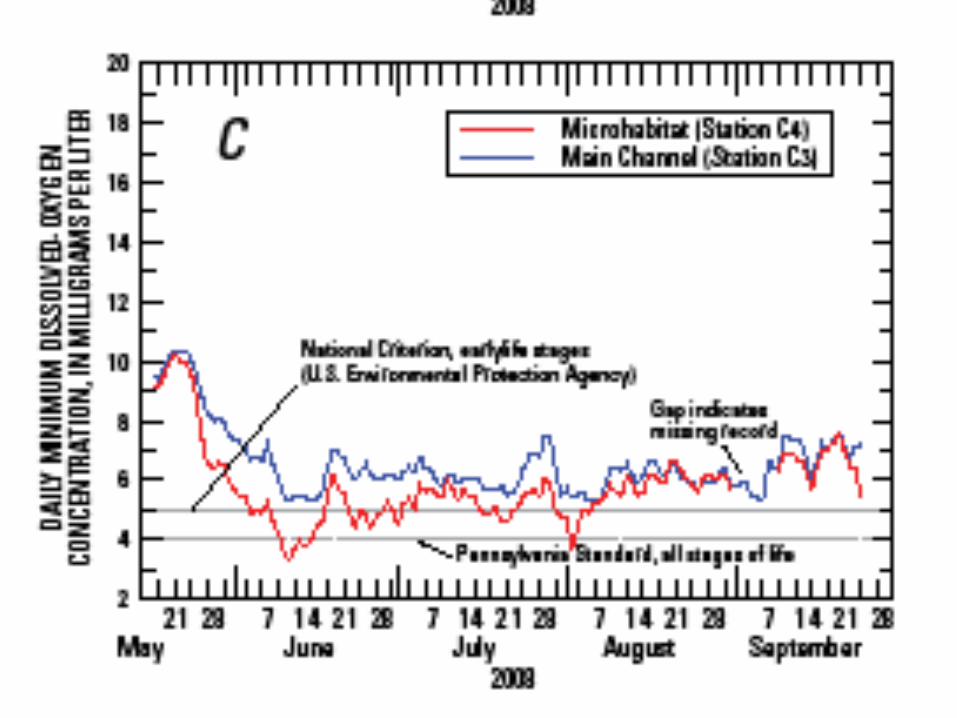
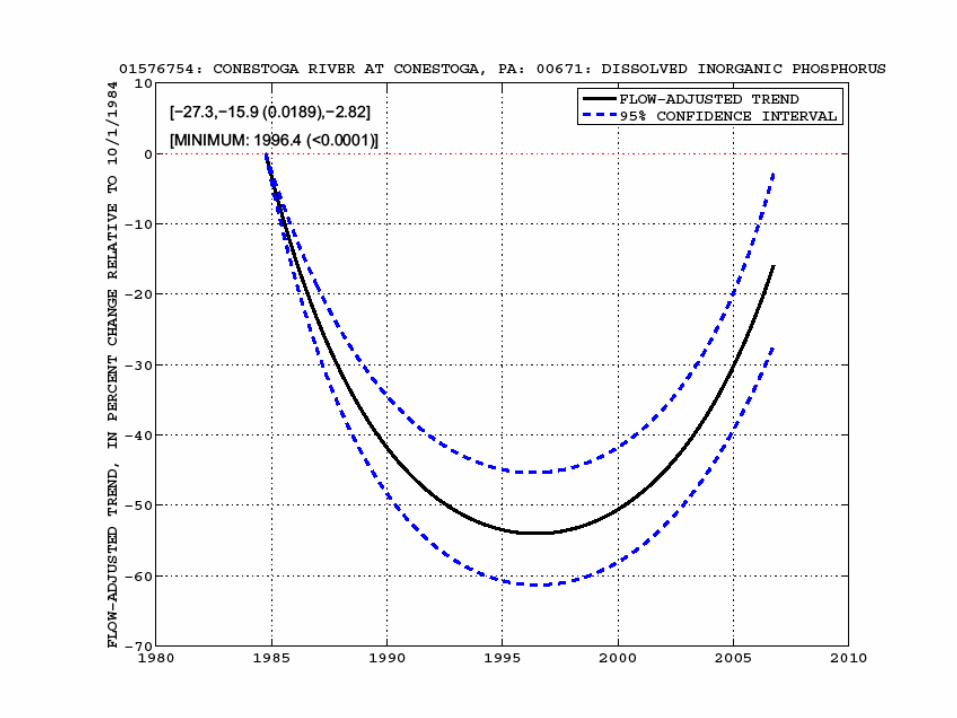
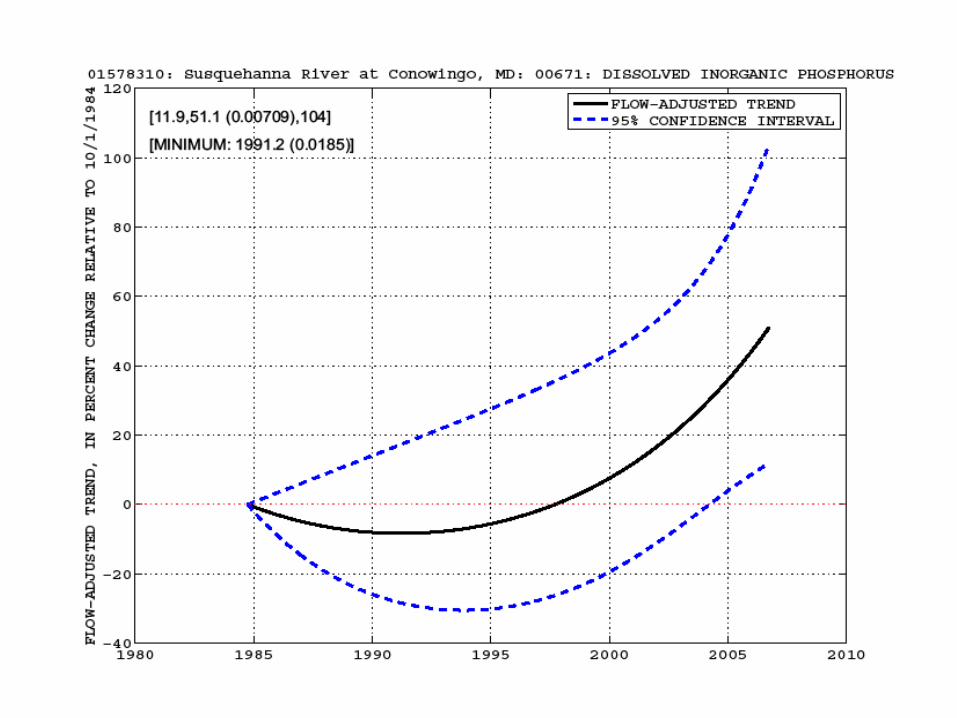
DIP and DO
• Phosphorus is a major plant nutrient, and is often considered the most limiting nutrient in freshwater systems.
• DIP is the dissolved inorganic phosphorus available for plant growth.
• Excessive aquatic vegetation consumes oxygen at night causing dangerously low DO, particularly in river margins, the nurseries for Smallmouth and other YOY.
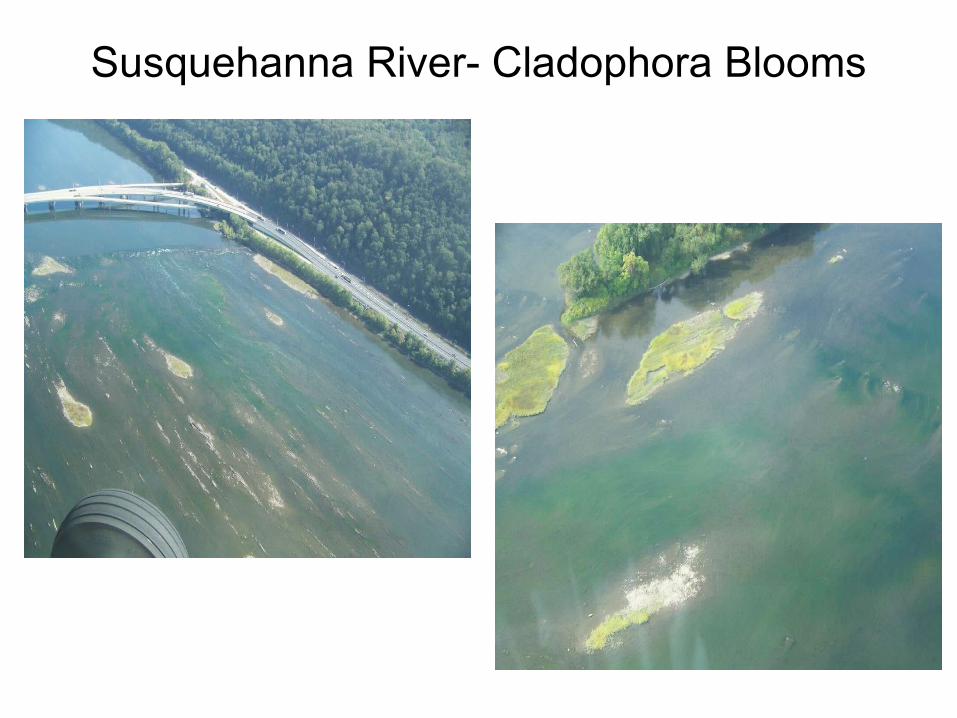
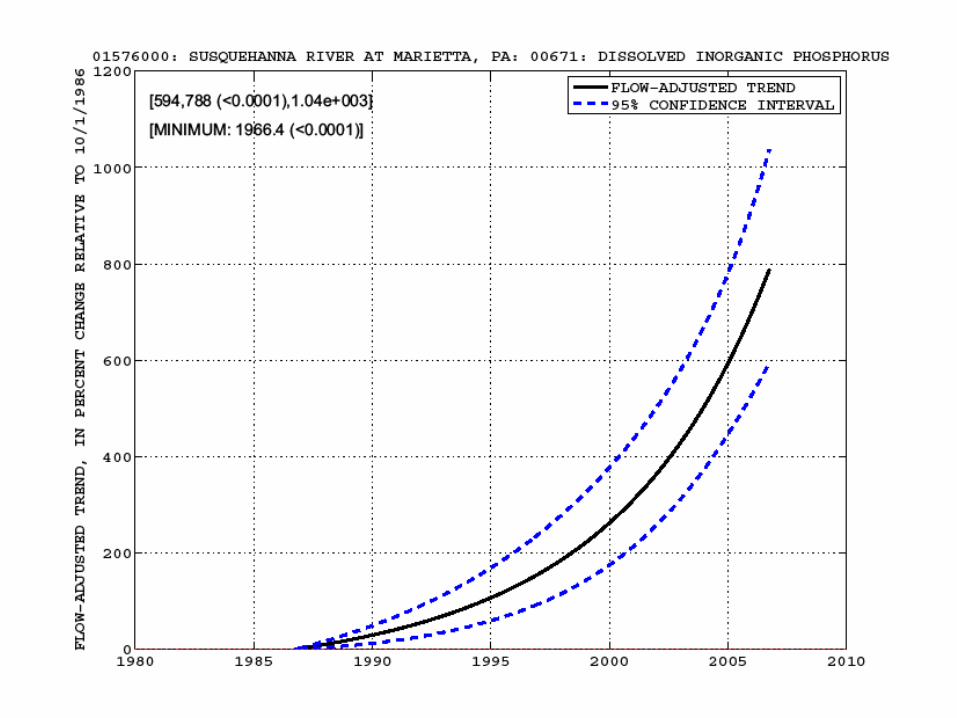
Susquehanna River- Cladophora Blooms
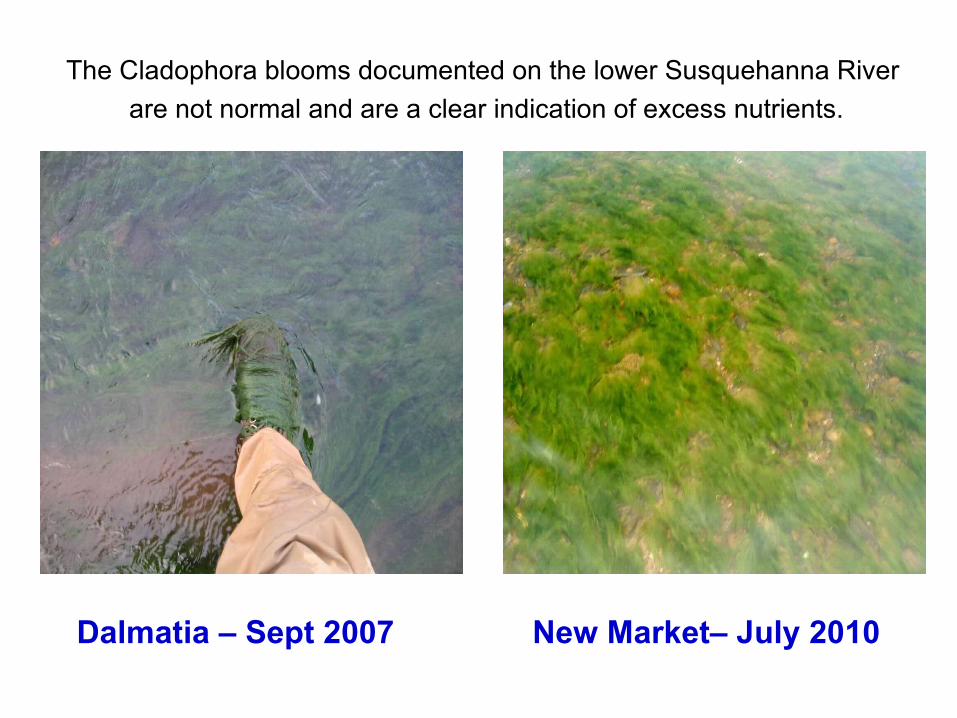
Dalmatia – Sept 2007 New Market– July 2010
The Cladophora blooms documented on the lower Susquehanna River
are not normal and are a clear indication of excess nutrients.
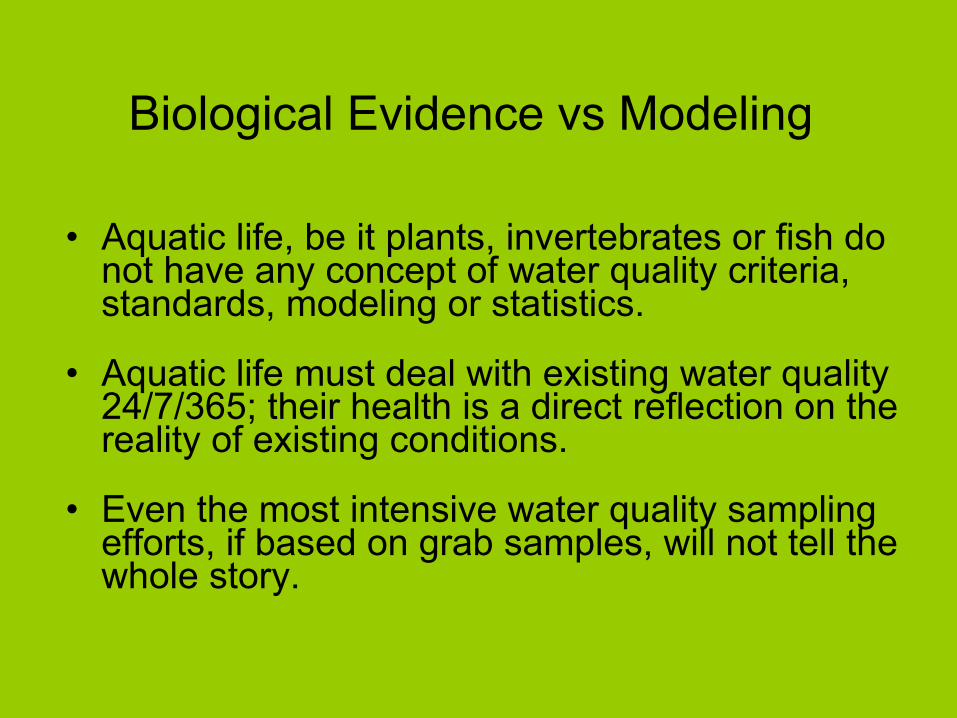
Biological Evidence vs Modeling
• Aquatic life, be it plants, invertebrates or fish do not have any concept of water quality criteria, standards, modeling or statistics.
• Aquatic life must deal with existing water quality 24/7/365; their health is a direct reflection on the reality of existing conditions.
• Even the most intensive water quality sampling efforts, if based on grab samples, will not tell the whole story.

What is the Difference?
• The Susquehanna shows consistently lower Dissolved Oxygen than the Delaware and Allegheny Rivers.
• What are the differences in land use?
• Intense Agriculture exists, particularly south of the confluence of the North and West Branches of the Susquehanna.
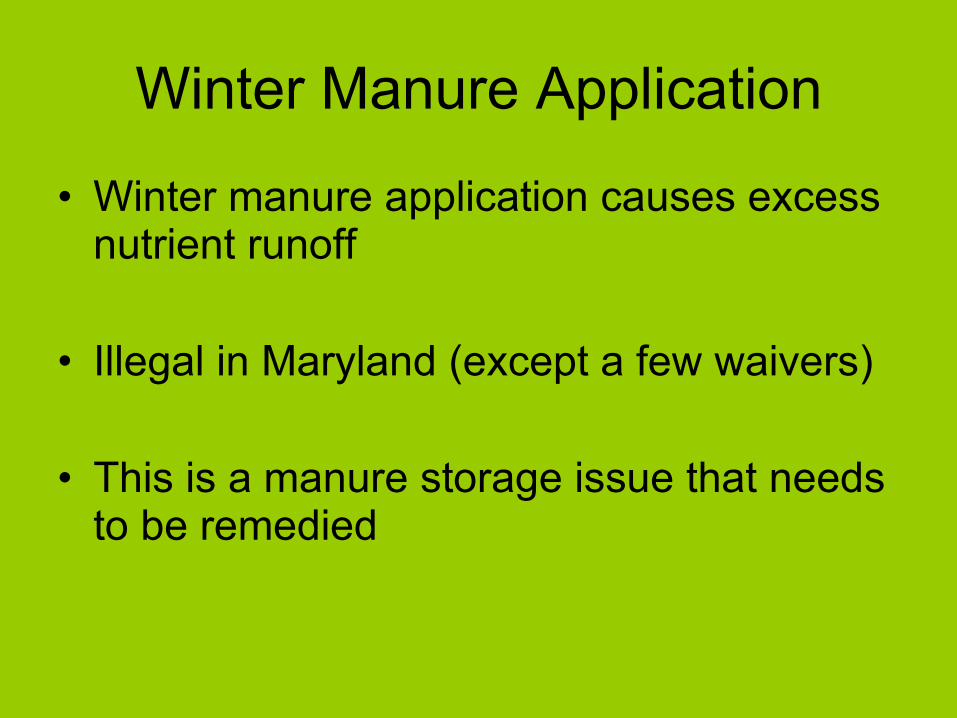
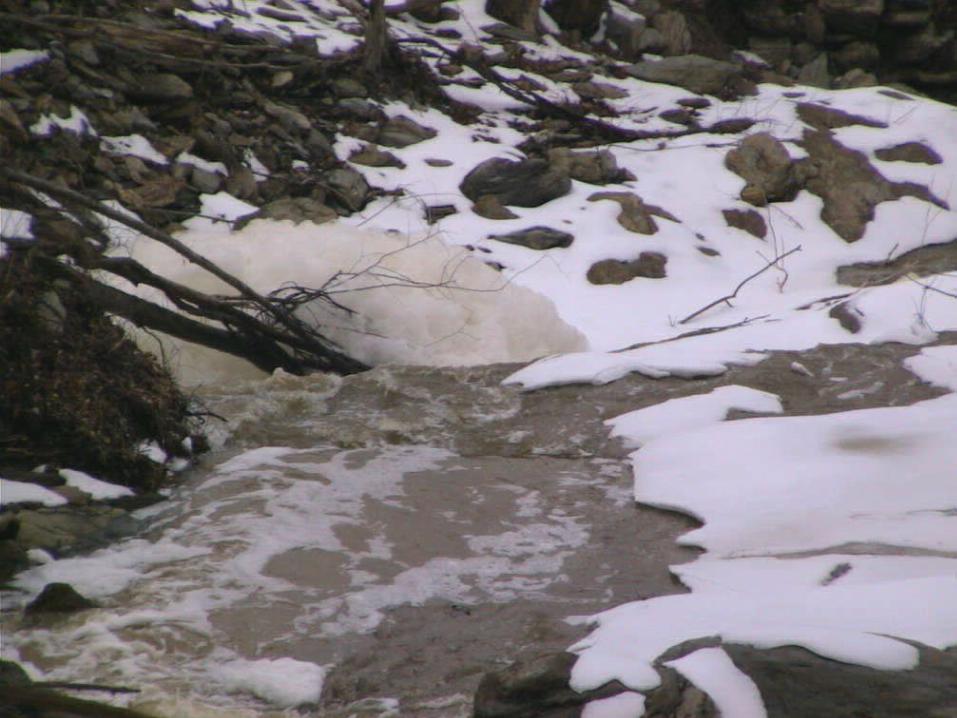
Winter Manure Application
• Winter manure application causes excess nutrient runoff
• Illegal in Maryland (except a few waivers)
• This is a manure storage issue that needs to be remedied
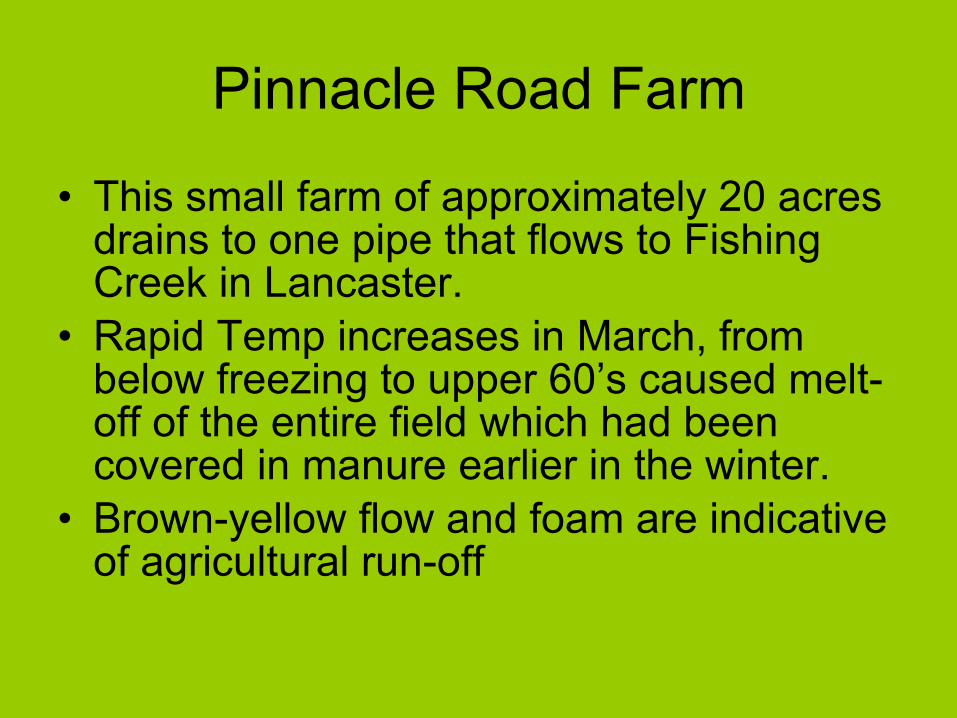
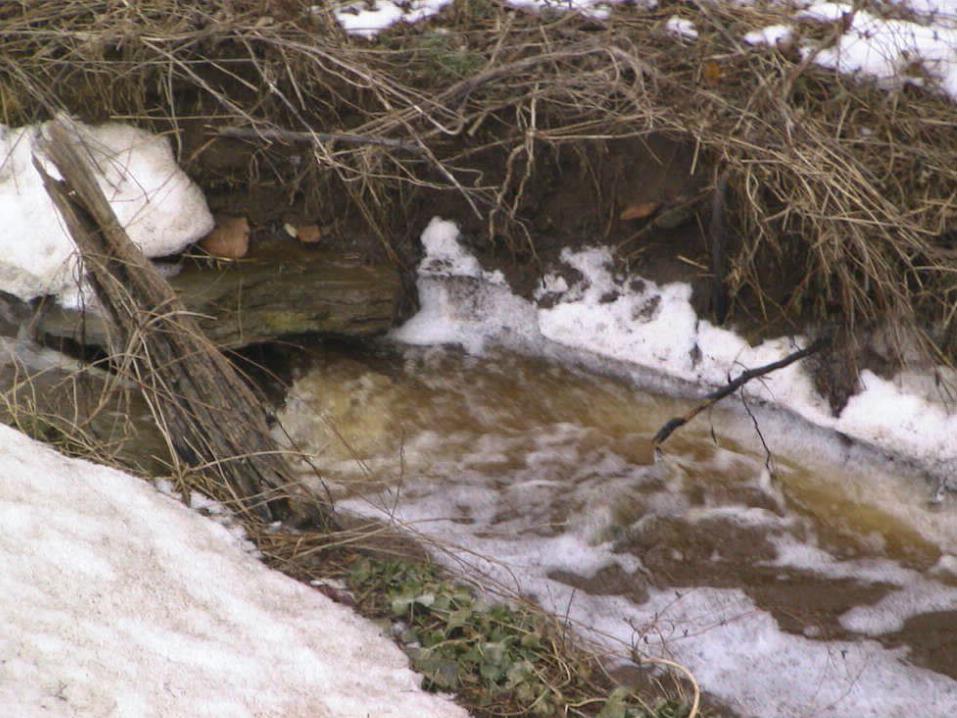
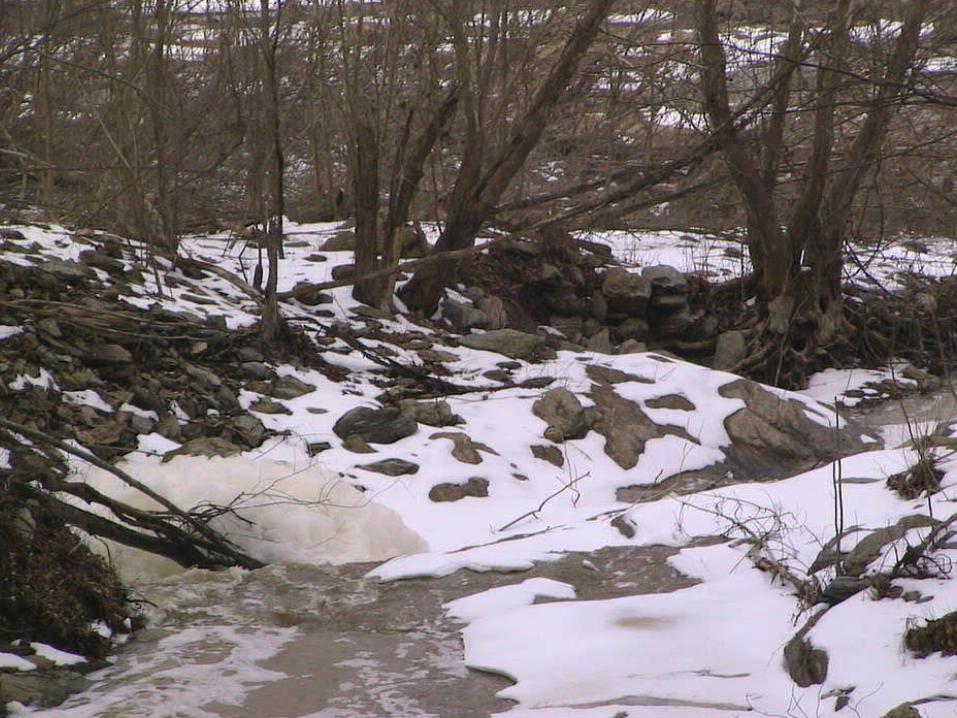
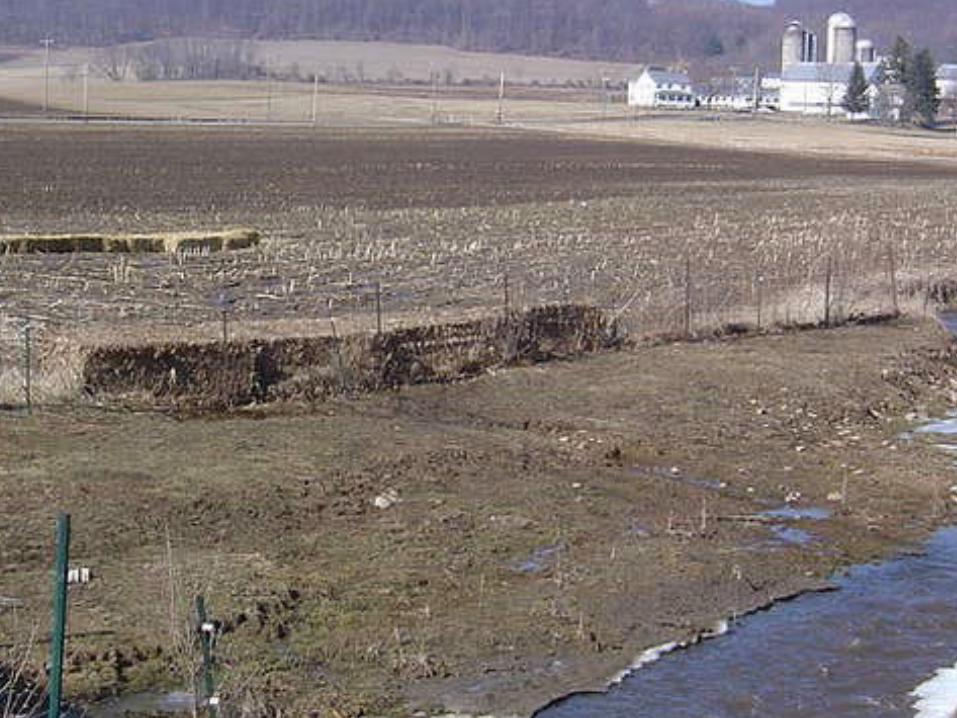
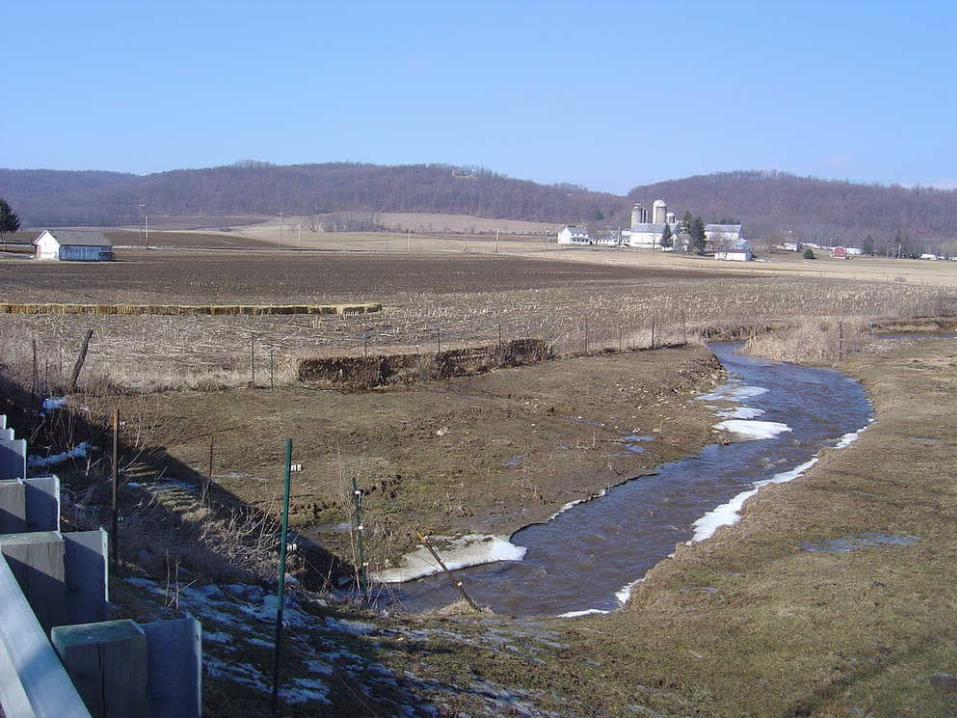
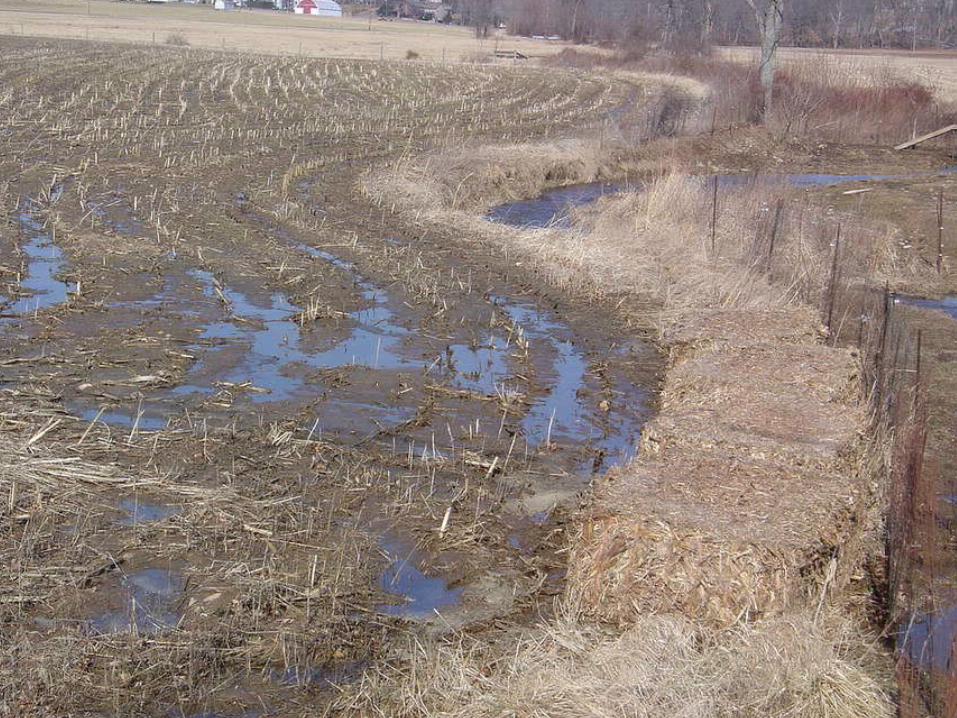
Pinnacle Road Farm
• This small farm of approximately 20 acres drains to one pipe that flows to Fishing Creek in Lancaster.
• Rapid Temp increases in March, from below freezing to upper 60’s caused melt-off of the entire field which had been covered in manure earlier in the winter.
• Brown-yellow flow and foam are indicative of agricultural run-off

Liquid Manure Applied on top of frozen ground
with 3 inches of new snow cover.
Next Day Clear and Sunny, Temp 55 F.
Harnish Run
Liquid manure applied to frozen ground
Manure runoff entering Harnish Run as a point source
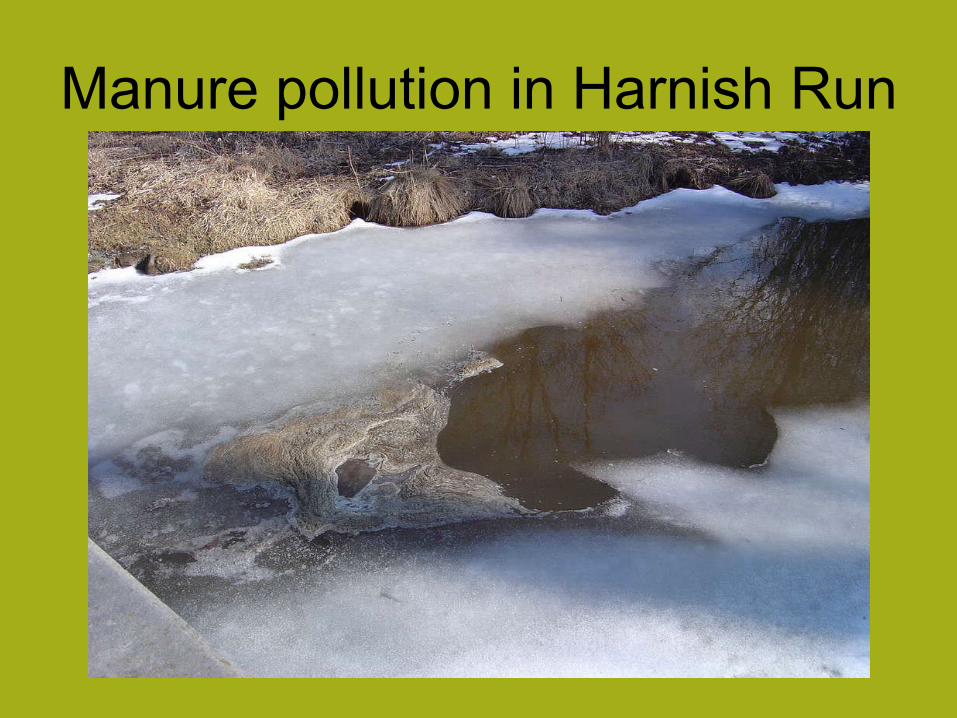
Manure pollution in Harnish Run
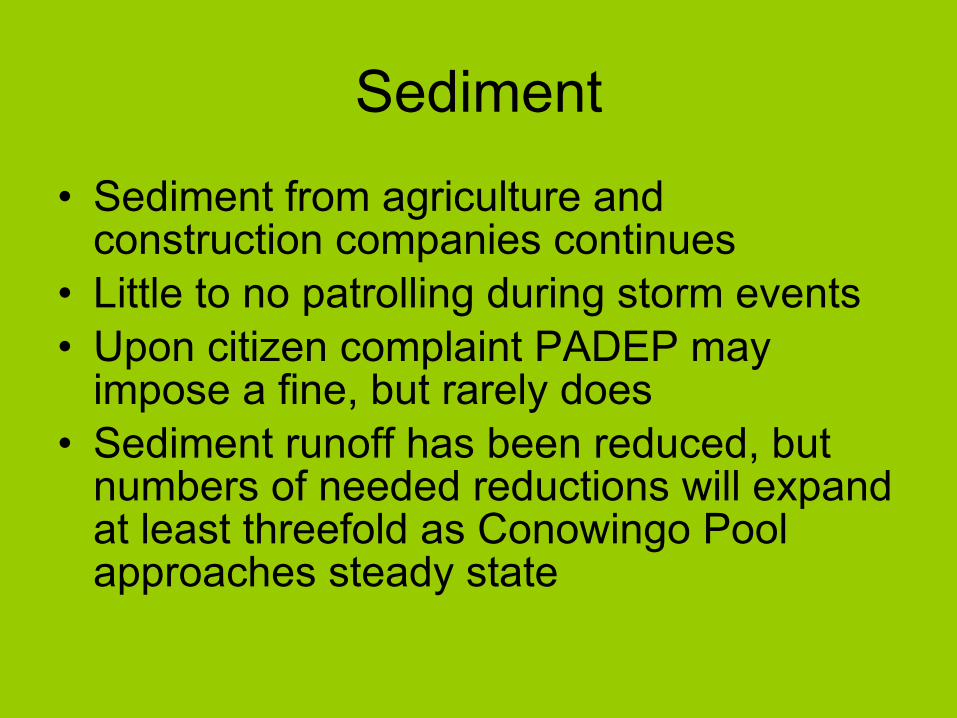
Sediment
• Sediment from agriculture and construction companies continues
• Little to no patrolling during storm events• Upon citizen complaint PADEP may
impose a fine, but rarely does• Sediment runoff has been reduced, but
numbers of needed reductions will expand at least threefold as Conowingo Pool approaches steady state
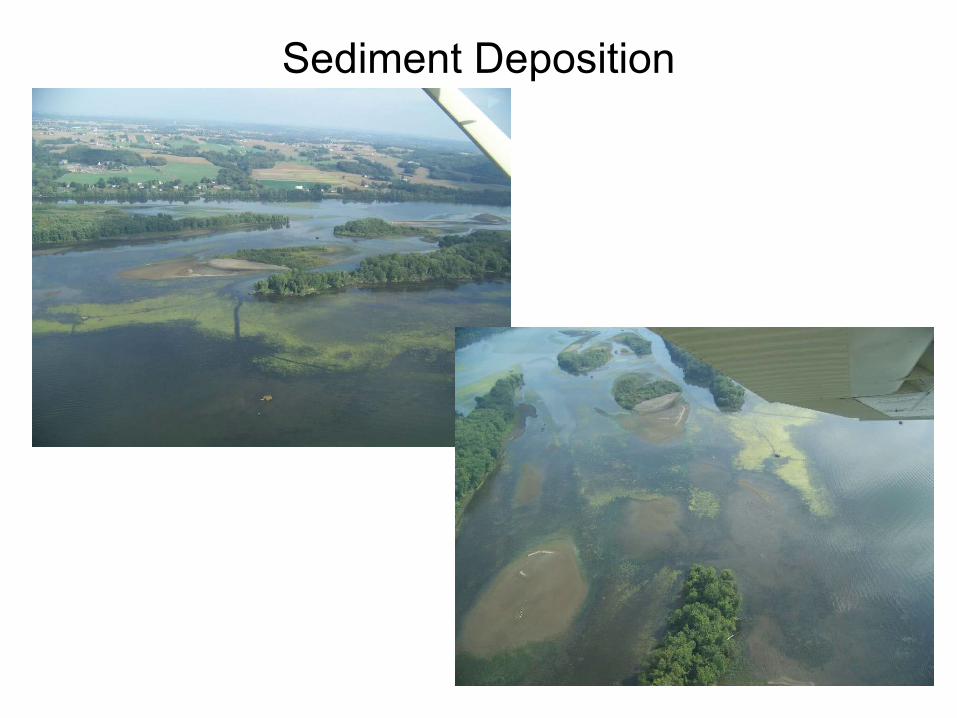
Sediment Deposition
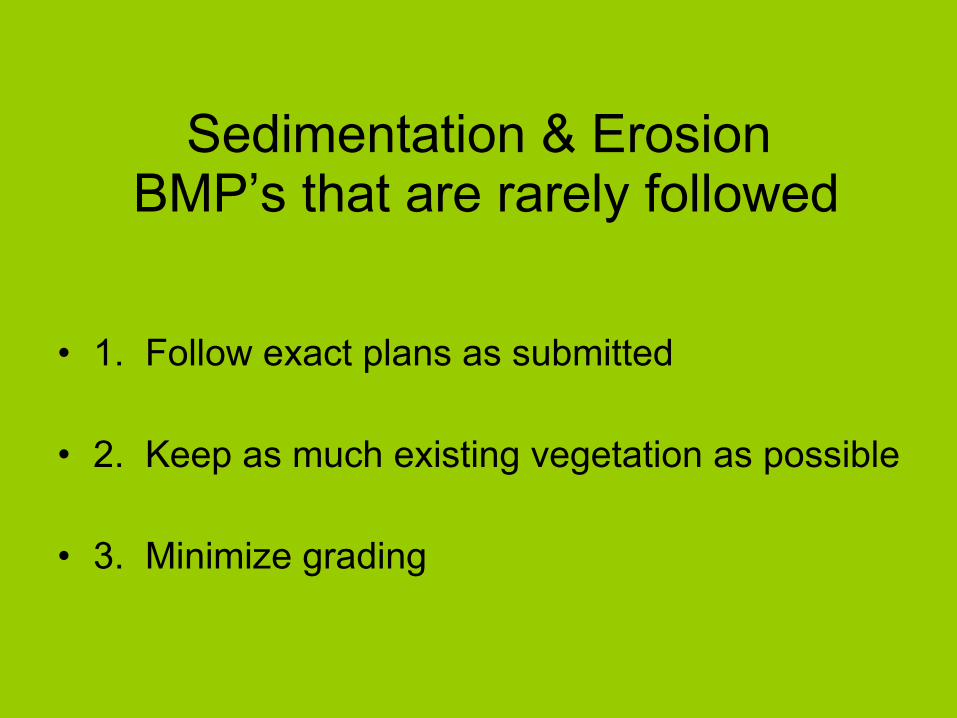
Sedimentation & Erosion BMP’s that are rarely followed
• 1. Follow exact plans as submitted
• 2. Keep as much existing vegetation as possible
• 3. Minimize grading
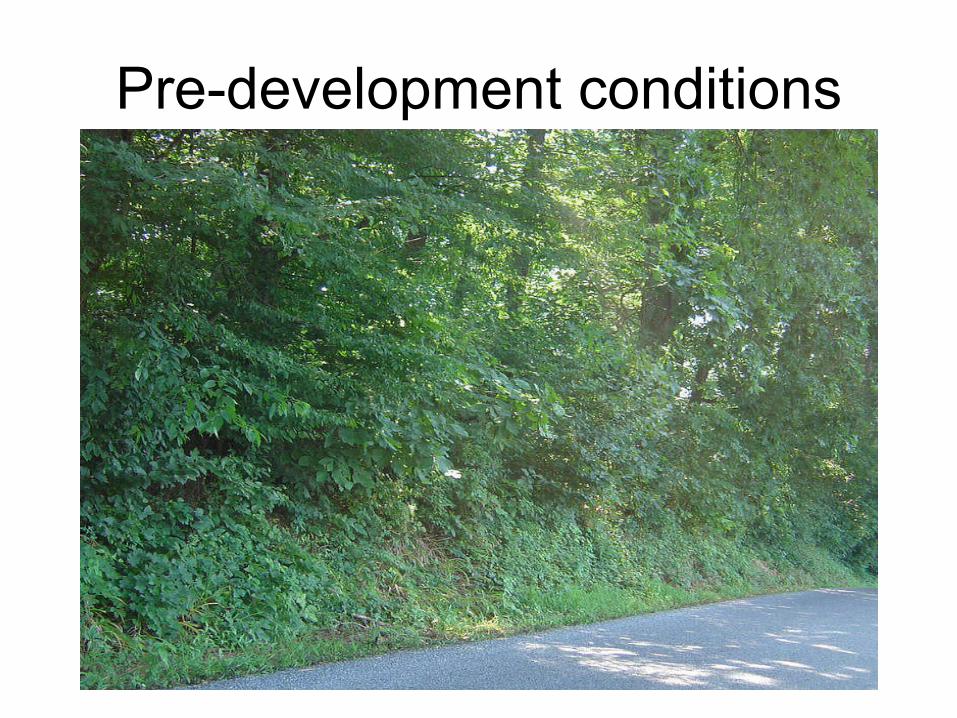
Pre-development conditions
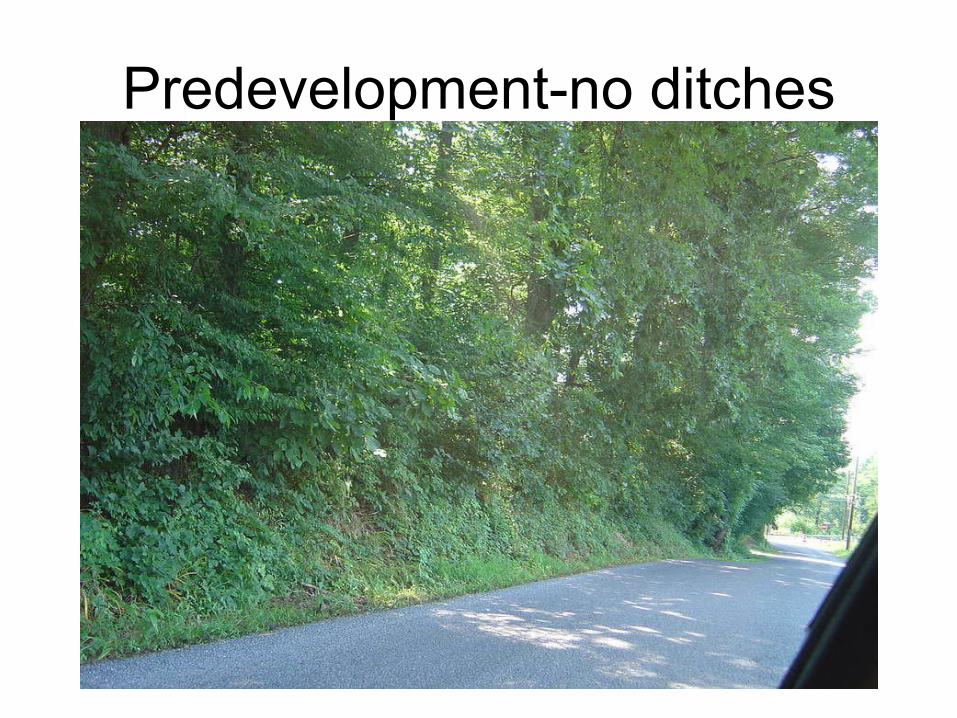
Predevelopment-no ditches
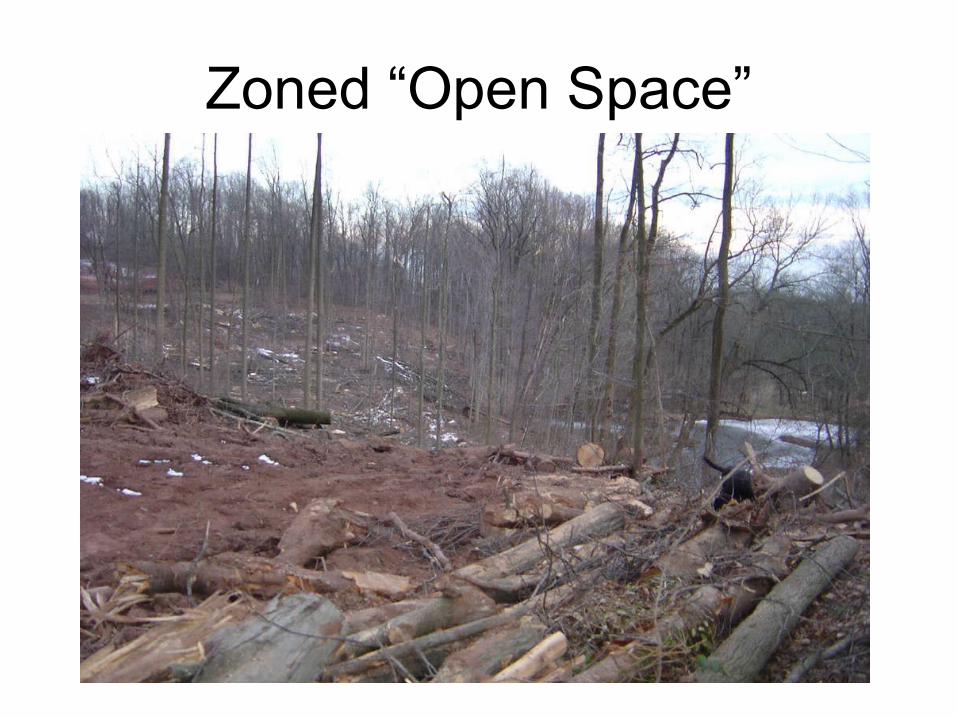
Zoned “Open Space”
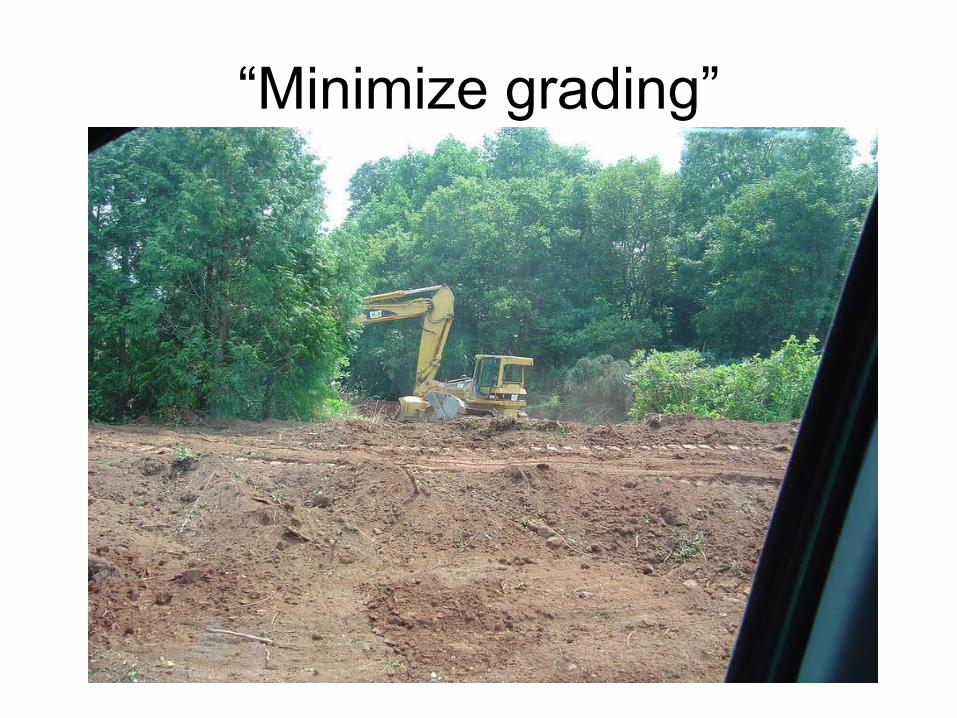
“Minimize grading”

Minimize grading
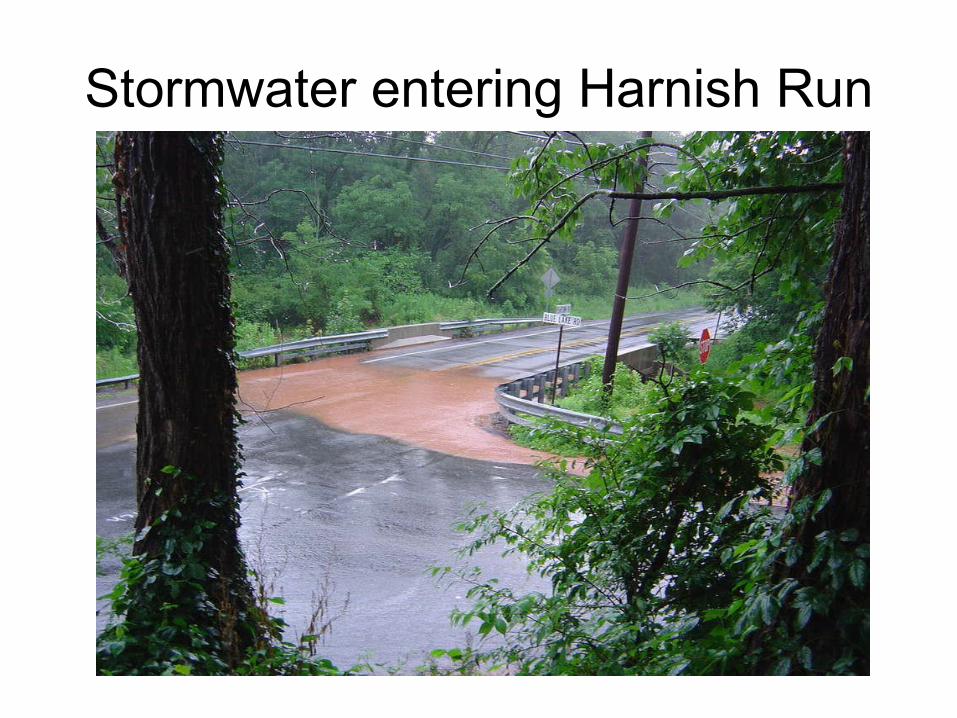
Stormwater entering Harnish Run
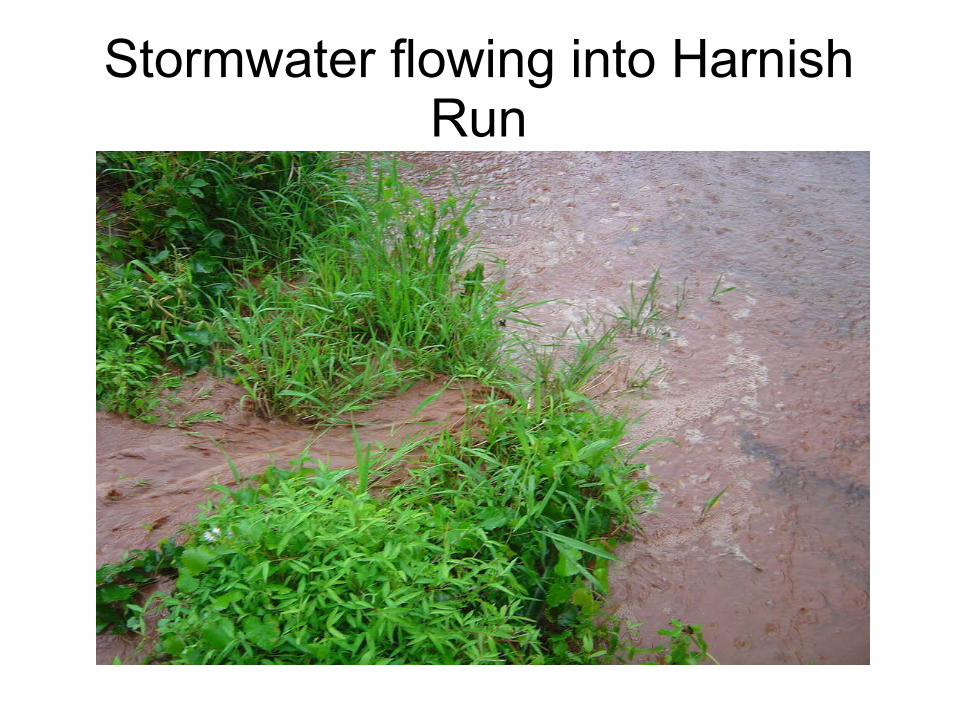
Stormwater flowing into Harnish Run
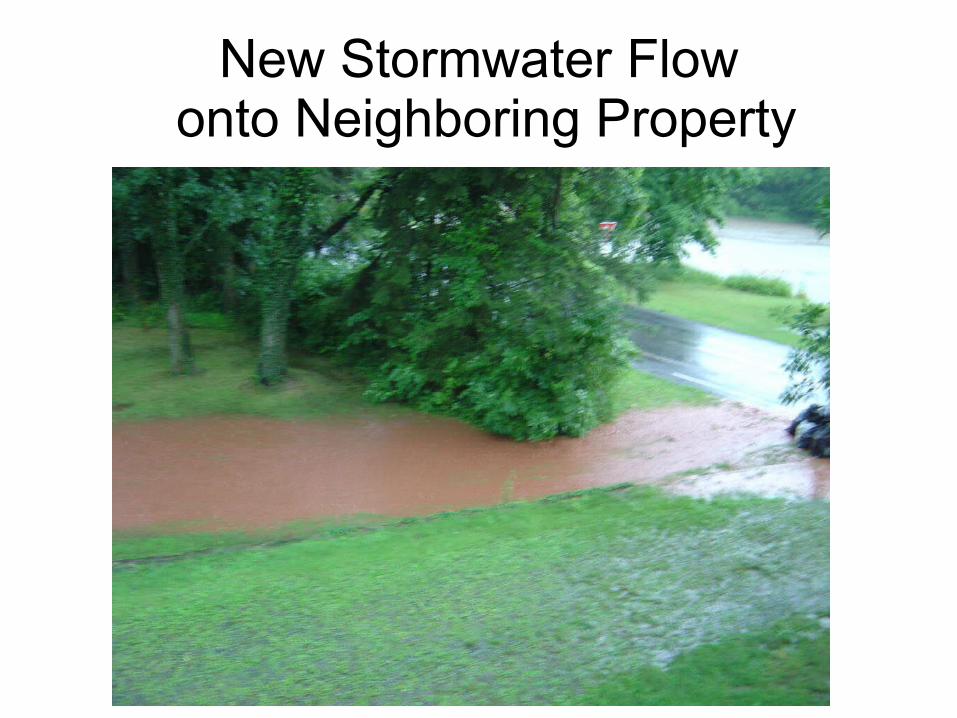
New Stormwater Flow onto Neighboring Property
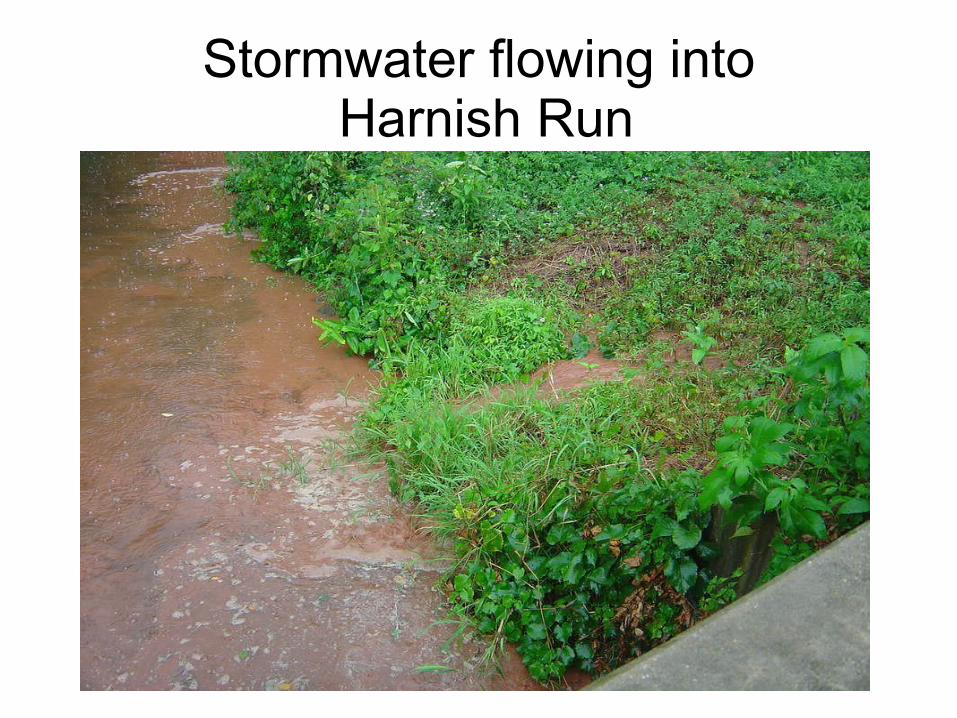
Stormwater flowing into Harnish Run
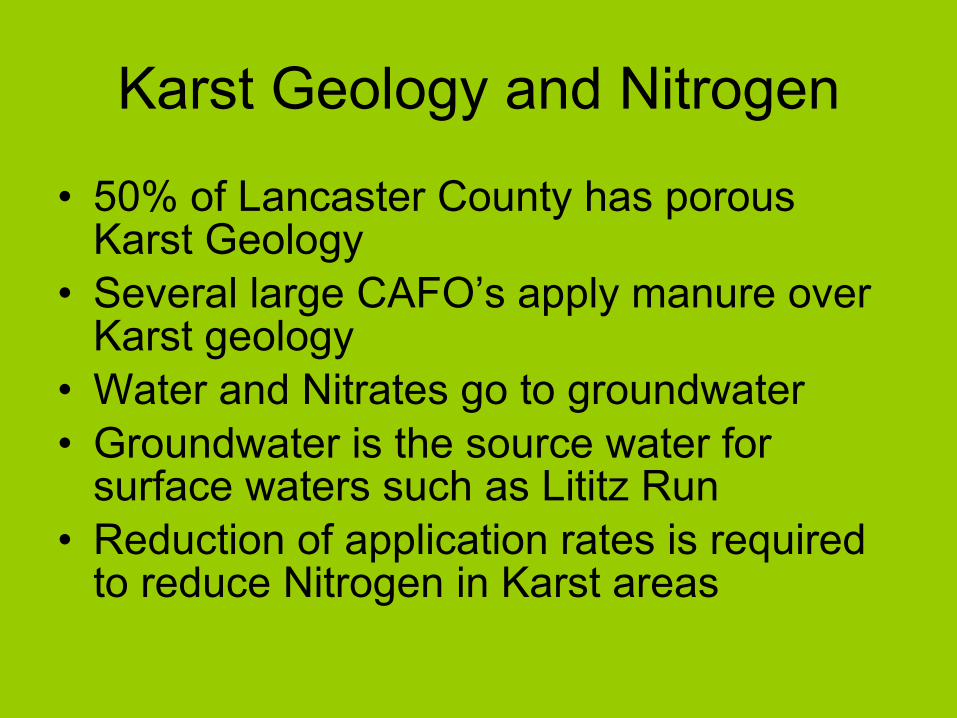
Karst Geology and Nitrogen
• 50% of Lancaster County has porous Karst Geology
• Several large CAFO’s apply manure over Karst geology
• Water and Nitrates go to groundwater• Groundwater is the source water for
surface waters such as Lititz Run• Reduction of application rates is required
to reduce Nitrogen in Karst areas
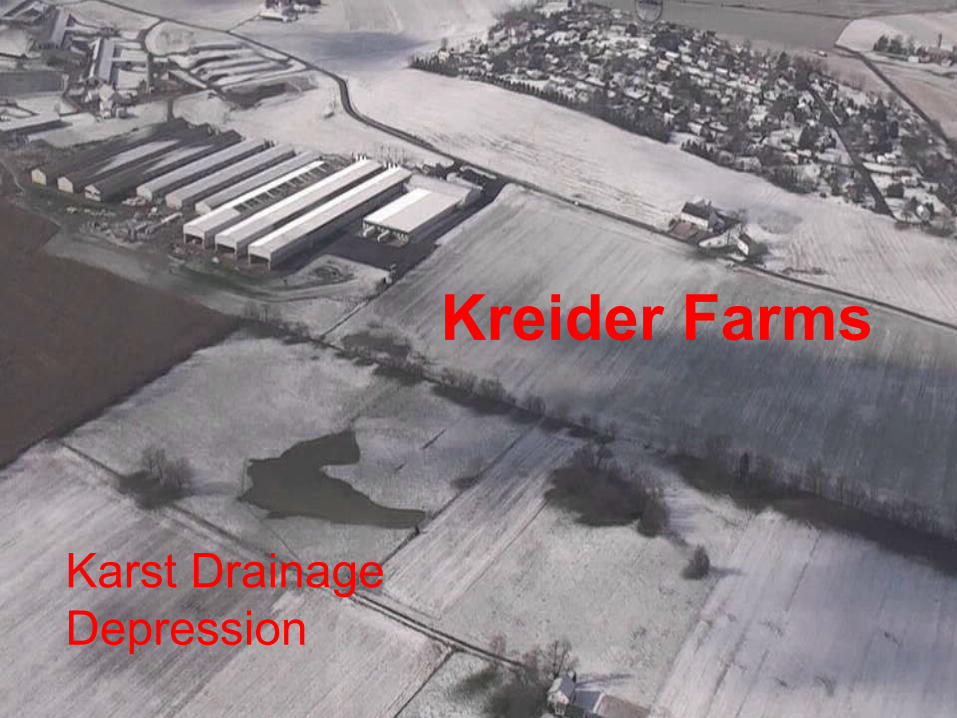
Kreider Farms
Karst Drainage Depression
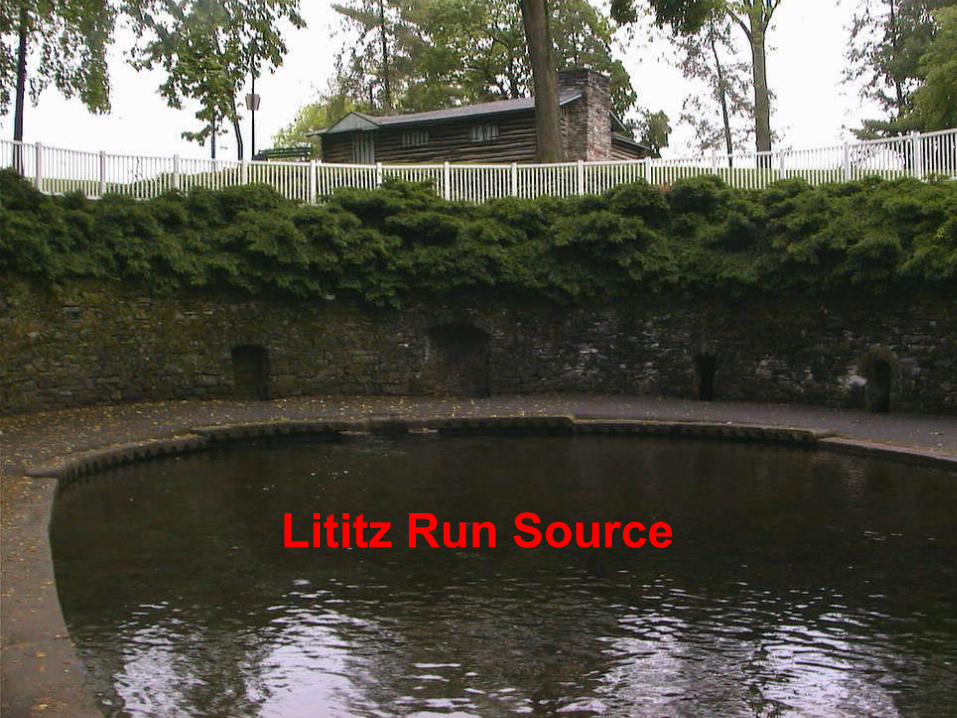
Lititz Run Source
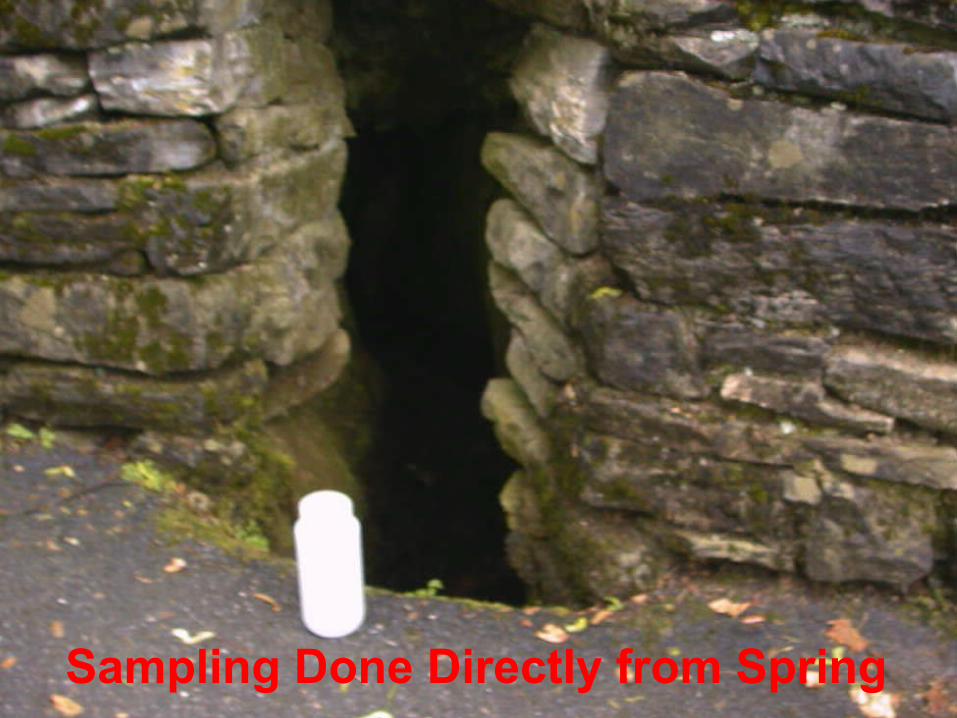
Sampling Done Directly from Spring

Nitrate Tests suggest Levels above 10 ppm color suggests much greater
USGS Data confirms levels above 15 ppm
Manure Incorporation
• The Penn State Agronomy Guide shows that incorporation of manure within 24 hours greatly increases the availability of Nitrogen for crop uptake
• This reduces excess Nitrogen that would be available for pollution; in some cases (chicken manure) by 94%.
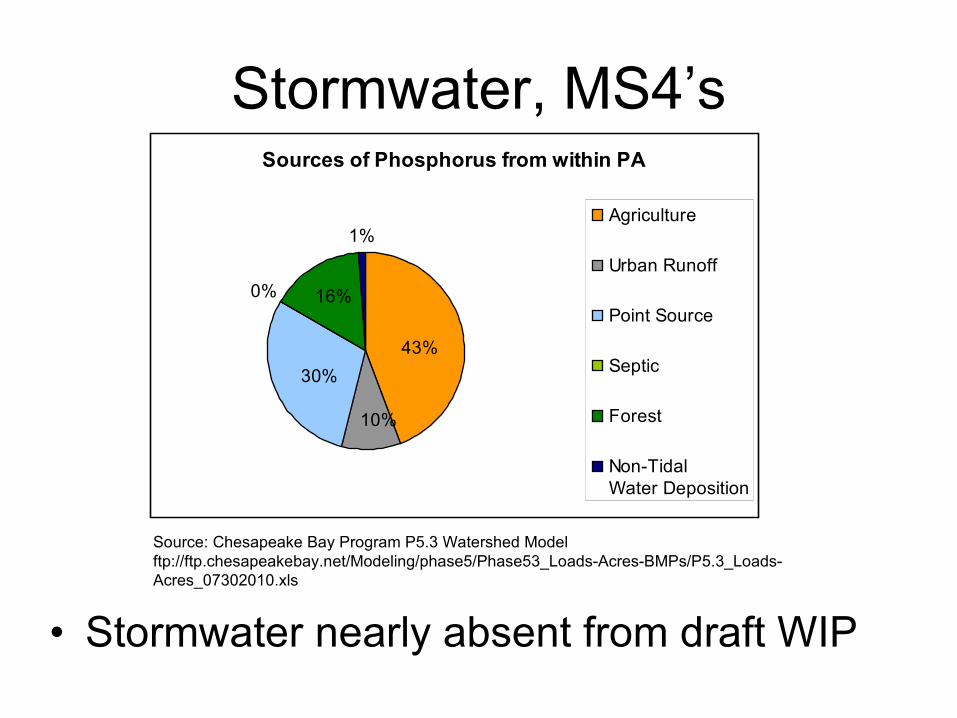
Stormwater, MS4’s
• Stormwater nearly absent from draft WIP
Sources of Phosphorus from within PA
0%
1%
43%
10%
30%
16%
Agriculture
Urban Runoff
Point Source
Septic
Forest
Non-Tidal Water Deposition
Source: Chesapeake Bay Program P5.3 Watershed Modelftp://ftp.chesapeakebay.net/Modeling/phase5/Phase53_Loads-Acres-BMPs/P5.3_Loads-Acres_07302010.xls
• Source: Chesapeake Bay Program P5.3 Watershed Model• ftp://ftp.chesapeakebay.net/Modeling/phase5/Phase53_Loads-Acres-BMPs/P5.3_Loads-Acres_07302010.xls
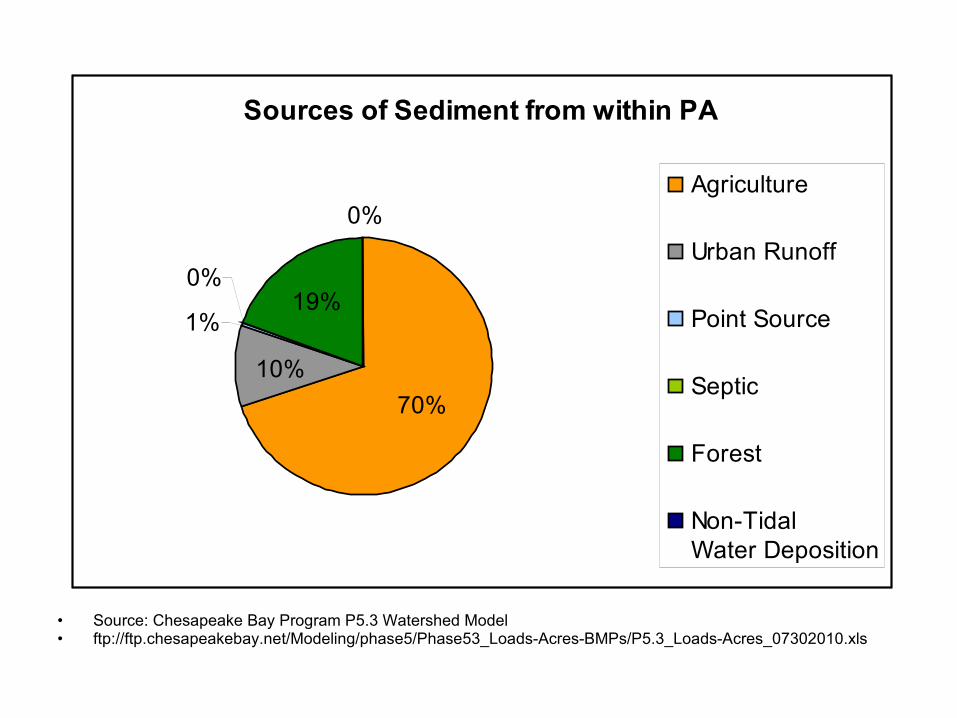
Sources of Sediment from within PA
1%
0%
0%
70%
10%
19%
Agriculture
Urban Runoff
Point Source
Septic
Forest
Non-Tidal Water Deposition
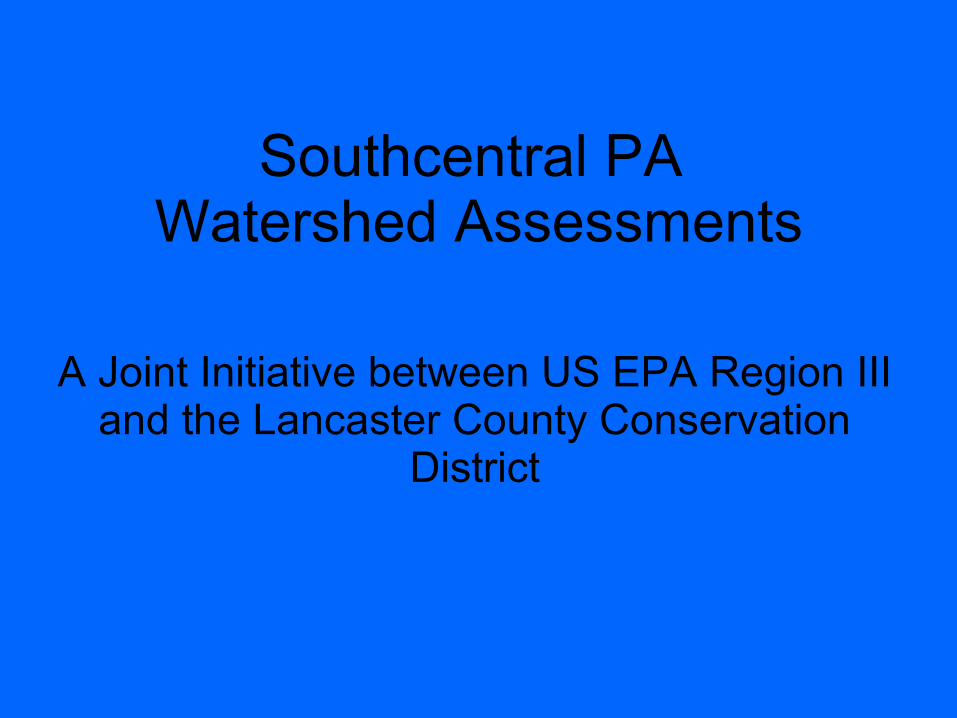
Southcentral PA Watershed Assessments
A Joint Initiative between US EPA Region III and the Lancaster County Conservation
District
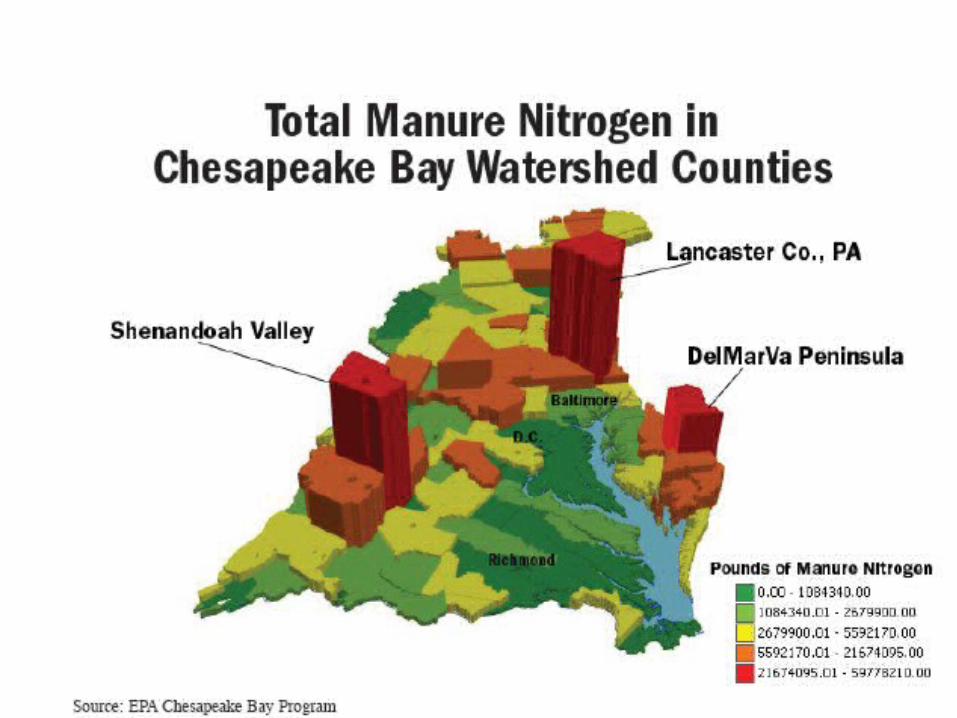
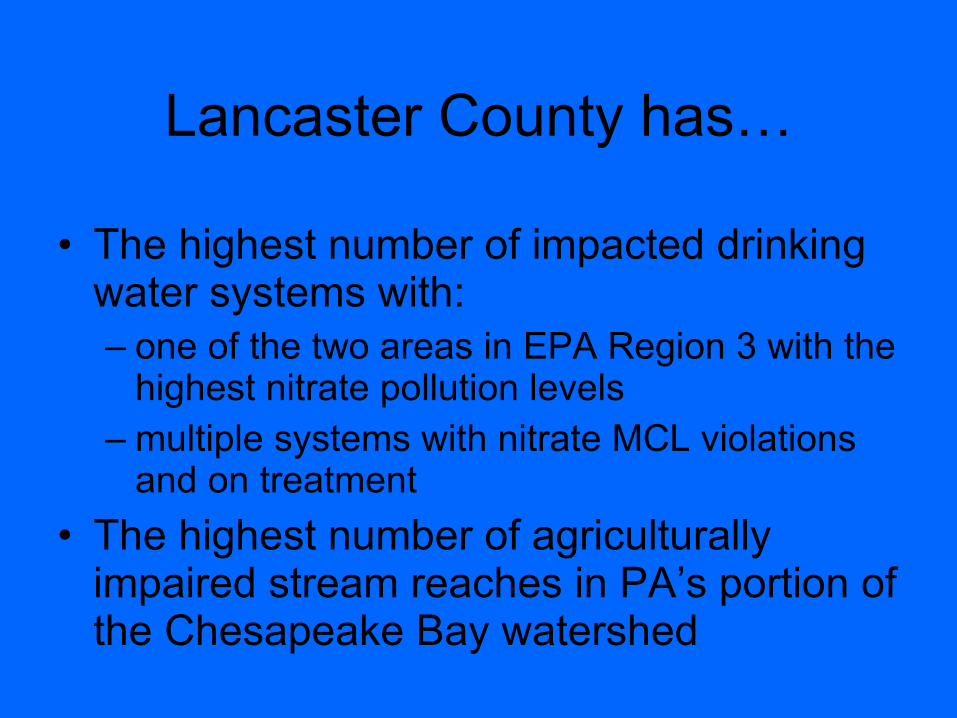
Lancaster County has…
• The highest number of impacted drinking water systems with:– one of the two areas in EPA Region 3 with the
highest nitrate pollution levels – multiple systems with nitrate MCL violations
and on treatment
• The highest number of agriculturally impaired stream reaches in PA’s portion of the Chesapeake Bay watershed
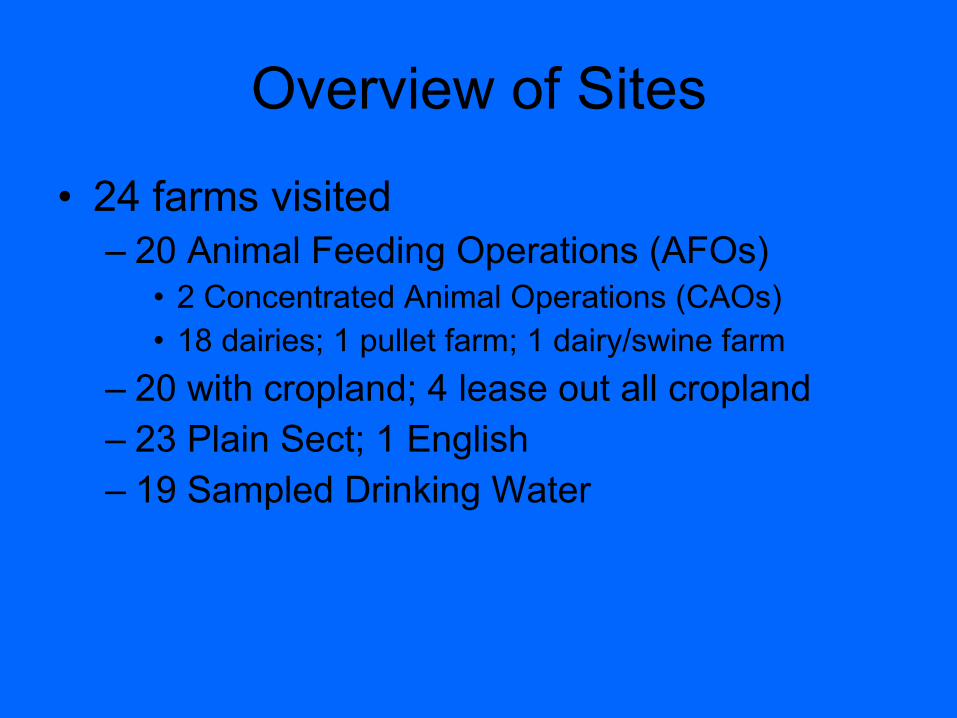
Overview of Sites
• 24 farms visited– 20 Animal Feeding Operations (AFOs)
• 2 Concentrated Animal Operations (CAOs)• 18 dairies; 1 pullet farm; 1 dairy/swine farm
– 20 with cropland; 4 lease out all cropland– 23 Plain Sect; 1 English– 19 Sampled Drinking Water
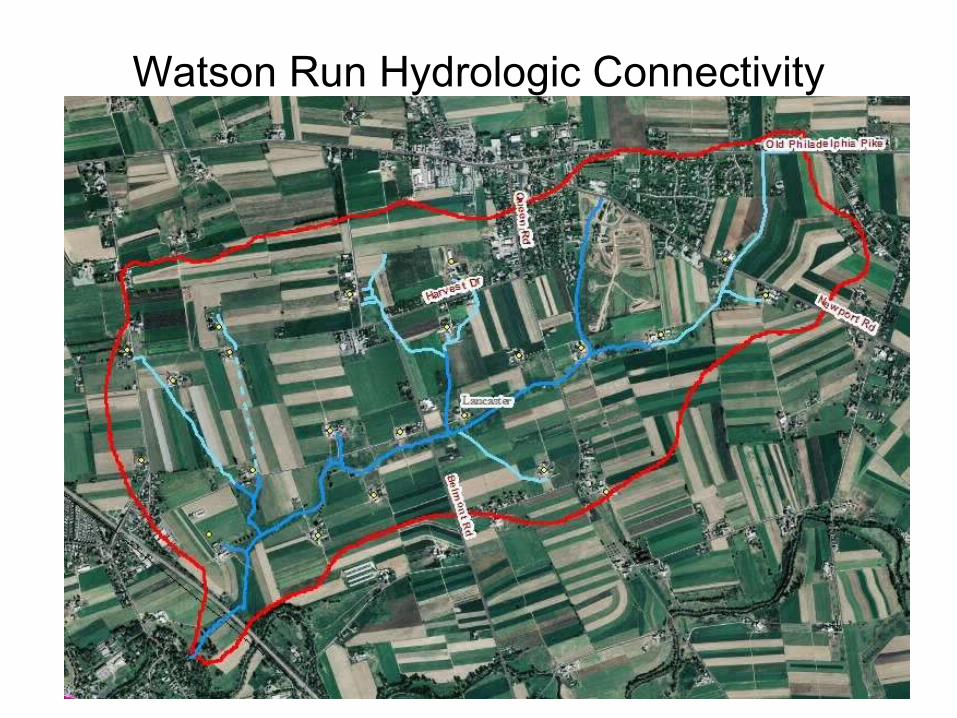
Watson Run Hydrologic Connectivity
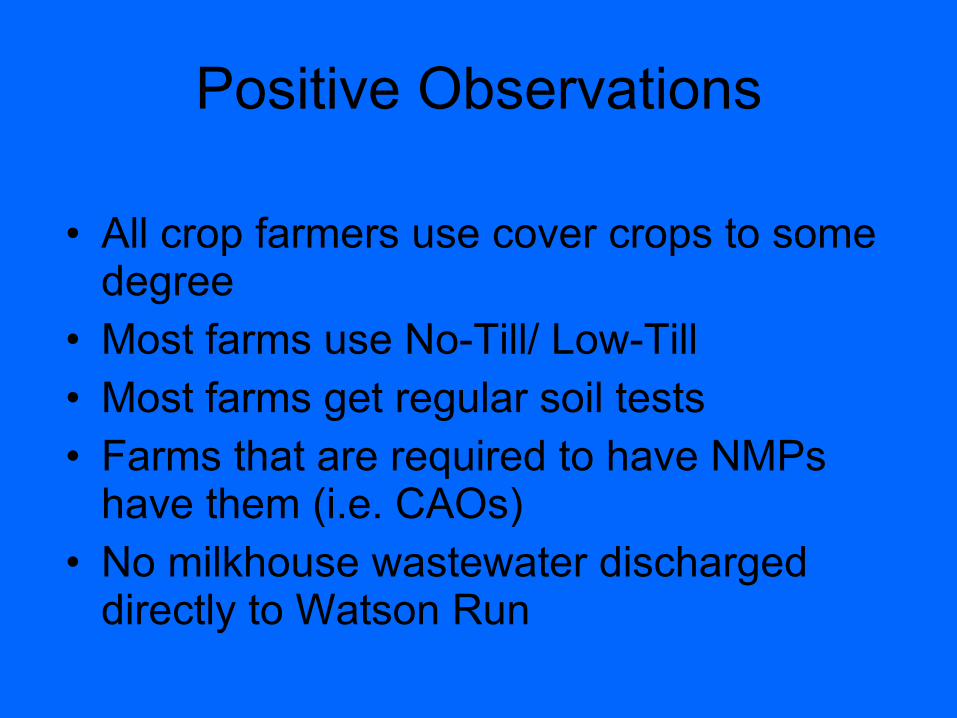
Positive Observations
• All crop farmers use cover crops to some degree
• Most farms use No-Till/ Low-Till• Most farms get regular soil tests• Farms that are required to have NMPs
have them (i.e. CAOs)• No milkhouse wastewater discharged
directly to Watson Run
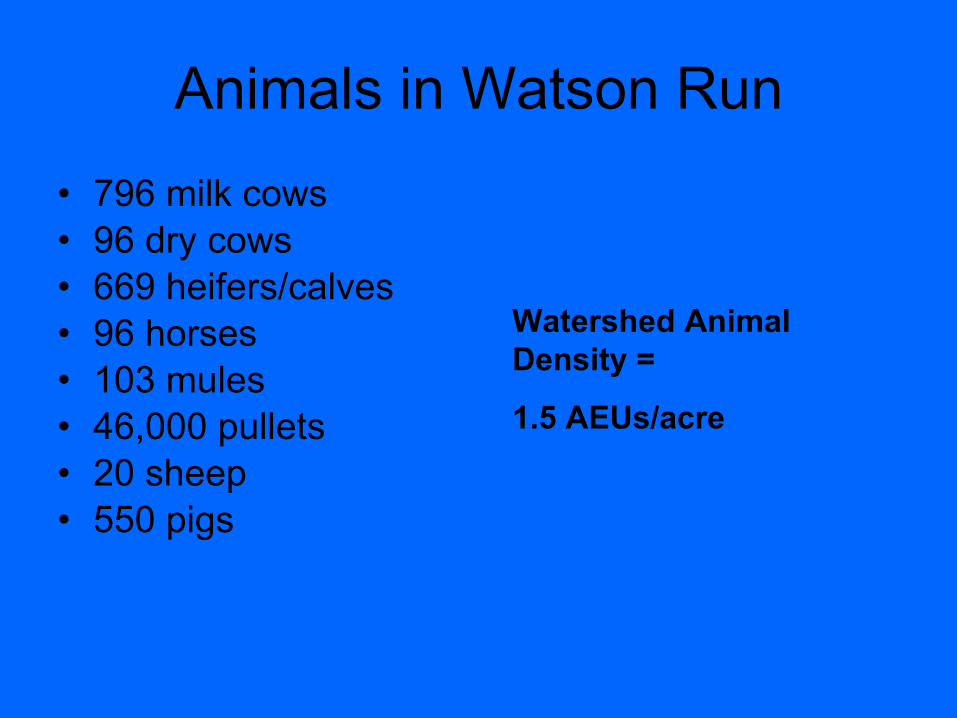
Animals in Watson Run
• 796 milk cows• 96 dry cows• 669 heifers/calves• 96 horses• 103 mules• 46,000 pullets• 20 sheep• 550 pigs
Watershed Animal Density =
1.5 AEUs/acre
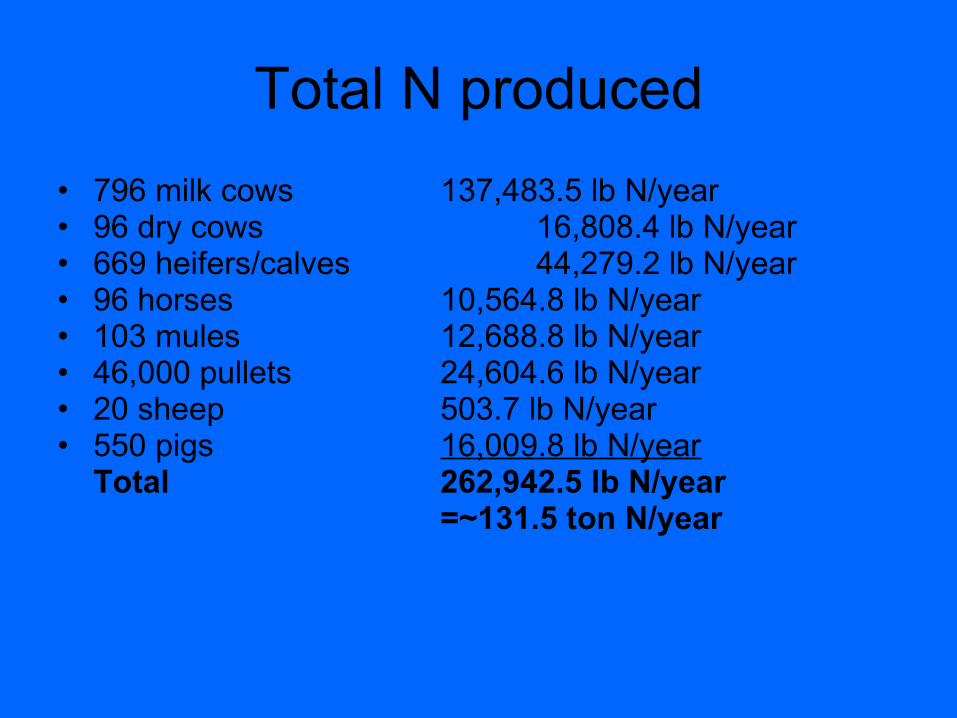
Total N produced
• 796 milk cows 137,483.5 lb N/year• 96 dry cows 16,808.4 lb N/year• 669 heifers/calves 44,279.2 lb N/year• 96 horses 10,564.8 lb N/year• 103 mules 12,688.8 lb N/year• 46,000 pullets 24,604.6 lb N/year• 20 sheep 503.7 lb N/year• 550 pigs 16,009.8 lb N/year
Total 262,942.5 lb N/year=~131.5 ton N/year
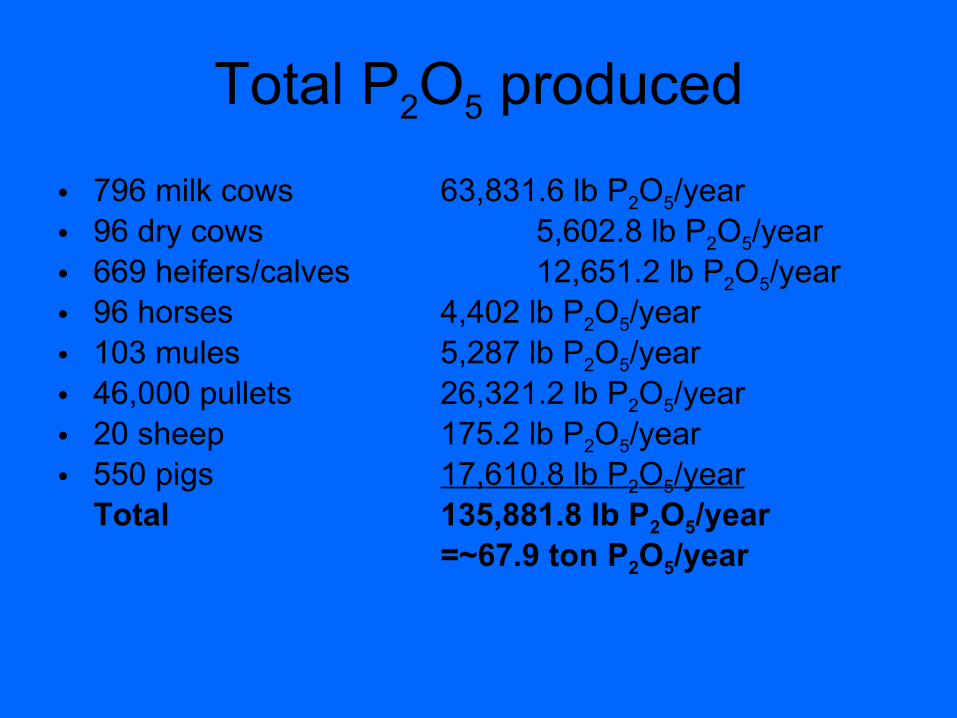
Total P2O5 produced
• 796 milk cows 63,831.6 lb P2O5/year• 96 dry cows 5,602.8 lb P2O5/year• 669 heifers/calves 12,651.2 lb P2O5/year• 96 horses 4,402 lb P2O5/year• 103 mules 5,287 lb P2O5/year• 46,000 pullets 26,321.2 lb P2O5/year• 20 sheep 175.2 lb P2O5/year• 550 pigs 17,610.8 lb P 2O 5/year
Total 135,881.8 lb P2O5/year=~67.9 ton P2O5/year
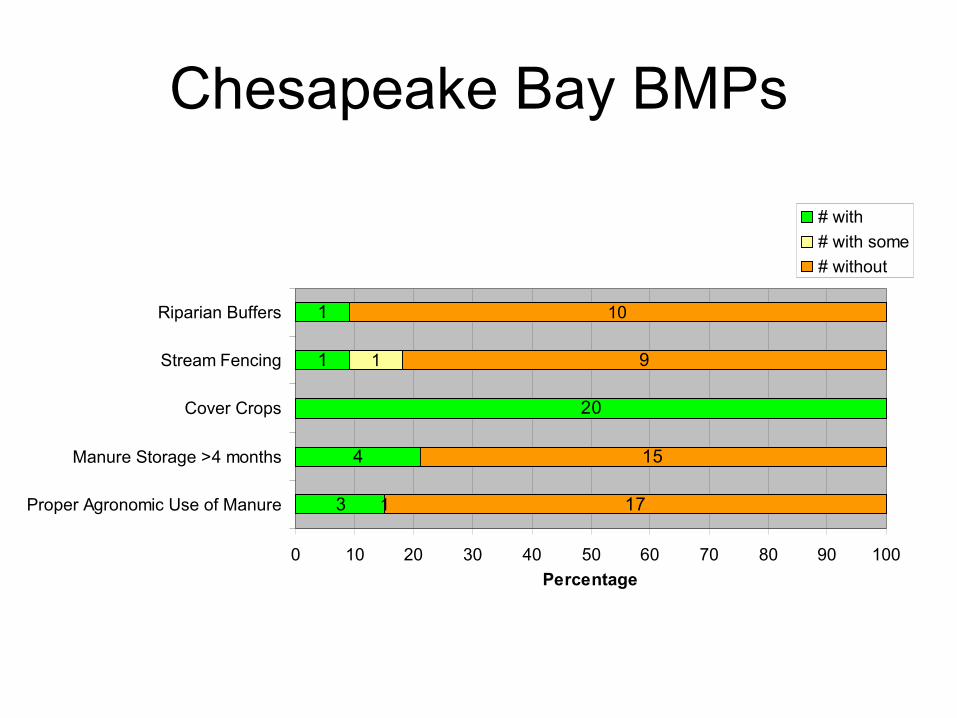
Chesapeake Bay BMPs
1
1
20
4
3 1
1
10
9
15
17
0 10 20 30 40 50 60 70 80 90 100
Proper Agronomic Use of Manure
Manure Storage >4 months
Cover Crops
Stream Fencing
Riparian Buffers
Percentage
# with
# with some
# without
PA “Core Four” BMPs
18
20
3
1
2
17
10
0 10 20 30 40 50 60 70 80 90 100
No-till/Low-till
Cover Crops
Nutrient ManagementPlanning
Buffers
Percentage
# with
# without
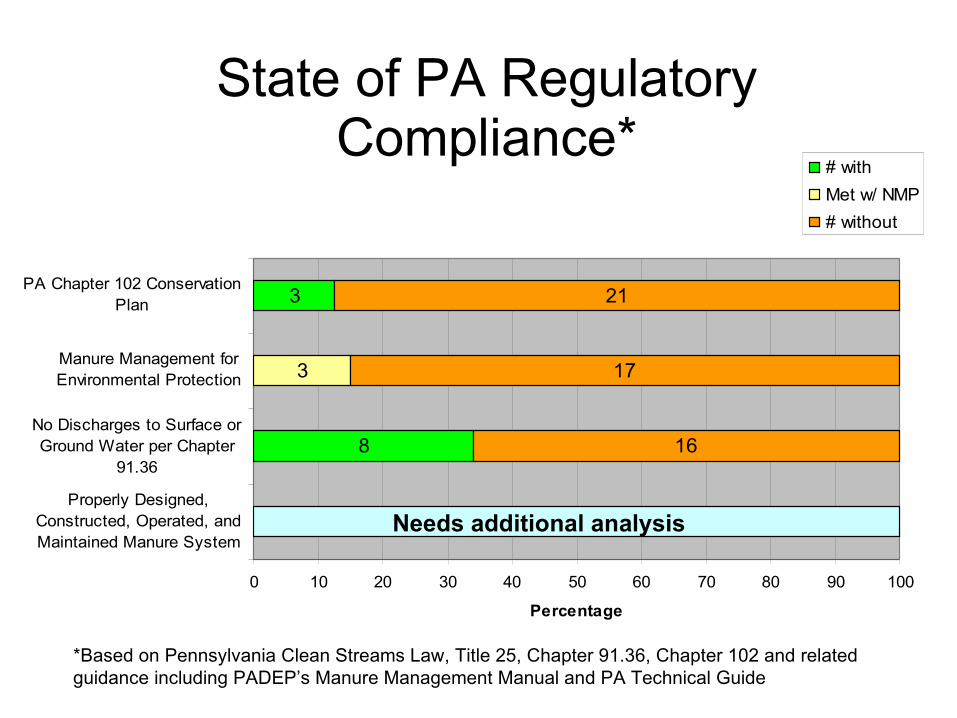
*Based on Pennsylvania Clean Streams Law, Title 25, Chapter 91.36, Chapter 102 and related guidance including PADEP’s Manure Management Manual and PA Technical Guide
Needs additional analysis
8
3
3
16
17
21
0 10 20 30 40 50 60 70 80 90 100
Properly Designed,Constructed, Operated, andMaintained Manure System
No Discharges to Surface orGround Water per Chapter
91.36
Manure Management forEnvironmental Protection
PA Chapter 102 ConservationPlan
Percentage
# with
Met w/ NMP
# without
Needs additional analysis
State of PA Regulatory Compliance*
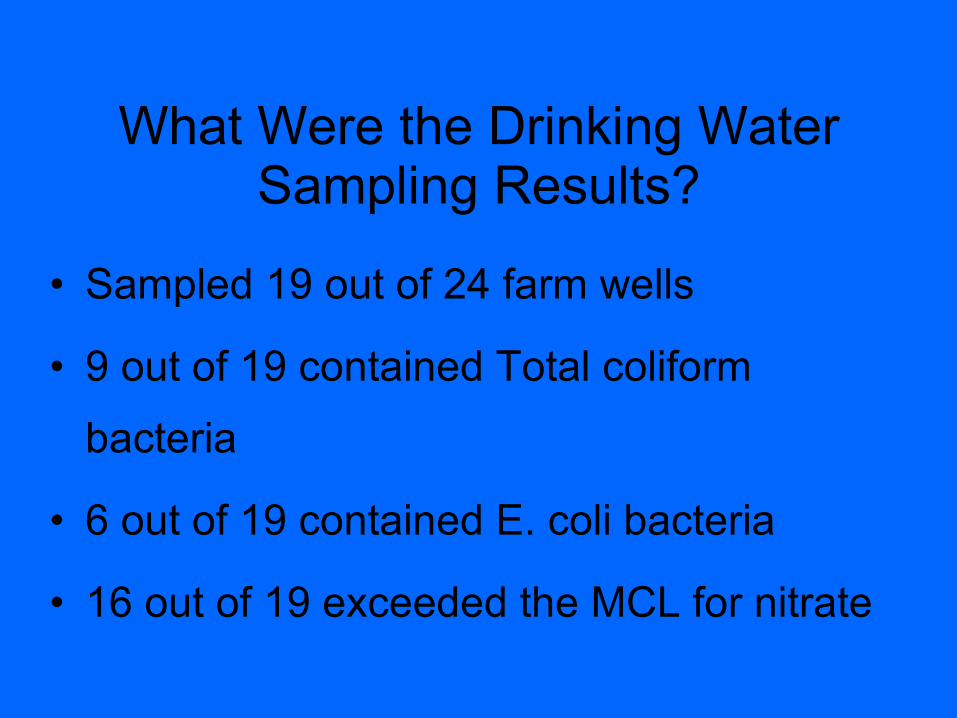
What Were the Drinking Water Sampling Results?
• Sampled 19 out of 24 farm wells
• 9 out of 19 contained Total coliform
bacteria
• 6 out of 19 contained E. coli bacteria
• 16 out of 19 exceeded the MCL for nitrate
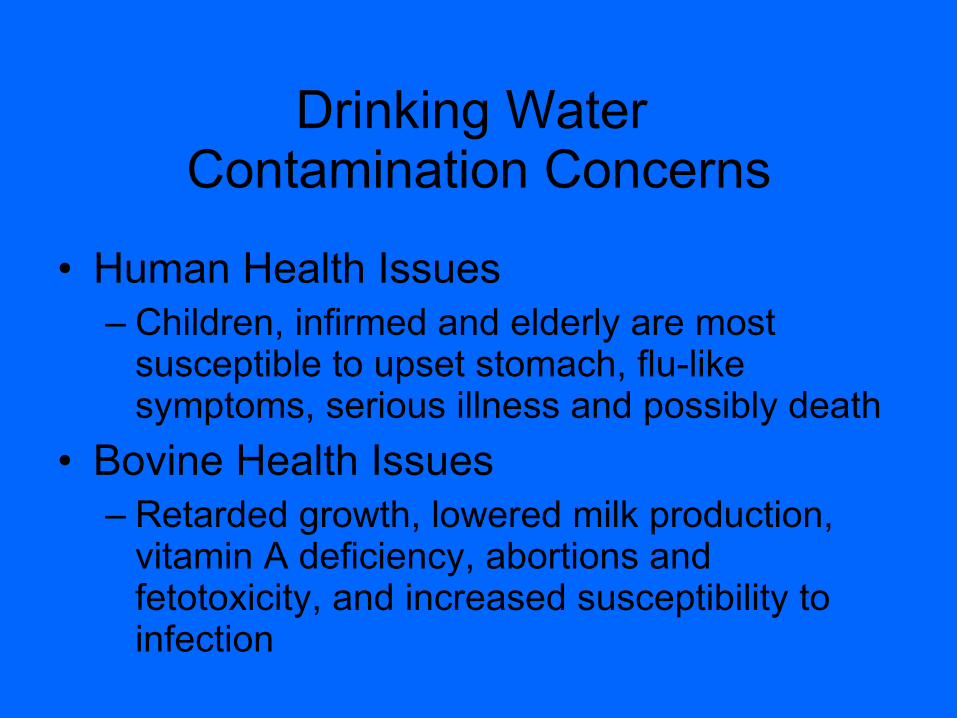
Drinking Water Contamination Concerns
• Human Health Issues – Children, infirmed and elderly are most
susceptible to upset stomach, flu-like symptoms, serious illness and possibly death
• Bovine Health Issues– Retarded growth, lowered milk production,
vitamin A deficiency, abortions and fetotoxicity, and increased susceptibility to infection
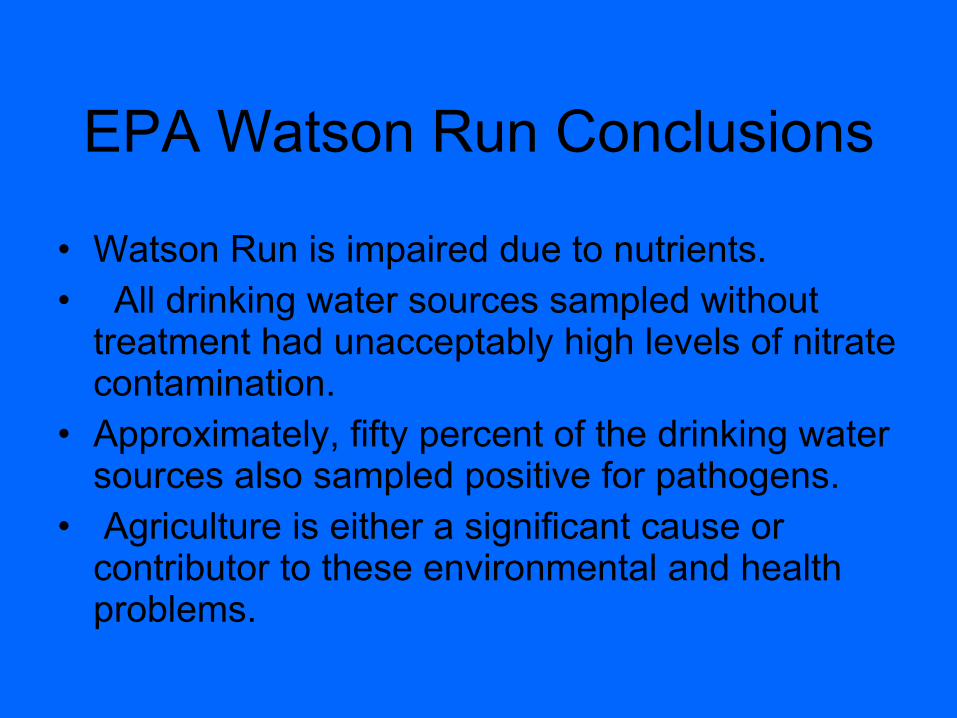
EPA Watson Run Conclusions
• Watson Run is impaired due to nutrients.• All drinking water sources sampled without
treatment had unacceptably high levels of nitrate contamination.
• Approximately, fifty percent of the drinking water sources also sampled positive for pathogens.
• Agriculture is either a significant cause or contributor to these environmental and health problems.
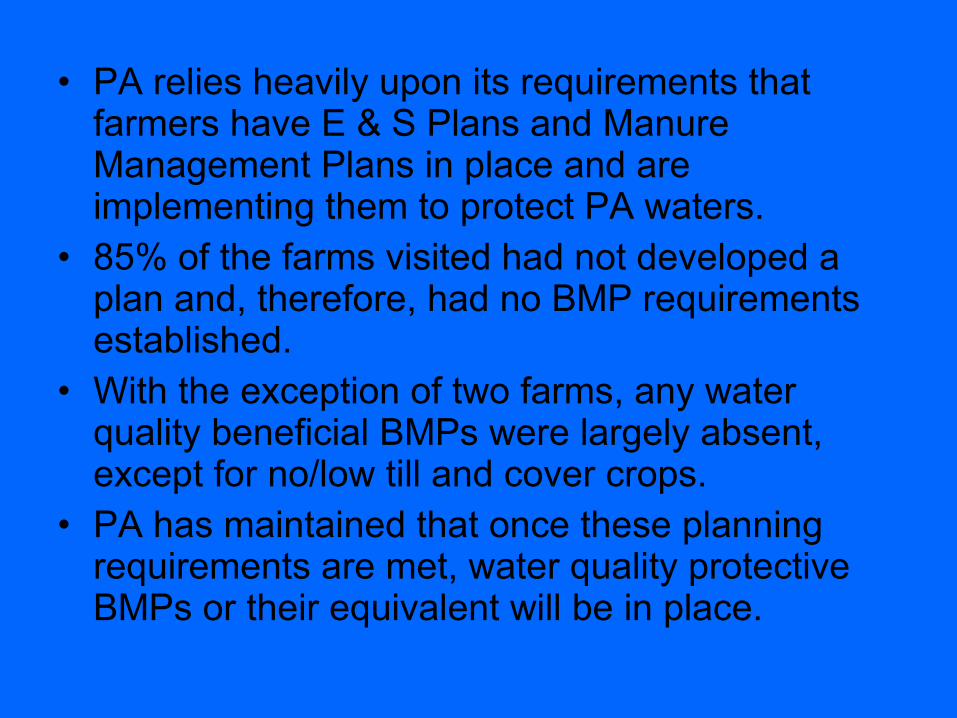
• PA relies heavily upon its requirements that farmers have E & S Plans and Manure Management Plans in place and are implementing them to protect PA waters.
• 85% of the farms visited had not developed a plan and, therefore, had no BMP requirements established.
• With the exception of two farms, any water quality beneficial BMPs were largely absent, except for no/low till and cover crops.
• PA has maintained that once these planning requirements are met, water quality protective BMPs or their equivalent will be in place.