Embed Size (px)
Citation preview
INFOVIS LES 3Robin De Croon – 22 februari 2016
Joris Klerkx – Erik Duval
1Monday, February 22, 2016
Opdracht vorige week
• Individueel
• spreadsheet aanvullen
• Infovis van de week
• Per team
• Blogpost – oefening 75 – 37
• Publiek – Data – Verhaal
• Data – ruwe feasibility (eg omvang/formaat/etc.)
• Visuele alternatieven (sketches)
• 10 minuten slot om te presenteren / 5 minuten feedback
Monday, February 22, 2016 2
Infovis vd week + spreadsheet?
Monday, February 22, 2016 3
http://www.themissionsuite.com/wp-content/uploads/2012/04/How-To-Segment-Your-Email-Marketing-List.jpg

http://2.bp.blogspot.com/-gZjNR3XVULs/T_ZOVgE-5lI/AAAAAAAAAg8/6YVmd5Q064o/s1600/questions11.jpg
4Monday, February 22, 2016
https://augmenthci-students.slack.com/
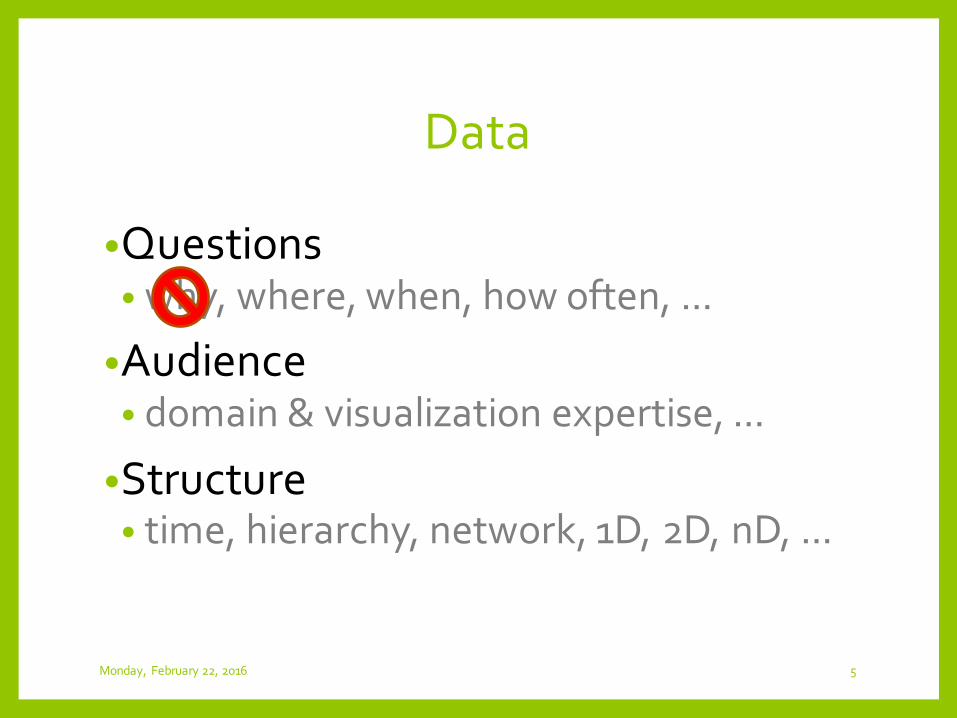
Data
•Questions• why, where, when, how often, ...
•Audience• domain & visualization expertise, ...
•Structure• time, hierarchy, network, 1D, 2D, nD, ...
Monday, February 22, 2016 5
Monday, February 22, 2016 6
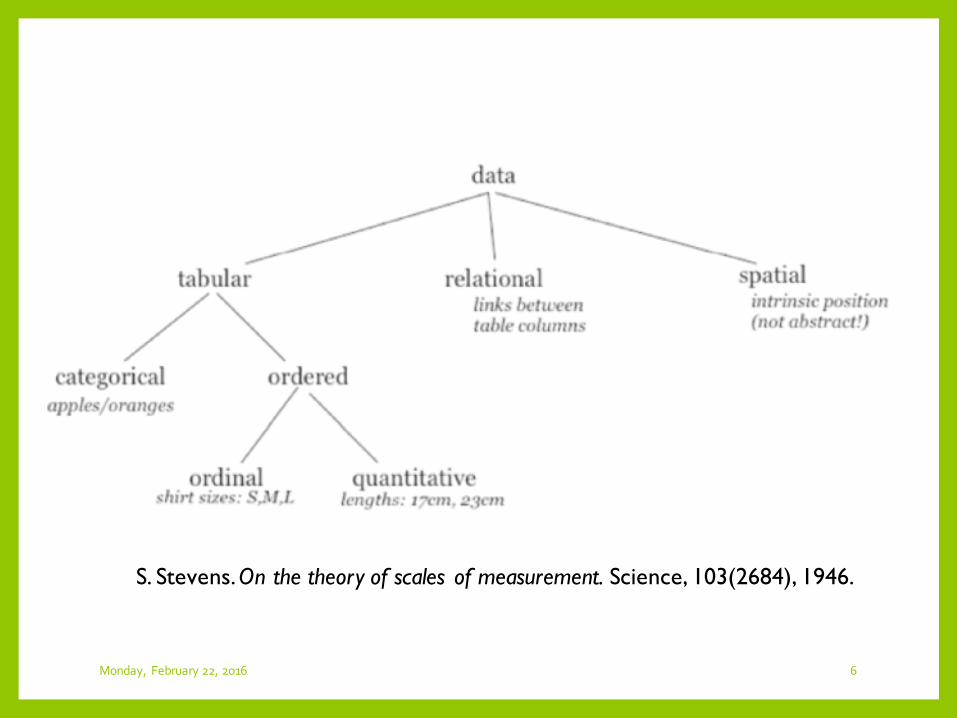
S. Stevens. On the theory of scales of measurement. Science, 103(2684), 1946.
7
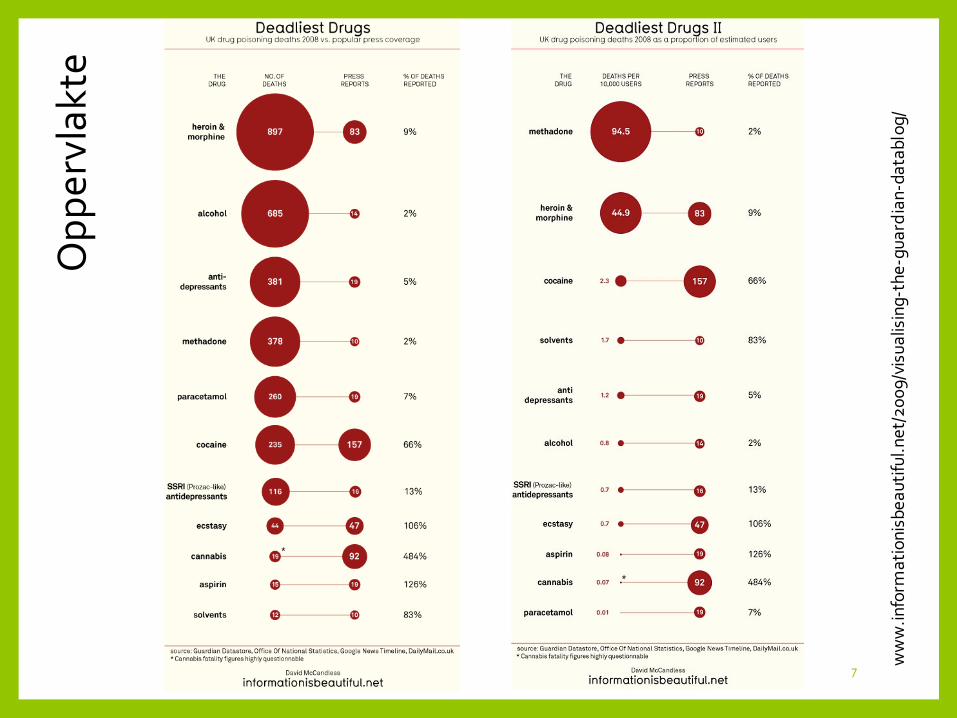
Opp
ervl
akte
ww
w.in
form
atio
nisb
eaut
iful.n
et/2
009/
visu
alis
ing-
the-
guar
dian
-dat
ablo
g/
8
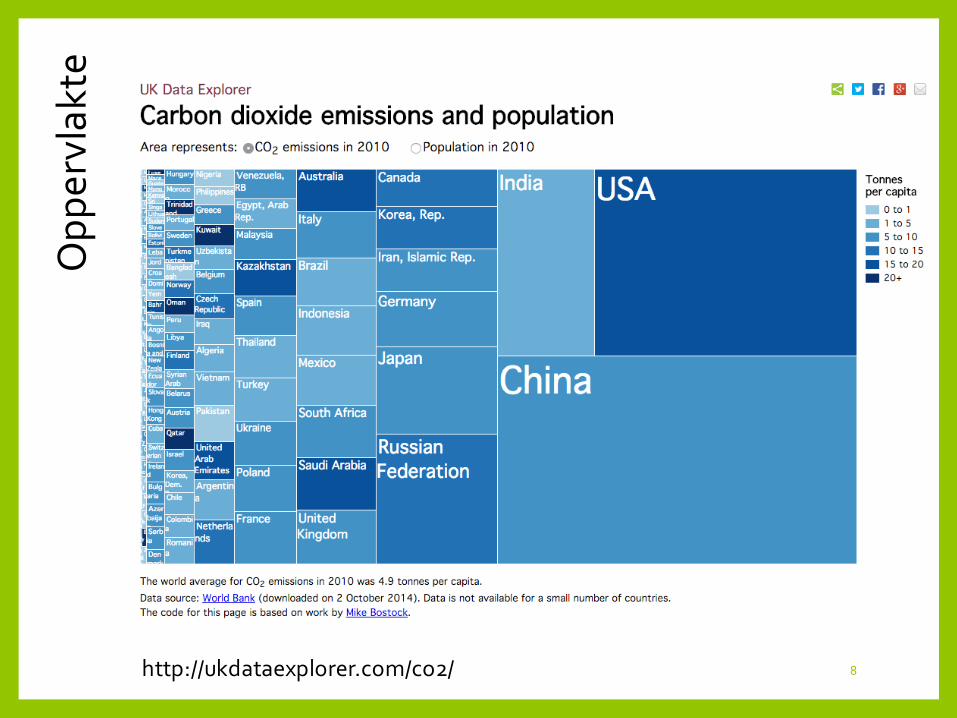
Opp
ervl
akte
http://ukdataexplorer.com/co2/
9
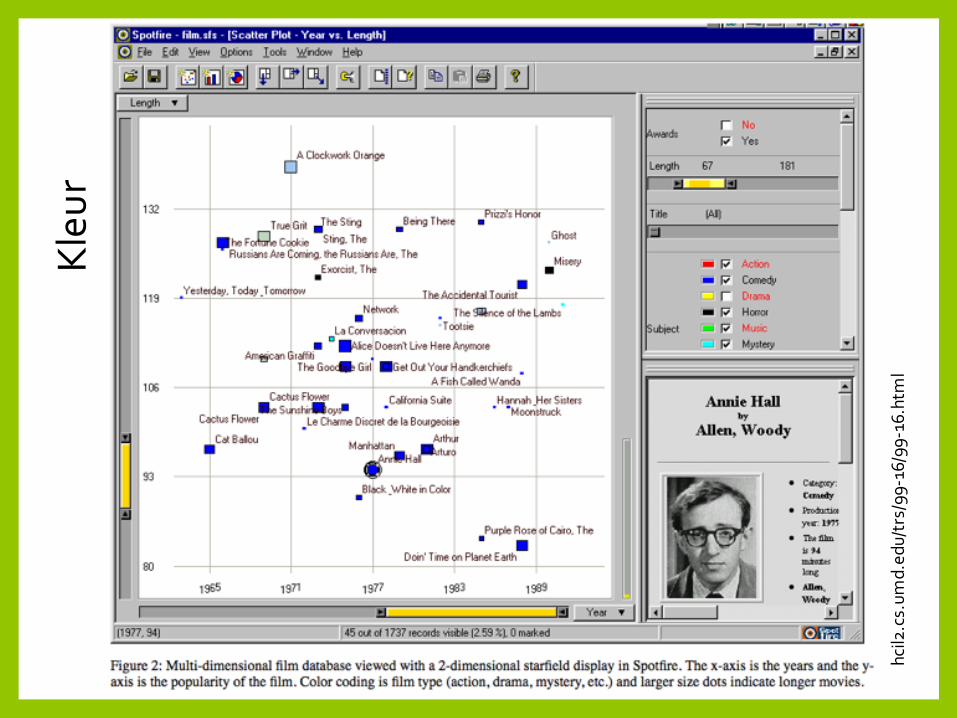
Kleu
r
hcil2
.cs.
umd.
edu/
trs/
99-1
6/99
-16.
htm
l
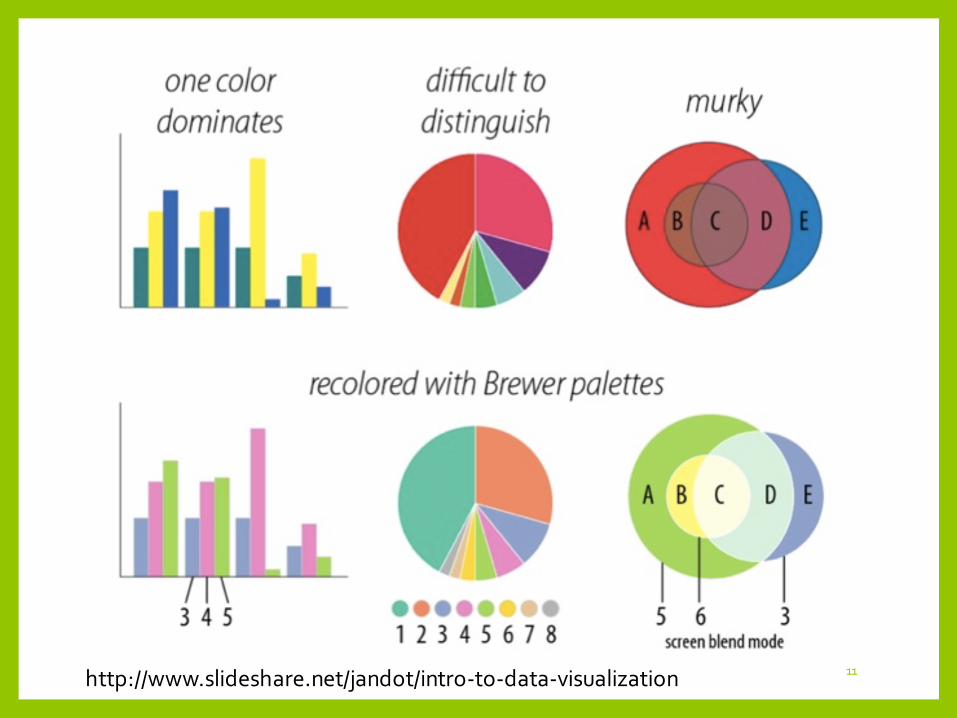
Kleur
• RGB (rood – groen – blauw)• Meest gebruikt, minst nuttig
• HSV (hue – saturation – value)• Nuttiger!
Monday, February 22, 2016 10http://www.slideshare.net/jandot/intro-to-data-visualization
11http://www.slideshare.net/jandot/intro-to-data-visualization
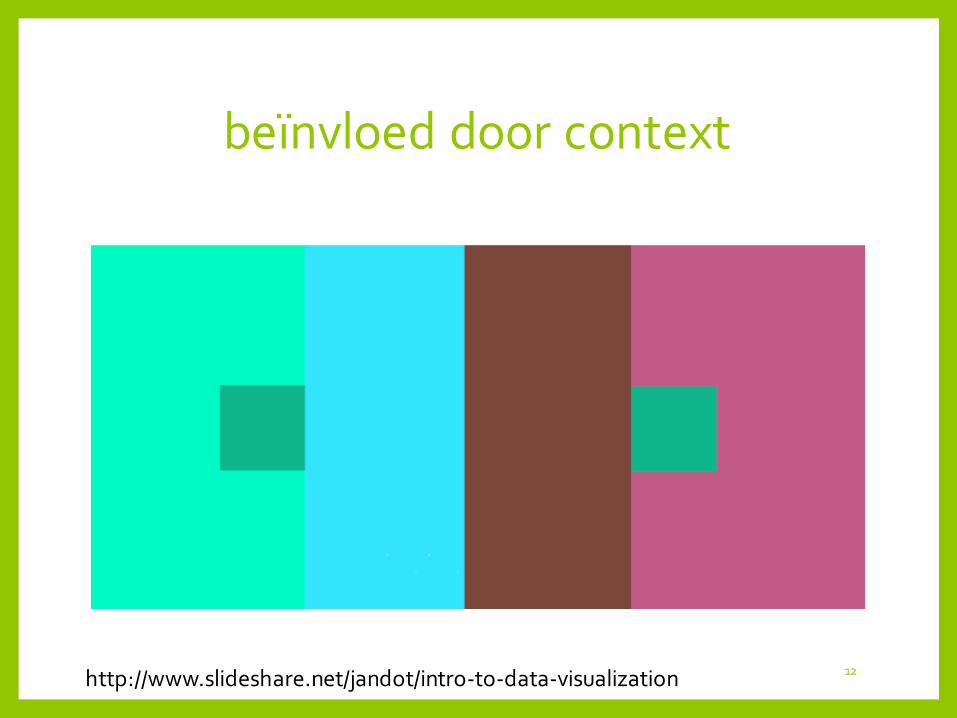
beïnvloed door context
12http://www.slideshare.net/jandot/intro-to-data-visualization
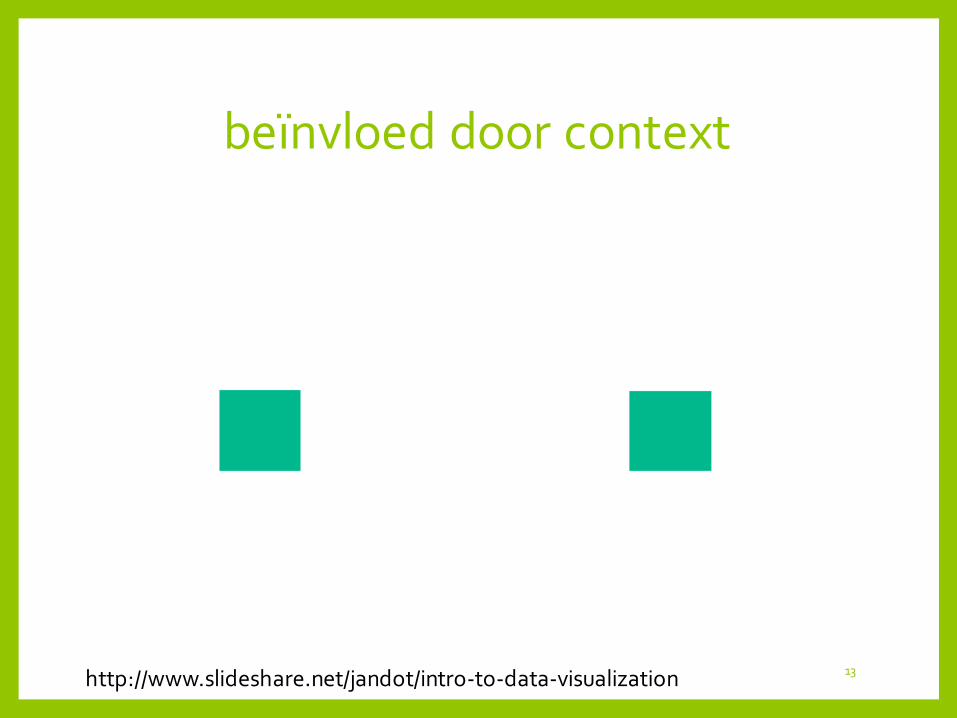
beïnvloed door context
13http://www.slideshare.net/jandot/intro-to-data-visualization
14
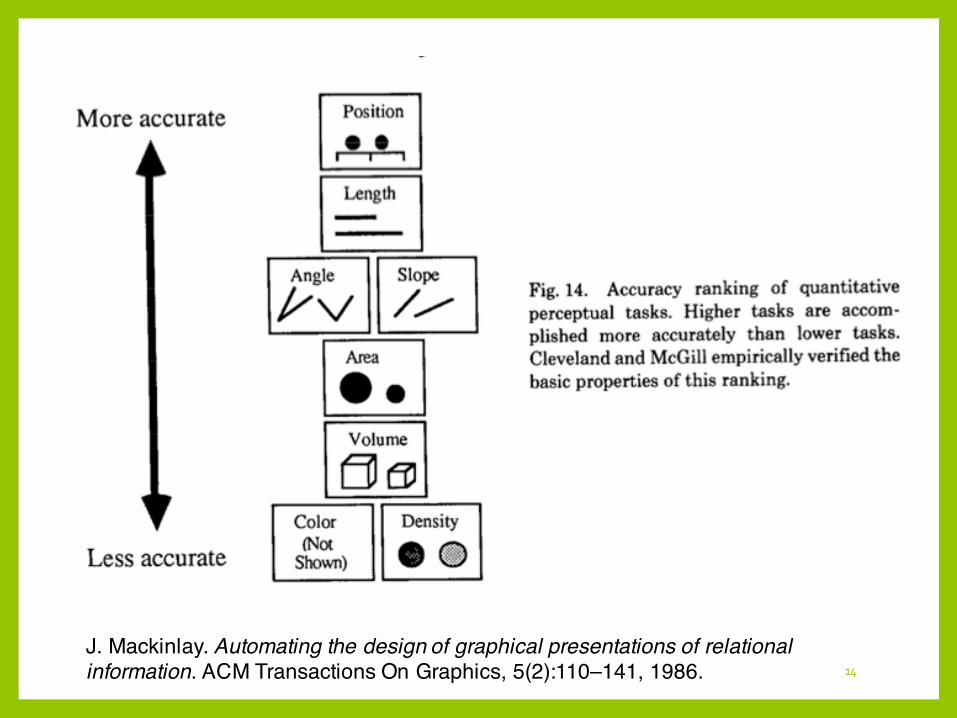
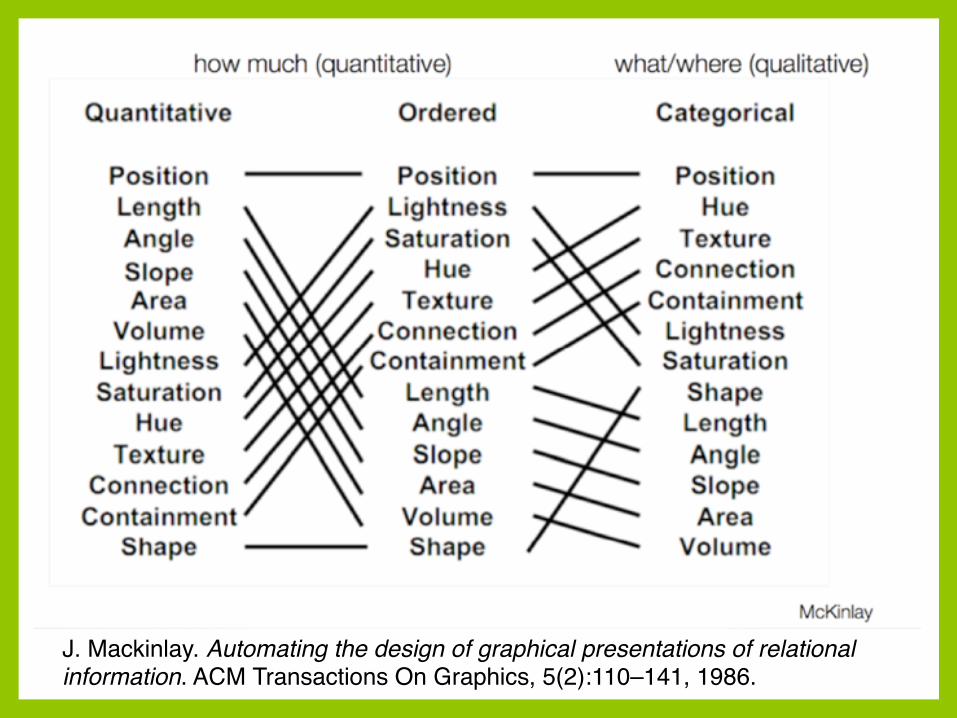
J. Mackinlay. Automating the design of graphical presentations of relationalinformation. ACM Transactions On Graphics, 5(2):110–141, 1986.
J. Mackinlay. Automating the design of graphical presentations of relationalinformation. ACM Transactions On Graphics, 5(2):110–141, 1986.
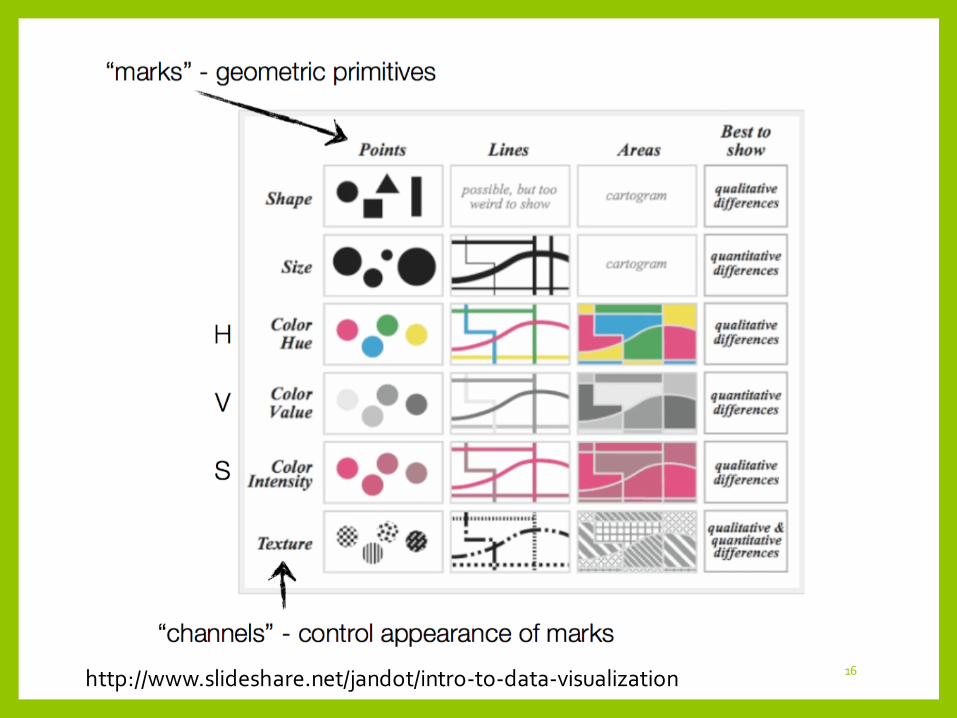
16http://www.slideshare.net/jandot/intro-to-data-visualization
GESTALT PRINCIPESop basis van: http://www.slideshare.net/jandot/intro-to-data-visualization
Monday, February 22, 2016 17
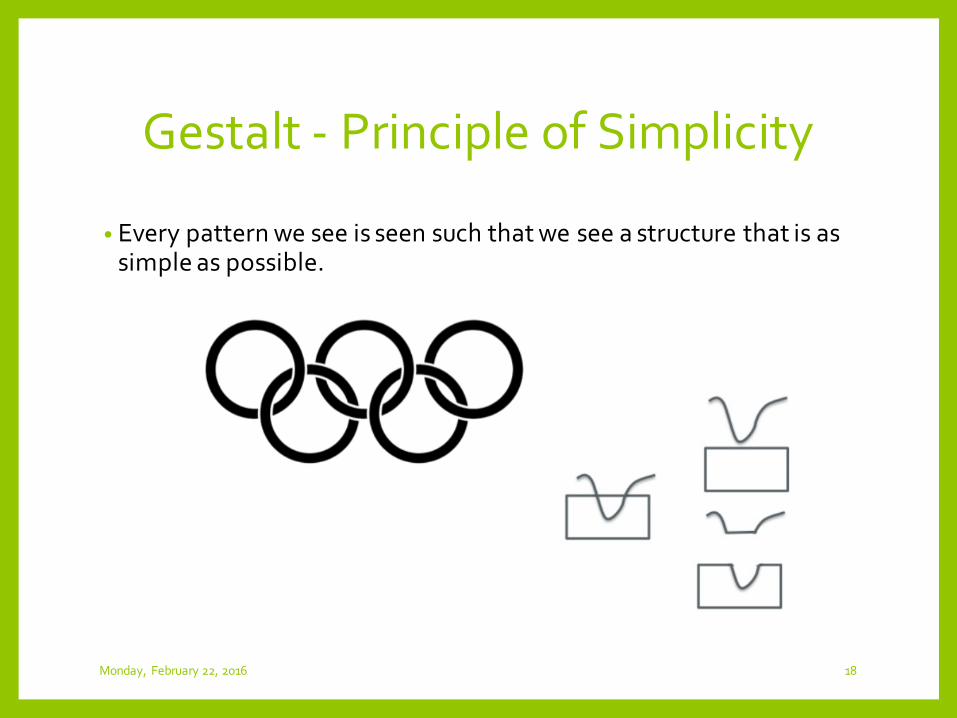
Gestalt - Principle of Simplicity
• Every pattern we see is seen such that we see a structure that is as simple as possible.
Monday, February 22, 2016 18
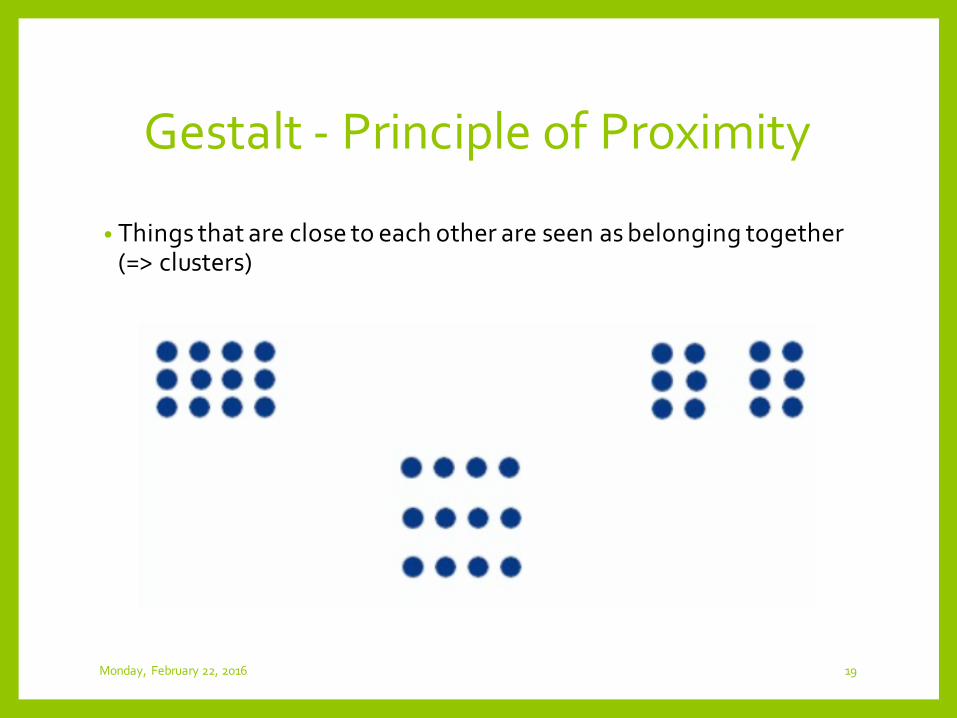
Gestalt - Principle of Proximity
• Things that are close to each other are seen as belonging together(=> clusters)
Monday, February 22, 2016 19
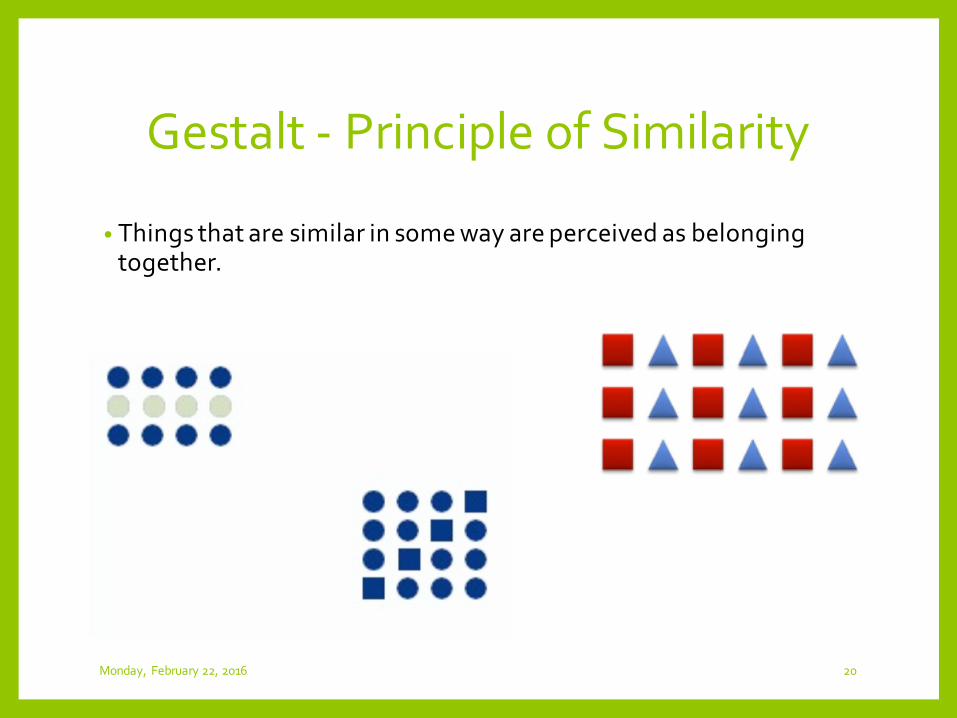
Gestalt - Principle of Similarity
• Things that are similar in some way are perceived as belongingtogether.
Monday, February 22, 2016 20
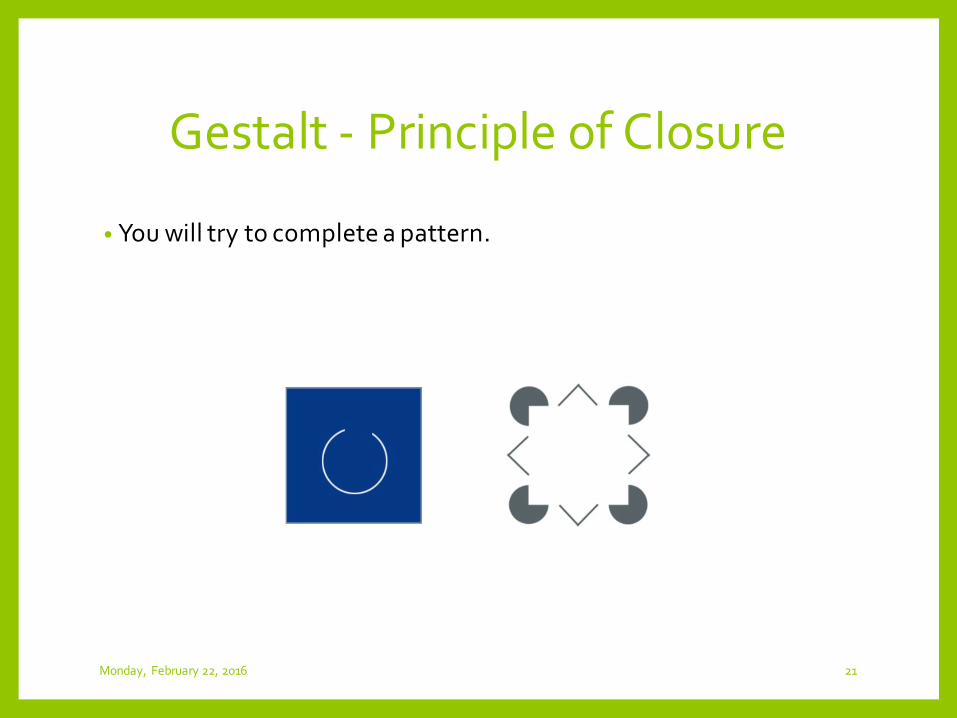
Gestalt - Principle of Closure
• You will try to complete a pattern.
Monday, February 22, 2016 21
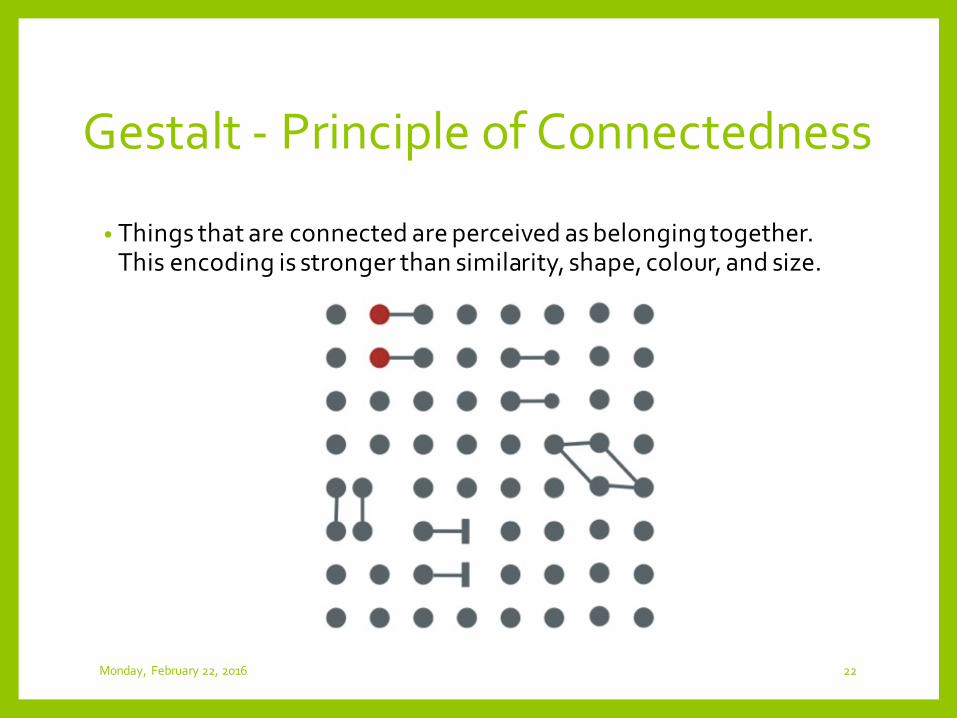
Gestalt - Principle of Connectedness
• Things that are connected are perceived as belonging together. This encoding is stronger than similarity, shape, colour, and size.
Monday, February 22, 2016 22
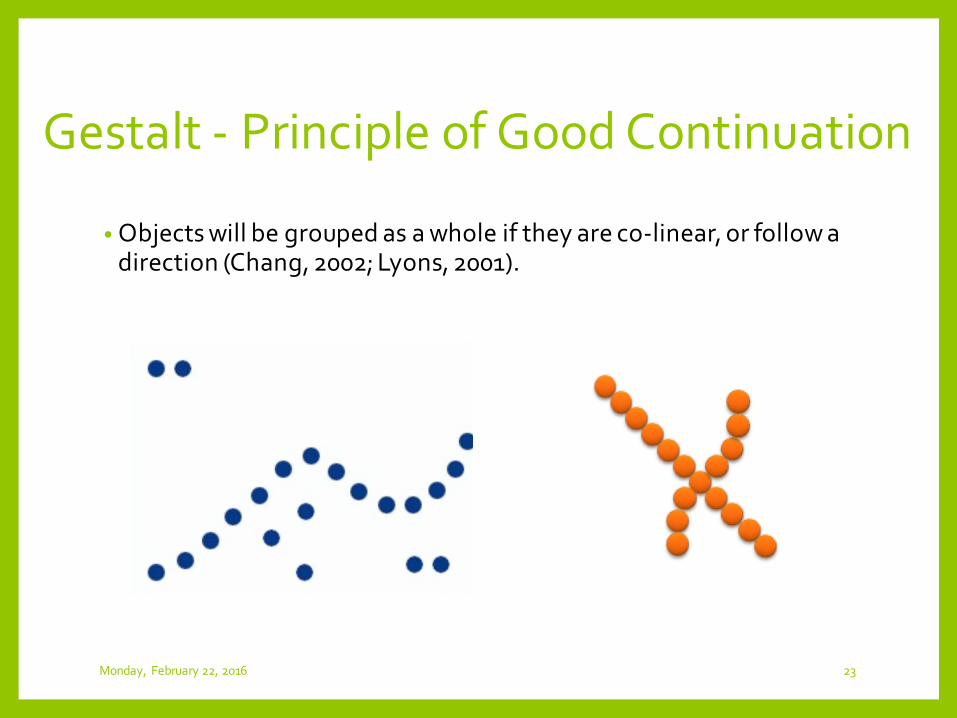
Gestalt - Principle of Good Continuation
• Objects will be grouped as a whole if they are co-linear, or follow a direction (Chang, 2002; Lyons, 2001).
Monday, February 22, 2016 23
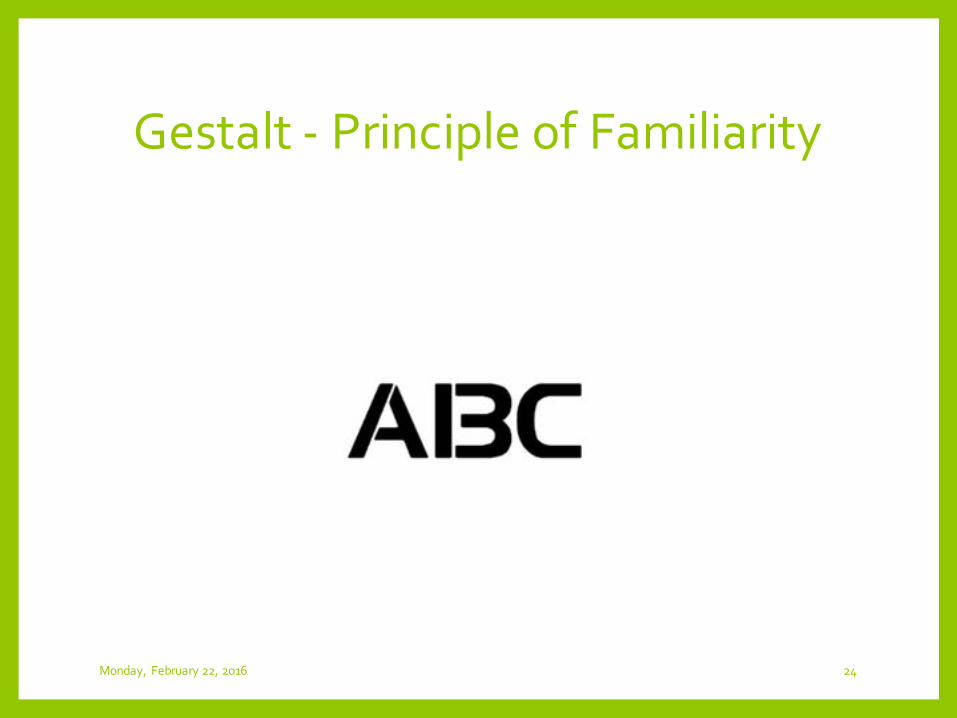
Gestalt - Principle of Familiarity
Monday, February 22, 2016 24
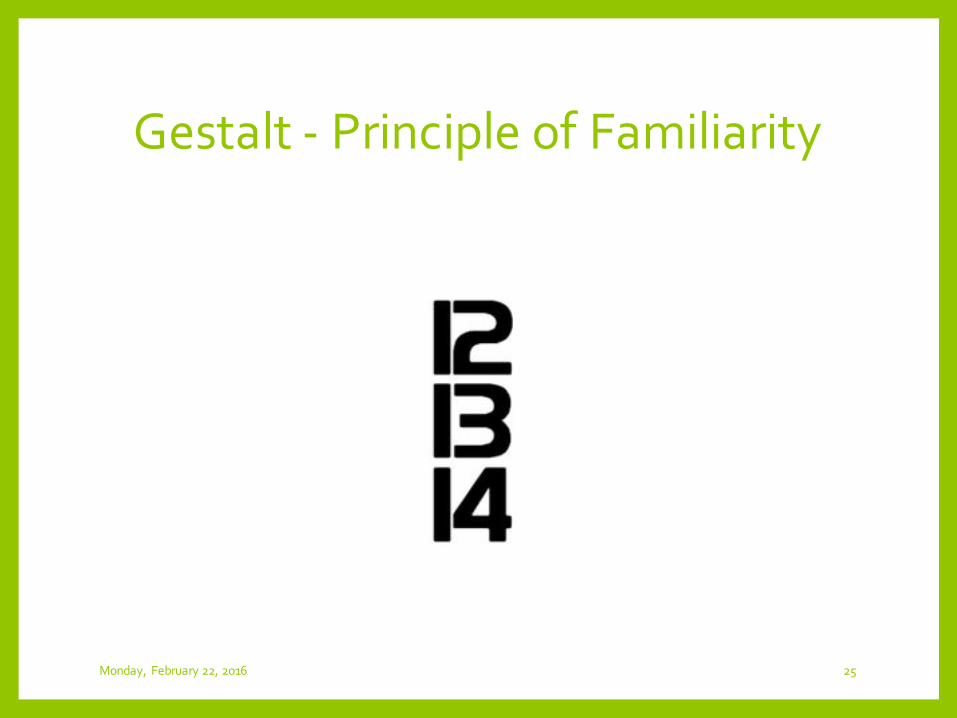
Gestalt - Principle of Familiarity
Monday, February 22, 2016 25
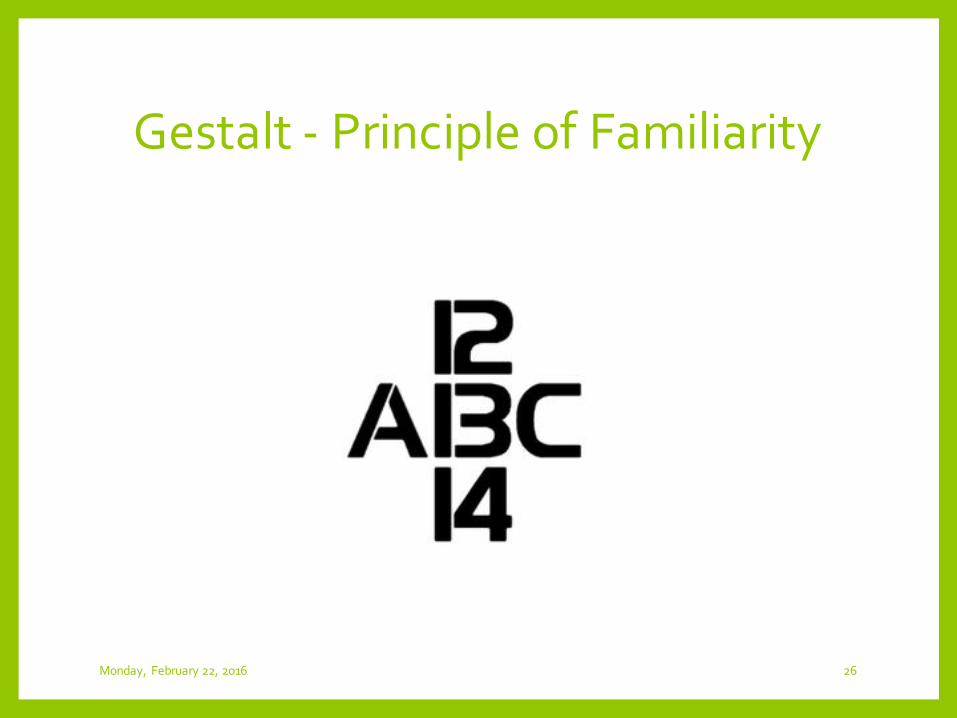
Gestalt - Principle of Familiarity
Monday, February 22, 2016 26
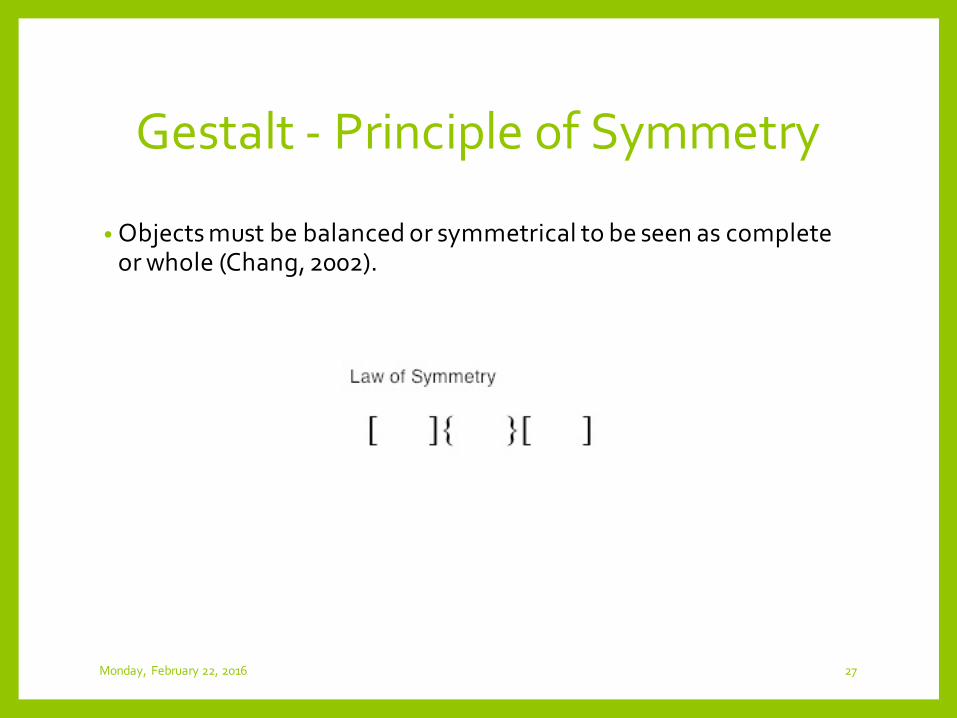
Gestalt - Principle of Symmetry
Monday, February 22, 2016 27
• Objects must be balanced or symmetrical to be seen as complete or whole (Chang, 2002).
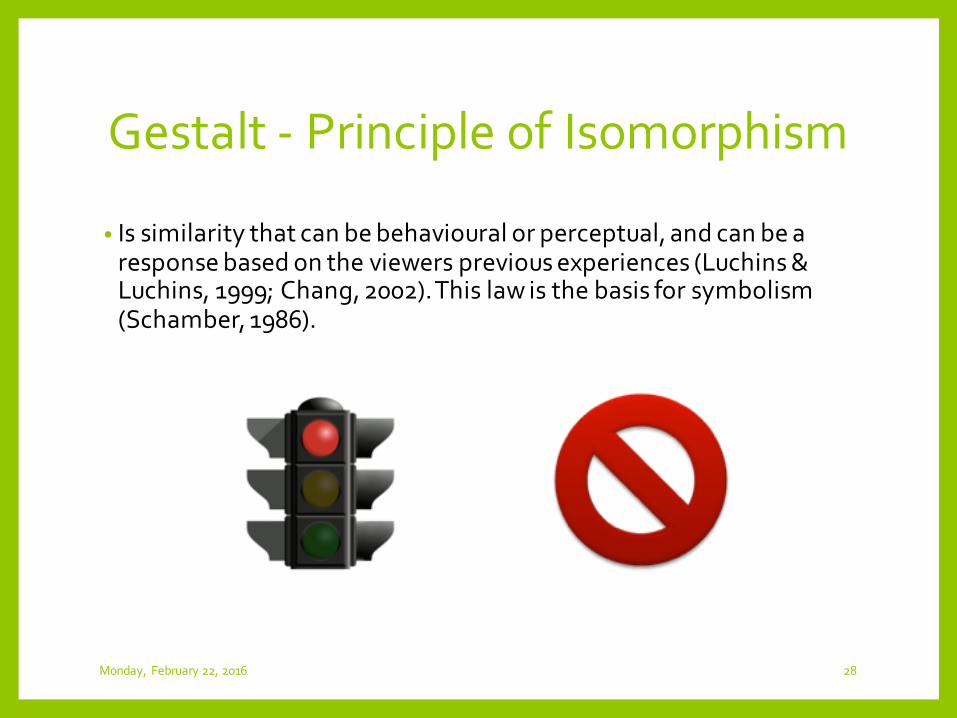
Gestalt - Principle of Isomorphism
Monday, February 22, 2016 28
• Is similarity that can be behavioural or perceptual, and can be a response based on the viewers previous experiences (Luchins & Luchins, 1999; Chang, 2002). This law is the basis for symbolism(Schamber, 1986).

http://2.bp.blogspot.com/-gZjNR3XVULs/T_ZOVgE-5lI/AAAAAAAAAg8/6YVmd5Q064o/s1600/questions11.jpg
29Monday, February 22, 2016
https://augmenthci-students.slack.com/
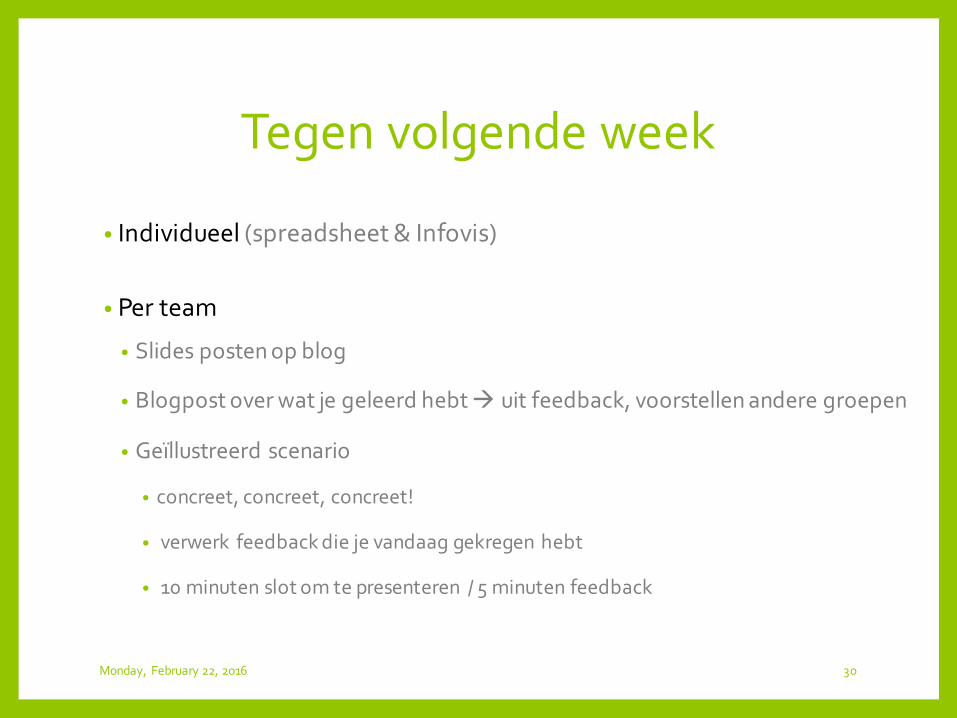
Tegen volgende week
• Individueel (spreadsheet & Infovis)
• Per team
• Slides posten op blog
• Blogpost over wat je geleerd hebt à uit feedback, voorstellen andere groepen
• Geïllustreerd scenario
• concreet, concreet, concreet!
• verwerk feedback die je vandaag gekregen hebt
• 10 minuten slot om te presenteren / 5 minuten feedback
Monday, February 22, 2016 30
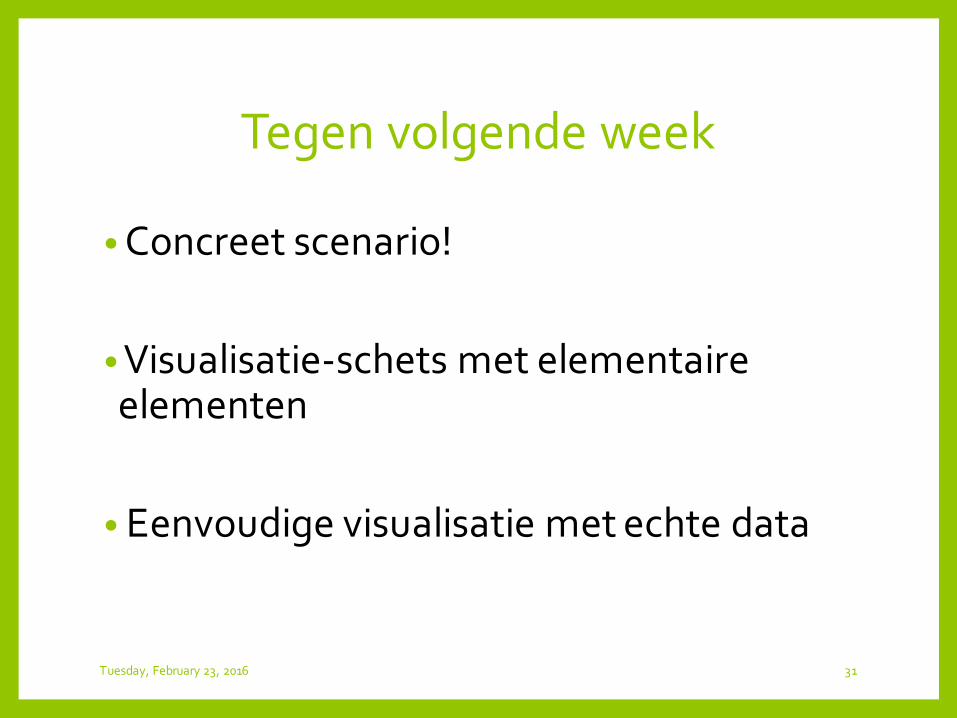
Tegen volgende week
• Concreet scenario!
• Visualisatie-schets met elementaire elementen
• Eenvoudige visualisatie met echte data
Tuesday, February 23, 2016 31

http://2.bp.blogspot.com/-gZjNR3XVULs/T_ZOVgE-5lI/AAAAAAAAAg8/6YVmd5Q064o/s1600/questions11.jpg
32Monday, February 22, 2016
https://augmenthci-students.slack.com/